Sulfuric Acid-BASed PARTiAlly AcidulATEd PhOSphATE Rock
36
Sulfuric Acid-BASed PARTiAlly AcidulATEd PhOSphATE Rock I NY -its ProducTioN, COST, And Use- INTERNATiONAl FERTiliTER DEVElOPMENT CENTER, MV WtE ShoAs, AlAbAMA U.S.A.
Transcript of Sulfuric Acid-BASed PARTiAlly AcidulATEd PhOSphATE Rock

Sulfuric Acid-BASed
PARTiAlly AcidulATEd PhOSphATE Rock
I NY
-its ProducTioN COST And Use-
INTERNATiONAl FERTiliTER DEVElOPMENT CENTER MV WtE ShoAs AlAbAMA USA
Library of Congress Cataloging In Publication Data
Sulfuric acid based partially acidulated phosphate rockshyits production cost and use
(Technical bulletin T-31) Prepared by James J Schultz and others Bibliography p 1 Superphosphates I Schultz James J
1936- IIInternational Fertilizer Development Center ill Series Technical bulletin (International Fertilizer Development Center) T31 TP9634$9S85 1986 668625 86-93 ISBN 0-88090-056-3
International Fertilizer Development Center PO Box 2040 Muscle Shoals Alabama 35662
Phone No 205-381-6600 TWX-810-731-3970 IFDEC MCHL
Edited by E D Frederick and E N Roth Cover Design and Layout by T L McGee Internal Illustrations by F Rudolph
IFDC publications are listed in Publications of the International Fertilizer Development Center General Publication IFDC-G-1 which is available free of charge
Abstract
Phosphate deposits are located in many tropical coun- imported sulfur or sulfuric acid because less acid is used tries Many of these deposits have had little commercial and a significant saving in foreign exchange can besignificance in the past because they were either too low realized in grade too unreactive or associated with excessive The process technology production cost estimates and quantities of unwanted impurities One means of utiliz- agronomic performance of a number of sulfuric acid-baseding these indigenous phosphates to the benefit of coun- PAPR (SAB-PAPR) products described in this bulletintries having such deposits is to increase the often compare favorably with those of conventional supershyplant-available phosphate by chemical conversion to a par- ihusphate fertilizers tially acidulated phosphate rock (PAPR) product The par- The factory-gate cost of P20 obtained from SAB-PAPRtial acidulation concepL indicating the use of Jess acid is estimated at about 80 of that obtained from singlethan that needed to convert the rock to superphosphate superphosphate Likewise the agronomic performance ofoften makes it possible to process problem ores into use- the SAB-PAPR products is comparable to that of convenshyful fertilizer products when the use of conventional tional superphosphate under the appropriate conditionsprocessing methods is not feasible The PAPR products (acidic soils with high phesphorus-fixation capacities) may be especially attractive to producers who rely upon
Table of Contents
Page
Introduction 1
brm inology Fully Acidulated Phosphate Rock 1 Partially Acidulated Phosphate Rock 2 Available Phosphate 2 Unavailable Phosphate 2 Free Acid 2 Rock Reactivity 4 Degree of Acidulaton 4 Acidulation Efficiency 4
Status of Technology of SSP and SAB-PA PR 5
PA PR Production Processes 5 Run-of-Pile SAB-PA PR 6 Granular SAB-PA PR 7
Laboratory- and Pilot Plant-Scale T st Results 8 Phosphate Rock Composition 8 Effect of Process Variables 9 Product Physical Properties 13
Com m ercial-Scale Practices and Potential 14 Europe 14 Latin A merica 14 Africa and A sia 14
Production Econom ics 14 Basic Premises and A ssumptions 15 Investment and Production Cost Estimates 15 Factors Affecting SA B-PAPR Production Costs 20
Agronomic Perform ance 23
References27
APPENDIX A
List of rhbles 1 Factors for Estimating Quantity of Sulfuric Acid Requirpd to Fully Acidulate Phosphate Rock 2 Chemical Composition and Relative Reactivity of Phosphate Rocks Evaluated in Laboratory- or Pilot
Plant-Scale SAB-PAPR Studies 3 Typical Product Characteristics- Granular SAB-PAPR 4 Particle Size and Surface Area Data for Slected Phosphate Rocks Used in SAB-PAPR Studies 5 Physical Properties of Selected Granular and Run-of-Pile SAB-PAPR Products 6 Maximum Degree of Acidulation Predicted for Various Phosphate Rocks-Run-of-Pile and Single-Step
Granular SAB-PAPR Processes 7 Pilot Plant-Scale Operating Data-Run-of-Pi and Granular SAB-PAPR 8 Effect of Curing (Aging) on P20 5 Solubility-Granular SAB-PAPR Products Made by IFDC 9 Process Schemes and Capacities Used for Comparing Economics of SAB-PAPR Processing Alternatives
10 Summary of Investment and Production Cost Estimates Used for Comparing SAB-PAPR Processing Alternatives
11 Total Capital Investment Estimates Used for Comparing SAB-PAPR Processing Alternatives 12 Production Cost Estimate-Scheme I Ground Phosphate Rock 13 Production Cost Estimate-Scheme K Run-of-Pile Single Superphosphate14 Production Cost Estimate--Scheme III Run-of-Pile Single Superphosphate Followed by Granulation 15 Production Cost Estimate-Scheme IV Run-of-Pile SAB-PAPR 16 Production Cost Estimate-Scheme V Run-of-Pile SAB-PAPR Followed by Granulation 17 Production Cost Estimate-Scheme VI Single-Step Granulcr SAB-PAPR 18 Production Cost Estimate-Scheme VII Single-Step Granular SAB-PAPR Using Purchased Sulfuric
Acid 19 Influence of Soil Characteristics on Agronomic Effectiveness of Phosphate Rock and SAB-PAPR
List of Figures 1 Relative Prcduction Cost of SAB-PAPR Compared With Alternative Phosphate Products 2 Theoretical Effect of Degree of Acidulation on Water-Soluble P20 5 in Acidulated Phosphate Rock 3 Run-of-Pile SAB-PAPR Process 4 Single-Step Granular SAB-PAPR Process 5 IFDC Laboratory-Scale Granular SAB-PAPR Production Unit 6 IFDC Pilot Plant-Scale Granular SAB-PAPR Production Unit 7 Efifect of Retention Time (Production Rate) on Plant Operation and Product Quality-Single-Step
Granular SAB-PAPR Process 8 Effect of Fixed Capital Investment on Production Cost-Single-Step Granular SAB-PAPR Process
(Scheme VI) Compared With Granular SSP (Scheme III)9 Effect of Capacity Utilization on Production Cost-Single-Step Granular SAB-PAPR Process (Scheme
VI) Compared With Granular SSP (Scheme III) 10 Effect of Degree of Acidulation on Production Cost-Single-Step Granular SAB-PAPR Process (Scheme
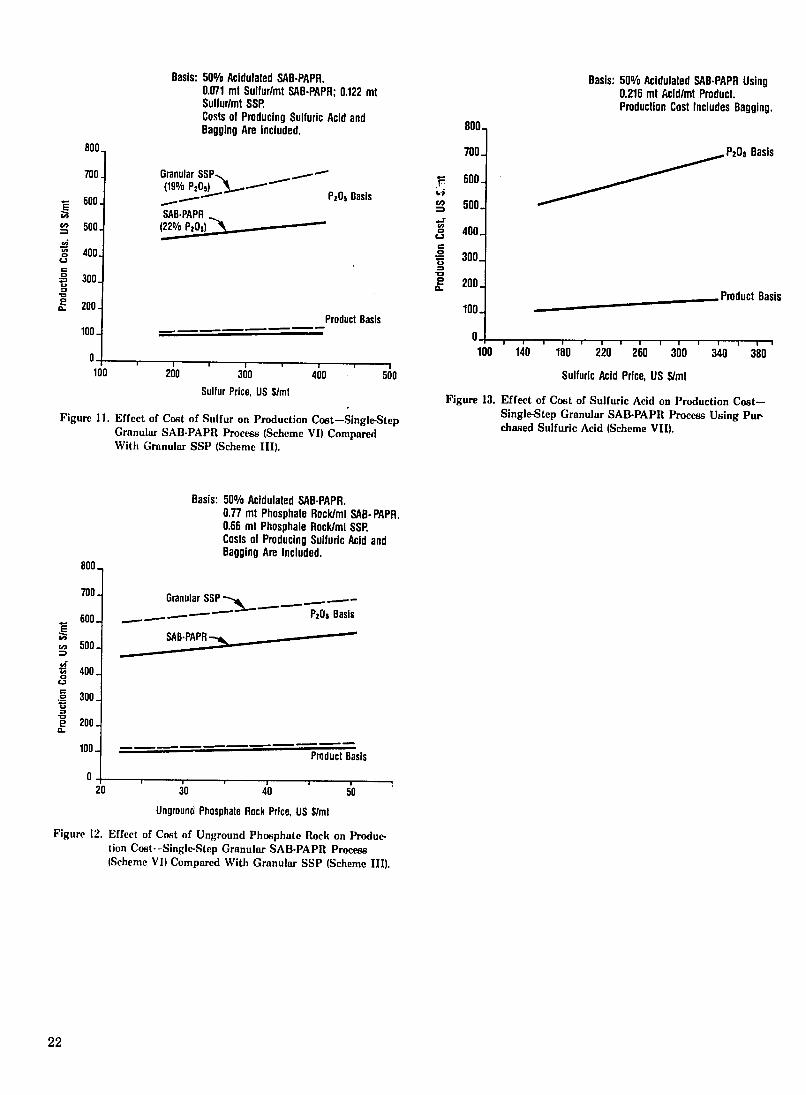
VI) 11 Effect of Cost of Sulfur on Production Cost-Single-Step Granular SAB-PAPR Process (Scheme VI)
Compared With Granular SSP (Scheme III) 12 Effect of Cost of Unground P1sphate Rock on Production Cost--Single-Step Granular SAB-PAPR
Process (Scheme VI) Compared With Granular SSP (Scheme III)13 Effect of Cost of Sulfuric Acid on Production Cost-Single-Step Granular SAB-PAPR Process Using
Purchased Sulfuric Acid (Scheme VII) 14 Effect of Phosphorus and Sul11r on Yield of Maize-Subhumid Africa 15 Effect of Phosphorus Source on Yield of Potatoes-Ecuador 16 Effect of Phosphorus Source on Yield of Two Crops of Beans-Colombia 17 Effect of Phosphorus Source on Yield of Intercropped Maize and Beans-Colombia 18 Effect of Phosphorus Source on Yield of Maize-Humid Africa 19 Effect of Phosphorus Source on Yield of Maize-Semiarid Africa 20 Effect of Phosphorus Source on Yield of Rainfed Upland Rice-Colombia
I
Summary
In conventional superphosphate products-single super- 35 phosphate (SSP) and triple superphosphate (TSP)-usually more than 90 of the total phosphate (P 20 5 ) is in a form available to plants ie soluble in a neutral am-monium citrate (NAC) solution Most of the available P205
is also soluble in water The superphosphate-type products described in this
bulletin contain lesser amounts of available P 205 because only a portion (usually about 30-50) of the sulfuric acid required to fully acidulate the phosphate rock to conventional SSF is used
Agronomic research and demonstration performed by the International Fertilizer Development Center (IFDC) and others in several developing countries show that
PAPR is usually as effective as highly soluble phosphate fertilizers on many tropical and subtropical soils (1 2 3 4 5) With sulfur-deficient soils the agronomic response to SAB-PAPR substantially exceeded that to sulfur-free fertilizers such as TSP
The production of SAB-PAPB is relatively simple the r-ethod used is basically the same as that for SSP produc-tion The SAB-PAPR can be produced as a powdered or semigranular run-of-pile (ROP) material or it can be granulated A completely granular product can be made by granulating ROP material in a separate processing step or it can be made directly by using a single-step acid-ulationgranulation process developed by IFDC (6)
Production cost estimates indicate that the SAB-PAPR products are less expensive to produce than convention-al SSP when evaluated according to the assumptions used in this bulletin In all cases the saving in cost is attri-buted primarily to the use of less sulfuric acid A rank-ing of the production cost of SAB-PAPR relative to ground phosphate rock and SSP is shown in Figure 1
These estimates and indicated saving for SAB-PAPR compared with SSP are based on the assumptions described in this bulletin The actual cost of production must be determined on a case-by-case basis after consi-dering the site-specific cost and operating factors
Compared with SSP the SAB-PAPR products are more concentrated with respect to total P2 0 5 thus leading to some savings in the cost of physical distribution of the P 20s nutrient to the farm level However when compared
T- Production Cost for a 30 Ground Phosphate Rock0 IsUS $2011mt P205
sU25 2
o 20 1
_ cc cc
_- Ira W W C a
001 m
- 1 1
-
_ 1 -
Product
Figure 1 Relative Productin Cost of SAB-PAPR Compared With Alternative Phosphate Products
with a more concentrated phosphate fertilizer such as TSP the cost of physical distribution per unit of nutrient will be higher even if allowance is made for the sulfur nutrient in the SAB PAPR product The comparison beshytween the production and distribution cost of SAB-PAPR and that of alternative sulfur-free phosphate fertilizers is not included in this bulletin
The use of SAB-PAPR production technology may make it possible to process phosphate rocks that are not suitable for producing SSP Some phosphate rocks are either too unreactive or contain too many impurities for conventional processing The ability of SAB-PAPR techshynology to cope with many types of phosphate rocks may make it possible to use indigenous materials in a numshyber of developing countries
Although commercial production of SAB-PAPR began at least 55 years ago in Europe its widespread replaceshyment of conventional phosphate fertilizers is unlikely In the developing world government incentives designed to increase the use of indigenous phosphate resources and decrease the use of imported fertilizers will probably be needed in many cases to fully exploit the advantages of this technology
Introduction
The element phosphorus was discovered by the German physician and alchemist Henning Brandt in the 17th cen-tury Its subsequent extraction from urine and bones in the 18th century and from the earths crust in the 19th centu-ry paved the way for the development of the phosphate fer-tilizer industry as we know it today By the middle of the 19th century the agronomic usefulness of phosphorus was established and the world production of phosphate rock grew from about 5000 mt in 1850 to about 135 million mt in 1984 (7) An annual production of phosphate rock in the order of 200 million mt is projected for 1990 (8)
The chemistry of the phosphate fertilizer industry has changed little during the past century-sulfuric acid re-mains a major industrial ingredient for solubilizing the phosphate and making it more available as a fertilizer Sin-gle superphosphate (SSP) is a product made from a mix-ture of phosphate rock and sulfuric acid Usually it contains about 16-22 P205 and it has been the basic phosphate fertilizer for more than 100 years Acidulation of phosphate rock with phosphoric acid to produce triple superphosphate (TSP) usually containing 45-48 P20 5 was first begun about 1870 but did not become popular until about 1950 The rapid growth in phosphoric acid production during the past 30 years has resulted largely in replacement of SSP with TSP and ammonium phosphate principally diammo-nium phosphate (DAP) usually containing 18 nitrogen and 46 P20 5
Phosphoric acid-based technology further intensified the dependency of the phosphate industry on sulfuric acid For example 1 mt of soluble P205 in the form of SSP requires approximately 18 mt of sulfuric acid whereas 1 mL of solu-ble P20 5 in the form of TSP and DAP requires about 20 and 28 mt of sulfuric acid respectively
Temperate zone agriculture is typified by relatively coel climates moderate rainfall short growing seasons a wide range of soil properties and intensive farming practices which have created the need for highly soluble and concen-trated fertilizers This explains the current position of the phosphate fertilizer industry World phosphate consump-
tion in the 198384 fertilizer year amounted to approximateshyly 33 million mt of P20 5Of this amount of P20s about 38 was contained in multinutrient (compound) fertilizers 33 in superphosphates 22 in ammonium phosphates 4 in the form of phosphate rock for direct application and 3 in miscellaneous phosphate materials including thermally altered phosphates and basic slag (9)
In many tropical and subtropical locations phosphate fershytilizers with less water solubility are desirable for a numshyber of agronomic and economic reasons Furthermore the agronomic value of both SSP and sulfuric acid-based parshytially acidulated phosphate rock (SAB-PAPR) is usually enshyhanced by the presence of the secondary elements calcium and sulfur Sulfur deficiencies are becoming apparent in phosphorus-deficient tropical regions because of the wideshyspread use of sulfur-free fertilizers such as TSP and DAP (10) It has been suggested that a P20s-to-S ratio of 31 will give maximum efficiency of phosphorus (11) SAB-PAPRshy50 (50 acidulated) supplies approximately this ratio whereas SSP supplies about twice the suggested amuunt of sulfur Thus some value should be assigned to the sulshyfur in SAB-PAPR because it is an essential element that is often deficient
The apparent usefulness of less soluble forms of phosshyphate containing an appropriate amount of sulfur (especialshyly on acidic tropical soils) together with the objective of developing suitable methods for processing a variety of inshydigenous phosphate rock materials occurring in the developshying countries provided the basis for IFDCs interest in further development of partial acidulation technology The data described in this bulletin were developed over a perishyod of several years of laboratory- and pilot plant-scale testshying if a large number of phosphate rock- Concurrent with the technical studies comparative agronomic evaluations of a majority of the products were performed in greenshyhouses research stations and farmers fields The technishycal economic and agronomic advantages and limitations of the SAB-PAPR family of phosphate products identified as a result of these studies are discussed in the bulletin
Terminology
Th facilitate a uniform interpretation of the PAPR process usually fluorapatite to the water-soluble form-monoshytechnology and economics described in this bulletin the fol- calcium phosphate nmonohydrate (MCP) Determination of lowing terms are defined the precise amount of acid required to My acidulate a phosshy
phate rock is difficult because of the influence of variable qiantities of acid-producing and acid-consuming con3ti-
Fully Acidulated Phosphate Rock tuents in the rock In practice a reasonable estirmte of the stoichiometric amount of acid required can be made by mul-
This term describes a phosphate rock that has been treat- tiplying the level of certain consttuents in the rock by posishyed with the theoretical (stoichiometric) quantity of acid re- tive and negative factors (Tble 1) These factors describe quired to fully convert the insoluble pLosphate mineral the theoretical amount of acid required to convert each
Tbble 1 Factors for Estimating Quantity of Sulfuric Acid Required to Fully Acidulate Phosphate Rocka
Phosphate Acidulation Rock Component Factor
MgO 2433 CaO 1749 NaO 1582 KO 1041 AI20 0962 Fe203 0614 F (-)1650 SO (-)1225 PO5 (-W0691
a T estimate kilograms of sulfuric acid (100 basis) required to fully Pcidulate 100 kg of phosphate rock multiply weight-percent of each component by appropriate acidulation factor and total
major constituent of the phosphate rock into the acidula-maoronsttucts no fod po iespe rk mttcases acidtion products normally found mn SSP In most cae cd
consumption data reported by commercial phosphate fertili-zer producers agree closely with these estimates although many producers may use slightly more acid than indicated (usually 5-10) to compensatefor normal process ineffi-
ciencies and to ensure optimum conversion of the phosphate to the phosphate to havailable form
The term PAPR refers to a phosphate rock that has been
treated with only a portion of the acid required to fully conshy
vert the insoluble tricalcium phosphate to the watersoluble form (MCP)
It is recognized that various acids (sulfuric phosphoric nitric hydrochloric or a combination of these) can be used to acidulate most phosphate rocks although for economic reasons sulfuric acid is usually the preferred choice for producing PAPR The quantity of acid used can be varied depending upon the characteristics of the phosphate rock and the desired quality of the final product (discussed later)
To facilitate a uniform identification of PAPH products the fclowing nomenclature is used to describe the raw material and composition of the products discussed in this bulletin-for example SAB-PAPR-50
SAB-Denotes sulfuric acid-based PAPR-Indicates that the material is a partially acidu-
lated phosphate rock product instead of a fully acidulated product such as SSP
50-Indicates the degree of acidulation (expressed as a percentage) relative to a fully acidulated SSP product As previously indicated the amount of acid required to fully acidulate a phosphate rock varies quite widely depending upon the characteristics of the phosphate rock Therefore the amount of acid required to obtain a certain degree of acidulation also varies with the composition of the phos-phate rock
Although only SAB-PAPR products are described in this bulletin it is evident that a uniform and systematic nomenshyclature for PAPR products is helpful in facilitating cornshy
minication It is unlikely that the nutrient content of the PAPR products can be universally incorporated into the nomenclature because of the large variability in the comshyposition of the candidate rocks and possible levels of acidshyulation therefore the nutrient content of the products
described in this bulletin is specified separately
Available Phosphate
Available phosphate as used in this bulletin is defined as the phosphate (normally expressed as P20 5 ) that is solushyble in a neutral ammonium citrate solution This includes
the water-soluble fraction when the sample is processed and analyzed in accordance with procedures established by the Association of Official Analytical Chemists (AOAC) (12) Inthis procedure the water-soluble PO5 fraction is determined first and the NAG-soluble P 250fraction is determined on the remaining non-water-soluble fraction The NAG-soluble phosphate reported in this bulletin does not include the wat-olu oetedcin this itin s nic ud
water-soluble fraction unless it is so indicated A comparison of available PO5 results obtained by the
NAC test method with those from other widely used methods-2 citric acid and 2 formic acid-is shown in Thble 2 for unacidulated rocks and in Thble 3 for a number of SAB-PAPR products (13 14) Normally the citric and forshymic acid test methods are used to measure the reactivityof phosphate rocks for direct application and are usually
not used on chemical- or water-soluble fertilizers
Unavailable Phosphate
In this bulletin phosphate that is found to be insoluble in an NAC solution is designated unavailable
Free Acid
The free acid (113PO4 expressed in P205 ) of the SAB-PAPR products described in this bulletin is determined by washing the sample with acetone to remove residual (unshyreacted) phosphoric acid (15) In superphosphate chemisshytry phosphoric acid is an intermediate product of the sulfuric acid and fluorapatite reaction The phosphoric acid continues to react with more fluorapatite to form the final SAB-PAPR product-a mixture of mono- and dicalcium phosphate calcium sulfate and unreacted fluorapatite (phosphate rock) A limitation of this determination is that any free acidity contributed by unreacted sulfuric acid is not detected However it is not likely that the PAPR products normally would contain free sulfuric acid
2
Table 2 Chemical Composition and Relative Reactivity of Phosphme Rocks Evaluated in Laboratory- or Pilot Plant-Scale SAB-PAPR Studies
PO Soluble in Total 2 Citric 2 Formic Relativoa
Phosphato Rock Source PzO NAC Acid Acid CaO FezO AIO3 MgO CO F SiOz Na2O K3O SO Reactivity
Central Florida (USA) El-llassa (Jordan) Ilahotoe (Tbgo) Huila (Colombia Kodjari (Burkina Faso) Media Luna (Colombia) Mussoorie (India)-Concentrate Mussoorie (India)-Run-of-Mine Pare IN (Niger) Pesca (Colombia) Sukulu Hills (Uganda) lhhoua (Niger) Tilemsi Valley (Mali) Utah (USA)
310 304 359 207 253 300 250 186 285 195 379 279 262 302
42 45 30 35 19 23 04 10 26 33 27 25 42 24
112 139 72 78 62
105 21 28 75
100 15 76
121 54
178 278 143 151 106 226 66 75
149 151 48
160 199 166
466 500 513 400 335 455 453 438 399 279 505 392 395 476
13 031 13 06 31 044 50 40 19 10 28
103 63 10
089 044 11 17 40 047 055 17 10 14 077 21 25 10
038 021 005 017 029 012 12 14 003 015 005 02 055 054
41 68 19 83 13 46
100 136
12 13 06 15 23 37
35 39 40 27 31 36 25 18 15 21 24 28 31 35
68 71 46
236 257 125 51
154 232 403
19 117 115 87
064 058 023 016 009 012 019 026 013 014 020 015 029 055
011 002 004 009 043 007 016 045 004 015 003 012 016 032
110 152 050 095 008 075 825 574 010 045 005 045 07 25
Medium Medium Medium Medium
Low Low Low Low Low
Medium Low Low
Medium Low
a Relative reactivity criteria NAC-soluble POs 0-29-Low
NAC-soluble PA01 30-49-Medium NAC-soluble PO 50 and above-High
Table 3 TIypical Product Characteristics-Granular SAB-PAPR
POs Soluble in
Phosphate Rock Source Degree of
Acidulation Total P20 Water NACa
2 Citric Acda
2 Formic Adda
Free Acid (POs Basis)
Free Water
() Laboratory-Scale Production
Central Florida (USA) El Hassa (Jordan)
40 15
233 280
107 38
31 48
73 115
8 192
lt01 01
10 09
Hahotoe (Tbgo) 30 25
265 287
75 49
42 38
114 100
167 138
02 03
07 11
Huila (Colombia) Kodjari (Burkina Faso)
50 50 30
251 148 205
106 61 07
25 28 52
78 58 71
103 77 73
04 01
lt01
06 05 19
Media Luna Colombia) Mussoorie (India)-Concentrate Mussoorie (India)-Run-of-Mine Parc W (Nigr)
50 50 50 35 25
186 234 203 147 243
30 101
74 36 44
48 16 26 23 34
100 68 36 42 73
98 114
69 73
108
lt01 08 03 02 01
06 21 20 20 06
Pesca (Colombia) 50 20
223 i 75
93 43
28 22
70 NA
84 NA
lt01 07
08 17
Sukulu Hills (Uganda) 40 25
162 303
57 61
36 10
69 20
86 51
01 lt01
01 04
Tahoua (Niger) 50 25
268 243
121 11
15 47
25 85
50 107
lt01 lt01
04 10
Tilemsi Valley (Mali) 50 15
230 256
25 06
46 53
78 118
98 152
02 lt01
14 20
30 227 16 66 123 146 lt01 18
Pilot Plant-Scale Production
Central Florida (USA) 30 256 54 44 113 162 03 17
Utah (USA) 50 30
219 253
96 73
42 12
90 NA
118 NA
07 02
28 09
50 225 111 18 77 119 02 13
a Does not include POs soluble in water b Not analyzed
3
Rock Reactivity
Phosphate rocks used for direct application may be classi-
The reactivity of arock refers to the ease with which the
phosphate can be converted (by chemical processing or reac-ion in the soil) into an available form The reactivity s in-
fluenced by a combination of physical and chemical characteristics unique to each rock With few exceptions those rocks that display a high level of carbonate substitu-tion within the apatite structure or have a high surface area are usually found to be the most reactive Particle size and surface area data for several phosphate rocks used in the IFDC SAB-PAPR studies are shown in Thble 4 It should be emphasized that a relatively large surface area does not always indicate a highly reactive rock For example the Kodjari (Burkina Faso) and Tilemsi Valley (Mali) phosphate rocks (Tble 4) have a high surface area (about 15 mlg and 38 m2g respectively) but they are not highly reactive In these examples most of the surface area is attributed to the clay particlps (iron and aluminum compounds) in the rocks
Table 4 Particle Size and Surface Area Data for Selected Phosphate Rocks Used in SAB-PAPR Studies
Particle Size Average Median Passing Passing Particle Particle Surface
Phosphate Rock Source 100-Mesh 200-Mesh Size Size Am
() (An) (Am) (m2g)
Central Florida (USA) 99 95 14 25 13 Huila (Colombia) 93 89 12 24 6 Kodjari (Burkina Faso) 97 80 20 42 15 Media Luna (Colombia) 92 77 12 28 6 Mussoorie (India) 92 77 14 32 2 Pesca (Colombia) 100 97 7 9 8 Tllemsi Valley (Mali) 100 96 13 6 38 Utah (USA) 91 77 28 63 3
Degree of Acidulation
Degree of acidulation expressed as a percentage refers to the amount o actually used compared with the stoi-chiometric quantity o icid required to fully acidulate a particular phosphate rock to SSP The theoretical effect of degree of acidulation (assuming pure fluorapatite) on the amount of water-soluble P205 in sulfuric and phosphoric acid-acidulated products is shown in Figure 2 These data show a linear relationship between the theoretical watershysoluble P205 and the acidulation degree for sulfuric acid acidulation and a nonlinear relationship for phosphoric acid acidulation
10 g-I Phosphoic Acid
80 Acpiuaion
0A S
30- Acldulation
j 20_
10 0__ 0 1b i[ 4o 5b 6 -h fir 90 1d
DOn=a of Acidulaion
Figure 2 Theoretical Effect of Degree of Acidulation on Water-Soluble PsO in Acidulated Phosphate Rock
Acidulation Efficiency
To facilitate a comparison between different acidulations of the same or different phosphate rocks the term acidulation efficiency is used This term describes the effectiveness of the acidulation process in converting the phosphate in the rock to water-soluble idNAC-soluble forms of P20 5 when compared with the theoretical conversion expected from the intended acidulation degree
Since the stoichiometric amount of sulfuric acid required for the total acidulation of a phosphate rock is based on the conversion of the P205 to the water-soluble form (MCP) the acidulation efficiency is calculated on the basis of the level of water-soluble P20 obtained in the product In pracshy
tice however a portion of the MCP usually reacts to form water-insoluble but NAC-soluble P20s in the product
Therefore in this bulletin acidulation efficiency is exshypressed in two ways-on the basis of water-soluble P0 5 and on the basis of available P20 5 (NAC-soluble P20 5 includingwater-soluble fraction) in the product
1 Water-soluble P20 shy
acidulation efficiency
Water-soluble P20 5 x 1 Tota x Actual degree of
product acidulation
2 Available P205 =
acidulation efficiency
NAC-soluble P205 + water-soluble P20 X100 Total P205 in x Actual degree of product acidulation
When these definitions am used the water-soluble P205 acidulation efficiency more closely describes the process pershyformance based on the intended level of acidulation and the
4
available P20s acidulation efficiency more appropriately lation efficiency the NAC-soluble P20 5 that may occur in the describes the agronomic usefulness of the product It should unacidulated rock was not considered in developing the be noted that in the calculation of the available P20 5 acidu- equation
Status of Technology of SSP and SAB-PAPR Since SSP has been produced in large quantities for about 140 years in many countries a brief review of its technology is given For a more complete review see Superphosphate Its Historn Chenistryand Manufacture (18)
In the most common practice production of SSP consisted of (1)mixing of ground phosphate rock with sulfuric acid (2)denning and (3)curing After curing by pile storage for several weeks the product was reclaimed from the pile and crushed to pass a 3-or 4-mm screen Such product is known as ROP superphosphate and may be sold as such or used as an ingredient in mixed fertilizers In the United States over 80 of the product was used to make mixed fertilizers (84 in 1951)
The major process variables in producing SSP included fineness of grinding of the rock concentration of the sul-furic acid acid-to-rock ratio and rock composition Usually the sulfuric acid was diluted to about 70 H2SO4although in some cases concentrated acid water and rock were simul-taneously added to the mixer Tlypical acid-to-rock ratios were near 06 kg of I-12S0 4 (100 basis) per kilogram of Florida rock A wide variety of mixing devices both batch and continuous have been used Their function is to mix the rock and acid quickly and thoroughly and to discharge the slurry-type mixture into the den while it is still semi-fluid
A number of den designs have also been used both batch and continuous Continuous (mechanical) dens permitted retention times of 20 minutes to 2 hours stationary (box-or pit-type) dens usually were operated at an average reten-tion time of about 1 hour The function of the den was to permit reactions to proceed to the point that the superphos-phate was firm enough to be excavated by mechanical devices and conveyed to storage but still soft enough for easy excavation (In some of the early plants the den was a brick- or stone-lined rectangular pit which was excavat-ed manually with shovels) Curing usually consisted mere-l of storage in piles for 3 weeks or more while chemical
reactions were reaching completion and the material was hardening
Optional steps in SSP production were drying granulashytion and incorporation of additives such as potash salts micronutrients or conditioners Superphosphate may be granulated either before or after curing In some cases SSP is granulated without drying and in other cases it is dried without granulation Granulation before curing followed bypartial drying (to permit curing reactions to continue) is another variation that is practiced in some plants
Partial acidulation of phosphate rock or ground bones probably is as old as superphosphate Gotthold Escher a school headmaster in Moravia who is credited by some authorities with the invention of superphosphate in 1835 suggested slighty to moisten bonemeal with a cheap and not too strong an acid (18) Some subsequent producers of superphosphate probably underacidulated bones or phosshyphate rock for various reasons-ignorance economy or a belief that high solubility of P20 5 was deleterious The first recorded systematic deliberate and overt underacidulation of phosphate rock was in Finland in the late 1920s The product was called Kotka Phosphate because it was proshyduced in the city of Kotka in Finland The process was based on the theory that a phosphate with less acid than fully acidulated superphosphate would be beneficial to acidshyic Finnish soils as well as more economical At first the product was made by underacidulating phosphate rock later it was made by mixing uracidulated rock with fully acidulated fresh superphosphate Sauchelli in his book pubshylished in 1960 states that Kotka superphosphate had been manufactured and sold for 30 years and gives a typical analshyysis of 26 total P 20j 20 P20 5 soluble in citric acid and 13-15 water-soluble P20 5 (19 Later PAPR was produced in other European countries and South Africa by various pocesses involving direct underacidulation or by mixing ground rock with fully acidulated SSP
PAPR Production Processes Mvo basic PAPIl production methods (processes) were (walu-ated by IFDC In one commercially practiced process an ROP product is made The ROP product is usually seni-granular in appearance hut still quite dusty After curing for several days this ROP material is usually granulated in a separate step to produce a straight or multinutrient (coni-pound) granular product An I 1DC-developtd process pro-duces granular PAPR by single-step acidulationgranulation (SSAG)(6) In this process a closely sized durable and non-dusty granular product resembling granular SSP TSP or
DAP is produced in a single step without curing The SSAG process was initially developed in laboratoryshy
scale batch and continuous test equipment using various phosphate rocks The laboratory-scale test results obtained at a production rate of about 25 kgh were generally conshyfirmed in pilot plant-scale tests performed at production rates of 250-750 kgh using two phosphate rock sources The ROP lrrocess was also studied in pilot plant-scale equipment at a production rate of about 200 kgh using two phosphate rocks Throughout the course of development a large
5
number of SAB-PAPR products were prepared for agronom-ic testing A description of the two basic SAB-PAPR processes evaluated in IFDC pilot plant-scale equipment follows
Run-of-Pile SAB-PAPR
This process is relatively simple with respect to machinery and equipment (Figure 3) In the process ground phosphate rock acid and water (optional) are ted continuously into a mixer This _mixer (usually a pug mill type) is designed to provide thorough mixing of the phosphate rock and acid with a minimum of retention time (typically 30-60 seconds) A relatively short retention time during the mixing step is preferred to avoid excessive agglomeration caking and other material-handling problems A certain amount of ag-glomeration (granulation) sometimes occurs in the mixer but this is incidental to the major function of the unit-to obtain thorough mixing of the phosphate rock and acid Batch-type mixing is not preferred because the acid and rock mixture tends to agglomerate and solidify too quickly to obtain good mixing and rapid discharge from the mixt
FumandDust Scrubber
Wae -]-in Phosphate Rock DustFrom~Crushincitening
kid Screen
water Trn
Ce OP P
I -CuringDen
Cu BucketElev WithLumpBeaker
C24Usg(24 Weeks)
Figure 3 Run-of-Pile SAB-PAPR Process
The phosphate rock acid and water are usually added to the mixer at the same point However depending upon the charactistics of the phosphate rock degree of acidula-tion and other process variables the points of addition for rock acid and water may be manipulated to achieve opti-mum mixing and reaction Likewise the rotational speed of the mixer shafts and the orientation of the mixing paddles may be varied to achieve the desired retention time for opti-mum mixing and reaction
In some cases adding other materials to the mixer(typi-cally potassium chloride) may be desirable to improve the acidulation process (discussed later) or to provide additional nutrients in the product Usually when potassium chloride is added it is fed directly to the mixer withcat first being premixed with the phosphate rock
In one variation of this process (batch-type denning pro-cess) simulated by FDC in the laboratory and pilot plant the material discharged from the mixer was stored for a
short time in a closed and ventilated chamber (curing den) The IFDC pilot-plant den had a capacity of about 1 mt whereas the capacity of a commercial-scale unit usually ranges from 10 to 40 mt After about 1 hour the material was excavated from the den and transferred to storage This denning process was essentially the same as that used for the previously described production of ROP SSP In some cases depending upon the characteristics of the rock and degree of acidulation it is possible to transfer the material directly from the mixer to storage without first denning If denning is required a continuous belt-type den can be used as an alternative to the previously described batch-type unit After a period of storage usually about 2 weeks the ROP material is reclaimed and crushed to pass a nominal 4-mm screen before it is bagged or otherwise prepared for shipment The particle size data for two ROP SAB-PAPRshy50 products are shown in Table 5These data indicate that the product is quite granular (about 55 retained on a 118shymm [14-mesh] screen) The semigrmular characteristic of the ROP material is attributed to the lack of sufficient lishyquid phase (acid plus water) at a 50 level of acidulation to form a slurry Instead of forming a typical SSP-type slurshyry that solidifies into a monolithic mass the PAPR product discharged from the mixer is moist and relatively granular in appearance
Dust and fumes (primarily fluorine gas) must be ventishylated from the mixer den (if used) conveyor system and
some cases the product storage area However because of the relatively low levels of acidulation and the correspondshyingly small release of fluorine it is unlikely that fumeshyscrubbing equipment normally used for the recovery of byproduct fluorine would be economical unless the recovershyed fluorine (fluosilicic acid) could be sold or used to replace a portion of the sulfuric acid fed to the process
The ROP SAB-PAPR process may be operated in a single-step or two-step mode With some phosphate rocks especially at higher levels of acidulation it may be desirable to perform the acidulation in two steps to obtain optimum conversion of the phosphate to the available form and to improve the physical properties of the product With the two-step acidulation method the phosphate rock and apshyproximately one-half of the acid required for the intended degree of acidulation are fed to the process The material is cured for several hours to several days before it is reclaimed and fed through the process a second time while the remainder of the acid is added After the second pass through the process the product is cured for an additional period (about 2 weeks) before it is bagged
The need for crushing screening and other processing of the material between the acidulation steps or of the cured SAB-PAPR product before bagging is largely depenshydent upon the character of the phosphate rock and the degree of acidulation used In general lumping and caking of the SAB-PAPR product during curing tends to increase as the degree of acidulation is increased This is especially true with the more unreactive rocks or with rocks that conshytain a low level of free carbonate
6
Table 5 Physical Properties of Selected Granular and Run-of-Pile SAB-PAPR Productsa
Particle Size Analysis Nominal Cumulative Retained on
Degree of Free Free 4- 6- 8 10- 14- 20- Crushing Abrasion Moisture Moisture Compatiblecd d CoptbePhosphate Rock Source Acidulation Moisture Acid Mesh Mesh Mesh Mesh Mesh Mesh Strength Resistance Absorption Penetration With Urea
1N () (PAt) (kg) 1Degradation) (gkcm( Basis)
Laboratory-Scale Production (Granular)
NA fCentral Florida (USA) 10 30 34 00 00 51 350 771 994 11 22 NA NA luila (Colombia) 50 05 02 00 00 110 49A 820 907 04 54 NA NA Yes
Kodjari (lurkina Faso) 15 08 09 00 02 277 917 996 999 12 27 NA NA Yes Mussoorie India)9 35 21 46 00 2A 339 726 941 980 05 27 21 0 NA Pare W (Niger) 50 06 02 00 00 102 656 940 92 08 33 NA NA Yes Pare W (Niger) 25 02 01 00 02 240 570 885 987 05 54 NA NA Yes Pesca (Colombia 40 04 06 00 00 61 398 829 944 11 22 NA NA Yes Sukulu Hills (Uganda) 50 25 10 NA NA NA NA NA NA 32 NA 11 0 No
(fresh) (fresh) (fresh) 05 01 00 20 516 896 995 999 Yes
(cured) (cured) (cured)Tilemsi Valley (Mali) 30 14 01 00 00 191 762 985 999 10 NA NA NA Yes Hahotoe (Tbgo) 50 03 01 00 00 114 669 933 994 08 NA NA NA Yes Hahotoe (Togo) 25 06 02 00 04 105 676 953 992 11 NA NA NA Yes
Pilot Plant-Scale Production (Granular)
Central Florida (USA) 50 28 07 00 110 457 755 960 988 25 13 95 0 NA Central Florida (USA) 40 16 03 00 163 676 924 996 997 30 NA 47 0 NA Central Florida (USA) 30 17 03 00 177 704 917 990 993 28 NA 51 0 NA Utah (USA) 50 13 02 00 160 527 781 966 979 21 14 18 0 Yes Utah (USA) 40 26 06 00 139 533 825 989 993 19 17 NA NA No Utah (USA) 30 09 02 00 164 560 850 984 990 17 NA 21 0 NA
Pilot Plant-Scale Production (Run-of-Pile)
Central Florida (USA) 50 11 03 57 93 258 450 579 667 02 NA NA NA NA Kodjari (Burkina Faso) 50 11 01 00 01 210 409 552 643 08 NA NA NA NA
a All tests performed on cured product (1 month or more curing) unless otherwise noted bTest performed on minus 7- plus 8-mesh particles c Rotary drumlsteel ball test method d At 30C and 80 relative humidity for 72 h a SAB-PAPRIprilled urea mixture (11) at 301C for a minimum of 72 h f Data not available g Run-of-mine phosphate rock
Granular SAB-PAPR
Granular SAB-PAPR can be produced either by granulatshying previously prepared ROP material in a separate step Scrubber using steamwater or it can he prepared directly by using the SSAG SAB-PAPR process developed by IFDC and F ive Dust shown in Figure 4 One producer in Germany also uses aWae compactiongranulation process to produce a granular proshyduct (usually containing some potassium) from an ROP Acid G screer rzatmet
Water material
In the SSAG process the phosphate rock sulfuric acid Product water and recycle material are fed continuously to a granu- i rusher Granular lator usually a rotary drum-type unit Recycle material fed Prosphate Rock Recycle
to the granulator consists of the undersize fraction (from the screening operation described later) and usually a porshytion of the product The amount of recycle material fed to Figure 4 Single-Step Granular SAII-PAPR Process the granulator may vary depending upon the type of phosshyphate rock and other operating conditions Howe-er a rate sufficient to maintain acceptable granulation Sulfuric acid equivalent to a recycit-to-product ratio of about 2 is usually and water are sprayed (through separate systems) onto the
7
rolling bed of material in the granulator to obtain the desired level of acidulation and granulation respectively The retention time in the granulator required to obtain the optimum level of reaction and granulation varies depend-ing upon the phosphate rock composition and level of acid-ulation however it is normally in the range of about 5-8 minutes
The moist plastic material from the drum granulator is discharged into a rotary drum-type cocurrent dryer The temperature of the material discharged from the dryer is maintained at the desired level by controlling the tempera-ture of the drying airA dry-type dust collector is usually
used to partially clean the air before it is discharged into a wet scrubber to remove the fluorine and fine particulate
The material from the dryer is screened to yield a product usually in the 1-to 4-mm size range Oversize material from the screening unit is routed to a crusher The material disshycharged from the crusher is recycled to the screen As previshyously mentioned the undersize material and usually a fraction of the product are returned to the granulator as recycle It is usually unnecessary to treat the product withbull a conditioner to minimize caking however the addition of a small amount of oil may be useful as a dust suppressant especially if the product is handled in bulk
Laboratory- and Pilot Plant-Scale Test Results The usefulness of SAB-PAPR production technology (ROP or granular) can usually be determined by evaluating three major factors-(1) composition of the phosphate rock and its amenability to chemical processing (2)cost of produc-tion especially with respect to the quantity of acid required to achieve an agronomically acceptable product and(3) agronomic performance of the PAPR product compared with alternative phosphate sources Several phosphate rocks were evaluated in the IFDC laboratory and pilot plant asdescribed in this bulletin to gather information on these
factors and to develop an objective criterion for determinshying on a case-by-case basis the technical and economic feasishybility of SAB-PAPR technology as a phosphate processing alternative The laboratory- and pilot plant-scale equipment used for these studies is shown in Figures 5 and 6 respectively
Phosphate Rock Composition
The chemistry of phosphate rock acidulation is complex and not always clearly understood therefore it is difficult to judge with certainty how a particular phosphate rock will
- -
Figure 5 IFDC Laboratory-Scale Granular SAB-PAPR Production Unit
-77
---
f shy- i
-I Y
Figure 6 IFDC Pilot Plant-Scale SAB-PAPR Production Unit
behave when treated with acid The chemical transformashytion of the phosphate minerals in a rock during and after initial acidulation is usually affected by competing and synshyergistic factors specific to each rock including texture surshyface area and porosity and the presence of associated compounds of calcium iron aluminum magnesium fluoshyrine and sulfur Thus acidulation chemistry is sometimes unpredictable because these associated compounds mayparticipate to some degree in the acidulation reactions and subsequent reactions that occur during product curing and storage Furthermore the influence of some of these physishycal and chemical factors can be altered by controlling critishycal process parameters including the reaction temperature profile retention time rate of reaction and level of moisture H owever since fluorapatite is usually the major constituent of phosphate rock the simplified equation for its reaction with sulfuric acid to form SSP or SAI3-PAIPl may be writshyten as follows
Cao( N)4 eF + 7y 11S0 + 3N 1i1 = (fluorapatit) Isulfuric acid) (watter)
3y Ca(lI 2PO) I1O + 7y CaS( 4 + 2y 11F + 11-y) CaoII1O 4)hFz (monocalcium phos- (calcium (hydrofluoric (fluorapatite) phate monohydrate) sulfate) acid)
8
In this equation the ter7 n y represents the degree of acidu-lation-for example 100 acidulation (production of SSP) corresponds to a y value of 10 and a y value of 05 refers to a 50 acidlated PAPR As previously stated the role of nonfluorapatite components in the phosphate rock may sig-nificantly alter the above reaction chemistry For this reason a relatively large number of phosphate rocks were studied (Table 2) to characterize the SAB-PAPR process chemistry and to develop meaningful estimates of the expected techni-cal economic and agronomic performance of a given SAB-PAPR product
An important attribute of PAPR technology is that a phosphate rock may be suitable for SAB-PAPR processing even though it is unsuitable for full acidulation to SSP The Kodjari deposit in Burkina Faso is an example of a rock well suited for SAB-PAPR processing This sedimentary-type rock is very unreactive and contains relatively high levels of silica iron and aluminum Acidulation of this rock beycnd about 50 results in a paste-like material that is very diffi-cult to handle The nonporous and therefore relatively low surface area of the apatite component of this rock makes it difficult to achieve good contact and complete reLction be-tween the phosphate mineral and the acid thus the rock is difficult to fully acidulate As previously mentioned the rel-atively high surface area of the Kodjari rock (about 15 m2g) is caused by clay minerals in the rock not by the apatite Extra fine grinding of such a rock to achieve a higher level of reactivity is not practical because it contains a large amount of abrasive silica (about 25) Also the iron and aluminum while not adversely affecting the physical prop-erties of the product tend to react slowly during curing to form insoluble phosphate compounds that have the net ef-fect of decreasing the efficiency of the acidulation reaction
Many phosphate rocks especially those that are not highshyly weathered contain high levels of calcium and magnesium carbonate High carbonate levels adversely affect SSP and SAB-PAPR production in two ways-first the carbonate preferentially reacts with the acid during acidulation inshycreasing the amount of acid required to achieve the desired level of acidulation and second the acidlcarbonate reaction releases carbon dioxide gas which usually causes undesirashyble frothing during the reaction and weakening of the granshyules if the SSAG-PAPR process is used Stepwise reaction of such high-carbonate rocks (those containing more than about 4 C02) lessens the adverse physical processing problems but it does not avoid the problem of excessive consumption of acid
The relatively unreactive rocks can usually be acidulated to a level oi only about 30-60 while still yielding a proshyduct that is sufficiently low in free acid to avoid excessive stickiness or hardening during processing and storage In most cases a higher level of acidulation can be obtained if the ROP-PAPR process is used because more time is availshyable for the acidulation reactions to reach comptetion durshying the curing step The maximum degree of acidulation that could be expected for several phosphate rocks in the SSAG and ROP PAPR processes is shown in Table 6
Effect )f Process Variables
The chemical and physical characteristics of the phosphate rock have a major influence on the performance of the SAB-PAPR process (ROP or SSAG) and the quality of the proshyduct However some process conditions (variables) also have a significant influence The most important process variashybles identified in the IFDC laboratory- and pilot plant-scale
Thble 6 Maximum Degree of Acidulation Predicted for Various Phosphate Rocks-Run-of-Pile and Single-Step Granular SAB-PAPR Processes
Rock Source
Central Florida (USA) El-Hassa (Jordan) Hahotoe (Thgo) Huila (Colombia) Kodjari (Burkina Faso) Mpdia Luna (Colombia) Mussoorie (India)-Concentrate Mussoorie (India)-Run-of-Mine Parc W (Niger) Pesca (Colombia) Sukulu Hills (Uganda) Thhoua (Niger) Tilemsi Valley (Mali) Utah (USA)
Typical Analysis Predicted Degree of Acidulation Total NAC-Soluble Relative Run-of-Pile Single-Step P2 0 5 P20 Reactivitya Process Granular Process
M( ( 310 42 Medium 100 60 304 45 Medium 100 60 359 30 Medium 100 60 207 35 Medium 100 30 253 19 Low 60 40 300 23 Low 100 70 250 04 Low 100 50 186 10 LOw 100 35 285 26 Low 100 60 195 33 Mcdium 100 30 379 27 Low 100 60 279 25 LOw 60 40 262 42 Medium 70 50 302 24 LOw 100 50
a Relative reactivity criteria NAC-soluble P20 5 0-29-Low NAC-soluble PO 30-49-Medium NAC-soluble PiOs 50 and above-High
9
studies were (1)degree of acidulation (2) concentration of in Thble 7 and the product characteristics (Thbles 3 and 5)acid (3)process tomperature profile and (4) retention time vary quite widely from one rock to another Also test re-
IFDCs laboratory- and pilot plant-scale evaluations indi- sults using the same rock may vary considerably from one cate that the chemistry of phosphate rock acidulation is not test to another as the process conditions are changedalways predictable This lack of predictability is presumed to Therefore specific test work is required to determine the be due to variations in the chemical and physical character- performance of a rock sample and to quantify the effect of istics of the rocks and the specific SAB-PAPR processing the major process variables on the quality of the final conditions (degree of acidulation temperature and reten- producttion time) The characteristics of the final product may also Although there is a significant variation in the data availshyvary as a result of curing reactions during storage For these able the general effect of the most significant process varishyreasons the laboratory- and pilot plant-scale test data shown ables can be summarized as follows
Table 7 Pilot Plant-Scale Operating Data-Run-of-Pile and Granular SAB-PAPR
Run-of-Pile Process
Phosphate Rock Source Central Florida
Burkina Faso (Kodpari)
Single-Step Granular Process Utah Central Florida
Production Rate kgh 200 200 250 234 246 256
Degree of acidulation 50 51 50 39 51 53 Acid concentration H2SO 69 69 73 92 74 95 Phosphate rock feed rate kgh 140 155 180 180 175 180 Dilute sulfuric acid feed rate kgh 62 49 71 44 71 60 Water feed rate kgh 25 19 46 47 76 70 Recycle feed rate kgh 195 216 497 490 Recycleproduct ratio kgkg 08 09 20 19 Ibmperature of recycle C 48 48 49 48 Particle size of recycle
Oversize (plus 6-mesh) 01 00 66 68 Product (minus 6- plus 14-mesh) 74 74 496 643 Fines (minus 14-mesh) 925 926 438 289
Retention time in mixer or granulator min 2 2 127 148 86 86 Moisture in mixer or granulator discharge Mixer or granulator discharge temperature degC
153 64
105 66
41 52
48 50
66 51
57 58
Dryer air discharge temperature C 76 76 75 76 Airflow through dryer (outlet conditions) mh Temperature of material discharged from dryer C
3300 68
1800 63
3100 66
3100 67
Curing time in den min 50 73 rTmperature of material removed from den C 63 77 Ibtal dust collected kgmt of product 72 28 74 52 Composition of product after 7-day curing
Ibta P20s dry basis 227 201 229 246 227 227 Water-soluble P0 5 dry basis 109 27 102 94 91 109 NAC-soluble PO dry basisa 35 46 22 23 40 33 Free acid (as P2O) dry basis 29 09 02 04 06 05 F dry basis NA NA 21 23 24 18 Ca dry basis 219 183 217 202 222 236 SO dry basis 203 139 228 226 218 253 Free H2O 79 48 12 26 25 26 Water-soluble P2O acidulation efficiency 95 27 90 99 79 90 Available POs acidulation efficiency 126 72 109 123 113 118
Composition of product after 21-day curing Ttal P20s dry basis 209 198 225 240 219 226 Water-soluble P1O dry basis NAC-soluble P2O e dry basis a
95 37
12 59
111 18
87 27
96 42
109 38
Free acid (as P2OA) dry basis 03 01 02 06 07 05 F I dry basis NA NA 22 24 25 25 Ca dry basis 219 184 237 264 216 221 SO dr basis 246 152 259 255 233 230 Free 120 11 11 13 26 28 27 Water-soluble P205 acidulation efficiency 90 12 99 93 86 91 Available 1P20 acidulation efficiency I 126 70 115 122 124 122
Crushing strengtta kggranule NA NA 23 19 23 30 a Does not include water-soluble fraction b Not available
10
Degree of Acidulation-An increase in the degree of acid-ulation usually results in a higher proportion of the availa-ble P20 5 in the product being in the water-soluble form Acidulation efficiency (Thble 7) appears to be unrelated to the degree of acidulation Acidulation efficiency apparent-ly is influenced to a greater extent by the combined effect of the phosphate rock composition reactivity and other process variables
Concetitration of Acid-The acidulation reaction is veryexotherinic (about 90 kcallkg of fluorapatite reacted with sulfuric acid) and an increase in temperature is usually ac-companied by an increase in the rate of reaction Howeverwith some phosphate rocks especially those that are less reactive a higher level of acidulation can be obtained if the temperature is decreased and the rate of reaction is slowed to minimize surface reactions and facilitate deeper penetra-tion of the acid into the phosphate rock matrix For this reason when an unreactive phosphate rock is processed im-proved results are usually obtained if the acid is diluted and cooled in a separate step before it is reacted with the rock
Laboratory-scale tests using Kodjari (Burkina Faso) phos-phate rock which is relatively unreactive and contains a high level of iron and aluminum show that a dilute acid (60-75) is more effective than a more concentrated acid in decreasing the precipitation of reaction products en the surface of the phosphate rock particles This surface precipi-tation of reaction products partially blocks or blinds the rock and leads to incomplete reaction excess free acid and a sticky unmanageable product F-irthermore the unreact-ed acid in the product tends to slowly react with the iron and aluminum impurities during storage to form a number of insoluble (unavailable) phosphate compounds When a more reactive rock (for example central Florida) was used in the pilot plant the higher acid concentration (95) result-ed in a slightly higher acidulation efficiency when meas-ured in terms of water-soluble P20However when a less reactive (Utah) rock was used a slightly higher acidulation efficie --y (water-soluble P205 basis after curing 21-days) was obtained with a dilute (73) acid
An optimum balance between the concentration of the acid the reactivity of the phosphate rock and the quantityof moisture (liquid phase) that can be tolerated must be de-termined for each phosphate rock and desired level of acid-ulation In general a sulfuric acid concentration of 60-75 is desired for acidulating the less reactive rocks and an acid concentration of 75-93 is more appropriate for the morn reactive rocks
Process Temperature Profile-As indicated from the above discussion it is difficult to separate the influence of temperature and rate of reaction when evaluating the SAB-PAPR process When a less reactive phosphate rock such as Kodjari (Burkina Faso) is processed a high temperatureduring the initial period of reaction and during subsequent drying (assuming the SSAG process) usually causes a decline in the amount of water- and NAC-soluble P20 in the finished product
Part of this adverse effect on the solubility of P205 in the
finished product is related to the previously described blindshying and to the high free acid which leads to the undesired ironaluminum reactions during curing These reactions are caused in part by the high temperature of the PAPR materishyal resulting from the combined effect of a high acid concenshytration and rate of reaction The temperature of the material that is maintained during the drying step can also adverseshyly affect the level of water-soluble P20 5 (MCP) in the finished product Laboratory-scale results indicate that the revershysion of water-soluble P 20 5 to NAC-soluble and insoluble compounds is minimized if the temperature of the material during drying does not exceed 120C 100degC being the preshyferred maximum temperature The reversion reactions were also found to be influenced by retention time during dryshying The laboratory data indicate that the retention time during drying at the 1000 -120C level should not exceed 30 minutes to ensure a minimum loss of water-soluble P20 5
Pilot-plant tests were performed at drying temperatures of 66 deg - 93degC Within this range and with a rock of medishyum reactivity (central Florida) and one of low reactivity (Utah) the amount of water-soluble P2Os in the productgenerally increased as the drying temperature was inshycreased However the maximum drying temperature that could be maintained without causing a significant decline in the level of water-soluble P205 was not determined In the design of an SAB-PAPR process for a particular rock the maximum allowable drying temperature should be detershymined and used This will ensure that the dryer (the most costly item of equipment in the process) is properly sized and that it is operated at the optimum level to obtain the required product characteristics
Retention Time-The acidulation reaction although inishytially quite rapid requires considerable time to approachcompletion For example in the production of fully acidushylated ROP SSP a reaction or curing period of 10-30 daysis usually required for optimum utilization of the acid and conversion of the phosphate to the available form In the SSAG process used to produce a 50 acidulated product in the pilot plant a minimum retention time of about 4 minutes was required for the initial rockacid reaction in the granulator when a phosphate rock of medium reactivity(central Florida) is used An additional 12 minutes was reshyquired for drying (curing) in the rotary drum-type dryerThe retention time in the process equipment (granulator and dryer) is based on the mass flow of material through the equipment Therefore the maximum production rate that can be achieved in a given plant is determined by the retenshytion time required for the particular phospbate rock after taking into account the required recycle-to-product ratio (total flow of material through the process equipment) In general for a given acidulation level the retention time reshyquired to achieve optimum operation of the plant and conshyversion of the P20 to an available form increases as the reactivity of the rock decreases A diagram of the effect of retention time in the pilot-plant granulator on the qualityof the operation and product when a rock of medium reacshytion (central Florida) was used is shown in Figure 7
11
Throughput Rate kglh However the presence of chloride may lead to increased corshyrosion of process equipment
4500 2250 1503 750 Particle Size-During the course of developing the SAB-I I I -- PAPR processing technology no tests were made specifi-
Production Rate kglh cally to evaluate the effect of the particle size of the phosshyphate rock on the performance of the process or the quality
1500 750 500 250 of the product However in several laboratory-scale tests using Hahotoe (Ibgo) and Pesca (Colombia) phosphate rocks (rocks considered low in reactivity) it was observed that relatively coarse material (65-89 passing 100-mesh and
Unacceptable Good Very Good less than 50 passing 200-mesh) was difficult to process Operation Operation Operation The 30-50 acidulated rock was extremely sticky and
could not be properly granulated or dried because of an exshycessive amount of unreacted acid When the rocks were more finely ground (at least 80 passing 200-mesh) the problems of stickiness and high levels of unreacted acid were
1 2 3 4 5 6 7 8 9 10 largely eliminated
Retention Time in Granulator minutes Furthermore in pilot plant-scale SSAG tests using the relatively unreactive Utah rock the granular product ws weak (this led to an excessively high recycle-to-product ratio)Figure 7 Effect of Rietention Time (production rate) on Plant Opera- when a relatively coarse (45 passing 200-mesh) material
tion and Product Quality-Single-Step Granular SAB-
PAPR Process was used However when the rock was more finely ground (77 passing 200-mesh) the strength of the product im-
Potassium Chloride Additive-With some relatively un- proved and operation was routine at a recycle-to-product reactive rocks the addition of a small amount of potassi- ratio of about 1 um chloride or sodium chloride (about 3-10) to the Effect of Curing-Reactions during curing (aging) of acidulation reaction usually increases its efficiency The inshycrease in efficiency is presumed to be due to the formation superphosphate-type products often affect the P solushyih of hydrochloric acid which attacks the rock more aggres- bility When ROP-SSP is produced from relatively higshysively than does straight sulfuric acid according to the fol- grade low-impurity phosphate rock curing of the moist lowing reactions material for a period of about 1-4 weeks increases the solushy
bility of the P20 5 Aging of granular SAB-PAPR products 2KCI + HS04 - made by IFDC had a variable effect on the final water- and
(potassium chloride) (sulfuric acid) NAC-soluble P20 in the products The data in Table 8 show that even though the granularKSO + 2HCI
(potassium sulfateT (hydrochloric acid) products were essentially dry a significant reversion of water-soluble P20 5 to NAC-soluble or insoluble P20 oc-
KCI + HSO - curred in those products containing a relatively large quanshy(potassium chloride) (sulfuric acid) tity of iron and aluminum impurities For example with the
Tilemsi Valley (Mali) product the water-soluble P20KHS0 4 + HOI (potassium hydrogen sulfate) (hydrochloric acid) declined about 60 and the NAC-soluble P20 5 increased
about 19 with aging Likewise th Kodjari (Burkina Faso) 14HCI + Caa(POeF + 3HO - product declined about 49 in water solubility and in
(hydrochloric acid) (fluorapatite) (water) creased about 80 in NAC-soluble P2Os In these two cases
3Ca(HZP04)H 20 + 7CaC + 21-F the available P205 (water- plus NAC-soluble fractions) (monocalcium phosphate (calcium chloride) (hydrofluoric acid) declined about 27 and 8 respectively as 9 result of
monohydrate) aging
- The products made from central Florida (USA) El-Cad 2 + llS04 (calcium chloride) (sulfuric acid) Hassa (Jordan) and Huila (Colombia) rocks were not sigshy
nificantly affected by aging presumably because of their 2HCI + CaSO4 relatively low level of iron and aluminum impurities
thydrochloric acid) (calcium sulfate) Although some samples were analyzed after 12-months
Addition of potassium chloride is particularly advanta- aging most of the reversion occurred within 2-4 weeks after geous when there is an agronomic need for potassium production
12
Thble 8 Effect of Curing (Aging) on P205 Solubility-Granular SAB-PAPR Products Made by IFDCa
Degree of P 20 5 Free Acid Free SAB-PAPR Product Acidilation Total Water-Soluble NAC-Soluble b Available (as P20) Water Fe2O3 AI20 3
() Central Florida (USA) 13 11
Fresh 50 236 112 31 143 06 18 Aged 50 234 119 38 157 08 12
EI-Hassa (Jordan) 044 021Fresh 30 261 79 31 110 15 42 Aged 30 262 75 31 106 01 07
Kodjari (Burkina Faso) 31 40 Fresh 50 180 65 30 95 NAc NAAged 50 183 33 54 87 lt01 20
Tilemsi Valley (Mal) 63 25Fresh 30 227 66 48 114 21 38 Aged 30 231 26 57 83 lt01 22
Thhoua (Niger) 103 21Aged 1 day 50 226 65 29 94 11 13 Aged I week 50 224 66 33 99 09 18 Aged I month 50 228 59 37 96 03 19 Aged 3 months 50 224 47 40 87 01 NA Aged 6 months 50 223 45 51 96 lt01 16
a Unless otherwise noted fresh samples were analyzed on day of production Aged samples were analyzed 3 weeks to 12 months following production depending upon sample b Does not include water-soluble P20 fraction c Not analyzed
Product Physical Properties prodtcts tested were fairly compatible with urea (able 5) This improved compatibility may make it possible to pre-
The granular SAB-PAPR products produced in laboratory- pare (bulk blend) multinutrient (NPK) mixtures using urea scale equipment generally exhibit less strength than those -usually the most abundant and economic source of nitroshyprepared in the pilot plant (Thble 5) The increased strength gen fertilizer The reason for the incompatibility of SABshyof the granules produced in the pilot plant (about 3 kg PAPR made from Sukula Hills (Uganda) phosphate rock is granule in the pilot plant compared with about 1 kggranule not fully understood but it is presumed to be related toin the laboratory) is attributed to the greater compaction the relatively high level of free acid and moisture in the forces that are imparted to granules in the larger size equip- freshly made product A cured sample (5 months old) of ment As previously mentioned the strength of the gran- the same product having a low level of free acid and free ules is also improved if the rock does not contain excessive water showed good compatibility with urea Also two mixshyamounts of carbonates When the carbonate level is high (in tures of urea and cured SAB-PAPR prepared from Utah excess of about 4 CO2) the granules are relatively porous phosphate rock showed differences in compatibility One and weak This can be seen by comparing products made sample containing 13 free water remained in good conshyfrom low-carbonate (central Florida) and high-carbonate dition while the other sample containing 26 free water(Huila and Mussoorie) phosphate rocks A crushing became wet and sticky after 6 days of storage at 30CThe strength of at least 2 kggranule is usually needed to avoid free acid (P20 5 basis) in both samples was low (06 or less)excessive degradation during handling and storage Conven- Although these tests are preliminary and long-term storagetional granular products such as SSP TSP and DAP usual- data with mixtures of urea and SAB-PAPR are not availashyly have crushing strengths of 2-5 kggranule depending ble it is likely that it will be feasible to mix SAB-PAPR upon the process and raw material compositions with urea and avoid unwanted reactions that cause wetting
The amount of water used during granulation also tends and caking provided the SAB-PAPR contains very low levshyto have an effect on granule strength When water evapo- els of free water and free acid rates from a granule during the drying step the structure of The 50 acidulated ROP products made from central the granule may become quite porous and this may cause Florida (USA) and Kodjari (Burkina Faso) rocks were quitethe granule to become relatively weak However in some granular After it was reclaimed from the curing pile and cases the adverse effect of high porosity may be offset by crushed (milled) to remove he large lumps about 50 of strong salt bridging on the surface of the granule caused by the material was between 4- and 14-mesh and the granulesthe migration of a salt solution from the core of the gran- were relatively hard (Table 5) In some cases such a semishyule to the surface during drying granular product may be an acceptable alternative to the
Unlike SSP and TSP most of the granular SAB-PAPR more costly granular product
13
Commercial-Scale Practices and Potential The rate of commercial utilization of SAB-PAPR technolo-gy is increasing However largely because of market prefer-ences and unattractive economics caused by the relatively small scale of operation required in many developing coun-tries this production technology is not expected to signifi-cantly replace the traditional more soluble phosphate products Some exceptions to this global prediction are described
Europe
Commercial-scale production of SAB-PAPR was begun in Finland in about 1930 and in Germany in the mid-1960s and now is established to a limited extent in those coun-tries as well as in France-a total production of about 400000 mtpy is estimated (20) The European firms pre-pare an ROP material that is subsequently granulated (after an appropriate period of curing) either alone or in combi-nation with nitrogen andor potassium salts A steamwater granulation process is most commonly used but a pressureshyroll compactiongranulation process is also used The choice of the granulation method used is more closely related to the cost of fuel and electricity than to the technical merits of either process For example if fuel (for drying with steamwater granulation) is relatively expensive comparedwith electricity (for pressure-roll compaction) compac-tiongranulation may be preferred
Latin America
Economic reasons are most often cited when explaining the recent rapid expansion of SAB-PAPR production in Brazil-nearly 200000 mt wa reportedly produced byabout 20 companies in 1983 (21) The governments man-date to maximize the utilization of indigenous phosphate resources (primarily of igneous origin) coupled with the desire to decrease acid consumption (importation of sulfur) catalyzed this rapid growth which began in about 1982
Most of the SAI3-PAIIR processing methods used in Brazil are similar to those used in Europe-an ROP materi-al is usually produced by use of a typical continuous belt-type den superphosphate process one plant however uses a single-step acidulationgranulation process similar to the SSAG process developed by IFDC After being cured (for a few days to several weeks) the ROP material is reclaimed
from storage and granulated using steam and water Th simplicity of using the existing SSP and TSP processin equipment for producing SAB-PAPR further explain Brazils rapid adoption of this technology The intermed ate and long-term agronomic and economic impact of thi shift away from the highly soluble phosphate fertilizer (SSP and TSP) must still be determined
Extensive agronomic testing of SAB-PAPR product made from a number of indigenous and imported phosphat rock sources has been under way since about 1978 in Colorr bia Favorable results (discussed later) may lead to th construction of SAB-PAPR production facilities in Color bia Unlike Brazil Colombia would most likely install neN production units because they do not have a large existinj superphosphate industry This would make it possible tA install the SAB-PAPR process that is best suited for thi specific characteristics of the indigenous phosphate rocl and the needs of the market A preference for the granulaSAB-PAPR product over the ROP variation is expected
Africa and Asia
West Africa-The potential for the adoption of SAB-PAPF technology in the interior regions of West Africa is quit( high However despite the availability of numerous in digenous phosphate deposits the relatively modest demanc for fertilizer and the small scale of ope tion consequentl3 required are expected to increase the cost of locall produced phosphate fertilizers (including SAB-PAPR) to level that is not economic
India-The situation in India is similar in many ways tc that in West Africa Certain cost reductions may be achiev able through economy of scale and improvements in the technology and the physical distribution system However it is expected that government mandates similar to those instituted in Brazil will be needed to catalyze the adop tion of this technology
Israel-Israel a longtime producer and exporter of phosshyphate fertilizers is reported to have begun commercial production of SAB-PAPR in 1984 (22) This product-along with its predecessors granular phosphate rock and TSPshyis expected to find its way into the export market prinshycipally in Europe This PAPR product is expected to replace a portion of the thermally altered phosphate fertilizers produced in Europe which require large amounts of energy
Production Economics The production econorcs including capital investment re-quirements were estimated for several phosphate process-ing schemes including ground phosphate rock (GPR) SSP
and the production capacities used for comparing the ecoshynomics of SAB-PAPR with conventional processing alternashytives are shown in Table 9
and SAB-PAPR A description of the processing schemes
14
Thble 9 Process Schemes and Capacities Used for Comparing Economics of SAB-PAPR
ScIheme I Scheme III (Ground (ROP SSP Scheme IV
Phosphate Scheme 1I Followed by (ROP Rock) (ROP SSP) Granulation) SAB-PAPR)
Processing Alternatives
Scheme V Scheme VI Scheme VII (ROP SAB-PAPR (Single-Step (Single-Step
Followed by Granular Granular SAB-PAPR Granulation) SAB-PAPR) Using Purchased Acid)
Required Production Units
Phosphate rock grinding product (30 PO( P2Os
Sulfuric acid (100 HS0)
SAB-PAPR (50 acidulation) product (22 total P20s) P20s
SSP (100 acidulation) product (19 total POJ P203
a Indicated capacities assume
(capacity mtpda)
200 200 200 200 200 200 200 60 60 60 60 60 60 60
56 b c1 12 b 1 12b 5 6b 56 b
270 270 270 270 60 60 60 60
315 315 60 60
100 utilization and negligible losses b Based on 056 mt 100 acidmt rock for 100 sulfuric acid acidulation c Purchased sulfuric acid must be equivalent to 56 mtpd of 100 acid Actual acid concentration may be as low as 75 or as high as 98 H2SO4
Basic Premises and Assumptions
These estimates are intended to describe the relative differ-ences in the fixed-capital investment and production costs for a number of phosphate fertilizer processing schemes and therefore make it possible to objectively assess the economic merits of the SAB-PAPR processing alternatives Invest-ment estimates are given for three basic SAB-PAPR pro-cessing schemes including phosphate rock grinding sulfuric acid production storage and related items A scheme assuming purchased sulfuric acid is also included In all cases a plant location in a developing country is as-sumed for estimating the required capital investment and production cost The capacity of each production unit is based on a rock-grinding capacity of 200 mtpd of a rock containing 30 P205 (60 mtpd P205 ) Other premises and assumptions used in preparing these estimates are shown in Appendix A
The cost estimates in this bulletin are presented in such a way that they can be easily adjusted to fit local conditions By using these cost estimates as a reference it is possible to make relatively accurate site-specific investment and pro-duction cost estimates after considering juch site-specific factors as (1)cost of process equipment (2) local construc-tion costs (3) cost of raw materials (4)cost of labor supervi-sion fuel and finance charges and (5)expected capacity utiliation
Investment and Production Cost Estimates
A summary of the capital investment and production cost estimates for the various processing schemes used to com-
pare the SAB-PAPR production alternatives is shown in Table 10 A detailed description of the estimates for each scheme is given in Tbles 11-18 The estimated cost of the major SSP and SAB-PAPR equipment items and the total fixed-investrient components for each processing scheme are shown in Appendix A
Investment Cost Estimates-These estimates (Thble 11) show that the SSAG process scheme using purchased sulshyfuric acid (Scheme VII) is the least costly of the SAB-PAPR processing alternatives involving granulation (about US $156 million) The ROP SAB-PAPR process followed by granulation and the SSAG process (including production of sulfuric acid) require essentially the same total capital investment (about US $189 million) while the ROP SAB-PAPR process (Scheme IV) requires the least investment (about US $134 million compared with about US $189 milshylion for the granular SAB-PAPR variation) All the schemes include rock grinding and the SSP and SAB-PAPR schemes (except Scheme VII) include the production of sulshyfuric acid The ROP SSP and the granular SSP alternatives (Schemes II and III including rock grinding) cost approxshyimately US $35 million more than the equivalent SAB-PAPR processing units This increased investment is due primarily to the cost of a larger sulfuric acid unit In all cases the cost for the battery limits process plant units for the three granular SAB-PAPR schemes is less than 25 of the total capital investment (155 189 and 230 for Scheme V VI and VII respectively)
Production Cost Estimates-Of the granular SAB-PAPR alternatives (Tiable 10) the SSAG process (Scheme VI inshycluding the production of sulfuric acid) shows the lowest production cost (about US $105mt product or about US $478mt P205)The SSAG process based on purchased sulshyfuric acid (Scheme VII) is indicated as the most costly
15
Table 10 Summary of Investment and Production Cost Estimates Used For Comparing SAB-PAPR Processing Alternatives a
Schemc I Scheme II Scheme V Scheme VI Scheme VII (Ground (ROP SSP Scheme IV (ROP SAB-PAPR (Siugle-Step (Single-Step
Phosphate Scheme II Followed by (ROP Followed by Granular Granular SAB-PAPR Rock) (ROP SSP) Granulation) SAB-PAPR Granulation) SAB-PAPR) Using Purchased Acid)
Plant capacity mtpd Product 200 315 315 270 270 270 270 P 201 60 60 60 60 60 60 60
PO content of product 30 19 19 22 22 22 22 Capital investment US $ x 1 million) --------
Fixed investment ------- -
43 144 196 116 166 172 136 Working capital 07 24 29 18 23 17 20
Total Capital Investment 50 168 225 134 189 189 156
(US $Mt)
Raw material 258
Production cost U 409 409 335 335 335 560
Variable conversion 158 182 276 178 269 241 247 Fixed conversion 187 358 476 343 476477 381
Total Production Cost
Product basis 603 949 1161 856 1081 1052 1188 POA basis 2010 4995 6111 3891 4914 4782 5400
a Values may vary slightly due to rounding when compared with detailed estimates
Table 11 Total Capital Investment Estimates Used for Comparing SAB-PAPR Processing Alternatives
Scheme I Scheme III Scheme V Scheme VI Scheme VII (Ground (ROP SSP Scheme IV (ROP SAB-PAPR (Single-Step (Single-Step
Phosphate Scheme II Followed by (ROP Followed by Granular Granular SAB-PAPR Rock) (ROP SSP Granulation) SAB-PAPR) Granulation) SAB-PAPR) Using Purchased Acid)
Plant capacity mtpd Product 200 315 315 270 270 270 270 POS 60 60 60 60 60 60 60
PO content of product llt 30 19 19 22 22 22 22 Direct plant cost ------- US $ x- I million)
Phosphate rock gfinding unit 120 120 120 120 120 120 120 Sulfuric acid unit 230230 150 150 150 SSP or SAB-PAPR unitc
079 320 072 357294 357 Raw material and product
storage yd handling facilities 075 180 180 150 150 110 145
Utility facilities e 025 100 120 080 110 110 050
General service facilities 025 060 070 050 060 060 050 Total Direct Plant Cost 245 769 1040 622 884 901 722
Other costs Engineering and supervision 037 115 156 093 133 136 108 Constructin overhead and
expenses 025 077 104 062 088 091 072 Contractors fee f 025 077 104 062 088 091 072
Subtotal 086 269 364 218 309 317 253 Total Plant Fost 331 1038 1404 840 1193 1224 975 Spare parts 009 032 047 025 040 044 032 Preoperatiqnal and startup
expenses 1 013 048 071 038 061 066 047 Project manalement services 017 052 070 042 060 061 049 Contingencies 033 104 140 084 119 122 097 Interest during construction f 028 166 225 134 192 197 156 Total Fixed Investment 430 1439 1958 1163 1665 1716 1356 Working capital f 069 236 286 180 227 174 199 Total Capital Investment 499 1675 2244 1343 1892 1890 1555
a Ibtals may vary slightly due to rounding b Based on vendor estimates and IFDC cost files c- Refer to Appendix Tbbles A-1 and A-2 d Refer to Appendix A for capacity and unit cost e Based on engineering and construction estimates for similar projects f Refer to Appendix A for cost estimating factors
16
Table 12 Production Cost Estimate-Scheme I Ground Phosphate Rock
Basis 1 Total plant cost-US S331 million 2 Total fixed investment-US $430 million 3 Working capital-US $069 million 4 Total capital investment-US S499 million 5 Annual production-66000 mt of 30 POs ground rock
Item
Raw material cost Unground rock (30- PO0
Variable-conversior costElectricity
Diesel oil Imobile equipment) Miscellaneous supplies Bags
Subtotal
Fixed-conversion cost Operating personnel
Administration and general overhead Maintenance materials and labor Insurance and taxes Fixed-capital recovery Interest on working capital
Subtotal
TOTAL PRODUCTION COSTa Product basis P2Os basis
Basis
103 mt (a US S25mt
25 kWh a US $01kWh
0092 mt US $400mt
20 bags US $06 each
Appendix Table A-3
100 personnel cost 5 of US $331 millionyear 1 of US $331 millionyear 163 of US $430 millionyear 14 of US $069 millionyear
a At 100 capacity utilization and including bagging
Cost US Simt
258
25
08 05
120
158
18
18 25
05 106
15
187
603 2010
Table 13 Production Cost Estimate-Scheme II Run-of-Pile Single Superphosphate
Basis 1 Total plant cost-US S1038 million 2 Total fixed investment-US $1439 million 3 Working capital-US S236 million 4 Total capital investment-US $1675 million 5 Annual production-103950 mt of 19 P 20s product
Item
Raw material cost Unground rock (30 P200 Sulfur
Subtotal
Variable-conversion cost Electricity Water Diesel oil (mobile equipment)
Catalyst chemicals and miscellaneoussupplies
Bags
Subtotal
Fixed-conversion cost Operating personnel
Administration and general overhead Maintenance materials and labor
Insurance and taxes Fixed-capital recovery Interest on working capital
Subtotal
TOTAL PRODUCTION COSTa Product basis P1 0s basis
Basis
066 mt US $25mt 0122 mt US $200mt
23 kWh US $01kWh 14 m US $05m0003 mt ( US $400mt
20 bags US $06 each
Appendix Table A-3
100 personnel cost 5 of US $1039 millionyear
1 of US $1038 millionyear 163 of US $1439 millionyear14 of US $236 millionyear
a At 100 capacity utilization and including bagging
Cost US $(mt
165 244
409
23 07 12
20 120
182
20
20 50
10 226 32
358
949 4995
I-
Table 14 Production Cost Estimate-Scheme III Run-of-Pile Single Superphosphate Followed by Granulation
Basis 1 Total plant cost-US S1404 million 2 Total fixed investment-US S1958 million 3 Working capital-US S286 million 4 Total capital investment-US $2244 million 5 Annual production-103950 mt of 19 P20s product
Item
Raw material cost Unground rock (30 P O) Sulfur
Subtotal
Variable-conversion cost Electricity Water Fuel oil Diesel oil (mobile equipment) Catalyst chemicals and miscellaneous
supplies Bags
Subtotal
Fixed-conversion cost Operating personnel Administration and general overhead Maintenance materials and labor Insurance and taxes Fixed-capital recovery Interest on working capital
Subtotal
TOTAL PRODUCTION COSTa Product basis POd basis
Basis
066 mt US $25mt 0122 mt US $200mt
90 kWh US $01kWh 16 m US S051m 0006 mt US $350mt 0003 mt US $400mt
20 bags US $06 each
Appendix Table A-3 100 personnel cost 5 of US $1404 millionyear 1 of US S1404 millionyear 163 of US $1958 millionyear 14 of US $286 millionyear
a At 100 capacity utilization and including bagging
Table 15 Production Cost Estimate-Scheme IV Run-of-Pile SAB-PAPR
Basis 1 Total plant cost-US S840 million 2 Total fixed investment-US $1163 million 3 Working capital-US SI80 million 4 Total capital investment-US S1343 million 5 Annual production-89100 mt of 22 PO product
Item
Raw material cost Unground rock (30 POs) Sulfur
Subtotal Variable-conversion cost
Electricity Water Diesel oil (mobile equipment) Catalyst chemicals and miscellaneous
supplies Bags
Subtotal
Fixed-conversion cost Operating personnel Administration and general overhead Maintenance materials and labor Insurance and taxes Fixed-capital recovery Interest on working capital
Subtotal
TOTAL PRODUCTION COSTa
Product basis PO basis
Basis
077 mt US $25mt 0071 mt US S200mt
27 kWh US $01kWh 08 m3 US $05m 0002 mt US $400mt
20 bags US $06 each
Appendix Table A-3 100 personnel cost 5 of US $840 millionyear 1 of US $840 millionyear 163 of US $1163 millionyear 14 of US $180 millionyear
Cost
US Smt
165 244
409
90 08 21 12
25 120
276
25 25 68 13
307 38
476
1161 6111 a At 100 capacity utilization and including bagging
Cost US Smt
193 142
335
27 04 12
15 120
178
23 23 47 09
213 28
343
856 3891
Table 16 Production Cost Estimate-Scheme V Run-of-Pile SAB-PAPR Followed by Granulation
Basis 1 Total plant cost-US $1193 million 2 Total fixed investment-US S1665 million 3 Working capital-US $227 million 4 Total capital investment-US S1892 million 5 Annual production-89100 mt of 22 POs product
Item
Raw material cost Unground rock (30 P20) Sulfur
Subtotal
Variable-conversion cost Electricity Water Fuel oil Diesel oil (mobile equipment) Catalyst chemicals and miscellaneous
supplies
Bags
Subtotal
Fixed-conversion cost Operating personnel Administration and general overhead Maintenance materials and labor Insurance and taxes Fixed-capital recovery
Interest on working capital
Subtotal
TOTAL PRODUCTION COSTa Product basis
P2 0s basis
Basis
077 mt US $25mt
0071 mt US $200mt
80 kWh US $01kWh 10 m US $05m 0009 mt US $350mt 0003 mt US $400mt
20 bags US $06 each
Appendix Table A-3 100 personnel cost 5 of US $1193 millionyear 1 of US $1193 millionyear 163 of US $1665 millionyear
14 of US $227 millionyear
a At 100 capacity utilization and including bagging
Cost US $mt
193
142
335
80 05 32 12
20
120
269
28 28 67 13
305
36
477
1081
4914
Table 17 Production Cost Estimate-Scheme VI Single-Step Granular SAB-PAPR
Basis 1 Total plant cost-US S1224 million 2 Total fixed investnent-US S1716 million 3 Working capital-US SI74 million 4 Total capital investment-US $1890 million 5 Annual production-89100 mt of 22 P20S product
Item
Raw material costUnground rock (30 POs) Sulfur
Subtotal Variable-conversion cost
Electricity Water Fuel oil Diesel oil (mobile equipment) Catalyst chemicals and miscellaneous
supplies Bags
Subtotal
Fixed-conversion cost Operating personnel Administration and general overhead Maintenance materials and labor Insurance and taxes Fixed-capital recovery Interest on working capital
Subtotal
TOTAL PRODUCTION COSTa Product basis PA0 basis
Basis Cost
US $Imt
077 mt US $25mt 0071 mt US $200mt
193 142
335
706 kWh US $01kWh 10 m US $05m 0005 mt US $350mt 0002 mt US $400mt
70 05 18 08
20 bags US $06 each 20
120
241
Appendix Table A-3 100 personnel cost 5 of US $1224 millionyear 1 of US $1224 millionyear 163 of US $1716 milhioniyear 14 of US $174 millionyear
26 26 69 14
314 27
476
1052 4782
a At 100 capacity utilization and including bagging
Table 18 Production Cost Estimate-Scheme VII Single-Step Granular SAB-PAPR Using Purchased Sulfuric Acid
Basis 1 Total plant cost-US $975 million 2 Total fixed investment-US $1356 million 3 Working capital-US $199 million 4 Total capital investment-US $1555 million 5 Annual production-89100 mt of 22 P205 product
Item
Raw material cost Unground rock (30 POs) Sulfuric acid (100 basis)
Subtotal
Variable-conversion cost Electricity Water Fuel oil Diesel oil (mobile equipment) Catalyst chemicals and miscellaneous
supplies Bags
Subtotal
Fixed-conversion cost Operating personnel Administration and general overhead Maintenance materials and labor Insurance and taxes Fixed-capital recovery Interest on working capital
Subtotal
TOTAL PRODUCTION COSTa Product basis P20 basis
a At 100 capacity utilization and including bagging
(about US $119mt product or about US $540mt P20 5) The least expensive SAB-PAPR alternative is the ROP SAB- PAPR process (Scheme IV)-about US $86mt product or about US $389mt P 20 5 For comparison the ROP and granular SSP alternatives were evaluated A production cost of about US $500mt P20 for ROP SSP and about US $61 1mt P20 for granular SS1P is indicated The major reason for the increased cost of SSP compared with SAB-PAPR is the cost of additional sulfuric acid (sulfur) Also when expressed in terms of total P20 5 the PAPR product has the added benefit of a higher P 205 content (22 P 20 5 compared with 19 for SSP)
Factors Affecting SAB-PAPR Production Costs
The cost of producing SAB-PAPR as with most other fer-tilizers is influenced by several factors A discussion of the most important factors identified as a result of these tech-nicalkeconornic studies follows
Cost Basis US $mt
077 mt US $25mt 193 0216 mt US $170mt 367
560
60 kWh US $01kWh 60 05 m US $05m 03 0013 mt US $350nt 46 0002 mt US $409mt 08
10 20 bags US $06 each 120
247
Appendix Table A-3 18 100 personnel cost 18 5 of US $975 millionyear 55 1of US $975 millionyear 11 163 of US $1356 millionyear 248 14 of US $199 millionyear 31
381
1188 5400
Effect of Fixed-Capital Investment-Except for the cost of raw materials the largest single production cost composhynent for the SAB-PAPR processing schemes described in this bulletin is fixed-capital recovery (21-30 of total production cost) This component is heavily influenced by the plant investment and the cost of money (interest or exshypected return on equity) The effect of fixed-capital investshyment on production cost (at 100 capacity utilization) including bagging for the SSAG process (Scheme VI) comshypared with granular SSP (Scheme III) is hown in Figure 8 The production of sulfuric acid is included in both schemes This figure can also be used to estimate the imshypact of plant location on production cost (location factor) by comparing the base-case fixed investment used in this bulletin with the actual investment expected in the specifshyic location
Effect of Capacity Utilization-The previout iy mentioned production costs were based on 100 capacity utilization The effect of decreasing capacity utilization of the SSAG unit (Scheme VI) and the granular SSP unit (Scheme III) below the 100 level on the expected production cost
20
Basis 100 Capacity Utilization is Equivalent Basis A50 Degree ofAcidulation Corresponds to 270 mtpd 50 acidulated SAB-PAPR and Total Productto 270 mtpd of22 PsO 315 mtpd SSP and 0071 mt Sulfurnt Product Coasts of Producing Sulfuric Acid and Bagging SulfurIsproed atUS $r imt
Are Included Cot ofProducing Sulfurickid and Boo Bagging Ae IncludeeFixed-Capital Investment-US $172 Million
SAB-PAPR (Scheme VI) US $196 Million 700Boo Granular SSP (Scheme 1II)
600700- Granular SSP P1OSBasis 600 _ (19 P2O) -P0 Basis 5II---
500 SA--PAPR(22 PjOs)
a400shy
~200shy300shy
100- Product Basis 200
Product Basis (1
100 35 45 556
0 Degree of Acidulation 10 11 14 16 18 20 2224 26 e
Fixed-Capital US $ on Production Cost-Investment million Figure 10 Effect of Degree of AcidulationSingle-Step Granular SAB-PAPR Process (Scheme VI)
Figure 8 Effect of Fixed-Capital Investment on Production CostshySingle-Step Granular SAB-PAPR Process (Scheme VI) 50 This occurs not only because more sulfuric acid is re-Compared With Granular SSP (Scheme III) quired per metric ton of product but also because the overall
production rate must be decreased below the base-case Basis 100 Capacity Utilization is Equivalent production rate of 270 mtpd of 50 acidulated product (less
to 270 mtpd 50 Acidulated SAD-PAPR and rock will be used) since the capacity of the sulfuric acid315 mtpd SSR plant cannot be significantly increased When the acidula-Costs of Prducing Sulfuric Acid and tion level is decreased below the base-case value of 50
100Bg the rock-grinding capacity becomes a limiting factor and 900 Granular SSP the production of sulfuric acid and finished product must
p90 also be decreased accordingly The result of this is a slight E decrease in production cost (compared with the base-case
700- level of 50 acidulation) because the sulfuric acid saving
800 ( )
600 -more than offsets the other cost increases due to the slight-SAB-PAPR P205 Basis ly decreased capacity utilization For example at a 30(22o P205) level of acidulation about 250 mtpd of product would be
400 produced compared with 270 mtpd at the 50 (base-case) 300- level of acidulation Also since the total P20 content of 200- the SAB-PAPR product declines as the degree of acidulashy100 ---- - - Product Basis tion is increased the cost of production when expressed
0 in terms of total P20 also increases with the degree of acidulation40 60 DO 100 120 Effect of Raw Material Cost-The impact of the cost of
Caoacity Utilization 0 sulfur and unground phosphate rock on the cost of produc-
Figure 9 Effect of Capacity Utilization on Production Cost-Single- tion of SAB-PAPR compared with granular SSP is shown Step Granular SAB-PAPR Process (Scheme VI) Compared in Figures 11 and 12 respectively The effect of using pur-With Granular SSP (Scheme III) chased sulfuric acid is shown in Figure 13 These data show
that the production cost of a SAB-PAPR processing altershyincluding the production of sulfuric acid and bagging) is nati e based on the use of purchased sulfuric acid (Schemeshown in Figure 9 A similar adverse effect on the produc- VII for example) will be affected the most by changes in tion cost would also occur with the other processing the cost of sulfur or sulfuric acid Although the cost of unshyschemes ground phosphate rock is significant with respect to produc-
Effect of Degree of Acidulation-For the example illus- tion cost its impact is less pronounced trated in Figure 10 (Scheme VI including production of sulshyfuric acid) the cost of production will increase if the acidulation level is increased above the base-case level of
21
800
Basis 50 Acidulated SAB-PAPR 0071 mt Sulfurlmt SAB-PAPR 0122 mt Sulfurlmt SSP Costs of Producing Sulfuric Acid and Bagging Are Included 800
700-
Basis 50 Acidulated SAB-PAPR Using 0216 mt Acidrt Product Production Cost Includes Bagging
P205 Basis
-E
700
600
50(22500
Granular SSP - (19 P 0 5)
SAB-PAPR P205)
P205 Oasis
F shy
0
600
500
400shy
_
400 =2 300
t
e
300
200
100-Product Basis
E2 200
100
0
Product Basis
0 100 200 300 400 500
100 140 180 220 260 300 Sulfuric Acid Price US $mt
340 380
Sulfur Price US Srnt Figure 13 Effect of Cost of Sulfuric Acid on Production Cost-
Figure 11 Effect of Cost of Sulfur on Production Cost-Single-Step
Granular SAB-PAPR Process (Scheme VI) Compared
With Granular SSP (Scheme 1i1)
Single-Step Granular SAB-PAPR Process Using Purshychased Sulfuric Acid (SchemeVII)
800
Basis 50 Acidulated SAB-PAPR 077 mt Phosphate Rockrt SAB-PAPR 066 mt Phosphate Rocklml SSP Costs ofProducing Sulfuric Acid and Bagging Are Included
700 Granular SSP s -
600- POs Basis
500 SABPAPR -
400
300shy
2 200shy
00
Product Basis
O020 30 40 50
Unground Phosphate Rock Price US $mt
Figure 12 Effect of Cost of Unground Phosphate Rock on Producshytion Cost--Single-Step Granular SAB-PAPR Process (Scheme VI) Compared With Granular SSP (Scheme III)
22
Agronomic Performance 2Phosphorus is absorbed by plants as H2PO 1- and HP04 - ure of the quantity of available phosphorus in the rock
ions present in the soil solution Without the use of (the case with most conventional chemically processed phosphorus-containing fertilizers replenishment of the phosphate fertilizers) Instead repeated NAC extractions soil solution with the phosphorus-containing ions de- of a phosphate rock sample will cause the incremental pends upon the release of phosphorus from compounds release of a portion of the phosphorus in the rock This native to the soil such as apatite iron or aluminum phos- release of phosphorus can be used to index the expected phates or phosphates combined with the clay and organic rate of rock (phosphorus) dissolution fractions of the soil The degree to which the concentra- Partially acidulated phosphate rock products such as
2tion of H 2PO 41 andor HP0 4 is altered in the soil solu- SAB-PAPR combine some of the solubility characterisshy
tion depends upon the solubility of the phosphate and tics of all the phosphate fertilizers described above Since the pH of the soil SAB-PAPR is the product of the acidulation of phosphate
Conventional types of phosphate fertilizers are gener- rock with less sulfuric acid than is required for the producshyally classified into the following three groups with respect tion of a fully acidulated material (SSP) it contains varishyto solubility able quantities of water-soluble NAC-soluble and
NAC-insoluble phosphorus depending upon the reactivi-Group 1 Those in which the phosphorus is mostly solu- ty of the phosphate rock the quantity of acid used the
ble in water (for example SSP TSP DAP and impurities in the rock and the process conditions The monoammonium phosphate [MAP)) water-soluble portion therefore provides an immediate
Group 2 Those containing phosphorus that is moderate- source of phosphorus for entry into the soil solution and ly soluble in water but highly soluble in an the unacidulated portion of the SAB-PAPR behaves in NAC solution (for example ammoniated super- a manner similar to that of the phosphate rock from phosphates and some nitrophosphate-type which it vas produced fertilizers) When MCP (the principal water-soluble phosphate com-
Group 3 Those in which the phosphorus is not readily ponent in SSP TSP and SAB-PAPR) hydrolyzes in the soluble in water but quite soluble in an NAC soil the soil near the fertilizer becomes quite acid (pH solution (for example dicalcium phosphate usually less than 2) This high acidity is transitory but thermally altered phosphates and basic slag) can cause rapid dissolution of the otherwise insoluble and
unreactive iron and aluminum compounds in the soil If Unacidulated phosphate rock falls into a fourth this occurs these solubilized compounds may react with
category in which the phosphorus is not soluble in water soluble phosphorus and render it unavailable to the crop and only sparingly soluble in an NAC solution The usually good performance of SAB-PAPR (compared
The solubility of a fertilizer directly influences the quan- with conventional sources of phosphate such as SSP and tity of plant-available phosphorus that will be released TSP) in such soils is attributed in part to the neutralizshyfrom the fertilizer at any given time after its application ing effect of the unacidulated phosphate rock contained The phosphorus in the fertilizers belonging to Group 1 in SAB-PAPR The net result is that the localized acidishycan be expected to enter into the soil solution almost im- ty caused by the hydrolysis of MCP is quickly neutralshymediately following application For those fertilizers in ized the dissolution of iron and aluminum is slowed and Group 2 30-50 of the phosphorus usually will immedi- more phosphorus is apt to remain in the soil solution for ately enter into the soil solution and the remainder will immediate use by the crop Furthermore the unreacted enter over a period of several weeks to several months phosphate rock in the SAB-PAPR also offers a residual In the case of the fertilizers in Group 3 only a small por- source of phosphorus as it gradually dissolves in the soil tion of the phosphorus will enter into the soil solution The conditions under which the SAB-PAPR would be exshyimmediately but nearly all of it will become available pected to be the most effective are summarized through the course of the growing season of the crop 1 SAB-PAPR would be expected to provide the
Since phosphate rocks contain virtually no water- maximum amount of plant-available phosphorus when soluble phosphorus and variable amounts of NAC-soluble applied to acid soils In all soils the water- and NACshyphosphorus depending upon the origin and composition soluble P20 5 portions would be immediately available of the predominant phosphorus-containing mineral they to promote rapid development of the crop but only in dissolve in acid environments at a rate related to their acid soils would the unacidulated portion of the rock NAC solubility (reactivity) Therefore untreated phos- be expected to contribute plant-available phosphorus phate rocks provide phosphorus to the soil solution in a in any significant quantity slow but continuous manner with the rate of release de- 2 Although SAB-PAPR would be expected to show high termined by the rocks reactivity (solubility) and the effectiveness when applied to acid soils with low phosshycharacteristics of the soil The phosphorus extracted from phorus-fixation capacities its efficiency relative to phosphate rock by an NAC solution is not a finite meas- more soluble phosphate fertilizers would be maximized
23
in acid soils with high phosphorus-fixation capacities (for example soils high in iron and aluminum oxides and hydroxides)
3 The increase in agronomic effectiveness of a SAB-PAPR product above that of an unacidulated phos-phate rock will often be most pronounced when the reactivity of the phosphate rock is low This is because highly reactive phosphate rocks applied to acid soils may already be very effective In those cases the minimal increase in effectiveness due to the addition-al soluble phosphorus may not justify the additional expense of partial acidulation This is illustrated in Fable 19 which shows the high effectiveness of a very reactive unacidulated phosphate rock (Sechura deposit in Peru) when compared with TSP in a greenhouse ex-periment using several Colombian soils This table also illustrates the improvement of a less reactive rock (Pesca deposit in Colombia) when it was converted to SAB-PAPR and applied to soils exhibiting relatively high pl values and phosphorus-fixation capacities
Table 19 Influence of Soil Characteristics on Agronomic Effectiveness of Phosphate Rock and SAB-PAPR
Relative
Agronomic Effectivenessc
Soil Characteristics Pesca
Available P Phosphate Rock SAB-Soil pli Native P t Fixation b Sechura Pesca PAPR
ppm) ( (7r)
Ultisols
Amazonas 155 322 202 106 87 88 Quilichao 130 108 401 102 88 8C Caucasia 485 119 304 93 37 65
Oxisols Gaviotas 425 183 335 115 74 75 Caritnagua 465 243 323 108 91 85 La Lihertad 460 235 339 107 70 80
Andepts Unidad 10 550 395 412 59 0 59 El Hefugio 530 042 721 88 16 77
a HraN I test method shy
h) Method as described by Fassbender and Igue (23) c Based on drv-miatter production of grass (Brachiaria decumbens) rela-tive to rSP
Source IFI)CCIAT collaborative research (1)
___---_
Another factor that usually enhances the agronomic performance of the SAB-lIAPR product is the relation-ship between phosphorus and sulfur In most SAB-PAPR products this relationship closely matches the cropsnutritional demand for both of these elements Sulfur deficiencies are becoming apparent in phosphorus-deficient tropical regions because of the widespread use of essentially sulfur-free phosphate fertilizers such as TSP and DAPThe SAB-PAPR product is usually an adequate source of sulfur because the quantity of sulfur required
to overcome the deficiency is generally far less than the amount of sulfur provided by a fully acidulated product(SSP) if the SSP is applied at the level required to meet the phosphorus requirement The beneficial effect of the sulfur component of SAB-PAPR was observed in a numshyber of locations One such example is illustrated in Figure 14 In this experiment performed at Ikare Nigeria the superior performance of SAB-PAPR and SSP compared with DAP and NPK (15-15-15) was attributed to the adshydition of nutrient sulfur as well as phosphorus
48 46
ssP
no 42
E_6
gt 40 - 15-1515
38
36
34 0 5 10 15 20 25 30
Total Phosphorus (P)Applied kglha
SAB-PAPR50 Togo(Africa) Rock Acid50Acldulatad Phosphate With Sulfuric 25TotalPrO
ws PO14MNACSolubla (includesPO I S7s
SSP20 ProTotal18WSP19NACSolublePoCOcludesW13PA0)
12S
SAP18Nitogen
43WSPo 45NCSolubla WSP01Pro (Iocludes Nil S
1515-15 Nitrogen15 13WSPrO151NAC-SolublsPrO lincludes WNSP01
Al I Source A Botiono etat (3)
Figure 14 Effect of Phosphorus and Sulfur on Yield of Maize-
Subhumid Africa
Extensive field investigations into the agronomic effecshytiveness of SAB-PAPR have been performed during the past 10 years under a wide range of tropical conditions in Latin America Africa and Asia These experiments have been conducted both in research experiment stations and under the constraints encountered at the farm level Iypishycal crop responses to SAB-PAPR on phosphorus-deficient acid soils are illustrated in Figures 15-20 It can be seen from these data that SAB-PAPR especially when acidushylated to a level of about 50 was found to be usually as effective as TSP or SSP over a wide range of soil and cropshyping combinations Likewise it can be observed that this high degree of effectiveness was obtained even during the first cropping period following application of SAB-PAPR fertilizer In contrast during this first cropping period the rocks from which the SAB-PAPR products were proshyduced-unacidulated rocks of low to medium reactivityshycontributed little phosphorus to the soil solution
24
8
24
TSP
SAB-PAPR- 40 SAB-PAPR -50 20-7
TSP
Phosphate Rock16
E
z 12shyw 6
Phosphate Rock U TSP48 Total P20 TSP48TotalPro 41 PSP0 cdC 41 WSPro0 Ra NAC4Soluble P20541clWdPs(Inlude
- 461oNACSoluble PO (includes WSPrO) SAB-PAPR-40 401 Acidulated Central Florida Phosphate Rock SBPAPR50 50 Acidulated Huila (Colombia) Phosphate Rock
With Sulfuric Acid Z With Sulfuric Acid 230oTotalP1O5 = 150 Total PoOs 9o0ws PrOs5 Lu a WS POs12 NACSoluble PrOs(Includes WSP0) 5- 95 NACSoluble PrOs (Includes WSPrOs)
Central Florida Phosphate Rock 900oMinus 100Mesh Huilo Phosphate Rock 90 Minus 100 Mesh 320oTotalPrO 1900Total PrOs340o NACSoluble PzOs 35NAC-Soluble Pros
0 44 8 132 176
Total Phosphorus (P)Applied kgha
0 30 60 90 Source IFDCINIAP collaborative research (1)
Figure 15 Effect of Phosphorus Source on Yield of Potatoes-Ecuador Total Phosphorus (P) Applied kgha
Source L A Leon (2)12 1TSP
Figure 17 Effect of Phosphorus Source on Yield of lntercropped Maize FirstCrop SABPAPR-50 and Beans-Colombia SSecondCrop
24
SAB-PAPR50 09-
SSP22P 08 ---TSP Z 20
- SABPAPR -50 E =E 07 18
-- -Phosphate Rock SABPAPR25506t 16-Phosphate
Phosphale Rockk w 05 6 Sp48 TotalPrO 14
04 shy 4 NAC-Souble P os (Includes WS P Os)114 41 WSP20 12 5 shy
0 SAIPAPR50 Hulls Rock 0 18 36 54 72 905aAcidulated (Colombia) PhosphateWithSlfuric Acid15 rotalPO 1 WS PO 0 licudnn Total Phosphorus (P) Applied kgha95 4NAtSoluble (IncludesP rO W S P O )T
SSP20 lotailPO 01- HuliaPhosphate 18 WS PrORock90Minus100 Mesh
19TotalPro i9NACSolublePiO(includes WS PjOsi 35 NACSoluble 500 AcidulatedTogoAficaPhosphateRockWithSulfuricAcidPrO SAORPAPR50
1 26 TotalPO0 35 70 105 140 t21 wS P2O
14tNAC PO lilnciudesSoluble WS POs)Total Phosphorus (P)Applied kgha SAB-PAPR-25 RockWiihSulfuricAcid25 AcidulaedTogoPhosphate
Source LA Leon (2) 3 TotlP1o 70WS PrO
Figure 16 Efiect of Phosphorus Source on Yield of Two Crops of tNACSiube PiO(includes WS P0) Beans-Colombia Togo Rock 90 Minus100Phosphate Mesh
36 TotalPO 3 NACSolublePO
Source A Battono et al(3)
Figure 18 Effect of Phosphorus Source on Yield of Maize-Humid
Africa
25
16 54
SAB-PAPR-30
14 S 5 TSP
12
50 SAB-PAPR-50
E 10
Phosphate Rock SAB-PAPR-15
Phosphate Rock
08 441 ISP4 TotalPro
WS_Peasi
06 46 NACSolublePrO Includes WSP0s
040
5 10 15 20
Total Phosphorus (P)Applied kglha
25
44-
42-l
40
SAIPAPR50508 AcidulatedHuila(Colombia)PhosphateRockWith Sulfuric Acid 15l Total PrO I INS PrO
95 NACSolube P2O tincludesWS Pr01
HuilaPhosphateRock900 Minus100 Mesh 19Total PrO 35 NACSotuble PO 35______ ______Plus
TSP48TotalPo 41WS PrO 46HAC-SolublePOslnclutesWS Pr0)
SSP20 TotalPrO 18 WSPrO l9a NAC-SolublePrO lIncludes WSPlot)
SAB-PAPR3030C AcidulatedTilemstValley (Mali) Phosphate RockWith Sulfuric Acid 234 TotalPO 6 WSPrO 11 NAC SoluhlePrO(includesWSPl)d
SABPAPR1515 AcidutatedTtems ValleyPhosphateRockWithSulfuricAcid 25 TotalPO 25k WSPO 75 NACSolublePlO ItncludebWSPrOd
0 10 20 30 40 50 60 o 80 90 100
Total Phosphorus (P)Applied kglha Source L A Leon (2)
Figure 20 Effect of Phosphorus Source on Yield of Rainfed Upland Rice-Colombia
Tilems0ValleyPhosphateRock90Minus200Mesh 264 TotalPrO J NACSlublePO
Source A Sationo el al (3)
Figure 19 Effect of Phosphorus Source on Yield of Maize-Semiarid Africa
26
References 1 Hammond L L and L A Le6n 1983 Agronomic Effectiveness of Natural and Altered -Phosphate
Rocks From Latin America ProceedingsThird International Congress on Phosphorus Compounds October 4-6 Brussels Belgium
2 Le6n L A 1984 On-Farm Suitability of Indigenous Phosphate Products unpublished 3 Bationo A S K Mughogho and A U Mokwunye 1985 Agronomic Evaluation of Phosphate Fershy
tilizer Alternatives in Sub-Saharan Africa Paper presented at the Symposium on the Management of Nitrogen and Phosphorus Fertilizers in Sub-Saharan Africa Lome Ibgo March 25-28
4 Sudjadi M J Prawirasumantri and B Palmer 1985 Response of Upland Rice to Applied Phosshyphorus and Lime on a Iypic Paleudult unpublished
5 Hagin J 1985 Partially Acidulated Phosphate Rock A Review Iechnion Israel Institute of rTchshynology Haifa Israel June
6 Carmon S and A H Roy February 27 1985 Single-Step Acidulation and Granulation Process for Selective Acidulation of Apatite in Phosphate Rocks Patent Application Serial No 706368
7 International Fertilizer Industry Association Limited 1984 Raw Materials Committee Meeting Palm Springs September 20-21 1984 Volume III Phosphate Rock Paris France
8 Louis P L 1985 Outlook for Raw Materials Supply and Demand International Fertilizer Indusshytry Association Limited Paris France
9 The British Sulphur Corporation Limited 1985 World Statistics Fertilizer Products June 10 Kanwar J S and M S Mudahar 1983 FertilizerSulfurand FoodProductionExecutive Brief IFDC
Bulletin T-27 International Fertilizer Development Center Muscle Shoals Alabama 35662 11 Solutions 24(6) NovemberDecember 1980 Tracking Down Sulfur Deficiencies-A Tricky Business 12 The Association of Official Analytical Chemists (AOAC) 1984 Official Methods of Analysis Method
2044-2047 13 Official Journal of the European Communities 1977 Vol 20 No L213 Method 313 14 Official Journal of the European Communities 1977 Vol 20 No L213 Method 312 15 Hill W L and K C Beeson 1936 JournalAssociation Official AgriculturalChemists 19328-338 16 Tnnessee Valley Authority 1972 A Revised Laboratory Reactivity Scale for Evaluating Phosphate
Rocks for Direct Application Bulletin Y-43 Muscle Shoals Alabama 35660 17 McClellan G H and FJ Klem 1977 Phosphate Rock Characterization IN FAIIFDC Fertiliser
Seminar 1977 Trends in Consumption and Production Proceedings Tch 112 pp 1-18 18 US Department of Agriculture and Tnnessee Valley Authority 1964 Superphosphate Its Histoshy
ry Chemistry and Manufacture US Government Printing Office Washington DC 20402 19 Sauchelli Vincent tEd) 1960 Chemisiryand Technology ofFertilizersReinhold Publishing Corporashy
tion New York New York 20 International Fertilizer Development Center 1985 IFDC Industry Survey unpublished 21 Associacao Nacional Para Difusao de Adubos e Corretivos Agricolas (ANDA) 1984 Unpublished
data Sao Paulo SP Brazil 22 Green Markets 1984 McGraw-Hill Volume 8 Number 36 September 10 23 Fassbender H W and Y K Igue 1967 Comparacion de Metodos Radiometricos y Colorimetricos
en Estudios Sobre Retencion y Transformacion de Fosfatos en Suelo 7hrialba 17284-287
27
Appendix A
Premises and Assumptions and Related Data Used for Investment and Production Cost Estimates
1 Investment cost estimates are based on mid-1985 costs in a developing country where these costs are similar to those of a US Gulf Coast plant location
2 The investment cost estimates do not include al-lowances for land infrastructure and facilities locat-ed outside the plant site boundary
3 The SAB-PAPR and SSP process plant battery limits are defined to include the process plant building and related facilities beginning with the raw material feed system and ending with the conveyor belt used to transfer the product to the bulk storage andor bag-ging facilities
4 The auxiliary and support facilities include storage and handling facilities for raw materials in-process curing bulk and bagged products utility facilities (in-cluding steam electricity and water supply) and general service facilities (including site development laboratory maintenance facilities and administration buildings)
5 The investment cost estimates do not include al-lowances for escalation during construction
6 Engineering and supervision are equivalent to 15 of total direct plant cost
7 Construction overhead and expenses are equivalent to 10 of total direct plant cost
8 Contractors fee is equivalent to 10 of Ical direct plant cost
9 The cost of spare parts is based on 6 of the direct plant cost for process units and utility facilities
10 Preoperational and startup expenses are based on 9 of the direct plant cost for process units and utility facilities
11 Project management services are based on 5 of the total plant cost
12 Contingency cost is based on 10 of total plant cost 13 Interest during construction of the SAB-PAPR and
SSP plants (Schemes II-VII) is equivalent to 13 of total fixed investment This value is calculated using a 14 annual interest rate and a 2-year period of construction with 40 of the funds disbursed dur-ing the first year and the remainder disbursed dur-ing the second year A factor of 7 is used for the phosphate rock grinding plant (Scheme I) which is based on a 14 annual interest rate and a 1-year peri-od of construction
14 Raw material and product storage capacities and unit costs are based on 100 capacity utilization
Phosphate rock (coarse concentrate)-25 months outdoor storage (cost included in general service facilities)
Sulfur-25 months outdoor storage (cost included in general service facilities)
Sulfuric acid (Scheme VII only)-25 months storage (US $240mt)
Bulk product- month indoor storage for granular products 2 months for ROP products to allow for curing (US $50mt)
Bagged finished product-15 days indoor storage (US $80mt)
15 Delivered raw material and utility prices are assumed as follows
Phosphate rock (coarse concentrate 30 P20 5 ) US $mt 2500
Sulfur US $mt 20000 Sulfuric acid US $mt H 2SO 4 17000 Electricity US $kWh 010 Natural gas US $million kcal 1600 Fuel oil US $mt (96 million kcalmt) 35000 Diesel oil US $mt (10 million kcallmt) 40000 Water US Sn5 or mt 050 Bags US Sbag (50-kg) 060
16 Personnel costs (operating labor and supervision) are based on typical staffing and costs in developing countries (Table A-3)
17 Administrative and general overhead expenses are equivalent to 100 of operating labor and supervishysion costs
18 Annual costs for maintenance materials labor and contract services are based on 5 of the total plant cost
19 Annual costs for insurance and taxes are based on 1 of the total plant cost
20 Annual interest on working capital is based on 14 of the working capital
21 Working capital estimates include allowances for the following
50-day inventory of raw materials at delivered cost 20-day inventory of bulk product (40 days for ROP
products) and 10-day inventory of bagged product at total production cost
Cash is equivalent to 30 days of conversion cost 22 Fixed-capital recovery is equivalent to 163 of the
total fixed investment This capital recovery factor corresponds to an annual interest rate of 14 and a 15-year amortization period (plant life) The capital recovery factor (163) covers depreciation and inshyterest (or return on investment)
23 The production cost estimates are based on a capacshyity utilization of 100 with the annual capacity ratshying corresponding to 330 days operation at the daily rated capacity
28
Appendix Table A-1 Estimated Cost of Major Process Equipment Items-SSP and SAB-PAPR Processing Schemesa
Scheme III Scheme V (ROP SSP Scheme IV (ROP SAB-PAPR
Scheme II Followed by (ROP Followed by (ROP SSP) Granulation) SAB-PAPR) Granulation)
Plant capacity mtpd 315 315 270 270 Equipment Item (US $ x 1000) Primary lump breaker 8 b 8 Raw material bucket elevator 24 46 b 24 4 6b Raw material surge hopper and feed
system including dust collector 35 70 b 35 55 b Acid surge tank 12 12 12 12 Pug mill mixer 30 30 25 25 Belt-type curing len 74 74 74 74Rotary drum granulator 180 160 Rotary dryer with combustion system 420c
4 20c Screen feed bucket elevator 40 35 Oversize and product screens 55 50 Oversize crushers 15 10 Fluid bed-type product cooler 100 100 Cyclone-type dust collectors 120 120Dust and fluorine scrubber 35 85 25 75 Exhaust fans 30 80 30 75 In-process conveyors 60 100 60 80 ROP product reclaiming and millshy
ing system including dust collector 70 70 55 55
Total Process Equipment Cost 370 1510 340 1400
a Includes deliveryb Includes two systems one for phosphate rock and one for reclaimed ROP SSP or SAB-PAPR c- Dryer for Scheme III and Scheme V is 2 m in diameter and 12 m long dryer for Scheme VI and Scheme VII is 37 m in diameter and 185 m long
Appendix Table A-2 Direct Plant Cost Data for SSP and SAB-PAPR Processing Units
Scheme III Scheme V Scheme VI
Scheme II (ROP SSP)
(ROP SSP Followed by Granulation)
Scheme IV (ROP
SAB-PAPR)
(ROP SAB-PAPR Followed by Granulation)
(Single-Step Granular
SAB-PAPR)
Process equiprienta Equipmeri ix alltdonb
370 150
1510 620
340 135
(US $ x 1000) 1400
560 1700
680 Chutes ducts av piping Instrumentation
40 20
150 80
35 20
140 70
170 90
Electrical Process plant building b 60
150 230 620
50 140
210 560
250680
Totul Direct Plant Cost 790 1210 720 2940 3570
a Refer to Appendix Table A-1 b Based on vendor and IFDC cost-estimating data for similar process units
Scheme VI or VII (Single-Step
Granular SAB-PAPR)
270
24
35 12
200 700 c
44 60 20
100 180 100 125 100
1700
Scheme VII (Single-Step
Granular SAB-PAPR Using Purchased Acid)
1700 680 170 90
250680
3570
29
Appendix Table A-3 Estimated Workforce Requirements and Labor Costs for Various SAB-PAPR and SSP Processing Schemes
Scheme I Scheme III Scheme V Scheme VI Scheme VII
Position Annual Salary a
(Ground Phosphate
Rock) Scheme II (ROP SSP)
(ROP SSP Followed by Granulation)
Scheme IV (MOP
SAB-PAPI)
(ROP SAB-PAPR Followed by Granulation)
(Single-Step Granular
SAB-PAPR)
(Single-Step Granular SAB-PAPR
Using Purchased Acid)
(US S) (number required) ---
Superintendent Shift supervisor Foreman ()trator lAIhortvr
15000 10000 5000 3000 1000
1 4
12 8
1 4 8
28 28
1 4 8
44 28
1 4 8
28 25
1 4 8
44 25
1 4 8
36 25
1 4 4
24 15
Total 29 69 R5 66 82 74 48 tal Annual Cost US S x 1000 119 207 255 204 252 228 162
a Estimatd based on typical employee salaries and benefits in developing countries
30

Library of Congress Cataloging In Publication Data
Sulfuric acid based partially acidulated phosphate rockshyits production cost and use
(Technical bulletin T-31) Prepared by James J Schultz and others Bibliography p 1 Superphosphates I Schultz James J
1936- IIInternational Fertilizer Development Center ill Series Technical bulletin (International Fertilizer Development Center) T31 TP9634$9S85 1986 668625 86-93 ISBN 0-88090-056-3
International Fertilizer Development Center PO Box 2040 Muscle Shoals Alabama 35662
Phone No 205-381-6600 TWX-810-731-3970 IFDEC MCHL
Edited by E D Frederick and E N Roth Cover Design and Layout by T L McGee Internal Illustrations by F Rudolph
IFDC publications are listed in Publications of the International Fertilizer Development Center General Publication IFDC-G-1 which is available free of charge
Abstract
Phosphate deposits are located in many tropical coun- imported sulfur or sulfuric acid because less acid is used tries Many of these deposits have had little commercial and a significant saving in foreign exchange can besignificance in the past because they were either too low realized in grade too unreactive or associated with excessive The process technology production cost estimates and quantities of unwanted impurities One means of utiliz- agronomic performance of a number of sulfuric acid-baseding these indigenous phosphates to the benefit of coun- PAPR (SAB-PAPR) products described in this bulletintries having such deposits is to increase the often compare favorably with those of conventional supershyplant-available phosphate by chemical conversion to a par- ihusphate fertilizers tially acidulated phosphate rock (PAPR) product The par- The factory-gate cost of P20 obtained from SAB-PAPRtial acidulation concepL indicating the use of Jess acid is estimated at about 80 of that obtained from singlethan that needed to convert the rock to superphosphate superphosphate Likewise the agronomic performance ofoften makes it possible to process problem ores into use- the SAB-PAPR products is comparable to that of convenshyful fertilizer products when the use of conventional tional superphosphate under the appropriate conditionsprocessing methods is not feasible The PAPR products (acidic soils with high phesphorus-fixation capacities) may be especially attractive to producers who rely upon
Table of Contents
Page
Introduction 1
brm inology Fully Acidulated Phosphate Rock 1 Partially Acidulated Phosphate Rock 2 Available Phosphate 2 Unavailable Phosphate 2 Free Acid 2 Rock Reactivity 4 Degree of Acidulaton 4 Acidulation Efficiency 4
Status of Technology of SSP and SAB-PA PR 5
PA PR Production Processes 5 Run-of-Pile SAB-PA PR 6 Granular SAB-PA PR 7
Laboratory- and Pilot Plant-Scale T st Results 8 Phosphate Rock Composition 8 Effect of Process Variables 9 Product Physical Properties 13
Com m ercial-Scale Practices and Potential 14 Europe 14 Latin A merica 14 Africa and A sia 14
Production Econom ics 14 Basic Premises and A ssumptions 15 Investment and Production Cost Estimates 15 Factors Affecting SA B-PAPR Production Costs 20
Agronomic Perform ance 23
References27
APPENDIX A
List of rhbles 1 Factors for Estimating Quantity of Sulfuric Acid Requirpd to Fully Acidulate Phosphate Rock 2 Chemical Composition and Relative Reactivity of Phosphate Rocks Evaluated in Laboratory- or Pilot
Plant-Scale SAB-PAPR Studies 3 Typical Product Characteristics- Granular SAB-PAPR 4 Particle Size and Surface Area Data for Slected Phosphate Rocks Used in SAB-PAPR Studies 5 Physical Properties of Selected Granular and Run-of-Pile SAB-PAPR Products 6 Maximum Degree of Acidulation Predicted for Various Phosphate Rocks-Run-of-Pile and Single-Step
Granular SAB-PAPR Processes 7 Pilot Plant-Scale Operating Data-Run-of-Pi and Granular SAB-PAPR 8 Effect of Curing (Aging) on P20 5 Solubility-Granular SAB-PAPR Products Made by IFDC 9 Process Schemes and Capacities Used for Comparing Economics of SAB-PAPR Processing Alternatives
10 Summary of Investment and Production Cost Estimates Used for Comparing SAB-PAPR Processing Alternatives
11 Total Capital Investment Estimates Used for Comparing SAB-PAPR Processing Alternatives 12 Production Cost Estimate-Scheme I Ground Phosphate Rock 13 Production Cost Estimate-Scheme K Run-of-Pile Single Superphosphate14 Production Cost Estimate--Scheme III Run-of-Pile Single Superphosphate Followed by Granulation 15 Production Cost Estimate-Scheme IV Run-of-Pile SAB-PAPR 16 Production Cost Estimate-Scheme V Run-of-Pile SAB-PAPR Followed by Granulation 17 Production Cost Estimate-Scheme VI Single-Step Granulcr SAB-PAPR 18 Production Cost Estimate-Scheme VII Single-Step Granular SAB-PAPR Using Purchased Sulfuric
Acid 19 Influence of Soil Characteristics on Agronomic Effectiveness of Phosphate Rock and SAB-PAPR
List of Figures 1 Relative Prcduction Cost of SAB-PAPR Compared With Alternative Phosphate Products 2 Theoretical Effect of Degree of Acidulation on Water-Soluble P20 5 in Acidulated Phosphate Rock 3 Run-of-Pile SAB-PAPR Process 4 Single-Step Granular SAB-PAPR Process 5 IFDC Laboratory-Scale Granular SAB-PAPR Production Unit 6 IFDC Pilot Plant-Scale Granular SAB-PAPR Production Unit 7 Efifect of Retention Time (Production Rate) on Plant Operation and Product Quality-Single-Step
Granular SAB-PAPR Process 8 Effect of Fixed Capital Investment on Production Cost-Single-Step Granular SAB-PAPR Process
(Scheme VI) Compared With Granular SSP (Scheme III)9 Effect of Capacity Utilization on Production Cost-Single-Step Granular SAB-PAPR Process (Scheme
VI) Compared With Granular SSP (Scheme III) 10 Effect of Degree of Acidulation on Production Cost-Single-Step Granular SAB-PAPR Process (Scheme
VI) 11 Effect of Cost of Sulfur on Production Cost-Single-Step Granular SAB-PAPR Process (Scheme VI)
Compared With Granular SSP (Scheme III) 12 Effect of Cost of Unground P1sphate Rock on Production Cost--Single-Step Granular SAB-PAPR
Process (Scheme VI) Compared With Granular SSP (Scheme III)13 Effect of Cost of Sulfuric Acid on Production Cost-Single-Step Granular SAB-PAPR Process Using
Purchased Sulfuric Acid (Scheme VII) 14 Effect of Phosphorus and Sul11r on Yield of Maize-Subhumid Africa 15 Effect of Phosphorus Source on Yield of Potatoes-Ecuador 16 Effect of Phosphorus Source on Yield of Two Crops of Beans-Colombia 17 Effect of Phosphorus Source on Yield of Intercropped Maize and Beans-Colombia 18 Effect of Phosphorus Source on Yield of Maize-Humid Africa 19 Effect of Phosphorus Source on Yield of Maize-Semiarid Africa 20 Effect of Phosphorus Source on Yield of Rainfed Upland Rice-Colombia
I
Summary
In conventional superphosphate products-single super- 35 phosphate (SSP) and triple superphosphate (TSP)-usually more than 90 of the total phosphate (P 20 5 ) is in a form available to plants ie soluble in a neutral am-monium citrate (NAC) solution Most of the available P205
is also soluble in water The superphosphate-type products described in this
bulletin contain lesser amounts of available P 205 because only a portion (usually about 30-50) of the sulfuric acid required to fully acidulate the phosphate rock to conventional SSF is used
Agronomic research and demonstration performed by the International Fertilizer Development Center (IFDC) and others in several developing countries show that
PAPR is usually as effective as highly soluble phosphate fertilizers on many tropical and subtropical soils (1 2 3 4 5) With sulfur-deficient soils the agronomic response to SAB-PAPR substantially exceeded that to sulfur-free fertilizers such as TSP
The production of SAB-PAPB is relatively simple the r-ethod used is basically the same as that for SSP produc-tion The SAB-PAPR can be produced as a powdered or semigranular run-of-pile (ROP) material or it can be granulated A completely granular product can be made by granulating ROP material in a separate processing step or it can be made directly by using a single-step acid-ulationgranulation process developed by IFDC (6)
Production cost estimates indicate that the SAB-PAPR products are less expensive to produce than convention-al SSP when evaluated according to the assumptions used in this bulletin In all cases the saving in cost is attri-buted primarily to the use of less sulfuric acid A rank-ing of the production cost of SAB-PAPR relative to ground phosphate rock and SSP is shown in Figure 1
These estimates and indicated saving for SAB-PAPR compared with SSP are based on the assumptions described in this bulletin The actual cost of production must be determined on a case-by-case basis after consi-dering the site-specific cost and operating factors
Compared with SSP the SAB-PAPR products are more concentrated with respect to total P2 0 5 thus leading to some savings in the cost of physical distribution of the P 20s nutrient to the farm level However when compared
T- Production Cost for a 30 Ground Phosphate Rock0 IsUS $2011mt P205
sU25 2
o 20 1
_ cc cc
_- Ira W W C a
001 m
- 1 1
-
_ 1 -
Product
Figure 1 Relative Productin Cost of SAB-PAPR Compared With Alternative Phosphate Products
with a more concentrated phosphate fertilizer such as TSP the cost of physical distribution per unit of nutrient will be higher even if allowance is made for the sulfur nutrient in the SAB PAPR product The comparison beshytween the production and distribution cost of SAB-PAPR and that of alternative sulfur-free phosphate fertilizers is not included in this bulletin
The use of SAB-PAPR production technology may make it possible to process phosphate rocks that are not suitable for producing SSP Some phosphate rocks are either too unreactive or contain too many impurities for conventional processing The ability of SAB-PAPR techshynology to cope with many types of phosphate rocks may make it possible to use indigenous materials in a numshyber of developing countries
Although commercial production of SAB-PAPR began at least 55 years ago in Europe its widespread replaceshyment of conventional phosphate fertilizers is unlikely In the developing world government incentives designed to increase the use of indigenous phosphate resources and decrease the use of imported fertilizers will probably be needed in many cases to fully exploit the advantages of this technology
Introduction
The element phosphorus was discovered by the German physician and alchemist Henning Brandt in the 17th cen-tury Its subsequent extraction from urine and bones in the 18th century and from the earths crust in the 19th centu-ry paved the way for the development of the phosphate fer-tilizer industry as we know it today By the middle of the 19th century the agronomic usefulness of phosphorus was established and the world production of phosphate rock grew from about 5000 mt in 1850 to about 135 million mt in 1984 (7) An annual production of phosphate rock in the order of 200 million mt is projected for 1990 (8)
The chemistry of the phosphate fertilizer industry has changed little during the past century-sulfuric acid re-mains a major industrial ingredient for solubilizing the phosphate and making it more available as a fertilizer Sin-gle superphosphate (SSP) is a product made from a mix-ture of phosphate rock and sulfuric acid Usually it contains about 16-22 P205 and it has been the basic phosphate fertilizer for more than 100 years Acidulation of phosphate rock with phosphoric acid to produce triple superphosphate (TSP) usually containing 45-48 P20 5 was first begun about 1870 but did not become popular until about 1950 The rapid growth in phosphoric acid production during the past 30 years has resulted largely in replacement of SSP with TSP and ammonium phosphate principally diammo-nium phosphate (DAP) usually containing 18 nitrogen and 46 P20 5
Phosphoric acid-based technology further intensified the dependency of the phosphate industry on sulfuric acid For example 1 mt of soluble P205 in the form of SSP requires approximately 18 mt of sulfuric acid whereas 1 mL of solu-ble P20 5 in the form of TSP and DAP requires about 20 and 28 mt of sulfuric acid respectively
Temperate zone agriculture is typified by relatively coel climates moderate rainfall short growing seasons a wide range of soil properties and intensive farming practices which have created the need for highly soluble and concen-trated fertilizers This explains the current position of the phosphate fertilizer industry World phosphate consump-
tion in the 198384 fertilizer year amounted to approximateshyly 33 million mt of P20 5Of this amount of P20s about 38 was contained in multinutrient (compound) fertilizers 33 in superphosphates 22 in ammonium phosphates 4 in the form of phosphate rock for direct application and 3 in miscellaneous phosphate materials including thermally altered phosphates and basic slag (9)
In many tropical and subtropical locations phosphate fershytilizers with less water solubility are desirable for a numshyber of agronomic and economic reasons Furthermore the agronomic value of both SSP and sulfuric acid-based parshytially acidulated phosphate rock (SAB-PAPR) is usually enshyhanced by the presence of the secondary elements calcium and sulfur Sulfur deficiencies are becoming apparent in phosphorus-deficient tropical regions because of the wideshyspread use of sulfur-free fertilizers such as TSP and DAP (10) It has been suggested that a P20s-to-S ratio of 31 will give maximum efficiency of phosphorus (11) SAB-PAPRshy50 (50 acidulated) supplies approximately this ratio whereas SSP supplies about twice the suggested amuunt of sulfur Thus some value should be assigned to the sulshyfur in SAB-PAPR because it is an essential element that is often deficient
The apparent usefulness of less soluble forms of phosshyphate containing an appropriate amount of sulfur (especialshyly on acidic tropical soils) together with the objective of developing suitable methods for processing a variety of inshydigenous phosphate rock materials occurring in the developshying countries provided the basis for IFDCs interest in further development of partial acidulation technology The data described in this bulletin were developed over a perishyod of several years of laboratory- and pilot plant-scale testshying if a large number of phosphate rock- Concurrent with the technical studies comparative agronomic evaluations of a majority of the products were performed in greenshyhouses research stations and farmers fields The technishycal economic and agronomic advantages and limitations of the SAB-PAPR family of phosphate products identified as a result of these studies are discussed in the bulletin
Terminology
Th facilitate a uniform interpretation of the PAPR process usually fluorapatite to the water-soluble form-monoshytechnology and economics described in this bulletin the fol- calcium phosphate nmonohydrate (MCP) Determination of lowing terms are defined the precise amount of acid required to My acidulate a phosshy
phate rock is difficult because of the influence of variable qiantities of acid-producing and acid-consuming con3ti-
Fully Acidulated Phosphate Rock tuents in the rock In practice a reasonable estirmte of the stoichiometric amount of acid required can be made by mul-
This term describes a phosphate rock that has been treat- tiplying the level of certain consttuents in the rock by posishyed with the theoretical (stoichiometric) quantity of acid re- tive and negative factors (Tble 1) These factors describe quired to fully convert the insoluble pLosphate mineral the theoretical amount of acid required to convert each
Tbble 1 Factors for Estimating Quantity of Sulfuric Acid Required to Fully Acidulate Phosphate Rocka
Phosphate Acidulation Rock Component Factor
MgO 2433 CaO 1749 NaO 1582 KO 1041 AI20 0962 Fe203 0614 F (-)1650 SO (-)1225 PO5 (-W0691
a T estimate kilograms of sulfuric acid (100 basis) required to fully Pcidulate 100 kg of phosphate rock multiply weight-percent of each component by appropriate acidulation factor and total
major constituent of the phosphate rock into the acidula-maoronsttucts no fod po iespe rk mttcases acidtion products normally found mn SSP In most cae cd
consumption data reported by commercial phosphate fertili-zer producers agree closely with these estimates although many producers may use slightly more acid than indicated (usually 5-10) to compensatefor normal process ineffi-
ciencies and to ensure optimum conversion of the phosphate to the phosphate to havailable form
The term PAPR refers to a phosphate rock that has been
treated with only a portion of the acid required to fully conshy
vert the insoluble tricalcium phosphate to the watersoluble form (MCP)
It is recognized that various acids (sulfuric phosphoric nitric hydrochloric or a combination of these) can be used to acidulate most phosphate rocks although for economic reasons sulfuric acid is usually the preferred choice for producing PAPR The quantity of acid used can be varied depending upon the characteristics of the phosphate rock and the desired quality of the final product (discussed later)
To facilitate a uniform identification of PAPH products the fclowing nomenclature is used to describe the raw material and composition of the products discussed in this bulletin-for example SAB-PAPR-50
SAB-Denotes sulfuric acid-based PAPR-Indicates that the material is a partially acidu-
lated phosphate rock product instead of a fully acidulated product such as SSP
50-Indicates the degree of acidulation (expressed as a percentage) relative to a fully acidulated SSP product As previously indicated the amount of acid required to fully acidulate a phosphate rock varies quite widely depending upon the characteristics of the phosphate rock Therefore the amount of acid required to obtain a certain degree of acidulation also varies with the composition of the phos-phate rock
Although only SAB-PAPR products are described in this bulletin it is evident that a uniform and systematic nomenshyclature for PAPR products is helpful in facilitating cornshy
minication It is unlikely that the nutrient content of the PAPR products can be universally incorporated into the nomenclature because of the large variability in the comshyposition of the candidate rocks and possible levels of acidshyulation therefore the nutrient content of the products
described in this bulletin is specified separately
Available Phosphate
Available phosphate as used in this bulletin is defined as the phosphate (normally expressed as P20 5 ) that is solushyble in a neutral ammonium citrate solution This includes
the water-soluble fraction when the sample is processed and analyzed in accordance with procedures established by the Association of Official Analytical Chemists (AOAC) (12) Inthis procedure the water-soluble PO5 fraction is determined first and the NAG-soluble P 250fraction is determined on the remaining non-water-soluble fraction The NAG-soluble phosphate reported in this bulletin does not include the wat-olu oetedcin this itin s nic ud
water-soluble fraction unless it is so indicated A comparison of available PO5 results obtained by the
NAC test method with those from other widely used methods-2 citric acid and 2 formic acid-is shown in Thble 2 for unacidulated rocks and in Thble 3 for a number of SAB-PAPR products (13 14) Normally the citric and forshymic acid test methods are used to measure the reactivityof phosphate rocks for direct application and are usually
not used on chemical- or water-soluble fertilizers
Unavailable Phosphate
In this bulletin phosphate that is found to be insoluble in an NAC solution is designated unavailable
Free Acid
The free acid (113PO4 expressed in P205 ) of the SAB-PAPR products described in this bulletin is determined by washing the sample with acetone to remove residual (unshyreacted) phosphoric acid (15) In superphosphate chemisshytry phosphoric acid is an intermediate product of the sulfuric acid and fluorapatite reaction The phosphoric acid continues to react with more fluorapatite to form the final SAB-PAPR product-a mixture of mono- and dicalcium phosphate calcium sulfate and unreacted fluorapatite (phosphate rock) A limitation of this determination is that any free acidity contributed by unreacted sulfuric acid is not detected However it is not likely that the PAPR products normally would contain free sulfuric acid
2
Table 2 Chemical Composition and Relative Reactivity of Phosphme Rocks Evaluated in Laboratory- or Pilot Plant-Scale SAB-PAPR Studies
PO Soluble in Total 2 Citric 2 Formic Relativoa
Phosphato Rock Source PzO NAC Acid Acid CaO FezO AIO3 MgO CO F SiOz Na2O K3O SO Reactivity
Central Florida (USA) El-llassa (Jordan) Ilahotoe (Tbgo) Huila (Colombia Kodjari (Burkina Faso) Media Luna (Colombia) Mussoorie (India)-Concentrate Mussoorie (India)-Run-of-Mine Pare IN (Niger) Pesca (Colombia) Sukulu Hills (Uganda) lhhoua (Niger) Tilemsi Valley (Mali) Utah (USA)
310 304 359 207 253 300 250 186 285 195 379 279 262 302
42 45 30 35 19 23 04 10 26 33 27 25 42 24
112 139 72 78 62
105 21 28 75
100 15 76
121 54
178 278 143 151 106 226 66 75
149 151 48
160 199 166
466 500 513 400 335 455 453 438 399 279 505 392 395 476
13 031 13 06 31 044 50 40 19 10 28
103 63 10
089 044 11 17 40 047 055 17 10 14 077 21 25 10
038 021 005 017 029 012 12 14 003 015 005 02 055 054
41 68 19 83 13 46
100 136
12 13 06 15 23 37
35 39 40 27 31 36 25 18 15 21 24 28 31 35
68 71 46
236 257 125 51
154 232 403
19 117 115 87
064 058 023 016 009 012 019 026 013 014 020 015 029 055
011 002 004 009 043 007 016 045 004 015 003 012 016 032
110 152 050 095 008 075 825 574 010 045 005 045 07 25
Medium Medium Medium Medium
Low Low Low Low Low
Medium Low Low
Medium Low
a Relative reactivity criteria NAC-soluble POs 0-29-Low
NAC-soluble PA01 30-49-Medium NAC-soluble PO 50 and above-High
Table 3 TIypical Product Characteristics-Granular SAB-PAPR
POs Soluble in
Phosphate Rock Source Degree of
Acidulation Total P20 Water NACa
2 Citric Acda
2 Formic Adda
Free Acid (POs Basis)
Free Water
() Laboratory-Scale Production
Central Florida (USA) El Hassa (Jordan)
40 15
233 280
107 38
31 48
73 115
8 192
lt01 01
10 09
Hahotoe (Tbgo) 30 25
265 287
75 49
42 38
114 100
167 138
02 03
07 11
Huila (Colombia) Kodjari (Burkina Faso)
50 50 30
251 148 205
106 61 07
25 28 52
78 58 71
103 77 73
04 01
lt01
06 05 19
Media Luna Colombia) Mussoorie (India)-Concentrate Mussoorie (India)-Run-of-Mine Parc W (Nigr)
50 50 50 35 25
186 234 203 147 243
30 101
74 36 44
48 16 26 23 34
100 68 36 42 73
98 114
69 73
108
lt01 08 03 02 01
06 21 20 20 06
Pesca (Colombia) 50 20
223 i 75
93 43
28 22
70 NA
84 NA
lt01 07
08 17
Sukulu Hills (Uganda) 40 25
162 303
57 61
36 10
69 20
86 51
01 lt01
01 04
Tahoua (Niger) 50 25
268 243
121 11
15 47
25 85
50 107
lt01 lt01
04 10
Tilemsi Valley (Mali) 50 15
230 256
25 06
46 53
78 118
98 152
02 lt01
14 20
30 227 16 66 123 146 lt01 18
Pilot Plant-Scale Production
Central Florida (USA) 30 256 54 44 113 162 03 17
Utah (USA) 50 30
219 253
96 73
42 12
90 NA
118 NA
07 02
28 09
50 225 111 18 77 119 02 13
a Does not include POs soluble in water b Not analyzed
3
Rock Reactivity
Phosphate rocks used for direct application may be classi-
The reactivity of arock refers to the ease with which the
phosphate can be converted (by chemical processing or reac-ion in the soil) into an available form The reactivity s in-
fluenced by a combination of physical and chemical characteristics unique to each rock With few exceptions those rocks that display a high level of carbonate substitu-tion within the apatite structure or have a high surface area are usually found to be the most reactive Particle size and surface area data for several phosphate rocks used in the IFDC SAB-PAPR studies are shown in Thble 4 It should be emphasized that a relatively large surface area does not always indicate a highly reactive rock For example the Kodjari (Burkina Faso) and Tilemsi Valley (Mali) phosphate rocks (Tble 4) have a high surface area (about 15 mlg and 38 m2g respectively) but they are not highly reactive In these examples most of the surface area is attributed to the clay particlps (iron and aluminum compounds) in the rocks
Table 4 Particle Size and Surface Area Data for Selected Phosphate Rocks Used in SAB-PAPR Studies
Particle Size Average Median Passing Passing Particle Particle Surface
Phosphate Rock Source 100-Mesh 200-Mesh Size Size Am
() (An) (Am) (m2g)
Central Florida (USA) 99 95 14 25 13 Huila (Colombia) 93 89 12 24 6 Kodjari (Burkina Faso) 97 80 20 42 15 Media Luna (Colombia) 92 77 12 28 6 Mussoorie (India) 92 77 14 32 2 Pesca (Colombia) 100 97 7 9 8 Tllemsi Valley (Mali) 100 96 13 6 38 Utah (USA) 91 77 28 63 3
Degree of Acidulation
Degree of acidulation expressed as a percentage refers to the amount o actually used compared with the stoi-chiometric quantity o icid required to fully acidulate a particular phosphate rock to SSP The theoretical effect of degree of acidulation (assuming pure fluorapatite) on the amount of water-soluble P205 in sulfuric and phosphoric acid-acidulated products is shown in Figure 2 These data show a linear relationship between the theoretical watershysoluble P205 and the acidulation degree for sulfuric acid acidulation and a nonlinear relationship for phosphoric acid acidulation
10 g-I Phosphoic Acid
80 Acpiuaion
0A S
30- Acldulation
j 20_
10 0__ 0 1b i[ 4o 5b 6 -h fir 90 1d
DOn=a of Acidulaion
Figure 2 Theoretical Effect of Degree of Acidulation on Water-Soluble PsO in Acidulated Phosphate Rock
Acidulation Efficiency
To facilitate a comparison between different acidulations of the same or different phosphate rocks the term acidulation efficiency is used This term describes the effectiveness of the acidulation process in converting the phosphate in the rock to water-soluble idNAC-soluble forms of P20 5 when compared with the theoretical conversion expected from the intended acidulation degree
Since the stoichiometric amount of sulfuric acid required for the total acidulation of a phosphate rock is based on the conversion of the P205 to the water-soluble form (MCP) the acidulation efficiency is calculated on the basis of the level of water-soluble P20 obtained in the product In pracshy
tice however a portion of the MCP usually reacts to form water-insoluble but NAC-soluble P20s in the product
Therefore in this bulletin acidulation efficiency is exshypressed in two ways-on the basis of water-soluble P0 5 and on the basis of available P20 5 (NAC-soluble P20 5 includingwater-soluble fraction) in the product
1 Water-soluble P20 shy
acidulation efficiency
Water-soluble P20 5 x 1 Tota x Actual degree of
product acidulation
2 Available P205 =
acidulation efficiency
NAC-soluble P205 + water-soluble P20 X100 Total P205 in x Actual degree of product acidulation
When these definitions am used the water-soluble P205 acidulation efficiency more closely describes the process pershyformance based on the intended level of acidulation and the
4
available P20s acidulation efficiency more appropriately lation efficiency the NAC-soluble P20 5 that may occur in the describes the agronomic usefulness of the product It should unacidulated rock was not considered in developing the be noted that in the calculation of the available P20 5 acidu- equation
Status of Technology of SSP and SAB-PAPR Since SSP has been produced in large quantities for about 140 years in many countries a brief review of its technology is given For a more complete review see Superphosphate Its Historn Chenistryand Manufacture (18)
In the most common practice production of SSP consisted of (1)mixing of ground phosphate rock with sulfuric acid (2)denning and (3)curing After curing by pile storage for several weeks the product was reclaimed from the pile and crushed to pass a 3-or 4-mm screen Such product is known as ROP superphosphate and may be sold as such or used as an ingredient in mixed fertilizers In the United States over 80 of the product was used to make mixed fertilizers (84 in 1951)
The major process variables in producing SSP included fineness of grinding of the rock concentration of the sul-furic acid acid-to-rock ratio and rock composition Usually the sulfuric acid was diluted to about 70 H2SO4although in some cases concentrated acid water and rock were simul-taneously added to the mixer Tlypical acid-to-rock ratios were near 06 kg of I-12S0 4 (100 basis) per kilogram of Florida rock A wide variety of mixing devices both batch and continuous have been used Their function is to mix the rock and acid quickly and thoroughly and to discharge the slurry-type mixture into the den while it is still semi-fluid
A number of den designs have also been used both batch and continuous Continuous (mechanical) dens permitted retention times of 20 minutes to 2 hours stationary (box-or pit-type) dens usually were operated at an average reten-tion time of about 1 hour The function of the den was to permit reactions to proceed to the point that the superphos-phate was firm enough to be excavated by mechanical devices and conveyed to storage but still soft enough for easy excavation (In some of the early plants the den was a brick- or stone-lined rectangular pit which was excavat-ed manually with shovels) Curing usually consisted mere-l of storage in piles for 3 weeks or more while chemical
reactions were reaching completion and the material was hardening
Optional steps in SSP production were drying granulashytion and incorporation of additives such as potash salts micronutrients or conditioners Superphosphate may be granulated either before or after curing In some cases SSP is granulated without drying and in other cases it is dried without granulation Granulation before curing followed bypartial drying (to permit curing reactions to continue) is another variation that is practiced in some plants
Partial acidulation of phosphate rock or ground bones probably is as old as superphosphate Gotthold Escher a school headmaster in Moravia who is credited by some authorities with the invention of superphosphate in 1835 suggested slighty to moisten bonemeal with a cheap and not too strong an acid (18) Some subsequent producers of superphosphate probably underacidulated bones or phosshyphate rock for various reasons-ignorance economy or a belief that high solubility of P20 5 was deleterious The first recorded systematic deliberate and overt underacidulation of phosphate rock was in Finland in the late 1920s The product was called Kotka Phosphate because it was proshyduced in the city of Kotka in Finland The process was based on the theory that a phosphate with less acid than fully acidulated superphosphate would be beneficial to acidshyic Finnish soils as well as more economical At first the product was made by underacidulating phosphate rock later it was made by mixing uracidulated rock with fully acidulated fresh superphosphate Sauchelli in his book pubshylished in 1960 states that Kotka superphosphate had been manufactured and sold for 30 years and gives a typical analshyysis of 26 total P 20j 20 P20 5 soluble in citric acid and 13-15 water-soluble P20 5 (19 Later PAPR was produced in other European countries and South Africa by various pocesses involving direct underacidulation or by mixing ground rock with fully acidulated SSP
PAPR Production Processes Mvo basic PAPIl production methods (processes) were (walu-ated by IFDC In one commercially practiced process an ROP product is made The ROP product is usually seni-granular in appearance hut still quite dusty After curing for several days this ROP material is usually granulated in a separate step to produce a straight or multinutrient (coni-pound) granular product An I 1DC-developtd process pro-duces granular PAPR by single-step acidulationgranulation (SSAG)(6) In this process a closely sized durable and non-dusty granular product resembling granular SSP TSP or
DAP is produced in a single step without curing The SSAG process was initially developed in laboratoryshy
scale batch and continuous test equipment using various phosphate rocks The laboratory-scale test results obtained at a production rate of about 25 kgh were generally conshyfirmed in pilot plant-scale tests performed at production rates of 250-750 kgh using two phosphate rock sources The ROP lrrocess was also studied in pilot plant-scale equipment at a production rate of about 200 kgh using two phosphate rocks Throughout the course of development a large
5
number of SAB-PAPR products were prepared for agronom-ic testing A description of the two basic SAB-PAPR processes evaluated in IFDC pilot plant-scale equipment follows
Run-of-Pile SAB-PAPR
This process is relatively simple with respect to machinery and equipment (Figure 3) In the process ground phosphate rock acid and water (optional) are ted continuously into a mixer This _mixer (usually a pug mill type) is designed to provide thorough mixing of the phosphate rock and acid with a minimum of retention time (typically 30-60 seconds) A relatively short retention time during the mixing step is preferred to avoid excessive agglomeration caking and other material-handling problems A certain amount of ag-glomeration (granulation) sometimes occurs in the mixer but this is incidental to the major function of the unit-to obtain thorough mixing of the phosphate rock and acid Batch-type mixing is not preferred because the acid and rock mixture tends to agglomerate and solidify too quickly to obtain good mixing and rapid discharge from the mixt
FumandDust Scrubber
Wae -]-in Phosphate Rock DustFrom~Crushincitening
kid Screen
water Trn
Ce OP P
I -CuringDen
Cu BucketElev WithLumpBeaker
C24Usg(24 Weeks)
Figure 3 Run-of-Pile SAB-PAPR Process
The phosphate rock acid and water are usually added to the mixer at the same point However depending upon the charactistics of the phosphate rock degree of acidula-tion and other process variables the points of addition for rock acid and water may be manipulated to achieve opti-mum mixing and reaction Likewise the rotational speed of the mixer shafts and the orientation of the mixing paddles may be varied to achieve the desired retention time for opti-mum mixing and reaction
In some cases adding other materials to the mixer(typi-cally potassium chloride) may be desirable to improve the acidulation process (discussed later) or to provide additional nutrients in the product Usually when potassium chloride is added it is fed directly to the mixer withcat first being premixed with the phosphate rock
In one variation of this process (batch-type denning pro-cess) simulated by FDC in the laboratory and pilot plant the material discharged from the mixer was stored for a
short time in a closed and ventilated chamber (curing den) The IFDC pilot-plant den had a capacity of about 1 mt whereas the capacity of a commercial-scale unit usually ranges from 10 to 40 mt After about 1 hour the material was excavated from the den and transferred to storage This denning process was essentially the same as that used for the previously described production of ROP SSP In some cases depending upon the characteristics of the rock and degree of acidulation it is possible to transfer the material directly from the mixer to storage without first denning If denning is required a continuous belt-type den can be used as an alternative to the previously described batch-type unit After a period of storage usually about 2 weeks the ROP material is reclaimed and crushed to pass a nominal 4-mm screen before it is bagged or otherwise prepared for shipment The particle size data for two ROP SAB-PAPRshy50 products are shown in Table 5These data indicate that the product is quite granular (about 55 retained on a 118shymm [14-mesh] screen) The semigrmular characteristic of the ROP material is attributed to the lack of sufficient lishyquid phase (acid plus water) at a 50 level of acidulation to form a slurry Instead of forming a typical SSP-type slurshyry that solidifies into a monolithic mass the PAPR product discharged from the mixer is moist and relatively granular in appearance
Dust and fumes (primarily fluorine gas) must be ventishylated from the mixer den (if used) conveyor system and
some cases the product storage area However because of the relatively low levels of acidulation and the correspondshyingly small release of fluorine it is unlikely that fumeshyscrubbing equipment normally used for the recovery of byproduct fluorine would be economical unless the recovershyed fluorine (fluosilicic acid) could be sold or used to replace a portion of the sulfuric acid fed to the process
The ROP SAB-PAPR process may be operated in a single-step or two-step mode With some phosphate rocks especially at higher levels of acidulation it may be desirable to perform the acidulation in two steps to obtain optimum conversion of the phosphate to the available form and to improve the physical properties of the product With the two-step acidulation method the phosphate rock and apshyproximately one-half of the acid required for the intended degree of acidulation are fed to the process The material is cured for several hours to several days before it is reclaimed and fed through the process a second time while the remainder of the acid is added After the second pass through the process the product is cured for an additional period (about 2 weeks) before it is bagged
The need for crushing screening and other processing of the material between the acidulation steps or of the cured SAB-PAPR product before bagging is largely depenshydent upon the character of the phosphate rock and the degree of acidulation used In general lumping and caking of the SAB-PAPR product during curing tends to increase as the degree of acidulation is increased This is especially true with the more unreactive rocks or with rocks that conshytain a low level of free carbonate
6
Table 5 Physical Properties of Selected Granular and Run-of-Pile SAB-PAPR Productsa
Particle Size Analysis Nominal Cumulative Retained on
Degree of Free Free 4- 6- 8 10- 14- 20- Crushing Abrasion Moisture Moisture Compatiblecd d CoptbePhosphate Rock Source Acidulation Moisture Acid Mesh Mesh Mesh Mesh Mesh Mesh Strength Resistance Absorption Penetration With Urea
1N () (PAt) (kg) 1Degradation) (gkcm( Basis)
Laboratory-Scale Production (Granular)
NA fCentral Florida (USA) 10 30 34 00 00 51 350 771 994 11 22 NA NA luila (Colombia) 50 05 02 00 00 110 49A 820 907 04 54 NA NA Yes
Kodjari (lurkina Faso) 15 08 09 00 02 277 917 996 999 12 27 NA NA Yes Mussoorie India)9 35 21 46 00 2A 339 726 941 980 05 27 21 0 NA Pare W (Niger) 50 06 02 00 00 102 656 940 92 08 33 NA NA Yes Pare W (Niger) 25 02 01 00 02 240 570 885 987 05 54 NA NA Yes Pesca (Colombia 40 04 06 00 00 61 398 829 944 11 22 NA NA Yes Sukulu Hills (Uganda) 50 25 10 NA NA NA NA NA NA 32 NA 11 0 No
(fresh) (fresh) (fresh) 05 01 00 20 516 896 995 999 Yes
(cured) (cured) (cured)Tilemsi Valley (Mali) 30 14 01 00 00 191 762 985 999 10 NA NA NA Yes Hahotoe (Tbgo) 50 03 01 00 00 114 669 933 994 08 NA NA NA Yes Hahotoe (Togo) 25 06 02 00 04 105 676 953 992 11 NA NA NA Yes
Pilot Plant-Scale Production (Granular)
Central Florida (USA) 50 28 07 00 110 457 755 960 988 25 13 95 0 NA Central Florida (USA) 40 16 03 00 163 676 924 996 997 30 NA 47 0 NA Central Florida (USA) 30 17 03 00 177 704 917 990 993 28 NA 51 0 NA Utah (USA) 50 13 02 00 160 527 781 966 979 21 14 18 0 Yes Utah (USA) 40 26 06 00 139 533 825 989 993 19 17 NA NA No Utah (USA) 30 09 02 00 164 560 850 984 990 17 NA 21 0 NA
Pilot Plant-Scale Production (Run-of-Pile)
Central Florida (USA) 50 11 03 57 93 258 450 579 667 02 NA NA NA NA Kodjari (Burkina Faso) 50 11 01 00 01 210 409 552 643 08 NA NA NA NA
a All tests performed on cured product (1 month or more curing) unless otherwise noted bTest performed on minus 7- plus 8-mesh particles c Rotary drumlsteel ball test method d At 30C and 80 relative humidity for 72 h a SAB-PAPRIprilled urea mixture (11) at 301C for a minimum of 72 h f Data not available g Run-of-mine phosphate rock
Granular SAB-PAPR
Granular SAB-PAPR can be produced either by granulatshying previously prepared ROP material in a separate step Scrubber using steamwater or it can he prepared directly by using the SSAG SAB-PAPR process developed by IFDC and F ive Dust shown in Figure 4 One producer in Germany also uses aWae compactiongranulation process to produce a granular proshyduct (usually containing some potassium) from an ROP Acid G screer rzatmet
Water material
In the SSAG process the phosphate rock sulfuric acid Product water and recycle material are fed continuously to a granu- i rusher Granular lator usually a rotary drum-type unit Recycle material fed Prosphate Rock Recycle
to the granulator consists of the undersize fraction (from the screening operation described later) and usually a porshytion of the product The amount of recycle material fed to Figure 4 Single-Step Granular SAII-PAPR Process the granulator may vary depending upon the type of phosshyphate rock and other operating conditions Howe-er a rate sufficient to maintain acceptable granulation Sulfuric acid equivalent to a recycit-to-product ratio of about 2 is usually and water are sprayed (through separate systems) onto the
7
rolling bed of material in the granulator to obtain the desired level of acidulation and granulation respectively The retention time in the granulator required to obtain the optimum level of reaction and granulation varies depend-ing upon the phosphate rock composition and level of acid-ulation however it is normally in the range of about 5-8 minutes
The moist plastic material from the drum granulator is discharged into a rotary drum-type cocurrent dryer The temperature of the material discharged from the dryer is maintained at the desired level by controlling the tempera-ture of the drying airA dry-type dust collector is usually
used to partially clean the air before it is discharged into a wet scrubber to remove the fluorine and fine particulate
The material from the dryer is screened to yield a product usually in the 1-to 4-mm size range Oversize material from the screening unit is routed to a crusher The material disshycharged from the crusher is recycled to the screen As previshyously mentioned the undersize material and usually a fraction of the product are returned to the granulator as recycle It is usually unnecessary to treat the product withbull a conditioner to minimize caking however the addition of a small amount of oil may be useful as a dust suppressant especially if the product is handled in bulk
Laboratory- and Pilot Plant-Scale Test Results The usefulness of SAB-PAPR production technology (ROP or granular) can usually be determined by evaluating three major factors-(1) composition of the phosphate rock and its amenability to chemical processing (2)cost of produc-tion especially with respect to the quantity of acid required to achieve an agronomically acceptable product and(3) agronomic performance of the PAPR product compared with alternative phosphate sources Several phosphate rocks were evaluated in the IFDC laboratory and pilot plant asdescribed in this bulletin to gather information on these
factors and to develop an objective criterion for determinshying on a case-by-case basis the technical and economic feasishybility of SAB-PAPR technology as a phosphate processing alternative The laboratory- and pilot plant-scale equipment used for these studies is shown in Figures 5 and 6 respectively
Phosphate Rock Composition
The chemistry of phosphate rock acidulation is complex and not always clearly understood therefore it is difficult to judge with certainty how a particular phosphate rock will
- -
Figure 5 IFDC Laboratory-Scale Granular SAB-PAPR Production Unit
-77
---
f shy- i
-I Y
Figure 6 IFDC Pilot Plant-Scale SAB-PAPR Production Unit
behave when treated with acid The chemical transformashytion of the phosphate minerals in a rock during and after initial acidulation is usually affected by competing and synshyergistic factors specific to each rock including texture surshyface area and porosity and the presence of associated compounds of calcium iron aluminum magnesium fluoshyrine and sulfur Thus acidulation chemistry is sometimes unpredictable because these associated compounds mayparticipate to some degree in the acidulation reactions and subsequent reactions that occur during product curing and storage Furthermore the influence of some of these physishycal and chemical factors can be altered by controlling critishycal process parameters including the reaction temperature profile retention time rate of reaction and level of moisture H owever since fluorapatite is usually the major constituent of phosphate rock the simplified equation for its reaction with sulfuric acid to form SSP or SAI3-PAIPl may be writshyten as follows
Cao( N)4 eF + 7y 11S0 + 3N 1i1 = (fluorapatit) Isulfuric acid) (watter)
3y Ca(lI 2PO) I1O + 7y CaS( 4 + 2y 11F + 11-y) CaoII1O 4)hFz (monocalcium phos- (calcium (hydrofluoric (fluorapatite) phate monohydrate) sulfate) acid)
8
In this equation the ter7 n y represents the degree of acidu-lation-for example 100 acidulation (production of SSP) corresponds to a y value of 10 and a y value of 05 refers to a 50 acidlated PAPR As previously stated the role of nonfluorapatite components in the phosphate rock may sig-nificantly alter the above reaction chemistry For this reason a relatively large number of phosphate rocks were studied (Table 2) to characterize the SAB-PAPR process chemistry and to develop meaningful estimates of the expected techni-cal economic and agronomic performance of a given SAB-PAPR product
An important attribute of PAPR technology is that a phosphate rock may be suitable for SAB-PAPR processing even though it is unsuitable for full acidulation to SSP The Kodjari deposit in Burkina Faso is an example of a rock well suited for SAB-PAPR processing This sedimentary-type rock is very unreactive and contains relatively high levels of silica iron and aluminum Acidulation of this rock beycnd about 50 results in a paste-like material that is very diffi-cult to handle The nonporous and therefore relatively low surface area of the apatite component of this rock makes it difficult to achieve good contact and complete reLction be-tween the phosphate mineral and the acid thus the rock is difficult to fully acidulate As previously mentioned the rel-atively high surface area of the Kodjari rock (about 15 m2g) is caused by clay minerals in the rock not by the apatite Extra fine grinding of such a rock to achieve a higher level of reactivity is not practical because it contains a large amount of abrasive silica (about 25) Also the iron and aluminum while not adversely affecting the physical prop-erties of the product tend to react slowly during curing to form insoluble phosphate compounds that have the net ef-fect of decreasing the efficiency of the acidulation reaction
Many phosphate rocks especially those that are not highshyly weathered contain high levels of calcium and magnesium carbonate High carbonate levels adversely affect SSP and SAB-PAPR production in two ways-first the carbonate preferentially reacts with the acid during acidulation inshycreasing the amount of acid required to achieve the desired level of acidulation and second the acidlcarbonate reaction releases carbon dioxide gas which usually causes undesirashyble frothing during the reaction and weakening of the granshyules if the SSAG-PAPR process is used Stepwise reaction of such high-carbonate rocks (those containing more than about 4 C02) lessens the adverse physical processing problems but it does not avoid the problem of excessive consumption of acid
The relatively unreactive rocks can usually be acidulated to a level oi only about 30-60 while still yielding a proshyduct that is sufficiently low in free acid to avoid excessive stickiness or hardening during processing and storage In most cases a higher level of acidulation can be obtained if the ROP-PAPR process is used because more time is availshyable for the acidulation reactions to reach comptetion durshying the curing step The maximum degree of acidulation that could be expected for several phosphate rocks in the SSAG and ROP PAPR processes is shown in Table 6
Effect )f Process Variables
The chemical and physical characteristics of the phosphate rock have a major influence on the performance of the SAB-PAPR process (ROP or SSAG) and the quality of the proshyduct However some process conditions (variables) also have a significant influence The most important process variashybles identified in the IFDC laboratory- and pilot plant-scale
Thble 6 Maximum Degree of Acidulation Predicted for Various Phosphate Rocks-Run-of-Pile and Single-Step Granular SAB-PAPR Processes
Rock Source
Central Florida (USA) El-Hassa (Jordan) Hahotoe (Thgo) Huila (Colombia) Kodjari (Burkina Faso) Mpdia Luna (Colombia) Mussoorie (India)-Concentrate Mussoorie (India)-Run-of-Mine Parc W (Niger) Pesca (Colombia) Sukulu Hills (Uganda) Thhoua (Niger) Tilemsi Valley (Mali) Utah (USA)
Typical Analysis Predicted Degree of Acidulation Total NAC-Soluble Relative Run-of-Pile Single-Step P2 0 5 P20 Reactivitya Process Granular Process
M( ( 310 42 Medium 100 60 304 45 Medium 100 60 359 30 Medium 100 60 207 35 Medium 100 30 253 19 Low 60 40 300 23 Low 100 70 250 04 Low 100 50 186 10 LOw 100 35 285 26 Low 100 60 195 33 Mcdium 100 30 379 27 Low 100 60 279 25 LOw 60 40 262 42 Medium 70 50 302 24 LOw 100 50
a Relative reactivity criteria NAC-soluble P20 5 0-29-Low NAC-soluble PO 30-49-Medium NAC-soluble PiOs 50 and above-High
9
studies were (1)degree of acidulation (2) concentration of in Thble 7 and the product characteristics (Thbles 3 and 5)acid (3)process tomperature profile and (4) retention time vary quite widely from one rock to another Also test re-
IFDCs laboratory- and pilot plant-scale evaluations indi- sults using the same rock may vary considerably from one cate that the chemistry of phosphate rock acidulation is not test to another as the process conditions are changedalways predictable This lack of predictability is presumed to Therefore specific test work is required to determine the be due to variations in the chemical and physical character- performance of a rock sample and to quantify the effect of istics of the rocks and the specific SAB-PAPR processing the major process variables on the quality of the final conditions (degree of acidulation temperature and reten- producttion time) The characteristics of the final product may also Although there is a significant variation in the data availshyvary as a result of curing reactions during storage For these able the general effect of the most significant process varishyreasons the laboratory- and pilot plant-scale test data shown ables can be summarized as follows
Table 7 Pilot Plant-Scale Operating Data-Run-of-Pile and Granular SAB-PAPR
Run-of-Pile Process
Phosphate Rock Source Central Florida
Burkina Faso (Kodpari)
Single-Step Granular Process Utah Central Florida
Production Rate kgh 200 200 250 234 246 256
Degree of acidulation 50 51 50 39 51 53 Acid concentration H2SO 69 69 73 92 74 95 Phosphate rock feed rate kgh 140 155 180 180 175 180 Dilute sulfuric acid feed rate kgh 62 49 71 44 71 60 Water feed rate kgh 25 19 46 47 76 70 Recycle feed rate kgh 195 216 497 490 Recycleproduct ratio kgkg 08 09 20 19 Ibmperature of recycle C 48 48 49 48 Particle size of recycle
Oversize (plus 6-mesh) 01 00 66 68 Product (minus 6- plus 14-mesh) 74 74 496 643 Fines (minus 14-mesh) 925 926 438 289
Retention time in mixer or granulator min 2 2 127 148 86 86 Moisture in mixer or granulator discharge Mixer or granulator discharge temperature degC
153 64
105 66
41 52
48 50
66 51
57 58
Dryer air discharge temperature C 76 76 75 76 Airflow through dryer (outlet conditions) mh Temperature of material discharged from dryer C
3300 68
1800 63
3100 66
3100 67
Curing time in den min 50 73 rTmperature of material removed from den C 63 77 Ibtal dust collected kgmt of product 72 28 74 52 Composition of product after 7-day curing
Ibta P20s dry basis 227 201 229 246 227 227 Water-soluble P0 5 dry basis 109 27 102 94 91 109 NAC-soluble PO dry basisa 35 46 22 23 40 33 Free acid (as P2O) dry basis 29 09 02 04 06 05 F dry basis NA NA 21 23 24 18 Ca dry basis 219 183 217 202 222 236 SO dry basis 203 139 228 226 218 253 Free H2O 79 48 12 26 25 26 Water-soluble P2O acidulation efficiency 95 27 90 99 79 90 Available POs acidulation efficiency 126 72 109 123 113 118
Composition of product after 21-day curing Ttal P20s dry basis 209 198 225 240 219 226 Water-soluble P1O dry basis NAC-soluble P2O e dry basis a
95 37
12 59
111 18
87 27
96 42
109 38
Free acid (as P2OA) dry basis 03 01 02 06 07 05 F I dry basis NA NA 22 24 25 25 Ca dry basis 219 184 237 264 216 221 SO dr basis 246 152 259 255 233 230 Free 120 11 11 13 26 28 27 Water-soluble P205 acidulation efficiency 90 12 99 93 86 91 Available 1P20 acidulation efficiency I 126 70 115 122 124 122
Crushing strengtta kggranule NA NA 23 19 23 30 a Does not include water-soluble fraction b Not available
10
Degree of Acidulation-An increase in the degree of acid-ulation usually results in a higher proportion of the availa-ble P20 5 in the product being in the water-soluble form Acidulation efficiency (Thble 7) appears to be unrelated to the degree of acidulation Acidulation efficiency apparent-ly is influenced to a greater extent by the combined effect of the phosphate rock composition reactivity and other process variables
Concetitration of Acid-The acidulation reaction is veryexotherinic (about 90 kcallkg of fluorapatite reacted with sulfuric acid) and an increase in temperature is usually ac-companied by an increase in the rate of reaction Howeverwith some phosphate rocks especially those that are less reactive a higher level of acidulation can be obtained if the temperature is decreased and the rate of reaction is slowed to minimize surface reactions and facilitate deeper penetra-tion of the acid into the phosphate rock matrix For this reason when an unreactive phosphate rock is processed im-proved results are usually obtained if the acid is diluted and cooled in a separate step before it is reacted with the rock
Laboratory-scale tests using Kodjari (Burkina Faso) phos-phate rock which is relatively unreactive and contains a high level of iron and aluminum show that a dilute acid (60-75) is more effective than a more concentrated acid in decreasing the precipitation of reaction products en the surface of the phosphate rock particles This surface precipi-tation of reaction products partially blocks or blinds the rock and leads to incomplete reaction excess free acid and a sticky unmanageable product F-irthermore the unreact-ed acid in the product tends to slowly react with the iron and aluminum impurities during storage to form a number of insoluble (unavailable) phosphate compounds When a more reactive rock (for example central Florida) was used in the pilot plant the higher acid concentration (95) result-ed in a slightly higher acidulation efficiency when meas-ured in terms of water-soluble P20However when a less reactive (Utah) rock was used a slightly higher acidulation efficie --y (water-soluble P205 basis after curing 21-days) was obtained with a dilute (73) acid
An optimum balance between the concentration of the acid the reactivity of the phosphate rock and the quantityof moisture (liquid phase) that can be tolerated must be de-termined for each phosphate rock and desired level of acid-ulation In general a sulfuric acid concentration of 60-75 is desired for acidulating the less reactive rocks and an acid concentration of 75-93 is more appropriate for the morn reactive rocks
Process Temperature Profile-As indicated from the above discussion it is difficult to separate the influence of temperature and rate of reaction when evaluating the SAB-PAPR process When a less reactive phosphate rock such as Kodjari (Burkina Faso) is processed a high temperatureduring the initial period of reaction and during subsequent drying (assuming the SSAG process) usually causes a decline in the amount of water- and NAC-soluble P20 in the finished product
Part of this adverse effect on the solubility of P205 in the
finished product is related to the previously described blindshying and to the high free acid which leads to the undesired ironaluminum reactions during curing These reactions are caused in part by the high temperature of the PAPR materishyal resulting from the combined effect of a high acid concenshytration and rate of reaction The temperature of the material that is maintained during the drying step can also adverseshyly affect the level of water-soluble P20 5 (MCP) in the finished product Laboratory-scale results indicate that the revershysion of water-soluble P 20 5 to NAC-soluble and insoluble compounds is minimized if the temperature of the material during drying does not exceed 120C 100degC being the preshyferred maximum temperature The reversion reactions were also found to be influenced by retention time during dryshying The laboratory data indicate that the retention time during drying at the 1000 -120C level should not exceed 30 minutes to ensure a minimum loss of water-soluble P20 5
Pilot-plant tests were performed at drying temperatures of 66 deg - 93degC Within this range and with a rock of medishyum reactivity (central Florida) and one of low reactivity (Utah) the amount of water-soluble P2Os in the productgenerally increased as the drying temperature was inshycreased However the maximum drying temperature that could be maintained without causing a significant decline in the level of water-soluble P205 was not determined In the design of an SAB-PAPR process for a particular rock the maximum allowable drying temperature should be detershymined and used This will ensure that the dryer (the most costly item of equipment in the process) is properly sized and that it is operated at the optimum level to obtain the required product characteristics
Retention Time-The acidulation reaction although inishytially quite rapid requires considerable time to approachcompletion For example in the production of fully acidushylated ROP SSP a reaction or curing period of 10-30 daysis usually required for optimum utilization of the acid and conversion of the phosphate to the available form In the SSAG process used to produce a 50 acidulated product in the pilot plant a minimum retention time of about 4 minutes was required for the initial rockacid reaction in the granulator when a phosphate rock of medium reactivity(central Florida) is used An additional 12 minutes was reshyquired for drying (curing) in the rotary drum-type dryerThe retention time in the process equipment (granulator and dryer) is based on the mass flow of material through the equipment Therefore the maximum production rate that can be achieved in a given plant is determined by the retenshytion time required for the particular phospbate rock after taking into account the required recycle-to-product ratio (total flow of material through the process equipment) In general for a given acidulation level the retention time reshyquired to achieve optimum operation of the plant and conshyversion of the P20 to an available form increases as the reactivity of the rock decreases A diagram of the effect of retention time in the pilot-plant granulator on the qualityof the operation and product when a rock of medium reacshytion (central Florida) was used is shown in Figure 7
11
Throughput Rate kglh However the presence of chloride may lead to increased corshyrosion of process equipment
4500 2250 1503 750 Particle Size-During the course of developing the SAB-I I I -- PAPR processing technology no tests were made specifi-
Production Rate kglh cally to evaluate the effect of the particle size of the phosshyphate rock on the performance of the process or the quality
1500 750 500 250 of the product However in several laboratory-scale tests using Hahotoe (Ibgo) and Pesca (Colombia) phosphate rocks (rocks considered low in reactivity) it was observed that relatively coarse material (65-89 passing 100-mesh and
Unacceptable Good Very Good less than 50 passing 200-mesh) was difficult to process Operation Operation Operation The 30-50 acidulated rock was extremely sticky and
could not be properly granulated or dried because of an exshycessive amount of unreacted acid When the rocks were more finely ground (at least 80 passing 200-mesh) the problems of stickiness and high levels of unreacted acid were
1 2 3 4 5 6 7 8 9 10 largely eliminated
Retention Time in Granulator minutes Furthermore in pilot plant-scale SSAG tests using the relatively unreactive Utah rock the granular product ws weak (this led to an excessively high recycle-to-product ratio)Figure 7 Effect of Rietention Time (production rate) on Plant Opera- when a relatively coarse (45 passing 200-mesh) material
tion and Product Quality-Single-Step Granular SAB-
PAPR Process was used However when the rock was more finely ground (77 passing 200-mesh) the strength of the product im-
Potassium Chloride Additive-With some relatively un- proved and operation was routine at a recycle-to-product reactive rocks the addition of a small amount of potassi- ratio of about 1 um chloride or sodium chloride (about 3-10) to the Effect of Curing-Reactions during curing (aging) of acidulation reaction usually increases its efficiency The inshycrease in efficiency is presumed to be due to the formation superphosphate-type products often affect the P solushyih of hydrochloric acid which attacks the rock more aggres- bility When ROP-SSP is produced from relatively higshysively than does straight sulfuric acid according to the fol- grade low-impurity phosphate rock curing of the moist lowing reactions material for a period of about 1-4 weeks increases the solushy
bility of the P20 5 Aging of granular SAB-PAPR products 2KCI + HS04 - made by IFDC had a variable effect on the final water- and
(potassium chloride) (sulfuric acid) NAC-soluble P20 in the products The data in Table 8 show that even though the granularKSO + 2HCI
(potassium sulfateT (hydrochloric acid) products were essentially dry a significant reversion of water-soluble P20 5 to NAC-soluble or insoluble P20 oc-
KCI + HSO - curred in those products containing a relatively large quanshy(potassium chloride) (sulfuric acid) tity of iron and aluminum impurities For example with the
Tilemsi Valley (Mali) product the water-soluble P20KHS0 4 + HOI (potassium hydrogen sulfate) (hydrochloric acid) declined about 60 and the NAC-soluble P20 5 increased
about 19 with aging Likewise th Kodjari (Burkina Faso) 14HCI + Caa(POeF + 3HO - product declined about 49 in water solubility and in
(hydrochloric acid) (fluorapatite) (water) creased about 80 in NAC-soluble P2Os In these two cases
3Ca(HZP04)H 20 + 7CaC + 21-F the available P205 (water- plus NAC-soluble fractions) (monocalcium phosphate (calcium chloride) (hydrofluoric acid) declined about 27 and 8 respectively as 9 result of
monohydrate) aging
- The products made from central Florida (USA) El-Cad 2 + llS04 (calcium chloride) (sulfuric acid) Hassa (Jordan) and Huila (Colombia) rocks were not sigshy
nificantly affected by aging presumably because of their 2HCI + CaSO4 relatively low level of iron and aluminum impurities
thydrochloric acid) (calcium sulfate) Although some samples were analyzed after 12-months
Addition of potassium chloride is particularly advanta- aging most of the reversion occurred within 2-4 weeks after geous when there is an agronomic need for potassium production
12
Thble 8 Effect of Curing (Aging) on P205 Solubility-Granular SAB-PAPR Products Made by IFDCa
Degree of P 20 5 Free Acid Free SAB-PAPR Product Acidilation Total Water-Soluble NAC-Soluble b Available (as P20) Water Fe2O3 AI20 3
() Central Florida (USA) 13 11
Fresh 50 236 112 31 143 06 18 Aged 50 234 119 38 157 08 12
EI-Hassa (Jordan) 044 021Fresh 30 261 79 31 110 15 42 Aged 30 262 75 31 106 01 07
Kodjari (Burkina Faso) 31 40 Fresh 50 180 65 30 95 NAc NAAged 50 183 33 54 87 lt01 20
Tilemsi Valley (Mal) 63 25Fresh 30 227 66 48 114 21 38 Aged 30 231 26 57 83 lt01 22
Thhoua (Niger) 103 21Aged 1 day 50 226 65 29 94 11 13 Aged I week 50 224 66 33 99 09 18 Aged I month 50 228 59 37 96 03 19 Aged 3 months 50 224 47 40 87 01 NA Aged 6 months 50 223 45 51 96 lt01 16
a Unless otherwise noted fresh samples were analyzed on day of production Aged samples were analyzed 3 weeks to 12 months following production depending upon sample b Does not include water-soluble P20 fraction c Not analyzed
Product Physical Properties prodtcts tested were fairly compatible with urea (able 5) This improved compatibility may make it possible to pre-
The granular SAB-PAPR products produced in laboratory- pare (bulk blend) multinutrient (NPK) mixtures using urea scale equipment generally exhibit less strength than those -usually the most abundant and economic source of nitroshyprepared in the pilot plant (Thble 5) The increased strength gen fertilizer The reason for the incompatibility of SABshyof the granules produced in the pilot plant (about 3 kg PAPR made from Sukula Hills (Uganda) phosphate rock is granule in the pilot plant compared with about 1 kggranule not fully understood but it is presumed to be related toin the laboratory) is attributed to the greater compaction the relatively high level of free acid and moisture in the forces that are imparted to granules in the larger size equip- freshly made product A cured sample (5 months old) of ment As previously mentioned the strength of the gran- the same product having a low level of free acid and free ules is also improved if the rock does not contain excessive water showed good compatibility with urea Also two mixshyamounts of carbonates When the carbonate level is high (in tures of urea and cured SAB-PAPR prepared from Utah excess of about 4 CO2) the granules are relatively porous phosphate rock showed differences in compatibility One and weak This can be seen by comparing products made sample containing 13 free water remained in good conshyfrom low-carbonate (central Florida) and high-carbonate dition while the other sample containing 26 free water(Huila and Mussoorie) phosphate rocks A crushing became wet and sticky after 6 days of storage at 30CThe strength of at least 2 kggranule is usually needed to avoid free acid (P20 5 basis) in both samples was low (06 or less)excessive degradation during handling and storage Conven- Although these tests are preliminary and long-term storagetional granular products such as SSP TSP and DAP usual- data with mixtures of urea and SAB-PAPR are not availashyly have crushing strengths of 2-5 kggranule depending ble it is likely that it will be feasible to mix SAB-PAPR upon the process and raw material compositions with urea and avoid unwanted reactions that cause wetting
The amount of water used during granulation also tends and caking provided the SAB-PAPR contains very low levshyto have an effect on granule strength When water evapo- els of free water and free acid rates from a granule during the drying step the structure of The 50 acidulated ROP products made from central the granule may become quite porous and this may cause Florida (USA) and Kodjari (Burkina Faso) rocks were quitethe granule to become relatively weak However in some granular After it was reclaimed from the curing pile and cases the adverse effect of high porosity may be offset by crushed (milled) to remove he large lumps about 50 of strong salt bridging on the surface of the granule caused by the material was between 4- and 14-mesh and the granulesthe migration of a salt solution from the core of the gran- were relatively hard (Table 5) In some cases such a semishyule to the surface during drying granular product may be an acceptable alternative to the
Unlike SSP and TSP most of the granular SAB-PAPR more costly granular product
13
Commercial-Scale Practices and Potential The rate of commercial utilization of SAB-PAPR technolo-gy is increasing However largely because of market prefer-ences and unattractive economics caused by the relatively small scale of operation required in many developing coun-tries this production technology is not expected to signifi-cantly replace the traditional more soluble phosphate products Some exceptions to this global prediction are described
Europe
Commercial-scale production of SAB-PAPR was begun in Finland in about 1930 and in Germany in the mid-1960s and now is established to a limited extent in those coun-tries as well as in France-a total production of about 400000 mtpy is estimated (20) The European firms pre-pare an ROP material that is subsequently granulated (after an appropriate period of curing) either alone or in combi-nation with nitrogen andor potassium salts A steamwater granulation process is most commonly used but a pressureshyroll compactiongranulation process is also used The choice of the granulation method used is more closely related to the cost of fuel and electricity than to the technical merits of either process For example if fuel (for drying with steamwater granulation) is relatively expensive comparedwith electricity (for pressure-roll compaction) compac-tiongranulation may be preferred
Latin America
Economic reasons are most often cited when explaining the recent rapid expansion of SAB-PAPR production in Brazil-nearly 200000 mt wa reportedly produced byabout 20 companies in 1983 (21) The governments man-date to maximize the utilization of indigenous phosphate resources (primarily of igneous origin) coupled with the desire to decrease acid consumption (importation of sulfur) catalyzed this rapid growth which began in about 1982
Most of the SAI3-PAIIR processing methods used in Brazil are similar to those used in Europe-an ROP materi-al is usually produced by use of a typical continuous belt-type den superphosphate process one plant however uses a single-step acidulationgranulation process similar to the SSAG process developed by IFDC After being cured (for a few days to several weeks) the ROP material is reclaimed
from storage and granulated using steam and water Th simplicity of using the existing SSP and TSP processin equipment for producing SAB-PAPR further explain Brazils rapid adoption of this technology The intermed ate and long-term agronomic and economic impact of thi shift away from the highly soluble phosphate fertilizer (SSP and TSP) must still be determined
Extensive agronomic testing of SAB-PAPR product made from a number of indigenous and imported phosphat rock sources has been under way since about 1978 in Colorr bia Favorable results (discussed later) may lead to th construction of SAB-PAPR production facilities in Color bia Unlike Brazil Colombia would most likely install neN production units because they do not have a large existinj superphosphate industry This would make it possible tA install the SAB-PAPR process that is best suited for thi specific characteristics of the indigenous phosphate rocl and the needs of the market A preference for the granulaSAB-PAPR product over the ROP variation is expected
Africa and Asia
West Africa-The potential for the adoption of SAB-PAPF technology in the interior regions of West Africa is quit( high However despite the availability of numerous in digenous phosphate deposits the relatively modest demanc for fertilizer and the small scale of ope tion consequentl3 required are expected to increase the cost of locall produced phosphate fertilizers (including SAB-PAPR) to level that is not economic
India-The situation in India is similar in many ways tc that in West Africa Certain cost reductions may be achiev able through economy of scale and improvements in the technology and the physical distribution system However it is expected that government mandates similar to those instituted in Brazil will be needed to catalyze the adop tion of this technology
Israel-Israel a longtime producer and exporter of phosshyphate fertilizers is reported to have begun commercial production of SAB-PAPR in 1984 (22) This product-along with its predecessors granular phosphate rock and TSPshyis expected to find its way into the export market prinshycipally in Europe This PAPR product is expected to replace a portion of the thermally altered phosphate fertilizers produced in Europe which require large amounts of energy
Production Economics The production econorcs including capital investment re-quirements were estimated for several phosphate process-ing schemes including ground phosphate rock (GPR) SSP
and the production capacities used for comparing the ecoshynomics of SAB-PAPR with conventional processing alternashytives are shown in Table 9
and SAB-PAPR A description of the processing schemes
14
Thble 9 Process Schemes and Capacities Used for Comparing Economics of SAB-PAPR
ScIheme I Scheme III (Ground (ROP SSP Scheme IV
Phosphate Scheme 1I Followed by (ROP Rock) (ROP SSP) Granulation) SAB-PAPR)
Processing Alternatives
Scheme V Scheme VI Scheme VII (ROP SAB-PAPR (Single-Step (Single-Step
Followed by Granular Granular SAB-PAPR Granulation) SAB-PAPR) Using Purchased Acid)
Required Production Units
Phosphate rock grinding product (30 PO( P2Os
Sulfuric acid (100 HS0)
SAB-PAPR (50 acidulation) product (22 total P20s) P20s
SSP (100 acidulation) product (19 total POJ P203
a Indicated capacities assume
(capacity mtpda)
200 200 200 200 200 200 200 60 60 60 60 60 60 60
56 b c1 12 b 1 12b 5 6b 56 b
270 270 270 270 60 60 60 60
315 315 60 60
100 utilization and negligible losses b Based on 056 mt 100 acidmt rock for 100 sulfuric acid acidulation c Purchased sulfuric acid must be equivalent to 56 mtpd of 100 acid Actual acid concentration may be as low as 75 or as high as 98 H2SO4
Basic Premises and Assumptions
These estimates are intended to describe the relative differ-ences in the fixed-capital investment and production costs for a number of phosphate fertilizer processing schemes and therefore make it possible to objectively assess the economic merits of the SAB-PAPR processing alternatives Invest-ment estimates are given for three basic SAB-PAPR pro-cessing schemes including phosphate rock grinding sulfuric acid production storage and related items A scheme assuming purchased sulfuric acid is also included In all cases a plant location in a developing country is as-sumed for estimating the required capital investment and production cost The capacity of each production unit is based on a rock-grinding capacity of 200 mtpd of a rock containing 30 P205 (60 mtpd P205 ) Other premises and assumptions used in preparing these estimates are shown in Appendix A
The cost estimates in this bulletin are presented in such a way that they can be easily adjusted to fit local conditions By using these cost estimates as a reference it is possible to make relatively accurate site-specific investment and pro-duction cost estimates after considering juch site-specific factors as (1)cost of process equipment (2) local construc-tion costs (3) cost of raw materials (4)cost of labor supervi-sion fuel and finance charges and (5)expected capacity utiliation
Investment and Production Cost Estimates
A summary of the capital investment and production cost estimates for the various processing schemes used to com-
pare the SAB-PAPR production alternatives is shown in Table 10 A detailed description of the estimates for each scheme is given in Tbles 11-18 The estimated cost of the major SSP and SAB-PAPR equipment items and the total fixed-investrient components for each processing scheme are shown in Appendix A
Investment Cost Estimates-These estimates (Thble 11) show that the SSAG process scheme using purchased sulshyfuric acid (Scheme VII) is the least costly of the SAB-PAPR processing alternatives involving granulation (about US $156 million) The ROP SAB-PAPR process followed by granulation and the SSAG process (including production of sulfuric acid) require essentially the same total capital investment (about US $189 million) while the ROP SAB-PAPR process (Scheme IV) requires the least investment (about US $134 million compared with about US $189 milshylion for the granular SAB-PAPR variation) All the schemes include rock grinding and the SSP and SAB-PAPR schemes (except Scheme VII) include the production of sulshyfuric acid The ROP SSP and the granular SSP alternatives (Schemes II and III including rock grinding) cost approxshyimately US $35 million more than the equivalent SAB-PAPR processing units This increased investment is due primarily to the cost of a larger sulfuric acid unit In all cases the cost for the battery limits process plant units for the three granular SAB-PAPR schemes is less than 25 of the total capital investment (155 189 and 230 for Scheme V VI and VII respectively)
Production Cost Estimates-Of the granular SAB-PAPR alternatives (Tiable 10) the SSAG process (Scheme VI inshycluding the production of sulfuric acid) shows the lowest production cost (about US $105mt product or about US $478mt P205)The SSAG process based on purchased sulshyfuric acid (Scheme VII) is indicated as the most costly
15
Table 10 Summary of Investment and Production Cost Estimates Used For Comparing SAB-PAPR Processing Alternatives a
Schemc I Scheme II Scheme V Scheme VI Scheme VII (Ground (ROP SSP Scheme IV (ROP SAB-PAPR (Siugle-Step (Single-Step
Phosphate Scheme II Followed by (ROP Followed by Granular Granular SAB-PAPR Rock) (ROP SSP) Granulation) SAB-PAPR Granulation) SAB-PAPR) Using Purchased Acid)
Plant capacity mtpd Product 200 315 315 270 270 270 270 P 201 60 60 60 60 60 60 60
PO content of product 30 19 19 22 22 22 22 Capital investment US $ x 1 million) --------
Fixed investment ------- -
43 144 196 116 166 172 136 Working capital 07 24 29 18 23 17 20
Total Capital Investment 50 168 225 134 189 189 156
(US $Mt)
Raw material 258
Production cost U 409 409 335 335 335 560
Variable conversion 158 182 276 178 269 241 247 Fixed conversion 187 358 476 343 476477 381
Total Production Cost
Product basis 603 949 1161 856 1081 1052 1188 POA basis 2010 4995 6111 3891 4914 4782 5400
a Values may vary slightly due to rounding when compared with detailed estimates
Table 11 Total Capital Investment Estimates Used for Comparing SAB-PAPR Processing Alternatives
Scheme I Scheme III Scheme V Scheme VI Scheme VII (Ground (ROP SSP Scheme IV (ROP SAB-PAPR (Single-Step (Single-Step
Phosphate Scheme II Followed by (ROP Followed by Granular Granular SAB-PAPR Rock) (ROP SSP Granulation) SAB-PAPR) Granulation) SAB-PAPR) Using Purchased Acid)
Plant capacity mtpd Product 200 315 315 270 270 270 270 POS 60 60 60 60 60 60 60
PO content of product llt 30 19 19 22 22 22 22 Direct plant cost ------- US $ x- I million)
Phosphate rock gfinding unit 120 120 120 120 120 120 120 Sulfuric acid unit 230230 150 150 150 SSP or SAB-PAPR unitc
079 320 072 357294 357 Raw material and product
storage yd handling facilities 075 180 180 150 150 110 145
Utility facilities e 025 100 120 080 110 110 050
General service facilities 025 060 070 050 060 060 050 Total Direct Plant Cost 245 769 1040 622 884 901 722
Other costs Engineering and supervision 037 115 156 093 133 136 108 Constructin overhead and
expenses 025 077 104 062 088 091 072 Contractors fee f 025 077 104 062 088 091 072
Subtotal 086 269 364 218 309 317 253 Total Plant Fost 331 1038 1404 840 1193 1224 975 Spare parts 009 032 047 025 040 044 032 Preoperatiqnal and startup
expenses 1 013 048 071 038 061 066 047 Project manalement services 017 052 070 042 060 061 049 Contingencies 033 104 140 084 119 122 097 Interest during construction f 028 166 225 134 192 197 156 Total Fixed Investment 430 1439 1958 1163 1665 1716 1356 Working capital f 069 236 286 180 227 174 199 Total Capital Investment 499 1675 2244 1343 1892 1890 1555
a Ibtals may vary slightly due to rounding b Based on vendor estimates and IFDC cost files c- Refer to Appendix Tbbles A-1 and A-2 d Refer to Appendix A for capacity and unit cost e Based on engineering and construction estimates for similar projects f Refer to Appendix A for cost estimating factors
16
Table 12 Production Cost Estimate-Scheme I Ground Phosphate Rock
Basis 1 Total plant cost-US S331 million 2 Total fixed investment-US $430 million 3 Working capital-US $069 million 4 Total capital investment-US S499 million 5 Annual production-66000 mt of 30 POs ground rock
Item
Raw material cost Unground rock (30- PO0
Variable-conversior costElectricity
Diesel oil Imobile equipment) Miscellaneous supplies Bags
Subtotal
Fixed-conversion cost Operating personnel
Administration and general overhead Maintenance materials and labor Insurance and taxes Fixed-capital recovery Interest on working capital
Subtotal
TOTAL PRODUCTION COSTa Product basis P2Os basis
Basis
103 mt (a US S25mt
25 kWh a US $01kWh
0092 mt US $400mt
20 bags US $06 each
Appendix Table A-3
100 personnel cost 5 of US $331 millionyear 1 of US $331 millionyear 163 of US $430 millionyear 14 of US $069 millionyear
a At 100 capacity utilization and including bagging
Cost US Simt
258
25
08 05
120
158
18
18 25
05 106
15
187
603 2010
Table 13 Production Cost Estimate-Scheme II Run-of-Pile Single Superphosphate
Basis 1 Total plant cost-US S1038 million 2 Total fixed investment-US $1439 million 3 Working capital-US S236 million 4 Total capital investment-US $1675 million 5 Annual production-103950 mt of 19 P 20s product
Item
Raw material cost Unground rock (30 P200 Sulfur
Subtotal
Variable-conversion cost Electricity Water Diesel oil (mobile equipment)
Catalyst chemicals and miscellaneoussupplies
Bags
Subtotal
Fixed-conversion cost Operating personnel
Administration and general overhead Maintenance materials and labor
Insurance and taxes Fixed-capital recovery Interest on working capital
Subtotal
TOTAL PRODUCTION COSTa Product basis P1 0s basis
Basis
066 mt US $25mt 0122 mt US $200mt
23 kWh US $01kWh 14 m US $05m0003 mt ( US $400mt
20 bags US $06 each
Appendix Table A-3
100 personnel cost 5 of US $1039 millionyear
1 of US $1038 millionyear 163 of US $1439 millionyear14 of US $236 millionyear
a At 100 capacity utilization and including bagging
Cost US $(mt
165 244
409
23 07 12
20 120
182
20
20 50
10 226 32
358
949 4995
I-
Table 14 Production Cost Estimate-Scheme III Run-of-Pile Single Superphosphate Followed by Granulation
Basis 1 Total plant cost-US S1404 million 2 Total fixed investment-US S1958 million 3 Working capital-US S286 million 4 Total capital investment-US $2244 million 5 Annual production-103950 mt of 19 P20s product
Item
Raw material cost Unground rock (30 P O) Sulfur
Subtotal
Variable-conversion cost Electricity Water Fuel oil Diesel oil (mobile equipment) Catalyst chemicals and miscellaneous
supplies Bags
Subtotal
Fixed-conversion cost Operating personnel Administration and general overhead Maintenance materials and labor Insurance and taxes Fixed-capital recovery Interest on working capital
Subtotal
TOTAL PRODUCTION COSTa Product basis POd basis
Basis
066 mt US $25mt 0122 mt US $200mt
90 kWh US $01kWh 16 m US S051m 0006 mt US $350mt 0003 mt US $400mt
20 bags US $06 each
Appendix Table A-3 100 personnel cost 5 of US $1404 millionyear 1 of US S1404 millionyear 163 of US $1958 millionyear 14 of US $286 millionyear
a At 100 capacity utilization and including bagging
Table 15 Production Cost Estimate-Scheme IV Run-of-Pile SAB-PAPR
Basis 1 Total plant cost-US S840 million 2 Total fixed investment-US $1163 million 3 Working capital-US SI80 million 4 Total capital investment-US S1343 million 5 Annual production-89100 mt of 22 PO product
Item
Raw material cost Unground rock (30 POs) Sulfur
Subtotal Variable-conversion cost
Electricity Water Diesel oil (mobile equipment) Catalyst chemicals and miscellaneous
supplies Bags
Subtotal
Fixed-conversion cost Operating personnel Administration and general overhead Maintenance materials and labor Insurance and taxes Fixed-capital recovery Interest on working capital
Subtotal
TOTAL PRODUCTION COSTa
Product basis PO basis
Basis
077 mt US $25mt 0071 mt US S200mt
27 kWh US $01kWh 08 m3 US $05m 0002 mt US $400mt
20 bags US $06 each
Appendix Table A-3 100 personnel cost 5 of US $840 millionyear 1 of US $840 millionyear 163 of US $1163 millionyear 14 of US $180 millionyear
Cost
US Smt
165 244
409
90 08 21 12
25 120
276
25 25 68 13
307 38
476
1161 6111 a At 100 capacity utilization and including bagging
Cost US Smt
193 142
335
27 04 12
15 120
178
23 23 47 09
213 28
343
856 3891
Table 16 Production Cost Estimate-Scheme V Run-of-Pile SAB-PAPR Followed by Granulation
Basis 1 Total plant cost-US $1193 million 2 Total fixed investment-US S1665 million 3 Working capital-US $227 million 4 Total capital investment-US S1892 million 5 Annual production-89100 mt of 22 POs product
Item
Raw material cost Unground rock (30 P20) Sulfur
Subtotal
Variable-conversion cost Electricity Water Fuel oil Diesel oil (mobile equipment) Catalyst chemicals and miscellaneous
supplies
Bags
Subtotal
Fixed-conversion cost Operating personnel Administration and general overhead Maintenance materials and labor Insurance and taxes Fixed-capital recovery
Interest on working capital
Subtotal
TOTAL PRODUCTION COSTa Product basis
P2 0s basis
Basis
077 mt US $25mt
0071 mt US $200mt
80 kWh US $01kWh 10 m US $05m 0009 mt US $350mt 0003 mt US $400mt
20 bags US $06 each
Appendix Table A-3 100 personnel cost 5 of US $1193 millionyear 1 of US $1193 millionyear 163 of US $1665 millionyear
14 of US $227 millionyear
a At 100 capacity utilization and including bagging
Cost US $mt
193
142
335
80 05 32 12
20
120
269
28 28 67 13
305
36
477
1081
4914
Table 17 Production Cost Estimate-Scheme VI Single-Step Granular SAB-PAPR
Basis 1 Total plant cost-US S1224 million 2 Total fixed investnent-US S1716 million 3 Working capital-US SI74 million 4 Total capital investment-US $1890 million 5 Annual production-89100 mt of 22 P20S product
Item
Raw material costUnground rock (30 POs) Sulfur
Subtotal Variable-conversion cost
Electricity Water Fuel oil Diesel oil (mobile equipment) Catalyst chemicals and miscellaneous
supplies Bags
Subtotal
Fixed-conversion cost Operating personnel Administration and general overhead Maintenance materials and labor Insurance and taxes Fixed-capital recovery Interest on working capital
Subtotal
TOTAL PRODUCTION COSTa Product basis PA0 basis
Basis Cost
US $Imt
077 mt US $25mt 0071 mt US $200mt
193 142
335
706 kWh US $01kWh 10 m US $05m 0005 mt US $350mt 0002 mt US $400mt
70 05 18 08
20 bags US $06 each 20
120
241
Appendix Table A-3 100 personnel cost 5 of US $1224 millionyear 1 of US $1224 millionyear 163 of US $1716 milhioniyear 14 of US $174 millionyear
26 26 69 14
314 27
476
1052 4782
a At 100 capacity utilization and including bagging
Table 18 Production Cost Estimate-Scheme VII Single-Step Granular SAB-PAPR Using Purchased Sulfuric Acid
Basis 1 Total plant cost-US $975 million 2 Total fixed investment-US $1356 million 3 Working capital-US $199 million 4 Total capital investment-US $1555 million 5 Annual production-89100 mt of 22 P205 product
Item
Raw material cost Unground rock (30 POs) Sulfuric acid (100 basis)
Subtotal
Variable-conversion cost Electricity Water Fuel oil Diesel oil (mobile equipment) Catalyst chemicals and miscellaneous
supplies Bags
Subtotal
Fixed-conversion cost Operating personnel Administration and general overhead Maintenance materials and labor Insurance and taxes Fixed-capital recovery Interest on working capital
Subtotal
TOTAL PRODUCTION COSTa Product basis P20 basis
a At 100 capacity utilization and including bagging
(about US $119mt product or about US $540mt P20 5) The least expensive SAB-PAPR alternative is the ROP SAB- PAPR process (Scheme IV)-about US $86mt product or about US $389mt P 20 5 For comparison the ROP and granular SSP alternatives were evaluated A production cost of about US $500mt P20 for ROP SSP and about US $61 1mt P20 for granular SS1P is indicated The major reason for the increased cost of SSP compared with SAB-PAPR is the cost of additional sulfuric acid (sulfur) Also when expressed in terms of total P20 5 the PAPR product has the added benefit of a higher P 205 content (22 P 20 5 compared with 19 for SSP)
Factors Affecting SAB-PAPR Production Costs
The cost of producing SAB-PAPR as with most other fer-tilizers is influenced by several factors A discussion of the most important factors identified as a result of these tech-nicalkeconornic studies follows
Cost Basis US $mt
077 mt US $25mt 193 0216 mt US $170mt 367
560
60 kWh US $01kWh 60 05 m US $05m 03 0013 mt US $350nt 46 0002 mt US $409mt 08
10 20 bags US $06 each 120
247
Appendix Table A-3 18 100 personnel cost 18 5 of US $975 millionyear 55 1of US $975 millionyear 11 163 of US $1356 millionyear 248 14 of US $199 millionyear 31
381
1188 5400
Effect of Fixed-Capital Investment-Except for the cost of raw materials the largest single production cost composhynent for the SAB-PAPR processing schemes described in this bulletin is fixed-capital recovery (21-30 of total production cost) This component is heavily influenced by the plant investment and the cost of money (interest or exshypected return on equity) The effect of fixed-capital investshyment on production cost (at 100 capacity utilization) including bagging for the SSAG process (Scheme VI) comshypared with granular SSP (Scheme III) is hown in Figure 8 The production of sulfuric acid is included in both schemes This figure can also be used to estimate the imshypact of plant location on production cost (location factor) by comparing the base-case fixed investment used in this bulletin with the actual investment expected in the specifshyic location
Effect of Capacity Utilization-The previout iy mentioned production costs were based on 100 capacity utilization The effect of decreasing capacity utilization of the SSAG unit (Scheme VI) and the granular SSP unit (Scheme III) below the 100 level on the expected production cost
20
Basis 100 Capacity Utilization is Equivalent Basis A50 Degree ofAcidulation Corresponds to 270 mtpd 50 acidulated SAB-PAPR and Total Productto 270 mtpd of22 PsO 315 mtpd SSP and 0071 mt Sulfurnt Product Coasts of Producing Sulfuric Acid and Bagging SulfurIsproed atUS $r imt
Are Included Cot ofProducing Sulfurickid and Boo Bagging Ae IncludeeFixed-Capital Investment-US $172 Million
SAB-PAPR (Scheme VI) US $196 Million 700Boo Granular SSP (Scheme 1II)
600700- Granular SSP P1OSBasis 600 _ (19 P2O) -P0 Basis 5II---
500 SA--PAPR(22 PjOs)
a400shy
~200shy300shy
100- Product Basis 200
Product Basis (1
100 35 45 556
0 Degree of Acidulation 10 11 14 16 18 20 2224 26 e
Fixed-Capital US $ on Production Cost-Investment million Figure 10 Effect of Degree of AcidulationSingle-Step Granular SAB-PAPR Process (Scheme VI)
Figure 8 Effect of Fixed-Capital Investment on Production CostshySingle-Step Granular SAB-PAPR Process (Scheme VI) 50 This occurs not only because more sulfuric acid is re-Compared With Granular SSP (Scheme III) quired per metric ton of product but also because the overall
production rate must be decreased below the base-case Basis 100 Capacity Utilization is Equivalent production rate of 270 mtpd of 50 acidulated product (less
to 270 mtpd 50 Acidulated SAD-PAPR and rock will be used) since the capacity of the sulfuric acid315 mtpd SSR plant cannot be significantly increased When the acidula-Costs of Prducing Sulfuric Acid and tion level is decreased below the base-case value of 50
100Bg the rock-grinding capacity becomes a limiting factor and 900 Granular SSP the production of sulfuric acid and finished product must
p90 also be decreased accordingly The result of this is a slight E decrease in production cost (compared with the base-case
700- level of 50 acidulation) because the sulfuric acid saving
800 ( )
600 -more than offsets the other cost increases due to the slight-SAB-PAPR P205 Basis ly decreased capacity utilization For example at a 30(22o P205) level of acidulation about 250 mtpd of product would be
400 produced compared with 270 mtpd at the 50 (base-case) 300- level of acidulation Also since the total P20 content of 200- the SAB-PAPR product declines as the degree of acidulashy100 ---- - - Product Basis tion is increased the cost of production when expressed
0 in terms of total P20 also increases with the degree of acidulation40 60 DO 100 120 Effect of Raw Material Cost-The impact of the cost of
Caoacity Utilization 0 sulfur and unground phosphate rock on the cost of produc-
Figure 9 Effect of Capacity Utilization on Production Cost-Single- tion of SAB-PAPR compared with granular SSP is shown Step Granular SAB-PAPR Process (Scheme VI) Compared in Figures 11 and 12 respectively The effect of using pur-With Granular SSP (Scheme III) chased sulfuric acid is shown in Figure 13 These data show
that the production cost of a SAB-PAPR processing altershyincluding the production of sulfuric acid and bagging) is nati e based on the use of purchased sulfuric acid (Schemeshown in Figure 9 A similar adverse effect on the produc- VII for example) will be affected the most by changes in tion cost would also occur with the other processing the cost of sulfur or sulfuric acid Although the cost of unshyschemes ground phosphate rock is significant with respect to produc-
Effect of Degree of Acidulation-For the example illus- tion cost its impact is less pronounced trated in Figure 10 (Scheme VI including production of sulshyfuric acid) the cost of production will increase if the acidulation level is increased above the base-case level of
21
800
Basis 50 Acidulated SAB-PAPR 0071 mt Sulfurlmt SAB-PAPR 0122 mt Sulfurlmt SSP Costs of Producing Sulfuric Acid and Bagging Are Included 800
700-
Basis 50 Acidulated SAB-PAPR Using 0216 mt Acidrt Product Production Cost Includes Bagging
P205 Basis
-E
700
600
50(22500
Granular SSP - (19 P 0 5)
SAB-PAPR P205)
P205 Oasis
F shy
0
600
500
400shy
_
400 =2 300
t
e
300
200
100-Product Basis
E2 200
100
0
Product Basis
0 100 200 300 400 500
100 140 180 220 260 300 Sulfuric Acid Price US $mt
340 380
Sulfur Price US Srnt Figure 13 Effect of Cost of Sulfuric Acid on Production Cost-
Figure 11 Effect of Cost of Sulfur on Production Cost-Single-Step
Granular SAB-PAPR Process (Scheme VI) Compared
With Granular SSP (Scheme 1i1)
Single-Step Granular SAB-PAPR Process Using Purshychased Sulfuric Acid (SchemeVII)
800
Basis 50 Acidulated SAB-PAPR 077 mt Phosphate Rockrt SAB-PAPR 066 mt Phosphate Rocklml SSP Costs ofProducing Sulfuric Acid and Bagging Are Included
700 Granular SSP s -
600- POs Basis
500 SABPAPR -
400
300shy
2 200shy
00
Product Basis
O020 30 40 50
Unground Phosphate Rock Price US $mt
Figure 12 Effect of Cost of Unground Phosphate Rock on Producshytion Cost--Single-Step Granular SAB-PAPR Process (Scheme VI) Compared With Granular SSP (Scheme III)
22
Agronomic Performance 2Phosphorus is absorbed by plants as H2PO 1- and HP04 - ure of the quantity of available phosphorus in the rock
ions present in the soil solution Without the use of (the case with most conventional chemically processed phosphorus-containing fertilizers replenishment of the phosphate fertilizers) Instead repeated NAC extractions soil solution with the phosphorus-containing ions de- of a phosphate rock sample will cause the incremental pends upon the release of phosphorus from compounds release of a portion of the phosphorus in the rock This native to the soil such as apatite iron or aluminum phos- release of phosphorus can be used to index the expected phates or phosphates combined with the clay and organic rate of rock (phosphorus) dissolution fractions of the soil The degree to which the concentra- Partially acidulated phosphate rock products such as
2tion of H 2PO 41 andor HP0 4 is altered in the soil solu- SAB-PAPR combine some of the solubility characterisshy
tion depends upon the solubility of the phosphate and tics of all the phosphate fertilizers described above Since the pH of the soil SAB-PAPR is the product of the acidulation of phosphate
Conventional types of phosphate fertilizers are gener- rock with less sulfuric acid than is required for the producshyally classified into the following three groups with respect tion of a fully acidulated material (SSP) it contains varishyto solubility able quantities of water-soluble NAC-soluble and
NAC-insoluble phosphorus depending upon the reactivi-Group 1 Those in which the phosphorus is mostly solu- ty of the phosphate rock the quantity of acid used the
ble in water (for example SSP TSP DAP and impurities in the rock and the process conditions The monoammonium phosphate [MAP)) water-soluble portion therefore provides an immediate
Group 2 Those containing phosphorus that is moderate- source of phosphorus for entry into the soil solution and ly soluble in water but highly soluble in an the unacidulated portion of the SAB-PAPR behaves in NAC solution (for example ammoniated super- a manner similar to that of the phosphate rock from phosphates and some nitrophosphate-type which it vas produced fertilizers) When MCP (the principal water-soluble phosphate com-
Group 3 Those in which the phosphorus is not readily ponent in SSP TSP and SAB-PAPR) hydrolyzes in the soluble in water but quite soluble in an NAC soil the soil near the fertilizer becomes quite acid (pH solution (for example dicalcium phosphate usually less than 2) This high acidity is transitory but thermally altered phosphates and basic slag) can cause rapid dissolution of the otherwise insoluble and
unreactive iron and aluminum compounds in the soil If Unacidulated phosphate rock falls into a fourth this occurs these solubilized compounds may react with
category in which the phosphorus is not soluble in water soluble phosphorus and render it unavailable to the crop and only sparingly soluble in an NAC solution The usually good performance of SAB-PAPR (compared
The solubility of a fertilizer directly influences the quan- with conventional sources of phosphate such as SSP and tity of plant-available phosphorus that will be released TSP) in such soils is attributed in part to the neutralizshyfrom the fertilizer at any given time after its application ing effect of the unacidulated phosphate rock contained The phosphorus in the fertilizers belonging to Group 1 in SAB-PAPR The net result is that the localized acidishycan be expected to enter into the soil solution almost im- ty caused by the hydrolysis of MCP is quickly neutralshymediately following application For those fertilizers in ized the dissolution of iron and aluminum is slowed and Group 2 30-50 of the phosphorus usually will immedi- more phosphorus is apt to remain in the soil solution for ately enter into the soil solution and the remainder will immediate use by the crop Furthermore the unreacted enter over a period of several weeks to several months phosphate rock in the SAB-PAPR also offers a residual In the case of the fertilizers in Group 3 only a small por- source of phosphorus as it gradually dissolves in the soil tion of the phosphorus will enter into the soil solution The conditions under which the SAB-PAPR would be exshyimmediately but nearly all of it will become available pected to be the most effective are summarized through the course of the growing season of the crop 1 SAB-PAPR would be expected to provide the
Since phosphate rocks contain virtually no water- maximum amount of plant-available phosphorus when soluble phosphorus and variable amounts of NAC-soluble applied to acid soils In all soils the water- and NACshyphosphorus depending upon the origin and composition soluble P20 5 portions would be immediately available of the predominant phosphorus-containing mineral they to promote rapid development of the crop but only in dissolve in acid environments at a rate related to their acid soils would the unacidulated portion of the rock NAC solubility (reactivity) Therefore untreated phos- be expected to contribute plant-available phosphorus phate rocks provide phosphorus to the soil solution in a in any significant quantity slow but continuous manner with the rate of release de- 2 Although SAB-PAPR would be expected to show high termined by the rocks reactivity (solubility) and the effectiveness when applied to acid soils with low phosshycharacteristics of the soil The phosphorus extracted from phorus-fixation capacities its efficiency relative to phosphate rock by an NAC solution is not a finite meas- more soluble phosphate fertilizers would be maximized
23
in acid soils with high phosphorus-fixation capacities (for example soils high in iron and aluminum oxides and hydroxides)
3 The increase in agronomic effectiveness of a SAB-PAPR product above that of an unacidulated phos-phate rock will often be most pronounced when the reactivity of the phosphate rock is low This is because highly reactive phosphate rocks applied to acid soils may already be very effective In those cases the minimal increase in effectiveness due to the addition-al soluble phosphorus may not justify the additional expense of partial acidulation This is illustrated in Fable 19 which shows the high effectiveness of a very reactive unacidulated phosphate rock (Sechura deposit in Peru) when compared with TSP in a greenhouse ex-periment using several Colombian soils This table also illustrates the improvement of a less reactive rock (Pesca deposit in Colombia) when it was converted to SAB-PAPR and applied to soils exhibiting relatively high pl values and phosphorus-fixation capacities
Table 19 Influence of Soil Characteristics on Agronomic Effectiveness of Phosphate Rock and SAB-PAPR
Relative
Agronomic Effectivenessc
Soil Characteristics Pesca
Available P Phosphate Rock SAB-Soil pli Native P t Fixation b Sechura Pesca PAPR
ppm) ( (7r)
Ultisols
Amazonas 155 322 202 106 87 88 Quilichao 130 108 401 102 88 8C Caucasia 485 119 304 93 37 65
Oxisols Gaviotas 425 183 335 115 74 75 Caritnagua 465 243 323 108 91 85 La Lihertad 460 235 339 107 70 80
Andepts Unidad 10 550 395 412 59 0 59 El Hefugio 530 042 721 88 16 77
a HraN I test method shy
h) Method as described by Fassbender and Igue (23) c Based on drv-miatter production of grass (Brachiaria decumbens) rela-tive to rSP
Source IFI)CCIAT collaborative research (1)
___---_
Another factor that usually enhances the agronomic performance of the SAB-lIAPR product is the relation-ship between phosphorus and sulfur In most SAB-PAPR products this relationship closely matches the cropsnutritional demand for both of these elements Sulfur deficiencies are becoming apparent in phosphorus-deficient tropical regions because of the widespread use of essentially sulfur-free phosphate fertilizers such as TSP and DAPThe SAB-PAPR product is usually an adequate source of sulfur because the quantity of sulfur required
to overcome the deficiency is generally far less than the amount of sulfur provided by a fully acidulated product(SSP) if the SSP is applied at the level required to meet the phosphorus requirement The beneficial effect of the sulfur component of SAB-PAPR was observed in a numshyber of locations One such example is illustrated in Figure 14 In this experiment performed at Ikare Nigeria the superior performance of SAB-PAPR and SSP compared with DAP and NPK (15-15-15) was attributed to the adshydition of nutrient sulfur as well as phosphorus
48 46
ssP
no 42
E_6
gt 40 - 15-1515
38
36
34 0 5 10 15 20 25 30
Total Phosphorus (P)Applied kglha
SAB-PAPR50 Togo(Africa) Rock Acid50Acldulatad Phosphate With Sulfuric 25TotalPrO
ws PO14MNACSolubla (includesPO I S7s
SSP20 ProTotal18WSP19NACSolublePoCOcludesW13PA0)
12S
SAP18Nitogen
43WSPo 45NCSolubla WSP01Pro (Iocludes Nil S
1515-15 Nitrogen15 13WSPrO151NAC-SolublsPrO lincludes WNSP01
Al I Source A Botiono etat (3)
Figure 14 Effect of Phosphorus and Sulfur on Yield of Maize-
Subhumid Africa
Extensive field investigations into the agronomic effecshytiveness of SAB-PAPR have been performed during the past 10 years under a wide range of tropical conditions in Latin America Africa and Asia These experiments have been conducted both in research experiment stations and under the constraints encountered at the farm level Iypishycal crop responses to SAB-PAPR on phosphorus-deficient acid soils are illustrated in Figures 15-20 It can be seen from these data that SAB-PAPR especially when acidushylated to a level of about 50 was found to be usually as effective as TSP or SSP over a wide range of soil and cropshyping combinations Likewise it can be observed that this high degree of effectiveness was obtained even during the first cropping period following application of SAB-PAPR fertilizer In contrast during this first cropping period the rocks from which the SAB-PAPR products were proshyduced-unacidulated rocks of low to medium reactivityshycontributed little phosphorus to the soil solution
24
8
24
TSP
SAB-PAPR- 40 SAB-PAPR -50 20-7
TSP
Phosphate Rock16
E
z 12shyw 6
Phosphate Rock U TSP48 Total P20 TSP48TotalPro 41 PSP0 cdC 41 WSPro0 Ra NAC4Soluble P20541clWdPs(Inlude
- 461oNACSoluble PO (includes WSPrO) SAB-PAPR-40 401 Acidulated Central Florida Phosphate Rock SBPAPR50 50 Acidulated Huila (Colombia) Phosphate Rock
With Sulfuric Acid Z With Sulfuric Acid 230oTotalP1O5 = 150 Total PoOs 9o0ws PrOs5 Lu a WS POs12 NACSoluble PrOs(Includes WSP0) 5- 95 NACSoluble PrOs (Includes WSPrOs)
Central Florida Phosphate Rock 900oMinus 100Mesh Huilo Phosphate Rock 90 Minus 100 Mesh 320oTotalPrO 1900Total PrOs340o NACSoluble PzOs 35NAC-Soluble Pros
0 44 8 132 176
Total Phosphorus (P)Applied kgha
0 30 60 90 Source IFDCINIAP collaborative research (1)
Figure 15 Effect of Phosphorus Source on Yield of Potatoes-Ecuador Total Phosphorus (P) Applied kgha
Source L A Leon (2)12 1TSP
Figure 17 Effect of Phosphorus Source on Yield of lntercropped Maize FirstCrop SABPAPR-50 and Beans-Colombia SSecondCrop
24
SAB-PAPR50 09-
SSP22P 08 ---TSP Z 20
- SABPAPR -50 E =E 07 18
-- -Phosphate Rock SABPAPR25506t 16-Phosphate
Phosphale Rockk w 05 6 Sp48 TotalPrO 14
04 shy 4 NAC-Souble P os (Includes WS P Os)114 41 WSP20 12 5 shy
0 SAIPAPR50 Hulls Rock 0 18 36 54 72 905aAcidulated (Colombia) PhosphateWithSlfuric Acid15 rotalPO 1 WS PO 0 licudnn Total Phosphorus (P) Applied kgha95 4NAtSoluble (IncludesP rO W S P O )T
SSP20 lotailPO 01- HuliaPhosphate 18 WS PrORock90Minus100 Mesh
19TotalPro i9NACSolublePiO(includes WS PjOsi 35 NACSoluble 500 AcidulatedTogoAficaPhosphateRockWithSulfuricAcidPrO SAORPAPR50
1 26 TotalPO0 35 70 105 140 t21 wS P2O
14tNAC PO lilnciudesSoluble WS POs)Total Phosphorus (P)Applied kgha SAB-PAPR-25 RockWiihSulfuricAcid25 AcidulaedTogoPhosphate
Source LA Leon (2) 3 TotlP1o 70WS PrO
Figure 16 Efiect of Phosphorus Source on Yield of Two Crops of tNACSiube PiO(includes WS P0) Beans-Colombia Togo Rock 90 Minus100Phosphate Mesh
36 TotalPO 3 NACSolublePO
Source A Battono et al(3)
Figure 18 Effect of Phosphorus Source on Yield of Maize-Humid
Africa
25
16 54
SAB-PAPR-30
14 S 5 TSP
12
50 SAB-PAPR-50
E 10
Phosphate Rock SAB-PAPR-15
Phosphate Rock
08 441 ISP4 TotalPro
WS_Peasi
06 46 NACSolublePrO Includes WSP0s
040
5 10 15 20
Total Phosphorus (P)Applied kglha
25
44-
42-l
40
SAIPAPR50508 AcidulatedHuila(Colombia)PhosphateRockWith Sulfuric Acid 15l Total PrO I INS PrO
95 NACSolube P2O tincludesWS Pr01
HuilaPhosphateRock900 Minus100 Mesh 19Total PrO 35 NACSotuble PO 35______ ______Plus
TSP48TotalPo 41WS PrO 46HAC-SolublePOslnclutesWS Pr0)
SSP20 TotalPrO 18 WSPrO l9a NAC-SolublePrO lIncludes WSPlot)
SAB-PAPR3030C AcidulatedTilemstValley (Mali) Phosphate RockWith Sulfuric Acid 234 TotalPO 6 WSPrO 11 NAC SoluhlePrO(includesWSPl)d
SABPAPR1515 AcidutatedTtems ValleyPhosphateRockWithSulfuricAcid 25 TotalPO 25k WSPO 75 NACSolublePlO ItncludebWSPrOd
0 10 20 30 40 50 60 o 80 90 100
Total Phosphorus (P)Applied kglha Source L A Leon (2)
Figure 20 Effect of Phosphorus Source on Yield of Rainfed Upland Rice-Colombia
Tilems0ValleyPhosphateRock90Minus200Mesh 264 TotalPrO J NACSlublePO
Source A Sationo el al (3)
Figure 19 Effect of Phosphorus Source on Yield of Maize-Semiarid Africa
26
References 1 Hammond L L and L A Le6n 1983 Agronomic Effectiveness of Natural and Altered -Phosphate
Rocks From Latin America ProceedingsThird International Congress on Phosphorus Compounds October 4-6 Brussels Belgium
2 Le6n L A 1984 On-Farm Suitability of Indigenous Phosphate Products unpublished 3 Bationo A S K Mughogho and A U Mokwunye 1985 Agronomic Evaluation of Phosphate Fershy
tilizer Alternatives in Sub-Saharan Africa Paper presented at the Symposium on the Management of Nitrogen and Phosphorus Fertilizers in Sub-Saharan Africa Lome Ibgo March 25-28
4 Sudjadi M J Prawirasumantri and B Palmer 1985 Response of Upland Rice to Applied Phosshyphorus and Lime on a Iypic Paleudult unpublished
5 Hagin J 1985 Partially Acidulated Phosphate Rock A Review Iechnion Israel Institute of rTchshynology Haifa Israel June
6 Carmon S and A H Roy February 27 1985 Single-Step Acidulation and Granulation Process for Selective Acidulation of Apatite in Phosphate Rocks Patent Application Serial No 706368
7 International Fertilizer Industry Association Limited 1984 Raw Materials Committee Meeting Palm Springs September 20-21 1984 Volume III Phosphate Rock Paris France
8 Louis P L 1985 Outlook for Raw Materials Supply and Demand International Fertilizer Indusshytry Association Limited Paris France
9 The British Sulphur Corporation Limited 1985 World Statistics Fertilizer Products June 10 Kanwar J S and M S Mudahar 1983 FertilizerSulfurand FoodProductionExecutive Brief IFDC
Bulletin T-27 International Fertilizer Development Center Muscle Shoals Alabama 35662 11 Solutions 24(6) NovemberDecember 1980 Tracking Down Sulfur Deficiencies-A Tricky Business 12 The Association of Official Analytical Chemists (AOAC) 1984 Official Methods of Analysis Method
2044-2047 13 Official Journal of the European Communities 1977 Vol 20 No L213 Method 313 14 Official Journal of the European Communities 1977 Vol 20 No L213 Method 312 15 Hill W L and K C Beeson 1936 JournalAssociation Official AgriculturalChemists 19328-338 16 Tnnessee Valley Authority 1972 A Revised Laboratory Reactivity Scale for Evaluating Phosphate
Rocks for Direct Application Bulletin Y-43 Muscle Shoals Alabama 35660 17 McClellan G H and FJ Klem 1977 Phosphate Rock Characterization IN FAIIFDC Fertiliser
Seminar 1977 Trends in Consumption and Production Proceedings Tch 112 pp 1-18 18 US Department of Agriculture and Tnnessee Valley Authority 1964 Superphosphate Its Histoshy
ry Chemistry and Manufacture US Government Printing Office Washington DC 20402 19 Sauchelli Vincent tEd) 1960 Chemisiryand Technology ofFertilizersReinhold Publishing Corporashy
tion New York New York 20 International Fertilizer Development Center 1985 IFDC Industry Survey unpublished 21 Associacao Nacional Para Difusao de Adubos e Corretivos Agricolas (ANDA) 1984 Unpublished
data Sao Paulo SP Brazil 22 Green Markets 1984 McGraw-Hill Volume 8 Number 36 September 10 23 Fassbender H W and Y K Igue 1967 Comparacion de Metodos Radiometricos y Colorimetricos
en Estudios Sobre Retencion y Transformacion de Fosfatos en Suelo 7hrialba 17284-287
27
Appendix A
Premises and Assumptions and Related Data Used for Investment and Production Cost Estimates
1 Investment cost estimates are based on mid-1985 costs in a developing country where these costs are similar to those of a US Gulf Coast plant location
2 The investment cost estimates do not include al-lowances for land infrastructure and facilities locat-ed outside the plant site boundary
3 The SAB-PAPR and SSP process plant battery limits are defined to include the process plant building and related facilities beginning with the raw material feed system and ending with the conveyor belt used to transfer the product to the bulk storage andor bag-ging facilities
4 The auxiliary and support facilities include storage and handling facilities for raw materials in-process curing bulk and bagged products utility facilities (in-cluding steam electricity and water supply) and general service facilities (including site development laboratory maintenance facilities and administration buildings)
5 The investment cost estimates do not include al-lowances for escalation during construction
6 Engineering and supervision are equivalent to 15 of total direct plant cost
7 Construction overhead and expenses are equivalent to 10 of total direct plant cost
8 Contractors fee is equivalent to 10 of Ical direct plant cost
9 The cost of spare parts is based on 6 of the direct plant cost for process units and utility facilities
10 Preoperational and startup expenses are based on 9 of the direct plant cost for process units and utility facilities
11 Project management services are based on 5 of the total plant cost
12 Contingency cost is based on 10 of total plant cost 13 Interest during construction of the SAB-PAPR and
SSP plants (Schemes II-VII) is equivalent to 13 of total fixed investment This value is calculated using a 14 annual interest rate and a 2-year period of construction with 40 of the funds disbursed dur-ing the first year and the remainder disbursed dur-ing the second year A factor of 7 is used for the phosphate rock grinding plant (Scheme I) which is based on a 14 annual interest rate and a 1-year peri-od of construction
14 Raw material and product storage capacities and unit costs are based on 100 capacity utilization
Phosphate rock (coarse concentrate)-25 months outdoor storage (cost included in general service facilities)
Sulfur-25 months outdoor storage (cost included in general service facilities)
Sulfuric acid (Scheme VII only)-25 months storage (US $240mt)
Bulk product- month indoor storage for granular products 2 months for ROP products to allow for curing (US $50mt)
Bagged finished product-15 days indoor storage (US $80mt)
15 Delivered raw material and utility prices are assumed as follows
Phosphate rock (coarse concentrate 30 P20 5 ) US $mt 2500
Sulfur US $mt 20000 Sulfuric acid US $mt H 2SO 4 17000 Electricity US $kWh 010 Natural gas US $million kcal 1600 Fuel oil US $mt (96 million kcalmt) 35000 Diesel oil US $mt (10 million kcallmt) 40000 Water US Sn5 or mt 050 Bags US Sbag (50-kg) 060
16 Personnel costs (operating labor and supervision) are based on typical staffing and costs in developing countries (Table A-3)
17 Administrative and general overhead expenses are equivalent to 100 of operating labor and supervishysion costs
18 Annual costs for maintenance materials labor and contract services are based on 5 of the total plant cost
19 Annual costs for insurance and taxes are based on 1 of the total plant cost
20 Annual interest on working capital is based on 14 of the working capital
21 Working capital estimates include allowances for the following
50-day inventory of raw materials at delivered cost 20-day inventory of bulk product (40 days for ROP
products) and 10-day inventory of bagged product at total production cost
Cash is equivalent to 30 days of conversion cost 22 Fixed-capital recovery is equivalent to 163 of the
total fixed investment This capital recovery factor corresponds to an annual interest rate of 14 and a 15-year amortization period (plant life) The capital recovery factor (163) covers depreciation and inshyterest (or return on investment)
23 The production cost estimates are based on a capacshyity utilization of 100 with the annual capacity ratshying corresponding to 330 days operation at the daily rated capacity
28
Appendix Table A-1 Estimated Cost of Major Process Equipment Items-SSP and SAB-PAPR Processing Schemesa
Scheme III Scheme V (ROP SSP Scheme IV (ROP SAB-PAPR
Scheme II Followed by (ROP Followed by (ROP SSP) Granulation) SAB-PAPR) Granulation)
Plant capacity mtpd 315 315 270 270 Equipment Item (US $ x 1000) Primary lump breaker 8 b 8 Raw material bucket elevator 24 46 b 24 4 6b Raw material surge hopper and feed
system including dust collector 35 70 b 35 55 b Acid surge tank 12 12 12 12 Pug mill mixer 30 30 25 25 Belt-type curing len 74 74 74 74Rotary drum granulator 180 160 Rotary dryer with combustion system 420c
4 20c Screen feed bucket elevator 40 35 Oversize and product screens 55 50 Oversize crushers 15 10 Fluid bed-type product cooler 100 100 Cyclone-type dust collectors 120 120Dust and fluorine scrubber 35 85 25 75 Exhaust fans 30 80 30 75 In-process conveyors 60 100 60 80 ROP product reclaiming and millshy
ing system including dust collector 70 70 55 55
Total Process Equipment Cost 370 1510 340 1400
a Includes deliveryb Includes two systems one for phosphate rock and one for reclaimed ROP SSP or SAB-PAPR c- Dryer for Scheme III and Scheme V is 2 m in diameter and 12 m long dryer for Scheme VI and Scheme VII is 37 m in diameter and 185 m long
Appendix Table A-2 Direct Plant Cost Data for SSP and SAB-PAPR Processing Units
Scheme III Scheme V Scheme VI
Scheme II (ROP SSP)
(ROP SSP Followed by Granulation)
Scheme IV (ROP
SAB-PAPR)
(ROP SAB-PAPR Followed by Granulation)
(Single-Step Granular
SAB-PAPR)
Process equiprienta Equipmeri ix alltdonb
370 150
1510 620
340 135
(US $ x 1000) 1400
560 1700
680 Chutes ducts av piping Instrumentation
40 20
150 80
35 20
140 70
170 90
Electrical Process plant building b 60
150 230 620
50 140
210 560
250680
Totul Direct Plant Cost 790 1210 720 2940 3570
a Refer to Appendix Table A-1 b Based on vendor and IFDC cost-estimating data for similar process units
Scheme VI or VII (Single-Step
Granular SAB-PAPR)
270
24
35 12
200 700 c
44 60 20
100 180 100 125 100
1700
Scheme VII (Single-Step
Granular SAB-PAPR Using Purchased Acid)
1700 680 170 90
250680
3570
29
Appendix Table A-3 Estimated Workforce Requirements and Labor Costs for Various SAB-PAPR and SSP Processing Schemes
Scheme I Scheme III Scheme V Scheme VI Scheme VII
Position Annual Salary a
(Ground Phosphate
Rock) Scheme II (ROP SSP)
(ROP SSP Followed by Granulation)
Scheme IV (MOP
SAB-PAPI)
(ROP SAB-PAPR Followed by Granulation)
(Single-Step Granular
SAB-PAPR)
(Single-Step Granular SAB-PAPR
Using Purchased Acid)
(US S) (number required) ---
Superintendent Shift supervisor Foreman ()trator lAIhortvr
15000 10000 5000 3000 1000
1 4
12 8
1 4 8
28 28
1 4 8
44 28
1 4 8
28 25
1 4 8
44 25
1 4 8
36 25
1 4 4
24 15
Total 29 69 R5 66 82 74 48 tal Annual Cost US S x 1000 119 207 255 204 252 228 162
a Estimatd based on typical employee salaries and benefits in developing countries
30
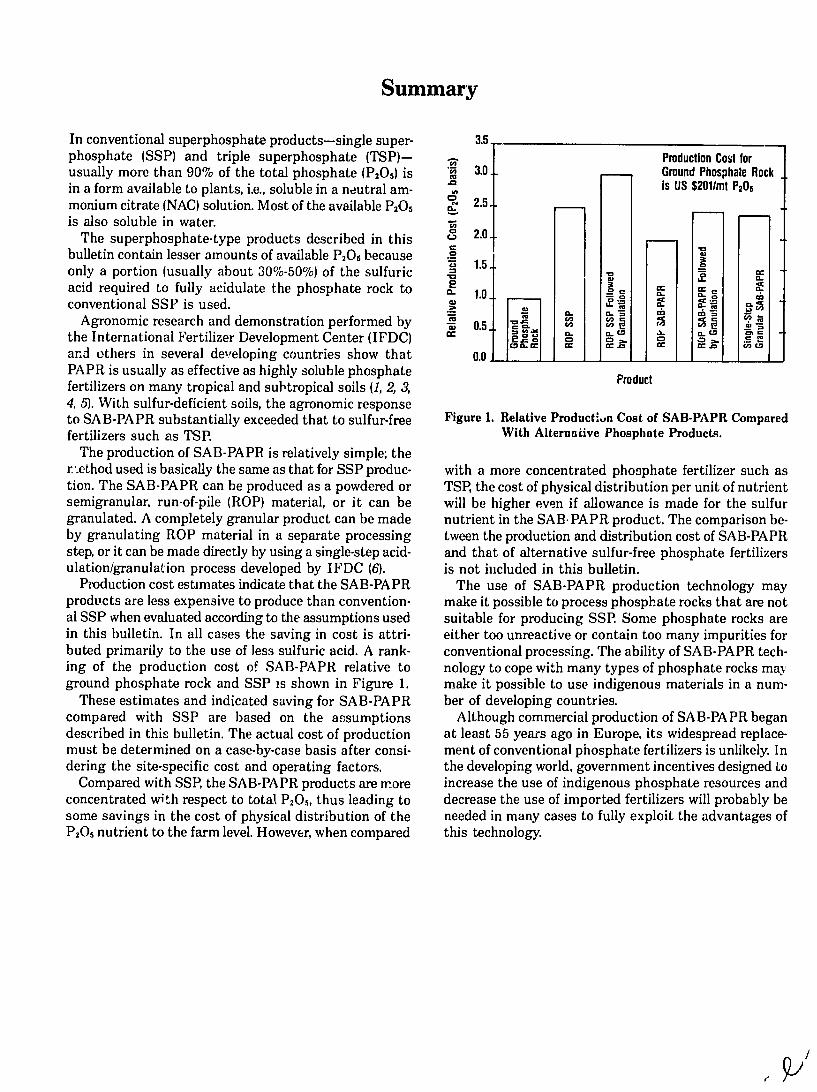