
Sulfate, nitrate and chloride in PM10 in the city of San ... · Laboratorio de Análisis Ambiental,...
12
Atmósfera 23(1), 83-94 (2010) Sulfate, nitrate and chloride in PM 10 in the city of San José, Costa Rica: 2004-2006 J. HERRERA MURILLO, J. F. ROJAS MARÍN Laboratorio de Análisis Ambiental, Escuela de Ciencias Ambientales, Universidad Nacional, Campus Omar Dengo, Heredia, Costa Rica Corresponding author: J. Herrera Murillo; e-mail: [email protected] S. RODRÍGUEZ ROMÁN Escuela de Química, Universidad de Costa Rica, Ciudad Universitaria Rodrigo Facio, San Pedro de Montes de Oca, Costa Rica R. GARCÍA MARTÍNEZ Laboratorio de Química Atmosférica, Centro de Ciencias de la Atmósfera, Universidad Nacional Autónoma de México, Ciudad Universitaria, México D. F., 04510 México Received August 13, 2008; accepted November 23, 2009 RESUMEN Se realizó la determinación de los niveles de PM 10 en dos sitios de la ciudad de San José (Catedral Metro- politana y Junta de Educación) durante un período de 2.5 años (abril 2004-octubre 2006) obteniendo una mediana de 39 ± 8 y 27 ± 8 µg m -3 , respectivamente. En forma adicional, se midieron las concentraciones de SO 4 2- , NO 3 - y Cl - registrando promedios que no son significativamente diferentes para ambos sitios de medición. Al aplicar el análisis de componentes principales a los datos, se obtuvieron dos factores que explican un 65% del total de la varianza. El factor PC1 incluye a la concentración de Cl - y la velocidad del viento sugiriendo la posible contribución marina de este anión. El factor PC2 muestra una relación entre las concentraciones de SO 4 2- , NO 3 - y PM 10 , demostrando su origen antropogénico. ABSTRACT The analysis of PM 10 levels in two sites of the city of San José (Catedral Metropolitana and Junta de Edu- cación), in a period of 2.5 years (April 2004-October 2006), reported a median of 39 ± 8 and 27 ± 8 µg m -3 , respectively. In addition, SO 4 2- , NO 3 - and Cl - levels were measured in both areas, where annual averages resulted not significantly different between each other. The analysis of main components, applied to the collected data, reveals a 65% of total variance explained by two factors. The PC1 correlates Cl - concentra- tion and wind speed, indicating a marine contribution to this ion. The PC2 shows a relation between SO 4 2- , NO 3 - and PM 10 levels, demonstrating its anthropogenic origin. Keywords: Atmospheric aerosols, inorganic anions, San José-Costa Rica. 1. Introduction According to the latest census, held in the year 2000, the capital of Costa Rica (San José), located in the Grand Metropolitan Area (GAM) and representing only 4% of the national territory (2084 km 2 ), holds the 75% of the vehicle fleet, 65% of the national industry, and 60% of the country’s population (INEC, 2002).
Transcript of Sulfate, nitrate and chloride in PM10 in the city of San ... · Laboratorio de Análisis Ambiental,...
Atmósfera 23(1), 83-94 (2010)
Sulfate, nitrate and chloride in PM10 in the city of San José,Costa Rica: 2004-2006
J. HERRERA MURILLO, J. F. ROJAS MARÍNLaboratorio de Análisis Ambiental, Escuela de Ciencias Ambientales, Universidad Nacional,
Campus Omar Dengo, Heredia, Costa Rica Corresponding author: J. Herrera Murillo; e-mail: [email protected]
S. RODRÍGUEZ ROMÁNEscuela de Química, Universidad de Costa Rica, Ciudad Universitaria Rodrigo Facio,
San Pedro de Montes de Oca, Costa Rica
R. GARCÍA MARTÍNEZLaboratorio de Química Atmosférica, Centro de Ciencias de la Atmósfera, Universidad Nacional
Autónoma de México, Ciudad Universitaria, México D. F., 04510 México
Received August 13, 2008; accepted November 23, 2009
RESUMENSe realizó la determinación de los niveles de PM10 en dos sitios de la ciudad de San José (Catedral Metro-politana y Junta de Educación) durante un período de 2.5 años (abril 2004-octubre 2006) obteniendo una mediana de 39 ± 8 y 27 ± 8 µg m-3, respectivamente. En forma adicional, se midieron las concentraciones de SO4
2-, NO3- y Cl- registrando promedios que no son significativamente diferentes para ambos sitios
de medición. Al aplicar el análisis de componentes principales a los datos, se obtuvieron dos factores que explican un 65% del total de la varianza. El factor PC1 incluye a la concentración de Cl- y la velocidad del viento sugiriendo la posible contribución marina de este anión. El factor PC2 muestra una relación entre las concentraciones de SO4
2-, NO3- y PM10, demostrando su origen antropogénico.
ABSTRACTThe analysis of PM10 levels in two sites of the city of San José (Catedral Metropolitana and Junta de Edu-cación), in a period of 2.5 years (April 2004-October 2006), reported a median of 39 ± 8 and 27 ± 8 µg m-3, respectively. In addition, SO4
2-, NO3- and Cl- levels were measured in both areas, where annual averages
resulted not significantly different between each other. The analysis of main components, applied to the collected data, reveals a 65% of total variance explained by two factors. The PC1 correlates Cl- concentra-tion and wind speed, indicating a marine contribution to this ion. The PC2 shows a relation between SO4
2-, NO3
- and PM10 levels, demonstrating its anthropogenic origin.
Keywords: Atmospheric aerosols, inorganic anions, San José-Costa Rica.
1. IntroductionAccording to the latest census, held in the year 2000, the capital of Costa Rica (San José), located in the Grand Metropolitan Area (GAM) and representing only 4% of the national territory (2084 km2), holds the 75% of the vehicle fleet, 65% of the national industry, and 60% of the country’s population (INEC, 2002).
84 J. Herrera Murillo et al.
In the last two decades, the GAM’s residents have witnessed a fast and unplanned development in the region. In most cases, this growth has not only involved new and modern infrastructure, but also an excessive increase in vehicular traffic (the reason of a considerable decline of the air quality), and the use of poor-quality, high-sulfur liquid fuels. The consequences are evident in the increasing number of cases associated with respiratory diseases, reported by the Costa Rican public health system (Herrera y Rodríguez, 2006).
One of the main indicators of the air pollution level is the concentration of suspended air particles (Visser et al., 2001). The particulate matter, specifically with diameters less than 10 µm (PM10), turned to be an important environmental issue in the last decade due to its impact on human health, directly on the lung tissues or indirectly as a transfer vector of toxic substances adsorbed on it (Dockery et al., 1993; Dockery, 1994; Gwynn et al., 2000). Since PM10 is composed of several materials with diverse physicochemical characteristics, there is a need to fully understand the composition of PM10 and its precursors in different populated centers and establish source-receptor relations that can help to guide future regulatory decisions. In most of the studies about air pollution, the chemical composition of the PM10 is usually the subject of concern (Querol et al., 2004; Lefer and Talbot, 2001; Zhang et al., 2003; Sun et al., 2004). However, the characterization of the aqueous extract of the aerosols can also assign information about the chemical constituents, their origin and specific emission source (Fernández Espinosa et al., 2002). Chemicals of anthropogenic origin (vehicular emissions, industrial emissions, etc.) occur mainly in an easily water-soluble form (Fernández Espinosa et al., 2002; Kyotani, 2002). Fernández Espinosa et al. (2002) also stress that this fraction could be biologically available for the human respiratory tract and Adamson et al. (1999) suggest that the soluble fraction of the particulate matter originates the toxicity.
Water-soluble ions are an important component of particles, especially in the (d < 1µm) fine fraction, both in continental and oceanic environments. Water-soluble particles play an essential role for the control of atmospheric processes. Since they are hygroscopic, they are able to form fog drops just before the saturation of steam. Fog particles change their size according to relative humidity variations, affecting the optical properties of air. This way, as a function of relative humidity, such particles spread the solar radiation producing significant changes in the transference of sun’s radiation (Fitzgerald, 1980).
Fine, inorganic, water-soluble particles are generated from gas precursors as sulfur dioxide (dimethyl sulfide in ocean environments), ammonia and nitrogen oxides, through gas-particle conversion processes (Bari et al., 2003). Most of the sulfate particles result from the oxidation of sulfur dioxide and, in a similar way, the nitrate particles from the nitrogen oxides. The nitrogen oxides react in the atmosphere to form gaseous nitric acid, which may react with the atmosphere’s ammonia to form ammonium nitrate. Nitric acid may also interact with particles containing sodium chloride or calcium carbonate generating hydrochloric acid or carbon dioxide, and sodium nitrate or calcium nitrate in the form of particles (USEPA, 2002).
The formation of fine secondary aerosol depends on the concentration of reactive gaseous species such as ozone, hydroxyl radical, and hydrogen peroxide, and specific atmospheric conditions as solar radiation and relative humidity. For this reason, it is difficult to associate the concentrations of secondary particles with the precursors emitted from the sources (Mylona, 1996).
From 2004 to present, the Laboratorio de Análisis Ambiental of the Universidad Nacional, together with the ministry of health and the municipality of San José have been monitoring the nitrate, chloride and sulfate levels in PM10. Based on those results, this paper analyses the annual trends, the influence of meteorological parameters, and the possible sources that affects those ion levels in PM10 found in San José City.
85Sulfate, nitrate and chloride in PM10
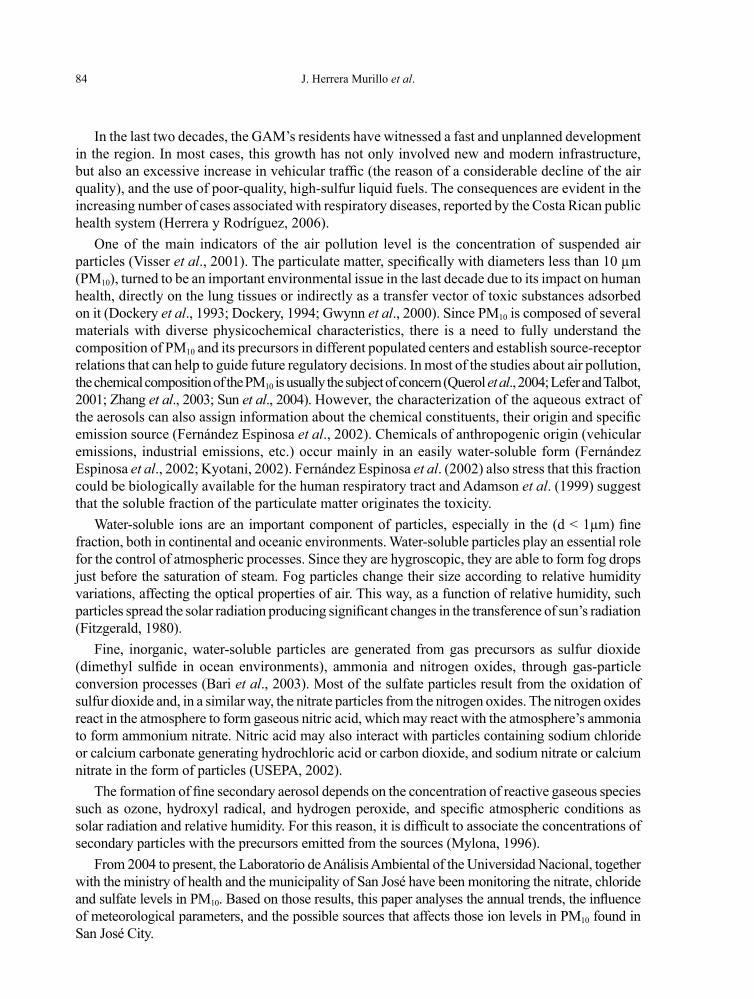
2. ExperimentalFor the sampling of the PM10, two monitoring sites (category B, according to the classification of the Environmental Protection Agency of the United States) were selected in the city of San José (Fig. 1). Category B refers to sites with high concentration of pollutants and low accumulation potential, located 3 to 15 m from a high vehicular traffic flow artery, with good natural ventilation.
Fig. 1. Location of points to monitor the PM10 particulate matter in the city of San José.
2.1 Sampling sitesFirst sampling siteLocation: Facilities of the Catedral Metropolitana of San José, Costa Rica, 10 m from the road and 3 m above ground level.
Second sampling siteLocation: Facilities of the Junta de Educación, San José, Costa Rica, 12 m from the 12 Avenue and 3 m above ground level.
Nicaragua
Study areaCaribbean
Sea
Panama
PacificOcean
N
300 0 300 600
Date: 12/05/2007
Diagram of location
Legend
Sampling SitesCatedral MetropolitanaJunta de EducaciónRoutes
Carmen
Catedral
Hospital
Mata redonda
Merced
Carmen
CatedralHospital
Mata redonda
Merced
Elaborated: Lic. Francisco Castro Delgado
m.
525000 528000
213000210000
528000525000
2100
0021
3000

86 J. Herrera Murillo et al.
2.2 SamplingSampling campaign was conducted between April 2004 and October 2006. Samples were collected three times a week: Mondays, Wednesdays and Fridays. To collect the samples, two high volume air samplers, Thermo Andersen model MFC were used during 24 ± 1 h, with a flow rate of 1.13 ± 10% m3min-1. Once every three samplings, flow calibration of each sampler was performed comparing the readings of pressure drop generated by the flow passing through a critical hole calibrated, Variflo, model 454, in comparison with equipment indications. The pressure drop measurements were made using two calibrated water pressure gauges connected to the hole and equipment, respectively. For each sampling, records of temperature condition and atmospheric pressure were taken using an anemometer Kestrel model 5000.
For sampling collection, Whatman Cat No. 1829-932 fiberglass filters were used. Those filters were conditioned at least 24 hours in a desiccator under the following conditions: temperature of 15-30 °C and humidity less than 40%, before being weighted in an analytical balance, before and after sampling conclusion. Hermetic sealing bags where used to transport filters to the field.
2.3 Chemical analysisA strip of 2.5 cm width was cut with a knife and a plastic ruler, from each of the filters. It was placed inside a 24/40 ground-glass joint flask of 250 mL. Fifty ml of Milli-Q water were added to extract the existing anions. Subsequently, the content of the ground-glass joint flask was heated at reflux for 30 minutes, it was cooled down and quantitatively transferred to a 100 mL volumetric flask. Thirty mL of Milli-Q water were added to the flask, it was heated for 30 minutes more, then it was cooled, and the residue was transferred to the volumetric flask. The flask’s content was rinsed three times with Milli-Q water and once it was cooled, it was dilute to volume with deionized water.
Finally, a portion of the solution of the volumetric flask was filtered through a Whatman 541 paper. The resulting solution was used for anion analysis by ionic exchange chromatography.
For the analysis, we used a DionexTM DX-100 chromatograph with Ion Pac AS4A-SC column of 4 mm, an Asrs-Ultra ionization suppressor of 4 mm and a 4400 plotter.
From 0.5 to 7 mgL-1 of anions (sulfate, nitrate, and chloride) were quantified by interpolation in a calibration curve, under the following experimental conditions: eluent: solution 1.8 mmol L-1 Na2CO3 /1.7 mmol L-1 NaHCO3 eluent flow: 2 mL min-1 sensitivity: 10 mS.
Standard dissolutions of calibration curve were run one time every 20 samples analyzed, together with a dissolution of quality control of 5 mg/L prepared from a certified Dionex synthetic sample. All the above steps were done in order to monitor the response and reproducibility of the peak and retention times. In addition, detection limits in ions were determined. To achieve this, 10 sample blanks of different filters measured once at a time, using the same analysis procedure applied to recollected samples, were analyzed. Detection limits were calculated by the concentration that generates a signal equal to the average of the signal of the blanks plus three times the blank’s standard deviation. Table I includes the detection and quantification limits for the analytical method. Precision and bias of analysis were determined from quality control check samples prepared in the laboratory. For this study 7 equal strips of a single filter were spiked at two concentrations levels, in the lineal range of the method, and analyzed for soluble anions. Table II shows the bias and relative standard deviation for the analytical method.
87Sulfate, nitrate and chloride in PM10
Catedral Metropolitana Junta de Educación PM10 SO4
2- NO3- Cl- PM10 SO4
2- NO3- Cl-
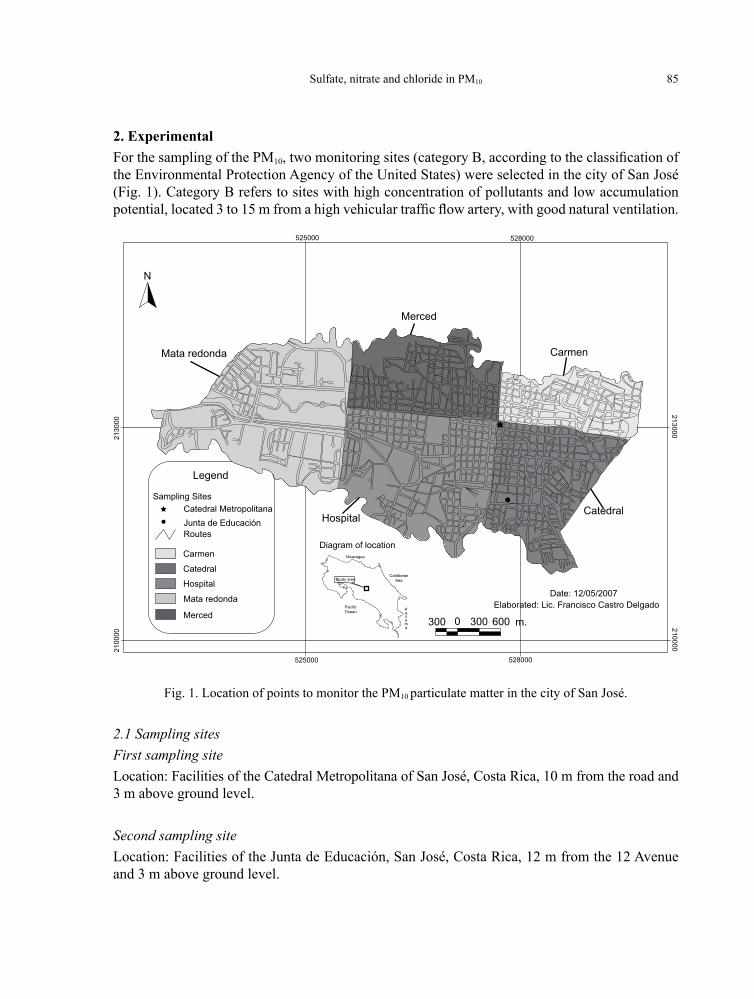
N 221 221 221 221 214 214 214 214 Maximum 66 12.8 1.91 2.34 40 12.1 2.65 1.91 Minimum 29 1.95 0.41 0.48 18 1.80 0.46 0.47 Median 39 3.23 0.92 1.30 27 3.39 1.01 1.18
Table III. Medians, maximum and minimum concentration (mgm-3) of the variables measured in PM10 collected in two sites of the city of San José, from 2004 to 2006.
Table I. Air detection and quatification limits (mgm-3) obtained for the analysis of the anion concentration by ionic exchange chromatography.
Sulfate Nitrate Chloride DL 0.06 0.11 0.23 QL 0.3 0.2 0.4
Recovery Standard Recovery Standard Recovery Standard percentage deviation percentage deviation percentage deviation Low (1 mgL-1) 100.6 2.5 99.1 2.0 97.9 3.4 High (7 mgL-1) 99.2 3.7 99.7 2.6 98.5 2.8
Concentration Sulfate Nitrate Chloride levels
Table II. Recovery percentages and their standard deviations obtained for the analysis of the anion concentration by ionic exchange chromatography.
3. Analysis and resultsTable III shows the median as well as the minimum and maximum concentration of each of the variables analyzed in both sampling sites. As it may be observed, the median and maximum PM10 concentrations of the sampling period do not exceed the values established in the Costa Rican Decree on Immissions for Atmospheric Pollutants (30221-S: Decreto de Inmisiones de Contaminantes Atmosféricos de Costa Rica), which are 150 µgm-3 for 24 h and 50 µgm-3 annual average. Non-parametric statistical methods were applied to all the inorganic anions and PM10 concentrations. Non-significant differences were found between sites for inorganic anions. The Kruskal-Wallis statistics was applied at a 5% level, confirming these results. Despite there is no significative difference in the anions concentrations of the particles for both sites, there are significative differences for PM10 concentrations. This means that both sites are probably affected by the same sources but with different intensity. It is important to remember that the Catedral Metropolitana is in the central area of the city, a commercial area with high vehicular traffic flow while the Junta de Educación is located in a transition area, between the commercial and residential sectors of the Costa Rican capital.
The trend of PM10 data for both sampling sites was determined based on autoregressive time series with moving integrated averages of Box-Jenkins called ARIMA, because exists a first order positive correlation based on he application of the Durbin-Watson test in both sites. In this case we applied a model ARIMA of order (1, 1, 1) to the univariated concentration of PM10 taking into account the seasonality factor. From the models obtained it was determined that while the concentration of PM10 in the Junta de Educación (PM10 = 29.9 + 0.0292 T) grows very slowly in this period, the Catedral Metropolitana (PM10 = -0.169T + 36.5) has had a significant decline in concentrations, according with both models slopes.

88 J. Herrera Murillo et al.
In addition, a crossed-correlation analysis was performed between PM10 data obtained from both sites, and some of the meteorological variables registered in the 2.5-year study, particularly, average daily temperature, wind speed, and accumulated daily rainfall. The crossed-correlation analysis represents the correlation between the number of input data at time t, X t (meteorological conditions), and the output series at time t + k (k = gap), Yt + k (PM10 concentrations). That is, between the current values of X and Y retarded. In Figure 2, the correlation between the concentration data of PM10 and rainfall shows two cycles of approximately six months. The highest values are registered during the rainy season when, as the rainfall levels increase, the PM10 concentrations increase as well (Fig. 3). However, after the sixth month of the rainy season, the pattern is reverted, while rainfall decreases, the PM10 concentration decreases. During the dry season, a persistent NE trend wind is over San José City, with speeds around 30 kmh-1 between January and March, and a high removal of pollutants occurs. But during the rainy season (May to December), the NE trend wind decreases during the morning, and a west-northwest breeze from the Pacific Ocean come into the Central Valley,
Fig. 2. Cross-correlation graphs of the PM10 concentration levels in both monitoring sites located in the city of San José and the meteorological parameters, 2004-2006.
Gap
Cor
rela
tion
PM10- Rainfall
Catedral MetropilitanaJunta de Educación
PM10- Temperature
1.0
0.5
0.0
0 10 20
−0.5
−1.0
Cor
rela
tion
1.0
0.5
0.0
−0.5
−1.0−20
Cor
rela
tion
1.0
0.5
0.0
−0.5
−1.0
Cor
rela
tion
1.0
0.5
0.0
−0.5
−1.0
Cor
rela
tion
1.0
0.5
0.0
−0.5
−1.0
Cor
rela
tion
1.0
0.5
0.0
−0.5
−1.0
−10
Gap0 10 20−20 −10
Gap0 10 20−20 −10
Gap0 10 20−20 −10
Gap0 10 20−20 −10
Gap0 10 20−20 −10
PM10- Rainfall
PM10- Temperature
PM10- Wind Speed PM10- Wind Speed
89Sulfate, nitrate and chloride in PM10
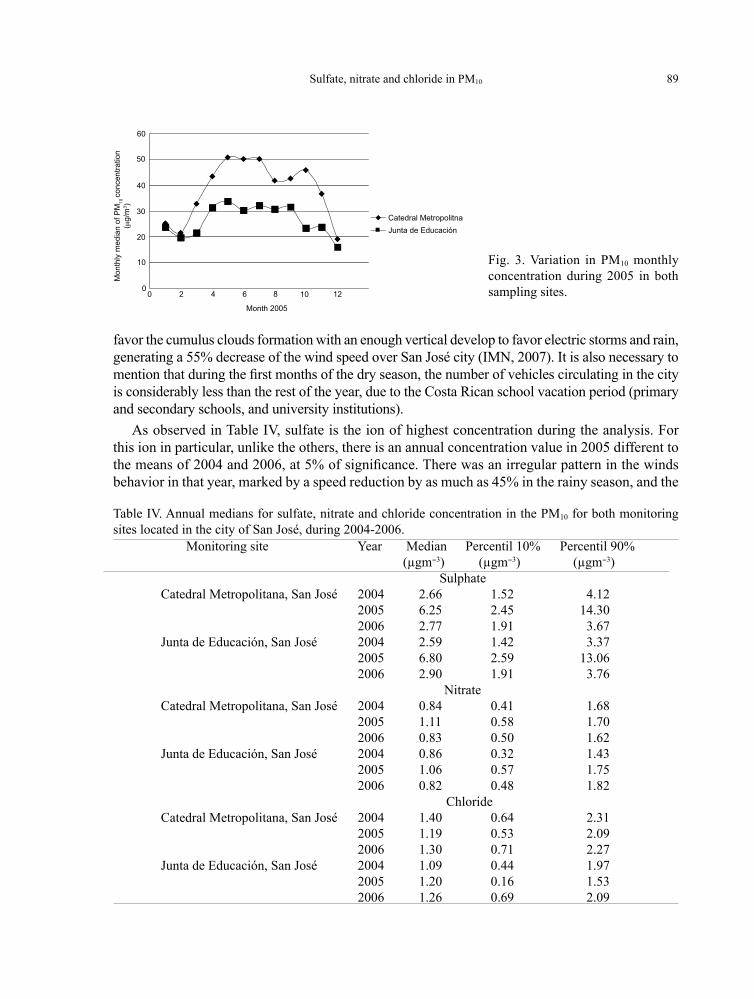
favor the cumulus clouds formation with an enough vertical develop to favor electric storms and rain, generating a 55% decrease of the wind speed over San José city (IMN, 2007). It is also necessary to mention that during the first months of the dry season, the number of vehicles circulating in the city is considerably less than the rest of the year, due to the Costa Rican school vacation period (primary and secondary schools, and university institutions).
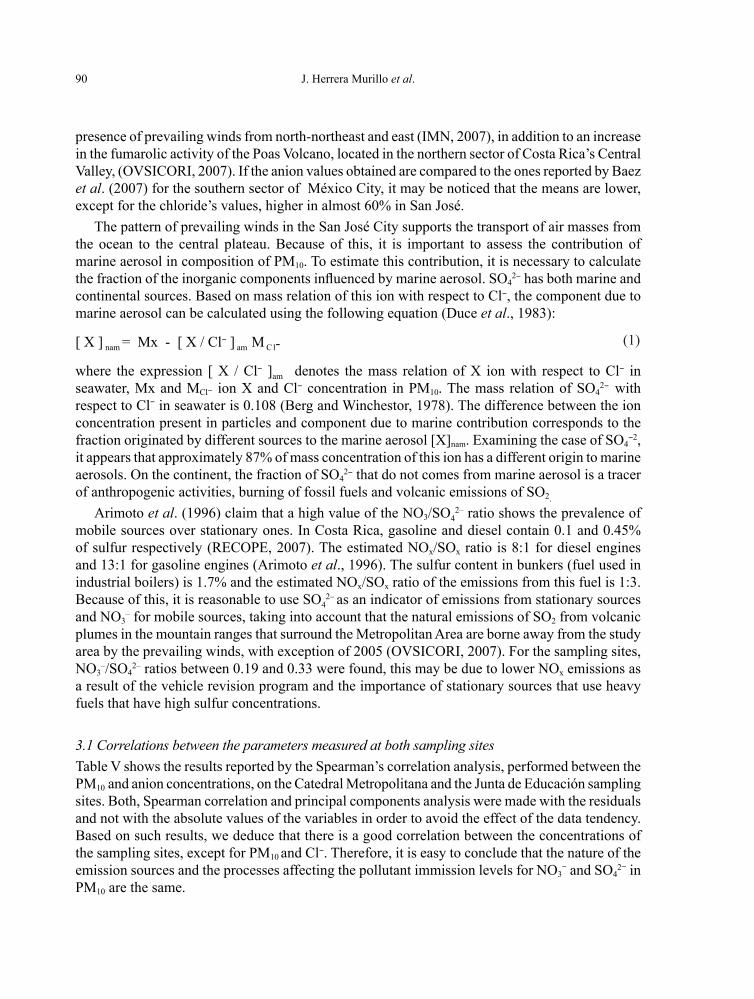
As observed in Table IV, sulfate is the ion of highest concentration during the analysis. For this ion in particular, unlike the others, there is an annual concentration value in 2005 different to the means of 2004 and 2006, at 5% of significance. There was an irregular pattern in the winds behavior in that year, marked by a speed reduction by as much as 45% in the rainy season, and the
Sulphate Catedral Metropolitana, San José 2004 2.66 1.52 4.12 2005 6.25 2.45 14.30 2006 2.77 1.91 3.67 Junta de Educación, San José 2004 2.59 1.42 3.37 2005 6.80 2.59 13.06 2006 2.90 1.91 3.76 Nitrate Catedral Metropolitana, San José 2004 0.84 0.41 1.68 2005 1.11 0.58 1.70 2006 0.83 0.50 1.62 Junta de Educación, San José 2004 0.86 0.32 1.43 2005 1.06 0.57 1.75 2006 0.82 0.48 1.82 Chloride Catedral Metropolitana, San José 2004 1.40 0.64 2.31 2005 1.19 0.53 2.09 2006 1.30 0.71 2.27 Junta de Educación, San José 2004 1.09 0.44 1.97 2005 1.20 0.16 1.53 2006 1.26 0.69 2.09
Monitoring site Year Median Percentil 10% Percentil 90% (µgm-3) (µgm-3) (µgm-3)
Table IV. Annual medians for sulfate, nitrate and chloride concentration in the PM10 for both monitoring sites located in the city of San José, during 2004-2006.
Fig. 3. Variation in PM10 monthly concentration during 2005 in both sampling sites.
Mon
thly
med
ian
of P
M10
conc
entra
tion
(μg/
m3 )
Month 2005
Catedral MetropolitnaJunta de Educación
50
40
30
20
10
00 2 4 6 8 10 12
60
90 J. Herrera Murillo et al.
presence of prevailing winds from north-northeast and east (IMN, 2007), in addition to an increase in the fumarolic activity of the Poas Volcano, located in the northern sector of Costa Rica’s Central Valley, (OVSICORI, 2007). If the anion values obtained are compared to the ones reported by Baez et al. (2007) for the southern sector of México City, it may be noticed that the means are lower, except for the chloride’s values, higher in almost 60% in San José.
The pattern of prevailing winds in the San José City supports the transport of air masses from the ocean to the central plateau. Because of this, it is important to assess the contribution of marine aerosol in composition of PM10. To estimate this contribution, it is necessary to calculate the fraction of the inorganic components influenced by marine aerosol. SO4
2- has both marine and continental sources. Based on mass relation of this ion with respect to Cl-, the component due to marine aerosol can be calculated using the following equation (Duce et al., 1983):
[ X ] nam = Mx - [ X / Cl- ] am M C l- where the expression [ X / Cl- ]am denotes the mass relation of X ion with respect to Cl- in seawater, Mx and MCl- ion X and Cl- concentration in PM10. The mass relation of SO4
2- with respect to Cl- in seawater is 0.108 (Berg and Winchestor, 1978). The difference between the ion concentration present in particles and component due to marine contribution corresponds to the fraction originated by different sources to the marine aerosol [X]nam. Examining the case of SO4
-2, it appears that approximately 87% of mass concentration of this ion has a different origin to marine aerosols. On the continent, the fraction of SO4
2- that do not comes from marine aerosol is a tracer of anthropogenic activities, burning of fossil fuels and volcanic emissions of SO2.
Arimoto et al. (1996) claim that a high value of the NO3/SO42– ratio shows the prevalence of
mobile sources over stationary ones. In Costa Rica, gasoline and diesel contain 0.1 and 0.45% of sulfur respectively (RECOPE, 2007). The estimated NOx/SOx ratio is 8:1 for diesel engines and 13:1 for gasoline engines (Arimoto et al., 1996). The sulfur content in bunkers (fuel used in industrial boilers) is 1.7% and the estimated NOx/SOx ratio of the emissions from this fuel is 1:3. Because of this, it is reasonable to use SO4
2– as an indicator of emissions from stationary sources and NO3
– for mobile sources, taking into account that the natural emissions of SO2 from volcanic plumes in the mountain ranges that surround the Metropolitan Area are borne away from the study area by the prevailing winds, with exception of 2005 (OVSICORI, 2007). For the sampling sites, NO3
–/SO42– ratios between 0.19 and 0.33 were found, this may be due to lower NOx emissions as
a result of the vehicle revision program and the importance of stationary sources that use heavy fuels that have high sulfur concentrations.
3.1 Correlations between the parameters measured at both sampling sitesTable V shows the results reported by the Spearman’s correlation analysis, performed between the PM10 and anion concentrations, on the Catedral Metropolitana and the Junta de Educación sampling sites. Both, Spearman correlation and principal components analysis were made with the residuals and not with the absolute values of the variables in order to avoid the effect of the data tendency. Based on such results, we deduce that there is a good correlation between the concentrations of the sampling sites, except for PM10 and Cl-. Therefore, it is easy to conclude that the nature of the emission sources and the processes affecting the pollutant immission levels for NO3
- and SO42- in
PM10 are the same.
(1)

91Sulfate, nitrate and chloride in PM10
Both sampling sites reported a significant correlation between PM10 and sulfate and nitrate concentrations, at a significance level of p < 0.02. Therefore, the acidity of particles, given by the H2SO4 and HNO3, is probably determined by the presence of SO4
2- and NO3- (Braga et al., 2005).
Analyzing the main components of the analytical data (PM10, SO42-,NO3
-, Cl-) and the meteorological variables prevailing during the sampling, we found that approximately 65 percent of the total variance, of both monitoring sites, may be explained by two factors. In both cases, the PC1 (Table VI) shows a strong relation between the wind speed and the chloride concentration. Therefore, and since the direction of the prevailing winds in the city is east-northeast, from the Caribbean Sea, we may conclude that there is a primary marine-based contribution to this ion concentration. The PC2, for both sites, indicates an important relation between the sulfate, nitrate and PM10, which evidences the effect of anthropogenic activities on the city’s quality of air.
Variables PC1 PC2 PC1 PC2 PM10 0.401 0.677 -0.396 0.748 Rainfall 0.540 0.090 -0.863 -0.055 Temperature 0.377 0.687 -0.626 0.657 Wind speed 0.698 -0.383 0.886 -0.314 Sulfate -0.172 0.842 0.040 0.819 Nitrate 0.027 0.567 0.127 0.615 Chloride 0.566 0.298 0.601 0.085 Variance percentage explained 32.6 31.5 35.1 30.7The PC values in bold are significant.
Catedral Metropolitana Junta de Educación
Table VI. Matrix of values of the main components obtained from the samplings of PM10 particulate matter in the city of San José, 2004-2006.
PM10 SO42- NO3
- Cl- PM10 SO42- NO3
Cl- Catedral PM10 1.000 Metropolitana SO4
2- 0.458 1.000 NO3
- 0.630 0.720 1.000 Cl- 0.112 0.123 0.206 1.000 Junta de Educación PM10 0.199 0.143 0.103 0.097 1.000 SO4
2- 0.231 0.512 0.686 -0.213 0.417 1.000 NO3
- 0.112 0.455 0.484 -0.034 0.396 0.550 1.000 Cl- 0.187 -0.159 -0.058 0.115 -0.217 -0.045 0.129 1.000
Catedral Metropolitana Junta de Educación
Table V. Matrix of Spearman’s correlations between PM10 and anion concentrations, for each of the sampling sites located in the city of San José, 2004-2006.
Values in bold represent p < 0.02, n = 214.
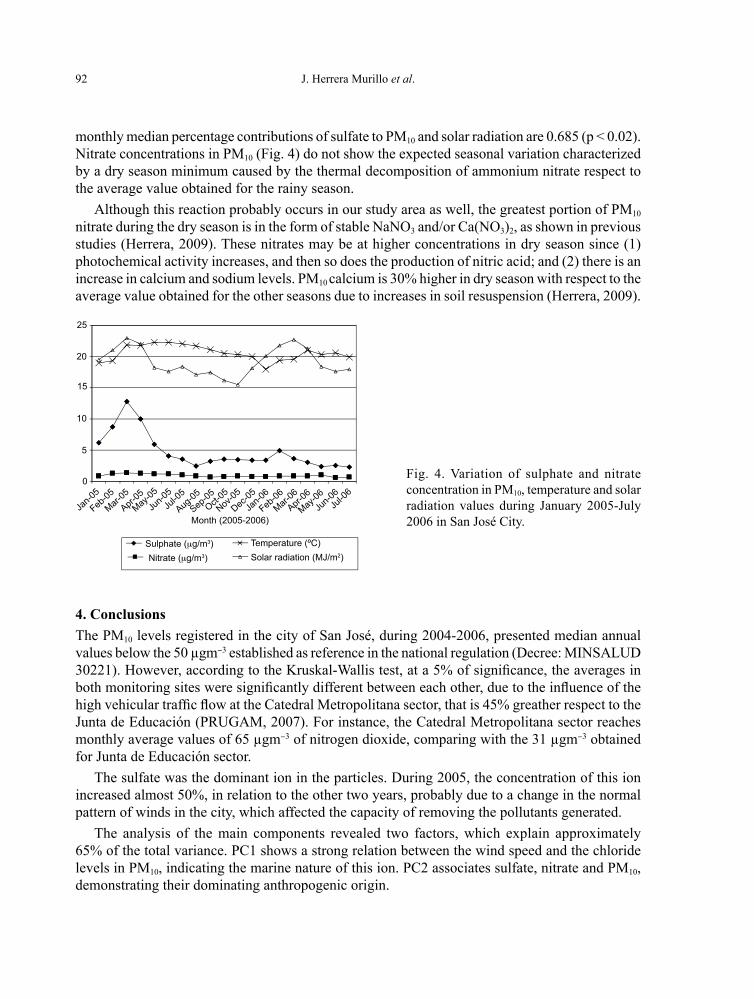
Figure 4 shows the nitrate and sulfate monthly medians variations in PM10 for the whole study period, together with some meteorological parameters (temperature and solar radiation). Sulfate exhibits the seasonal variation observed with a dry season maximum for PM10 because of an increase in the SO2 oxidation rate under high insolation conditions. The correlation coefficients between the
92 J. Herrera Murillo et al.
monthly median percentage contributions of sulfate to PM10 and solar radiation are 0.685 (p < 0.02). Nitrate concentrations in PM10 (Fig. 4) do not show the expected seasonal variation characterized by a dry season minimum caused by the thermal decomposition of ammonium nitrate respect to the average value obtained for the rainy season.
Although this reaction probably occurs in our study area as well, the greatest portion of PM10
nitrate during the dry season is in the form of stable NaNO3 and/or Ca(NO3)2, as shown in previous studies (Herrera, 2009). These nitrates may be at higher concentrations in dry season since (1) photochemical activity increases, and then so does the production of nitric acid; and (2) there is an increase in calcium and sodium levels. PM10 calcium is 30% higher in dry season with respect to the average value obtained for the other seasons due to increases in soil resuspension (Herrera, 2009).
Fig. 4. Variation of sulphate and nitrate concentration in PM10, temperature and solar radiation values during January 2005-July 2006 in San José City.
4. ConclusionsThe PM10 levels registered in the city of San José, during 2004-2006, presented median annual values below the 50 µgm-3 established as reference in the national regulation (Decree: MINSALUD 30221). However, according to the Kruskal-Wallis test, at a 5% of significance, the averages in both monitoring sites were significantly different between each other, due to the influence of the high vehicular traffic flow at the Catedral Metropolitana sector, that is 45% greather respect to the Junta de Educación (PRUGAM, 2007). For instance, the Catedral Metropolitana sector reaches monthly average values of 65 µgm-3 of nitrogen dioxide, comparing with the 31 µgm-3 obtained for Junta de Educación sector.
The sulfate was the dominant ion in the particles. During 2005, the concentration of this ion increased almost 50%, in relation to the other two years, probably due to a change in the normal pattern of winds in the city, which affected the capacity of removing the pollutants generated.
The analysis of the main components revealed two factors, which explain approximately 65% of the total variance. PC1 shows a strong relation between the wind speed and the chloride levels in PM10, indicating the marine nature of this ion. PC2 associates sulfate, nitrate and PM10, demonstrating their dominating anthropogenic origin.
25
20
15
10
5
0
Month (2005-2006)
Sulphate (μg/m3)Nitrate (μg/m3)
Temperature (ºC)Solar radiation (MJ/m2)
Jan-0
5
Feb-05
Mar-05
Apr-05
May-05
Jun-0
5Ju
l-05
Jan-0
6
Feb-06
Mar-06
Apr-06
May-06Ju
n-06Ju
l-06
Aug-05
Sep-05Oct-
05
Nov-05
Dec-05
93Sulfate, nitrate and chloride in PM10
AcknowledgementsThe authors appreciate the cooperation of members from the Municipality of San José and the Ministerio de Salud, for their contribution to the sampling process. Likewise, we thank the valuable assistance of the Intituto Meteorológico Nacional, which contributed with the data collected at the Aranjuez station, in the city of San José, during the monitoring period.
ReferencesAdamson I. Y. R., H. Prieditis and R.Vincent, 1999. Pulmonary toxicity of an atmospheric parti-
culate sample is due to the soluble fraction. Toxicol. Appl. Pharm. 157, 43-50.Arimoto R., R. A. Duce, D. L. Savoie, J. M. Prospero, R. Talbot, J. D. Cullen, U. Tomza, N. F.
Lewis and B. J. Ray, 1996. Relationships among aerosol constituents from Asia and the North Pacific during Pem-West A. J. Geophys. Res. 101, 2011-2023.
Báez A. P., R. M. García, M. C. Torres, H. G. Padilla, R. D. Belmont, O. M. Amador and R. Villalobos-Pietrini, 2007. Origin of trace elements and inorganic ions in PM10 aerosols to the south of Mexico City. Atmos. Res. 85, 52-63.
Bari, A., V. Ferraro, L. R. Wilson, D. Luttinger and L. Husain, 2003. Measurements of gaseous HONO, HNO3, SO2, HCl, NH3, particulate sulfate and PM2.5 in New York, NY. Atmos. Environ. 37, 2825-2835.
Berg W. W. and J. W. Winchestor, 1978. Aerosol chemistry of marine atmosphere. In: Chemical Oceanography 7. (J. P. Riley and R. Chester, Eds.). Academic Press, London, 173-231.
Braga C. F., E. C. Teixeira, L. Meira, F. Wieganda, M. L. Yoneama and J. F. Dias, 2005. Elemen-tal composition of PM10 and PM2.5 in urban environment in South Brazil. Atmos. Environ. 39, 1801-1815.
Dockery D. W., C. A. Pope III, X. Xu, J. D. Spengler, J. H. Ware, E. Martha, M. E. Fay, B. G. Ferris Jr. and F. E. Speitzer, 1993. An association between air pollution and mortality in six US cities. New. Engl. J. Med. 329, 1753-1759.
Dockery D. W. and C. A. Pope III, 1994. Acute respiratory effects of particulate air pollution. Annu. Rev. Publ. Health 15, 107-132.
Duce R. A., R. Arimoto, B. J. Ray, C. K. Unni and P. J. Harder, 1983. Atmospheric trace elements at Enewetak Atoll 1, concentrations, sources and temporal variability. J. Geophys. Res. 88, 5321-5342.
Fernández Espinosa A. J., M. T. Rodríguez, J. B. Rosa and J. C. Sánchez, 2002. A chemical spe-ciation of trace metals for fine urban particles. Atmos. Environ. 36, 773-780.
Fitzgerald J. W., 1980. The relative contribution of fluctuations in relative humidity and particulate concentrations to the variability of the scattering coefficient over the North Atlantic. Atmos. Environ. 14, 71-80.
Gwynn C. R., R. T. Burnett and G. D. Thurston, 2000. A time-series analysis of acidic particulate matter and daily mortality and morbidity in the Buffalo, New York, Region. Environ. Health Persp. 108, 125-133.
Herrera J. and S. Rodríguez, 2006. Tercer Informe de calidad del aire de la ciudad de San José. Informe Técnico, Heredia, 42 pp.
Herrera J., S. Rodríguez and A. P. Báez, 2009. Chemical composition and sources of PM10 particulate matter collected in San José, Costa Rica. The Open Atmospheric Sciences Journal 3, 124-130.
IMN, 2007. Resumen Meteorológico Año 2005. Instituto Meteorológico Nacional. Informe Téc-nico, San José. pp 45-53.
94 J. Herrera Murillo et al.
INEC, 2002. Compendio de Estadísticas de la Gran Área Metropolitana de Costa Rica. Instituto Nacional de Estadística y Censos. Informe Técnico, San José, pp 23-26.
Kyotani T. and M. Iwatsuki, 2002. Characterization of soluble and insoluble components in PM 2.5 and PM10 fractions of airborne particulate matter in Kofu city, Japan. Atmos. Environ. 36, 639-649.
Lefer B. L. and R. W. Talbot, 2001. Summertime measurements of aerosol nitrate and ammonium at a northeastern U.S. site. J. Geophys. Res. 106, 20365-20378.
Mylona S., 1996. Sulphur dioxide emissions in Europe 1880-1991 and their effects on sulphur concentrations and depositions. Tellus 48B, 662-689.
OVSICORI, 2007. Resumen de estudios volcánicos realizados en los años 2005-2006. Observatorio Vulcanológico y Sismológico de Costa Rica. Informe Técnico. Heredia, pp 14-23.
PRUGAM, 2007. Estudio de vialidad para el área metropolitana de Costa Rica. Planificación Regional y Urbana de la Gran Área Metropolitana del Valle Central de Costa Rica. Informe Técnico, San José, 59-64.
Querol X., A. Alastuey, C. R. Ruiz, B. Artiñano, H. C. Hansson, R. M. Harrison, E. Buringh, H. M. Ten Brink, M. Lutz, P. Bruckmann, P. Straehl and J. Schneider, 2004. Speciation and origin of PM10 and PM2.5 in selected European cities. Atmos. Environ. 38, 6547-6555.
RECOPE, 2007. Informes de control de calidad de los combustibles que se expenden en Costa Rica. Refinadora Costarricense de Petróleo, Informe Técnico, San José, 30 pp.
Sun Y. L., G. S. Zhuang, W. Ying, L. H. Han, J. H. Guo, D. Mo, W. J. Zhang, Z. F. Wang and Z. P. Hao, 2004. The air-borne particulate pollution in Beijing-concentration, composition, distri-bution and sources. Atmos. Environ. 38, 5991-6004.
USEPA, 2002. Air quality for particulate matter and sulfur oxides. US Environmental Protection Agency. Research Triangle Park, NC: Office of Health and Environmental Assesment; EPA report no. EPA-600/8-82-029aF-cF. 3v.
Visser H., E. Buringh and P. B. van Breugel, 2001. Composition and origin of airborne particulate matter in the Netherlands. National Institute for Public Health and the Environment, RIVM. The Netherlands, Report 650010029, 104 pp.
Zhang X. Y., S. L. Gong, Z. X. Shen, F. M. Mei, X. X. Xi, L. C. Liu, Z. J. Zhou, D. Wang, Y. Q. Wang and Y. Cheng, 2003. Characterization of soil dust aerosol in China and its transport and distribution during 2001 ACE-Asia: 1. Network observations. J. Geophys. Res. 108 (D9). 4261, doi:10.1029/2002JD002632.


![Bericht zu PM10-Tagesmittelwerten und Überschreitungen …...28.04.2011 PM10 [µg/m³] 1 58 05.11.2011 PM10 [µg/m³] 5 62 12.11.2011 PM10 [µg/m³] 3 102 23.11.2011 PM10 [µg/m³]](https://static.fdocuments.net/doc/165x107/5feb2fd0c3ceb232dc68d90f/bericht-zu-pm10-tagesmittelwerten-und-oeberschreitungen-28042011-pm10-gm.jpg)