
Suicides in the United Kingdom, 2013 Registrations
28
Statistical Bulletin Office for National Statistics | 1 Suicides in the United Kingdom, 2013 Registrations Coverage: UK Date: 19 February 2015 Geographical Areas: Country, Region, UK Theme: Population Theme: Health and Social Care Key Points • 6,233 suicides of people aged 15 and over were registered in the UK in 2013, 252 more than in 2012 (a 4% increase). • The UK suicide rate was 11.9 deaths per 100,000 population in 2013. The male suicide rate was more than three times higher than the female rate, with 19.0 male deaths per 100,000 compared to 5.1 female deaths. • The male suicide rate in 2013 was the highest since 2001. The lowest male rate since the beginning of the data series, at 16.6 per 100,000, was in 2007. Female rates have stayed relatively constant since 2007. • The highest UK suicide rate in 2013 by broad age group was among men aged 45 to 59, at 25.1 deaths per 100,000, the highest for that age group since 1981. • The most common method of suicide in the UK in 2013 was ‘hanging, strangulation and suffocation’ which accounted for 56.1% of male suicides and 40.2% of female suicides. • The highest suicide rate among the English regions was in North East England at 13.8 deaths per 100,000 population, while London had the lowest at 7.9 per 100,000. Summary This bulletin presents the latest (2013) figures on suicide deaths in the UK for recent years. Figures from 1981 to 2013 are available in the accompanying reference table to download, and are discussed in the commentary to provide context to the latest data. Figures are given by sex, age, area of usual residence of the deceased and suicide method.
Transcript of Suicides in the United Kingdom, 2013 Registrations
Statistical Bulletin
Office for National Statistics | 1
Suicides in the United Kingdom,2013 RegistrationsCoverage: UKDate: 19 February 2015Geographical Areas: Country, Region, UKTheme: PopulationTheme: Health and Social Care
Key Points
• 6,233 suicides of people aged 15 and over were registered in the UK in 2013, 252 more than in2012 (a 4% increase).
• The UK suicide rate was 11.9 deaths per 100,000 population in 2013. The male suicide rate wasmore than three times higher than the female rate, with 19.0 male deaths per 100,000 comparedto 5.1 female deaths.
• The male suicide rate in 2013 was the highest since 2001. The lowest male rate since thebeginning of the data series, at 16.6 per 100,000, was in 2007. Female rates have stayedrelatively constant since 2007.
• The highest UK suicide rate in 2013 by broad age group was among men aged 45 to 59, at 25.1deaths per 100,000, the highest for that age group since 1981.
• The most common method of suicide in the UK in 2013 was ‘hanging, strangulation andsuffocation’ which accounted for 56.1% of male suicides and 40.2% of female suicides.
• The highest suicide rate among the English regions was in North East England at 13.8 deathsper 100,000 population, while London had the lowest at 7.9 per 100,000.
Summary
This bulletin presents the latest (2013) figures on suicide deaths in the UK for recent years.Figures from 1981 to 2013 are available in the accompanying reference table to download, and arediscussed in the commentary to provide context to the latest data. Figures are given by sex, age,area of usual residence of the deceased and suicide method.

Suicides in the United Kingdom, 2013 Registrations | 19 February 2015
Office for National Statistics | 2
The Office for National Statistics (ONS) publishes suicide statistics for the UK as a whole and forEngland and Wales. The equivalent statistics for Scotland and Northern Ireland are produced byNational Records of Scotland (formerly the General Register Office for Scotland) and the NorthernIreland Statistics and Research Agency respectively, and can be found on their websites.
In 2013, a total of 6,233 suicides in people aged 15 and over were registered in the UK. Of the totalnumber of suicides, 78% were male and 22% were female.
There were 4,858 male suicides registered in the UK in 2013 (an age-standardised mortality rate of19.0 deaths per 100,000 population). Looking at broad age groups, the 45−59 age group had thehighest rate since 1981 of 25.1 deaths per 100,000. This was the first year that this age group hadthe highest suicide rate.
There were 1,375 female suicides registered in the UK in 2013 (an age-standardised mortality rateof 5.1 deaths per 100,000 population). The highest rate by age group was for women aged 45−59; in2013 the rate for this group was 7.0 deaths per 100,000 population.
The most common method of suicide in the UK is ‘hanging, strangulation and suffocation’, followedby poisoning, for both males and females.
In England, the age-standardised suicide rate in 2013 was 10.7 deaths per 100,000 (4,722 deaths),compared with 15.9 in Wales (393 deaths). Within England, the suicide rate was highest in the NorthEast at 13.8 deaths per 100,000 and lowest in London at 7.4 per 100,000 population.
Figures presented in this bulletin are for deaths registered in each year, rather than occurring eachyear. There can be a substantial delay between the date of death and date of registration. For detailsand implications see the section on methodological issues.
Suicide figures in England and Wales are also potentially affected by an increase over time in theuse of ‘narrative verdicts’ by coroners. For full details see the section on methodological issues.
United Kingdom
In 2013, a total of 6,233 suicides of people aged 15 and over were registered in the UK. A generallydownward trend in suicide rates was observed between 1981 and 2007, with a decrease from 15.6to 10.6 deaths per 100,000 population (see figure 1). There has been an increase in suicide ratessince 2007, to 11.9 per 100,000. This level was last seen in 2004.
Of the total number of suicides registered in 2013 in the UK, 78% were male and 22% were female.Suicide rates have been consistently lower in females than in males throughout the time periodcovered by the data. Although suicide rates for both sexes fell significantly between 1981 and 2007,the fall was more pronounced among females. Consequently, the proportion of male suicides tofemale suicides has increased since 1981 when 63% were male and 37% were female. Since 2007,the female rate stayed relatively constant while the male rate increased significantly.

Suicides in the United Kingdom, 2013 Registrations | 19 February 2015
Office for National Statistics | 3
Figure 1: Age-standardised suicide rates: by sex, deaths registered in each year from 1981 to2013United Kingdom
Source: Office for National Statistics, Northern Ireland Statistics and Research Agency, NationalRecords of Scotland
Notes:1. The National Statistics definition of suicide is given in the section 'Suicide definition'.2. Figures are for persons aged 15 years and over.3. Rates per 100,000 population, standardised to the European Standard Population (2013). Prior to 1994, the upper
age group was 85+ rather than 90+.4. Deaths of non-residents are included in figures for the UK.5. Figures are for deaths registered in each calendar year.
Download chart
XLS format(68.5 Kb)
When male suicide rates are analysed by five broad age groups, the 30 to 44 age group had thehighest rate from 1995 to 2012 (see figure 2). However, in 2013, the 45 to 59 age group had thehighest suicide rate out of any age group, having increased since 2007 to reach 25.1 deaths per100,000 population, the highest rate since 1981. The rate for 60 to 74 year olds rose significantlyfrom its 2012 level, to 14.5 per 100,000 in 2013. In contrast, the 15 to 29 age group was the onlygroup to have a decrease in the age-specific rate in 2013.
Suicide remains the leading cause of death in England and Wales for men aged between 20 and34 years of age (24% of all deaths in 2013) and for men aged 35 to 49 years (13% of all deaths in2013). Further data on causes of death can be found in the Death Register Series.

Suicides in the United Kingdom, 2013 Registrations | 19 February 2015
Office for National Statistics | 4
Figure 2: Age-specific suicide rate, males, deaths registered in each year from 2002 to 2013United Kingdom
Source: Office for National Statistics, Northern Ireland Statistics and Research Agency, NationalRecords of Scotland
Notes:1. The National Statistics definition of suicide is given in the section ‘Suicide definition’.2. Figures are for males aged 15 years and over.3. Age-specific suicide rates per 100,000 population.4. Deaths of non-residents are included in figures for the UK.5. Figures are for deaths registered in each calendar year.
Download chart
XLS format(49 Kb)
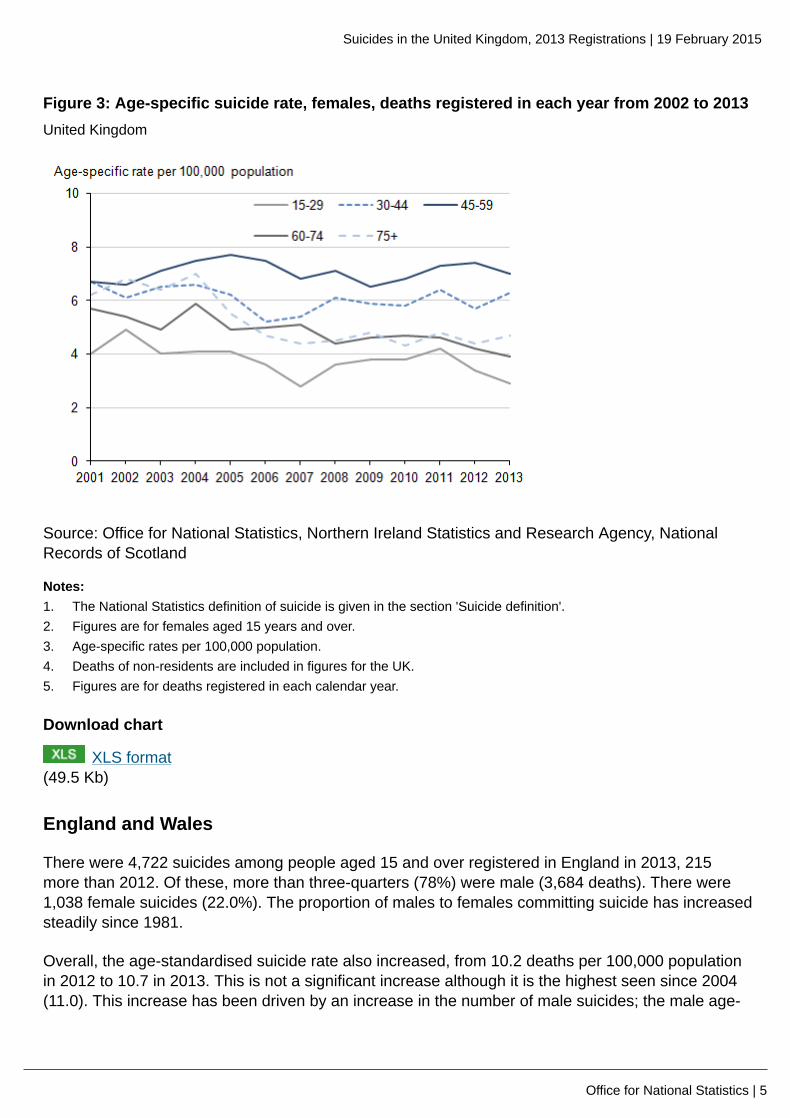
Female age-specific suicide rates remained relatively constant since 2008. Since 2002, the highestrate has been for those aged 45−59; in 2013 the rate for this group was 7.0 deaths per 100,000population. The lowest rate has been for those aged 15−29, where the 2013 rate was 2.9 deaths per100,000.
As with men, suicide is the leading cause of death among women aged between 20 and 34 years ofage in England and Wales, accounting for 12% of all deaths registered in this age group in 2013. Itis the third leading cause of death for those aged 35 to 49 in 2013 (6%). Further data on causes ofdeath can be found in the Death Register Series.
Suicides in the United Kingdom, 2013 Registrations | 19 February 2015
Office for National Statistics | 5
Figure 3: Age-specific suicide rate, females, deaths registered in each year from 2002 to 2013United Kingdom
Source: Office for National Statistics, Northern Ireland Statistics and Research Agency, NationalRecords of Scotland
Notes:1. The National Statistics definition of suicide is given in the section 'Suicide definition'.2. Figures are for females aged 15 years and over.3. Age-specific rates per 100,000 population.4. Deaths of non-residents are included in figures for the UK.5. Figures are for deaths registered in each calendar year.
Download chart
XLS format(49.5 Kb)
England and Wales
There were 4,722 suicides among people aged 15 and over registered in England in 2013, 215more than 2012. Of these, more than three-quarters (78%) were male (3,684 deaths). There were1,038 female suicides (22.0%). The proportion of males to females committing suicide has increasedsteadily since 1981.
Overall, the age-standardised suicide rate also increased, from 10.2 deaths per 100,000 populationin 2012 to 10.7 in 2013. This is not a significant increase although it is the highest seen since 2004(11.0). This increase has been driven by an increase in the number of male suicides; the male age-

Suicides in the United Kingdom, 2013 Registrations | 19 February 2015
Office for National Statistics | 6
standardised suicide rate increased from 16.2 deaths per 100,000 population in 2012 to 17.2 in2013, while the female rate remained constant at 4.6 deaths per 100,000 population.
There were 393 suicides in those aged 15 and over in Wales in 2013; this is a rise of 59 deathssince 2012. Between 2012 and 2013, the number of male suicides rose by 23% from 257 to 317,while the number of female suicides dropped very slightly from 77 to 76.
The age-standardised suicide rate for all persons has been increasing since 2009 and reached15.6 deaths per 100,000 population in 2013; this is the highest rate seen since 1982 (15.9). As withEngland, this is driven by the male population. The age-standardised suicide rate for males hasincreased significantly, from 18.8 in 2010 to 26.1 in 2013; this is the highest rate since 1981. Forfemales, the rate has remained fairly consistent over the past few years and in 2013 was 5.8 deathsper 100,000 population.
The male suicide rate in Wales has been significantly higher than the rate in England since 2010.In 2013, the Wales suicide rate was significantly higher than all English regions except for the NorthEast.
Registration delays in Wales decreased in 2013 whereas delays in England increased (see sectionon registration delays) so that more suicides that occurred in 2013 in Wales were registered in thatyear. Therefore, the higher suicide rate in Wales may partly be due to the deaths being registeredmore quickly rather than a real difference.
English regions
In 2013, the suicide rate was highest in the North East at 13.8 deaths per 100,000 population andlowest in London at 7.9 per 100,000 (see table 1). Reference table 5 shows that over the last 16years (1998 to 2013) suicide rates have tended to be highest in the North East, the North West andSouth West; the lowest rates tend to be in London and the East of England. The age-standardisedall persons rate of 7.9 deaths per 100,000 population in London in 2013 was the lowest rate of anyregion since 1981.

Suicides in the United Kingdom, 2013 Registrations | 19 February 2015
Office for National Statistics | 7
Table 1: Number of deaths and age-standardised suicide rate, by sex, country and region,England and Wales, deaths registered in 2013
Male Female Persons
Deaths Rate Deaths Rate Deaths Rate
England 3,684 17.2 1,038 4.6 4,722 10.7
NorthEast
229 22.1 66 5.9 295 13.8
NorthWest
567 20.0 148 5.0 715 12.3
Yorkshireand TheHumber
407 19.1 95 4.3 502 11.6
EastMidlands
307 16.7 77 4.0 384 10.2
WestMidlands
384 17.2 91 3.9 475 10.4
East ofEngland
353 14.9 103 4.1 456 9.4
London 395 12.4 121 3.7 516 7.9
SouthEast
627 18.0 193 5.2 820 11.4
SouthWest
415 19.0 144 6.3 559 12.5
Wales 317 26.1 76 5.8 393 15.6
Table source: Office for National Statistics
Table notes:1. The National Statistics definition of suicide is given below under 'Suicide definition'.2. Figures are for persons aged 15 years and over.3. Rates are age-standardised suicide rates per 100,000 population, standardised to the 2013 European Standard
Population.4. Figures are for persons usually resident in each area, based on boundaries as of November 2014.5. Figures are for deaths registered in 2013.
Download table
XLS format(53 Kb)

Suicides in the United Kingdom, 2013 Registrations | 19 February 2015
Office for National Statistics | 8
Methods of suicide
The two most common methods of suicide among men in the United Kingdom are ‘hanging,strangulation and suffocation’ (all grouped together under one code) followed by poisoning (figure4). This year, for the first time, the same pattern has been seen for women. Previously, the mostcommon method of suicide by women was poisoning.
For both men and women, the proportion of deaths from poisoning has fallen over the last 11 years,from 28% in 2002 to 20% in 2013 for men, and from 49% in 2002 to 38% in 2013 for women.Conversely, the proportion of suicides from ‘hanging, strangulation and suffocation’ has increasedover the same period, from 45% in 2002 to 56% in 2013 for men, and from 26% in 2002 to 40% in2013 for women. Drowning, falls and other methods have remained fairly consistent over the pastdecade.
Figure 4: Proportion of suicides by method and sex, United Kingdom, deaths registered in2013
Source: Office for National Statistics, Northern Ireland Statistics and Research Agency, NationalRecords of Scotland
Notes:1. The National Statistics definition of suicide is given in the 'Suicide definition' tab.2. Figures are for persons aged 15 years and over.3. Deaths of non-residents are included in figures for the UK.4. Figures are for deaths registered in 2013.

Suicides in the United Kingdom, 2013 Registrations | 19 February 2015
Office for National Statistics | 9
Download chart
XLS format(51.5 Kb)
A study by the World Health Organisation (WHO) in 2008, which compared methods of suicide bycountry, found that methods of suicide vary between countries, and that this difference is drivenprimarily by availability of means. For example, while hanging (suffocation) was the most commonmethod in the majority of countries, suicide by firearm was the most common method in the UnitedStates, and jumping from a height was the most common method in Hong Kong.
The report also highlighted differences in method between the sexes, with men tending to choosea more violent mechanism, such as hanging or suicide by firearm, whereas women choose lessviolent mechanisms such as poison.
The increase in the proportion of suicides from hanging seen in the UK, in particular in women, maybe related to restrictions on the availability of other methods, for example, drugs used in overdoseand to a misconception that hanging is a quick and painless way to die (Biddle et al, 2010).
Suicide definition
The National Statistics definition of suicide includes deaths given an underlying cause of intentionalself-harm or an injury/poisoning of undetermined intent. In England and Wales, it has beencustomary to assume that most injuries and poisonings of undetermined intent are cases where theharm was self-inflicted, but there was insufficient evidence to prove that the deceased deliberatelyintended to kill themselves (Adelstein and Mardon, 1975). This convention has been adopted acrossthe UK. However, this cannot be applied to children due to the possibility that these deaths werecaused by unverifiable accidents, neglect or abuse. Therefore, only persons aged 15 years and overare included in the suicide figures. Causes of death are coded using the International Classificationof Diseases, Tenth Revision (ICD-10) (World Health Organisation, 2010). These are the codes usedto define suicide:
International Classification of Diseases, Tenth Revision codes used to define suicide in theUnited Kingdom
ICD-10 code Description
X60–X84 Intentional self-harm
Y10–Y341 Injury/poisoning of undetermined intent
Y87.0 / Y87.22 Sequelae of intentional self-harm / injury /poisoning of undetermined intent
Table notes:1. Excluding Y33.9 where the coroner’s verdict was pending in England and Wales, up to 2006. From 2007, deaths
which were previously coded to Y33.9 are coded to U50.9.2. Y87.0 and Y87.2 are not included for England and Wales.

Suicides in the United Kingdom, 2013 Registrations | 19 February 2015
Office for National Statistics | 10
Download table
XLS format(27.5 Kb)
Age-standardised rates
This bulletin reports age-standardised rates for all ages taken together, and age-specific rates forbreakdowns by age group. Trends in rates take into account the changing size and age compositionof the population. For example, there were 4,129 male suicides registered in the UK in 1981 (anage-standardised mortality rate of 20.8 deaths per 100,000 population). In 2013, the number ofsuicides registered was higher at 4,858, but the suicide rate was significantly lower than in 1981, at19.0 deaths per 100,000.
Age-standardised rates are weighted using the European Standard Population (ESP), an artificialpopulation intended to facilitate comparisons across populations that may have different age andsex structures. Eurostat, the statistical office of the European Union, decided at the end of 2012to bring this population structure up-to-date. The 2013 ESP takes account of changes in the EUpopulation since the publication of the previous ESP in 1976.
All age-standardised rates in this bulletin have been calculated using the 2013 ESP, with revisionsprovided back to 1981. An ONS report examining the impact of the change in ESP on mortalitydata showed that rates for causes where deaths predominantly occur at older ages are significantlyhigher using the 2013 ESP compared with the 1976 ESP. This is because the larger number of olderpeople in the 2013 ESP exerts more influence on these rates than in the 1976 ESP. However, it isimportant to understand that any difference between death rates based on the old and new ESP ispurely methodological and does not indicate an actual increase in the previously published numbersof deaths or death rates.
The impact of the 2013 ESP on suicide rates has been small because many suicide deaths arein younger age groups. For the UK as a whole, the new rates in 1982 and 1983 were significantlyhigher than the old rates, while from 1984 onwards there were no significant differences between theage-standardised rates calculated using the 1976 and 2013 ESPs. When looking at the UK figuresby sex, there was no significant difference for males, and only one significant change for females (in1985). A similar pattern can be seen for England alone, and there were no significant changes forWales or the regions within England.
Registration delays
In common with most other UK mortality statistics, suicide figures are presented for deathsregistered in a particular calendar year, which enables figures to be published in a timely manner.The alternative would be to publish statistics based on the year in which the death occurred −however this would delay publication, cause repeated revisions to the figures for previous yearsand be inconsistent with other published mortality figures. Table 2 of the ONS publication MortalityMetadata presents figures on late registrations (for deaths from all causes).

Suicides in the United Kingdom, 2013 Registrations | 19 February 2015
Office for National Statistics | 11
The effect of publishing figures based on year of registration is that, due to late registrations,many suicide deaths appear in the statistics of a year which is later than the year when the deathactually occurred. Differences in the death registration systems in England and Wales, Scotlandand Northern Ireland mean that the level of registration delays vary between countries, which hasimplications for the comparability of mortality statistics across the UK. That is, the UK suicide figuresfor deaths registered in 2013 will comprise deaths occurring in different time periods for differentcountries of the UK. However, as suicide trends tend to change relatively slowly over time, this isunlikely to have a great impact on the usability of UK suicide statistics.
Figure 5 shows that in 2013 the average (median) registration delay for suicides in England was 168days. Of the 4,722 suicides in England registered in 2013, 51% occurred before 2013. In England,the average registration delay has gradually increased over time.
For Wales, the average (median) registration delay for suicides was 143 days in 2013. Out of the393 suicides in Wales registered in 2013, 38% occurred before 2013. The average registration delaygradually increased between 2001 and 2009 and has remained relatively constant since then.
In Northern Ireland, average registration delays for suicides peaked in 2005 at 334 days, but haddecreased sharply to 138 days by 2012, and was 141 days in 2013. 52% of suicides registered inNorthern Ireland in 2013 also occurred in 2013.
In 2013, the average registration delay in Scotland was just 7 days. Although the registration delayhas increased slightly since 2001, 96.7% of suicides registered in Scotland in 2013 also occurred in2013.

Suicides in the United Kingdom, 2013 Registrations | 19 February 2015
Office for National Statistics | 12
Figure 5: Median registration delay for suicides, deaths registered in each year from 2001 to2013United Kingdom
Source: Office for National Statistics, Northern Ireland Statistics and Research Agency, NationalRecords of Scotland
Notes:1. The National Statistics definition of suicide is given below under ‘Suicide definition’.2. Figures are for persons aged 15 years and over.3. The registration delay is calculated as the difference between the date each death occurred and the date it
was registered, measured in days. Additional information on the calculation of registration delays is providedBackground Note 7
4. Figures are for deaths registered in each calendar year.5. Figures include deaths of non-residents.
Download chart
XLS format(54 Kb)
Additional information on registration delays for suicides, including separate figures for males andfemales, and an indication of the range of registration delays (the lower and upper quartile) can befound in reference table 16. Information on registration delays for a range of causes in England andWales in 2011 can be found on the ONS website.

Suicides in the United Kingdom, 2013 Registrations | 19 February 2015
Office for National Statistics | 13
Further analysis has been carried out on the England and Wales data for 2001 to 2012 based onthe date the suicide occurred, to test whether the registration delays observed made any significantdifference to the findings. For England and Wales combined, and both countries separately,there was no significant difference between the rates produced using suicide registrations andoccurrences in any of the years. There were also no significant differences in results for any of theyears, when analysed by sex or broad age group.
The time trend in suicide rates was very similar whether using date of registration or of occurrence.The main difference is that the occurrence-based trend appears slightly shifted to the left incomparison, this is expected as the deaths occurred before they were registered. When looking atoccurrence data, the suicide rate in 2006 is slightly lower, whilst the rate in 2007 is slightly higherthan with registration data. As the two rates are more similar, this suggests that the change in thetrend in suicides may have occurred in 2006 rather than 2007 (based on England and Wales dataonly).
When considering the percentage of hard-to-code narrative verdicts (see next section) in Englandand Wales, there is a small difference when using the occurrence data instead of the registrationdata. This reflects the fact that hard-to-code narratives tend to be those cases with longerregistration delays.
Narrative verdicts in England and Wales
There are around 30,000 coroner’s inquests held in England and Wales each year that concludewith a verdict (now ‘conclusions’ following implementation of reforms to the coronial system inEngland and Wales − Coroners and Justice Act, 2009). In 2013, 88% of these inquests concludedwith a ‘short form’ verdict such as accident, misadventure, natural causes, suicide or homicide. Theremaining 12% were ‘narrative verdicts’ which can be used by a coroner or jury instead of a shortform verdict to express their conclusions as to the cause of death. A narrative verdict can be given ina range of different circumstances, and for a variety of causes of death (see table 2).

Suicides in the United Kingdom, 2013 Registrations | 19 February 2015
Office for National Statistics | 14
Table 2: Number of narrative verdicts, by underlying cause of death, England and Wales,deaths registered in 2013
Underlying cause ofdeath
Hard-to-codenarrative verdict
Other type ofnarrative verdict
All narrative verdicts
All causes 2,405 1,528 3,933
Diseases 1,211 654 1,865
Neoplasms 268 178 446
Circulatory 255 180 435
Respiratory 98 55 153
Digestive system 161 79 240
Other disease orcondition
429 162 591
External causes 1,194 874 2,068
Transport accidents 123 44 167
Other accidents 1,006 242 1,248
Intentional self-harm 0 236 236
Undetermined intent 0 251 251
Other external cause 65 101 166
Table source: Office for National Statistics
Table notes:1. Underlying cause of death was defined using the International Classification of Diseases, Tenth Revision (ICD–10)
codes shown in Background Note 8.2. Figures include deaths of non-residents.3. Figures are for deaths registered in 2013.
Download table
XLS format(56 Kb)
In 2013, 53% of narrative verdicts in England and Wales resulted from an external cause ofdeath (an injury or poisoning) rather than a disease. Some of these narrative verdicts clearlystate the intent (for example, accidental) and mechanism (for example, hanging, poisoning) ofdeath. However, in some cases, the coroner may not indicate clearly whether the fatal injury wasaccidental, or if there was deliberate intent to self-harm, or if intent could not be determined. ONS

Suicides in the United Kingdom, 2013 Registrations | 19 February 2015
Office for National Statistics | 15
defines deaths where the intent has not been specified as ‘hard-to-code’. The rules for coding causeof death mean that, if no indication of intent has been given by the certifier, a death from injury orpoisoning must be coded as accidental.
Table 3: Hard-to-code narrative verdicts as a percentage of all inquest verdicts, England,regions in England, and Wales, deaths registered in each year from 2006 to 2013
Percentage
2006 2007 2008 2009 2010 2011 2012 2013
England 6 8 9 10 12 6 7 8
NorthEast
4 6 6 7 8 2 3 3
NorthWest
5 8 11 13 15 6 7 7
Yorkshireand TheHumber
7 9 9 10 10 9 11 10
EastMidlands
4 6 6 8 11 5 8 10
WestMidlands
15 17 17 16 20 8 8 8
East ofEngland
5 7 8 13 13 10 11 12
London 5 6 8 8 8 6 6 8
SouthEast
5 6 7 6 8 5 5 7
SouthWest
4 6 7 8 8 5 6 7
Wales 3 7 9 8 8 4 5 4
Table source: Office for National Statistics
Table notes:1. Number of narrative verdicts defined by ONS as hard-to-code. 2. Figures are for persons usually resident in each area, based on boundaries as of November 2014.3. Figures are for deaths registered in each calendar year.
Download table
XLS format(53.5 Kb)

Suicides in the United Kingdom, 2013 Registrations | 19 February 2015
Office for National Statistics | 16
Between 2001 and 2010, there were large year-on-year increases in the number of narrativeverdicts returned by coroners in England and Wales (reference table 13). The number of hard-to-code narrative verdicts registered in England in 2010 (3,170) was almost double the numberregistered in 2006 (1,592). In Wales, the number increased almost three-fold over the same period,from 52 in 2006 to 147 in 2010.
There is considerable variation in the use of narrative verdicts between coroners and thereforebetween regions (see table 3). Carroll, et al (2011) found that in the 10 English coroners’jurisdictions where the highest proportion of ‘other’ verdicts were given, the incidence of suicidedecreased by 16% between 2001–02 and 2008–09, whereas it did not change in areas served bythe 10 coroners who used narratives the least.
Following improvements by ONS in 2011 in the coding of narrative verdicts, the number of hard-to-code verdicts decreased between 2010 and 2011 by 46% in England (from 3,170 to 1,727) and by49% in Wales (from 147 to 75). It rose again slightly from 2012 in England (though not in Wales). In2013, the lowest percentage of hard-to-code verdicts occurred in North East England at 2.9%, whilethe highest was in East of England at 11.6%.
An analysis to assess the impact of narrative verdicts on suicide rates in England and Wales wasundertaken by ONS in 2011 (Hill and Cook, 2011). Simulated age-standardised suicide rates werecalculated for the years 2001 to 2009 using two different assumptions:
• Scenario 1: suicide rates were calculated assuming all deaths where a hard-to-code narrativeverdict meant that the death been coded as an accidental hanging (ICD-10 codes W75–W76) oraccidental poisoning (ICD-10 codes X40–X49) were intentional self-harm.
• Scenario 2: suicide rates were calculated assuming that half of these deaths were intentionalself-harm. This is more likely than Scenario 1.
The results showed that, between 2001 and 2009, there were no statistically significant differencesbetween the published and simulated suicide rates at national level. These analyses have beenrepeated annually for deaths registered in 2010 onwards (Suicides in the United Kingdom, 2012,2013, 2014). ONS has now repeated the Scenario 1 analysis using the latest figures for regions ofEngland, and for Wales (see background note 6).
Table 4 shows the results of adding all accidental hangings and poisonings from hard-to-codenarrative verdicts with existing suicides (Scenario 1), for regions of England, and Wales in 2013.This can be compared with the actual rates shown in table 1. As expected, the rates are slightlyhigher, however, there is no significant difference except for England, for all persons, where the rateincreased from 10.7 deaths per 100,000 population to 11.5 deaths per 100,000.
When half of the accidental hangings and poisonings are added to existing suicides for 2013(Scenario 2) there is no significant change to the rates, for males or females, for any region.

Suicides in the United Kingdom, 2013 Registrations | 19 February 2015
Office for National Statistics | 17
Table 4: Simulated suicide rates – Scenario 1, by sex and region, England and Wales, deathsregistered in 2013
Males Females Persons
Deaths Rate Deaths Rate Deaths Rate
England 3,925 18.2 1,154 5.1 5,079 11.5
NorthEast
237 22.9 71 6.3 308 14.4
NorthWest
601 21.2 166 5.6 767 13.2
Yorkshireand TheHumber
433 20.3 119 5.4 552 12.7
EastMidlands
332 18.0 84 4.4 416 11.0
WestMidlands
406 18.2 101 4.3 507 11.1
East ofEngland
390 16.5 119 4.8 509 10.4
London 424 13.3 136 4.1 560 8.6
SouthEast
659 18.9 206 5.6 865 12.0
SouthWest
443 20.4 152 6.6 595 13.3
Wales 330 27.2 79 6.0 409 16.3
Table source: Office for National Statistics
Table notes:1. Underlying cause of death was defined using the International Classification of Diseases, Tenth Revision (ICD–10).2. Suicide rates were calculated assuming all deaths where a hard-to-code narrative verdict meant that the death
been coded as an accidental hanging (ICD-10 codes W75–W76) or accidental poisoning (ICD-10 codes X40–X49) were intentional self-harm. These deaths were then added to the number of suicides (see ‘Suicide definition’section) in order to calculate simulated suicide rates.
3. Figures are for persons aged 15 years and over.4. Age-standardised rates per 100,000 population, standardised to the European Standard Population 2013.5. Figures are for persons usually resident in each area, based on boundaries as of November 2014.6. Figures are for deaths registered in 2013.

Suicides in the United Kingdom, 2013 Registrations | 19 February 2015
Office for National Statistics | 18
Download table
XLS format(55 Kb)
Use of the statistics
Suicide statistics provide an indicator of mental health and are important for monitoring trends indeaths resulting from intentional (and probable) self-harm. The statistics are widely used to informpolicy, planning and research in both the public and private sector and they enable policy makersand support services to target their resources most effectively. Key users include the Department ofHealth and devolved health administrations, public health organisations, local and health authorities,academics, and charity organisations.
Policy context
Barr et al (2012) carried out a time trend analysis in England which suggested that the recentrecession in the UK could be an influencing factor in the increase in suicides. They found that localareas with greater rises in unemployment had also experienced higher rises in male suicides.
A review by the Samaritans (2012) emphasised that middle-aged men in lower socioeconomicgroups are at particularly high risk of suicide. They pointed to evidence that suicidal behaviourresults from the interaction of complex factors such as unemployment and economic hardship, lackof close social and family relationships, the influence of a historical culture of masculinity, personalcrises such as divorce, as well as a general ‘dip’ in subjective wellbeing among people in their mid-years, compared to both younger and older people.
Each constituent country of the UK has a suicide prevention strategy in place which aims to identifyrisk factors, take action via cross-sector organisations, and reduce suicide rates.
In September 2012, the Department of Health launched ‘Preventing Suicide in England: a cross-government outcomes strategy to save lives’. This strategy aims to reduce the suicide rate andimprove support for those affected by suicide and was informed by an earlier consultation onpreventing suicide in England. The new strategy outlines six areas for action including: reducingthe risk of suicide in key high-risk groups (for example, people in the care of mental health services,people with a history of self-harm, people in contact with the criminal justice system, and men agedunder 50); reducing access to the means of suicide; and supporting research, data collection andmonitoring.
The Welsh Assembly Government published ‘Talk to Me: The National Action Plan to ReduceSuicide and Self Harm in Wales, 2009–2014’. A follow up strategy called ‘Talk to Me 2’ has nowbeen put out for consultation to gather views about the content and priorities of a draft Strategyand Action Plan. It aims to promote, coordinate and support plans and programmes for theprevention of suicidal behaviours and self harm via collaborative work across statutory and thirdsector organisations. There are six objectives: awareness raising, responses to crisis and earlyintervention, information and support for the bereaved, supporting the media in responsible

Suicides in the United Kingdom, 2013 Registrations | 19 February 2015
Office for National Statistics | 19
reporting, reducing access to the means of suicide and supporting learning information andmonitoring systems to improve understanding of suicide and self harm.
In Scotland, following a 10-year ‘Choose Life’ suicide prevention strategy and action plan launchedin 2002, a summary of progress to date and recommendations for the final phase of the strategyare reported in ‘Refreshing the National Strategy and Action Plan to Prevent Suicide in Scotland’,published by the Scottish Government in 2010. In 2013, the ‘Scottish Government: SuicidePrevention Strategy 2013–2016’ was launched. The key themes are: responding to people indistress, talking about suicide, improving the NHS response to suicide, developing the evidencebase and supporting change and improvement.
In 2006, the Department of Health, Social Services and Public Safety in Northern Ireland (DHSSPS)published ‘Protect Life: A Shared Vision – The Northern Ireland Suicide Prevention Strategy andAction Plan, 2006–2011’. The strategy includes two targets: to obtain a 10% reduction in theoverall suicide rate by 2008, and reduce the overall suicide rate by a further 5% by 2011. The aim,objectives and approach are similar to those in other UK countries and specific actions focussingon both the general population and the target population are also highlighted. In 2012, the strategywas refreshed to cover the period 2011 to March 2014 and the DHSSPS published an evaluationof the original ‘Protect Life’ strategy. It showed that there has been strong support and commitmentto the Strategy. Progress has been made in a number of areas, however the issue of suicide hasnot diminished, with a need still for both crisis response and preventative interventions, especiallyfollowing the recent economic downturn.
People with mental illness have a higher suicide risk than the general population (Windfur andKapur, 2011). A National Confidential Inquiry into Suicide and Homicide by People with MentalIllness was set up to help reduce this risk. The recommendations of this project could assist healthprofessionals and policymakers improve patient safety and reduce the suicide risk of individualswho are in contact with mental health services. The most recent annual report from the ConfidentialInquiry was published in July 2014.
Comparison with other countries
It is not always possible to compare UK suicide statistics with those of other countries becauseof differences in the way suicide is defined and recorded. For example, deaths from injuries andpoisonings of undetermined intent are included in UK suicide figures, (as well as deaths fromintentional self-harm). This is because in the UK we assume that these deaths were self-inflicted, butthere was insufficient evidence to prove that the deceased deliberately intended to kill themselves(Adelstein and Mardon, 1975). This cannot be assumed for child deaths, and so UK suicide figuresroutinely only include persons aged 15 years and over (although data for children aged ten andover are available on request). However, many other countries, including Canada, United Statesand France, use a narrower definition that does not include deaths from injuries and poisonings ofundetermined intent, and do report on deaths of children aged between 10 and 14. The AustralianBureau of Statistics uses a similar definition to these countries, but does not routinely report onsuicides of children under the age of 15.
Suicide figures published by Eurostat for European countries are based on a broadly comparabledefinition of deaths from intentional self-harm only. These are available for all ages and rates for

Suicides in the United Kingdom, 2013 Registrations | 19 February 2015
Office for National Statistics | 20
males and females are age-standardised to the European Standard Population. Age-specific (or‘crude’) rates for particular age groups are also available.
Suicide figures published by the World Health Organization (WHO) use official figures madeavailable to WHO by its member states. These are based on actual death certificates signed bylegally authorised personnel, usually doctors and, to a lesser extent, police officers. Although theyare not all directly comparable or timely, the suicide figures published by the WHO give an overallperspective of the extent of suicide deaths around the world.
Suicide data available
Suicide figures for the UK, England and Wales, England, Wales and regions of England, and resultsfrom the analysis of the impact of hard-to-code narrative verdicts returned by coroners in Englandand Wales, can be found in a Microsoft Excel workbook by clicking on the ‘data section for thispublication’ link.
The workbook contains:
• age-standardised suicide rates per 100,000 population (with 95% confidence limits) and numbersof suicides: by sex, for the UK, England and Wales, England, regions of England and Wales,deaths registered in each year from 1981 to 2013
• age-specific suicide rates per 100,000 population (with 95% confidence limits) and numbers ofsuicides: by sex and five-year age group, for the UK, England and Wales, England, and Wales,deaths registered in each year from 1981 to 2013
• age-specific suicide rate for broad age groups (with 95% confidence intervals): for males andfemales, United Kingdom, deaths registered in each year from 1981 to 2013
• number of narrative verdicts: by underlying cause of death, England and Wales, deathsregistered in 2013
• number of narrative verdicts: by sex, for England and Wales and regions of England, deathsregistered in each year from 2001 to 2013
• simulated age-standardised suicide rates per 100,000 population (with 95% confidence limits): bysex, for England and Wales and regions of England, deaths registered in each year from 2001 to2013
• median registration delays (and the lower and upper quartiles) in England and Wales, Scotlandand Northern Ireland, deaths registered in each year from 2001 to 2013
References
1. Adelstein A and Mardon C (1975) ‘Suicides 1961–1974’, Population Trends 02, 13–18.
2. Australian Bureau of Statistics (2011) ‘Causes of death, Australia, 2011, Explanatory Notes’.Accessed on 13 January 2015
3. Biddle L, Donovan J, Owen-Smith A, Potokar J, Longson D, Hawton K, Kapur N, Gunnell D(2010) ‘Factors influencing the decision to use hanging as a method of suicide: qualitative study’.British Journal of Psychiatry, 197: 320–325.

Suicides in the United Kingdom, 2013 Registrations | 19 February 2015
Office for National Statistics | 21
4. Barr B, Taylor-Robinson D, Scott-Samuel A, McKee M, Stuckler D (2012) ‘Suicides associatedwith the 2008-10 economic recession in England: time trend analysis’. BMJ 2012;345:e5142.Accessed on 13 January 2015
5. Centres for Disease Control and Prevention (2014) ‘National suicide statistics at a glance: trendsin suicide rates among persons ages 10 years and older, by sex, United States, 1991–2009’.Accessed on 13 January 2015
6. Coroners’ and Justice Act 2009. Accessed on 13 January 2015
7. Department of Health (2012) 'Preventing suicide in England: A cross-government outcomesstrategy to save lives'. Accessed on 13 January 2015
8. Department of Health, Social Services and Public Safety (2006) Protect Life – A Shared Vision:The Northern Ireland Suicide Prevention Strategy and Action Plan 2006-2011. Accessed on 13January 2015
9. Department of Health, Social Services and Public Safety (2012) Evaluation of the Implementationof the NI Protect Life Suicide Prevention Strategy and Action Plan 2006–2011. Moore Stephens.
Accessed on 13 January 2015
10. Eurostat (2010) File:Deaths from suicide — standardised death rate, 2010 (1) (per 100 000inhabitants) YB14 II.png. Accessed on 13 January 2015
11. General Register Office Scotland, (2014) ‘Probably suicides: deaths which are the result ofintentional self harm or events of undetermined intent, 2012’. Accessed on 13 January 2015
12. Hill C and Cook L (2011) Narrative verdicts of their impact on mortality statistics in England andWales, Health Statistics Quarterly 49, 81 -100 (197.6 Kb Pdf). Accessed on 13 January 2015
13. Institut national de la santé et de la recherche médicale (2009) ‘Etudes et resultats: La mortalitepar suicide en France en 2006’. Accessed on 13 January 2015
14. Northern Ireland Statistics and Research Agency (2013) ‘Suicide Deaths 2013’. Accessed on 13January 2015
15. Office for National Statistics (2011) ‘Impact of registration delays on mortality statistics, 2011’.Accessed on 13 January 2015
16. Office for National Statistics (2014) ‘Mortality Metadata’. Accessed on 13 January 2015
17. Office for National Statistics (2012) ‘Suicides in the United Kingdom, index page’. Accessed on19 January 2015
18. Office for National Statistics (2014) ‘The impact of using the 2013 European Standard Populationto calculate mortality and cancer incidence rates’. Accessed on 13 January 2015

Suicides in the United Kingdom, 2013 Registrations | 19 February 2015
Office for National Statistics | 22
19. Office for National Statistics (2014) Mortality Statistics: Deaths Registered in England and Wales(Series DR), 2013. Accessed on 17 February 2014
20. R. Carroll, K. Hawton, N. Kapur, O. Bennewith, D. Gunnell (2011) ‘Impact of the growing useof narrative verdicts by coroners on geographic variations in suicide: analysis of coroners’ inquestdata’. Journal of Public Health | Vol. 34, No. 3, 447–453
21. Samaritans (2012) ‘Men, Suicide and Society: Why disadvantaged men in mid-life die bysuicide’. Accessed on 13 January 2015
22. Scottish Executive (2002) Choose life: Making it work together – A National Strategy and ActionPlan to Prevent Suicide in Scotland, The Stationery Office Bookshop: Edinburgh. Accessed on 13January 2015
23. The Scottish Government (2010) Refreshing the national strategy and action plan to preventsuicide in Scotland: Report of the national suicide prevention working group. Accessed on 13January 2015
24. The Scottish Government (2013) Scottish Government: Suicide Prevention Strategy 2013–2016.Accessed on 13 January 2015
25. Statistics Canada (2012) ‘Suicides and suicide rate, by sex and age group’. Accessed on 13January 2015
26. University of Manchester (2014) 'The National Confidential Inquiry into Suicide and Homicide byPeople with Mental Illness Annual Report: England, Wales, Scotland, and Northern Ireland' – July2014. Accessed on 13 January 2015
27. Welsh Assembly Government (2009) Talk to me: The National Action Plan to Reduce Suicideand Self harm in Wales 2009–2014. Accessed on 13 January 2015
28. Welsh Assembly Government (2009) Talk to me 2. Accessed on 13 January 2015
29. Windfur K and Kapur N (2011) ‘Suicide and mental illness: a clinical review of 15 years findingsfrom the UK National Confidential Inquiry into Suicide’. British Medical Bulletin 100, 101–121.Accessed on 27 January 2015
30. World Health Organisation – WHO (2010) International Statistical Classification of Diseases andRelated Health Problems, volumes 1, 2 and 3 (Tenth Revision). WHO: Geneva. Accessed on 13January 2015
31. World Health Organisation – WHO (2008) – Ajdacic-Gross, V., Weiss, M. G., Ring, M., Hep, U.,Bopp, M., Gutzwiller, G., Rossler, W., ‘Methods of suicide: international suicide patterns derivedfrom the WHO mortality database’, Volume 86, Number 9, September 2008. Accessed on 13January 2015

Suicides in the United Kingdom, 2013 Registrations | 19 February 2015
Office for National Statistics | 23
32. World Health Organisation – WHO. ‘Suicide data’. Accessed on 13 January 2015
Background notes
1. Sources of data
The Office for National Statistics holds mortality data for England and Wales. Figures for the UKinclude data kindly provided by National Records of Scotland (formerly the General RegisterOffice for Scotland) and the Northern Ireland Statistics and Research Agency.
2. Mortality metadata
Information about the underlying mortality data, including details on how the data is collectedand coded are available in the mortality metadata.
3. Calculation of UK suicide rates
This bulletin presents age-standardised (also known as ‘directly-standardised’) rates,standardised to the 2013 European Standard Population (ESP). These are presented assuicides per 100,000 population. Age-standardised rates make allowances for differences in theage structure of the population, over time and between sexes. The age-standardised rate for aparticular cause of death is that which would have occurred if the observed age-specific rates forthat cause had applied in the given standard population. Suicide rates for particular age groups(for example, figures 2 and 3) are age-specific rates. A template demonstrating how to calculateage-standardised rates using both the 1976 ESP and the 2013 ESP can be found on the ONSwebsite.
4. Confidence IntervalsWithin this bulletin, a difference which is described as ‘significant’ has been assessed using95% confidence intervals. Confidence intervals are a measure of the statistical precision of anestimate and show the range of uncertainty around the estimated figure. Calculations basedon small numbers of events are often subject to random fluctuations. As a general rule, if theconfidence interval around one figure overlaps with the interval around another, we cannot saywith certainty that there is more than a chance difference between the two figures.
5. Coroners’ statistics
Coroners’ statistics (including statistics on the verdicts returned at inquests) are available fromthe Gov.uk website.
6. Regional analysis of narrative verdicts
The analysis of regional variations in the use of narrative verdicts, and the calculation of regionalsimulated suicide rates were based on the country/region of usual residence of the deceased.Please note that boundaries for coroner district areas are not aligned with regional boundaries(that is, they are not coterminous), so it is possible that narrative verdicts returned by anindividual coroner may fall within more than one region.
7. Differences among UK death registration systems

Suicides in the United Kingdom, 2013 Registrations | 19 February 2015
Office for National Statistics | 24
In England and Wales, all suicides are certified by a coroner following an inquest. The deathcannot be registered until the inquest is completed, which can take months or even years,and ONS is not notified that a death has occurred until it is registered. The only exception tothis is when someone will be charged in relation to a death − in this instance the coroner mustadjourn the inquest, and they may carry out an ‘accelerated registration’. The full details of thesedeaths are not recorded until the inquest is completed, but the majority are eventually coded asassaults and therefore would not be included in the suicides data.
The death registration system in Northern Ireland is similar to that used in England and Wales,in that all suspected suicides are referred to the coroner. The family of the deceased may alsoask for an inquest and if one has been held, the registrar will register the death on receipt ofthe coroner's report. If there is no inquest the General Register Office (GRO) will write to thedeceased’s family (or other informant) to ask them to register the death. However, if the deathis not registered within a year of its occurrence, GRO are able to register the death on theauthority of the Registrar General.
In Scotland, a death must be registered within eight days. The Procurator Fiscal has a duty toinvestigate all sudden, suspicious, accidental, unexpected or unexplained deaths and any deathoccurring in circumstances that give rise to serious public concern, and a Fatal Accident Inquirymay follow. If the results of toxicological tests or a post mortem are not yet known, the cause ofdeath can be given as ‘unascertained, pending investigations’, and the actual cause of deathwill be entered at a later date. Therefore National Records of Scotland (NRS) receive notificationof deaths more quickly than ONS and the Northern Ireland Statistics and Research Agency(NISRA).
However, although NRS may know what caused the death (for example, hanging, poisoning),they may not be told whether it was due to an accident, assault or intentional self-harm untilafter the statistical database has been ‘frozen’ for the year. So NRS may have to code thedeath as an event of undetermined intent, which would be counted as a probable suicide.Consequently, Scotland has proportionally more deaths coded as being due to events ofundetermined intent (and hence as probable suicides), compared with England, Wales andNorthern Ireland.
8. Calculation of registration delays
Figure 5 presents data on the length of time taken to register a death (also known as theregistration delay) for suicides. This is calculated as the difference between the date eachdeath occurred and the date it was registered, measured in days. Data where the exact date ofdeath was unknown or the date of death was more than 11 years before date of registration orwhere either the date of death or date of registration was clearly recorded incorrectly (that is, thedeath appeared to have been registered before it occurred) were excluded from this analysis.Approximately 0.01% of the data were excluded for these reasons.
Analysis showed that the data was positively skewed, and contained some deaths with verylong registration delays. Therefore, the registration delay has been presented using the medianvalue, as this is not influenced by extreme values. The median is defined as is the middle valueif the delays were sorted by size. The lower and upper quartiles are also presented in reference

Suicides in the United Kingdom, 2013 Registrations | 19 February 2015
Office for National Statistics | 25
table 16 to give an indication of the spread of registration delays that are found with suicides.The lower quartile is the smallest values below which 25% of the values lie; the upper quartile isthe smallest values below which 75% of the values lie.
9. Cause of death categories for narrative verdicts
Cause ICD-10 Code
All causes A00–R99, U50.9, V00–Y89
Diseases A00–R99
Neoplasms C00–D48
Circulatory I00–I99
Respiratory J00–J99
Digestive system K00–K93
Other disease or condition All other codes in the range A00–R99 notincluded above
External causes V00–Y89, and U50.9
Transport accidents V00–V99
Other accidents W00–X59
Intentional self-harm X60–X84
Undetermined intent Y10–Y34
Other external cause All other codes in the range V00–Y89, andU50.9
Download table
XLS format(19.5 Kb)
10. Coding changes
Several changes were introduced in 2011 that could have affected suicide statistics. In respectof narrative verdicts, an advice note was issued to coroners explaining what informationis required in a narrative verdict to help ONS code cause of death using the InternationalClassification of Diseases. Also, additional guidance was given to the ONS coding team toimprove coding of narrative verdicts. Finally, an update of the ICD-10 software (version 2010)was introduced in the UK, which included a rule change that affected deaths coded as an eventof undetermined intent. These changes were outlined in more detail in the statistical bulletinSuicides in the UK, 2011, which is available on the ONS website.
11. Special extractsSpecial extracts and tabulations of suicide data (and data for other causes of mortality) forEngland and Wales are available to order (subject to legal frameworks, disclosure control,

Suicides in the United Kingdom, 2013 Registrations | 19 February 2015
Office for National Statistics | 26
resources and agreement of costs, where appropriate). Such requests or enquiries should bemade to:
Mortality Analysis Team
Life Events and Population Sources Division
Office for National Statistics
Government Buildings
Cardiff Road
Newport NP10 8XG
Tel: +44 (0)1633 651958
Email: [email protected]
The ONS charging policy can be found on the ONS website.
12. Life Events user feedback
As a user of our statistics, we would welcome your feedback on this publication. Please get intouch either via email at [email protected] or telephone on +44 (0)1633 651958.
13. Revisions
The ONS revisions policy is available on our website.
14. Pre-release access
A list of the names of those given pre-publication access to the statistics and writtencommentary is available in the pre-release access list for Suicide in the United Kingdom 2013.The rules and principles which govern pre-release access are featured within the pre-releaseAccess to Official Statistics Order 2008.
15. National StatisticsNational Statistics are produced to high professional standards set out in the Code of Practicefor Official Statistics. They undergo regular quality assurance reviews to ensure that they meetcustomer needs. They are produced free from any political interference.
© Crown copyright 2015.
16. Terms and conditions
You may re-use this document/publication (not including logos) free of charge in anyformat or medium, under the terms of the Open Government Licence v3.0; or write to theInformation Policy Team, The National Archives, Kew, Richmond, Surrey, TW9 4DU; or email:[email protected]. Where we have identified any third party copyright informationyou will need to obtain permission from the copyright holders concerned. This document/publication is also available on the ONS website.

Suicides in the United Kingdom, 2013 Registrations | 19 February 2015
Office for National Statistics | 27
17. Social Media
Follow ONS on Facebook and Twitter or view our podcasts on YouTube.
18. Journalists
If you are a journalist covering a suicide-related issue, please consider following Samaritans’media guidelines on the reporting of suicide, due to the potentially damaging consequences ofirresponsible reporting. In particular, the guidelines advise including links to sources of supportfor anyone affected by the themes in the article, such as Samaritans.
19. Where to go for help
If you are struggling to cope, please call Samaritans on 08457 90 90 90 (UK) 1850 60 90 90(ROI), email [email protected], or visit the Samaritans website to find details of the nearestbranch. Samaritans is available round the clock, every single day of the year, providing a safeplace for anyone struggling to cope, whoever they are, however they feel, whatever life hasdone to them.
Resources are also available online: ‘U can Cope’ includes a film and resources that aredesigned for people in distress and those trying to support them, to instil hope, promoteappropriate self-help and inform people regarding useful strategies and how they can accesshelp and support; 'Staying safe if you’re not sure life’s worth living' includes practical,compassionate advice and many useful links for people in distress.
20. Details of the policy governing the release of new data are available by visitingwww.statisticsauthority.gov.uk/assessment/code-of-practice/index.html or from the MediaRelations Office email: [email protected]
Copyright
© Crown copyright 2015
You may use or re-use this information (not including logos) free of charge in any formator medium, under the terms of the Open Government Licence. To view this licence, visitwww.nationalarchives.gov.uk/doc/open-government-licence/ or write to the Information Policy Team,The National Archives, Kew, London TW9 4DU, or email: [email protected].
This document is also available on our website at www.ons.gov.uk.
Statistical contacts
Name Phone Department EmailDani Evans +44 (0)1633 651958 Mortality Analysis

Suicides in the United Kingdom, 2013 Registrations | 19 February 2015
Office for National Statistics | 28
Issuing Body:Office for National Statistics
Media Contact Details:Telephone: 0845 604 1858(8.30am-5.30pm Weekdays)
Emergency out of hours (limited service): 07867 906553
Email:[email protected]