Prisons and Jails Chapter 12 & 13 In Your Textbook John Massey Criminal Justice.
By Christopher J. MumolaBJS Policy Analyst
Data from new Bureau of JusticeStatistics (BJS) data collections offerthe first opportunity to analyze thepersonal characteristics, currentoffenses, and environmental factorssurrounding inmate deaths in local jailsand State prisons nationwide.
To implement the Death in CustodyReporting Act of 2000 (PL 106-297),BJS began collecting inmate deathrecords from all local jails in 2000 andexpanded reporting to include Stateprisons in 2001. In this first report fromthe Deaths in Custody ReportingProgram, data from 2000 to 2002highlight inmate and facility character-istics related to high risks of suicideand homicide.
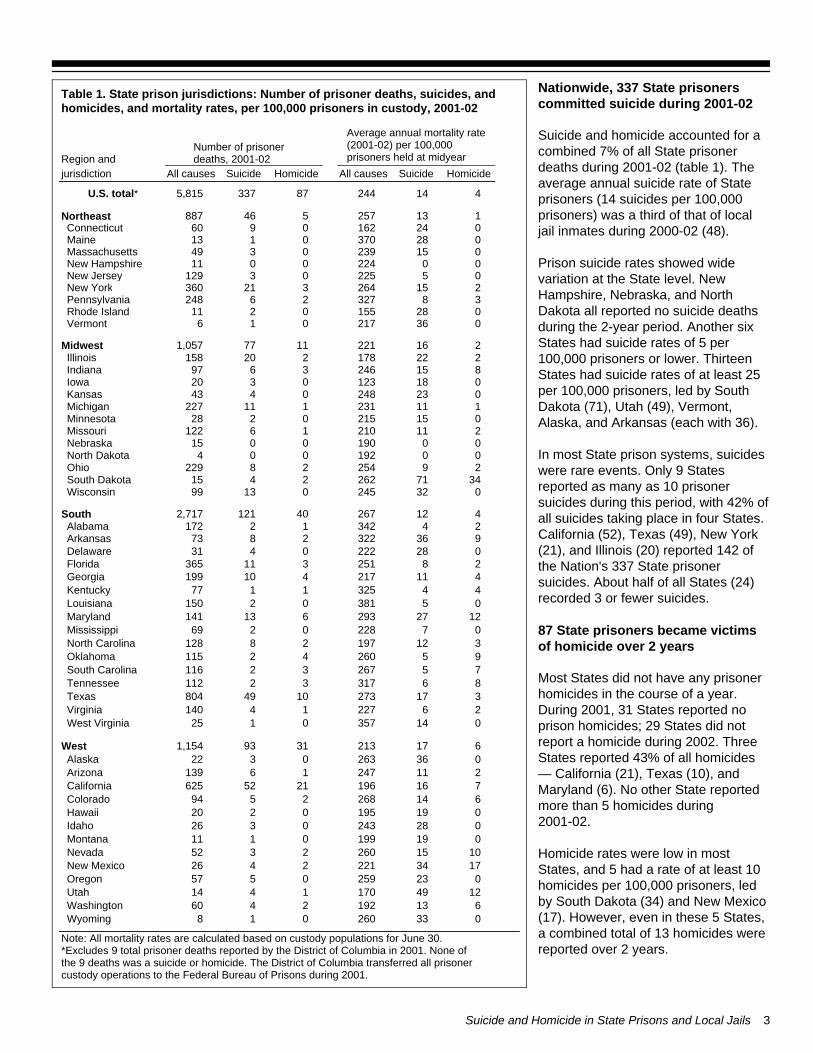
Jail suicide rates declined steadily from129 per 100,000 inmates in 1983 to 47per 100,000 in 2002. In 1983 suicideaccounted for the majority of jail deaths(56%), but by 2002, the most commoncause of jail deaths was naturalcauses (including AIDS) (52%), wellahead of suicides (32%). Suicide ratesin State prison fell from 34 per 100,000in 1980 to 16 per 100,000 in 1990, andhave since stabilized.
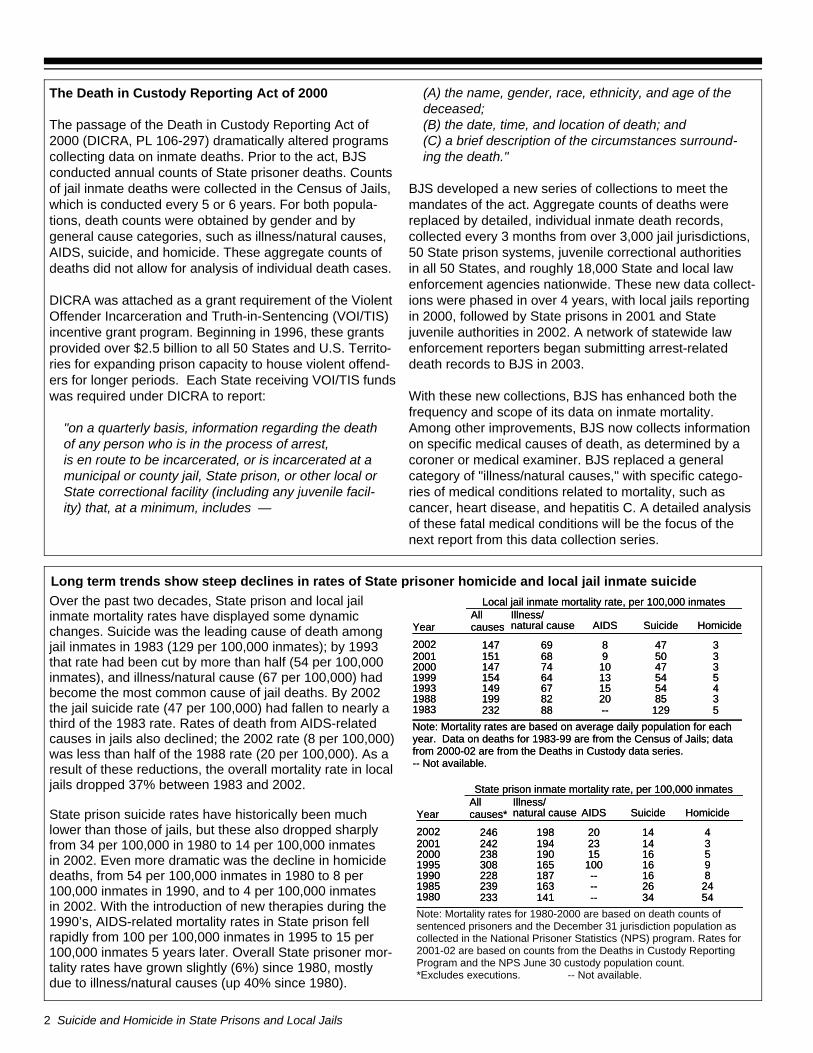
State prison homicide rates dippedsharply from 1980 (54 per 100,000) to1990 (8 per 100,000). By 2002 prisonhomicide rates had declined further,down to 4 per 100,000. Homicide ratesin local jails were more stable, declin-ing slightly from 5 per 100,000 in 1983to 3 per 100,000 in 2002.
U.S. Department of Justice Office of Justice Programs
Bureau of Justice StatisticsSpecial ReportSuicide and Homicide in State Prisons and Local Jails
August 2005, NCJ 210036
w In 2002 the suicide rate in local jails (47 per 100,000 inmates) was over 3 times the rate in State prisons(14 per 100,000 inmates).
w The suicide rate in the Nation’s 50 largest jail systems (29 per 100,000 inmates) was half that of other jails (57 per 100,000).
Violent offenders in both local jails(92 per 100,000) and State prisons (19 per 100,000) had suicide rates over twice as high as those of nonvio-lent offenders (31 and 9 per 100,000respectively).
Homicide rates were similar in local jails (3 per 100,000) and Stateprisons (4 per 100,000).
67% of homicide victims in Stateprisons had served at least 2 years;37% had served 5 years.
Violent offenders were the victims of most State prison homicides (61%), and their jail homicide rate (5 per 100,000) was over twice that of nonviolent offenders (2 per100,000).
Highlights
Homicide rates in State prisons dropped 93% from 1980 to 2002
State prison, local jail suicide rates have fallen sharply since the 1980’s1.338383.6463222Other/unknown1.237355.2545837Intoxication0.931233.3353525Accident1.548392.1202217Homicide5.816816932.3314315289Suicide8.82452705.9505960AIDS
%80.42,3792,304%47.6459432462Illness
%1002,9462,878%100978953912All causespercent20022001percent200220012000Cause2001-022000-02
State prison inmate deathsLocal jail inmate deaths
1980 1985 1990 1995 20000
10
20
30
40
50
60Homicides per 100,000 inmates
Prisons
Jails
1980 1985 1990 1995 20000
20
40
60
80
100
120
140Suicides per 100,000 inmates
Jails
Prisons
1980 1985 1990 1995 20000
10
20
30
40
50
60Homicides per 100,000 inmates
Prisons
Jails
2 Suicide and Homicide in State Prisons and Local Jails
The Death in Custody Reporting Act of 2000
The passage of the Death in Custody Reporting Act of2000 (DICRA, PL 106-297) dramatically altered programscollecting data on inmate deaths. Prior to the act, BJSconducted annual counts of State prisoner deaths. Countsof jail inmate deaths were collected in the Census of Jails,which is conducted every 5 or 6 years. For both popula-tions, death counts were obtained by gender and bygeneral cause categories, such as illness/natural causes,AIDS, suicide, and homicide. These aggregate counts ofdeaths did not allow for analysis of individual death cases.
DICRA was attached as a grant requirement of the ViolentOffender Incarceration and Truth-in-Sentencing (VOI/TIS)incentive grant program. Beginning in 1996, these grantsprovided over $2.5 billion to all 50 States and U.S. Territo-ries for expanding prison capacity to house violent offend-ers for longer periods. Each State receiving VOI/TIS fundswas required under DICRA to report:
"on a quarterly basis, information regarding the deathof any person who is in the process of arrest,is en route to be incarcerated, or is incarcerated at amunicipal or county jail, State prison, or other local orState correctional facility (including any juvenile facil-ity) that, at a minimum, includes —
(A) the name, gender, race, ethnicity, and age of thedeceased; (B) the date, time, and location of death; and (C) a brief description of the circumstances surround-ing the death."
BJS developed a new series of collections to meet themandates of the act. Aggregate counts of deaths werereplaced by detailed, individual inmate death records,collected every 3 months from over 3,000 jail jurisdictions, 50 State prison systems, juvenile correctional authorities in all 50 States, and roughly 18,000 State and local law enforcement agencies nationwide. These new data collect-ions were phased in over 4 years, with local jails reporting in 2000, followed by State prisons in 2001 and Statejuvenile authorities in 2002. A network of statewide lawenforcement reporters began submitting arrest-relateddeath records to BJS in 2003.
With these new collections, BJS has enhanced both thefrequency and scope of its data on inmate mortality.Among other improvements, BJS now collects informationon specific medical causes of death, as determined by a coroner or medical examiner. BJS replaced a generalcategory of "illness/natural causes," with specific catego-ries of medical conditions related to mortality, such ascancer, heart disease, and hepatitis C. A detailed analysisof these fatal medical conditions will be the focus of thenext report from this data collection series.
Over the past two decades, State prison and local jailinmate mortality rates have displayed some dynamicchanges. Suicide was the leading cause of death amongjail inmates in 1983 (129 per 100,000 inmates); by 1993that rate had been cut by more than half (54 per 100,000inmates), and illness/natural cause (67 per 100,000) hadbecome the most common cause of jail deaths. By 2002the jail suicide rate (47 per 100,000) had fallen to nearly athird of the 1983 rate. Rates of death from AIDS-relatedcauses in jails also declined; the 2002 rate (8 per 100,000)was less than half of the 1988 rate (20 per 100,000). As aresult of these reductions, the overall mortality rate in localjails dropped 37% between 1983 and 2002.
State prison suicide rates have historically been muchlower than those of jails, but these also dropped sharplyfrom 34 per 100,000 in 1980 to 14 per 100,000 inmates in 2002. Even more dramatic was the decline in homicidedeaths, from 54 per 100,000 inmates in 1980 to 8 per100,000 inmates in 1990, and to 4 per 100,000 inmates in 2002. With the introduction of new therapies during the1990’s, AIDS-related mortality rates in State prison fellrapidly from 100 per 100,000 inmates in 1995 to 15 per100,000 inmates 5 years later. Overall State prisoner mor-tality rates have grown slightly (6%) since 1980, mostlydue to illness/natural causes (up 40% since 1980).
Long term trends show steep declines in rates of State prisoner homicide and local jail inmate suicide
Note: Mortality rates are based on average daily population for eachyear. Data on deaths for 1983-99 are from the Census of Jails; datafrom 2000-02 are from the Deaths in Custody data series.-- Not available.
5129--8823219833852082199198845415671491993554136415419993471074147200035096815120013478691472002
HomicideSuicideAIDSIllness/natural cause
All causesYear
Local jail inmate mortality rate, per 100,000 inmates
Note: Mortality rates for 1980-2000 are based on death counts ofsentenced prisoners and the December 31 jurisdiction population ascollected in the National Prisoner Statistics (NPS) program. Rates for2001-02 are based on counts from the Deaths in Custody ReportingProgram and the NPS June 30 custody population count.*Excludes executions. -- Not available.
5434--14123319802426--1632391985816--18722819909161001653081995516151902382000314231942422001414201982462002
HomicideSuicideAIDSIllness/natural cause
All causes*Year
State prison inmate mortality rate, per 100,000 inmates
Note: Mortality rates are based on average daily population for eachyear. Data on deaths for 1983-99 are from the Census of Jails; datafrom 2000-02 are from the Deaths in Custody data series.-- Not available.
5129--8823219833852082199198845415671491993554136415419993471074147200035096815120013478691472002
HomicideSuicideAIDSIllness/natural cause
All causesYear
Local jail inmate mortality rate, per 100,000 inmates
5434--14123319802426--1632391985816--18722819909161001653081995516151902382000314231942422001414201982462002
HomicideSuicideAIDSIllness/natural cause
All causes*Year
State prison inmate mortality rate, per 100,000 inmates
Nationwide, 337 State prisonerscommitted suicide during 2001-02
Suicide and homicide accounted for acombined 7% of all State prisonerdeaths during 2001-02 (table 1). Theaverage annual suicide rate of Stateprisoners (14 suicides per 100,000prisoners) was a third of that of localjail inmates during 2000-02 (48).
Prison suicide rates showed widevariation at the State level. NewHampshire, Nebraska, and NorthDakota all reported no suicide deathsduring the 2-year period. Another sixStates had suicide rates of 5 per100,000 prisoners or lower. ThirteenStates had suicide rates of at least 25per 100,000 prisoners, led by SouthDakota (71), Utah (49), Vermont,Alaska, and Arkansas (each with 36).
In most State prison systems, suicideswere rare events. Only 9 Statesreported as many as 10 prisonersuicides during this period, with 42% ofall suicides taking place in four States.California (52), Texas (49), New York(21), and Illinois (20) reported 142 ofthe Nation's 337 State prisonersuicides. About half of all States (24)recorded 3 or fewer suicides.
87 State prisoners became victims of homicide over 2 years
Most States did not have any prisonerhomicides in the course of a year.During 2001, 31 States reported noprison homicides; 29 States did notreport a homicide during 2002. ThreeStates reported 43% of all homicides— California (21), Texas (10), andMaryland (6). No other State reportedmore than 5 homicides during2001-02.
Homicide rates were low in mostStates, and 5 had a rate of at least 10homicides per 100,000 prisoners, ledby South Dakota (34) and New Mexico(17). However, even in these 5 States,a combined total of 13 homicides werereported over 2 years.
Suicide and Homicide in State Prisons and Local Jails 3
Note: All mortality rates are calculated based on custody populations for June 30.*Excludes 9 total prisoner deaths reported by the District of Columbia in 2001. None of the 9 deaths was a suicide or homicide. The District of Columbia transferred all prisonercustody operations to the Federal Bureau of Prisons during 2001.
033260018Wyoming6131922460Washington
12491701414Utah0232590557Oregon
17342212426New Mexico10152602352Nevada
0191990111Montana0282430326Idaho0191950220Hawaii6142682594Colorado7161962152625California21124716139Arizona0362630322Alaska61721331931,154West
0143570125West Virginia2622714140Virginia3172731049804Texas8631732112Tennessee7526732116South Carolina9526042115Oklahoma31219728128North Carolina072280269Mississippi
1227293613141Maryland0538102150Louisiana443251177Kentucky411217410199Georgia28251311365Florida0282220431Delaware9363222873Arkansas2434212172Alabama412267401212,717South
03224501399Wisconsin34712622415South Dakota
2925428229Ohio00192004North Dakota001900015Nebraska21121016122Missouri0152150228Minnesota111231111227Michigan0232480443Kansas0181230320Iowa8152463697Indiana222178220158Illinois21622111771,057Midwest
036217016Vermont0281550211Rhode Island3832726248Pennsylvania215264321360New York0522503129New Jersey002240011New Hampshire0152390349Massachusetts0283700113Maine0241620960Connecticut113257546887Northeast
414244873375,815U.S. total*
HomicideSuicideAll causesHomicideSuicideAll causesjurisdiction
Number of prisonerdeaths, 2001-02Region and
Average annual mortality rate(2001-02) per 100,000 prisoners held at midyear
Table 1. State prison jurisdictions: Number of prisoner deaths, suicides, andhomicides, and mortality rates, per 100,000 prisoners in custody, 2001-02
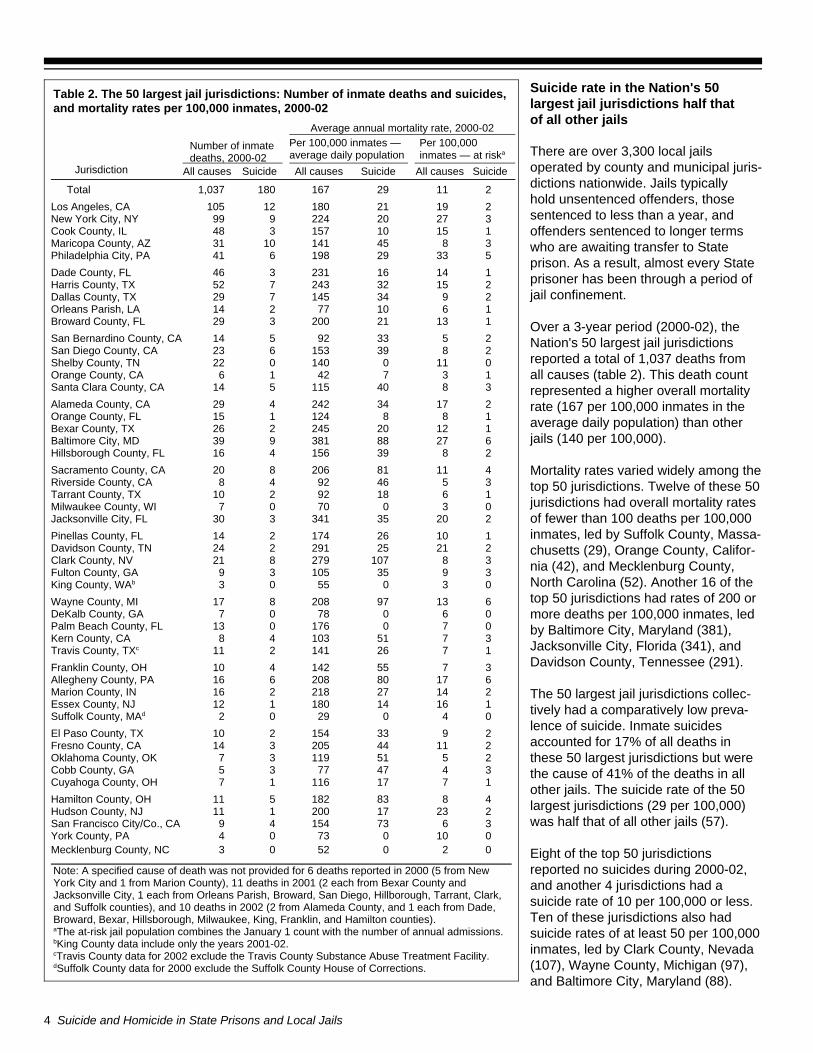
Suicide rate in the Nation's 50largest jail jurisdictions half that of all other jails
There are over 3,300 local jailsoperated by county and municipal juris-dictions nationwide. Jails typicallyhold unsentenced offenders, thosesentenced to less than a year, andoffenders sentenced to longer termswho are awaiting transfer to Stateprison. As a result, almost every Stateprisoner has been through a period ofjail confinement.
Over a 3-year period (2000-02), theNation's 50 largest jail jurisdictionsreported a total of 1,037 deaths fromall causes (table 2). This death countrepresented a higher overall mortalityrate (167 per 100,000 inmates in theaverage daily population) than otherjails (140 per 100,000).
Mortality rates varied widely among thetop 50 jurisdictions. Twelve of these 50jurisdictions had overall mortality ratesof fewer than 100 deaths per 100,000inmates, led by Suffolk County, Massa-chusetts (29), Orange County, Califor-nia (42), and Mecklenburg County,North Carolina (52). Another 16 of thetop 50 jurisdictions had rates of 200 ormore deaths per 100,000 inmates, ledby Baltimore City, Maryland (381),Jacksonville City, Florida (341), andDavidson County, Tennessee (291).
The 50 largest jail jurisdictions collec-tively had a comparatively low preva-lence of suicide. Inmate suicidesaccounted for 17% of all deaths inthese 50 largest jurisdictions but werethe cause of 41% of the deaths in allother jails. The suicide rate of the 50largest jurisdictions (29 per 100,000)was half that of all other jails (57).
Eight of the top 50 jurisdictionsreported no suicides during 2000-02,and another 4 jurisdictions had asuicide rate of 10 per 100,000 or less.Ten of these jurisdictions also hadsuicide rates of at least 50 per 100,000inmates, led by Clark County, Nevada(107), Wayne County, Michigan (97),and Baltimore City, Maryland (88).
4 Suicide and Homicide in State Prisons and Local Jails
Note: A specified cause of death was not provided for 6 deaths reported in 2000 (5 from NewYork City and 1 from Marion County), 11 deaths in 2001 (2 each from Bexar County and Jacksonville City, 1 each from Orleans Parish, Broward, San Diego, Hillborough, Tarrant, Clark,and Suffolk counties), and 10 deaths in 2002 (2 from Alameda County, and 1 each from Dade,Broward, Bexar, Hillsborough, Milwaukee, King, Franklin, and Hamilton counties).aThe at-risk jail population combines the January 1 count with the number of annual admissions.bKing County data include only the years 2001-02. cTravis County data for 2002 exclude the Travis County Substance Abuse Treatment Facility.dSuffolk County data for 2000 exclude the Suffolk County House of Corrections.
0205203Mecklenburg County, NC01007304York County, PA367315449San Francisco City/Co., CA22317200111Hudson County, NJ4883182511Hamilton County, OH171711617Cuyahoga County, OH34477735Cobb County, GA255111937Oklahoma County, OK21144205314Fresno County, CA2933154210El Paso County, TX0402902Suffolk County, MAd11614180112Essex County, NJ21427218216Marion County, IN61780208616Allegheny County, PA3755142410Franklin County, OH1726141211Travis County, TXc375110348Kern County, CA070176013Palm Beach County, FL0607807DeKalb County, GA61397208817Wayne County, MI0305503King County, WAb393510539Fulton County, GA38107279821Clark County, NV22125291224Davidson County, TN11026174214Pinellas County, FL22035341330Jacksonville City, FL0307007Milwaukee County, WI161892210Tarrant County, TX35469248Riverside County, CA41181206820Sacramento County, CA2839156416Hillsborough County, FL62788381939Baltimore City, MD11220245226Bexar County, TX188124115Orange County, FL21734242429Alameda County, CA3840115514Santa Clara County, CA1374216Orange County, CA0110140022Shelby County, TN2839153623San Diego County, CA253392514San Bernardino County, CA11321200329Broward County, FL161077214Orleans Parish, LA2934145729Dallas County, TX21532243752Harris County, TX11416231346Dade County, FL53329198641Philadelphia City, PA38451411031Maricopa County, AZ11510157348Cook County, IL32720224999New York City, NY2192118012105Los Angeles, CA211291671801,037Total
SuicideAll causesSuicideAll causesSuicideAll causesJurisdiction
Per 100,000 inmates — at riska
Per 100,000 inmates —average daily population
Number of inmatedeaths, 2000-02
Average annual mortality rate, 2000-02
Table 2. The 50 largest jail jurisdictions: Number of inmate deaths and suicides, and mortality rates per 100,000 inmates, 2000-02
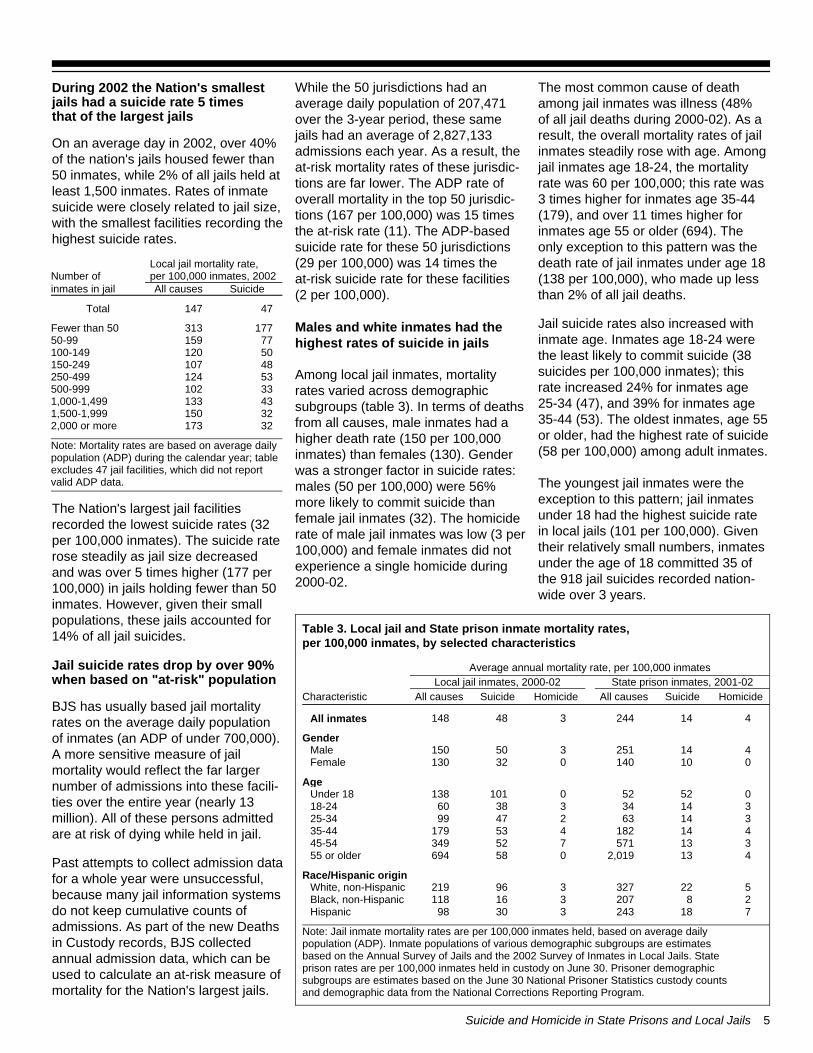
During 2002 the Nation's smallestjails had a suicide rate 5 times that of the largest jails
On an average day in 2002, over 40%of the nation's jails housed fewer than50 inmates, while 2% of all jails held atleast 1,500 inmates. Rates of inmatesuicide were closely related to jail size,with the smallest facilities recording thehighest suicide rates.
The Nation's largest jail facilitiesrecorded the lowest suicide rates (32per 100,000 inmates). The suicide raterose steadily as jail size decreasedand was over 5 times higher (177 per100,000) in jails holding fewer than 50inmates. However, given their smallpopulations, these jails accounted for14% of all jail suicides.
Jail suicide rates drop by over 90%when based on "at-risk" population
BJS has usually based jail mortalityrates on the average daily population of inmates (an ADP of under 700,000).A more sensitive measure of jailmortality would reflect the far largernumber of admissions into these facili-ties over the entire year (nearly 13million). All of these persons admittedare at risk of dying while held in jail. Past attempts to collect admission datafor a whole year were unsuccessful,because many jail information systemsdo not keep cumulative counts ofadmissions. As part of the new Deathsin Custody records, BJS collectedannual admission data, which can beused to calculate an at-risk measure ofmortality for the Nation's largest jails.
While the 50 jurisdictions had anaverage daily population of 207,471over the 3-year period, these samejails had an average of 2,827,133admissions each year. As a result, theat-risk mortality rates of these jurisdic-tions are far lower. The ADP rate ofoverall mortality in the top 50 jurisdic-tions (167 per 100,000) was 15 timesthe at-risk rate (11). The ADP-basedsuicide rate for these 50 jurisdictions(29 per 100,000) was 14 times theat-risk suicide rate for these facilities (2 per 100,000).
Males and white inmates had thehighest rates of suicide in jails
Among local jail inmates, mortalityrates varied across demographicsubgroups (table 3). In terms of deathsfrom all causes, male inmates had ahigher death rate (150 per 100,000inmates) than females (130). Genderwas a stronger factor in suicide rates:males (50 per 100,000) were 56%more likely to commit suicide thanfemale jail inmates (32). The homiciderate of male jail inmates was low (3 per100,000) and female inmates did notexperience a single homicide during2000-02.
The most common cause of deathamong jail inmates was illness (48% of all jail deaths during 2000-02). As aresult, the overall mortality rates of jailinmates steadily rose with age. Amongjail inmates age 18-24, the mortalityrate was 60 per 100,000; this rate was3 times higher for inmates age 35-44(179), and over 11 times higher forinmates age 55 or older (694). Theonly exception to this pattern was thedeath rate of jail inmates under age 18(138 per 100,000), who made up lessthan 2% of all jail deaths.
Jail suicide rates also increased withinmate age. Inmates age 18-24 werethe least likely to commit suicide (38suicides per 100,000 inmates); thisrate increased 24% for inmates age25-34 (47), and 39% for inmates age35-44 (53). The oldest inmates, age 55or older, had the highest rate of suicide(58 per 100,000) among adult inmates.
The youngest jail inmates were theexception to this pattern; jail inmatesunder 18 had the highest suicide ratein local jails (101 per 100,000). Giventheir relatively small numbers, inmatesunder the age of 18 committed 35 ofthe 918 jail suicides recorded nation-wide over 3 years.
Suicide and Homicide in State Prisons and Local Jails 5
Note: Mortality rates are based on average dailypopulation (ADP) during the calendar year; tableexcludes 47 jail facilities, which did not reportvalid ADP data.
321732,000 or more321501,500-1,999431331,000-1,49933102500-99953124250-49948107150-24950120100-1497715950-99
177313Fewer than 50
47147Total
SuicideAll causesinmates in jail
Local jail mortality rate,per 100,000 inmates, 2002Number of
Note: Jail inmate mortality rates are per 100,000 inmates held, based on average dailypopulation (ADP). Inmate populations of various demographic subgroups are estimatesbased on the Annual Survey of Jails and the 2002 Survey of Inmates in Local Jails. Stateprison rates are per 100,000 inmates held in custody on June 30. Prisoner demographic subgroups are estimates based on the June 30 National Prisoner Statistics custody counts and demographic data from the National Corrections Reporting Program.
71824333098Hispanic28207316118Black, non-Hispanic522327396219White, non-Hispanic
Race/Hispanic origin
4132,01905869455 or older31357175234945-5441418245317935-44314632479925-34314343386018-24052520101138Under 18
Age
010140032130Female414251350150Male
Gender
414244348148All inmates
HomicideSuicideAll causesHomicideSuicideAll causesCharacteristicState prison inmates, 2001-02Local jail inmates, 2000-02
Average annual mortality rate, per 100,000 inmates
Table 3. Local jail and State prison inmate mortality rates, per 100,000 inmates, by selected characteristics
Inmate age did not have any clearrelationship to jail homicide rates,which were no higher than 7 per100,000 inmates for all age groups.Both the youngest (under 18) andoldest (55 or older) inmates had nohomicide deaths during 2000-02.
White jail inmates 6 times morelikely to commit suicide than blackinmates and 3 times more likely than Hispanic inmates
Mortality rates displayed substantialdifferences by race and ethnicity.Death rates from all causes for bothblack (118 per 100,000 inmates) andHispanic (98) jail inmates were at least20% below the overall jail inmatemortality rate (148). But the death rateof white jail inmates (219 per 100,000)was 86% higher than that of blackinmates and over twice as high as therate for Hispanic inmates.
Differences across racial/ethniccategories were more pronounced injail inmate suicide rates. The suiciderate of white jail inmates (96 per100,000 inmates) was more than triplethat of Hispanic inmates (30) andwas 6 times the suicide rate for blackinmates (16). White inmates accountedfor nearly three-quarters of all jailinmate suicides during 2000-02.
Unlike the overall mortality and suiciderates, homicide rates were not relatedto race/ethnicity. White, black andHispanic jail inmates were all equallylikely to be victims of a homicide (3 deaths per 100,000 inmates).
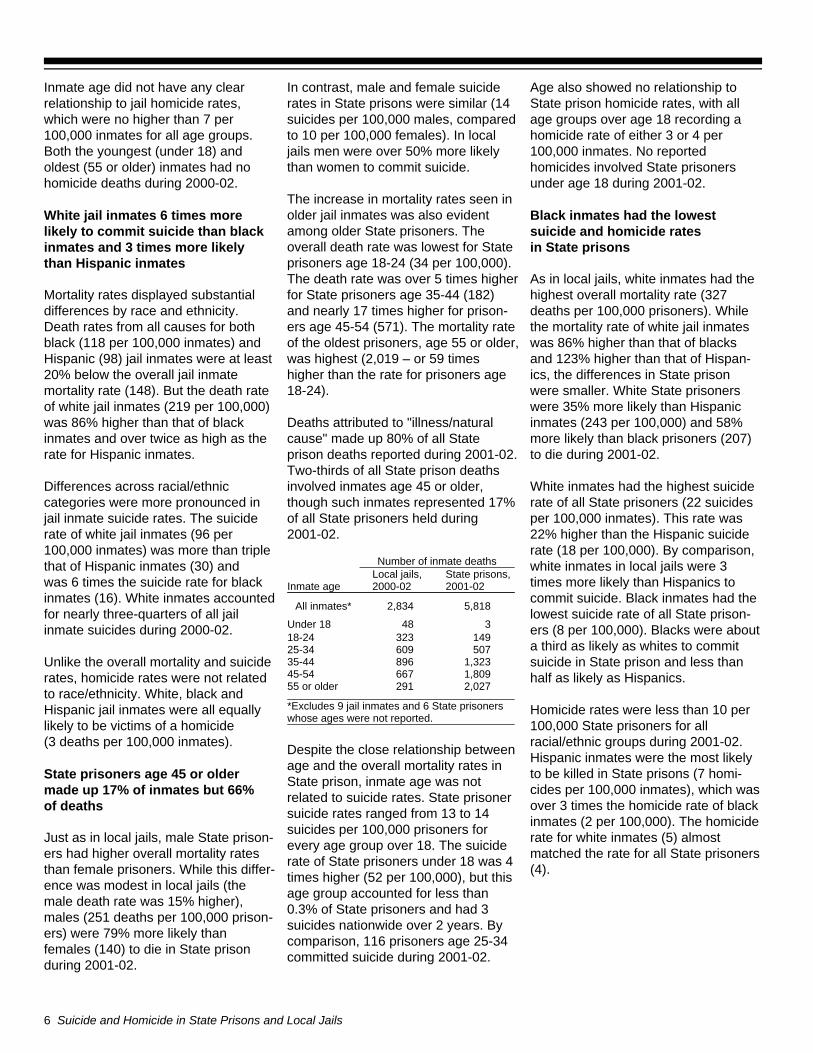
State prisoners age 45 or oldermade up 17% of inmates but 66% of deaths
Just as in local jails, male State prison-ers had higher overall mortality ratesthan female prisoners. While this differ-ence was modest in local jails (themale death rate was 15% higher),males (251 deaths per 100,000 prison-ers) were 79% more likely thanfemales (140) to die in State prisonduring 2001-02.
In contrast, male and female suiciderates in State prisons were similar (14suicides per 100,000 males, comparedto 10 per 100,000 females). In localjails men were over 50% more likelythan women to commit suicide.
The increase in mortality rates seen inolder jail inmates was also evidentamong older State prisoners. Theoverall death rate was lowest for Stateprisoners age 18-24 (34 per 100,000).The death rate was over 5 times higherfor State prisoners age 35-44 (182)and nearly 17 times higher for prison-ers age 45-54 (571). The mortality rateof the oldest prisoners, age 55 or older,was highest (2,019 – or 59 timeshigher than the rate for prisoners age18-24).
Deaths attributed to "illness/naturalcause" made up 80% of all State prison deaths reported during 2001-02.Two-thirds of all State prison deathsinvolved inmates age 45 or older,though such inmates represented 17%of all State prisoners held during2001-02.
Despite the close relationship betweenage and the overall mortality rates inState prison, inmate age was notrelated to suicide rates. State prisonersuicide rates ranged from 13 to 14suicides per 100,000 prisoners forevery age group over 18. The suiciderate of State prisoners under 18 was 4times higher (52 per 100,000), but thisage group accounted for less than0.3% of State prisoners and had 3suicides nationwide over 2 years. Bycomparison, 116 prisoners age 25-34committed suicide during 2001-02.
Age also showed no relationship toState prison homicide rates, with allage groups over age 18 recording ahomicide rate of either 3 or 4 per100,000 inmates. No reportedhomicides involved State prisonersunder age 18 during 2001-02.
Black inmates had the lowestsuicide and homicide rates in State prisons
As in local jails, white inmates had thehighest overall mortality rate (327deaths per 100,000 prisoners). Whilethe mortality rate of white jail inmateswas 86% higher than that of blacksand 123% higher than that of Hispan-ics, the differences in State prisonwere smaller. White State prisonerswere 35% more likely than Hispanicinmates (243 per 100,000) and 58%more likely than black prisoners (207)to die during 2001-02.
White inmates had the highest suiciderate of all State prisoners (22 suicidesper 100,000 inmates). This rate was22% higher than the Hispanic suiciderate (18 per 100,000). By comparison,white inmates in local jails were 3times more likely than Hispanics tocommit suicide. Black inmates had thelowest suicide rate of all State prison-ers (8 per 100,000). Blacks were abouta third as likely as whites to commitsuicide in State prison and less thanhalf as likely as Hispanics.
Homicide rates were less than 10 per100,000 State prisoners for allracial/ethnic groups during 2001-02. Hispanic inmates were the most likelyto be killed in State prisons (7 homi-cides per 100,000 inmates), which wasover 3 times the homicide rate of blackinmates (2 per 100,000). The homiciderate for white inmates (5) almostmatched the rate for all State prisoners(4).
6 Suicide and Homicide in State Prisons and Local Jails
*Excludes 9 jail inmates and 6 State prisonerswhose ages were not reported.
2,02729155 or older1,80966745-541,32389635-44
50760925-3414932318-24
348Under 18
5,8182,834All inmates*
State prisons,2001-02
Local jails,2000-02Inmate age
Number of inmate deaths
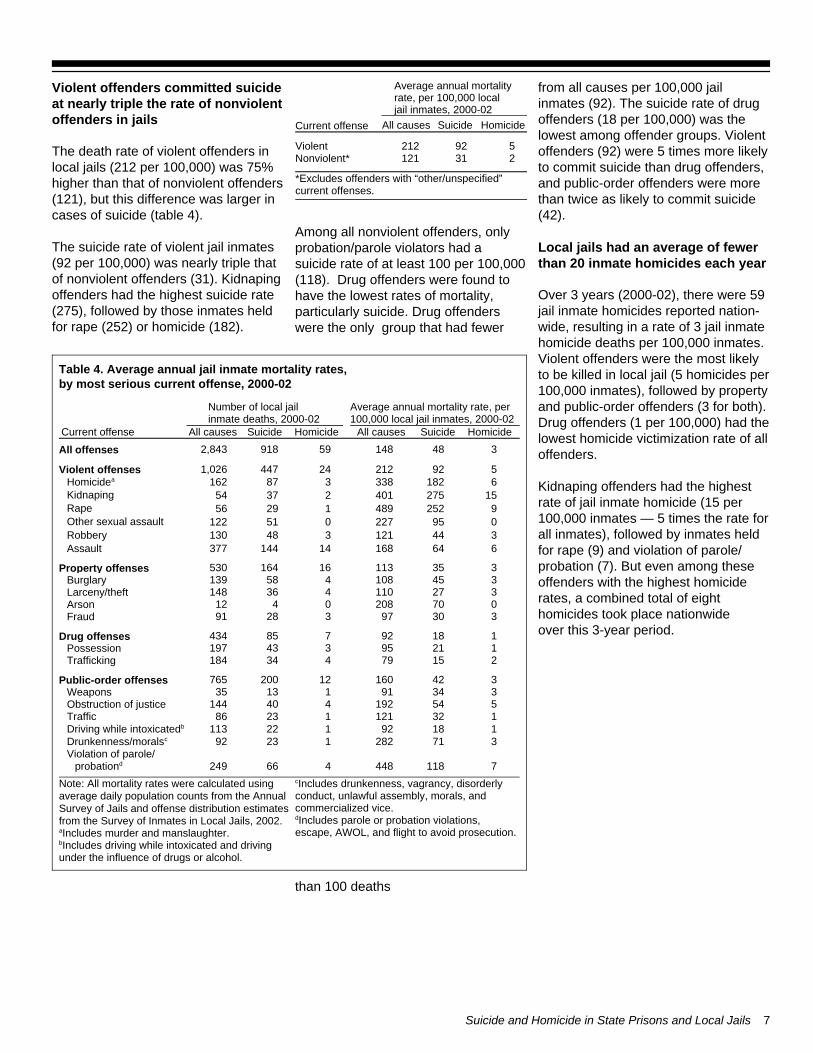
Violent offenders committed suicideat nearly triple the rate of nonviolentoffenders in jails
The death rate of violent offenders inlocal jails (212 per 100,000) was 75%higher than that of nonviolent offenders(121), but this difference was larger incases of suicide (table 4).
The suicide rate of violent jail inmates(92 per 100,000) was nearly triple thatof nonviolent offenders (31). Kidnapingoffenders had the highest suicide rate(275), followed by those inmates heldfor rape (252) or homicide (182).
Among all nonviolent offenders, onlyprobation/parole violators had asuicide rate of at least 100 per 100,000(118). Drug offenders were found tohave the lowest rates of mortality,particularly suicide. Drug offenderswere the only group that had fewer
than 100 deaths
from all causes per 100,000 jailinmates (92). The suicide rate of drugoffenders (18 per 100,000) was thelowest among offender groups. Violentoffenders (92) were 5 times more likelyto commit suicide than drug offenders,and public-order offenders were morethan twice as likely to commit suicide(42).
Local jails had an average of fewerthan 20 inmate homicides each year
Over 3 years (2000-02), there were 59jail inmate homicides reported nation-wide, resulting in a rate of 3 jail inmatehomicide deaths per 100,000 inmates.Violent offenders were the most likelyto be killed in local jail (5 homicides per100,000 inmates), followed by propertyand public-order offenders (3 for both).Drug offenders (1 per 100,000) had thelowest homicide victimization rate of alloffenders.
Kidnaping offenders had the highestrate of jail inmate homicide (15 per100,000 inmates — 5 times the rate forall inmates), followed by inmates heldfor rape (9) and violation of parole/probation (7). But even among theseoffenders with the highest homiciderates, a combined total of eighthomicides took place nationwide over this 3-year period.
Suicide and Homicide in State Prisons and Local Jails 7
*Excludes offenders with “other/unspecified”current offenses.
231121Nonviolent*592212Violent
HomicideSuicideAll causes
Average annual mortalityrate, per 100,000 localjail inmates, 2000-02
Current offense
cIncludes drunkenness, vagrancy, disorderlyconduct, unlawful assembly, morals, andcommercialized vice.dIncludes parole or probation violations,escape, AWOL, and flight to avoid prosecution.
Note: All mortality rates were calculated usingaverage daily population counts from the AnnualSurvey of Jails and offense distribution estimatesfrom the Survey of Inmates in Local Jails, 2002. aIncludes murder and manslaughter.bIncludes driving while intoxicated and drivingunder the influence of drugs or alcohol.
7118448466249Violation of parole/
probationd
37128212392Drunkenness/moralsc11892122113Driving while intoxicatedb13212112386Traffic554192440144Obstruction of justice3349111335Weapons34216012200765Public-order offenses
21579434184Trafficking12195343197Possession11892785434Drug offenses
3309732891Fraud0702080412Arson327110436148Larceny/theft345108458139Burglary33511316164530Property offenses
66416814144377Assault344121348130Robbery095227051122Other sexual assault925248912956Rape
1527540123754Kidnaping6182338387162Homicidea592212244471,026Violent offenses
348148599182,843All offensesHomicideSuicideAll causesHomicideSuicideAll causesCurrent offense
Average annual mortality rate, per100,000 local jail inmates, 2000-02
Number of local jailinmate deaths, 2000-02
Table 4. Average annual jail inmate mortality rates, by most serious current offense, 2000-02
Drug offenders had the lowestsuicide and homicide rates of allState prisoners
State prison mortality rates showedsimilar patterns by offense type (table5). Violent offenders not only had thehighest overall mortality rate (312deaths per 100,000 prisoners), theywere the only State prisoners with adeath rate of at least 200 per 100,000prisoners held. Property and public-order offenders each had a rate of 184deaths per 100,000, followed by drugoffenders (166).
Compared to violent offenders in localjails (92 suicides per 100,000 inmates),the suicide rate of violent offenders inState prison (19 per 100,000) wasmuch lower. But among State prison-ers, violent offenders were more thantwice as likely to commit suicide as nonviolent offenders (9 per 100,000).
Kidnapers had the highest suicide rate(36 per 100,000 prisoners), followed byoffenders held for homicide (29),sexual assault (23), and assault (20).Among nonviolent offenders,probation/parole violators had thehighest suicide rates (18 per 100,000),followed by offenders held for arson(16), burglary (14), and obstruction ofjustice (14). Drug offenders recordedthe lowest suicide rates of all Stateprisoners (6 per 100,000 inmates).
The rate of homicide in State prisonwas 4 per 100,000 prisoners, andvaried little across offense types.Three types of offenders had as manyas 10 homicides per 100,000 prison-ers — arsonists (16), kidnapers (15),and probation/parole violators (12).Among these three categories with thehighest homicide rates, the number ofhomicides was small, with a total ofnine prisoners killed over 2 years.
State prisoners convicted of fraud anddriving while intoxicated had the lowestrate of homicide, with zero homicidesreported for 2001-02. Nearly half of jail suicides occurredin the first week of custody
Jail inmate suicides were heavilyconcentrated in the first week spent incustody. Forty-eight percent of all jailsuicides during 2000-02 took placeduring the inmate's first week followingadmission. In particular, almost aquarter of all jail suicides took placeeither on the date of admission to jail(14%) or the following day (9%).
The frequency of jail suicides slowedafter the initial week, with the secondweek of custody accounting for 10% ofjail suicides. The next 2 weeks incustody (days 15 to 30) accounted foreven fewer suicides (8%). Despite thisearly concentration of suicides, moresuicides took place after the 60th dayin jail (24%) than during the first 2 days(23%).
The median time served in jail prior tocommitting suicide was just over 1week (9 days), but this period of timevaried across demographic and crimi-nal offense categories (table 6).Females spent less than half as muchtime as males in jail prior to committingsuicide (median time served: 4 days forfemales and 10 days for males). Themedian length of time served byHispanic inmates prior to suicide (23days) was over twice as long as thetime for white inmates (9 days) andnearly 4 times longer than that forblack inmates (6 days).
8 Suicide and Homicide in State Prisons and Local Jails
10.4181 days or more14.061-180 days10.631-60 days
7.715-30 days9.68-14 days
24.92-7 days9.0Next day
%13.7Same day
Percent of jail inmatesuicides, 2000-02
Time servedafter admission
bIncludes driving while intoxicated anddriving under the influence of drugs or alcohol.cIncludes parole or probation violations,escape, AWOL, and flight to avoidprosecution.
Note: All mortality rates were calculated using June 30custody prisoner counts from the National PrisonerStatistics program and 2002 offense distributionestimates from the National Corrections ReportingProgram.aIncludes murder and manslaughter.
12181942332Violation of parole/
probationc
0426302123Driving while
intoxicatedb
7143811253Obstruction of justice24671236Weapons27184413319Public-order offenses
28188621485Trafficking48224510278Possession261661133853Drug offenses
01020906128Fraud16162772235Arson
410209410199Larceny/theft414177936447Burglary4121841858904Property offenses
5202171144485Assault391711128552Robbery523523836803Other sexual assault112299114344Rape
153645455151Kidnaping52941716891,295Homicidea419312532293,691Violent offenses
414244873375,824All offenses
HomicideSuicideAll causesHomicideSuicideAll causesCurrent offense
Average annual mortality rate, per 100,000 State prison inmates, 2001-02
Number of State prisoninmate deaths, 2001-02
Table 5. Average annual State prison inmate mortality rates, by most serious current offense, 2001-02
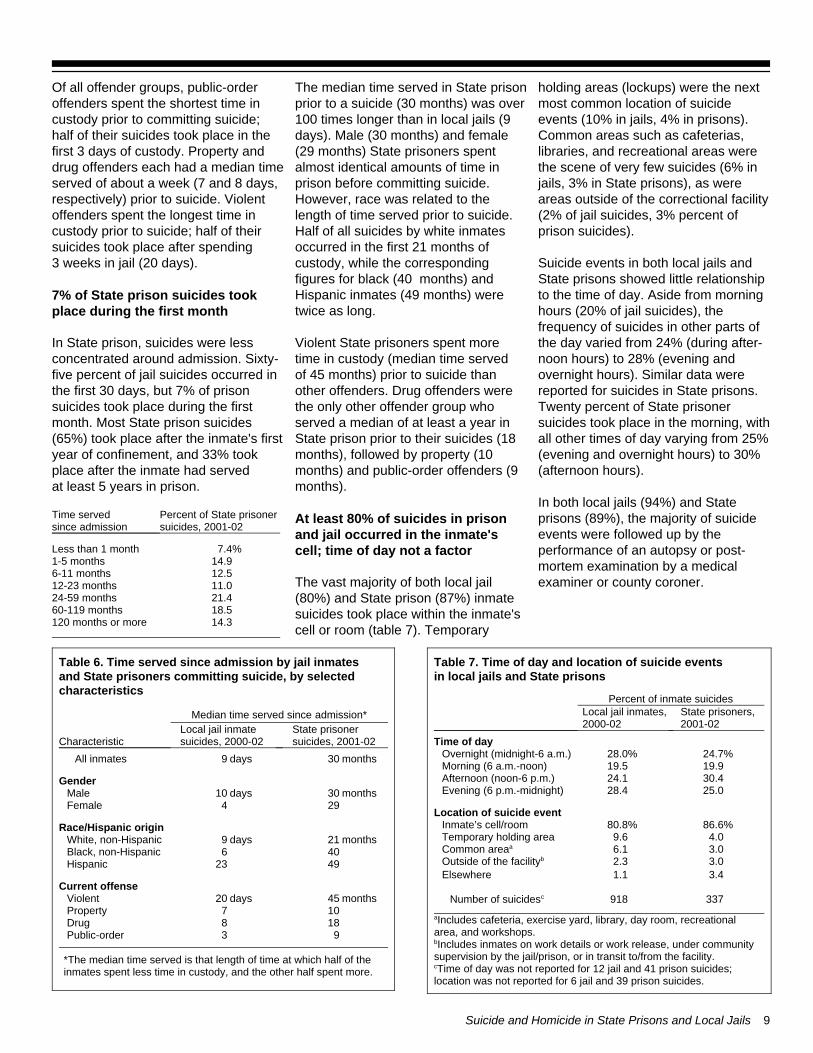
Of all offender groups, public-orderoffenders spent the shortest time incustody prior to committing suicide;half of their suicides took place in thefirst 3 days of custody. Property anddrug offenders each had a median timeserved of about a week (7 and 8 days,respectively) prior to suicide. Violentoffenders spent the longest time incustody prior to suicide; half of theirsuicides took place after spending 3 weeks in jail (20 days).
7% of State prison suicides tookplace during the first month
In State prison, suicides were lessconcentrated around admission. Sixty-five percent of jail suicides occurred inthe first 30 days, but 7% of prisonsuicides took place during the firstmonth. Most State prison suicides(65%) took place after the inmate's firstyear of confinement, and 33% tookplace after the inmate had served at least 5 years in prison.
The median time served in State prisonprior to a suicide (30 months) was over100 times longer than in local jails (9days). Male (30 months) and female(29 months) State prisoners spentalmost identical amounts of time inprison before committing suicide.However, race was related to thelength of time served prior to suicide.Half of all suicides by white inmatesoccurred in the first 21 months ofcustody, while the correspondingfigures for black (40 months) andHispanic inmates (49 months) weretwice as long.
Violent State prisoners spent moretime in custody (median time served of 45 months) prior to suicide thanother offenders. Drug offenders werethe only other offender group who served a median of at least a year inState prison prior to their suicides (18months), followed by property (10months) and public-order offenders (9months).
At least 80% of suicides in prisonand jail occurred in the inmate'scell; time of day not a factor
The vast majority of both local jail(80%) and State prison (87%) inmatesuicides took place within the inmate'scell or room (table 7). Temporary
holding areas (lockups) were the nextmost common location of suicideevents (10% in jails, 4% in prisons).Common areas such as cafeterias,libraries, and recreational areas werethe scene of very few suicides (6% injails, 3% in State prisons), as wereareas outside of the correctional facility(2% of jail suicides, 3% percent ofprison suicides).
Suicide events in both local jails andState prisons showed little relationshipto the time of day. Aside from morninghours (20% of jail suicides), thefrequency of suicides in other parts ofthe day varied from 24% (during after-noon hours) to 28% (evening andovernight hours). Similar data werereported for suicides in State prisons.Twenty percent of State prisonersuicides took place in the morning, withall other times of day varying from 25%(evening and overnight hours) to 30%(afternoon hours).
In both local jails (94%) and Stateprisons (89%), the majority of suicideevents were followed up by theperformance of an autopsy or post-mortem examination by a medicalexaminer or county coroner.
Suicide and Homicide in State Prisons and Local Jails 9
14.3120 months or more18.560-119 months21.424-59 months11.012-23 months12.56-11 months14.91-5 months
%7.4Less than 1 month
Percent of State prisonersuicides, 2001-02
Time servedsince admission
*The median time served is that length of time at which half of theinmates spent less time in custody, and the other half spent more.
93Public-order188Drug107Property
months45days20ViolentCurrent offense
4923Hispanic406Black, non-Hispanic
months21days9White, non-HispanicRace/Hispanic origin
294Femalemonths30days10Male
Gender
months30days9All inmates
State prisonersuicides, 2001-02
Local jail inmatesuicides, 2000-02Characteristic
Median time served since admission*
Table 6. Time served since admission by jail inmates and State prisoners committing suicide, by selectedcharacteristics
aIncludes cafeteria, exercise yard, library, day room, recreationalarea, and workshops.bIncludes inmates on work details or work release, under communitysupervision by the jail/prison, or in transit to/from the facility.cTime of day was not reported for 12 jail and 41 prison suicides; location was not reported for 6 jail and 39 prison suicides.
337918Number of suicidesc
3.41.1Elsewhere3.02.3Outside of the facilityb3.06.1Common areaa4.09.6Temporary holding area
%86.6%80.8Inmate’s cell/roomLocation of suicide event
25.028.4Evening (6 p.m.-midnight)30.424.1Afternoon (noon-6 p.m.)19.919.5Morning (6 a.m.-noon)
%24.7%28.0Overnight (midnight-6 a.m.)Time of day
State prisoners,2001-02
Local jail inmates,2000-02
Percent of inmate suicides
Table 7. Time of day and location of suicide events in local jails and State prisons
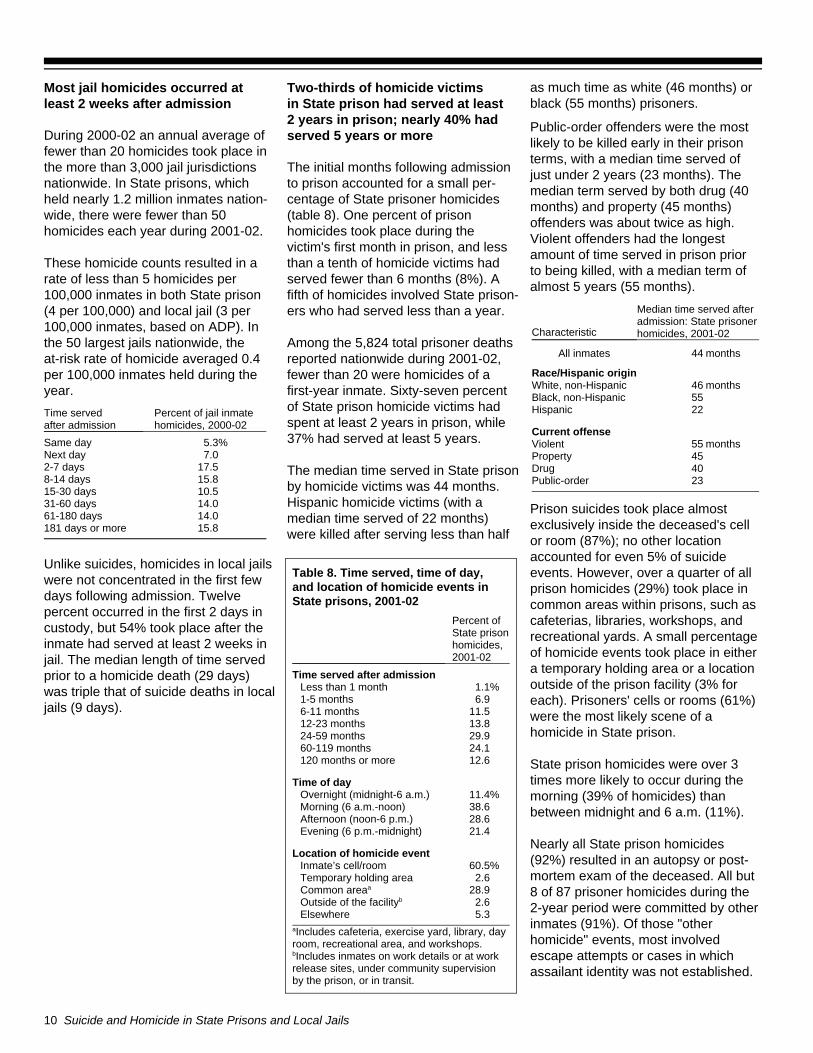
Most jail homicides occurred atleast 2 weeks after admission
During 2000-02 an annual average offewer than 20 homicides took place inthe more than 3,000 jail jurisdictionsnationwide. In State prisons, whichheld nearly 1.2 million inmates nation-wide, there were fewer than 50homicides each year during 2001-02.
These homicide counts resulted in arate of less than 5 homicides per 100,000 inmates in both State prison (4 per 100,000) and local jail (3 per100,000 inmates, based on ADP). Inthe 50 largest jails nationwide, theat-risk rate of homicide averaged 0.4per 100,000 inmates held during theyear.
Unlike suicides, homicides in local jailswere not concentrated in the first fewdays following admission. Twelvepercent occurred in the first 2 days incustody, but 54% took place after theinmate had served at least 2 weeks injail. The median length of time servedprior to a homicide death (29 days)was triple that of suicide deaths in localjails (9 days).
Two-thirds of homicide victims in State prison had served at least 2 years in prison; nearly 40% hadserved 5 years or more
The initial months following admissionto prison accounted for a small per-centage of State prisoner homicides(table 8). One percent of prisonhomicides took place during thevictim's first month in prison, and lessthan a tenth of homicide victims hadserved fewer than 6 months (8%). Afifth of homicides involved State prison-ers who had served less than a year. Among the 5,824 total prisoner deathsreported nationwide during 2001-02,fewer than 20 were homicides of afirst-year inmate. Sixty-seven percentof State prison homicide victims hadspent at least 2 years in prison, while37% had served at least 5 years.
The median time served in State prisonby homicide victims was 44 months.Hispanic homicide victims (with amedian time served of 22 months)were killed after serving less than half
as much time as white (46 months) orblack (55 months) prisoners.
Public-order offenders were the mostlikely to be killed early in their prisonterms, with a median time served ofjust under 2 years (23 months). Themedian term served by both drug (40months) and property (45 months)offenders was about twice as high.Violent offenders had the longestamount of time served in prison prior to being killed, with a median term ofalmost 5 years (55 months).
Prison suicides took place almostexclusively inside the deceased's cellor room (87%); no other locationaccounted for even 5% of suicideevents. However, over a quarter of allprison homicides (29%) took place incommon areas within prisons, such ascafeterias, libraries, workshops, andrecreational yards. A small percentageof homicide events took place in eithera temporary holding area or a location outside of the prison facility (3% foreach). Prisoners' cells or rooms (61%)were the most likely scene of ahomicide in State prison.
State prison homicides were over 3times more likely to occur during themorning (39% of homicides) thanbetween midnight and 6 a.m. (11%).
Nearly all State prison homicides(92%) resulted in an autopsy or post-mortem exam of the deceased. All but8 of 87 prisoner homicides during the2-year period were committed by otherinmates (91%). Of those "otherhomicide" events, most involvedescape attempts or cases in whichassailant identity was not established.
10 Suicide and Homicide in State Prisons and Local Jails
15.8181 days or more14.061-180 days14.031-60 days10.515-30 days15.88-14 days17.52-7 days
7.0Next day%5.3Same day
Percent of jail inmatehomicides, 2000-02
Time servedafter admission
aIncludes cafeteria, exercise yard, library, dayroom, recreational area, and workshops.bIncludes inmates on work details or at workrelease sites, under community supervisionby the prison, or in transit.
5.3Elsewhere2.6Outside of the facilityb
28.9Common areaa2.6Temporary holding area
%60.5Inmate’s cell/roomLocation of homicide event
21.4Evening (6 p.m.-midnight)28.6Afternoon (noon-6 p.m.)38.6Morning (6 a.m.-noon)
%11.4Overnight (midnight-6 a.m.)Time of day
12.6120 months or more24.160-119 months29.924-59 months13.812-23 months11.56-11 months
6.91-5 months%1.1Less than 1 month
Time served after admission
Percent ofState prisonhomicides,2001-02
Table 8. Time served, time of day, and location of homicide events in State prisons, 2001-02
23Public-order40Drug45Property
months55ViolentCurrent offense
22Hispanic55Black, non-Hispanic
months46White, non-HispanicRace/Hispanic origin
months44All inmates
Median time served afteradmission: State prisonerhomicides, 2001-02Characteristic
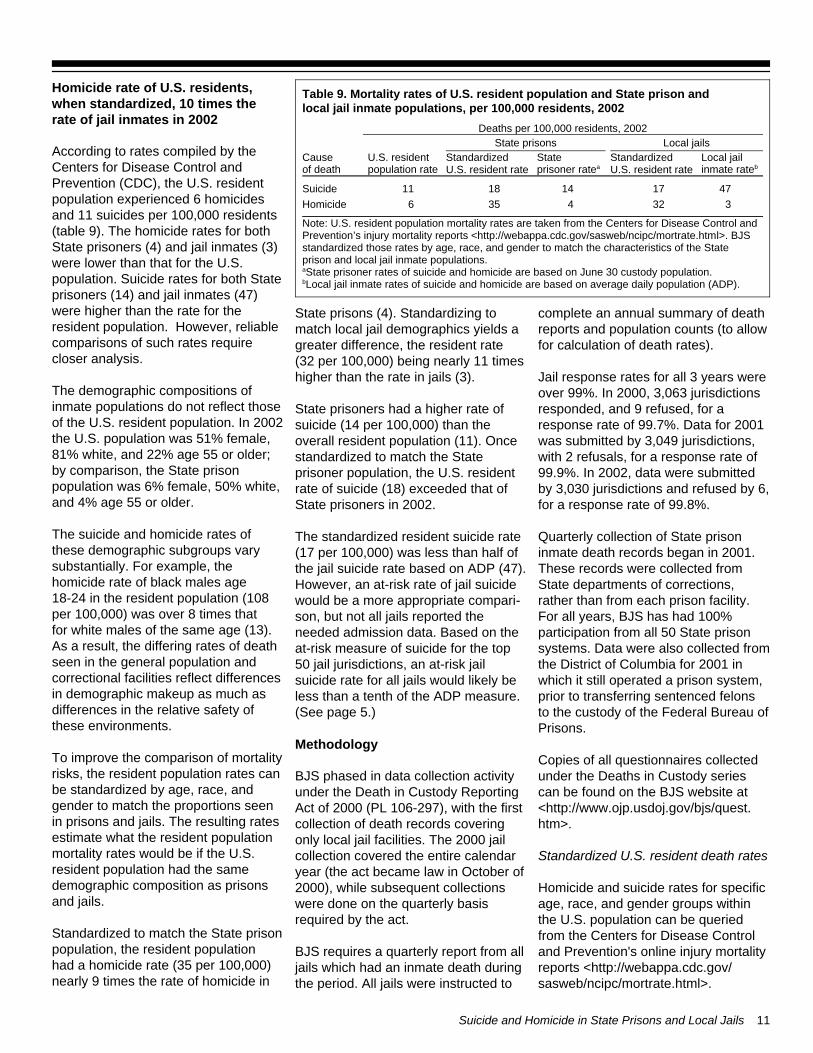
Homicide rate of U.S. residents,when standardized, 10 times the rate of jail inmates in 2002
According to rates compiled by theCenters for Disease Control andPrevention (CDC), the U.S. residentpopulation experienced 6 homicidesand 11 suicides per 100,000 residents (table 9). The homicide rates for bothState prisoners (4) and jail inmates (3)were lower than that for the U.S.population. Suicide rates for both Stateprisoners (14) and jail inmates (47)were higher than the rate for theresident population. However, reliablecomparisons of such rates requirecloser analysis.
The demographic compositions ofinmate populations do not reflect thoseof the U.S. resident population. In 2002the U.S. population was 51% female,81% white, and 22% age 55 or older;by comparison, the State prisonpopulation was 6% female, 50% white,and 4% age 55 or older.
The suicide and homicide rates ofthese demographic subgroups varysubstantially. For example, thehomicide rate of black males age18-24 in the resident population (108per 100,000) was over 8 times thatfor white males of the same age (13).As a result, the differing rates of deathseen in the general population andcorrectional facilities reflect differencesin demographic makeup as much asdifferences in the relative safety ofthese environments.
To improve the comparison of mortalityrisks, the resident population rates canbe standardized by age, race, andgender to match the proportions seenin prisons and jails. The resulting ratesestimate what the resident populationmortality rates would be if the U.S.resident population had the samedemographic composition as prisonsand jails.
Standardized to match the State prisonpopulation, the resident population had a homicide rate (35 per 100,000)nearly 9 times the rate of homicide in
State prisons (4). Standardizing tomatch local jail demographics yields agreater difference, the resident rate (32 per 100,000) being nearly 11 timeshigher than the rate in jails (3).
State prisoners had a higher rate ofsuicide (14 per 100,000) than theoverall resident population (11). Oncestandardized to match the Stateprisoner population, the U.S. residentrate of suicide (18) exceeded that ofState prisoners in 2002.
The standardized resident suicide rate(17 per 100,000) was less than half ofthe jail suicide rate based on ADP (47).However, an at-risk rate of jail suicidewould be a more appropriate compari-son, but not all jails reported theneeded admission data. Based on theat-risk measure of suicide for the top50 jail jurisdictions, an at-risk jailsuicide rate for all jails would likely beless than a tenth of the ADP measure.(See page 5.)
Methodology
BJS phased in data collection activityunder the Death in Custody ReportingAct of 2000 (PL 106-297), with the firstcollection of death records coveringonly local jail facilities. The 2000 jailcollection covered the entire calendaryear (the act became law in October of2000), while subsequent collectionswere done on the quarterly basisrequired by the act.
BJS requires a quarterly report from alljails which had an inmate death duringthe period. All jails were instructed to
complete an annual summary of deathreports and population counts (to allowfor calculation of death rates).
Jail response rates for all 3 years wereover 99%. In 2000, 3,063 jurisdictionsresponded, and 9 refused, for aresponse rate of 99.7%. Data for 2001was submitted by 3,049 jurisdictions,with 2 refusals, for a response rate of99.9%. In 2002, data were submittedby 3,030 jurisdictions and refused by 6,for a response rate of 99.8%.
Quarterly collection of State prisoninmate death records began in 2001.These records were collected fromState departments of corrections,rather than from each prison facility.For all years, BJS has had 100%participation from all 50 State prisonsystems. Data were also collected fromthe District of Columbia for 2001 inwhich it still operated a prison system,prior to transferring sentenced felonsto the custody of the Federal Bureau ofPrisons.
Copies of all questionnaires collectedunder the Deaths in Custody seriescan be found on the BJS website at<http://www.ojp.usdoj.gov/bjs/quest.htm>. Standardized U.S. resident death rates
Homicide and suicide rates for specificage, race, and gender groups withinthe U.S. population can be queriedfrom the Centers for Disease Controland Prevention's online injury mortalityreports <http://webappa.cdc.gov/sasweb/ncipc/mortrate.html>.
Suicide and Homicide in State Prisons and Local Jails 11
Note: U.S. resident population mortality rates are taken from the Centers for Disease Control andPrevention’s injury mortality reports <http://webappa.cdc.gov/sasweb/ncipc/mortrate.html>. BJSstandardized those rates by age, race, and gender to match the characteristics of the State prison and local jail inmate populations.aState prisoner rates of suicide and homicide are based on June 30 custody population.bLocal jail inmate rates of suicide and homicide are based on average daily population (ADP).
3324356Homicide4717141811Suicide
Local jailinmate rateb
StandardizedU.S. resident rate
State prisoner ratea
StandardizedU.S. resident rate
U.S. residentpopulation rate
Cause of death
Local jailsState prisonsDeaths per 100,000 residents, 2002
Table 9. Mortality rates of U.S. resident population and State prison and local jail inmate populations, per 100,000 residents, 2002
For example, the 2002 suicide rate forwhite females, age 35-44, was 7.8per 100,000. These rates were thenstandardized to match the character-istics of State prison and local jailpopulations by weighting the rates bythe proportion of all inmates repre-sented by that subgroup. The sum ofall of the weighted subgroup ratesprovides the standardized rate for theresident population.
Population proportions for thesegender, race and age subgroups ofinmates were derived from theNational Corrections ReportingProgram (for State prisoners) and the2002 Survey of Inmates in LocalJails (for jail inmates).
Population bases for mortality rates
Annual mortality rates were based ondifferent population counts:
1. For prisons the custody populationon June 30 of each year.
2. For local jails the average dailypopulation in each calendar year.
Estimates of the population at risk forthe largest jail jurisdictions combinedthe population on January 1 andadmissions during the year.
12 Suicide and Homicide in State Prisons and Local Jails
The Bureau of Justice Statistics is the statistical agency of the U.S.Department of Justice. Lawrence A. Greenfeld is director.
Christopher J. Mumola wrote thisreport, under the supervision of AllenJ. Beck. Doris J. James, Lauren E.Glaze, and Rebecca L. Medwayverified the report, and Tom Hesteredited it.
Christopher J. Mumola, under thesupervision of Allen J. Beck,designed the survey, developed thequestionnaires, and monitored datacollection and data processing.
Data collection and processing ofState prison death records werecarried out by Lara Reynolds. Datacollection and processing of local jaildeath records were carried out byPamela Butler, Margaret Ferguson,Patricia Torreyson, and Pearl Chase,under the supervision of CharleneSebold, Governments Division,Census Bureau, U.S. Department ofCommerce.
August 2005 NCJ 210036
Office of Justice ProgramsPartnerships for Safer Communities
http://www.ojp.usdoj.gov
Obtain the most recent data oninmate deaths from Key Facts at a Glance on the BJS Internet site:http://www.ojp.usdoj.gov/bjs/glance/shipj.htm