
SUGAR CANE EXPANSION: DOES IT CONTRIBUTE...
26
SUGAR CANE EXPANSION: DOES IT CONTRIBUTE TO AMAZON DEFORESTATION? Eduardo Rodrigues de Castro, Federal University of São Carlos, [email protected] Erly Cardoso Teixeira, Federal University of Viçosa, [email protected]. Constanza Valdes, Economic Research Service – USDA, [email protected]. Selected Paper prepared for presentation at the International Association of Agricultural Economists (IAAE) Triennial Conference, Foz do Iguaçu, Brazil, 18-24 August, 2012. Copyright 2012 by Eduardo Rodrigues de Castro, Erly Cardoso Teixeira, Constanza Valdes. All rights reserved. Readers may make verbatim copies of this document for non-commercial purposes by any means, provided that this copyright notice appears on all such copies. The findings, interpretations, and conclusions expressed in this paper do not necessarily reflect the views of the Federal University of São Carlos, Federal University of Viçosa or the Economic Research Service, United States Department of Agriculture.
Transcript of SUGAR CANE EXPANSION: DOES IT CONTRIBUTE...
SUGAR CANE EXPANSION: DOES IT CONTRIBUTE TO AMAZON
DEFORESTATION?
Eduardo Rodrigues de Castro, Federal University of São Carlos, [email protected]
Erly Cardoso Teixeira, Federal University of Viçosa, [email protected].
Constanza Valdes, Economic Research Service – USDA, [email protected].
Selected Paper prepared for presentation at the International Association of Agricultural
Economists (IAAE) Triennial Conference, Foz do Iguaçu, Brazil, 18-24 August, 2012.
Copyright 2012 by Eduardo Rodrigues de Castro, Erly Cardoso Teixeira, Constanza Valdes. All
rights reserved. Readers may make verbatim copies of this document for non-commercial
purposes by any means, provided that this copyright notice appears on all such copies.
The findings, interpretations, and conclusions expressed in this paper do not necessarily reflect
the views of the Federal University of São Carlos, Federal University of Viçosa or the
Economic Research Service, United States Department of Agriculture.
2
Sugarcane Expansion: Does It Contribute to the Amazon
Deforestation?
Abstract
The aim of this study is to investigate the direct and indirect impacts of sugarcane
expansion on deforestation in the Brazilian Amazon from 2001 to 2008. The analysis is
based on the multi-output production theory where the annual agricultural acreage
represents the Production Possibility Frontier. It assumes that agricultural area is
limited and any agricultural expansion occurs over traditional agricultural areas
displacing some crops and pushing them to the agricultural frontier, where forests will be
cleared. The econometric analysis was carried out using a panel data model where the
counties are the cross section unity. The output supply for São Paulo state and the
agricultural frontier states (Mato Grosso, Rondônia, Maranhão and Tocantins) in the
Center-West region are estimated separately, considering the acreage as proxy of the
output and the crop prices of sugarcane, soybean, corn, beans, cotton and the total
annual acreage as the independent variables. The impact of crop prices and the annual
agricultural crop expansion over the deforestation acreage are also estimated. Our best
estimates reveal that it is not possible to establish a direct connection between sugarcane
area expansion and Amazon deforestation, and while the indirect effects are very small,
sugarcane also expanded over pastures and perennial crops, leading to an overall
increase in annual crop area.
Keywords: Brazil, sugarcane, agricultural frontier, Amazon deforestation
JEL Classification: Q110, Q160, Q230
1. Introduction
The commercial production of Brazilian flex-fuel engine vehicles, which run on
any fuel combination—from 100 percent ethanol to 100 percent gasoline, started in 2003
and resulted very attractive for consumers who own these cars, as ethanol and gasoline
were made perfect substitute goods. Currently more than 90 percent of all light vehicles
sold in Brazil use flex-fuel technology and, as a consequence, there has been a very rapid
increase in ethanol demand. However, at the center of the controversy surrounding
ethanol expansion, lies the claim made by several researchers (Searchinger et al., 2008;
Fargione et al., 2008; Fabiosa et al., 2010) that higher ethanol demand has led to land-use
3
changes, with food crops being replaced with sugarcane production in traditional areas to
support the ethanol demand. One could argue that as long as the agricultural frontier has
reached the Northern region of the country, sugarcane expansion may contribute, directly
or indirectly, to the Brazilian Amazon deforestation.
Besides its potential economic advantages, sugarcane ethanol is also considered
an advanced biofuel that reduces greenhouse gas (GHG) emissions by 61 percent,
compared with gasoline GHG emissions (EPA, 2010). However, Searchinger et al.
(2008) argue that the benefits of biofuel use have been overestimated: sugarcane
expansion would have replaced crops in agricultural areas which already contributed to
lower the GHG emissions. Besides, while displacing food crops from their traditional
areas, the new sugarcane acreage contributes to raising food prices and pushes the
agricultural frontier towards the Amazon forest. The evidence for this argument would be
the positive correlation between soybean prices and Amazon deforestation. On the other
hand, Brandão et al. (2005) have analyzed soybean expansion in the early 2000’s and
found evidences that it has been occurring over low productivity livestock areas and has
had low impact on Brazilian Amazon deforestation.
However, evidence exists that increased livestock activities in the Legal Amazon
region1 leads to more deforestation, with tax and credit incentives contributing to
livestock expansion in this region (Margulis, 2003). Over the past decade, the beef cattle
herd has increased by 25 million head in the Legal Amazon region, which account for 78
percent of the increase in the total cattle herd in Brazil, close to 33 million head. In the
State of São Paulo, Brazil’s leading cane-producing State, the cattle herd (including beef and
dairy cattle) decreased by about 2 million head, a number corresponding to the 8 percent
growth in the cattle herd in the Amazon region during 2000-2011 (IGBE, 2011). Still,
some researchers (Nassar et al. 2008) have found that the direct contribution of sugarcane
to deforestation is very low. In the Brazilian Center-South region (where 90 percent of
Brazilian sugarcane is grown) sugarcane expansion has been more intensive over the past
1 The Legal Amazon region also includes counties of the states of Mato Grosso and Maranhão, besides the
states of the North region (Amazônia, Pará, Tocantins, Rondônia, Roraima, Acre and Amapá).
4
few years; about 70 percent of the sugarcane acreage expansion occurred over pasture
areas. Data from the latest Agricultural Census indicates that in 1996-2006 pastureland
in São Paulo decreased 4 percent (668 thousand hectares), while sugarcane area increased
41 percent (865 thousand hectares). Nassar et al. (2008) found that close to 30 percent of
the expansion in sugarcane area in the São Paulo region took place over traditional crop
areas.
IBGE data indicates that between 2002 and 2008 forest land was replaced only in
three states: Minas Gerais (1 percent), Mato Grosso do Sul (2 percent), and Mato Grosso
(8 percent), while the expansion in sugarcane area in these same states was 15 percent, 4
percent, and 3 percent, respectively. New sugarcane areas in Mato Grosso are also close
to the Amazon region, but they correspond to less than 1 percent of the total new
sugarcane areas in this period (Nassar et al., 2008).
The indirect impact of sugarcane expansion on the Amazon forest region takes
place as the prices of crops being replaced by sugarcane in São Paulo (i.e., soybeans,
corn, cotton, beans) increase enough to stimulate farmers to plant in new areas,
principally in the agricultural frontier. However, given São Paulo’s share in total acreage
for these crops (soybeans: 3 percent; corn: 8 percent; cotton: 7 percent; and beans: 5
percent), it is most likely that sugarcane would have a minimal or no impact on the prices
of these crops. Moreover, Coelho et al. (2007) found corn to be the most substituted crop
during 2000-2008, with corn acreage decreasing by 120 thousand hectares, surpassing
cotton (49 thousand hectares), beans (33 thousand hectares), and soybeans (9 thousand
hectares). In the case of livestock production, some other studies found that while cattle
numbers increased, pastureland decreased –a reflection of increased livestock
productivity (Coelho et al., 2007; Torquato, 2006).
Moreover, Chagas et al. (2008) contend that under the assumption that sugarcane
production is evenly split for ethanol and sugar production, the area designated to ethanol
production corresponds to just 1 percent of current agricultural area in Brazil. In addition,
the authors contend, that while most of the replaced pastureland is of low productivity,
5
and would provide needed area to support sugarcane expansion, thus reducing the
pressure over food crop areas or forests. The present study aims to analyze the possible
impact of sugarcane expansion in São Paulo on the expansion of the agricultural frontier
and, ultimately, the impact on Brazil’s Amazon deforestation. While our study is based
on panel data analysis for the period from 2001 to 2008, the innovation in the study is the
inclusion of all São Paulo State counties and all counties in Brazil’s agricultural frontier.
The analysis is carried out in three steps: first, the supply for crops produced in São Paulo
State is estimated; second, the supply for crops produced in the Center-West agricultural
frontier region is estimated as well, and finally, the economic impact of individual crop
prices on deforestation in the agricultural frontier region of Brazil is estimated. The
paper is organized as follows: the next section presents the modeling framework for the
analysis, followed by the methodology; and then the results are discussed, following with
concluding remarks.
2. Modeling framework
The analysis is based on the multi output production theory. According to
Chambers (1986), in the multi output framework the problem is to obtain the maximum
value that a given input endowment can produce. In this case, a given input bundle can
produce the array of outputs summarized by the producible-output set. São Paulo State is
one of the most traditional agricultural areas in Brazil and most of its producible areas are
already in use. The agricultural land is considered as a fixed endowment and land use will
be determined by crop prices.
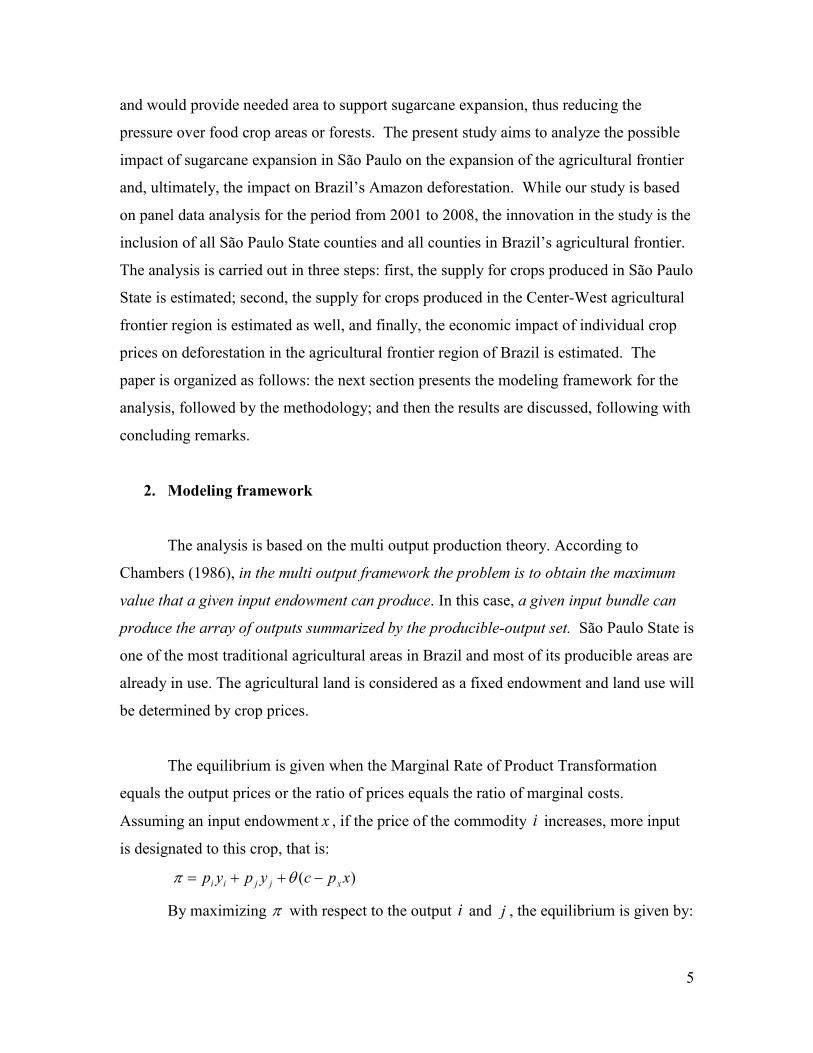
The equilibrium is given when the Marginal Rate of Product Transformation
equals the output prices or the ratio of prices equals the ratio of marginal costs.
Assuming an input endowment x , if the price of the commodity i increases, more input
is designated to this crop, that is:
)( xpcypyp xjjii −++= θπ
By maximizing π with respect to the output i and j , the equilibrium is given by:
6
j
i
j
i
MC
MC
p
p=
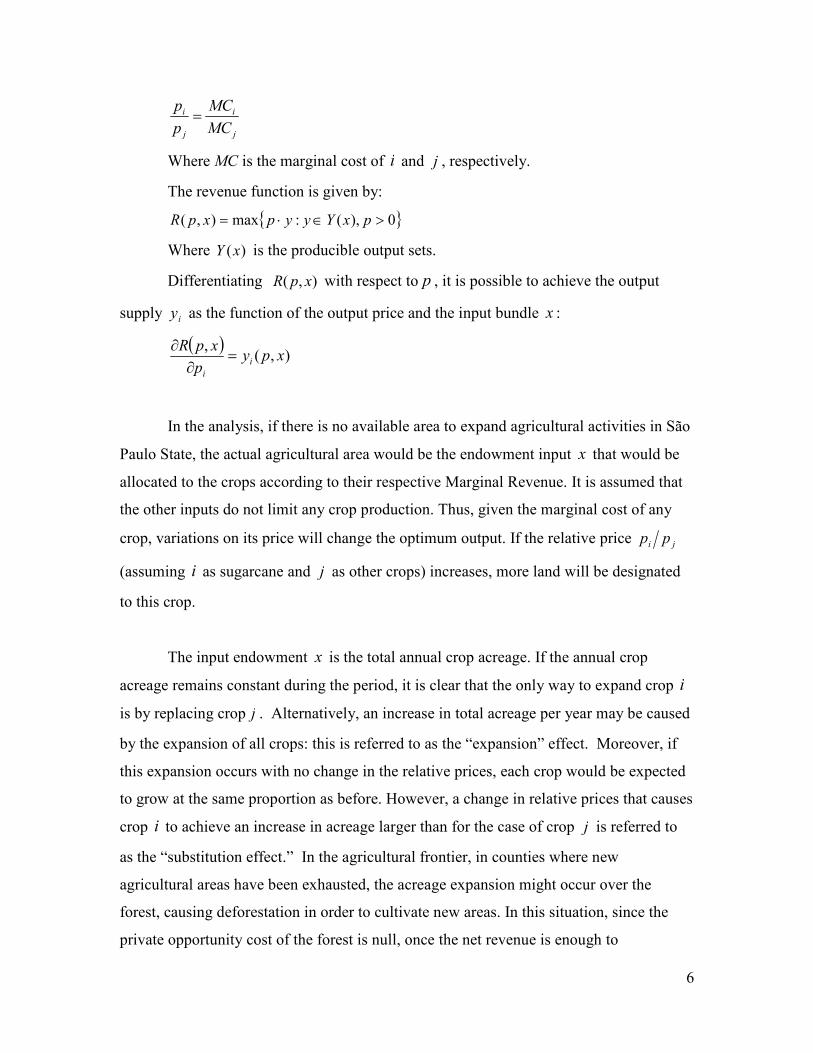
Where MC is the marginal cost of i and j , respectively.
The revenue function is given by:
{ }0),(:max),( >∈⋅= pxYyypxpR
Where )(xY is the producible output sets.
Differentiating ),( xpR with respect to p , it is possible to achieve the output
supply iy as the function of the output price and the input bundle x :
( )
),(,
xpyp
xpRi
i
=∂
∂
In the analysis, if there is no available area to expand agricultural activities in São
Paulo State, the actual agricultural area would be the endowment input x that would be
allocated to the crops according to their respective Marginal Revenue. It is assumed that
the other inputs do not limit any crop production. Thus, given the marginal cost of any
crop, variations on its price will change the optimum output. If the relative price ji pp
(assuming i as sugarcane and j as other crops) increases, more land will be designated
to this crop.
The input endowment x is the total annual crop acreage. If the annual crop
acreage remains constant during the period, it is clear that the only way to expand crop i
is by replacing crop j . Alternatively, an increase in total acreage per year may be caused
by the expansion of all crops: this is referred to as the “expansion” effect. Moreover, if
this expansion occurs with no change in the relative prices, each crop would be expected
to grow at the same proportion as before. However, a change in relative prices that causes
crop i to achieve an increase in acreage larger than for the case of crop j is referred to
as the “substitution effect.” In the agricultural frontier, in counties where new
agricultural areas have been exhausted, the acreage expansion might occur over the
forest, causing deforestation in order to cultivate new areas. In this situation, since the
private opportunity cost of the forest is null, once the net revenue is enough to
7
compensate the deforestation costs, it is profitable to incorporate forest areas for
agricultural production2.
3. Methodology3
The estimation considers the impact of the crop prices on their respective acreage.
The cultivated crops are: sugarcane, soybean, corn, beans and cotton.
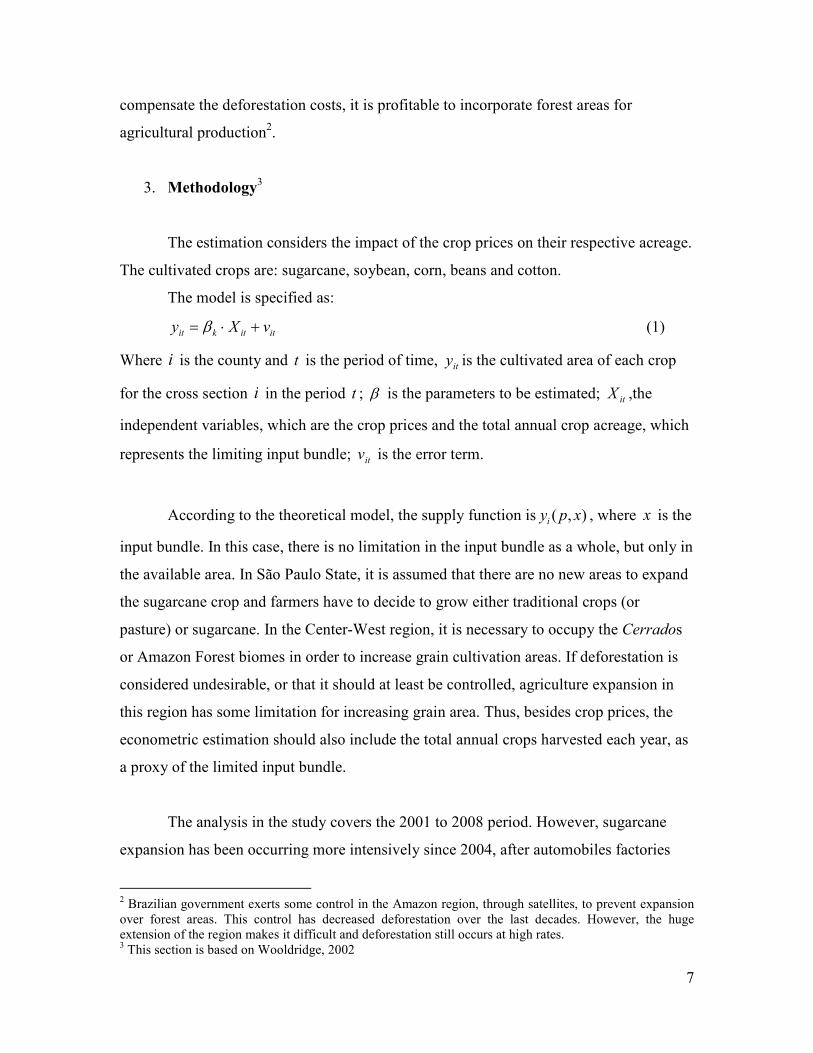
The model is specified as:
ititkit vXy +⋅= β (1)
Where i is the county and t is the period of time, ity is the cultivated area of each crop
for the cross section i in the period t ; β is the parameters to be estimated; itX ,the
independent variables, which are the crop prices and the total annual crop acreage, which
represents the limiting input bundle; itv is the error term.
According to the theoretical model, the supply function is ),( xpyi , where x is the
input bundle. In this case, there is no limitation in the input bundle as a whole, but only in
the available area. In São Paulo State, it is assumed that there are no new areas to expand
the sugarcane crop and farmers have to decide to grow either traditional crops (or
pasture) or sugarcane. In the Center-West region, it is necessary to occupy the Cerrados
or Amazon Forest biomes in order to increase grain cultivation areas. If deforestation is
considered undesirable, or that it should at least be controlled, agriculture expansion in
this region has some limitation for increasing grain area. Thus, besides crop prices, the
econometric estimation should also include the total annual crops harvested each year, as
a proxy of the limited input bundle.
The analysis in the study covers the 2001 to 2008 period. However, sugarcane
expansion has been occurring more intensively since 2004, after automobiles factories
2 Brazilian government exerts some control in the Amazon region, through satellites, to prevent expansion
over forest areas. This control has decreased deforestation over the last decades. However, the huge
extension of the region makes it difficult and deforestation still occurs at high rates. 3 This section is based on Wooldridge, 2002
8
had started producing flex-fuel vehicles. In order to capture this effect, a dummy
coefficient is also included for the total annual crop area, for the period from 2004 to
2008.
In the econometric estimation, both in São Paulo State and the Center-West
Cerrados area, iX is:
51 : xx are the annual prices of sugarcane, soybean, corn, beans and cotton;
76 : xx are the total annual crop area and its dummy coefficient (2004-08);
In the Center-West region, it is also estimated the influence of these independent
variables on deforestation rates in that region. This estimation included one more
independent variable: remaining forest.
The model specified in (1) is the Pooled Ordinary Least Squares estimation,
which is unbiased and consistent under the assumptions:
0)'( =itit vxE , Tt ,...2,1= (2)
kxxrankT
t
itit =
∑=1
)'( (3)
;,...,2,1),'()'( 22 TtxxExxvE ititititit ==σ where )( 22
itvE=σ for all t ; (4)
0)( =isitisit xxvvE , for Tstst ...2,1,, =≠ ; (5)
The first assumption states no correlation between tx and tv for each time period
and the second rules out perfect linear dependencies among explanatory variables. The
third assumptions imply homokedasticity along the time period and no correlation
between the errors over different periods of time. Besides, it implies ( ) Tii IvvE 2' σ= .
According to Wooldridge (2002), under assumptions one and two, the pooled OLS
estimator is consistent and asymptotically normal, and if the third assumptions hold, the
asymptotic variance of the estimator is given by ( )[ ] 6XXEA ii
12 ')ˆvar(−=σβ , and the
appropriate estimator is given by:
1
1 1
2 'ˆ)ˆr(av
−
= =
= ∑∑
6
i
T
t
itit xxA σβ (6)
Where 2σ is the usual OLS variance estimator from the pooled regression, given by:

9
k6T
vv itit
−=
ˆ'ˆˆ 2σ (7)
In the panel data estimation, while some of the independent variables for each unit
can vary over time, others can be time invariant. In this case, these variables are related to
the characteristic of each unit and are not usually observable. When the unobserved
effects ( ic ) for each cross section unit are not correlated with the independent variables
specified in iX , they can be assumed to be part of the error term, and the model specified
in (1) would be correctly specified. Otherwise, 0)'( ≠tt vxE and the pooled OLS estimator
is no longer unbiased. If this is the case, the unobserved effects can be specified in two
alternative ways: the Fixed Effects model and Random effects model. According to
Wooldridge (2002) and Greene (2005) the difference between both approaches is whether
these are, or not, correlated with the independent variables specified in .
In this research, the cross section unities are the counties, for the time period from
2001 to 2008. The sugarcane production in São Paulo State, for example, is concentrated
in many regions but it is not grown in every county of the State. This is also true in the
case of soybeans grown in Mato Grosso, the main soybean producing Brazilian State. To
avoid the inclusion of counties not producing a crop, only those counties reporting some
production in all the years of the period under analysis were selected. According to Judge
et al. (1988), the most appropriated approach in this case is the Fixed Effects analysis.
According to Wooldridge (2002), FE is more robust than RE and allows the estimation of
the unobserved effect for each cross section unit. The disadvantage of FE is that it is not
possible to specify the time constant in iX . Initially, the necessary assumption is:
( ) TtcXvE iiit ,...2,1;0, == (8)
Which is the strict exogeneity of and iv , conditional to the unobserved effect.
To eliminate the unobserved effects from the equation to be estimated, the time
averaged equation for each section:
iiiki vcXy ++⋅= β (9)
iX
iX
10
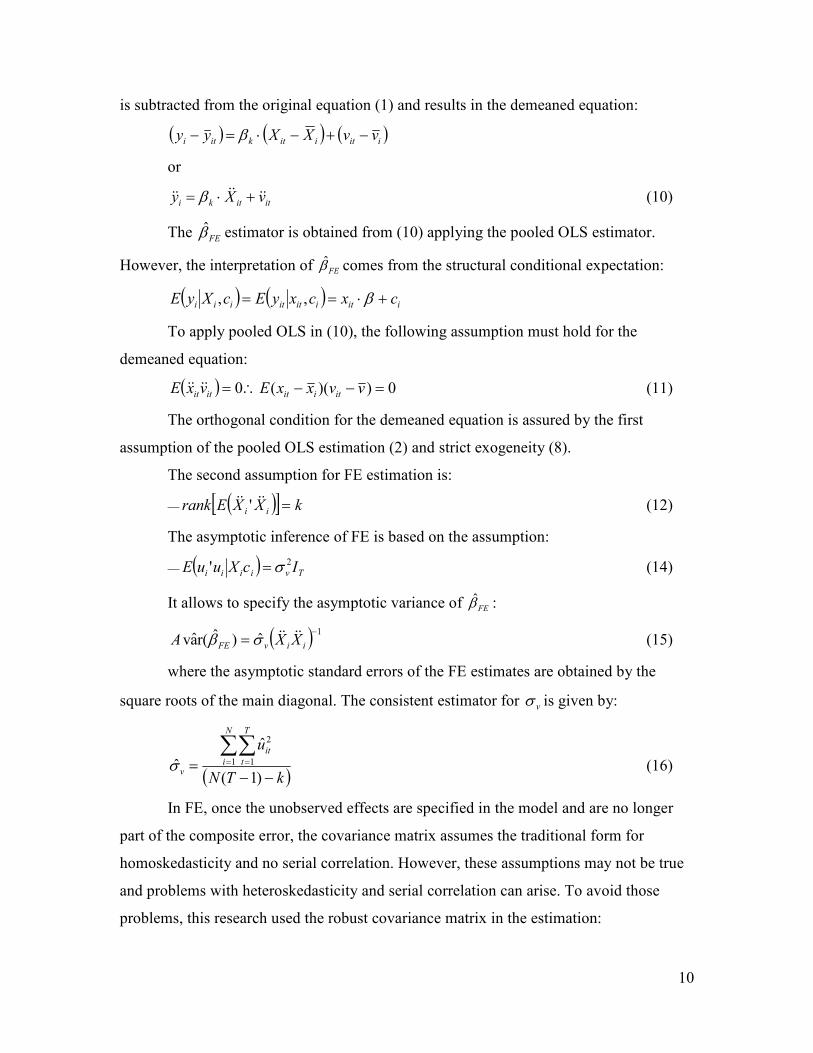
is subtracted from the original equation (1) and results in the demeaned equation:
( ) ( ) ( )iitiitkiti vvXXyy −+−⋅=− β
or
ititki vXy &&&&&& +⋅= β (10)
The FEβ estimator is obtained from (10) applying the pooled OLS estimator.
However, the interpretation of comes from the structural conditional expectation:
( ) ( ) iitiititiii cxcxyEcXyE +⋅== β,,
To apply pooled OLS in (10), the following assumption must hold for the
demeaned equation:
( ) 0))((0 =−−∴= vvxxEvxE itiititit&&&& (11)
The orthogonal condition for the demeaned equation is assured by the first
assumption of the pooled OLS estimation (2) and strict exogeneity (8).
The second assumption for FE estimation is:
( )[ ] kXXErank ii =&&&& ' (12)
The asymptotic inference of FE is based on the assumption:
( ) Tviiii IcXuuE 2' σ= (14)
It allows to specify the asymptotic variance of :
( ) 1ˆ)ˆr(av
−= iivFE XXA &&&&σβ (15)
where the asymptotic standard errors of the FE estimates are obtained by the
square roots of the main diagonal. The consistent estimator for vσ is given by:
( )kT6
u6
i
T
t
it
v −−=
∑∑= =
)1(
ˆ
ˆ 1 1
2
σ (16)
In FE, once the unobserved effects are specified in the model and are no longer
part of the composite error, the covariance matrix assumes the traditional form for
homoskedasticity and no serial correlation. However, these assumptions may not be true
and problems with heteroskedasticity and serial correlation can arise. To avoid those
problems, this research used the robust covariance matrix in the estimation:
FEβ
FEβ

11
( ) ( ) 1
1
1''ˆˆ'')ˆr(av
−
=
−
= ∑ ii
6
i
iiiiiiFE XXXvvXXXA &&&&&&&&&&&&β (17)
These estimates are carried out using the Matlab software.
Acreage decisions are based on the expected prices. Thus, in order to incorporate
the expectation formation, this analysis also uses the Quasi Rational Expectations (QRE)
model. It is based on the Rational Expectations Model which incorporates the hypothesis
that the “economic agents make purposeful and efficient use of information just as they
do with other scarce resources, in optimizing their decisions.” The alternative approach
(the Quasi Rational Expectations) has the same theoretical background and it is easier to
apply than the Rational Expectations, since it neglects some of the restrictions imposed
by this model (Nerlove, 2001). While RE proposed to incorporate all available
information, which causes some problems in the estimation, QRE proposes two-step
estimation.
To illustrate this, the following model is assumed:
ttt wbzaY ++= +1
Where tw is identically, independently distributed as ),0(2
wW6 σ and 1+tz is the
variable that incorporates the expectations. The QRE in its simple approach consists in
estimating tz from its past values using an autoregressive model and then, substituting
1+tz for the calculated value 1ˆ +tz . This is what is done in this research, taking the forecast
values for the crop prices, which are used in the panel data model estimation. The
forecast values are estimated based on the ARIMA model, using the Eviews software
system (2004).
4. Results and Discussion
The direct impacts from sugarcane expansion on deforestation would be reflected
in new crop areas in the forest region. Our analysis indicates that there has been
sugarcane expansion and deforestation in four states along the agricultural frontier:
Rondônia, Mato Grosso, Tocantins and Maranhão. While Mato Grosso has long been an
12
important agricultural producer in the agricultural frontier and Brazil’s main soybean
producer, the “new” agricultural frontier is represented by Mapito (in the State of
Maranhão, Tocantins and Piauí). In addition, the lower border of the Amazon forest
crosses these states, and encompass part of the Amazon biome.
Table 1 presents data for these states and selected regions for sugarcane and crop
expansion and deforestation. In Maranhão, sugarcane area increased in all five regions,
but more intensively in Western, Eastern and Southern Maranhão regions. Western
Maranhão presented the highest growth (22.9 percent) but the sugarcane area in this
region represents just 0.51 percent of the total annual crop area: total acreage increased
by 1,475 hectares while forest area decreased by 1,266,910 hectares. In Southern
Maranhão, sugarcane represents the largest share (5.91 percent) of total annual crop
acreage; here sugarcane area increased by 14,332 hectares while the reduction in the
forest area was 6,450 hectares. In Eastern Maranhão, sugarcane area increased by 12,376
hectares, an amount similar to the reduction in forest area (12,830 hectares). However, its
participation in total annual crop acreage is just 2.83 percent and there is no evidence that
deforestation was a result of sugarcane expansion.
In Mato Grosso State, the most significant growth in sugarcane acreage took place
in the Northern region (growth rate of 9.12 percent per year), but it has a very low
participation in total annual crop area (0.86 percent). In this region, forest area decreased
by 3,770,440 hectares, while annual crops increased by 2,972,694 hectares. South-
western Mato Grosso has 45.4 percent of its annual crop area cultivated with sugarcane
and in the 2000-2008 period, area cultivated to sugarcane grew 5.39 percent per year to a
total of 52,929 hectares while forest area decreased by 209,250 hectares (representing a
2.14 percent annual decline in the same period). For all other regions in this State, the
increase in sugarcane area is lower than the decrease in forest area, except for South-
Western Mato Grosso, where the two rates are close. Reduced forest area has been more
significantly in Northern, Northeastern and Southeastern Mato-Grosso, where annual
crop acreage has increased significantly.

13
In Rondônia, just four regions (Ariquemes, Alvorada d’Oeste, Alvorada and
Cacoal) register significant growth in sugarcane acreage, but the participation of this crop
in the annual crop acreage is below 1 percent, except for Cacoal, with 2.02 percent. The
growth in this region did not show any significant trend, but it was the most significant in
terms of acreage (2,546 hectares). It is worth highlighting that in all regions in Rondônia
State, the sugarcane acreage growth and the annual crop acreage growth is significantly
lower than the deforested area. In Tocantins, only three regions – Bico do Papagaio,
Araguaína and Miracema do Tocantins show a small growth in sugarcane acreage, and
lower than the deforested area registered.
To analyze the indirect impacts from sugarcane expansion on the Amazon
deforestation, we first estimate the impact of sugarcane expansion in São Paulo State by
estimating the output supply for sugarcane, soybean, corn, beans and cotton. A panel data
analysis is used considering the acreage as proxy of the output production, where the
counties are the cross section unities for the period 2001 to 2008. The independent
variables are the crop prices, while the annual crop acreage is used as the endowment
input, which represents the production possibility frontier. To incorporate the expectation
formation, the expected prices are estimated using an ARIMA model, considering the
annual series from 1971 to 2010 for each individual crop. Results from this estimation are
presented in Table 2.
A proxy coefficient for the annual crop acreage is used for the period 2004 to
2008 to capture the effect of the most recent sugarcane expansion. It is estimated a single
supply function for each crop, taking into consideration only the counties reporting
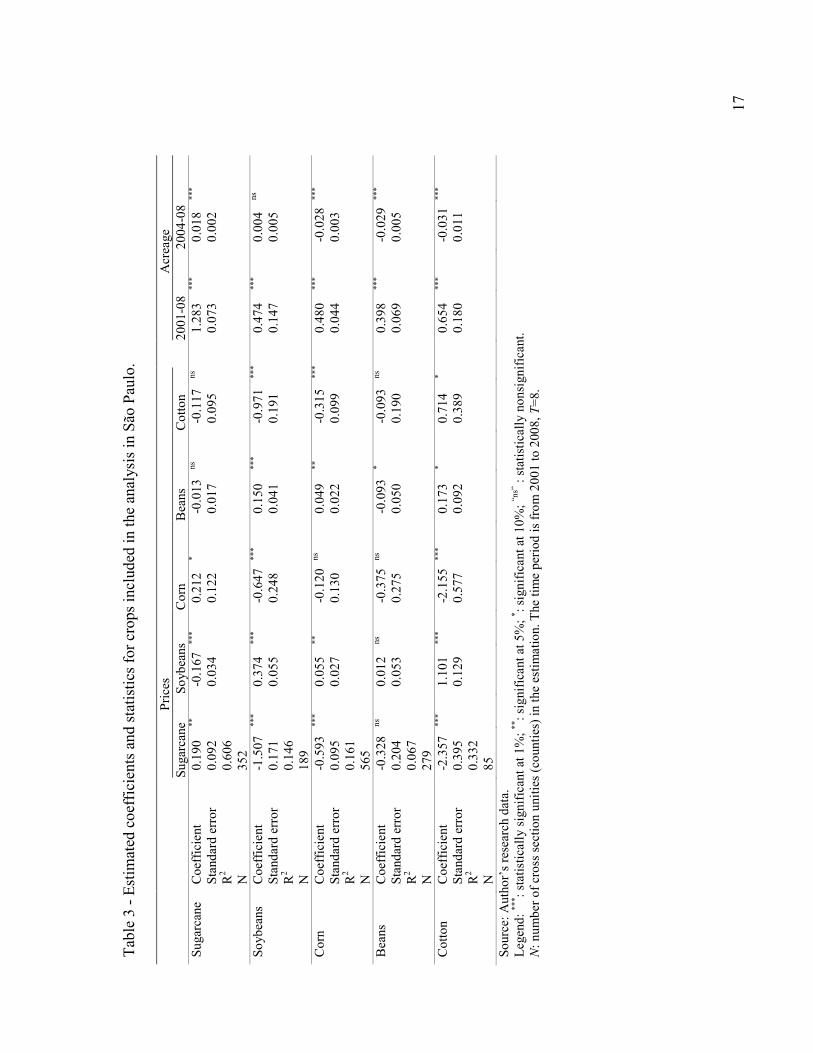
production in the period of analysis; results are presented in Table 3. The own price
elasticities are consistent with the theory, except for beans, which presented a negative
response to its own price, statistically significant at the 10 percent level. A possible
explanation for this result may be the fact that this crop is cultivated three times during
the year with average prices and acreage for the whole year likely misestimating the
prices and production relationship. Cross prices of sugarcane on other crops supply are
negative and statistically significant, except for the case of beans. The impact of
14
sugarcane prices on cotton acreage is the highest, followed by soybeans acreage. The
cross price elasticity of sugarcane is higher than the own price elasticity for soybean, corn
and cotton, which indicates the predominance of the former price on crop acreage. All
crops included in the analysis had their acreage reduced during the 2000-2008 period.
The “Annual Crops” variable represents the area available to plant these crops,
which is limited and the decision to plant one crop over another will depend on expected
returns. The highest elasticity was observed for the case of sugarcane supply (1.283). A
dummy variable was included to capture the most recent expansion of sugarcane resulting
after the adoption of flex fuel technology in 2003. During this period, the annual crop
acreage is positive and statistically significant for sugarcane supply, but corn, beans and
cotton were negatively affected by the annual acreage in the 2004-2008.

15
Tab
le 1
– S
ugar
cane
and c
rops ex
pan
sion a
nd d
efore
stat
ion in sel
ecte
d reg
ions of M
aran
hão
, M
ato G
ross
o, R
ondônia
and T
oca
ntins.
Sourc
es: A
uth
or’s ca
lcula
tions bas
ed o
n c
rop a
reas
as re
ported
by IBG
E; fo
rest a
reas
as re
ported
by IN
PE. N
ote
s: 1
– A
nnual
Gro
wth
: Exponen
tial
Gro
wth
for su
gar
cane
crop for
2000-2
008; fo
r def
ore
stat
ion a
nd fore
st a
rea
rem
ainin
g for 2001-2
008; 2 –
Cro
p shar
e of su
gar
cane
and fore
st rem
ainin
g a
rea:
2005-2
008 a
ver
age.
Sugar
cane
A
nnual
Cro
ps
Fore
st (ha)
Annual
Gro
wth
(%
)
Sta
te
Reg
ion
Annual
gro
wth
(%
)1
Acr
. V
ar. ( ha)
Shar
e (%
)
Acr
. V
ar. (h
a)
D
efore
sted
Rem
ain
ing
D
efore
stat
ion
Fore
st
Maranhão
Norther
n M
aran
hão
4.1
3
99
0.1
2
47.7
48
-1
91.5
80
2.0
39.0
90
-3
5.9
1
-1.1
5
Wes
tern
M
aran
hão
22.9
0
1.4
75
0.5
1
36.7
97
-1
.266.9
10
1.9
49.6
03
-2
7.1
9
-7.3
7
Cen
tral
M
aran
hão
6.4
3
429
0.4
6
22.2
26
-2
36.8
20
867.1
25
0.0
0
-3.4
8
Eas
tern
M
aran
hão
16.1
0
12.3
76
2.8
3
138.7
63
-1
2.8
30
1.7
02.1
73
0.0
0
-0.1
1
South
ern M
aran
hão
10.2
5
14.3
32
5.9
1
169.7
50
-6
.450
17.4
48
0.0
0
-5.7
8
Mato Grosso
Norther
n M
ato-g
ross
o
9.1
2
25.6
66
0.8
6
2.9
72.6
94
-3
.770.4
40
25.8
87.7
60
-1
6.4
2
-1.9
9
Northea
ster
n M
atogro
sso
2.0
3
496
0.7
5
451.6
10
-8
70.8
90
4.2
26.2
70
-1
8.8
3
-2.6
2
South
wes
tern
Mat
o-g
ross
o
5.3
9
52.9
29
45.4
0
100.4
21
-2
09.2
50
1.1
85.0
30
-2
7.0
6
-2.1
4
Cen
t.-S
outh
ern M
ato-g
ross
o
0.0
0
-1.9
51
6.7
4
45.6
41
-7
8.8
30
796.3
53
-2
2.4
7
-1.3
4
South
easter
n M
ato
-gro
sso
3.8
1
6.7
04
1.6
9
513.2
16
-7
.600
281.2
88
0.0
0
-0.3
7
Rondonia
Porto V
elho
0.0
0
-15
0.2
5
14.3
13
-8
54.0
20
4.5
59.3
65
0.0
0
-2.5
6
Guaj
ará-
Mirim
0.0
0
7
0.2
5
4.6
04
-2
31.5
30
2.9
06.4
25
-1
4.2
4
-1.1
2
Ariquem
es
29.8
6
45
0.1
4
1.7
40
-2
99.6
90
1.1
57.4
88
-1
9.2
0
-3.4
1
Ji-P
aran
á 0.0
0
-9
0.2
1
-2
3.9
52
-8
7.0
10
973.2
78
-2
7.5
8
-1.2
3
Alv
ora
da
D'O
este
16.5
1
32
0.3
6
-1
6.0
13
-9
8.7
10
635.0
83
-1
9.2
1
-2.0
7
Cac
oal
0.0
0
2.5
46
2.0
2
-2
3.5
65
-1
51.3
40
924.6
73
-1
9.7
5
-2.1
7
Vilhena
36.2
9
259
0.1
3
67.1
48
-1
58.6
00
1.4
50.3
10
0.0
0
-1.6
2
Colo
rado d
o O
este
0.0
0
-71
0.0
7
41.1
75
-5
63.5
0
453.3
00
0.0
0
-1.8
2
Tocantins
Bic
o d
o P
apag
aio
21.2
5
50
0.3
4
2.6
12
-3
2.1
60
124.0
38
-1
7.8
1
-3.5
1
Ara
guaí
na
78.8
4
1.0
47
1.5
5
20.9
05
-4
9.8
00
211.7
73
0.0
0
-3.2
1
Mirac
em
a do T
oca
ntins
0.0
0
38
0.0
4
40.4
51
-2
1.9
00
178.2
20
-2
4.7
0
-1.6
7
Rio
Form
oso
-7
.32
-157
0.2
2
23.1
13
-6
.950
486.7
93
0.0
0
-0.2
4
Guru
pi
0.0
0
852
0.7
6
22.6
99
490
1.9
30
0.0
0
0.0
0
Porto N
acio
nal
7.6
0
399
0.3
2
63.9
01
-6
80
4.0
43
0.0
0
-2.1
9
Jala
pão
6.0
5
39
0.0
6
132.2
04
1.2
50
10.7
25
0.0
0
1.8
0
Dia
nópolis
0.0
0
460
3.2
6
50.5
76
20
10
0.0
0
0.0
0

16
Tab
le 2
- T
ime
series
est
imat
ion for th
e an
alyze
d c
rop p
rice
s.
Cro
p
Model
Spec
ific
atio
n
R2
MA
PE
TIC
B
P
VP
CV
P
Sugar
cane
tt
eL
yL
)867
.0
1()
1(737
.2
12
***1
***−
=−
+−
0.5
02
6.5
95
0.0
32
0.0
06
0.0
15
0.9
78
(0.8
31) (0.0
36)
Soybea
ns
tt
eL
yL
)919
.0
1()
1(140
.38
6***
1**
−=
−+
−
0.5
51
14.4
50
0.0
78
0.0
00
0.0
03
0.9
96
(17.4
25)
(0.0
20)
Corn
t
te
LL
yL
LL
)841
.0
146
.0
1()
319
.0
321
.0
1)(
1(5
***4
*2
*1
*1
+−
=+
+−
0.5
57
11.4
25
0.0
65
0.0
32
0.0
02
0.9
64
(0.1
65)
(0.1
59) (0
.084)
(0
.075)
Bea
ns
tt
eL
yL
LL
)920
.0
1()
670
.0
410
.0
1)(
1(5
***2
***1
***1
+=
++
−
0.7
17
18.6
03
0.1
04
0.0
06
0.0
01
0.9
93
(0
.104) (0
.087)
(0.0
41)
Cotton
tt
eL
Ly
LL
LL
)630
.0
582
.0
1()
263
,0
304
,0
729
,0
1)(
1(4
***1
***6
***2
***1
***1
++
=+
++
−
0.7
15
11.2
34
0.0
67
0.0
97
0.0
21
0.8
81
(0.1
17) (0.1
05)
(0
.077)
(0
,135)
(0
,171)
Sourc
e: A
uth
or’
s re
sear
ch d
ata.
Sta
ndar
d e
rrors
are
in p
aren
thes
is, bel
ow
the
estim
ate
d c
oef
fici
ents.
***: stat
istica
lly sig
nific
ant at
1%
; **: si
gnific
ant at
5%
; *: si
gnific
ant at
10%
; ns : sta
tistic
ally
nonsi
gnific
ant.
MA
PE: M
ean A
bso
lute
Per
centa
ge
Err
or: the
smal
ler th
is v
alue,
the
smaller
the
per
centa
ge
erro
r m
ean o
f th
e fo
reca
st series
;
TIC
: Thei
l In
equal
ity C
oef
fici
ent: lie
s bet
wee
n z
ero a
nd o
ne, w
her
e ze
ro indic
ates
per
fect
fit. It c
an b
e dec
om
pose
d in:
BP: B
ias Pro
portio
n: in
dic
ates
how
far
the
mea
n o
f th
e fo
recas
t is fro
m the
mea
n o
f th
e ac
tual
ser
ies;
VP: V
aria
nce
Pro
portio
n: in
dic
ates
how
far
the
var
iation o
f th
e fo
reca
st is from
the
var
iation o
f th
e ac
tual
ser
ies;
CV
P: Covar
iance
Pro
portio
n: m
easu
res th
e re
mai
nin
g u
nsy
stem
atic
fore
castin
g e
rrors
.
The
bia
s, v
aria
nce
and c
ovar
iance
pro
portio
n a
dd u
p to o
ne
(EV
IEW
S U
SER’S
GU
IDE, 2004).
17
Tab
le 3
- E
stim
ated
coef
fici
ents
and sta
tist
ics fo
r cr
ops in
cluded
in the
anal
ysi
s in
São
Pau
lo.
Price
s
Acr
eage
Sugar
cane
Soybea
ns
Corn
B
eans
Cotton
2001-0
8
2004-0
8
Sugar
cane
Coef
fici
ent
0.1
90
**
-0.1
67
***
0.2
12
*
-0.0
13
ns
-0.1
17
ns
1.2
83
***
0.0
18
***
Sta
ndar
d e
rror
0.0
92
0.0
34
0.1
22
0.0
17
0.0
95
0.0
73
0.0
02
R
2
0.6
06
N
352
Soybea
ns
Coef
fici
ent
-1.5
07
***
0.3
74
***
-0.6
47
***
0.1
50
***
-0.9
71
***
0.4
74
***
0.0
04
ns
Sta
ndar
d e
rror
0.1
71
0.0
55
0.2
48
0.0
41
0.1
91
0.1
47
0.0
05
R
2
0.1
46
N
189
Corn
Coef
fici
ent
-0.5
93
***
0.0
55
**
-0.1
20
ns
0.0
49
**
-0.3
15
***
0.4
80
***
-0.0
28
***
Sta
ndar
d e
rror
0.0
95
0.0
27
0.1
30
0.0
22
0.0
99
0.0
44
0.0
03
R
2
0.1
61
N
565
Bea
ns
Coef
fici
ent
-0.3
28
ns
0.0
12
ns
-0.3
75
ns
-0.0
93
*
-0.0
93
ns
0.3
98
***
-0.0
29
***
Sta
ndar
d e
rror
0.2
04
0.0
53
0.2
75
0.0
50
0.1
90
0.0
69
0.0
05
R
2
0.0
67
N
279
Cotton
Coef
fici
ent
-2.3
57
***
1.1
01
***
-2.1
55
***
0.1
73
*
0.7
14
*
0.6
54
***
-0.0
31
***
Sta
ndar
d e
rror
0.3
95
0.1
29
0.5
77
0.0
92
0.3
89
0.1
80
0.0
11
R
2
0.3
32
N
85
Sourc
e: A
uth
or’
s re
sear
ch d
ata.
Legen
d:
***: stat
istica
lly sig
nific
ant at
1%
; **: si
gnific
ant at
5%
; *: si
gnific
ant at
10%
; “n
s” : sta
tist
ical
ly n
onsi
gnific
ant.
6: num
ber
of cr
oss
sec
tion u
nitie
s (c
ounties
) in
the
estim
ation. The
tim
e per
iod is from
2001 to 2
008,
T=8.

18
Considering the 2000-2008 period, the substitution effects were not very
significant, while the expansion of the annual crop acreage was a result of the expansion
in the acreage for most crops. After 2004, most increases in annual crop area resulted
from sugarcane expansion, with the substitution effects indicating that sugarcane replaced
some traditional crops. In addition, sugarcane also expanded over pastures and perennial
crops, leading to an increase in total annual crop area.
The analysis for São Paulo indicates that the sugarcane price had a negative
impact on the output supply of soybeans, corn, and cotton, a result consistent with the
acreage reduction of these crops in the State. The output supply for the same crops is
estimated for the Center-West region to determine if the sugarcane expansion in São
Paulo may cause an indirect effect on the agricultural frontier. The estimation follows the
same theoretical background and has the same independent variables. Despite the
difference between prices for the two regions due to transportation costs, it is assumed
that the price series have the same behavior. However, instead of estimating the elasticity
coefficients separately and on a State by State basis, we consider only the counties
reporting production in the 2001-2008 period in the four states of the agricultural frontier:
Mato Grosso, Rondônia, Maranhão and Tocantins.
The results are presented in Table 4: the results for own price elasticities are as
expected, except for beans, which also presented a negative own price response.
Sugarcane, soybean and cotton own price elasticity is not statistically significant. This
result for soybean is not expected, since it is the most important crop in the Center-West
region and higher prices have been the primary reason for the strong expansion of this
crop over the last decade. However, during the period of analysis, soybean price
presented a light negative trend, which may account for the results. The price of
sugarcane has a positive impact only on corn, indicating that increased sugarcane prices
will increase the acreage of corn in this region. Actually, this was the most replaced crop
in São Paulo State and this substitution may be positively correlated to the cultivated area
in the agricultural frontier. Besides, corn is the most widely cultivated crop in this region,
and small changes in the price of corn lead some farmers to take advantage of it.
19
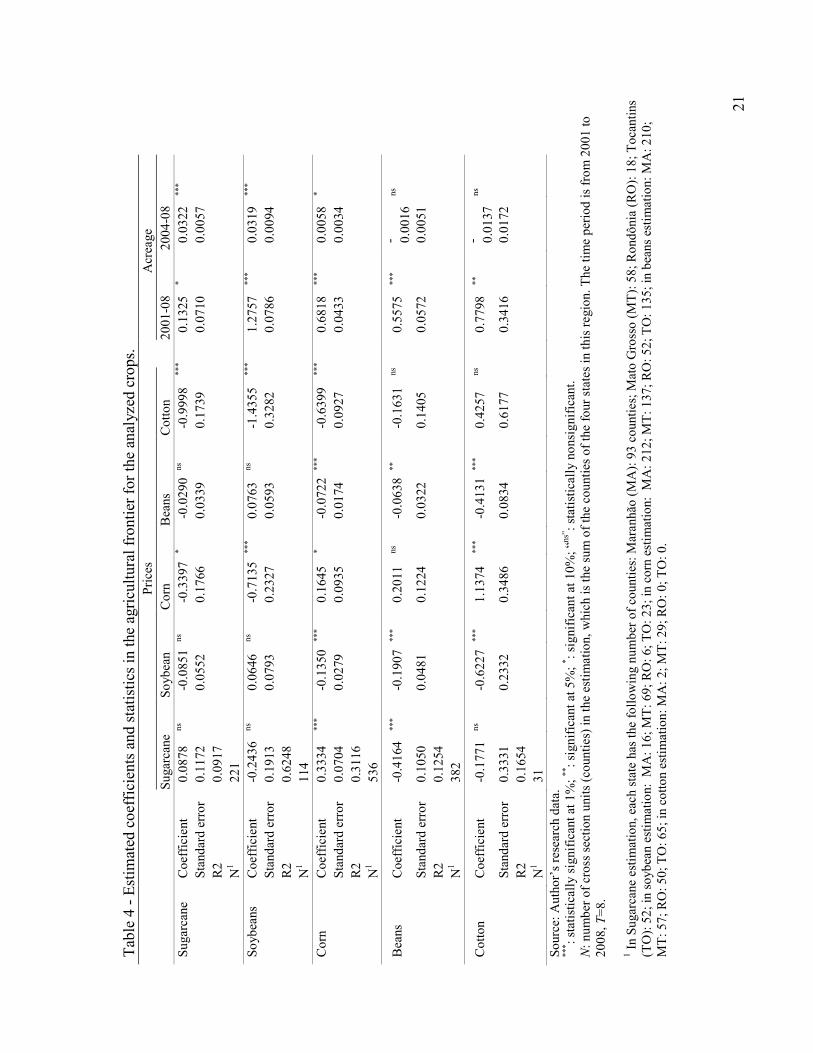
Regarding the other price elasticities, it is worth to comment the relationship between
cotton and soybean, which, despite the fact that these crops are usually cultivated in
sequence in a year, they appear to be substitutes.
The annual crop acreage presents a positive and statistically significant impact for
all crops. The highest elasticity of annual crop area is for soybeans, the crop that has
expanded the most in this region during the analyzed period. Sugarcane, on the other
hand, had the smallest impact on the annual crop acreage. The impact of this variable on
the production of beans and cotton is not statistically significant.
A comparison of the results between São Paulo State and the agricultural frontier
region, reveal that it is possible to establish a connection between both regions only in the
case of corn. The cross elasticity of sugarcane price on corn acreage in São Paulo State is
negative, as well as the dummy variable (the annual crop acreage 2004-2008 years). In
the agricultural frontier, this variable is positively correlated to corn acreage, as well as
the cross elasticity of sugarcane price. That is, the reduction of corn acreage in São Paulo
State could influence the acreage increase in the agricultural frontier. If so, it would be in
a small magnitude, which is indicated by the elasticity coefficient of the 2004-08 variable
in corn acreage, –0,028. Besides, São Paulo State’s share in the total acreage of corn is
less than 10 percent and the acreage variation occurred in the last years, would not be
enough to cause a stronger impact on corn prices. The cross elasticity of sugarcane price
in other crop acreage in São Paulo State is negative; in the agricultural frontier, it should
be positive to cause some impact, as it is for corn. Besides, the 2004-08 years have no
significant impact on the soybean acreage in São Paulo State. Cotton and beans have not
had a significant growth in their acreage in the former region. Thus, it is not possible to
state that the expansion of sugarcane in São Paulo State does impact the acreage
expansion in the agricultural frontier. It also likely that the internal prices for soybean,
corn and cotton are determined in the international market and other variables may affect
these prices. Thus, it is necessary to obtain the international price elasticity for these
commodities for achieving more precise information regarding the indirect effect.
20
The agricultural frontier has been moving towards the North reaching the Amazon
region even before the rapid expansion in sugarcane production. Thus, there is a conflict
between the agricultural expansion and forest preservation and the next model estimates
the impact of commodities prices on deforestation in counties belonging to the four states
of the agricultural frontier: Mato Grosso, Rondônia, Maranhão and Tocantins. An
additional variable “Remaining Forest” is added to the estimation to verify the impact of
the amount of forest on deforestation.
The first estimation considers the counties of the four states which had positive
deforestation rate and also reported production of at least one crop among those under
analysis, from 2001 to 2008 (Table 5). Results reveal that deforestation is positively
correlated with the price of all crops. Besides, it is also affected by the annual crop
acreage and by the recent expansion, represented by the 2004-08 acreage variable. The
remaining forest has a negative impact on the deforestation rate. It is probably due to the
difficulties to open new areas in the absence of roads or other infrastructure. The results
from this new estimation indicate that deforestation might have been affected by the
agricultural expansion in the Center-West and Northeastern regions.
21
Tab
le 4
- E
stim
ated
coef
fici
ents
and sta
tist
ics in
the
agricu
ltura
l frontier
for th
e an
alyzed
cro
ps.
Price
s
Acr
eage
Sugar
cane
Soybea
n
Corn
B
eans
Cotton
2001-0
8
2004-0
8
Sugar
cane
Coef
fici
ent
0.0
878
ns
-0.0
851
ns
-0.3
397
*
-0.0
290
ns
-0.9
998
***
0.1
325
*
0.0
322
***
Sta
ndar
d e
rror
0.1
172
0.0
552
0.1
766
0.0
339
0.1
739
0.0
710
0.0
057
R2
0.0
917
N
1
221
Soybea
ns
Coef
fici
ent
-0.2
436
ns
0.0
646
ns
-0.7
135
***
0.0
763
ns
-1.4
355
***
1.2
757
***
0.0
319
***
Sta
ndar
d e
rror
0.1
913
0.0
793
0.2
327
0.0
593
0.3
282
0.0
786
0.0
094
R2
0.6
248
N
1
114
Corn
Coef
fici
ent
0.3
334
***
-0.1
350
***
0.1
645
*
-0.0
722
***
-0.6
399
***
0.6
818
***
0.0
058
*
Sta
ndar
d e
rror
0.0
704
0.0
279
0.0
935
0.0
174
0.0
927
0.0
433
0.0
034
R2
0.3
116
N
1
536
Bea
ns
Coef
fici
ent
-0.4
164
***
-0.1
907
***
0.2
011
ns
-0.0
638
**
-0.1
631
ns
0.5
575
***
- 0.0
016
ns
Sta
ndar
d e
rror
0.1
050
0.0
481
0.1
224
0.0
322
0.1
405
0.0
572
0.0
051
R2
0.1
254
N
1
382
Cotton
Coef
fici
ent
-0.1
771
ns
-0.6
227
***
1.1
374
***
-0.4
131
***
0.4
257
ns
0.7
798
**
- 0.0
137
ns
Sta
ndar
d e
rror
0.3
331
0.2
332
0.3
486
0.0
834
0.6
177
0.3
416
0.0
172
R2
0.1
654
N
1
31
Sourc
e: A
uth
or’
s re
sear
ch d
ata.
***: stat
istica
lly sig
nific
ant at
1%
; **: si
gnific
ant at
5%
; *: si
gnific
ant at
10%
; “n
s”: stat
istica
lly n
onsi
gnific
ant.
6: num
ber
of cr
oss
sec
tion u
nits (c
ounties)
in the
estim
ation, w
hic
h is th
e su
m o
f th
e co
unties
of th
e fo
ur st
ates
in this regio
n. The
tim
e per
iod is from
2001 to
2008, T=8.
1 In S
ugar
cane
estim
atio
n, ea
ch sta
te h
as the
follow
ing n
um
ber
of co
unties
: M
aranhão
(M
A): 9
3 c
ounties; M
ato G
ross
o (M
T): 5
8; Rondônia
(RO
): 1
8; Toca
ntins
(TO
): 5
2; in
soybea
n e
stim
atio
n: M
A: 16; M
T: 69; RO
: 6; TO
: 23; in
corn
estim
atio
n: M
A: 212; M
T: 137; RO
: 52; TO
: 135; in
bea
ns es
tim
atio
n: M
A: 210;
MT: 57; RO
: 50; TO
: 65; in
cotton e
stim
atio
n: M
A: 2; M
T: 29; RO
: 0; TO
: 0.
22
The expansion is not the same for all states under analysis. In order to verify these
differences, it was estimated a model for each state4 (Table 5). The results for each state
confirm the aggregate results for the prices of soybean, corn, beans and cotton and for the
recent annual crop acreage (2004-08 acreage variable). The individual state analysis
shows that sugarcane price is statistically significant only for the case of Mato Grosso
and Tocantins, but the impact of the annual crop is statistically significant only for the
case of Mato Grosso, meaning that annual crop area increases the deforestation rate. In
the case of other states, annual crop area did not represent a significant impact.
In addition and according to the estimation results, deforestation is decreasing
despite the expansion of the annual crop acreage. This result is consistent with the
deforestation rate measured by the Exponential Growth Trend (EGT) presented in Table
1, which shows that deforestation is increasing at a decreasing rate, probably due to
government control over the Amazon region, in an attempt to hinder the advance of
illegal deforestation.
4 The results for each state must be analyzed carefully, since the asymptotic properties in panel data are
obtained with increasing N. Considering each state individually; the number of cross section units is low.
However, the results seem consistent with the aggregate estimation and agree with the differences among
the states previously presented.

23
Tab
le 5
- E
stim
ated
coef
fici
ents
and sta
tist
ics in
the
agricu
ltura
l frontier
are
a fo
r th
e def
ore
stat
ion a
crea
ge.
Price
s A
nnual
Cro
p A
crea
ge
Rem
ain
. For.
Sugar
cane
Soybea
n
Corn
B
eans
Cotton
2001-0
8
2004-0
8
MA
, M
T, RO
,
TO
Coef
fici
ent
0.9
849
***
0.8
995
***
4.4
928
***
-0.4
458
***
2.5
159
***
0.1
545
**
-0.1
404
***
-0.0
003
***
Sta
ndar
d e
rror
0.2
175
0.1
642
0.3
416
0.0
825
0.3
618
0.0
615
0.0
121
0.0
001
R2
0.2
844
N1
233
MA
Coef
fici
ent
0.5
118
ns
-0.9
114
**
7.2
474
***
-0.7
037
***
3.6
540
***
0.0
041
ns
-0.1
739
***
0.0
002
***
Sta
ndar
d e
rror
0.5
752
0.4
650
0.8
681
0.2
117
0.9
546
0.5
173
0.0
351
0.0
001
R2
0.1
682
N
66
MT
Coef
fici
ent
1.0
425
***
1.3
992
***
3.3
718
***
-0.1
827
*
2.5
410
***
0.1
984
***
-0.1
549
***
-0.0
007
***
Sta
ndar
d e
rror
0.2
957
0.1
465
0.3
858
0.1
074
0.4
240
0.0
551
0.0
121
0.0
002
R2
0.5
293
N
88
RO
Coef
fici
ent
0.3
782
ns
1.6
729
***
1.9
508
***
-0.4
975
***
0.8
095
**
0.0
820
ns
-0.1
101
***
-0.0
005
***
Sta
ndar
d e
rror
0.2
663
0.1
212
0.3
838
0.0
929
0.4
019
0.0
977
0.0
126
0.0
002
R2
0.6
269
N
51
TO
Coef
fici
ent
3.5
694
***
2.2
771
***
5.9
537
***
-0.6
183
***
3.4
118
***
0.0
030
ns
-0.0
779
*
-0.0
021
ns
Sta
ndar
d e
rror
0.5
424
0.2
824
0.9
437
0.2
387
0.9
727
0.2
221
0.0
405
0.0
049
R2
0.3
822
N
28
Sourc
e: R
esea
rch d
ata.
***: st
atistica
lly sig
nific
ant at
1%
; **: si
gnific
ant at
5%
; *: si
gnific
ant at
10%
; “n
s”: stat
istica
lly n
onsi
gnific
ant.
6: num
ber
of co
unties
of ea
ch sta
te in the
estim
atio
n. The
tim
e per
iod is from
2001 to 2
008,
T=8.
1 In this
estim
atio
n, ea
ch sta
te h
as the
follow
ing n
um
ber
of counties: M
aran
hão
: 66 c
ounties; M
ato G
ross
o: 88; Rondônia
: 51; Toca
ntins: 2
8.
24
5. Conclusions
Sugarcane expansion in the Brazilian agricultural frontier cannot be associated to
deforestation despite the fact that some regions in the country present a large sugarcane
acreage growth. Yet, some other regions have presented a strong expansion annual crop
acreage, which may have contributed to the advance of the agricultural frontier over
forest areas. While sugarcane has become one of the most important crops in terms of
cultivated area in São Paulo State with some regions in this State have more than half of
the total annual crop area cultivated to sugarcane. The econometric results indicate a
negative impact of sugarcane prices on the acreage of other crops, which may have
resulted in sugarcane replacing these other crops. The annual crop acreage expansion in
recent years (2004-08) appears to have been caused by sugarcane due to the increase in
the ethanol demand in this period.
Comparing the estimations between São Paulo State and the agricultural frontier,
it is not possible to establish a connection between the expansion of sugarcane and the
expansion of all other crops considered in our analysis in the frontier region, except for
corn. Although the replacement of this crop in São Paulo State may be related to the
expansion of this crop in the frontier region, there are many other variables that affect
corn price, including international prices.
In the Center-West region of Brazil, the agricultural frontier region expansion was
strongly promoted by large increases in soybeans acreage. As the frontier reaches the
Amazon region, its advance toward the northern country will necessarily be associated to
deforestation. However, while deforestation may be associated to the advance in the
agricultural frontier, it should be noticed that, in some regions, deforestation occurs
despite a larger increase in the agricultural acreage. Livestock expansion in that region
and its dynamics must be analyzed. Therefore, there are other incentives besides the
agricultural expansion to cut down part of the Amazon forest. Regarding this issue, the
government should increase control over that region to avoid illegal deforestation. In this
sense, the positive aspect is that the deforestation rate decreased in the analyzed period,

25
which indicates that some control measures have been effective. Thus, while we reach the
conclusion that initially, at least, the increased supply of sugarcane needed to meet
increased ethanol demand has no impact on forest areas. However, this issue and the
advances in agricultural frontier remain of concern. And while Brazil still has large tracks
of land for increasing agricultural acreage, it is necessary to continue to make efforts to
maintain ethanol as a cleaner alternative energy, while preserving the Amazon forest and
other Brazilian biomes.
References
Bandao, A. S. P.; Rezende, G. C.; Marques, R. W. C. Crescimento agrícola no período
de 1999-2004, explosão da área plantada com soja e meio ambiente no Brasil. Rio de
Janeiro: IPEA, 2005. (Texto para Discussão n.º 1062).
Chagas, A. L. S.; Toneto JR, R.; Azzoni, C.R. Teremos que trocar energia por comida?
Análise do impacto da expansão da produção de cana-de-açucar sobre o preço da terra
e dos alimentos. Available in: <http://www.anpec.org.br/revista/vol9/vol9n4p39_61.pdf>
Access in October 2011.
Chambers, R. G. Applied Production Analysis – A Dual Approach. New York:
Cambridge University Press, 1988.
Coelho, S. T.; Guardabassi, B. A. L.; Monteiro, M. B. C. A.; Corren, R. A
sustentabilidade expansão da cultura canavieira. São Paulo: Centro Nacional de
Referência em Biomassa – CENBIO, USP, 2007. Available in:
<http://cenbio.iee.usp.br/download/projetos/ANTP.pdf> Access in October, 2011.
EPA - U.S. Environmental Protection Agency. EPA Finalizes Regulations for the
6ational Renewable Fuel Standard Program for 2010 & Beyond. 2010. Available online:
www.epa.gov (accessed January 20, 2011).
Fabiosa, J.F.; Beghin, J.C., Dong, F., Elobeid, A., Tokgoz, S., Yu, T., 2010. Land
allocation effects of the global ethanol surge: Predictions from the international FAPRI
model. Land Economics. Forthcoming.
Fargione, J., Hill, J., Tilman, D., Polasky, S., Hawthorne, P., 2008. Land clearing and the
biofuel carbon debt. Science. 319(5867), 1235-1238.
Greene, W. Econometric Analysis. New Jersey: Pearson Education , Inc., 2003.
IBGE - Instituto Brasileiro de Geografia e Estatística - IBGE. Produção Agrícola
Municipal. Disponível em <www.ibge.gov.br>. Acesso em dez. 2009.

26
Judge, G. G.; Hill, R. C.; Griffiths, W. E.; Lutkepol, H.; Lee, T. C. Introduction to the
theory and practice of econometrics. 2. ed. . New York: John Wiley & Sons, 1988.
Margulis, S. Causas do desmatamento da Amazônia Brasileira. Washington: Banco
Mundial, 2003. Available in: <http://www-
wds.worldbank.org/external/default/WDSContentServer/WDSP/IB/2004/02/02/00009034
1_20040202130625/Rendered/PDF/277150PAPER0wbwp0no1022.pdf> Access in
October, 2011.
Nassar, A. M.; Ruderdoff, B.F.T; Antoniazzi, L.B.; Aguiar, D.A.; Bacchi, M.R.P.;
Adami, M. Prospects of the sugarcane expansion in Brazil: impacts on direct and indirect
land use changes. In: Zuurbier, P. and Vooren, J. Sugarcane ethanol: contributions to
climate change mitigation and the environment. The Netherlands: Wageningen Academic
Publishers, 2008.
Nerlove, M., Bessler, D.A. Expectations, information and dynamics. In: Gardner, B. and
Rausser, G. (eds.) Handbook of Agricultural Economics, Volume 1, Part A, Elsevier, pp.
156-206, 2001.
Searchinger, T.; Heimlich, R.; Houghton, R.A.; Dong, F.; Elobeid, A.; Fabiosa, J.;
Tokgoz, S. Hayes, D. Yu, T. H. Use of U.S. Croplands for Biofuels
Increases Greenhouse Gases Through Emissions from Land-Use Change. Sience, v. 319,
Feb. 2008.
Torquato, S. A.; Cana de Açucar para a indústria: o quanto vai precisar crescer. Análise e
Indicadores do Agronegócio. Vol. 1, n. 10, 2006. Available in:
<http://www.iea.sp.gov.br/out/verTexto.php?codTexto=7448> . Access in October 2011.
UNICA – União da Indústria da Cana de Açúcar. Etanol e Bioeletricidade: a cana-de-
açucar no futuro da matriz energética. São Paulo, 2009.
Wooldridge, J. M. Econometric Analysis of Cross Section and Panel Data. Cambridge:
MIT Press, 2002.


![Arabidopsis XTH4 and XTH9 Contribute to Wood …...Arabidopsis XTH4 and XTH9 Contribute to Wood Cell Expansion and Secondary Wall Formation1[OPEN] Sunita Kushwah,a,2 Alicja Banasiak,a,2,3](https://static.fdocuments.net/doc/165x107/5fcf63c155f47447ab09ab6d/arabidopsis-xth4-and-xth9-contribute-to-wood-arabidopsis-xth4-and-xth9-contribute.jpg)