Sudan 2014 Strategic Response Plan Revision Presented by OCHA on behalf of Humanitarian Partners.
17
Sudan 2014 Strategic Response Plan Revision Presented by OCHA on behalf of Humanitarian Partners
-
Upload
elvin-sparks -
Category
Documents
-
view
217 -
download
0
Transcript of Sudan 2014 Strategic Response Plan Revision Presented by OCHA on behalf of Humanitarian Partners.

Sudan 2014 Strategic Response Plan
Revision
Presented by OCHA on behalf of Humanitarian Partners

Summary
• Greatly increased needs (IDPs, refugees and malnutrition)
• Improved efficiency in the plan (reduced duplication etc)
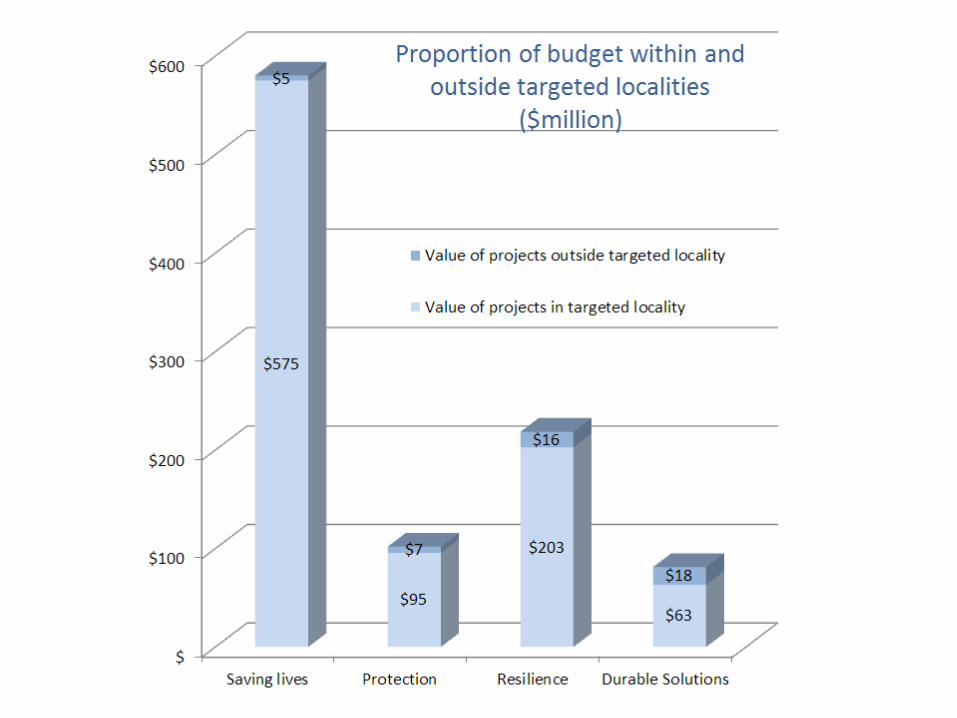
• Improved targeting (larger percentage in saving lives and much reduced proportion of out of strategic boundary projects)
• Improved transparency in the plan

Increased vulnerability
• Alarming levels of malnutrition
• Increased number of IDPs in Darfur
• Arrival of South Sudan refugees
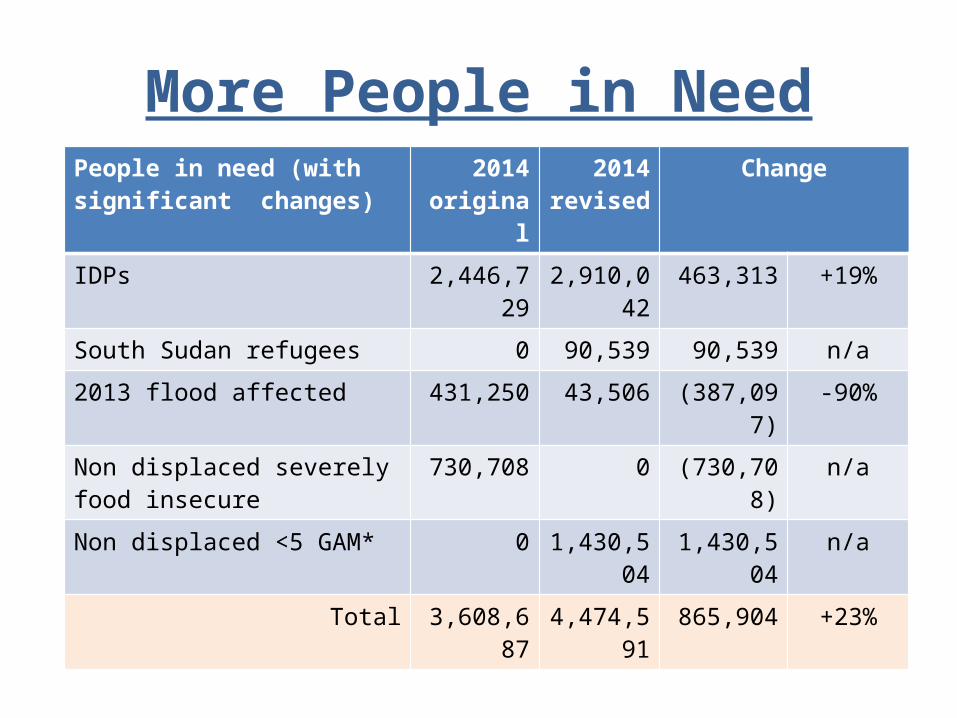
More People in NeedPeople in need (with significant changes)
2014 original
2014 revised
Change
IDPs 2,446,729 2,910,042 463,313 +19%
South Sudan refugees 0 90,539 90,539 n/a
2013 flood affected 431,250 43,506 (387,097) -90%
Non displaced severely food insecure
730,708 0 (730,708) n/a
Non displaced <5 GAM* 0 1,430,504 1,430,504 n/a
Total 3,608,687 4,474,591 865,904 +23%

6,898,829
Breakdown of People in Need

Multiple Crises Across Country
• North Darfur, South Darfur, South Kordofan,
Central Darfur remain top four states with highest
numbers of people in need
• Approximately 900,000 people in non-Government
held areas whose needs cannot be assess and are
NOT included in these estimates (no access)


More Focused Strategy
• Significant effort to better target most vulnerable Reallocated resources to life saving objectives Decrease in projects targeting non-priority
localities• Small reduction in overall requirements
despite an overall increase of people in need

2014 Original 2014 revised Change
People in need 6.1 million 6.9 million +13%
People targeted 5.9 million 6.7 million +17%
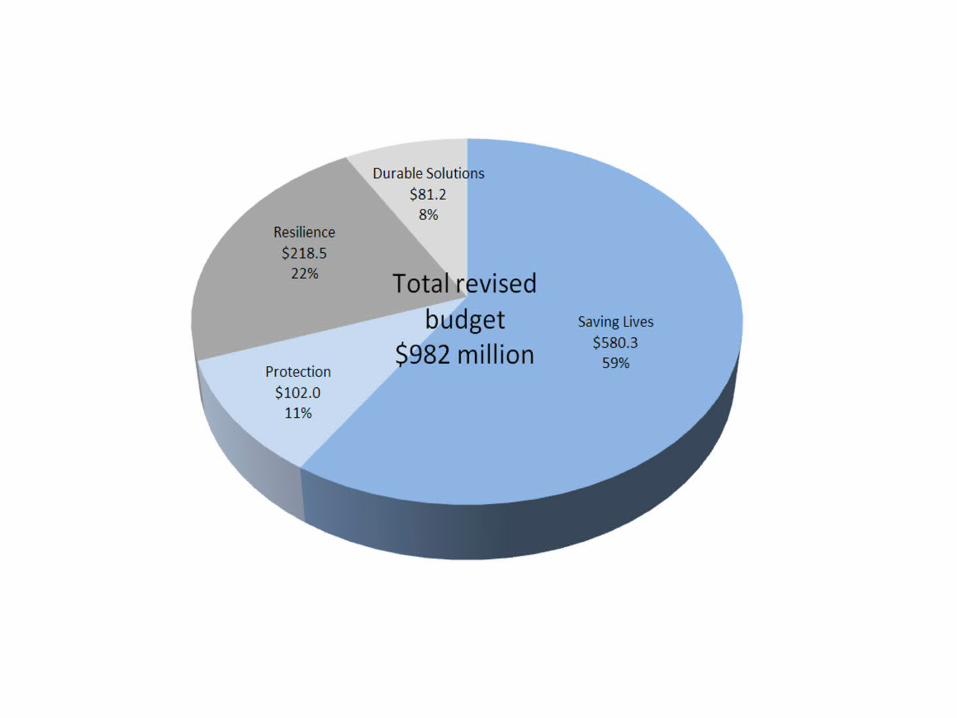
Total budget: $995 million $982 million -1%
• SO1: Saving lives $552 million $580 million +5%
• SO2: Protection $110 million $102 million -7%
• SO3: Resilience $233 million $219 million -6%
• SO4: Durable solutions $100 million $81 million -19%
$ per capita cost $169 $147 -13%
Key data


Further work required • Preparedness
STAIT mission advised HCT to include contingency plan. However, not all partners can appeal for funding for new projects that are not part of the centrally approved budget. Only WASH, FSL and Education requirements for contingency plans are currently included.

• Malnutrition– “Non-IDP severely food insecure” has been replaced by “non-IDP
under 5 GAM”– GAM = Global Acute Malnutrition (SAM + MAM)
• Severe Acute Malnutrition – SAM (below 70% weight for height)• Moderate Acute Malnutrition – MAM (between 70% and 80%
weight for height)– 2.1 million people = estimated “burden” based upon prevalence plus
incidence from 2013 S3M survey– GAM prevalence appears to stagnate in most places and deteriorating
in some. GAM levels for children under-five in parts of Sudan stand at 28.2% (state level) and as high as 42% (locality level). Internationally accepted emergency “critical” threshold = 15%.

• Strategic monitoring– No progress in completing strategic
indicator baselines and targets achieved in 2014 so far
– Strategic mission-critical data needs to be more systematically collected (e.g. Crude Mortality Rate)

Next steps
• Humanitarian space: agree on simple monitoring mechanism and advocacy strategy.
• Correct significant imbalances in sector funding.
• Reinforce capacity to undertake strategic monitoring and demonstrate impact of funding and of underfunding.
• Learn lessons for 2015 HNO and SRP – seek donor feedback and input