Succession in Family Owned Businesses: The Influence of ...
116
Louisiana State University LSU Digital Commons LSU Doctoral Dissertations Graduate School 2016 Succession in Family Owned Businesses: e Influence of Succession Planning and Demographic Characteristics on Succession Success Steven omas Perret Louisiana State University and Agricultural and Mechanical College, [email protected] Follow this and additional works at: hps://digitalcommons.lsu.edu/gradschool_dissertations Part of the Human Resources Management Commons is Dissertation is brought to you for free and open access by the Graduate School at LSU Digital Commons. It has been accepted for inclusion in LSU Doctoral Dissertations by an authorized graduate school editor of LSU Digital Commons. For more information, please contact[email protected]. Recommended Citation Perret, Steven omas, "Succession in Family Owned Businesses: e Influence of Succession Planning and Demographic Characteristics on Succession Success" (2016). LSU Doctoral Dissertations. 3419. hps://digitalcommons.lsu.edu/gradschool_dissertations/3419
Transcript of Succession in Family Owned Businesses: The Influence of ...
Louisiana State UniversityLSU Digital Commons
LSU Doctoral Dissertations Graduate School
2016
Succession in Family Owned Businesses: TheInfluence of Succession Planning andDemographic Characteristics on SuccessionSuccessSteven Thomas PerretLouisiana State University and Agricultural and Mechanical College, [email protected]
Follow this and additional works at: https://digitalcommons.lsu.edu/gradschool_dissertations
Part of the Human Resources Management Commons
This Dissertation is brought to you for free and open access by the Graduate School at LSU Digital Commons. It has been accepted for inclusion inLSU Doctoral Dissertations by an authorized graduate school editor of LSU Digital Commons. For more information, please [email protected].
Recommended CitationPerret, Steven Thomas, "Succession in Family Owned Businesses: The Influence of Succession Planning and DemographicCharacteristics on Succession Success" (2016). LSU Doctoral Dissertations. 3419.https://digitalcommons.lsu.edu/gradschool_dissertations/3419
SUCCESSION IN FAMILY OWNED BUSINESSES:
THE INFLUENCE OF SUCCESSION PLANNING AND
DEMOGRAPHIC CHARACTERISTICS ON SUCCESSION SUCCESS
A Dissertation
Submitted to the Graduate Faculty of the
Louisiana State University and
Agricultural and Mechanical College
in partial fulfillment of the
requirements for the degree of
Doctor of Philosophy
in
The School of Human Resource Education
And Workforce Development
by
Steven Thomas Perret
B.S., University of Phoenix, 2008
M.B.A., Louisiana State University, 2010
M.S., Louisiana State University, 2015
May 2016

ii
©Copyright 2016
Steven T. Perret
All Rights Reserved
iii
TABLE OF CONTENTS
LIST OF TABLES .............................................................................................................. v
LIST OF FIGURES ......................................................................................................... viii
ABSTRACT ....................................................................................................................... ix
CHAPTER I: INTRODUCTION ........................................................................................ 1
Rationale .......................................................................................................................... 1 Purpose of the Study ....................................................................................................... 5 Dependent Variable ......................................................................................................... 5 Objectives ........................................................................................................................ 5
Significance of the Study ................................................................................................ 7
CHAPTER 2: REVIEW OF LITERATURE ...................................................................... 9
What Is Succession Planning .......................................................................................... 9 Importance of Succession Planning .............................................................................. 11 Definition of Family Owned Business .......................................................................... 13
Family Owned Business and Its Impact ........................................................................ 15 Succession Planning in Family Owned Businesses ...................................................... 17
Longevity of Family Owned Businesses ....................................................................... 19 Define Successful Succession in Family Owned Business ........................................... 20 Components of a Succession Plan ................................................................................. 22
Summary ....................................................................................................................... 23
CHAPTER 3: METHODOLOGY ................................................................................... 25 Purpose of the Study ..................................................................................................... 25 Dependent Variable ....................................................................................................... 25
Objectives ...................................................................................................................... 25 Research Design ............................................................................................................ 27
Population and Sample .................................................................................................. 28 Instrumentation .............................................................................................................. 28 Successful Succession Score ......................................................................................... 29 Succession Plan Quality Score ...................................................................................... 31
Data Collection .............................................................................................................. 32 Data Analysis ................................................................................................................ 33
CHAPTER 4: RESULTS ................................................................................................. 34
Purpose of the Study ..................................................................................................... 34 Objective One Results ................................................................................................... 34 Objective Two Results .................................................................................................. 41 Objective Three Results ................................................................................................ 47
Objective Four Results .................................................................................................. 55
iv
CHAPTER 5: SUMMARY............................................................................................... 68 Summary of Purpose and Specific Objectives .............................................................. 68 Summary of Methodology ............................................................................................ 70 Summary of Major Findings ......................................................................................... 71
Conclusions, Implications, and Recommendations ....................................................... 80
REFERENCES ................................................................................................................. 89
APPENDIX A: IRB CONSENT FORM AND REQUEST FOR PARTICIPATION ...... 96
APPENDIX B: FOB PERCEPTION OF SUCCESSFUL SUCCESSION
INVENTORY ................................................................................................................... 97
VITA ............................................................................................................................... 105
v
LIST OF TABLES
Table 1 Family Owned Business Definitions (Barbara & Alberto Ivo, 2009) ............... 15
Table 2 Small Business Profile (Office of Advocacy U.S. Small Business
Administration, 2013) ...................................................................................... 17
Table 3 Age of Family Owned Businesses in South Louisiana that had Completed a
Succession and had a Written Succession Plan................................................ 35
Table 4 Incumbent’s Educational Level within Family Owned Businesses in South
Louisiana that had Completed a Succession and had a Written Succession
Plan ................................................................................................................... 36
Table 5 Successor’s Educational Level within Family Owned Businesses in South
Louisiana that had Completed a Succession and had a Written Succession
Plan ................................................................................................................... 37
Table 6 Number of Employees on Payroll within Family Owned Businesses in South
Louisiana that had Completed a Succession and had a Written Succession
Plan ................................................................................................................... 37
Table 7 Type of Business within Family Owned Businesses in South Louisiana that
had Completed a Succession and had a Written Succession Plan ................... 38
Table 8 Quality of Plan Score Components by Family Owned Businesses in South
Louisiana that had Completed a Succession and had a Written Succession
Plan ................................................................................................................... 39
Table 9 Quality of Plan Scores of Family Owned Businesses in South Louisiana that
had Completed a Succession and had a Written Succession Plan ................... 41
Table 10 Perception of Succession Planning as Reported by Family Owned Businesses
Located in South Louisiana .............................................................................. 43
Table 11 Perception of Commitment to Stakeholders as Reported by Family Owned
Businesses Located in South Louisiana ........................................................... 45
Table 12 Perception of Early Preparation as Reported by Family Owned Businesses
Located in South Louisiana .............................................................................. 45
Table 13 Perception of Learning that Occurs as Reported by Family Owned
Businesses Located in South Louisiana ........................................................... 45
Table 14 Perception of Satisfied Stakeholders as Reported by Family Owned
Businesses Located in South Louisiana ........................................................... 46
vi
Table 15 Perception of Harmonious Family Members as Reported by Family Owned
Businesses Located in South Louisiana ........................................................... 46
Table 16 Perception of Planning and Success as Reported by Family Owned
Businesses Located in South Louisiana ........................................................... 46
Table 17 Computed Factor Scores Based on Six Factors in Succession Planning .......... 47
Table 18 Relationship Between Age of Family Owned Business and Perceptions of
Selected Aspects of Succession Planning ........................................................ 48
Table 19 Relationship Between Incumbent’s Educational Level and Perceptions of
Selected Aspects of Succession Planning ........................................................ 49
Table 20 Relationship Between Successor’s Educational Level and Perceptions of
Selected Aspects of Succession Planning ........................................................ 51
Table 21 Relationship Between Number of Employees on Payroll and Perceptions of
Selected Aspects of Succession Planning ........................................................ 52
Table 22 Relationship Between Quality of the Plan and Perceptions of Selected
Aspects of Succession Planning ....................................................................... 53
Table 23 Relationship between Subsequent Positive Revenue Performance and
Perceptions of Selected Aspects of Succession Planning ................................ 54
Table 24 Relationship Between the Perception Regarding Successful Succession
Planning in Family Owned Business Sub-scale CTS and Selected
Demographic Characteristics ........................................................................... 56
Table 25 ANOVA Summary Table and Model Summary for Stepwise Multiple
Regression Predicting Commitment to Stakeholder Scores from
Demographic Factors ....................................................................................... 57
Table 26 Relationship Between the Perception Regarding Successful Succession
Planning in Family Owned Business Sub-scale EP and Selected
Demographic Characteristics ........................................................................... 58
Table 27 ANOVA Summary Table and Model Summary for Stepwise Multiple
Regression Predicting Early Planning Scores from Demographic Factors ...... 59
Table 28 Relationship Between the Perception Regarding Successful Succession
Planning in Family Owned Business Sub-scale LTO and Selected
Demographic Characteristics ........................................................................... 60
Table 29 ANOVA Summary Table and Model Summary for Stepwise Multiple
Regression Predicting Learning that Occurs Scores from Demographic
Factors .............................................................................................................. 60
vii
Table 30 Relationship Between the Perception Regarding Successful Succession
Planning in Family Owned Business Sub-scale SS and Selected
Demographic Characteristics ........................................................................... 62
Table 31 ANOVA Summary Table and Model Summary for Stepwise Multiple
Regression Predicting Stakeholder Satisfaction Scores from Demographic
Factors .............................................................................................................. 62
Table 32 Relationship Between the Perception Regarding Successful Succession
Planning in Family Owned Business Sub-scale HFM and Selected
Demographic Characteristics ........................................................................... 64
Table 33 ANOVA Summary Table and Model Summary for Stepwise Multiple
Regression Predicting Harmonious Family Members Score from
Demographic Factors ....................................................................................... 64
Table 34 Relationship Between the Perception Regarding Successful Succession
Planning in Family Owned Business Sub-scale PAS and Selected
Demographic Characteristics ........................................................................... 66
Table 35 ANOVA Summary Table and Model Summary for Stepwise Multiple
Regression Predicting Planning and Success Scores from Demographic
Factors .............................................................................................................. 66

viii
LIST OF FIGURES
Figure 1 Satisfaction, Effectiveness, and Successful Succession Source ........................21

ix
ABSTRACT
The primary purpose of this study was to determine the influence selected aspects
of succession planning and selected demographic characteristics had on the level of
success in the succession of family owned businesses (FOB’s) in south Louisiana. To
achieve this, the researcher designed a survey instrument to collect data. A total of 61
FOB’s responded indicating they completed succession; however, only 23 or (38%)
completed a planned succession to the next generation. An important finding was that
having a high quality succession plan had a positive influence on the perceptions of
family owned business owners and managers.
Another important finding was respondents perceived that planning for
succession was important. Perceptions were measured based on a four point Likert-type
scale, indicating mean values with a range from 3.52 (strongly agree) to 2.61 (agree). It
was based on these findings that the researcher recommended this study be replicated
with a larger sample size to further determine the influence that quality of plan has on
perceptions of succession planning. In addition, the researcher recommended that
organizations that provide consulting services, professional development and support to
family businesses, such as family owned business centers connected with universities,
local chambers of commerce, and corporate accounting firms, add programs that will
educate family business owners and managers on the importance of succession planning
and the steps necessary for preparing a quality succession plan. It was based on these
findings that the researcher recommended this study be replicated to determine if
perceptions of FOB owners and managers regarding their agreement with successful
succession items can be confirmed.
x
Also, that “Planning for succession early is important to a successful succession”
and “Planning had a positive effect on the overall succession process” report mean values
≥ 3.50. In addition, structured qualitative studies should be conducted to understand the
perceptions of why planning is important in family owned business and how and why it
increases success.
1
CHAPTER I: INTRODUCTION
“Thinking is the hardest work there is, which is probably the
reason why so few engage in it.” – Henry Ford
Rationale
Family owned businesses (FOB's) are the backbone of the American economy.
According to Poutziouris, Smyrnios, and Klein, “Their importance parallels socio-
cultural advances, technological advances, and the so-called new market order associated
with globalization” (Poutziouris, Smyrnios, & Klein, 2006, p. 1). There are over 5.5
million family owned businesses in the United States that contribute 57% of the U.S.
Gross Domestic Product (GDP), or an average of $8.3 trillion, and employ over 63% of
the workforce (USA, 2011). Galiano and Vinturella state, “According to the National
Family Business Association, 90 percent of U.S. businesses are family controlled,
producing half of the GDP and employing half of the workforce” (Galiano & Vinturella,
1995, p. 178). Members of the Family 500 index, a list of the largest family owned
businesses worldwide based on revenue, contribute $6.5 trillion in annual sales to the
U.S. and employ nearly 21 million people (Withorn, 2015). Some of the largest family
owned businesses in the United States include companies such as Bechtel Group ($30
billion), Comcast ($37 billion), Koch Industries ($100 billion), Ford Motor Co. ($128
billion), and Walmart ($421 billion) (Weinmann & Groth, 2011).
Small businesses employ over half of U.S. workers, and a majority of those are
family owned (Business, 2015). In 2015, the U.S. Small Business Administration (SBA)
released a Louisiana Small Business Profile that showed that there are 424,475 small
businesses, 78,720 small businesses with employees, and 345,755 small businesses
2
without employees (nonemployers) operating in Louisiana. In Louisiana, small
businesses employ 892,125 individuals, making up 97.3% of all employers. Small
businesses with fewer than 100 employees employ 54% of Louisiana’s workforce.
Businesses with 1-19 employees represent 18% of the Louisiana workforce, 20-29
employees represent 20%, 100-499 employees represent 16%, and 500+ employees
represent 46% (Office of Advocacy U.S. Small Business Administration, 2015).
Despite the importance of family owned businesses and the positive economic
impact they have on the U.S. economy, their longevity is often short. According to Scott,
“The average life expectancy of such a business is roughly 25 years” (Scott, 2000, p. 80).
Many factors can influence the longevity of the family firm, such as poor business
planning, lack of financial understanding, under capitalization, operational inefficiencies,
dysfunctional management, and a declining market (Monk, 2000). One factor that is often
identified as critical in the success of a family owned business, especially a small FOB, is
succession from one generation to the next. Many American family owned businesses
have vanished due to the lack of adequate succession planning (Galiano & Vinturella,
1995). According to Poutziouris et al., “Past research suggests that there are many
reasons such successions fail. They include unclear succession plans, incompetent or
unprepared successors, and family rivalries” (Poutziouris et al., 2006, p. 372). Although
management succession is a common issue within many types of businesses, family
owned businesses have far more challenges to overcome than do nonfamily owned
businesses. For example, the size of the candidate pool and the personal relationships that
exist between the incumbent and successor when transferring leadership to a family
member complicate the succession process (Long & Chrisman, 2013). As explained by

3
Barach and Ganitsky, “Successful succession of CEOs is a critical goal for family firms:
without the next generation’s leadership and direct management, the firm cannot survive
as a family firm, let alone maintain its character” (Barach & Ganitsky, 1995, p. 131).
Multigenerational successions in family owned businesses do not have an impressive
record of accomplishment. “Only a third of family owned businesses survive into the
second generation, and only about 10-15% make it into the third generation (Birley,
1986; Ward, 1987). Poor successions are often the source of the problem (Miller, Steier,
& Breton-Miller, 2003)” (Isabelle Le Breton-Miller, 2004, p. 305).
The literature suggests that there are gaps in our understanding of family business
succession planning. Although interest in family business research has grown over the
last decade, little attention has been given to succession planning and factors that
influence successful succession (Barbara & Alberto Ivo, 2009). Researchers include the
absence of planning as a top reason for failed succession; however, little is known about
how or why planning increases success (Long & Chrisman, 2013). Van der Merwe,
Venter, and Ellis describe the issue as follows:
One of the most significant factors determining the continuity of the family
business from one generation to the next is whether the succession process
is planned (Neubauer and Lank, 1998). The failure to plan for succession is
one of the greatest threats to the survival of the family business (Venter and
Boshoff, 2005; Venter, 2003; Bjuggren and Sund, 2001; Malinen, 2001).
(Van der Merwe, Venter, & Ellis, 2009, p. 4)
Researchers have focused on factors such as motivation for succession, characteristics of
the incumbent, characteristics of the successor, and other elements of the succession
process. However, Avila, Avila, and Naffziger (2003, p. 85) suggest that little has been
4
written on business succession planning, which could be a factor in the number of family
owned businesses that do not survive through subsequent generations.
Despite their significance, few organizations track statistics on family owned
businesses. The SBA collects demographic data such as gender, race, industry, minority
owned, and veteran owned, but does not record whether the business is family owned. In
Louisiana, two universities have established family business institutes. They are the
Levy-Rosenblum Institute at Tulane University Family Business Center and the
Centenary College of Louisiana Center for Family Owned Businesses. Both maintain a
membership list of approximately 25–50 family owned businesses; however, they only
track limited information. Furthermore, few studies that focus on family owned business
succession planning have been conducted in south Louisiana. Of these studies, John
Cater, Brent Beal, and Robert T. Justis have conducted the majority of the work, focusing
on leadership transitions within family owned businesses and development of the
successor from follower to leader. Also, Alanna Galiano and John Vinturella have
conducted a study in New Orleans on the implications of gender bias in family owned
businesses.
A review of the literature shows that there have been no studies conducted to
determine the influence of succession planning and demographic characteristics on the
success of succession in south Louisiana family owned businesses. This study focused on
the influence of succession planning and hopefully will serve as a basis for improving the
success and longevity of family owned businesses.
5
Purpose of the Study
The primary purpose of this study was to determine the influence selected aspects
of succession planning and selected demographic characteristics have on the level of
success in the succession of family owned businesses in south Louisiana.
Dependent Variable
The dependent variable of this study is the perception of successful succession by
family owned business owners and managers.
Objectives
The researcher formulated the following objectives to guide the study:
1. Describe family owned businesses in south Louisiana in terms of the following
characteristics:
a) Age of the family owned business based on number of years in business;
b) Incumbent's educational level;
c) Successor's educational level;
d) Number of employees on payroll;
e) Type of business (retail, service, manufacturing, etc.);
f) Whether or not leadership prepared a quality succession plan;
g) Whether or not there was a positive revenue performance subsequent to
succession.
2. Determine how family owned business owners and managers in south Louisiana
perceive selected aspects of succession planning:
a) Degree to which a firm commitment to successful succession was signaled to
stakeholders throughout the planning process;

6
b) Degree to which the leadership began the succession planning process in a
timely manner;
c) Degree to which the incumbent and successor learned throughout the planning
process;
d) Degree to which stakeholders were satisfied with the succession process;
e) Degree to which family members were harmonious during and after the
succession process;
f) Degree to which planning contributed to a successful transition.
3. Determine if a relationship exists between how family owned business owners
and managers in south Louisiana perceive selected aspects of succession planning
and the following variables:
a) Age of the family owned business based on number of years in business;
b) Incumbent’s educational level;
c) Successor’s educational level;
d) Number of employees on payroll;
e) Type of business (retail, service, manufacturing, etc.);
f) Whether or not leadership prepared a quality succession plan;
g) Whether or not there was a positive revenue performance subsequent to
succession.
4. Determine if a model exists that explains a significant portion of the variance in
the perception of family owned business owners and managers in south Louisiana
regarding selected aspects of succession planning from the following variables:
a) Age of the family owned business based on number of years in business;
7
b) Incumbent's educational level;
c) Successor's educational level;
d) Number of employees on payroll;
e) Type of business (retail, service, manufacturing, etc.);
f) Whether or not leadership prepared a quality succession plan;
g) Whether or not there was a positive revenue performance subsequent to
succession.
Significance of the Study
This study makes a significant contribution to the existing scholarly body of
knowledge regarding successful succession planning in family owned businesses.
Although scholarly researchers have focused on family owned business succession for
decades, much of the research has focused on factors such as motivation for succession,
characteristics of the incumbent, characteristics of the successor, and other elements of
the succession process. In contrast, this study expands our understanding to include
consideration of how planning, in particular, increases successful succession in family
owned businesses. Specifically, the study assessed the perceptions that family business
owners and managers in south Louisiana have on selected aspects of succession planning
and certain demographic characteristics. Based on a review of the literature on family
owned businesses, the researcher created two scoring systems to better understand the
quality of the succession plan and the level of succession success. These scores are
reported based on the results of selected items on the researcher-designed survey
instrument.
8
Family owned businesses are the backbone of the American economy and
families take great pride in continuing their legacy into the next generation. However, the
literature suggests that often family owned businesses fail to successfully transfer the
business from one generation to the next due to the lack of planning. This study provides
information that allows both researchers and practitioners to better understand how
planning facilitates success in family owned business succession, as well as identifies
opportunities for future research.
9
CHAPTER 2: REVIEW OF LITERATURE
Much of the literature on firms focuses on the activities, planning processes, and
effectiveness of large firms. Although little attention has been given to family owned
businesses in the past, more recent research has begun to recognize their importance.
Family owned business emerged as a field of study in the early 1980’s with the creation
of Family Business Review, a referreed academic journal pulished quarterly since 1988.
Since then, the study of family owned businesses has become a prominent area of
investigation for researchers (Ibrahim, Angelidis, & Parsa, 2008). One of the most
important issues for family owned businesses is succession planning, which has received
less attention. In this chapter, the researcher defines succession planning and family
owned businesses, briefly reviewing the literature on both.
What Is Succession Planning
The term succession planning has been used to described a wide variety of
activities involving planning for a leadership transition within an organization. Rothwell
(2001) defines succession planning as a deliberate and systematic effort by an
organization to ensure leadership continuity in key positions, to retain and develop
intellectual and knowledge capital for the future, and to encourage individual
advancement. The practice of succession planning has existed since the beginning of
recorded history in one form or another. Documented history shows that succession
planning was used in the transition of power within family networks, for example, within
royal families and family owned business empires (Garman & Glawe, 2004). Gray has
stated, “Succcession planning can be identified as a process for identifying and
developing key leaders within your company. The primary purpose is to create increased

10
engagement and retention by providing a career ladder” (Gray, 2014, p. 35). Redman
provides an additional, comprehensive definition:
Leadership succession planning consist[s] of assessing and planning for
future leadership needs in the organization. It is a long-term business
strategy that requires both strategic thinking and action to ensure that
leadership needs in the organization will be anticipated and leadership
compentencies will be sufficiently developed in those who have potential
for leadership roles in the future. (Richard W. Redman, 2006, p. 292)
The purpose of succession planning is not so much to select a candidate for a
specific vacancy, but to identify candidates with strong management training, knowledge,
skills, and attitudes for future leadership vacancies (Quinn, 2002). Succession planning is
viewed as a process of identifying potential successors to the incumbent and preparing
them to assume a new role (Garman & Glawe, 2004).
The need for succession planning is equally critical in large corporations and
small to mid-size enterprises (SMEs). Larger corporations have a wide range of potential
successors for executive and leadership roles, while SMEs have rather flat organizational
structures and the personal stakes for the entrepreneur are significantly more. A well-
defined succession plan communicated properly within the organization will boost
confidence among stakeholders, reducing the risk of losing key employees (Krishnan,
2012). In addition, a well-defined succession plan combines succession planning and
leadership development, because the two tasks are natural allies sharing a vital and
fundamental goal: getting the right skills in the right place (Conger & Fulmer, 2003). A
generic approach to succession planning, at a minumum, would include an assessment of
the position in detail, the skills and education needed, and other individual qualities
required to perform at a satisfactory level. In addition, it would require a systematic
11
assessment of the individuals currently employed to determine their leadership
capabilities and potential for moving into leadership positions, if available (Richard W.
Redman, 2006).
Succession planning is a topic every organization must face, but it is often
overlooked due to lack of resources or ability to conduct the succession planning process.
In fact, a recent survey conducted by the Stanford Graduate School of Business found
that of the 20 organizations surveyed, only 46% had a formal succession plan prepared
for key executives. Most organizations do not know who is next in line to fill senior
executive positions.
Companies do not kow who is nest in line to fill senior executive positions.
Organizations often do not make the connection between the skills and experience
requried to run the company, and the individual candidates – both internal and
external – that are best-suited to eventually assume senior positions. (Larcker &
Saslow, 2915, p. 1)
A generic approach to succession planing identified by Success Labs, a leadership and
organizational development consulting firm in Baton Rouge, focuses on five factors: (1)
assess your critical people and positions, (2) assess key skills and information, (3)
identify key talent, (4) assess key talent, and (5) create individual development plans
(Lemoine, 2015). This approach is similar to the generic model described by Redman
(2006).
Importance of Succession Planning
According to Berchelman, “Succession planning may seem like an essential
process for long-term success, but far too many organizations jeopardize results by
hoping that the right person is available for promotion when positions become available
unexpectedly” (Berchelman, 2005, p. 11). Corporate leaders suggest that succession is as
12
important today as it has been in the past. Research shows that organizations that plan for
succession tend to out perform those who do not plan (Larcker & Saslow, 2015). Garman
and Glawe (2004) conducted a survey to better understand the results of succession
planning and to determine whether firms received a return on investment for adopting the
planning process. In their 2004 article, Garman and Glawe listed six outcome studies
relevant to succession planning. The first study, authored by Worrell and Davidson
(1987), studied a sample of 60 companies whose CEOs passed away unexpectedly. The
results of the study concluded that organizations fared better if they could immediately
name an internal successor. Huselid (1995) sampled 968 human resource (HR) executives
from publicly traded U.S. firms, concluding that a portfolio of high-performance work
practices (including elements of succession planning) was associated with employee
retention, productivity, and organizational financial performance. Ciampa and Watkins
(1999) studied a sample of 94 publicly traded U.S. firms that had appointed a new CEO
during 1992. The results of the study concluded that five years later, only 25% of
candidates brought in from outside were nominated as planned. Axelrod, Handfield-
Jones, and Welsh (2000) examined a sample of 56 large and mid-sized U.S. companies,
finding that campanies in the top quintile of talent management practices were associated
with a 22% higher return to shareholders than their industries’ means. Shen and Cannella
(2003) sampled 114 heir appointments in publicly traded U.S. companies, concluding that
while heir promotion did not affect share value, internal non-heir promotion had a
negative effect. The final study, conducted by Sharma, Chrisman, and Chua (2012),
studied 604 family owned Canadian firms. The results of the study concluded that
succession planning improves satisfaction with outcomes (Garman & Glawe, 2004).

13
The results from Garman and Glawe’s survey show that succession planning has
impacted firms in a positive manner (2004). In particuliar, as it relates to this study, the
Sharma, Chrisman, and Chua survey of 604 Canadian family owned businesses showed
that succession planning improved satisfaction with outcomes (2003). Other than the
studies surveyed by Garman and Glawe, little research is available on succession
planning practice. What little research is available is primarily comprised of case studies,
typically examining about a dozen companies and their succession planning processes
(Garman & Glawe, 2004).
Definition of Family Owned Business
No business can escape the fact that at some point a spouse, child, or other trusted
family member influenced the decesions of the owner or CEO of a company (Chua,
Chrisman, & Sharma, 1999). The definition of a family owned business varies from firm
to firm. Although knowledge about family businesses has grown over the last decade,
there is still no widely accepted definition of family business in the literature either
(Littunen & Hyrsky, 2000). According to Chua, Chrisman, and Sharma, “It is generally
accepted that a family’s involvement in the business makes the family business unique;
but the literature continues to have difficulty defining the family business” (Chua et al.,
1999, p. 19). While a general definition of family business does not currently exist, many
of the definitions have similarities. Chua et al. reviewed 250 scholarly papers in the
family business literature (1999). They excluded papers that did not define a family
business explicitly and those that did not differentiate between family owned and non-
family owned businesses. This screening process resulted in 21 definitions of family
owned business. These definitions then were compared with three possible combinations
14
of the concepts of ownership and management: family owned and family managed, family
owned but not family managed, and family managed but not family owned. Each of the 21
definitions identified agreed with the combination family owned and family managed, but
disagreed with the remaining two combinations (Chua et al., 1999).
Attempts have been made to establish both conceptual and operational definitions;
however, there is no definition universally accepted in teaching, consulting, the public, or
even family businesses (Van der Merwe et al., 2009). Creating an established definition
of family business would assist in building a cumulative body of knowledge over time.
Researchers have made numerous attempts to understand and articulate the common
components of existing definitions by reviewing and consolidating the many definitions
that exist today. One definition holds that family business enterprises are controlled by
members of the same family, and policy is determined and ownership is dominated by
members of the same kinship group (Barbara & Alberto Ivo, 2009). Another often cited
definition of family owned business refers to management, governance, family
contribution, and sustainable transgenerational succession:
The family business is a business governed and/or managed with the
intention to shape and pursue the vision of the business held by a dominant
coalition controlled by members of the same family or a small number of
families in a manner that is potentially sustainable across generations of the
family or families. (Chua et al., 1999, p. 25)
A general definition of family business is unlikely to materialize, but the multiple
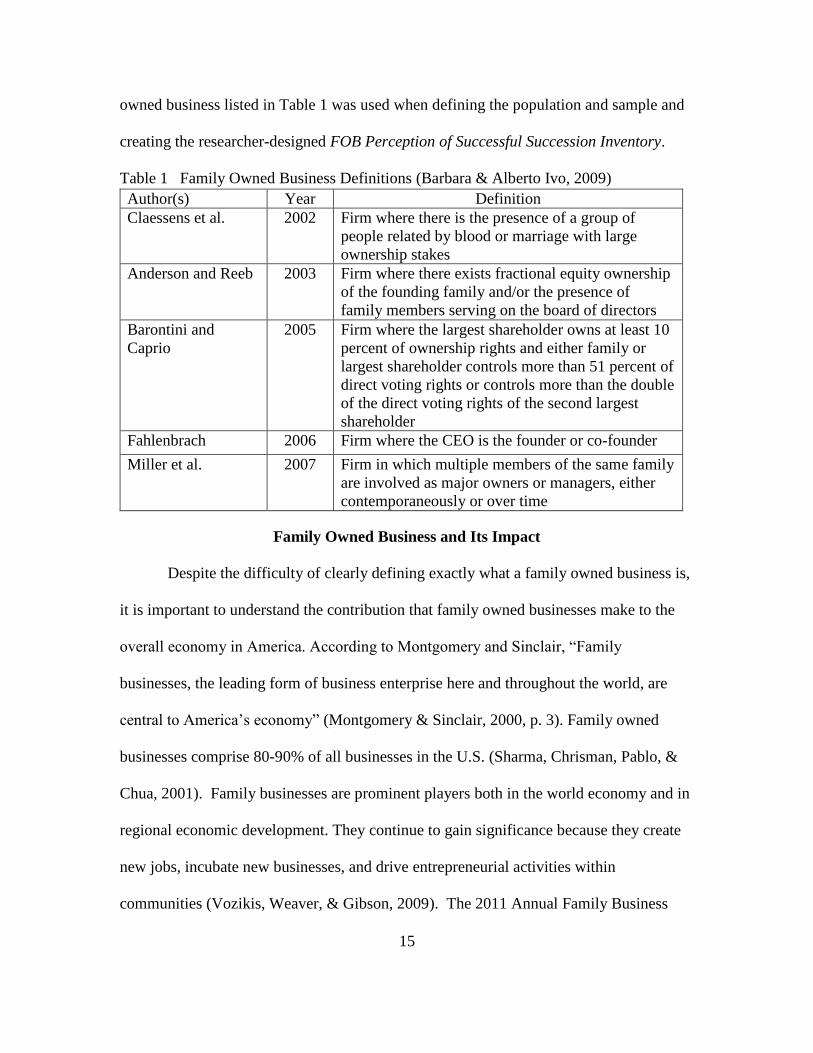
definitions do have similarities (Barbara & Alberto Ivo, 2009). Table 1 shows additional
definitions of family owned business that have been derived in the literature between
2002 and 2007. For the purposes of this study, the 2007 Miller et al. definition of family
15
owned business listed in Table 1 was used when defining the population and sample and
creating the researcher-designed FOB Perception of Successful Succession Inventory.
Table 1 Family Owned Business Definitions (Barbara & Alberto Ivo, 2009)
Family Owned Business and Its Impact
Despite the difficulty of clearly defining exactly what a family owned business is,
it is important to understand the contribution that family owned businesses make to the
overall economy in America. According to Montgomery and Sinclair, “Family
businesses, the leading form of business enterprise here and throughout the world, are
central to America’s economy” (Montgomery & Sinclair, 2000, p. 3). Family owned
businesses comprise 80-90% of all businesses in the U.S. (Sharma, Chrisman, Pablo, &
Chua, 2001). Family businesses are prominent players both in the world economy and in
regional economic development. They continue to gain significance because they create
new jobs, incubate new businesses, and drive entrepreneurial activities within
communities (Vozikis, Weaver, & Gibson, 2009). The 2011 Annual Family Business
Author(s) Year Definition
Claessens et al. 2002 Firm where there is the presence of a group of
people related by blood or marriage with large
ownership stakes
Anderson and Reeb 2003 Firm where there exists fractional equity ownership
of the founding family and/or the presence of
family members serving on the board of directors
Barontini and
Caprio
2005 Firm where the largest shareholder owns at least 10
percent of ownership rights and either family or
largest shareholder controls more than 51 percent of
direct voting rights or controls more than the double
of the direct voting rights of the second largest
shareholder
Fahlenbrach 2006 Firm where the CEO is the founder or co-founder
Miller et al. 2007 Firm in which multiple members of the same family
are involved as major owners or managers, either
contemporaneously or over time

16
Survey reported that family businesses have a dramatically positive impact on their
communities, and are the driving force of the American economy. With over 5.5 million
family owned businesses in the U.S., these family establishments are credited for
contributing 57% of the Gross Domestic Product and employ over 63% of the workforce
(USA, 2011). Furthermore, studies have shown that 35% of Fortune 500 companies are
family controlled (Office of Advocacy U.S. Small Business Administration, 2015).
Small businesses employ over half of U.S. workers, and a majority of small
businesses are family owned (Business, 2015). Out of 119.9 million non-farm private
sector workers in 2006, small and mid-size firms with fewer than 500 employees, as
defined by the SBA, employed 60.2 million individuals, while large firms employed 59.7
million. Firms with less than 20 employees employed 21.6 million (Zellweger, Nason, &
Nordqvist, 2012). However, despite their importance to the economy, research shows that
only a third of family businesses survive into the second generation, and only about 10-
15% last until the third generation (Birley, 1986; Ward, 1987). Poor successions are often
the source of the problem (Miller et al., 2003).
The SBA released a Louisiana Small Business Profile in February 2013. The
profile documented the number of businesses in Louisiana and the impact of small
businesses on the Louisiana economy. Small businesses represented 97.4% of all
employers and employed 54.5% of the private sector workforce in Louisiana. Louisiana
small businesses, a majority of which were firms with 20-499 employees, employed
871,369 workers and there were 76,168 small employers in 2010 (see Table 2). Most of
Louisiana’s small businesses employ relatively few individuals; in fact, 80.7% have no
employees and most have fewer than 20. Furthermore, the economic climate for

17
Louisiana small businesses is improving. During 2011, the number of establishments
opening was higher than the number closing and the employment turnover was positive
(Office of Advocacy U.S. Small Business Administration, 2013).
Based on the information identified in Table 2, there are over 60,000 family
owned businesses employing fewer than 500 employees operating in Louisiana. Sixty
thousand is a significant number of businesses creating employment opportunities and
overall economic growth within the Louisiana economy. Because of the importance of
family owned business, it is critical to study succession planning to understand the impact
planning has on successful succession.
Table 2 Small Business Profile (Office of Advocacy U.S. Small Business
Administration, 2013)
Louisiana Small Business Facts (2013)
Number of Businesses 2010 2009 2000
Small Employers (<500 employees) 79,168 79,403 79,569
Large Employers (500+ employees) 2,131 2,138 2,100
Non-employers 340,627 321,932 234,114
Succession Planning in Family Owned Businesses
Bigliardi and Dormio state, “During recent years, there has been a growing
interest in the study of FBs [Family Businesses]. Notwithstanding, little attention has
been paid to succession planning, and only [a] few studies tried to identify which factors
influence its success” (Barbara & Alberto Ivo, 2009, p. 44). Much of the literature on
family businesses suggests that their high failure rate can be reduced by improving the
succession process that transitions leadership from one generation to the next. As stated
earlier, there is a 30% attrition rate of family businesses from one generation to the next,
and only 10% of the firms survive into a third generation (File & Prince, 1996).
18
One of the central problems facing a family owned business is ensuring that
competent family leadership is available to transition the firm across generations (Isabelle
Le Breton-Miller, 2004). However, succession planning is one of the most overlooked
areas in a family business. When the leadership in a family owned business experiences
an unexpected event such as a sudden death, disability, partner retirement, or unresolved
family conflict, the business is likely to lose everything if it has not planned for
succession (Avila et al., 2003). Succession is more of a process than an event due to the
planning needed to prepare for a transition of leadership (Duh, 2012). That succession
planning process is very similar in family owned and non-family owned businesses, the
main difference being that the family owned business has a limited pool of qualified
candidates, all of whom have personal and delicate family relationships (Long &
Chrisman, 2013).
Planning for succession is one of the most challenging tasks facing family owned
businesses today. The failure to plan for leadership transition within a family owned
business is one of the greatest threats to the survival of the firm. Sharma, Chrisman, and
Chua claim that “Succession planning is believed to increase the probability of a
successful succession” (Sharma, Chrisman, & Chua, 2003, p. 3). Consequently, family
business literature shows that, in general, 20% of family owned businesses have a written
succession plan prior to the succession process. A study analyzing a database of 673
family owned businesses stated, “Consistent with other studies, the findings indicated
that only 20 percent had a written succession plan.” (Lee, Jasper, & Goebel, 2003, p. 31).
Organizations that carefully plan for leadership succession positivively impact their
ability to be successful (Pollitt, 2005). As Richards states, “Effective leadership is

19
fundamental to corporate success” (Richards, 2008, p. 446). However, the literature
suggests that there is still much to do to better understand family owned business
succession. Long and Chrisman describe the current state of research on succession
planning as follows:
Beginning with succession planning, although investigators place its
absence among the top reasons for failed successions, little is know about
why or how planning increases success. Questions regarding how much of
its impact is a function of the actual plan, the learning that occurs through
the process of planning, or the commitment to succession signaled to
stakeholders by the fact that planning is attempted have yet to be answered.
(Long & Chrisman, 2013, p. 258)
Longevity of Family Owned Businesses
One of the more commonly cited statistics on the the longevity of family owned
businesses is provided in John Ward’s (1987) seminal study, which states that 30% of
firms survive through the second generation, 13% survive the third generation, and only
3% survive beyond that (Zellweger et al., 2012). The average life span of these types of
businesses is 25 years (Scott, 2000). Many factors affect the longevity of family owned
businesses, including owner’s education, capital structure, age of the owner, operational
effectiveness, dysfunctional management, and family relationship. In addition, many
external factors play a role, such as a declining market, political stability in the country,
and overal economic condition (Monk, 2000; Williams & Jones, 2010). Researchers
place the absence of succession planning among the top reasons for failed succession
(Long & Chrisman, 2013). As File and Prince state,
A major focus of family business studies has been the effect of succession
planning on family business continuity; and specifically on the association
between inadequate succession planning and family business failure. This
focus is appropriate given the incidence of family business failure and the
importance of family businesses within the US economy. Much of the
20
literature suggests that the incidence of failure can be reduced with
improved management of the leadership transition from one generation to
the next—the process in the life of the business and the family customarily
referred to as succession (File & Prince, 1996, p. 171)
Define Successful Succession in Family Owned Business
Succession planning is central to the continuity and longevity of family owned
businesses. Although much of the literature focuses on succession issues, little attention
has been given to the planning of the succession and identifying the factors that influence
success (Barbara & Alberto Ivo, 2009). The process of a successful succession begins
many years before the selected family member takes over as CEO of the the family firm
(Barach & Ganitsky, 1995). Planning for succession is the longest strategic planning
process a family firm will undertake, and the process is designed so that the old CEO can
help the new develop as a leader and understand the overall operations of the business. It
is critical for family owned businesses to identify qualified family memebers capable of
providing leadership within the business. Without qualified next generation leadership,
the business cannot survive, much less maintain its unique family business character
(Barach & Ganitsky, 1995). Barbara Bigliardi and Alberto Ivo Dormio (2009) identified
several criteria and related indicators for a successful succession. For their first criterion,
“objective criteria for results,” they list sales volume, profits, financial indicators, and
market share as indicators (Cabrera-Suarez, 2005; Dyer, 1986; Handler, 1991). The
second criterion, “level of satisfaction of the parties involved,” is indicated by
heir’s/family business member's commitment; conflict among family business members;
and decline in relationships with customers, suppliers, and banks (Cabrera-Suarez, 2005;
Handler, 1991; Sharma et al., 2001). Lastly, the indicators for the criterion “success in

21
succession” are the subsequent positive performance of the firm, the ultimate viability of
the business, and the satisfaction of the stakeholders with the succession process
(Cabrera-Suárez et al., 2000; Dyer, 1986; Handler, 1990; Morris et al., 1997; Sharma et
al., 2001 (Barbara & Alberto Ivo, 2009, p. 46). Van der Merwe et al. offer another
definition of a successful succession: “If the leadership transition is so smooth that the
change does not disrupt the family or the business, then the succession can be labelled
highly successful” (Van der Merwe et al., 2009, p. 7).
In addition, Vozikis et al. have discussed two dimensions that characterize a
successful succession (2009). The first dimension is the satisfaction of all parties with the
process and the second, the effectiveness of the process. The satisfaction dimension
represents how the families feel about the process while it is occurring, while the
effectiveness dimension represents the impact of the process on the performance of the
firm (Vozikis et al., 2009). Figure 1 illustrates the two dimensions and how they affect
successful successions
.
Figure 1 Satisfaction, Effectiveness, and Successful Succession
Source: (Pyromalis, 2006, p. 430)
22
After conducting an extensive review of literature on succession in family owned
businesses, Le Breton-Miller, Miller, and Steier have suggested that the following
measures are among the most important for sucessful succession (2004):
The subsequent positive performance of the firm and ultimate viability of the
business
The satisfaction of stakeholders with the succession process (Cabrera-Suarez et
al., 2001; Dyer, 1986; Handler, 1990; Morris et al., 1997; Sharma et al., 2001)
Other indicators of sucessful succession identified in the family owned business literature
include both objective and subjective measurements. Objective measurements include
sales volume, profits, financial indicators, and market share; whereas more subjective
measurements include the commitment of heirs and family business members, conflict
among family business members, and a decline of relationships with customers or
suppliers (Barbara & Alberto Ivo, 2009).
Components of a Succession Plan
The literature suggests that a business will gain immense value from a formal
written succession plan that communicates a step-by-step approach to managing the
practical and psychological aspects of the transition process. The basic concepts of a
written succession plan should include the actions, events, and mechanisms by which the
leadership and ownership is transferred to the next generation (Van der Merwe et al.,
2009). The most common components discussed in articles deal with technical issues
such as tax, financing, and legal aspects of the transaction. This focus is largely due to
the fact that businesess typically turn to trusted advisors such as certified public
accountants and lawyers for advice on succession planning. Consequently, soft issues

23
such as long-term personal and family goals, shared vision and communication with
employees and stakeholders, development of the successor, and anticipated roll of the
incumbent after succession are often overlooked and remain unplanned (Bruce & Picard,
2006).
Succession within a family owned business requires the following three
components: a leader willing to transfer the leadership role, a successor willing to take
over the role, and a mechanisim by which the transition takes place [succession plan]
(Sharma et al., 2001). Miller, Steier, and Breton-Miller developed the Integrative Model
For Successful FOB Successions after reviewing over 40 articles and seven books,
including emperical, theoretical, and anecdotal articles based on positive succession
expereicnces. The researchers focused on two components of the model: Ground Rules
& 1st Steps and Nurturing/Development of successor(s). Ground Rules & 1st Steps
identify specific criteria that should be included in a successful succession plan. These
components include: governance guidelines (rules for ownership, board, council),
selection criteria, rules for choice (primogeniture, etc.), range of candidates (family, in-
laws, external), succession task force (key people, major stakeholders), and career plan
for bypassed non-family members and family members. The second component includes
nurturing/development of the successor(s). This component includes criteria such as
previous employment with the business and establishing gaps between FOB needs and
prospective successors abilities (Isabelle Le Breton-Miller, 2004).
Summary
This chapter defined succession planning and family owned businesses based on a
review of the literature. The term succession planning has been used to describe a wide
24
variety of activities involving planning for a leadership transition within an organization.
Literature suggests that succession planning is critical not only in large organizations, but
also in small and medium-sized enterprises [SME]. Although this process is critical in
ensuring the longevity of an organization, according to Berchelman, “Succession
planning may seem like an essential process for long-term success, but far too many
organizations jeopardize results by hoping that the right person is available for promotion
when positions become available unexpectedly” (Berchelman, 2005, p. 11).
Many definitions of family owned business can be found in the literature, and this
chapter identified those that are most widely cited. Despite the difficulty in clearly
defining family owned business, the contributions they make to the overall economy are
significant. With over 5.5 million family owned businesses in the U.S. generating over
57% of the Gross Domestic Product and employing over 63% of the nation’s workforce,
family owned businesses are a significant population. However, research shows that
succession within family owned business has a low success rate of transferring leadership
from generation to generation. Only a third of family businesses survive into the second
generation, and only about 10-15%, until the third (Isabelle Le Breton-Miller, 2004).
Thus, this study focused on the succession planning process conducted within family
owned businesses.
25
CHAPTER 3: METHODOLOGY
Purpose of the Study
The primary purpose of this study was to determine the influence selected aspects
of succession planning and selected demographic characteristics have on the level of
success in the succession of family owned businesses in south Louisiana.
Dependent Variable
The dependent variable of this study is the perceptions of family owned business
owners and managers regarding successful succession.
Objectives
The researcher formulated the following objectives to guide the study:
1. Describe family owned businesses in south Louisiana in terms of the following
characteristics:
a) Age of the family owned business based on number of years in business;
b) Incumbent's educational level;
c) Successor's educational level;
d) Number of employees on payroll;
e) Type of business (retail, service, manufacturing, etc.);
f) Whether or not leadership prepared a quality succession plan;
g) Whether or not there was a positive revenue performance subsequent to
succession.
2. Determine how family owned business owners and managers in south Louisiana
perceive selected aspects of succession planning:
26
a) Degree to which a firm commitment to successful succession was signaled to
stakeholders throughout the planning process;
b) Degree to which the leadership began the succession planning process in a
timely manner;
c) Degree to which the incumbent and successor learned throughout the planning
process;
d) Degree to which stakeholders were satisfied with the succession process;
e) Degree to which family members were harmonious during and after the
succession process;
f) Degree to which planning contributed to a successful transition.
3. Determine if a relationship exists between how family owned business owners
and managers in south Louisiana perceive selected aspects of succession planning
and the following variables:
a) Age of the family owned business based on number of years in business;
b) Incumbent’s educational level;
c) Successor’s educational level;
d) Number of employees on payroll;
e) Type of business (retail, service, manufacturing, etc.);
f) Whether or not leadership prepared a quality succession plan;
g) Whether or not there was a positive revenue performance subsequent to
succession.
27
4. Determine if a model exists that explains a significant portion of the variance in
the perception of family owned business owners and managers in south Louisiana
regarding selected aspects of succession planning from the following variables:
a) Age of the family owned business based on number of years in business;
b) Incumbent's educational level;
c) Successor's educational level;
d) Number of employees on payroll;
e) Type of business (retail, service, manufacturing, etc.);
f) Whether or not leadership prepared a quality succession plan;
g) Whether or not there was a positive revenue performance subsequent to
succession.
Research Design
This study used a survey research design. In survey research, the researcher asks
the participants a series of questions in order to answer the research objectives. Questions
may be administered in several formats, including personal interviews, telephone
interviews, mailed questionnaires, and electronic questionnaires (Totten, Panacek, &
Price, 1999). The survey questionnaire provides a snapshot of the current state of affairs
in a group or population and consequently, survey research is often referred to as
descriptive work. The primary concern encountered in survey research is ensuring the
representativeness of the sample, or that the group surveyed is representative of the
population of interest (Marín, 2012).

28
Population and Sample
The population in this study was family owned businesses located in south
Louisiana who had undergone a planned succession. The researcher identified businesses
that employ two or more employees, using multiple sources to compile the sample. These
sources included, but were not limited to, the LexisNexis Academic database, Baton
Rouge Business Report subscription list, LSU Innovation Park database, Tulane Family
Business Center membership, and Excelerant customer list. Family owned businesses
were described using the following demographic characteristics: (1) age of the firm, (2)
incumbent's educational level, (3) successor's educational level, (4) number of employees
on payroll, (5) type of business, (6) existence or not of a written succession plan, and (7)
subsequent positive revenue performance or not. In addition, the researcher determined
the perceptions of successful succession held by the businesses' owners and managers.
The following perceptions were measured: (1) degree to which commitment was signaled
to stakeholders throughout the planning process, (2) degree to which leadership prepared
early for succession, (3) degree to which learning occurred throughout the planning
process, (4) degree to which stakeholders were satisfied with the process, and (5) degree
to which conflict arose among family members.
Instrumentation
The researcher collected data on family owned businesses in south Louisiana
using a researcher-designed instrument called the FOB Perception of Successful
Succession Inventory. The instrument was designed to measure the perception held by the
family owned business successor regarding succession planning and success. The
instrument was developed based on a review of literature and factors that are believed to
29
contribute to successful succession. These factors include the following: Early
Preparation (Barach & Ganitsky, 1995); Commitment to Succession (Long & Chrisman,
2013); Learning that Occurs (Long & Chrisman, 2013); and Quality of the Plan (Long &
Chrisman, 2013). In addition, the instrument was used to measure the perception held by
owners and managers of family owned businesses on succession success based on a
review of literature and factors of success. These factors include the following: Positive
Performance of the Firm (Isabelle Le Breton-Miller, 2004; Cabrera-Suarez, 2005; Dyer,
1986; Handler, 1991); Satisfied Stakeholders (Cabrera-Suarez et al., 2001; Dyer, 1986;
Handler, 1990; Morris et al., 1997; Sharma et al., 2001); and Harmonious Family
Members (Handler, 1991).
The researcher-designed instrument FOB Perception of Successful Succession
Inventory underwent a content validation process, in which a panel of five experts, both
academic and industrial, reviewed the instrument to ensure it allowed the researcher to
accomplish the purpose and objectives of this study. Based on input from the panel of
experts, the researcher made appropriate modifications.
Successful Succession Score
The researcher also established criteria for a successful succession score, using
the following items on the researcher-designed survey instrument:
Item 10 – Financial performance of the firm after the succession process was
maintained or increased;
Item 18 – Employees were informed throughout the succession process;
Item 19 – Employees were engaged throughout the succession process;
30
Item 20 – Leadership demonstrated commitment to a successful succession
throughout the succession process;
Item 31 – Family members have defined roles within the firm;
Item 32 – Effective communication among family members exists within the
business;
Item 33 – Family members’ relationships have improved or remained the same
after succession.
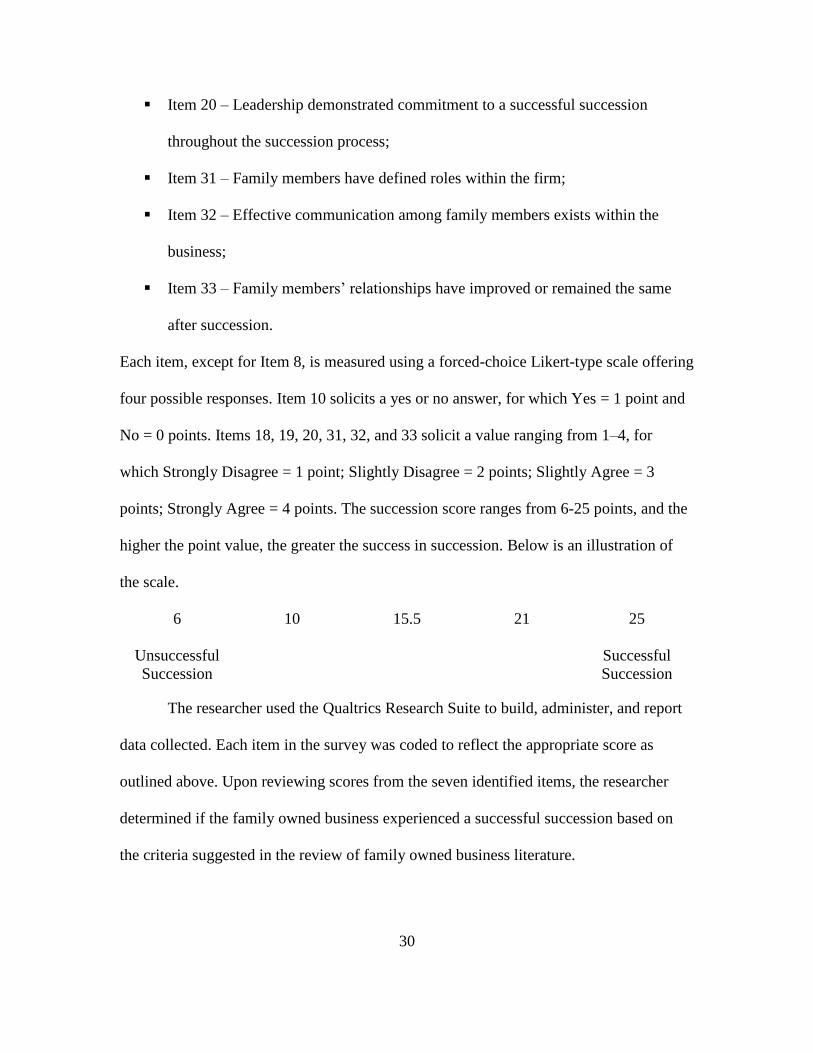
Each item, except for Item 8, is measured using a forced-choice Likert-type scale offering
four possible responses. Item 10 solicits a yes or no answer, for which Yes = 1 point and
No = 0 points. Items 18, 19, 20, 31, 32, and 33 solicit a value ranging from 1–4, for
which Strongly Disagree = 1 point; Slightly Disagree = 2 points; Slightly Agree = 3
points; Strongly Agree = 4 points. The succession score ranges from 6-25 points, and the
higher the point value, the greater the success in succession. Below is an illustration of
the scale.
6 10 15.5 21 25
Unsuccessful
Succession
Successful
Succession
The researcher used the Qualtrics Research Suite to build, administer, and report
data collected. Each item in the survey was coded to reflect the appropriate score as
outlined above. Upon reviewing scores from the seven identified items, the researcher
determined if the family owned business experienced a successful succession based on
the criteria suggested in the review of family owned business literature.
31
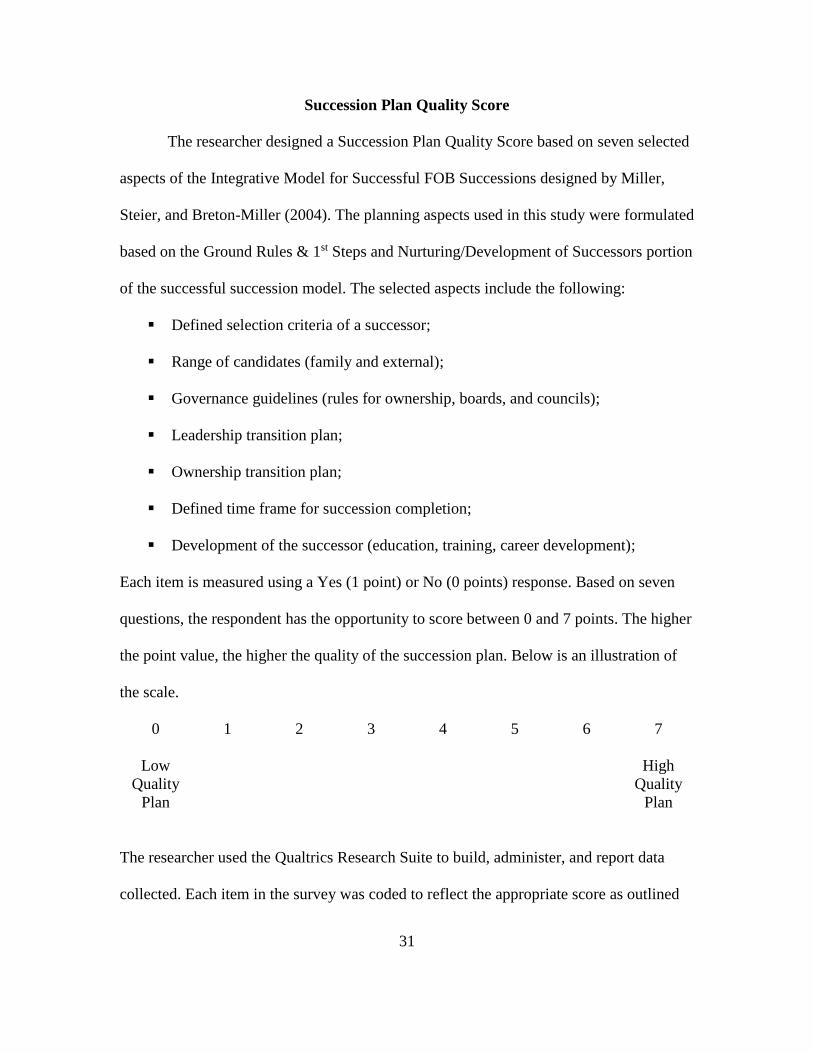
Succession Plan Quality Score
The researcher designed a Succession Plan Quality Score based on seven selected
aspects of the Integrative Model for Successful FOB Successions designed by Miller,
Steier, and Breton-Miller (2004). The planning aspects used in this study were formulated
based on the Ground Rules & 1st Steps and Nurturing/Development of Successors portion
of the successful succession model. The selected aspects include the following:
Defined selection criteria of a successor;
Range of candidates (family and external);
Governance guidelines (rules for ownership, boards, and councils);
Leadership transition plan;
Ownership transition plan;
Defined time frame for succession completion;
Development of the successor (education, training, career development);
Each item is measured using a Yes (1 point) or No (0 points) response. Based on seven
questions, the respondent has the opportunity to score between 0 and 7 points. The higher
the point value, the higher the quality of the succession plan. Below is an illustration of
the scale.
0 1 2 3 4 5 6 7
Low
Quality
Plan
High
Quality
Plan
The researcher used the Qualtrics Research Suite to build, administer, and report data
collected. Each item in the survey was coded to reflect the appropriate score as outlined
32
above. Upon reviewing scores from the seven identified items, the researcher determined
the quality of the succession plan based on the selected criteria suggested in the review of
family owned business literature.
Data Collection
An introduction letter was sent electronically (via email) to each subject to
explain the purpose of the study as well as explain that participation was both voluntary
and confidential. The letter also specified the time available for completing the survey
and provided the online survey link and contact information for questions. Using
Cochran’s sample size determination formula, the researcher determined that 96 usable
responses were required to maintain the established margin of error. The survey remained
open for four weeks and, if a response was not collected after the first week, a follow-up
email with a link to the survey was sent reminding non-responders of the online survey.
This procedure was repeated in weeks two, three, and four to ensure the highest number
of responses within the sample were collected. Once the electronic survey ended in week
four, the collected usable responses made up the dataset for this study. The survey was
administered electronically utilizing the Qualtrics Research Suite website,
https://lsu.qualtrics.com. The data obtained through LexisNexis Academic database
includes company name, title, address, and other company specific information; however,
the remaining sources distributed the survey internally and only the results were
submitted to the researcher via Qualtrics for analysis. When the data was received, the
researcher deleted all personal identifiers prior to importing the data into the SPSS
program for analysis. Therefore, when the data was analyzed, there was no potential to
connect individual responses to specific respondents. Even if individual subjects self-

33
identified, the personal identification information was deleted prior to analysis. The
researcher completed the Institution Review Board (IRB) training through Louisiana
State University and filed the proper IRB application prior to administering the electronic
survey.
Data Analysis
The first objective in the study was descriptive and was analyzed using
descriptive statistics such as frequency and percentages. The second objective was to
determine perceptions, which was summarized by computing the mean and standard
deviation of scores. In addition, the researcher conducted a factor analysis on the six
identified planning and success factors to determine if the items in each factor effectively
grouped together. In the third objective, Spearman’s rank-order and Point Biserial
correlation coefficients were used to determine if a relationship exist between how family
owned business owners and managers in south Louisiana perceive selected aspects of
succession planning and the independent variables. Objective four was examined using
bivariate correlation and multiple regression analysis to determine if a model exist
explaining a significant portion of the variance in the perceptions of family owned
business owners and managers and the independent variables.

34
CHAPTER 4: RESULTS
Purpose of the Study
The primary purpose of this study was to determine the influence selected aspects
of succession planning and selected demographic characteristics have on the level of
success in the succession of family owned businesses in south Louisiana. Findings of
this study are presented by objective in the following sections.
Objective One Results
The first objective of this study was to describe family owned businesses in south
Louisiana in terms of the following characteristics:
a) Age of the family owned business based on number of years in business;
b) Incumbent's educational level;
c) Successor's educational level;
d) Number of employees on payroll;
e) Type of business (retail, service, manufacturing, etc.);
f) Whether or not leadership prepared a quality succession plan;
g) Whether or not there was a positive revenue performance subsequent to
succession.
The researcher collected 136 total responses from the FOB Perception of
Successful Succession Inventory survey. The survey included three screening questions
requiring a “Yes” answer to continue the survey. The screening questions included: 1)
are you a family owned business, 2) has your company completed a leadership succession
to the next generation, and 3) was a written succession plan prepared. Of the 136
respondents, 105 were identified as a family owned business. Of the 105 family owned
35
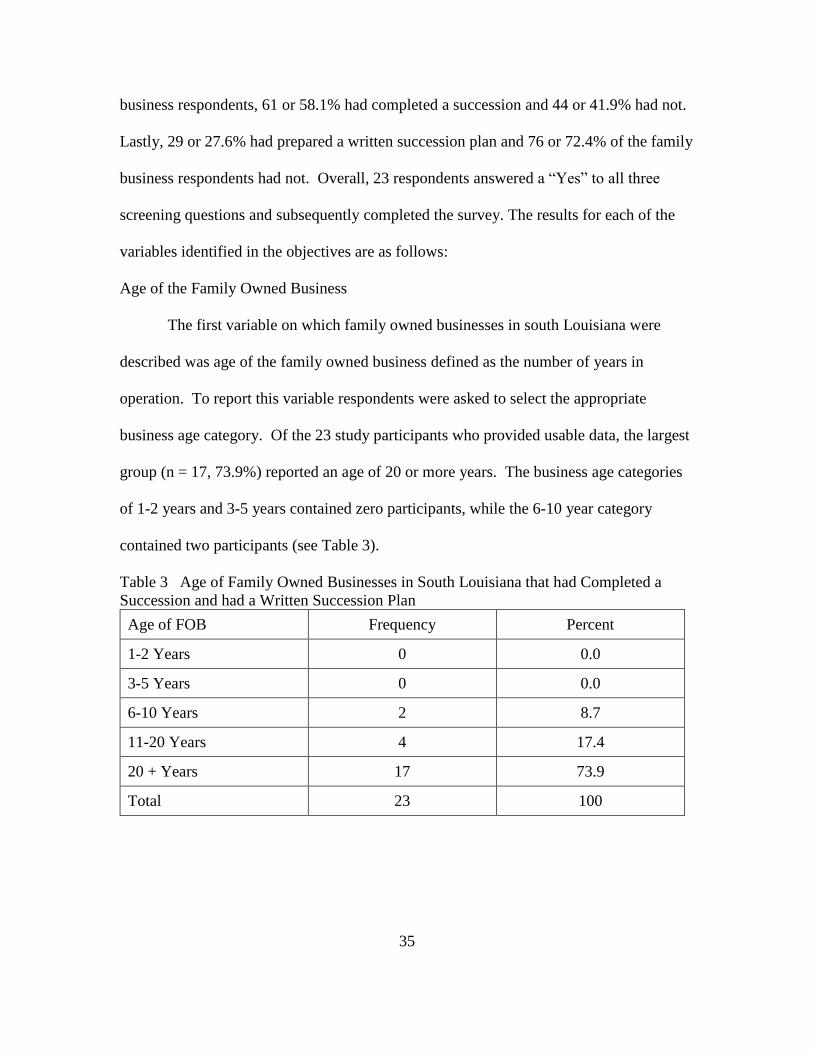
business respondents, 61 or 58.1% had completed a succession and 44 or 41.9% had not.
Lastly, 29 or 27.6% had prepared a written succession plan and 76 or 72.4% of the family
business respondents had not. Overall, 23 respondents answered a “Yes” to all three
screening questions and subsequently completed the survey. The results for each of the
variables identified in the objectives are as follows:
Age of the Family Owned Business
The first variable on which family owned businesses in south Louisiana were
described was age of the family owned business defined as the number of years in
operation. To report this variable respondents were asked to select the appropriate
business age category. Of the 23 study participants who provided usable data, the largest
group (n = 17, 73.9%) reported an age of 20 or more years. The business age categories
of 1-2 years and 3-5 years contained zero participants, while the 6-10 year category
contained two participants (see Table 3).
Table 3 Age of Family Owned Businesses in South Louisiana that had Completed a
Succession and had a Written Succession Plan
Age of FOB Frequency Percent
1-2 Years 0 0.0
3-5 Years 0 0.0
6-10 Years 2 8.7
11-20 Years 4 17.4
20 + Years 17 73.9
Total 23 100
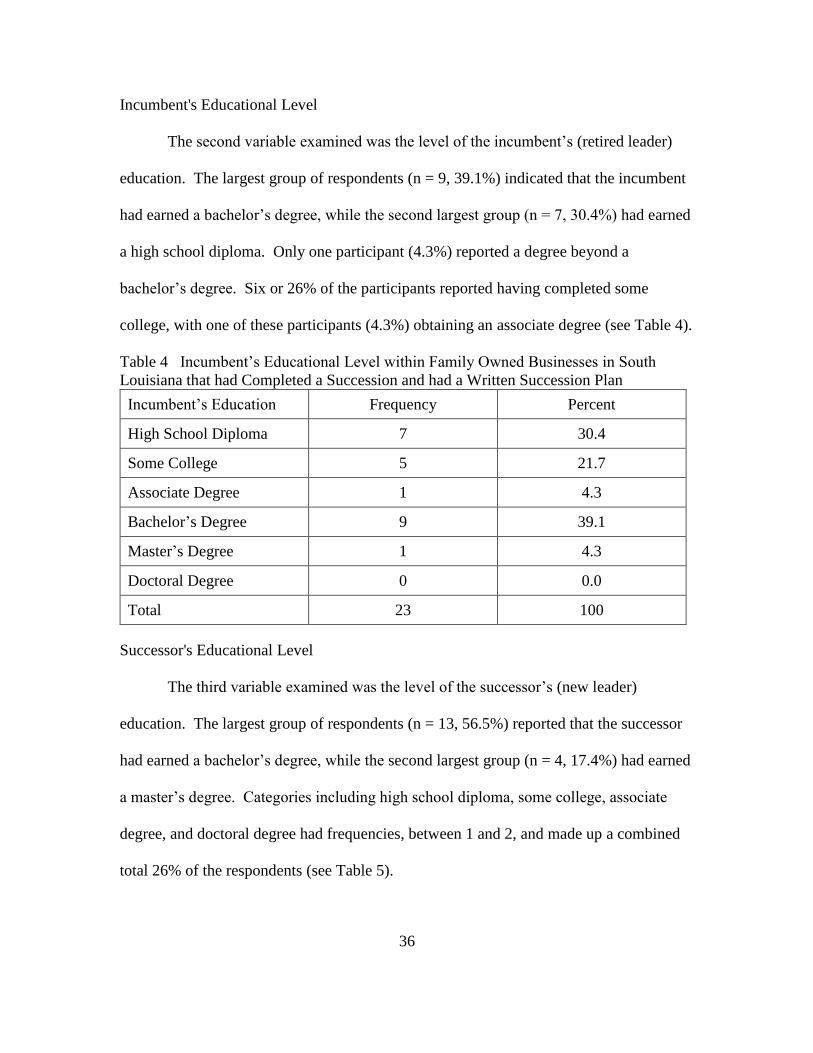
36
Incumbent's Educational Level
The second variable examined was the level of the incumbent’s (retired leader)
education. The largest group of respondents (n = 9, 39.1%) indicated that the incumbent
had earned a bachelor’s degree, while the second largest group (n = 7, 30.4%) had earned
a high school diploma. Only one participant (4.3%) reported a degree beyond a
bachelor’s degree. Six or 26% of the participants reported having completed some
college, with one of these participants (4.3%) obtaining an associate degree (see Table 4).
Table 4 Incumbent’s Educational Level within Family Owned Businesses in South
Louisiana that had Completed a Succession and had a Written Succession Plan
Incumbent’s Education Frequency Percent
High School Diploma 7 30.4
Some College 5 21.7
Associate Degree 1 4.3
Bachelor’s Degree 9 39.1
Master’s Degree 1 4.3
Doctoral Degree 0 0.0
Total 23 100
Successor's Educational Level
The third variable examined was the level of the successor’s (new leader)
education. The largest group of respondents (n = 13, 56.5%) reported that the successor
had earned a bachelor’s degree, while the second largest group (n = 4, 17.4%) had earned
a master’s degree. Categories including high school diploma, some college, associate
degree, and doctoral degree had frequencies, between 1 and 2, and made up a combined
total 26% of the respondents (see Table 5).
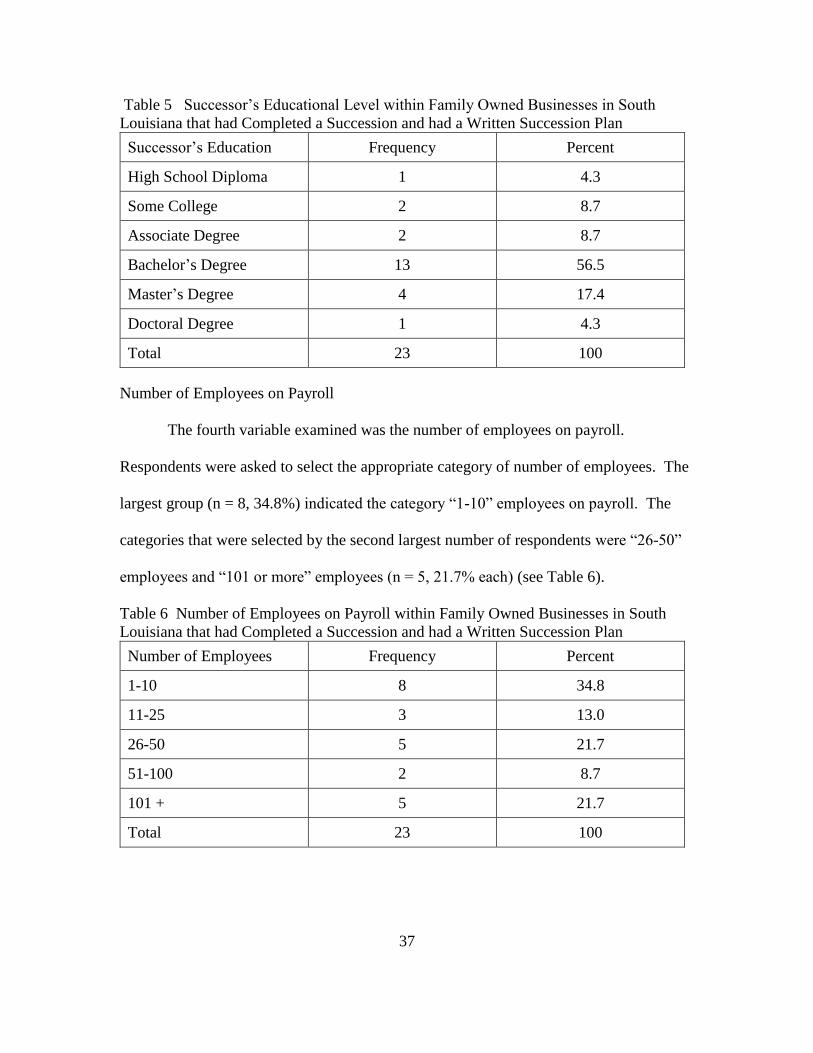
37
Table 5 Successor’s Educational Level within Family Owned Businesses in South
Louisiana that had Completed a Succession and had a Written Succession Plan
Successor’s Education Frequency Percent
High School Diploma 1 4.3
Some College 2 8.7
Associate Degree 2 8.7
Bachelor’s Degree 13 56.5
Master’s Degree 4 17.4
Doctoral Degree 1 4.3
Total 23 100
Number of Employees on Payroll
The fourth variable examined was the number of employees on payroll.
Respondents were asked to select the appropriate category of number of employees. The
largest group (n = 8, 34.8%) indicated the category “1-10” employees on payroll. The
categories that were selected by the second largest number of respondents were “26-50”
employees and “101 or more” employees (n = 5, 21.7% each) (see Table 6).
Table 6 Number of Employees on Payroll within Family Owned Businesses in South
Louisiana that had Completed a Succession and had a Written Succession Plan
Number of Employees Frequency Percent
1-10 8 34.8
11-25 3 13.0
26-50 5 21.7
51-100 2 8.7
101 + 5 21.7
Total 23 100
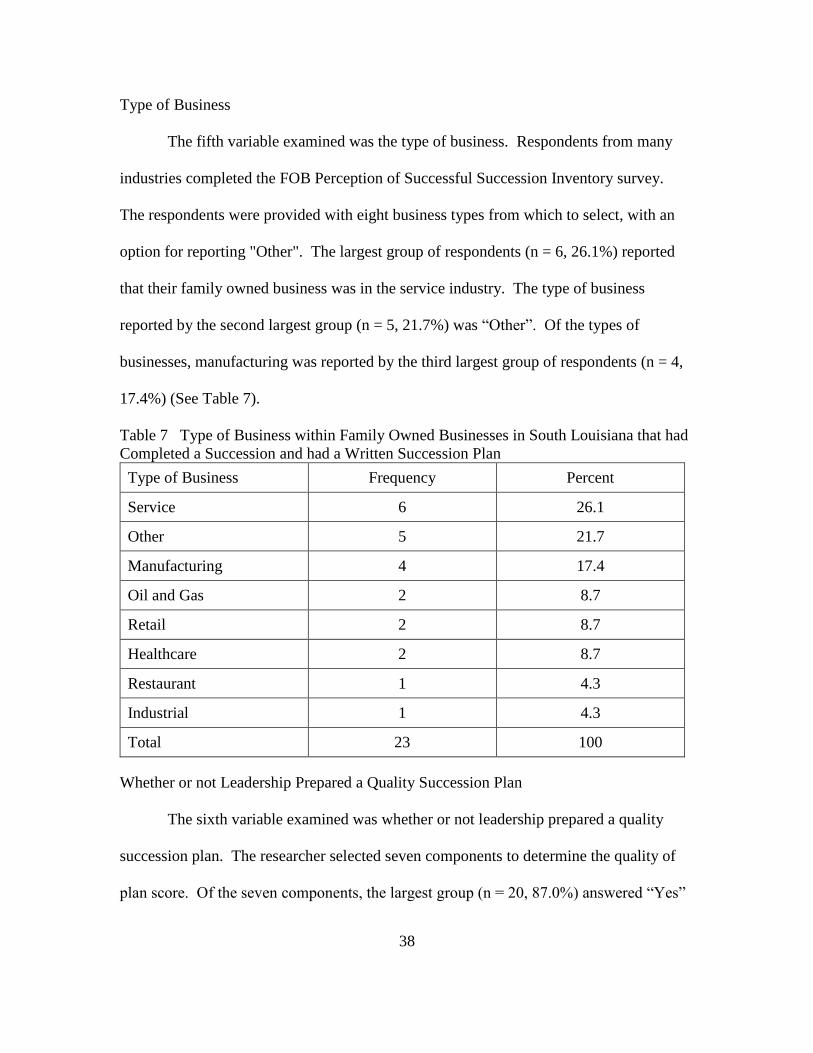
38
Type of Business
The fifth variable examined was the type of business. Respondents from many
industries completed the FOB Perception of Successful Succession Inventory survey.
The respondents were provided with eight business types from which to select, with an
option for reporting "Other". The largest group of respondents (n = 6, 26.1%) reported
that their family owned business was in the service industry. The type of business
reported by the second largest group (n = 5, 21.7%) was “Other”. Of the types of
businesses, manufacturing was reported by the third largest group of respondents (n = 4,
17.4%) (See Table 7).
Table 7 Type of Business within Family Owned Businesses in South Louisiana that had
Completed a Succession and had a Written Succession Plan
Type of Business Frequency Percent
Service 6 26.1
Other 5 21.7
Manufacturing 4 17.4
Oil and Gas 2 8.7
Retail 2 8.7
Healthcare 2 8.7
Restaurant 1 4.3
Industrial 1 4.3
Total 23 100
Whether or not Leadership Prepared a Quality Succession Plan
The sixth variable examined was whether or not leadership prepared a quality
succession plan. The researcher selected seven components to determine the quality of
plan score. Of the seven components, the largest group (n = 20, 87.0%) answered “Yes”

39
to component 5: the plan included an ownership transition plan. The second largest
“Yes” response (n = 17, 73.9%) indicated component 4: the plan included a leadership
transition plan. The smallest group (n = 10, 43.3%) reported both component 2: range of
candidates – family or external and component 3: the plan included governance
guidelines (see Table 8).
Table 8 Quality of Plan Score Components by Family Owned Businesses in South
Louisiana that had Completed a Succession and had a Written Succession Plan
Plan Score Component
Frequency & Percent
Yes / % No / %
Component 5: The plan included an ownership
transition plan 20 / 87.0% 3 / 13.0%
Component 4: The plan included a leadership
transition plan 17 / 73.9% 6 / 26.1%
Component 6: The plan included a timeframe
for succession completion 15 / 65.2% 8 / 34.8%
Component 1: The plan defined selection
criteria of a successor 14 / 60.9% 9 / 39.1%
Component 7: The plan addressed development
of the successor 12 / 52.2% 11 / 47.8%
Component 3: The plan included governance
guidelines 10 / 43.5% 13 / 56.5%
Component 2: Range of candidates – family or
external 10 / 43.3% 13 / 56.5%
Note. (n=23)
The researcher designed a Succession Plan Quality Score based on seven selected
aspects of the Integrative Model for Successful FOB Successions designed by Miller,
Steier, and Breton-Miller (2004). The planning aspects used in this study were formulated

40
based on the Ground Rules & 1st Steps and Nurturing/Development of Successors portion
of the successful succession model. The selected aspects include the following
components: 1) defined selection criteria of a successor, 2) range of candidates (family
and external), 3) governance guidelines (rules for ownership, boards, and councils), 4)
leadership transition plan, 5) ownership transition plan, 6) defined time frame for
succession completion, and 7) development of the successor (education, training, career
development. Each item was measured using a “Yes” (1 point) or “No” (0 points)
response. Based on seven questions, each respondent has the opportunity to score
between 0 and 7 points. The higher the point value, the higher the quality of the
succession plan.
The researcher established an Interpretive Scale to report quality of the plan
scores. The quality of the plan score ranges from 0 -7 points and the quality scale is
partitioned as follow: 0-1 Points = Low Quality (LQ), 2-3 Points = Moderate Low (ML),
4-5 Points = Moderate High (MH), and 6-7 Points = High Quality (HQ). Three
respondents (N = 3, 13%) received a quality score of 7, meaning the prepared plan was of
high quality. Five respondents (N=5, 21.7%) received a quality score of 6, meaning the
prepared plan was of high quality. No respondent received a zero score; however, three
respondents (N = 3, 13%) received a quality plan score of 1, which indicates that a low
quality plan was prepared (see Table 9).
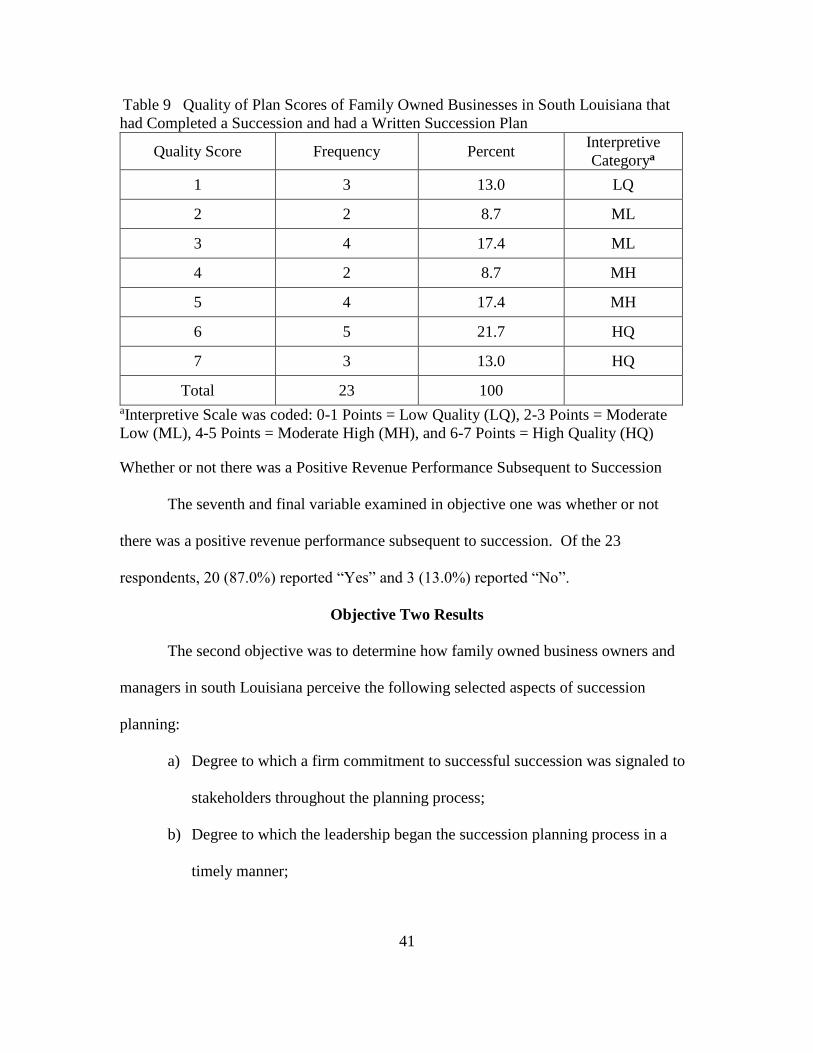
41
Table 9 Quality of Plan Scores of Family Owned Businesses in South Louisiana that
had Completed a Succession and had a Written Succession Plan
Quality Score Frequency Percent Interpretive
Categorya
1 3 13.0 LQ
2 2 8.7 ML
3 4 17.4 ML
4 2 8.7 MH
5 4 17.4 MH
6 5 21.7 HQ
7 3 13.0 HQ
Total 23 100
aInterpretive Scale was coded: 0-1 Points = Low Quality (LQ), 2-3 Points = Moderate
Low (ML), 4-5 Points = Moderate High (MH), and 6-7 Points = High Quality (HQ)
Whether or not there was a Positive Revenue Performance Subsequent to Succession
The seventh and final variable examined in objective one was whether or not
there was a positive revenue performance subsequent to succession. Of the 23
respondents, 20 (87.0%) reported “Yes” and 3 (13.0%) reported “No”.
Objective Two Results
The second objective was to determine how family owned business owners and
managers in south Louisiana perceive the following selected aspects of succession
planning:
a) Degree to which a firm commitment to successful succession was signaled to
stakeholders throughout the planning process;
b) Degree to which the leadership began the succession planning process in a
timely manner;

42
c) Degree to which the incumbent and successor learned throughout the planning
process;
d) Degree to which stakeholders were satisfied with the succession process;
e) Degree to which family members were harmonious during and after the
succession process;
f) Degree to which planning contributed to a successful transition.
Objective two was to determine the perceptions family owned business owners
and managers have regarding succession planning and success. This analysis begins with
determining the mean and standard deviation of each perception item measured in the
FOB Perception of Successful Succession Inventory survey. Participants rated their level
of agreement based on a 4-point Likert-type scale with the following descriptors:
Strongly Disagree = 1, Disagree = 2, Agree = 3, and Strongly Agree = 4. The mean of
the item scores range from 2.65 to 3.53. These ratings are determined from the
completion of 19 perception items grouped into six perception factors. The perception
factors include Commitment to Stakeholders, Early Preparation, Learning that Occurs,
Satisfied Stakeholders, Harmonious Family Members, and Planning and Success.
Family owned business owners and managers showed the highest level of
agreement was with the statement “Planning for succession early is important to
successful succession” (Mean = 3.74, SD = .541). The second highest level of agreement
is with the statement “Planning had a positive effect on the overall succession process”
(Mean = 3.52, SD = .846). The lowest level of agreement was indicated with the
statement “Employees were engaged throughout the succession process” (Mean = 2.61,
SD = .941).

43
The researcher established an Interpretative Scale to link the reported mean scores
to the level of agreement statements Strongly Disagree (SD), Disagree (D), Agree (A),
and Strongly Agree (SA). Of the 19 perception statements, the level of agreement was
Agree (A) on 17 items and Strongly Agree (SA) on two items. The two items with
Strongly Agree (SA) include “Planning for succession early is important to successful
succession” and “Planning had a positive effect on the overall succession process” (see
Table 10).
Table 10 Perception of Succession Planning as Reported by Family Owned Businesses
Located in South Louisiana
Perception Statement Meana Standard
Deviation
Interpretive
Categoryb
Planning for succession early is important
to successful succession 3.74 .541 SA
Planning had a positive effect on the
overall succession process 3.52 .846 SA
The successor learned throughout the
succession planning process 3.48 .790 A
Customer relationship improved or
remained the same after succession 3.48 .730 A
The succession process at my company
was successful 3.43 .843 A
Vendor relationship improved or remained
the same after succession 3.39 .722 A
Leadership demonstrated commitment to a
successful succession through the
succession process
3.36 .902 A
The succession plan placed the needs of
the organization at the forefront 3.30 .974 A
The incumbent learned throughout the
succession planning process 3.30 .822 A
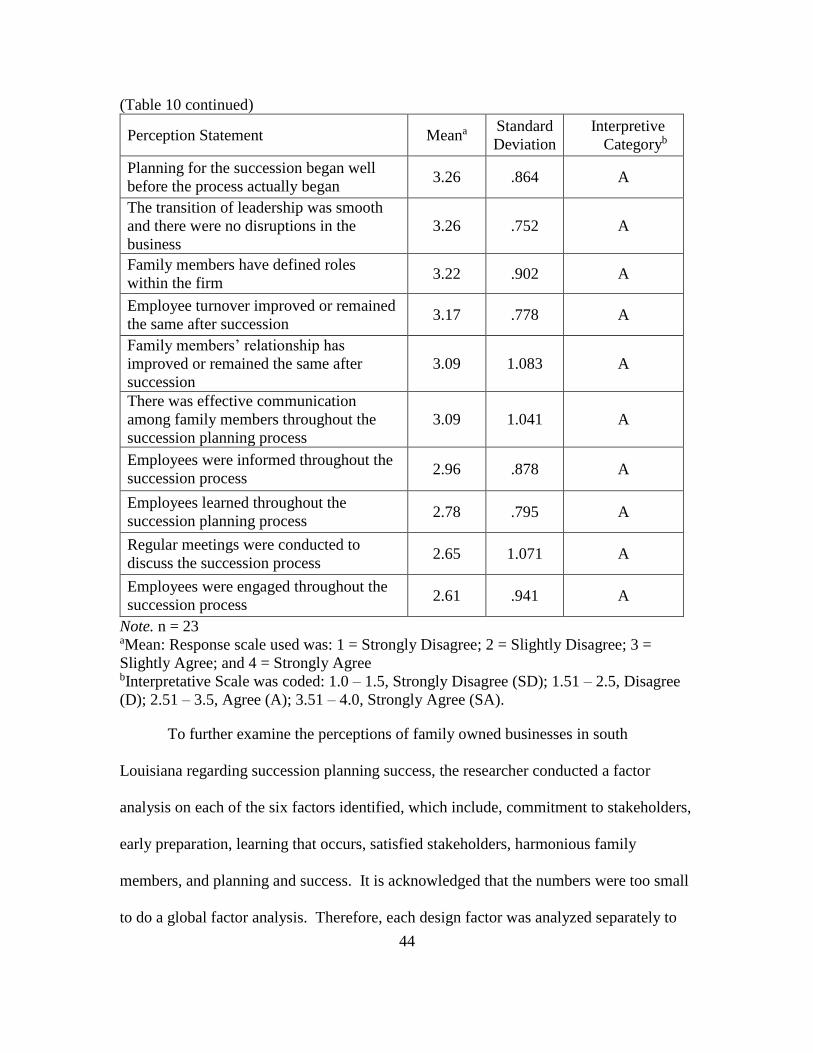
44
(Table 10 continued)
Perception Statement Meana Standard
Deviation
Interpretive
Categoryb
Planning for the succession began well
before the process actually began 3.26 .864 A
The transition of leadership was smooth
and there were no disruptions in the
business
3.26 .752 A
Family members have defined roles
within the firm 3.22 .902 A
Employee turnover improved or remained
the same after succession 3.17 .778 A
Family members’ relationship has
improved or remained the same after
succession
3.09 1.083 A
There was effective communication
among family members throughout the
succession planning process
3.09 1.041 A
Employees were informed throughout the
succession process 2.96 .878 A
Employees learned throughout the
succession planning process 2.78 .795 A
Regular meetings were conducted to
discuss the succession process 2.65 1.071 A
Employees were engaged throughout the
succession process 2.61 .941 A
Note. n = 23 aMean: Response scale used was: 1 = Strongly Disagree; 2 = Slightly Disagree; 3 =
Slightly Agree; and 4 = Strongly Agree bInterpretative Scale was coded: 1.0 – 1.5, Strongly Disagree (SD); 1.51 – 2.5, Disagree
(D); 2.51 – 3.5, Agree (A); 3.51 – 4.0, Strongly Agree (SA).
To further examine the perceptions of family owned businesses in south
Louisiana regarding succession planning success, the researcher conducted a factor
analysis on each of the six factors identified, which include, commitment to stakeholders,
early preparation, learning that occurs, satisfied stakeholders, harmonious family
members, and planning and success. It is acknowledged that the numbers were too small
to do a global factor analysis. Therefore, each design factor was analyzed separately to

45
determine if the items in that factor effectively grouped together. To do this, the
researcher entered the items in each factor into a factor analysis and forced the number of
factors to extract to one. The component factor loadings were then examined to
determine if all loadings met the criteria for satisfactory inclusion levels (≥.40) (Hair,
Black, Babin, & Anderson, 2006). These loadings for each factor are presented in Tables
11-16. All loadings on all factors exceeded .50; therefore, they met the criteria and the
items in each factor were judged to be appropriately grouped together.
Table 11 Perception of Commitment to Stakeholders as Reported by Family Owned
Businesses Located in South Louisiana
Perception Statement Loadings
Employees were informed throughout the succession process .897
Employees were engaged throughout the succession process .857
Leadership demonstrated commitment to a successful succession
through the succession process .775
Table 12 Perception of Early Preparation as Reported by Family Owned Businesses
Located in South Louisiana
Perception Statement Loadings
Planning for the succession began well before the process actually
began .901
Regular meetings were conducted to discuss the succession process .857
Planning for succession early is important to successful succession .577
Table 13 Perception of Learning that Occurs as Reported by Family Owned Businesses
Located in South Louisiana
Perception Statement Loadings
The successor learned throughout the succession planning process .878
The incumbent learned throughout the succession planning process .814
Employees learned throughout the succession planning process .641

46
Table 14 Perception of Satisfied Stakeholders as Reported by Family Owned Businesses
Located in South Louisiana
Perception Statement Loadings
The succession plan placed the needs of the organization at the forefront .960
Employee turnover improved or remained the same after succession .955
Vendor relationships improved or remained the same after succession .877
Customer relationships improved or remained the same after succession .841
Table 15 Perception of Harmonious Family Members as Reported by Family Owned
Businesses Located in South Louisiana
Perception Statement Loadings
Family members have defined roles within the firm .837
There was effective communication among family members throughout
the succession planning process .821
Family members’ relationship has improved or remained the same after
succession .715
Table 16 Perception of Planning and Success as Reported by Family Owned Businesses
Located in South Louisiana
Perception Statement Loadings
Planning had a positive effect on the overall succession process .929
The succession process at my company was successful .820
The transition of leadership was smooth and there were no disruptions
in the business .812
Based on these results, the researcher computed a factor score for each of the six
factors in succession planning. Each score is computed using the respondent’s level of
agreement as measured in the FOB Perception of Successful Succession Inventory
survey. Measurements were based on a 4-point Likert-type scale with the following
descriptors: Strongly Disagree = 1, Disagree = 2, Agree = 3, and Strongly Agree = 4.
The factor score analysis reported PAS Factor as the highest mean score (M = 3.40, SD =

47
.696). The factor with the lowest mean score was CTS Factor (M = 2.97, SD .758) (see
Table 17).
Table 17 Computed Factor Scores Based on Six Factors in Succession Planning
CTS
Factor
HFM
Factor
LTO
Factor EP Factor
SS
Factor
PAS
Factor
N 23 23 23 23 23 23
Mean 2.97 3.13 3.18 3.21 3.33 3.40
Std. Deviation .758 .802 .626 .671 .725 .696
Note. Computed factors: CTS = Commitment to Stakeholders; EP = Early Preparation;
LTO = Learning that Occurs; SS = Satisfied Stakeholders; HFM = Harmonious Family
Members; and PAS = Planning and Success
Objective Three Results
The third objective was to determine if a relationship exists between how family
owned business owners and managers in south Louisiana perceive selected aspects of
succession planning and the following variables:
a) Age of the family owned business based on number of years in business;
b) Incumbent’s educational level;
c) Successor’s educational level;
d) Number of employees on payroll ;
e) Type of business (retail, service, manufacturing, etc.);
f) Whether or not leadership prepared a quality succession plan;
g) Whether or not there was a positive revenue performance subsequent to
succession.
Age of the Family Owned Business Based on Number of Years in Business
The first step for this objective is to examine if a relationship exists between how
family business owners and managers in south Louisiana perceive selected aspects of
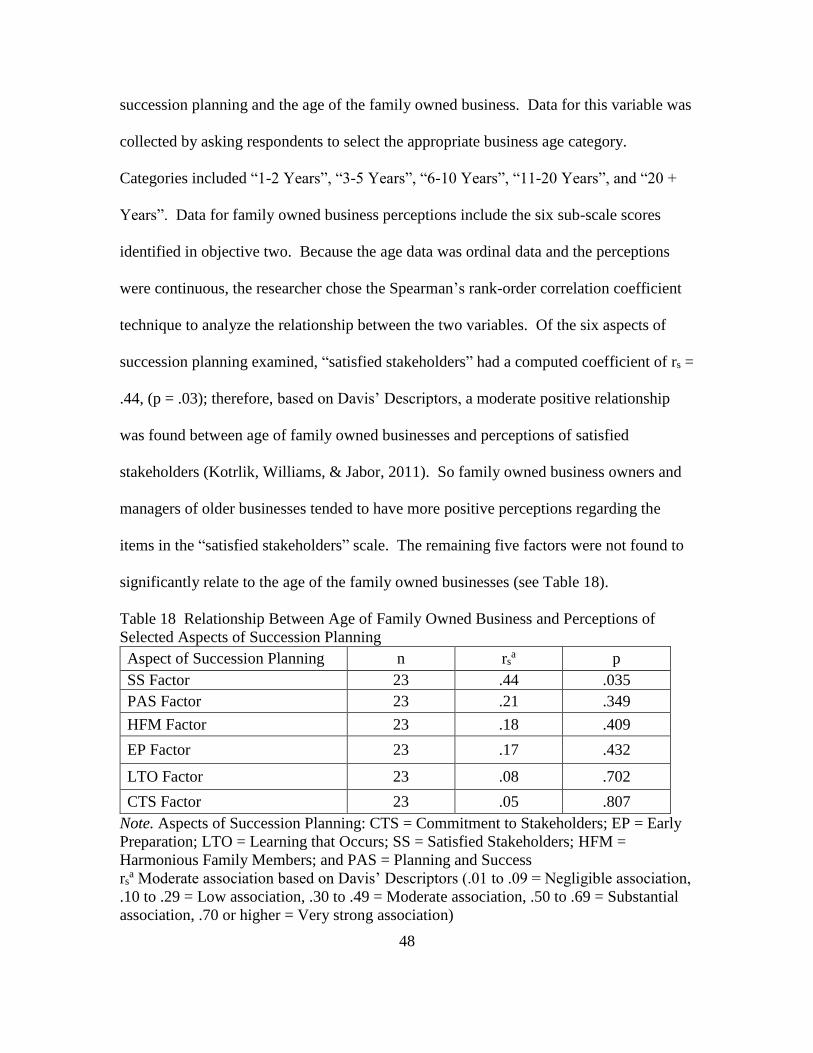
48
succession planning and the age of the family owned business. Data for this variable was
collected by asking respondents to select the appropriate business age category.
Categories included “1-2 Years”, “3-5 Years”, “6-10 Years”, “11-20 Years”, and “20 +
Years”. Data for family owned business perceptions include the six sub-scale scores
identified in objective two. Because the age data was ordinal data and the perceptions
were continuous, the researcher chose the Spearman’s rank-order correlation coefficient
technique to analyze the relationship between the two variables. Of the six aspects of
succession planning examined, “satisfied stakeholders” had a computed coefficient of rs =
.44, (p = .03); therefore, based on Davis’ Descriptors, a moderate positive relationship
was found between age of family owned businesses and perceptions of satisfied
stakeholders (Kotrlik, Williams, & Jabor, 2011). So family owned business owners and
managers of older businesses tended to have more positive perceptions regarding the
items in the “satisfied stakeholders” scale. The remaining five factors were not found to
significantly relate to the age of the family owned businesses (see Table 18).
Table 18 Relationship Between Age of Family Owned Business and Perceptions of
Selected Aspects of Succession Planning
Aspect of Succession Planning n rsa p
SS Factor 23 .44 .035
PAS Factor 23 .21 .349
HFM Factor 23 .18 .409
EP Factor 23 .17 .432
LTO Factor 23 .08 .702
CTS Factor 23 .05 .807
Note. Aspects of Succession Planning: CTS = Commitment to Stakeholders; EP = Early
Preparation; LTO = Learning that Occurs; SS = Satisfied Stakeholders; HFM =
Harmonious Family Members; and PAS = Planning and Success
rsa Moderate association based on Davis’ Descriptors (.01 to .09 = Negligible association,
.10 to .29 = Low association, .30 to .49 = Moderate association, .50 to .69 = Substantial
association, .70 or higher = Very strong association)
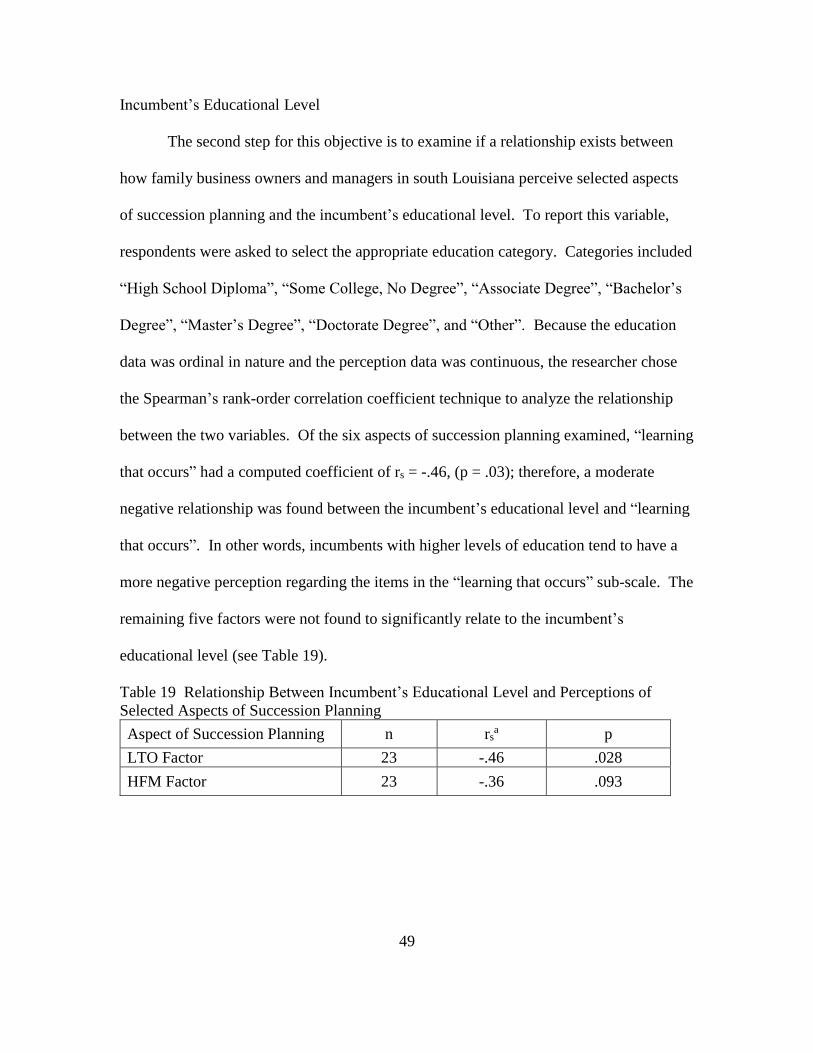
49
Incumbent’s Educational Level
The second step for this objective is to examine if a relationship exists between
how family business owners and managers in south Louisiana perceive selected aspects
of succession planning and the incumbent’s educational level. To report this variable,
respondents were asked to select the appropriate education category. Categories included
“High School Diploma”, “Some College, No Degree”, “Associate Degree”, “Bachelor’s
Degree”, “Master’s Degree”, “Doctorate Degree”, and “Other”. Because the education
data was ordinal in nature and the perception data was continuous, the researcher chose
the Spearman’s rank-order correlation coefficient technique to analyze the relationship
between the two variables. Of the six aspects of succession planning examined, “learning
that occurs” had a computed coefficient of rs = -.46, (p = .03); therefore, a moderate
negative relationship was found between the incumbent’s educational level and “learning
that occurs”. In other words, incumbents with higher levels of education tend to have a
more negative perception regarding the items in the “learning that occurs” sub-scale. The
remaining five factors were not found to significantly relate to the incumbent’s
educational level (see Table 19).
Table 19 Relationship Between Incumbent’s Educational Level and Perceptions of
Selected Aspects of Succession Planning
Aspect of Succession Planning n rsa p
LTO Factor 23 -.46 .028
HFM Factor 23 -.36 .093
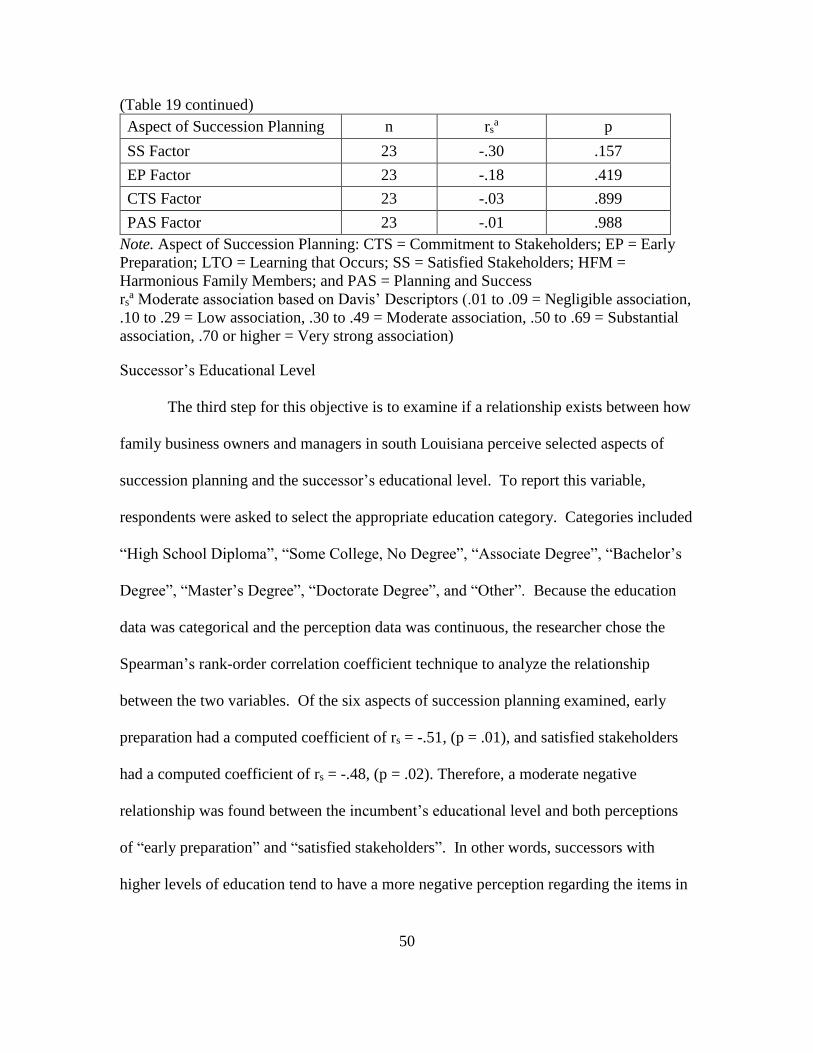
50
(Table 19 continued)
Aspect of Succession Planning n rsa p
SS Factor 23 -.30 .157
EP Factor 23 -.18 .419
CTS Factor 23 -.03 .899
PAS Factor 23 -.01 .988
Note. Aspect of Succession Planning: CTS = Commitment to Stakeholders; EP = Early
Preparation; LTO = Learning that Occurs; SS = Satisfied Stakeholders; HFM =
Harmonious Family Members; and PAS = Planning and Success
rsa Moderate association based on Davis’ Descriptors (.01 to .09 = Negligible association,
.10 to .29 = Low association, .30 to .49 = Moderate association, .50 to .69 = Substantial
association, .70 or higher = Very strong association)
Successor’s Educational Level
The third step for this objective is to examine if a relationship exists between how
family business owners and managers in south Louisiana perceive selected aspects of
succession planning and the successor’s educational level. To report this variable,
respondents were asked to select the appropriate education category. Categories included
“High School Diploma”, “Some College, No Degree”, “Associate Degree”, “Bachelor’s
Degree”, “Master’s Degree”, “Doctorate Degree”, and “Other”. Because the education
data was categorical and the perception data was continuous, the researcher chose the
Spearman’s rank-order correlation coefficient technique to analyze the relationship
between the two variables. Of the six aspects of succession planning examined, early
preparation had a computed coefficient of rs = -.51, (p = .01), and satisfied stakeholders
had a computed coefficient of rs = -.48, (p = .02). Therefore, a moderate negative
relationship was found between the incumbent’s educational level and both perceptions
of “early preparation” and “satisfied stakeholders”. In other words, successors with
higher levels of education tend to have a more negative perception regarding the items in
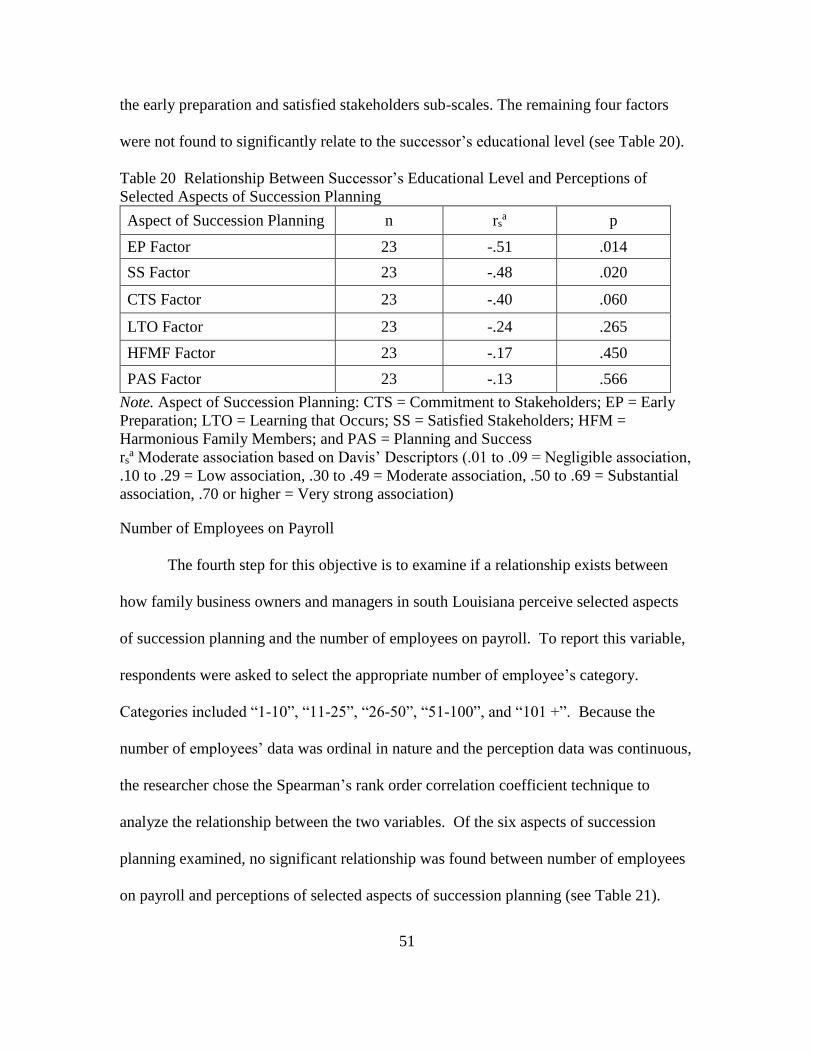
51
the early preparation and satisfied stakeholders sub-scales. The remaining four factors
were not found to significantly relate to the successor’s educational level (see Table 20).
Table 20 Relationship Between Successor’s Educational Level and Perceptions of
Selected Aspects of Succession Planning
Aspect of Succession Planning n rsa p
EP Factor 23 -.51 .014
SS Factor 23 -.48 .020
CTS Factor 23 -.40 .060
LTO Factor 23 -.24 .265
HFMF Factor 23 -.17 .450
PAS Factor 23 -.13 .566
Note. Aspect of Succession Planning: CTS = Commitment to Stakeholders; EP = Early
Preparation; LTO = Learning that Occurs; SS = Satisfied Stakeholders; HFM =
Harmonious Family Members; and PAS = Planning and Success
rsa Moderate association based on Davis’ Descriptors (.01 to .09 = Negligible association,
.10 to .29 = Low association, .30 to .49 = Moderate association, .50 to .69 = Substantial
association, .70 or higher = Very strong association)
Number of Employees on Payroll
The fourth step for this objective is to examine if a relationship exists between
how family business owners and managers in south Louisiana perceive selected aspects
of succession planning and the number of employees on payroll. To report this variable,
respondents were asked to select the appropriate number of employee’s category.
Categories included “1-10”, “11-25”, “26-50”, “51-100”, and “101 +”. Because the
number of employees’ data was ordinal in nature and the perception data was continuous,
the researcher chose the Spearman’s rank order correlation coefficient technique to
analyze the relationship between the two variables. Of the six aspects of succession
planning examined, no significant relationship was found between number of employees
on payroll and perceptions of selected aspects of succession planning (see Table 21).
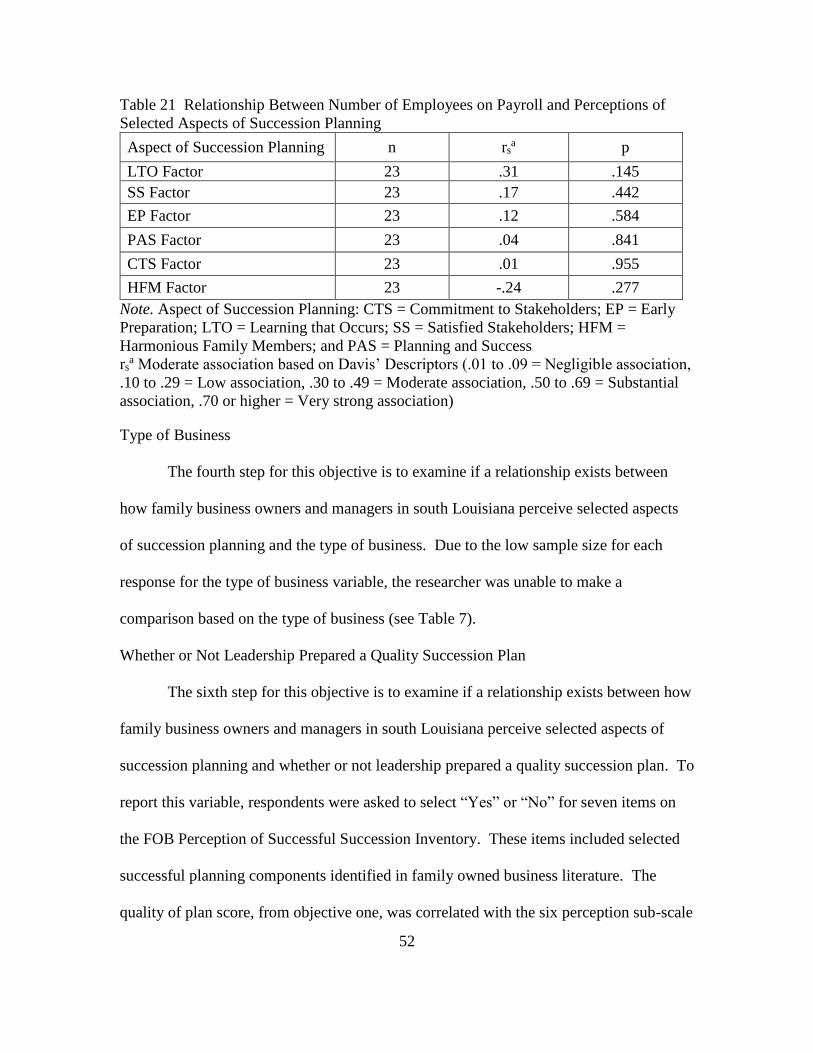
52
Table 21 Relationship Between Number of Employees on Payroll and Perceptions of
Selected Aspects of Succession Planning
Aspect of Succession Planning n rsa p
LTO Factor 23 .31 .145
SS Factor 23 .17 .442
EP Factor 23 .12 .584
PAS Factor 23 .04 .841
CTS Factor 23 .01 .955
HFM Factor 23 -.24 .277
Note. Aspect of Succession Planning: CTS = Commitment to Stakeholders; EP = Early
Preparation; LTO = Learning that Occurs; SS = Satisfied Stakeholders; HFM =
Harmonious Family Members; and PAS = Planning and Success
rsa Moderate association based on Davis’ Descriptors (.01 to .09 = Negligible association,
.10 to .29 = Low association, .30 to .49 = Moderate association, .50 to .69 = Substantial
association, .70 or higher = Very strong association)
Type of Business
The fourth step for this objective is to examine if a relationship exists between
how family business owners and managers in south Louisiana perceive selected aspects
of succession planning and the type of business. Due to the low sample size for each
response for the type of business variable, the researcher was unable to make a
comparison based on the type of business (see Table 7).
Whether or Not Leadership Prepared a Quality Succession Plan
The sixth step for this objective is to examine if a relationship exists between how
family business owners and managers in south Louisiana perceive selected aspects of
succession planning and whether or not leadership prepared a quality succession plan. To
report this variable, respondents were asked to select “Yes” or “No” for seven items on
the FOB Perception of Successful Succession Inventory. These items included selected
successful planning components identified in family owned business literature. The
quality of plan score, from objective one, was correlated with the six perception sub-scale

53
scores. Because both variables were continuous, the researcher chose to use the Pearson r
correlation coefficient method to analyze the relationship between the two variables. Of
the six aspects of succession planning examined, “early preparation” had a computed
coefficient of r = .54, (p = .01), “commitment to stakeholders” had a computed
coefficient of r = .50, (p = .01), and “harmonious family members” had a computed
coefficient of r = .50, (p = .02). Therefore, a moderate positive relationship was found
between whether or not leadership prepared a quality succession plan and perceptions of
early preparation, commitment to stakeholders, and harmonious family members. In
other words, family owned businesses that prepared a quality succession plan tend to
have a more positive perception regarding the items in the “early preparation”,
“commitment to stakeholders”, and “harmonious family members” sub-scales. The
remaining three factors were not found to significantly relate to whether or not leadership
prepared a quality succession plan (see Table 22).
Table 22 Relationship Between Quality of the Plan and Perceptions of Selected Aspects
of Succession Planning
Aspect of Succession Planning n ra p
EP Factor 23 .54 .008
CTS Factor 23 .50 .014
HFM Factor 23 .50 .016
PAS Factor 23 .41 .052
LTO Factor 23 .35 .107
SS Factor 23 .34 .118
Note. Aspect of Succession Planning: CTS = Commitment to Stakeholders; EP = Early
Preparation; LTO = Learning that Occurs; SS = Satisfied Stakeholders; HFM =
Harmonious Family Members; and PAS = Planning and Success
ra Moderate association based on Davis’ Descriptors (.01 to .09 = Negligible association,
.10 to .29 = Low association, .30 to .49 = Moderate association, .50 to .69 = Substantial
association, .70 or higher = Very strong association)
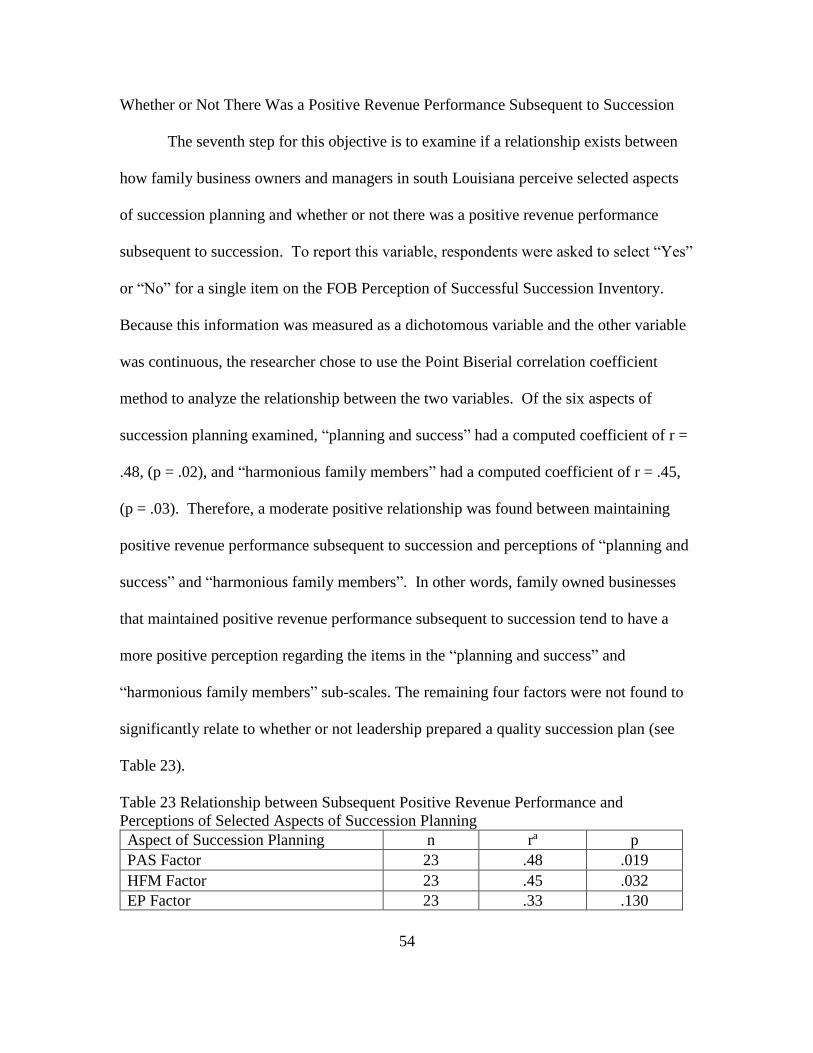
54
Whether or Not There Was a Positive Revenue Performance Subsequent to Succession
The seventh step for this objective is to examine if a relationship exists between
how family business owners and managers in south Louisiana perceive selected aspects
of succession planning and whether or not there was a positive revenue performance
subsequent to succession. To report this variable, respondents were asked to select “Yes”
or “No” for a single item on the FOB Perception of Successful Succession Inventory.
Because this information was measured as a dichotomous variable and the other variable
was continuous, the researcher chose to use the Point Biserial correlation coefficient
method to analyze the relationship between the two variables. Of the six aspects of
succession planning examined, “planning and success” had a computed coefficient of r =
.48, (p = .02), and “harmonious family members” had a computed coefficient of r = .45,
(p = .03). Therefore, a moderate positive relationship was found between maintaining
positive revenue performance subsequent to succession and perceptions of “planning and
success” and “harmonious family members”. In other words, family owned businesses
that maintained positive revenue performance subsequent to succession tend to have a
more positive perception regarding the items in the “planning and success” and
“harmonious family members” sub-scales. The remaining four factors were not found to
significantly relate to whether or not leadership prepared a quality succession plan (see
Table 23).
Table 23 Relationship between Subsequent Positive Revenue Performance and
Perceptions of Selected Aspects of Succession Planning
Aspect of Succession Planning n ra p
PAS Factor 23 .48 .019
HFM Factor 23 .45 .032
EP Factor 23 .33 .130
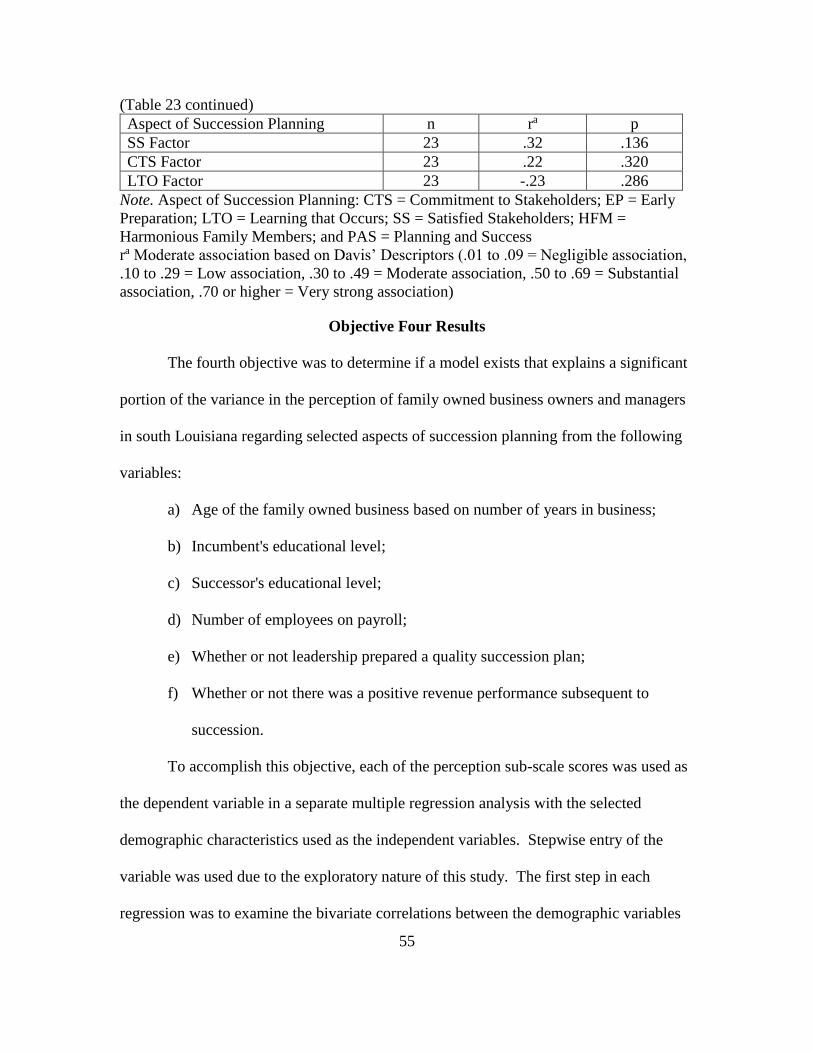
55
(Table 23 continued)
Aspect of Succession Planning n ra p
SS Factor 23 .32 .136
CTS Factor 23 .22 .320
LTO Factor 23 -.23 .286
Note. Aspect of Succession Planning: CTS = Commitment to Stakeholders; EP = Early
Preparation; LTO = Learning that Occurs; SS = Satisfied Stakeholders; HFM =
Harmonious Family Members; and PAS = Planning and Success
ra Moderate association based on Davis’ Descriptors (.01 to .09 = Negligible association,
.10 to .29 = Low association, .30 to .49 = Moderate association, .50 to .69 = Substantial
association, .70 or higher = Very strong association)
Objective Four Results
The fourth objective was to determine if a model exists that explains a significant
portion of the variance in the perception of family owned business owners and managers
in south Louisiana regarding selected aspects of succession planning from the following
variables:
a) Age of the family owned business based on number of years in business;
b) Incumbent's educational level;
c) Successor's educational level;
d) Number of employees on payroll;
e) Whether or not leadership prepared a quality succession plan;
f) Whether or not there was a positive revenue performance subsequent to
succession.
To accomplish this objective, each of the perception sub-scale scores was used as
the dependent variable in a separate multiple regression analysis with the selected
demographic characteristics used as the independent variables. Stepwise entry of the
variable was used due to the exploratory nature of this study. The first step in each
regression was to examine the bivariate correlations between the demographic variables
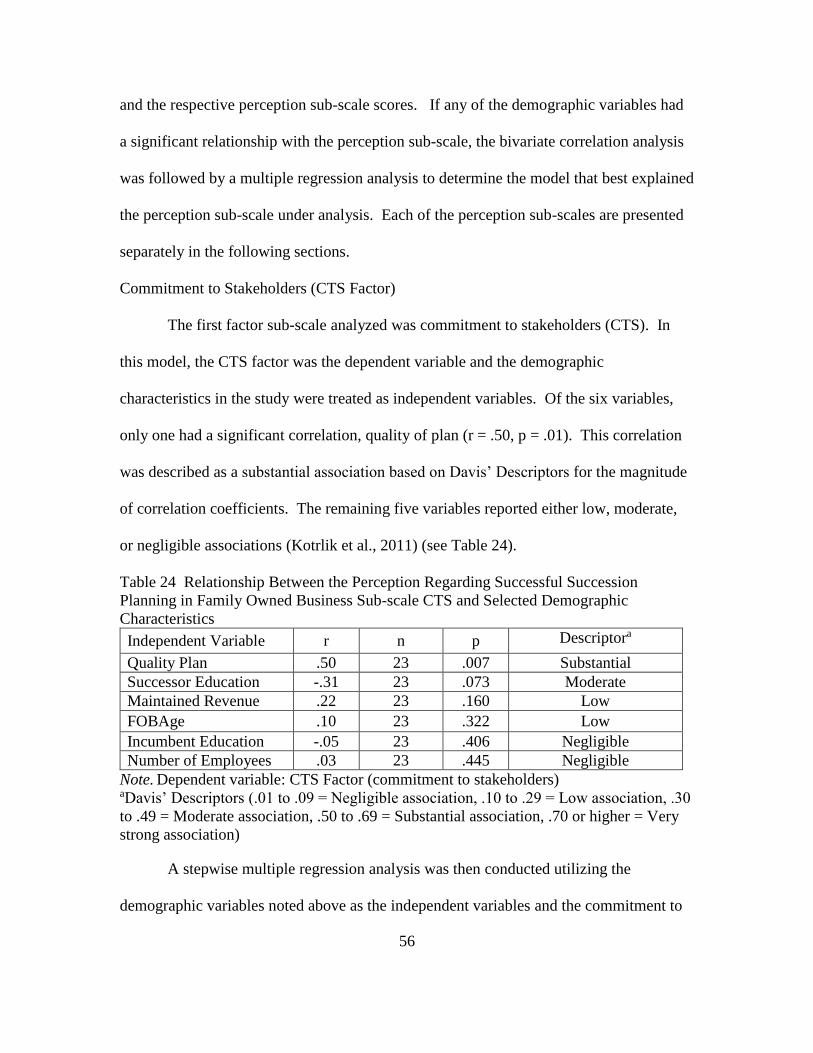
56
and the respective perception sub-scale scores. If any of the demographic variables had
a significant relationship with the perception sub-scale, the bivariate correlation analysis
was followed by a multiple regression analysis to determine the model that best explained
the perception sub-scale under analysis. Each of the perception sub-scales are presented
separately in the following sections.
Commitment to Stakeholders (CTS Factor)
The first factor sub-scale analyzed was commitment to stakeholders (CTS). In
this model, the CTS factor was the dependent variable and the demographic
characteristics in the study were treated as independent variables. Of the six variables,
only one had a significant correlation, quality of plan (r = .50, p = .01). This correlation
was described as a substantial association based on Davis’ Descriptors for the magnitude
of correlation coefficients. The remaining five variables reported either low, moderate,
or negligible associations (Kotrlik et al., 2011) (see Table 24).
Table 24 Relationship Between the Perception Regarding Successful Succession
Planning in Family Owned Business Sub-scale CTS and Selected Demographic
Characteristics
Independent Variable r n p Descriptora
Quality Plan .50 23 .007 Substantial
Successor Education -.31 23 .073 Moderate
Maintained Revenue .22 23 .160 Low
FOBAge .10 23 .322 Low
Incumbent Education -.05 23 .406 Negligible
Number of Employees .03 23 .445 Negligible
Note. Dependent variable: CTS Factor (commitment to stakeholders) aDavis’ Descriptors (.01 to .09 = Negligible association, .10 to .29 = Low association, .30
to .49 = Moderate association, .50 to .69 = Substantial association, .70 or higher = Very
strong association)
A stepwise multiple regression analysis was then conducted utilizing the
demographic variables noted above as the independent variables and the commitment to

57
stakeholders (CTS) as the dependent variable. The results of the regression analysis
showed that quality of plan was the only variable that entered the model explaining a
significant portion of the variance in the CTS sub-scale score F (1,21) = 7.13, p = .01.
The standardized beta coefficient was .50 for quality of plan, indicating that a higher
quality succession plan, tended to be associated with a higher CTS factor score. The
variable quality of plan explained 25% of the variance in the CTS sub-scale (see Table
25).
Table 25 ANOVA Summary Table and Model Summary for Stepwise Multiple
Regression Predicting Commitment to Stakeholder Scores from Demographic Factors
Model Sum of
Squares df Mean Square F Sig.
Regression 3.21 1 3.21 7.13 .014a
Residual 9.44 21 .45
Total 12.65 22
Model Summary
Model R R
Square
R Square
Change F Change df
Sig. F
Change
Standardized
Coefficient
Beta
Quality of
the Plan .50a .25 .25 7.13 1,21 .014 .50
Excluded Variables
Model t Sig.
Successor Education -.76 .458
Maintained Revenue .66 .514
Number of Employees -.45 .658
FOBAge -.45 .658
Incumbent Education .16 .877
Note. N =23, Dependent Variable: CTS Factor (commitment to stakeholders) aPredictors: Quality of the Plan
Early Planning (EP Factor)
The second factor sub-scale analyzed was early planning (EP). In this model, EP
factor was the dependent variable and the demographic characteristics in the study were
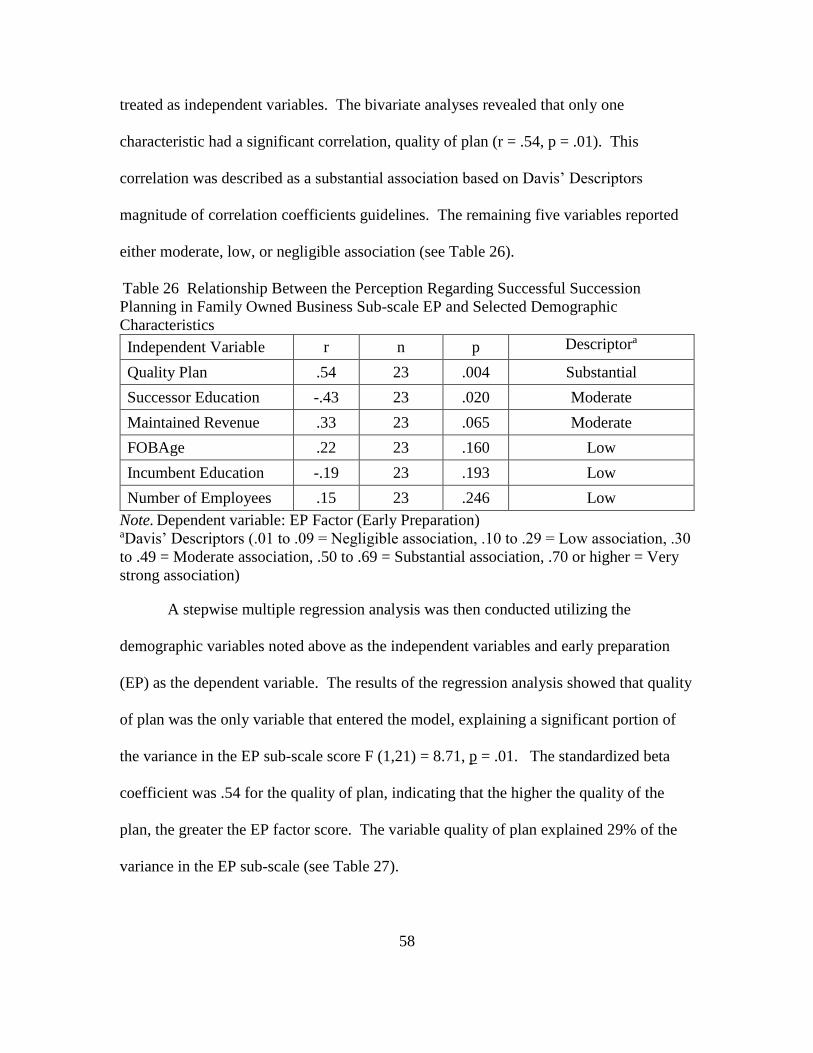
58
treated as independent variables. The bivariate analyses revealed that only one
characteristic had a significant correlation, quality of plan (r = .54, p = .01). This
correlation was described as a substantial association based on Davis’ Descriptors
magnitude of correlation coefficients guidelines. The remaining five variables reported
either moderate, low, or negligible association (see Table 26).
Table 26 Relationship Between the Perception Regarding Successful Succession
Planning in Family Owned Business Sub-scale EP and Selected Demographic
Characteristics
Independent Variable r n p Descriptora
Quality Plan .54 23 .004 Substantial
Successor Education -.43 23 .020 Moderate
Maintained Revenue .33 23 .065 Moderate
FOBAge .22 23 .160 Low
Incumbent Education -.19 23 .193 Low
Number of Employees .15 23 .246 Low
Note. Dependent variable: EP Factor (Early Preparation) aDavis’ Descriptors (.01 to .09 = Negligible association, .10 to .29 = Low association, .30
to .49 = Moderate association, .50 to .69 = Substantial association, .70 or higher = Very
strong association)
A stepwise multiple regression analysis was then conducted utilizing the
demographic variables noted above as the independent variables and early preparation
(EP) as the dependent variable. The results of the regression analysis showed that quality
of plan was the only variable that entered the model, explaining a significant portion of
the variance in the EP sub-scale score F (1,21) = 8.71, p = .01. The standardized beta
coefficient was .54 for the quality of plan, indicating that the higher the quality of the
plan, the greater the EP factor score. The variable quality of plan explained 29% of the
variance in the EP sub-scale (see Table 27).
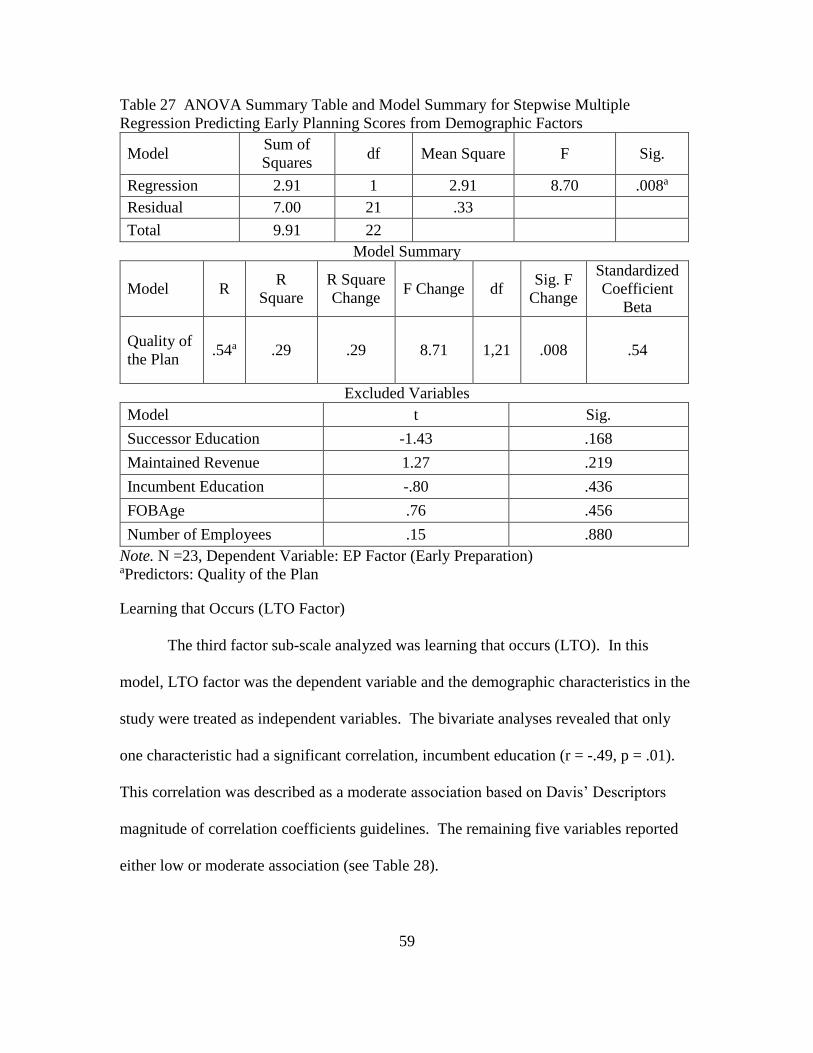
59
Table 27 ANOVA Summary Table and Model Summary for Stepwise Multiple
Regression Predicting Early Planning Scores from Demographic Factors
Model Sum of
Squares df Mean Square F Sig.
Regression 2.91 1 2.91 8.70 .008a
Residual 7.00 21 .33
Total 9.91 22
Model Summary
Model R R
Square
R Square
Change F Change df
Sig. F
Change
Standardized
Coefficient
Beta
Quality of
the Plan .54a .29 .29 8.71 1,21 .008 .54
Excluded Variables
Model t Sig.
Successor Education -1.43 .168
Maintained Revenue 1.27 .219
Incumbent Education -.80 .436
FOBAge .76 .456
Number of Employees .15 .880
Note. N =23, Dependent Variable: EP Factor (Early Preparation) aPredictors: Quality of the Plan
Learning that Occurs (LTO Factor)
The third factor sub-scale analyzed was learning that occurs (LTO). In this
model, LTO factor was the dependent variable and the demographic characteristics in the
study were treated as independent variables. The bivariate analyses revealed that only
one characteristic had a significant correlation, incumbent education (r = -.49, p = .01).
This correlation was described as a moderate association based on Davis’ Descriptors
magnitude of correlation coefficients guidelines. The remaining five variables reported
either low or moderate association (see Table 28).
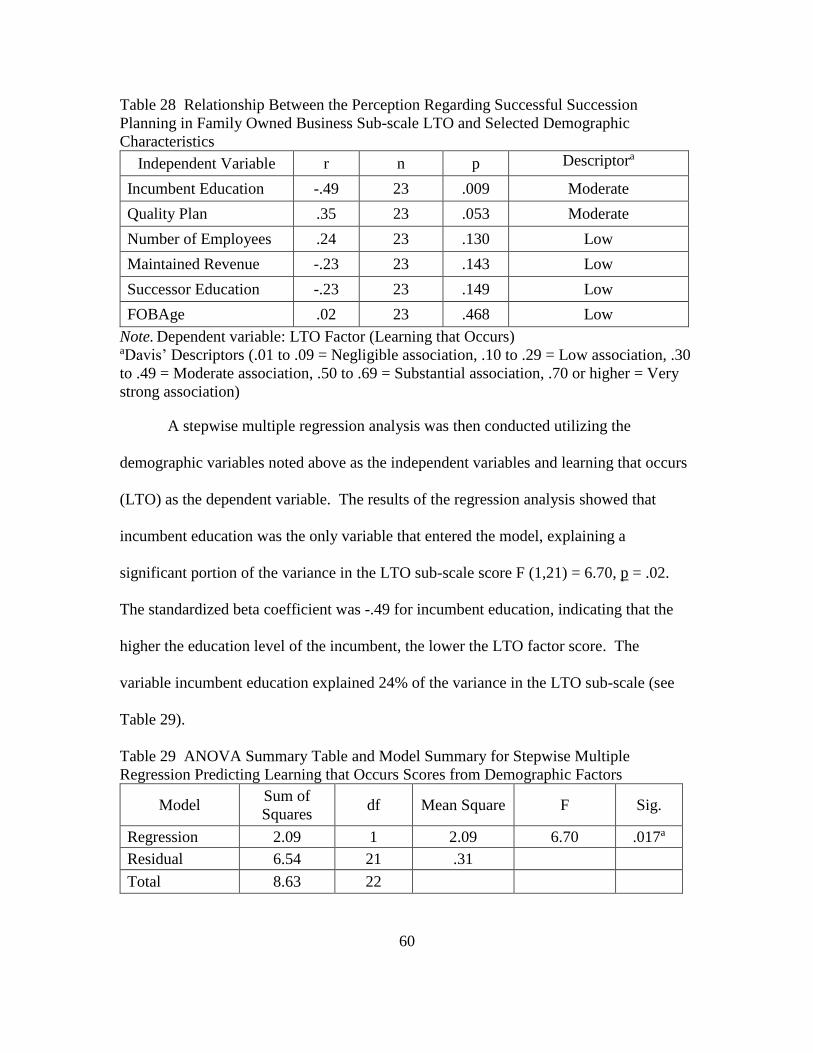
60
Table 28 Relationship Between the Perception Regarding Successful Succession
Planning in Family Owned Business Sub-scale LTO and Selected Demographic
Characteristics
Independent Variable r n p Descriptora
Incumbent Education -.49 23 .009 Moderate
Quality Plan .35 23 .053 Moderate
Number of Employees .24 23 .130 Low
Maintained Revenue -.23 23 .143 Low
Successor Education -.23 23 .149 Low
FOBAge .02 23 .468 Low
Note. Dependent variable: LTO Factor (Learning that Occurs) aDavis’ Descriptors (.01 to .09 = Negligible association, .10 to .29 = Low association, .30
to .49 = Moderate association, .50 to .69 = Substantial association, .70 or higher = Very
strong association)
A stepwise multiple regression analysis was then conducted utilizing the
demographic variables noted above as the independent variables and learning that occurs
(LTO) as the dependent variable. The results of the regression analysis showed that
incumbent education was the only variable that entered the model, explaining a
significant portion of the variance in the LTO sub-scale score F (1,21) = 6.70, p = .02.
The standardized beta coefficient was -.49 for incumbent education, indicating that the
higher the education level of the incumbent, the lower the LTO factor score. The
variable incumbent education explained 24% of the variance in the LTO sub-scale (see
Table 29).
Table 29 ANOVA Summary Table and Model Summary for Stepwise Multiple
Regression Predicting Learning that Occurs Scores from Demographic Factors
Model Sum of
Squares df Mean Square F Sig.
Regression 2.09 1 2.09 6.70 .017a
Residual 6.54 21 .31
Total 8.63 22
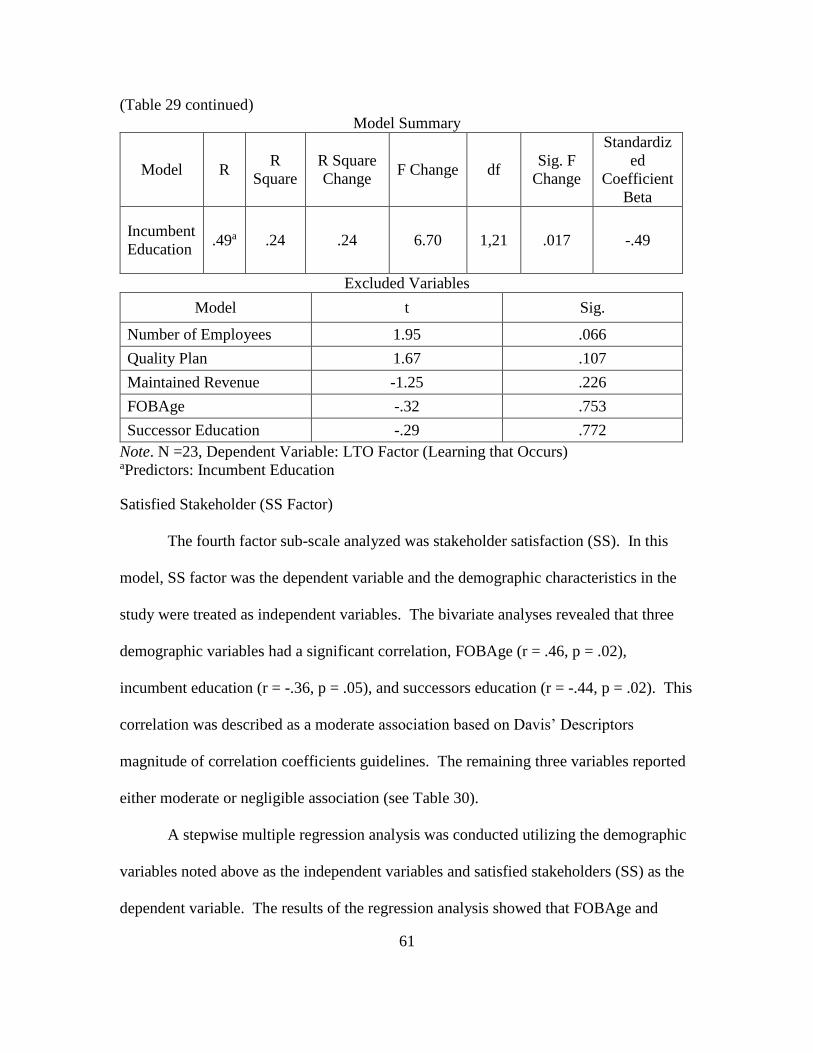
61
(Table 29 continued)
Model Summary
Model R R
Square
R Square
Change F Change df
Sig. F
Change
Standardiz
ed
Coefficient
Beta
Incumbent
Education .49a .24 .24 6.70 1,21 .017 -.49
Excluded Variables
Model t Sig.
Number of Employees 1.95 .066
Quality Plan 1.67 .107
Maintained Revenue -1.25 .226
FOBAge -.32 .753
Successor Education -.29 .772
Note. N =23, Dependent Variable: LTO Factor (Learning that Occurs) aPredictors: Incumbent Education
Satisfied Stakeholder (SS Factor)
The fourth factor sub-scale analyzed was stakeholder satisfaction (SS). In this
model, SS factor was the dependent variable and the demographic characteristics in the
study were treated as independent variables. The bivariate analyses revealed that three
demographic variables had a significant correlation, FOBAge (r = .46, p = .02),
incumbent education (r = -.36, p = .05), and successors education (r = -.44, p = .02). This
correlation was described as a moderate association based on Davis’ Descriptors
magnitude of correlation coefficients guidelines. The remaining three variables reported
either moderate or negligible association (see Table 30).
A stepwise multiple regression analysis was conducted utilizing the demographic
variables noted above as the independent variables and satisfied stakeholders (SS) as the
dependent variable. The results of the regression analysis showed that FOBAge and
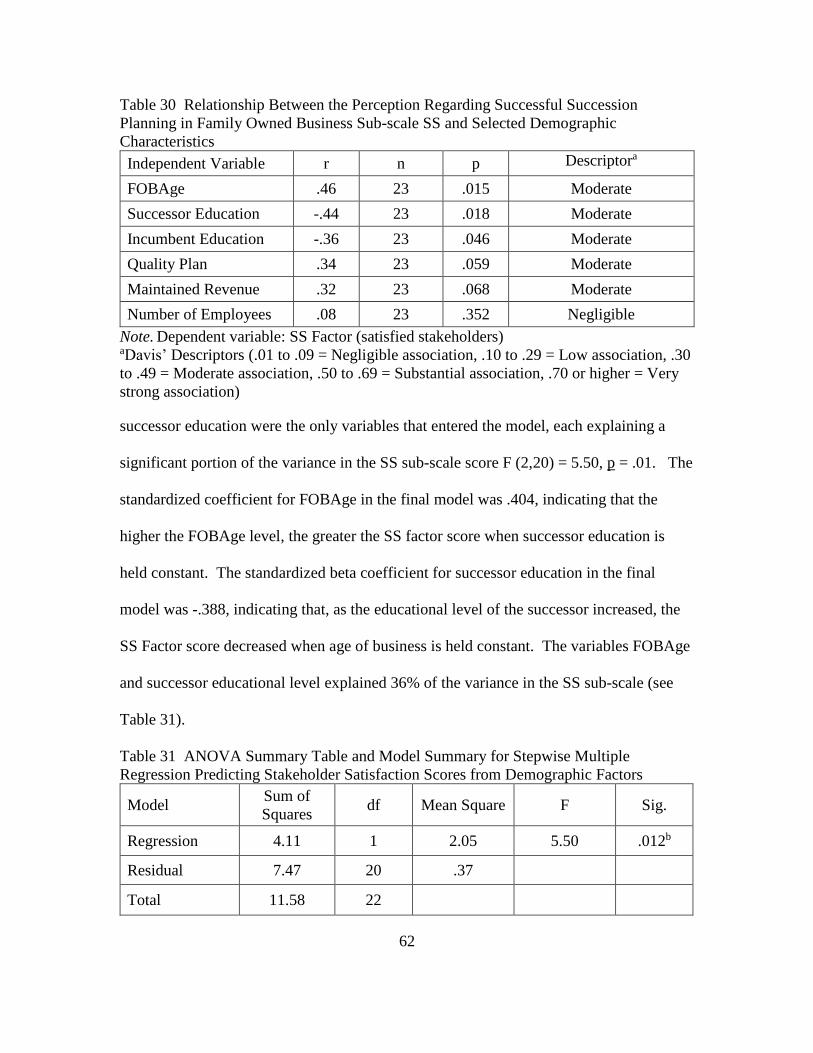
62
Table 30 Relationship Between the Perception Regarding Successful Succession
Planning in Family Owned Business Sub-scale SS and Selected Demographic
Characteristics
Independent Variable r n p Descriptora
FOBAge .46 23 .015 Moderate
Successor Education -.44 23 .018 Moderate
Incumbent Education -.36 23 .046 Moderate
Quality Plan .34 23 .059 Moderate
Maintained Revenue .32 23 .068 Moderate
Number of Employees .08 23 .352 Negligible
Note. Dependent variable: SS Factor (satisfied stakeholders) aDavis’ Descriptors (.01 to .09 = Negligible association, .10 to .29 = Low association, .30
to .49 = Moderate association, .50 to .69 = Substantial association, .70 or higher = Very
strong association)
successor education were the only variables that entered the model, each explaining a
significant portion of the variance in the SS sub-scale score F (2,20) = 5.50, p = .01. The
standardized coefficient for FOBAge in the final model was .404, indicating that the
higher the FOBAge level, the greater the SS factor score when successor education is
held constant. The standardized beta coefficient for successor education in the final
model was -.388, indicating that, as the educational level of the successor increased, the
SS Factor score decreased when age of business is held constant. The variables FOBAge
and successor educational level explained 36% of the variance in the SS sub-scale (see
Table 31).
Table 31 ANOVA Summary Table and Model Summary for Stepwise Multiple
Regression Predicting Stakeholder Satisfaction Scores from Demographic Factors
Model Sum of
Squares df Mean Square F Sig.
Regression 4.11 1 2.05 5.50 .012b
Residual 7.47 20 .37
Total 11.58 22

63
(Table 31 continued)
Model Summary
Model R R
Square
R Square
Change F Change df
Sig. F
Change
Standardized
Coefficient
Beta
FOBAge .46 a .21 .21 5.47 1,21 .029 .45
Successor
Education .60b .36 .29 4.60 1,21 .045 -.39
Excluded Variables
Model t Sig.
Maintained Revenue 1.29 .213
Incumbent Education -1.12 .276
Quality of Plan .83 .417
Number of Employees -.35 .734
Note. N =23, Dependent Variable: SS Factor (satisfied stakeholders) aPredictors: FOBAge bPredictors: FOBAge, Successor Education
Harmonious Family Members (HFM Factor)
The fifth factor sub-scale analyzed was harmonious family members (HFM). In
this model, HFM factor was the dependent variable and the demographic characteristics
in the study were treated as independent variables. The bivariate analyses revealed that
two variables had a significant correlation, quality of plan (r = .50, p = .01) and
maintained revenue (r = .45, p = .02). The quality of plan correlation was described as a
substantial association based on Davis’ Descriptors magnitude of correlation coefficients
guidelines. The remaining five variables reported either low or moderate association (see
Table 32).
A stepwise multiple regression analysis was then conducted utilizing the
demographic variables noted above as the independent variables and harmonious family

64
Table 32 Relationship Between the Perception Regarding Successful Succession
Planning in Family Owned Business Sub-scale HFM and Selected Demographic
Characteristics
Independent Variable r n p Descriptora
Quality Plan .50 23 .008 Substantial
Maintained Revenue .45 23 .016 Moderate
Incumbent Education -.30 23 .086 Moderate
FOBAge .21 23 .170 Low
Number of Employees -.21 23 .172 Low
Successor Education -.15 23 .245 Low
Note. Dependent variable: HFM Factor (Harmonious Family Members) aDavis’ Descriptors (.01 to .09 = Negligible association, .10 to .29 = Low association, .30
to .49 = Moderate association, .50 to .69 = Substantial association, .70 or higher = Very
strong association)
members (HFM) as the dependent variable. The results of the regression analysis showed
that quality of plan was the only variable that entered the model, explaining a significant
portion of the variance in the HFM sub-scale score F (1,21) = 6.85, p = .02. The
standardized beta coefficient was .50 for the independent variable, indicating that the
higher the quality of plan, the greater the HFM factor. The variable quality of plan
explained 25% of the variance in the HMF sub-scale (see Table 33).
Table 33 ANOVA Summary Table and Model Summary for Stepwise Multiple
Regression Predicting Harmonious Family Members Score from Demographic Factors
Model Sum of
Squares df Mean Square F Sig.
Regression 3.48 1 3.48 6.85 .016a
Residual 10.68 21 .51
Total 14.16 22
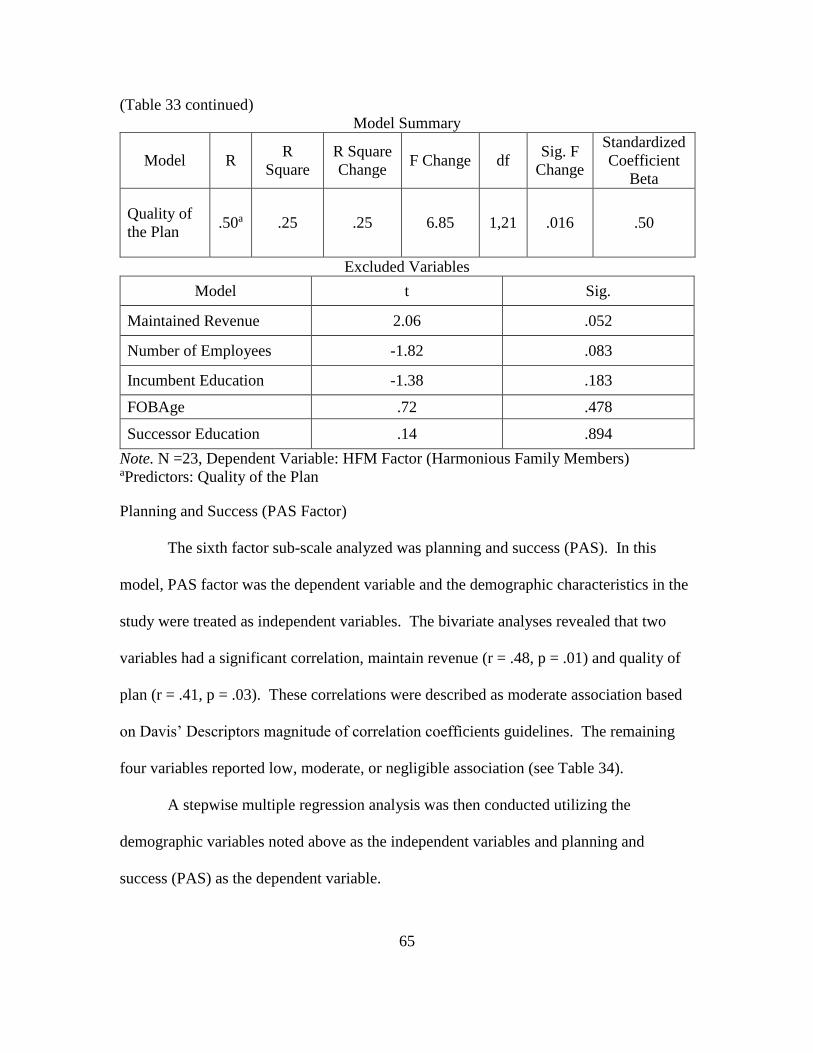
65
(Table 33 continued)
Model Summary
Model R R
Square
R Square
Change F Change df
Sig. F
Change
Standardized
Coefficient
Beta
Quality of
the Plan .50a .25 .25 6.85 1,21 .016 .50
Excluded Variables
Model t Sig.
Maintained Revenue 2.06 .052
Number of Employees -1.82 .083
Incumbent Education -1.38 .183
FOBAge .72 .478
Successor Education .14 .894
Note. N =23, Dependent Variable: HFM Factor (Harmonious Family Members) aPredictors: Quality of the Plan
Planning and Success (PAS Factor)
The sixth factor sub-scale analyzed was planning and success (PAS). In this
model, PAS factor was the dependent variable and the demographic characteristics in the
study were treated as independent variables. The bivariate analyses revealed that two
variables had a significant correlation, maintain revenue (r = .48, p = .01) and quality of
plan (r = .41, p = .03). These correlations were described as moderate association based
on Davis’ Descriptors magnitude of correlation coefficients guidelines. The remaining
four variables reported low, moderate, or negligible association (see Table 34).
A stepwise multiple regression analysis was then conducted utilizing the
demographic variables noted above as the independent variables and planning and
success (PAS) as the dependent variable.

66
Table 34 Relationship Between the Perception Regarding Successful Succession
Planning in Family Owned Business Sub-scale PAS and Selected Demographic
Characteristics
Independent Variable r n p Descriptora
Maintained Revenue .48 23 .010 Moderate
Quality Plan .41 23 .026 Moderate
FOBAge .26 23 .115 Low
Successor Education -.16 23 .315 Low
Incumbent Education -.13 23 .280 Low
Number of Employees -.05 23 .414 Negligible
Note. Dependent variable: PAS Factor (Planning and Success) aDavis’ Descriptors (.01 to .09 = Negligible association, .10 to .29 = Low association, .30
to .49 = Moderate association, .50 to .69 = Substantial association, .70 or higher = Very
strong association)
The results of the regression analysis showed that maintained revenue was the only
variable that entered the model, explaining a significant portion of the variance in the
PAS sub-scale score F (1,21) = 6.42, p = .02. The standardized beta coefficient was .484
for maintained revenue, indicating that if revenue was maintained or increased, the
greater the PAS factor score. The variable maintained revenue explained 23% of the
variance in the PAS sub-scale (see Table 35).
Table 35 ANOVA Summary Table and Model Summary for Stepwise Multiple
Regression Predicting Planning and Success Scores from Demographic Factors
Model Sum of
Squares df Mean Square F Sig.
Regression 2.50 1 2.50 6.42 .019a
Residual 8.16 21 .39
Total 10.66 22
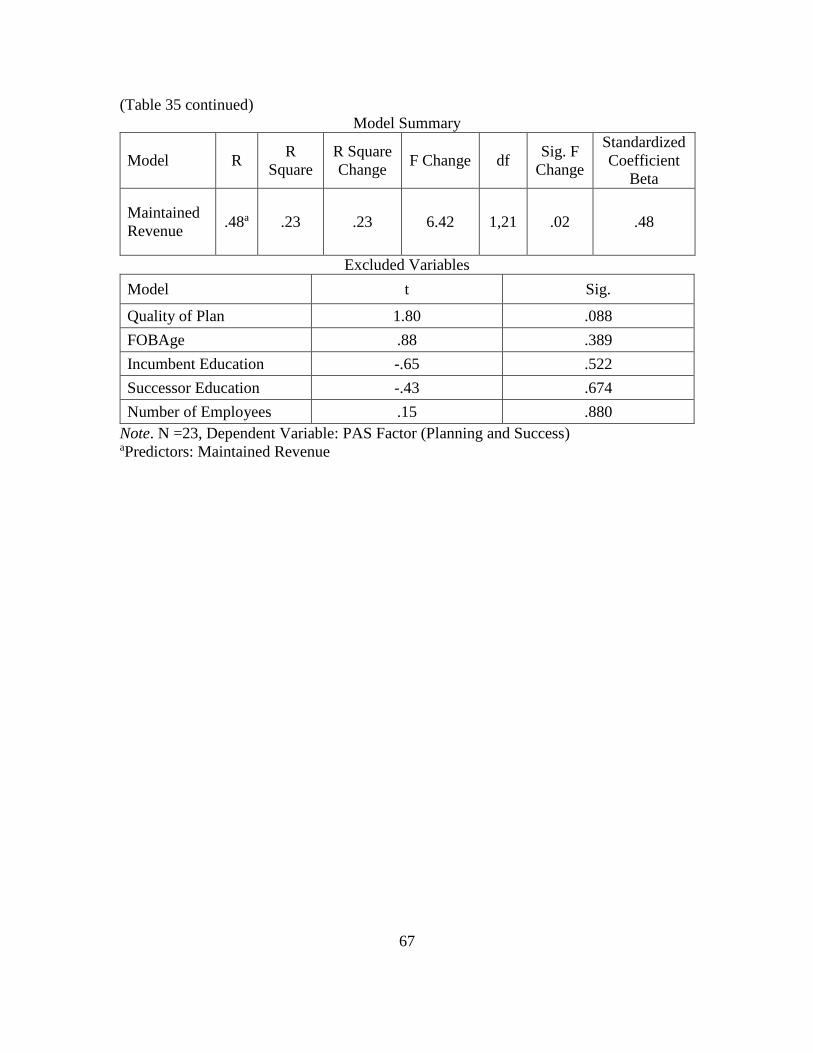
67
(Table 35 continued)
Model Summary
Model R R
Square
R Square
Change F Change df
Sig. F
Change
Standardized
Coefficient
Beta
Maintained
Revenue .48a .23 .23 6.42 1,21 .02 .48
Excluded Variables
Model t Sig.
Quality of Plan 1.80 .088
FOBAge .88 .389
Incumbent Education -.65 .522
Successor Education -.43 .674
Number of Employees .15 .880
Note. N =23, Dependent Variable: PAS Factor (Planning and Success) aPredictors: Maintained Revenue
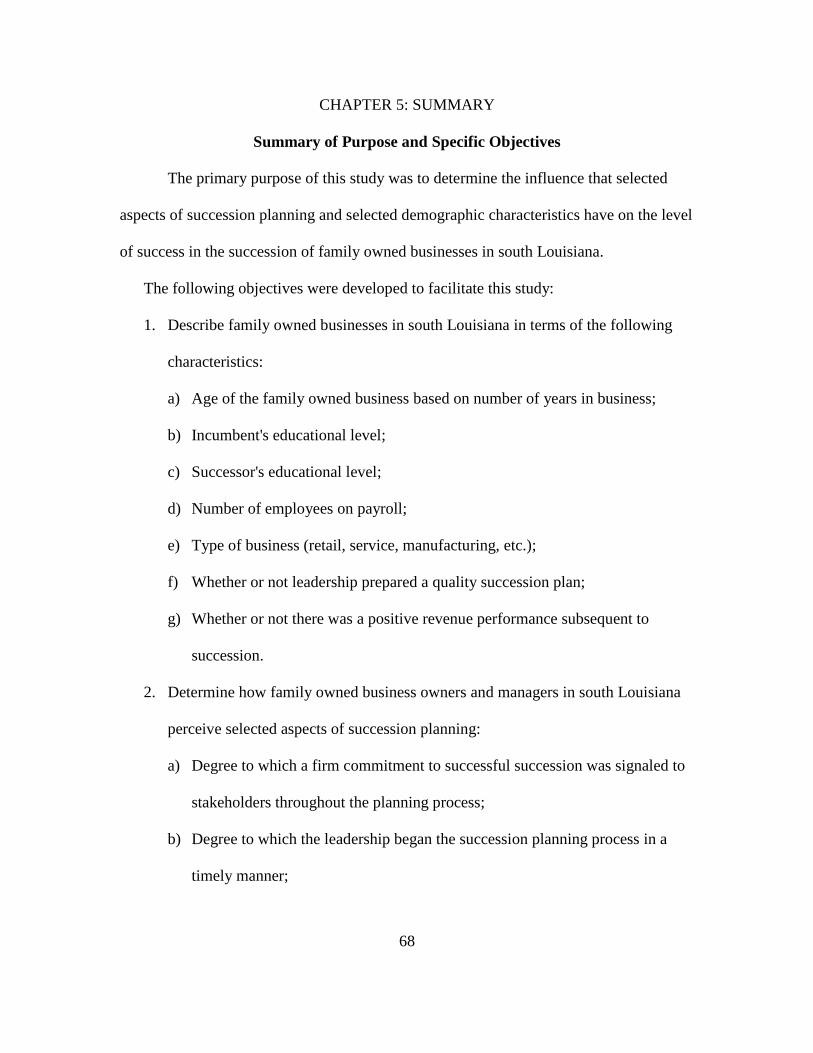
68
CHAPTER 5: SUMMARY
Summary of Purpose and Specific Objectives
The primary purpose of this study was to determine the influence that selected
aspects of succession planning and selected demographic characteristics have on the level
of success in the succession of family owned businesses in south Louisiana.
The following objectives were developed to facilitate this study:
1. Describe family owned businesses in south Louisiana in terms of the following
characteristics:
a) Age of the family owned business based on number of years in business;
b) Incumbent's educational level;
c) Successor's educational level;
d) Number of employees on payroll;
e) Type of business (retail, service, manufacturing, etc.);
f) Whether or not leadership prepared a quality succession plan;
g) Whether or not there was a positive revenue performance subsequent to
succession.
2. Determine how family owned business owners and managers in south Louisiana
perceive selected aspects of succession planning:
a) Degree to which a firm commitment to successful succession was signaled to
stakeholders throughout the planning process;
b) Degree to which the leadership began the succession planning process in a
timely manner;

69
c) Degree to which the incumbent and successor learned throughout the planning
process;
d) Degree to which stakeholders were satisfied with the succession process;
e) Degree to which family members were harmonious during and after the
succession process;
f) Degree to which planning contributed to a successful transition.
3. Determine if a relationship exists between how family owned business owners
and managers in south Louisiana perceive selected aspects of succession planning
and the following variables:
a) Age of the family owned business based on number of years in business;
b) Incumbent’s educational level;
c) Successor’s educational level;
d) Number of employees on payroll;
e) Type of business (retail, service, manufacturing, etc.);
f) Whether or not leadership prepared a quality succession plan;
g) Whether or not there was a positive revenue performance subsequent to
succession.
4. Determine if a model exists that explains a significant portion of the variance in
the perception of family owned business owners and managers in south Louisiana
regarding selected aspects of succession planning from the following variables:
a) Age of the family owned business based on number of years in business;
b) Incumbent's educational level;
c) Successor's educational level;
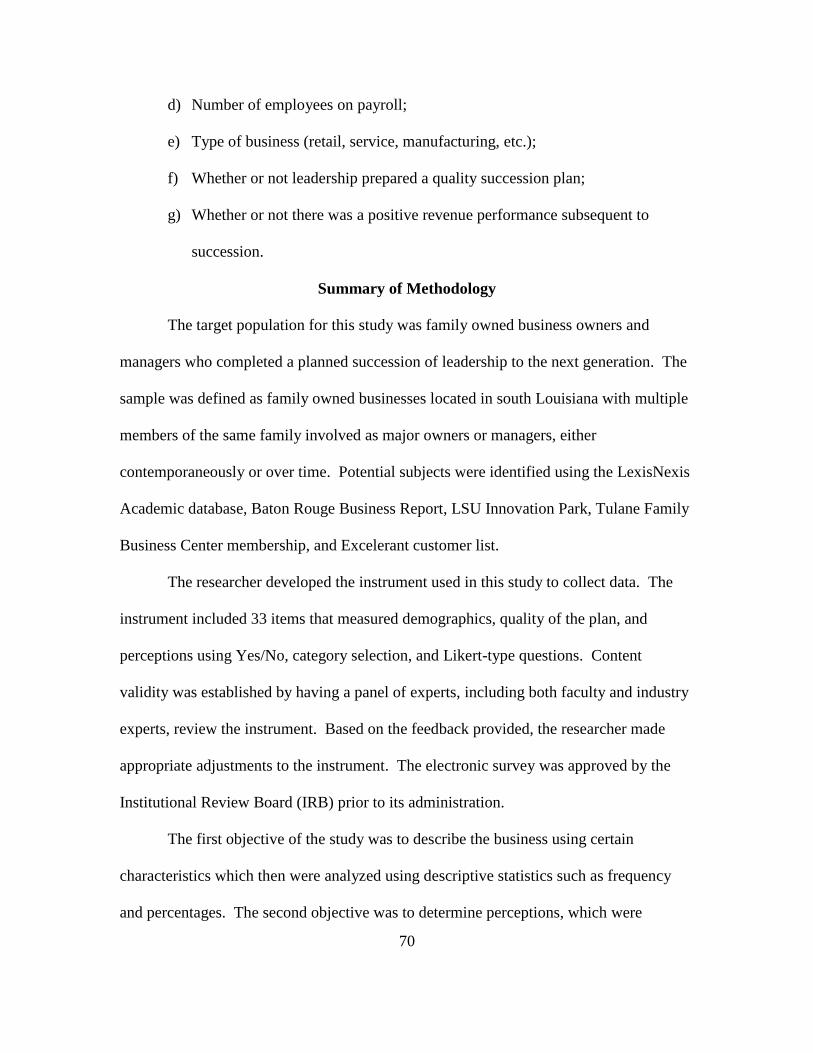
70
d) Number of employees on payroll;
e) Type of business (retail, service, manufacturing, etc.);
f) Whether or not leadership prepared a quality succession plan;
g) Whether or not there was a positive revenue performance subsequent to
succession.
Summary of Methodology
The target population for this study was family owned business owners and
managers who completed a planned succession of leadership to the next generation. The
sample was defined as family owned businesses located in south Louisiana with multiple
members of the same family involved as major owners or managers, either
contemporaneously or over time. Potential subjects were identified using the LexisNexis
Academic database, Baton Rouge Business Report, LSU Innovation Park, Tulane Family
Business Center membership, and Excelerant customer list.
The researcher developed the instrument used in this study to collect data. The
instrument included 33 items that measured demographics, quality of the plan, and
perceptions using Yes/No, category selection, and Likert-type questions. Content
validity was established by having a panel of experts, including both faculty and industry
experts, review the instrument. Based on the feedback provided, the researcher made
appropriate adjustments to the instrument. The electronic survey was approved by the
Institutional Review Board (IRB) prior to its administration.
The first objective of the study was to describe the business using certain
characteristics which then were analyzed using descriptive statistics such as frequency
and percentages. The second objective was to determine perceptions, which were
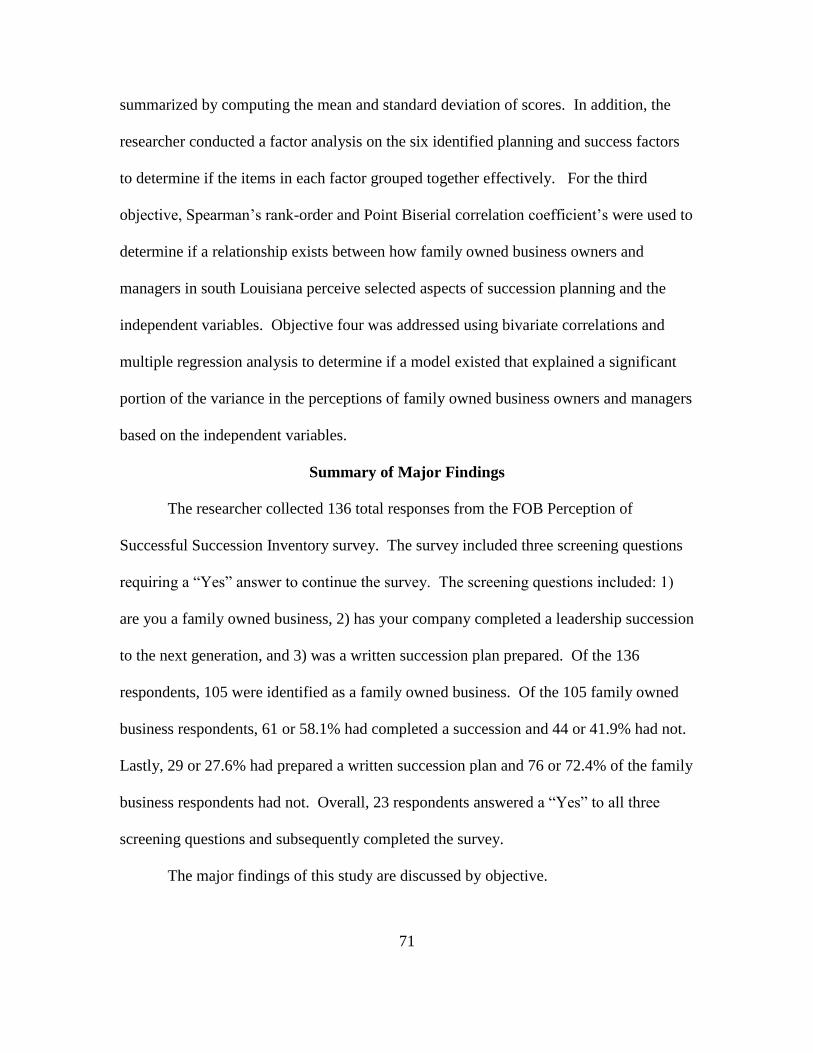
71
summarized by computing the mean and standard deviation of scores. In addition, the
researcher conducted a factor analysis on the six identified planning and success factors
to determine if the items in each factor grouped together effectively. For the third
objective, Spearman’s rank-order and Point Biserial correlation coefficient’s were used to
determine if a relationship exists between how family owned business owners and
managers in south Louisiana perceive selected aspects of succession planning and the
independent variables. Objective four was addressed using bivariate correlations and
multiple regression analysis to determine if a model existed that explained a significant
portion of the variance in the perceptions of family owned business owners and managers
based on the independent variables.
Summary of Major Findings
The researcher collected 136 total responses from the FOB Perception of
Successful Succession Inventory survey. The survey included three screening questions
requiring a “Yes” answer to continue the survey. The screening questions included: 1)
are you a family owned business, 2) has your company completed a leadership succession
to the next generation, and 3) was a written succession plan prepared. Of the 136
respondents, 105 were identified as a family owned business. Of the 105 family owned
business respondents, 61 or 58.1% had completed a succession and 44 or 41.9% had not.
Lastly, 29 or 27.6% had prepared a written succession plan and 76 or 72.4% of the family
business respondents had not. Overall, 23 respondents answered a “Yes” to all three
screening questions and subsequently completed the survey.
The major findings of this study are discussed by objective.

72
Objective One
To meet the first objective, respondents were asked to describe their family
owned businesses in south Louisiana using the following characteristics:
a) Age of the family owned business based on number of years in business;
b) Incumbent's educational level;
c) Successor's educational level;
d) Number of employees on payroll;
e) Type of business (retail, service, manufacturing, etc.);
f) Whether or not leadership prepared a quality succession plan;
g) Whether or not there was a positive revenue performance subsequent to
succession.
Of the 23 family owned business owners and managers who responded, the
majority indicated that the age of business was 20 + years (n = 17, 73.9%). The second
largest group (n = 4, 17.4%) indicated a business age of 11-20 years. The business age
categories of 1-2 years and 3-5 years received zero responses, while the 6-10 year
category received two.
The largest group of respondents (n = 9, 39.1%) bachelor’s degree as the
incumbent’s education category, while the second largest group (n = 7, 30.4%) had
earned a high school diploma. Only one participant (4.3%) reported a degree beyond a
bachelor’s degree.
With respect to the successor’s educational, the largest group of respondents (n =
13, 56.5%) had earned a bachelor’s degree, and the second largest group (n = 4, 17.4%)
had earned a master’s degree.
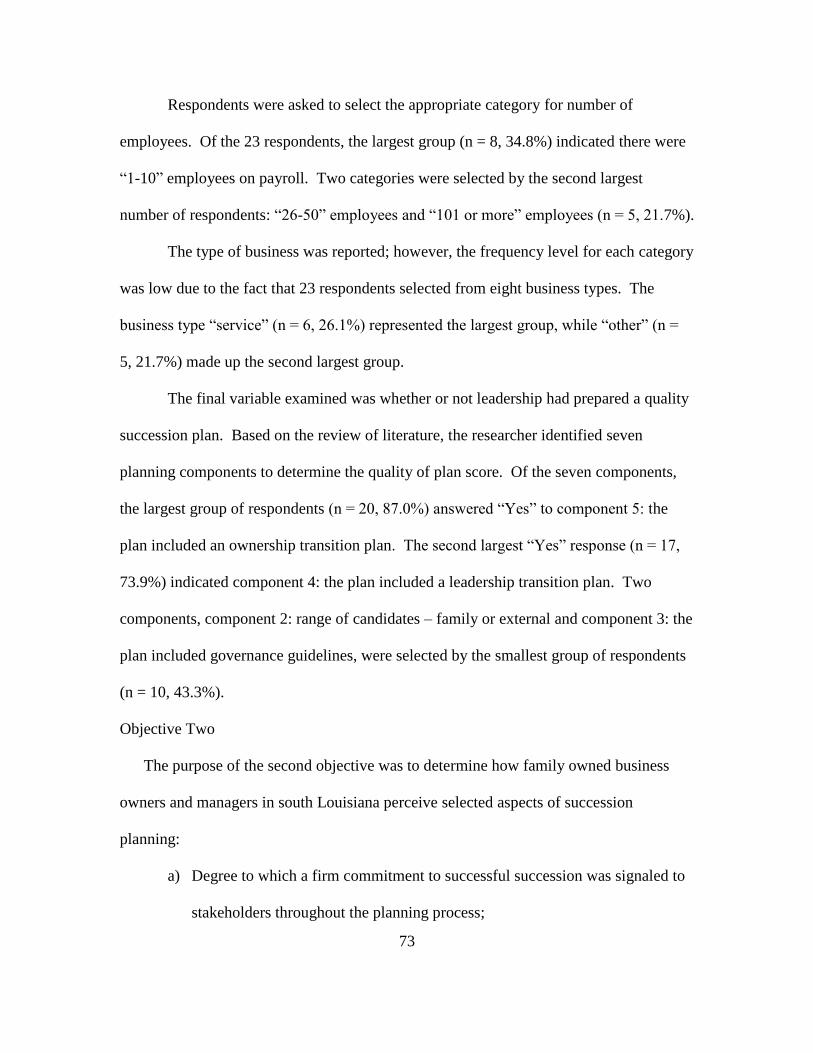
73
Respondents were asked to select the appropriate category for number of
employees. Of the 23 respondents, the largest group (n = 8, 34.8%) indicated there were
“1-10” employees on payroll. Two categories were selected by the second largest
number of respondents: “26-50” employees and “101 or more” employees (n = 5, 21.7%).
The type of business was reported; however, the frequency level for each category
was low due to the fact that 23 respondents selected from eight business types. The
business type “service” (n = 6, 26.1%) represented the largest group, while “other” (n =
5, 21.7%) made up the second largest group.
The final variable examined was whether or not leadership had prepared a quality
succession plan. Based on the review of literature, the researcher identified seven
planning components to determine the quality of plan score. Of the seven components,
the largest group of respondents (n = 20, 87.0%) answered “Yes” to component 5: the
plan included an ownership transition plan. The second largest “Yes” response (n = 17,
73.9%) indicated component 4: the plan included a leadership transition plan. Two
components, component 2: range of candidates – family or external and component 3: the
plan included governance guidelines, were selected by the smallest group of respondents
(n = 10, 43.3%).
Objective Two
The purpose of the second objective was to determine how family owned business
owners and managers in south Louisiana perceive selected aspects of succession
planning:
a) Degree to which a firm commitment to successful succession was signaled to
stakeholders throughout the planning process;
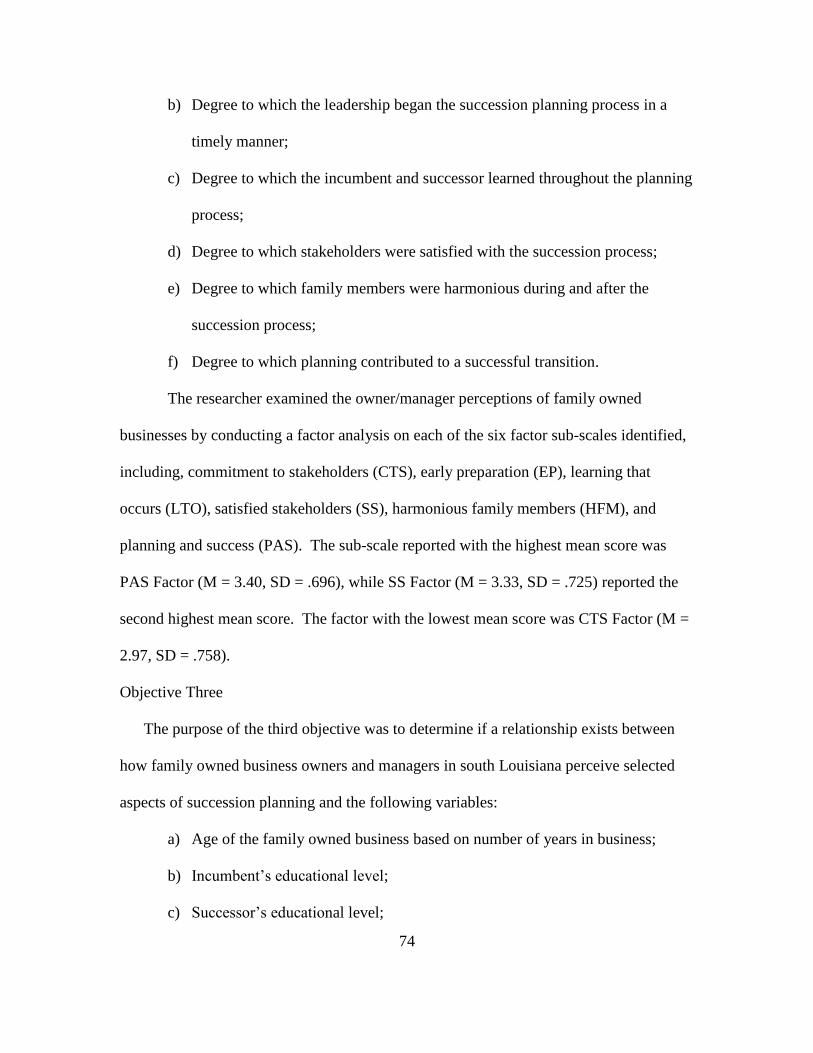
74
b) Degree to which the leadership began the succession planning process in a
timely manner;
c) Degree to which the incumbent and successor learned throughout the planning
process;
d) Degree to which stakeholders were satisfied with the succession process;
e) Degree to which family members were harmonious during and after the
succession process;
f) Degree to which planning contributed to a successful transition.
The researcher examined the owner/manager perceptions of family owned
businesses by conducting a factor analysis on each of the six factor sub-scales identified,
including, commitment to stakeholders (CTS), early preparation (EP), learning that
occurs (LTO), satisfied stakeholders (SS), harmonious family members (HFM), and
planning and success (PAS). The sub-scale reported with the highest mean score was
PAS Factor (M = 3.40, SD = .696), while SS Factor (M = 3.33, SD = .725) reported the
second highest mean score. The factor with the lowest mean score was CTS Factor (M =
2.97, SD = .758).
Objective Three
The purpose of the third objective was to determine if a relationship exists between
how family owned business owners and managers in south Louisiana perceive selected
aspects of succession planning and the following variables:
a) Age of the family owned business based on number of years in business;
b) Incumbent’s educational level;
c) Successor’s educational level;
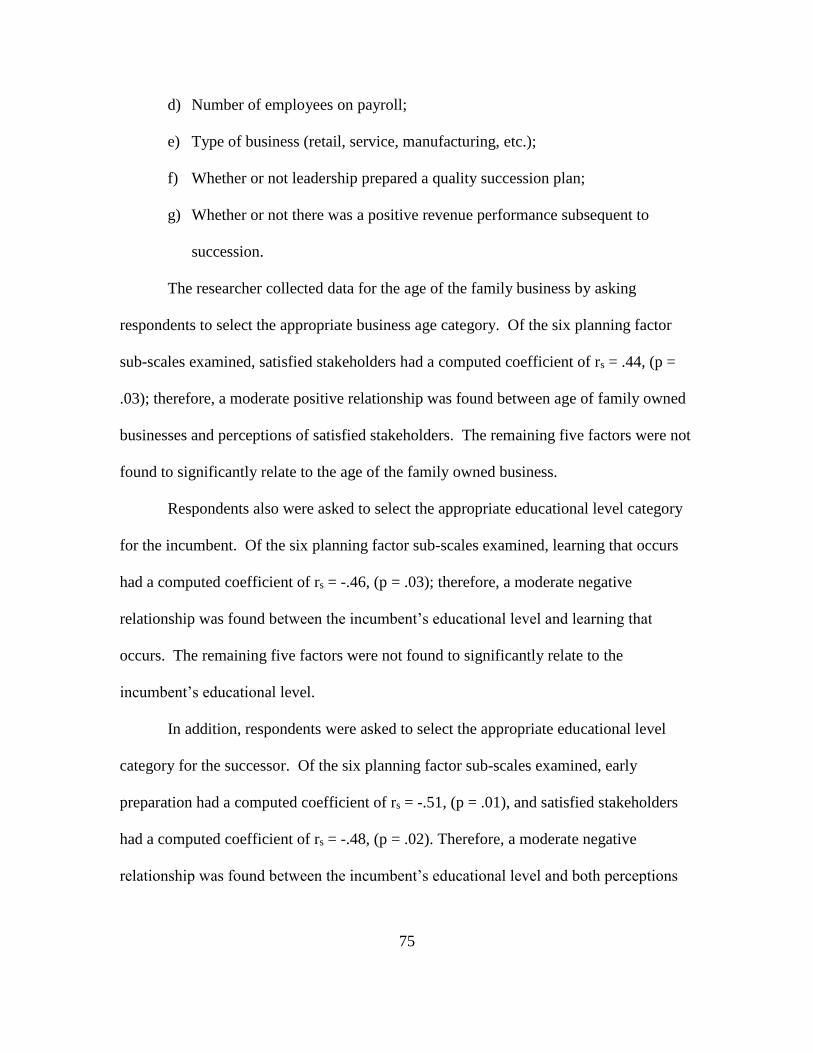
75
d) Number of employees on payroll;
e) Type of business (retail, service, manufacturing, etc.);
f) Whether or not leadership prepared a quality succession plan;
g) Whether or not there was a positive revenue performance subsequent to
succession.
The researcher collected data for the age of the family business by asking
respondents to select the appropriate business age category. Of the six planning factor
sub-scales examined, satisfied stakeholders had a computed coefficient of rs = .44, (p =
.03); therefore, a moderate positive relationship was found between age of family owned
businesses and perceptions of satisfied stakeholders. The remaining five factors were not
found to significantly relate to the age of the family owned business.
Respondents also were asked to select the appropriate educational level category
for the incumbent. Of the six planning factor sub-scales examined, learning that occurs
had a computed coefficient of rs = -.46, (p = .03); therefore, a moderate negative
relationship was found between the incumbent’s educational level and learning that
occurs. The remaining five factors were not found to significantly relate to the
incumbent’s educational level.
In addition, respondents were asked to select the appropriate educational level
category for the successor. Of the six planning factor sub-scales examined, early
preparation had a computed coefficient of rs = -.51, (p = .01), and satisfied stakeholders
had a computed coefficient of rs = -.48, (p = .02). Therefore, a moderate negative
relationship was found between the incumbent’s educational level and both perceptions

76
of early preparation and satisfied stakeholders. The remaining four factors were not
found to significantly relate to the successor’s educational level.
To report on the number of employees, respondents were asked to select the
category that best represents the number of employees on payroll. Due to the low sample
size for each response to the type of business variable, the researcher was unable to make
a comparison based on type of business.
To determine whether or not leadership had prepared a quality succession plan,
respondents were asked to select “Yes” or “No” for seven items on the FOB Perception
of Successful Succession Inventory. Of the six planning factor sub-scales examined,
early preparation had a computed coefficient of r = .54, (p = .01), commitment to
stakeholders had a computed coefficient of r = .50, (p = .01), and harmonious family
members had a computed coefficient of r = .50, (p = .02). Therefore, a moderate positive
relationship was found between whether or not leadership had prepared a quality
succession plan and perceptions of early preparation, commitment to stakeholders, and
harmonious family members. The remaining three factors were not found to significantly
relate to whether or not leadership had prepared a quality succession plan.
The final variable examined for this objective was whether or not there was a
positive revenue performance subsequent to succession. Respondents were asked to
select “Yes” or “No” for a single item on the FOB Perception of Successful Succession
Inventory. Of the six planning factor sub-scales examined, planning and success had a
computed coefficient of r = .48, (p = .02), and harmonious family members had a
computed coefficient of r = .45, (p = .03). Therefore, a moderate positive relationship
was found between maintaining positive revenue performance subsequent to succession

77
and perceptions of planning and success, and harmonious family members. The
remaining four factors were not found to significantly relate to whether or not leadership
had prepared a quality succession plan
Objective Four
The aim of the fourth objective was to determine if a model exists that explains a
significant portion of the variance in the perception of family owned business owners and
managers in south Louisiana regarding selected aspects of succession planning from the
following variables:
a) Age of the family owned business based on number of years in business;
b) Incumbent's educational level;
c) Successor's educational level;
d) Number of employees on payroll;
e) Whether or not leadership prepared a quality succession plan;
f) Whether or not there was a positive revenue performance subsequent to
succession.
The first factor sub-scale analyzed was commitment to stakeholders (CTS). Of
the six variables, only one had a significant correlation, quality of plan (r = .50, p = .01).
This correlation was described as a substantial association based on Davis’ Descriptors
for the magnitude of correlation coefficients. The remaining five variables reported low,
moderate, or negligible associations.
A stepwise multiple regression analysis was then conducted. The results of the
regression analysis showed that quality of plan was the only variable that entered the
model explaining a significant portion of the variance in the CTS sub-scale score F (1,21)
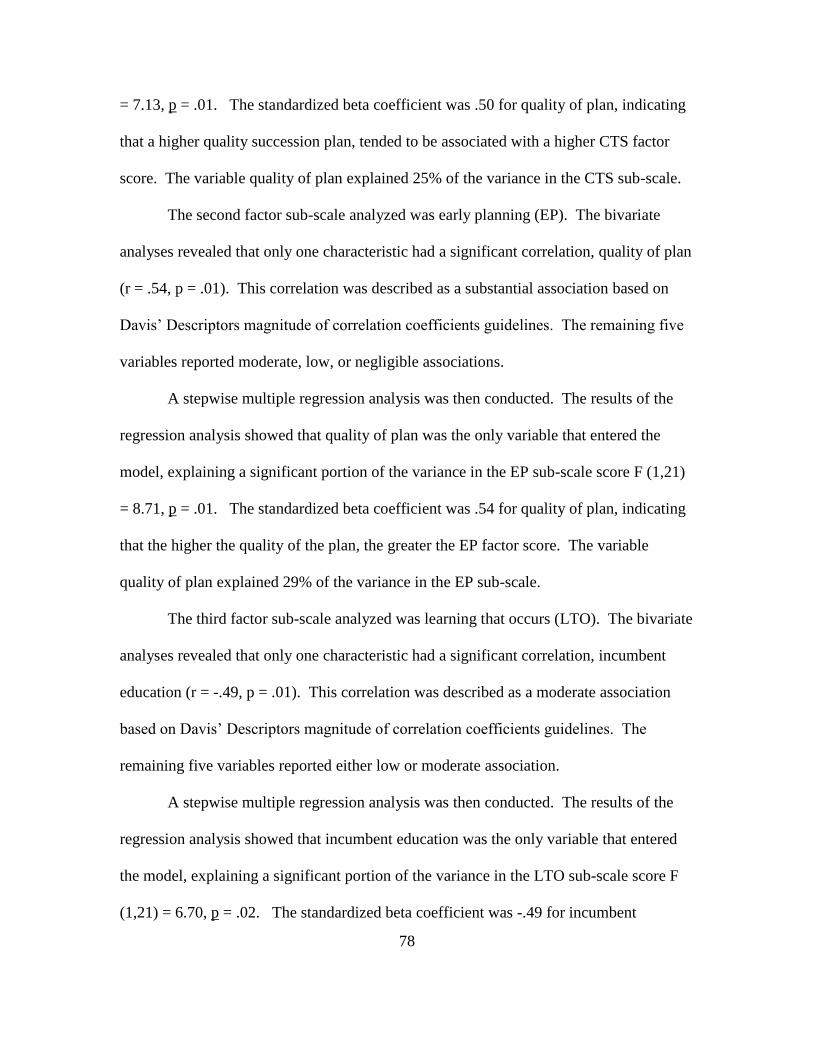
78
= 7.13, p = .01. The standardized beta coefficient was .50 for quality of plan, indicating
that a higher quality succession plan, tended to be associated with a higher CTS factor
score. The variable quality of plan explained 25% of the variance in the CTS sub-scale.
The second factor sub-scale analyzed was early planning (EP). The bivariate
analyses revealed that only one characteristic had a significant correlation, quality of plan
(r = .54, p = .01). This correlation was described as a substantial association based on
Davis’ Descriptors magnitude of correlation coefficients guidelines. The remaining five
variables reported moderate, low, or negligible associations.
A stepwise multiple regression analysis was then conducted. The results of the
regression analysis showed that quality of plan was the only variable that entered the
model, explaining a significant portion of the variance in the EP sub-scale score F (1,21)
= 8.71, p = .01. The standardized beta coefficient was .54 for quality of plan, indicating
that the higher the quality of the plan, the greater the EP factor score. The variable
quality of plan explained 29% of the variance in the EP sub-scale.
The third factor sub-scale analyzed was learning that occurs (LTO). The bivariate
analyses revealed that only one characteristic had a significant correlation, incumbent
education (r = -.49, p = .01). This correlation was described as a moderate association
based on Davis’ Descriptors magnitude of correlation coefficients guidelines. The
remaining five variables reported either low or moderate association.
A stepwise multiple regression analysis was then conducted. The results of the
regression analysis showed that incumbent education was the only variable that entered
the model, explaining a significant portion of the variance in the LTO sub-scale score F
(1,21) = 6.70, p = .02. The standardized beta coefficient was -.49 for incumbent
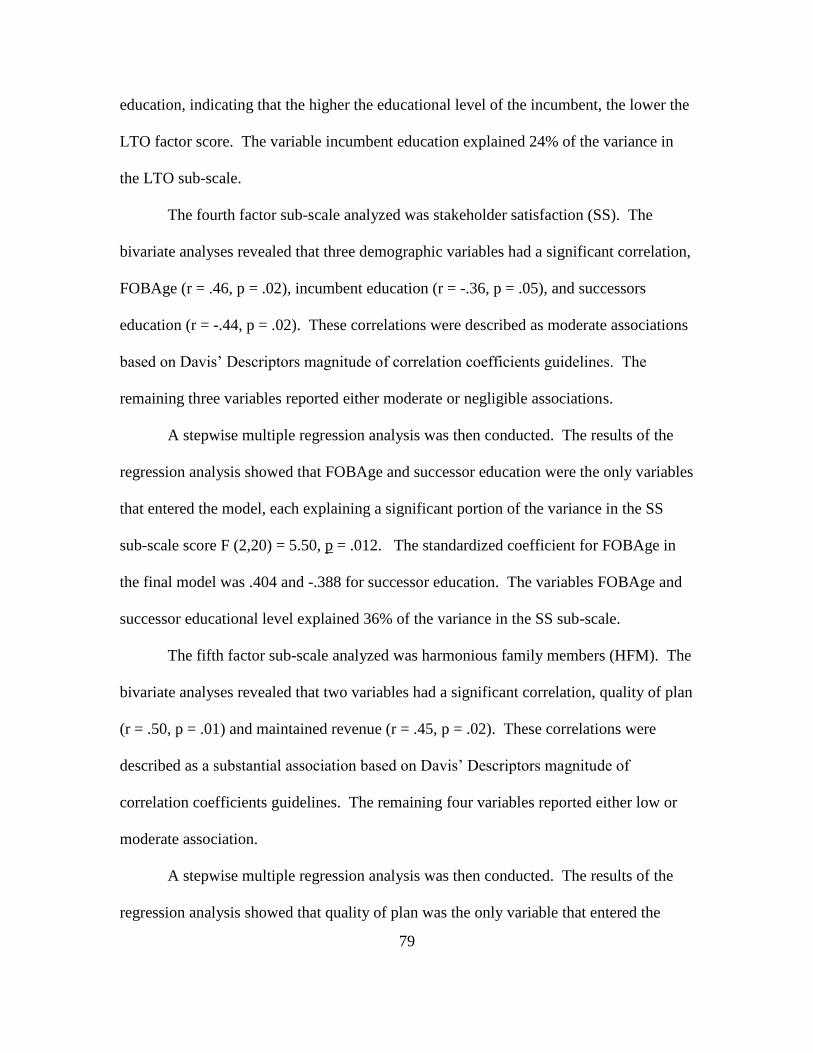
79
education, indicating that the higher the educational level of the incumbent, the lower the
LTO factor score. The variable incumbent education explained 24% of the variance in
the LTO sub-scale.
The fourth factor sub-scale analyzed was stakeholder satisfaction (SS). The
bivariate analyses revealed that three demographic variables had a significant correlation,
FOBAge (r = .46, p = .02), incumbent education (r = -.36, p = .05), and successors
education (r = -.44, p = .02). These correlations were described as moderate associations
based on Davis’ Descriptors magnitude of correlation coefficients guidelines. The
remaining three variables reported either moderate or negligible associations.
A stepwise multiple regression analysis was then conducted. The results of the
regression analysis showed that FOBAge and successor education were the only variables
that entered the model, each explaining a significant portion of the variance in the SS
sub-scale score F (2,20) = 5.50, p = .012. The standardized coefficient for FOBAge in
the final model was .404 and -.388 for successor education. The variables FOBAge and
successor educational level explained 36% of the variance in the SS sub-scale.
The fifth factor sub-scale analyzed was harmonious family members (HFM). The
bivariate analyses revealed that two variables had a significant correlation, quality of plan
(r = .50, p = .01) and maintained revenue (r = .45, p = .02). These correlations were
described as a substantial association based on Davis’ Descriptors magnitude of
correlation coefficients guidelines. The remaining four variables reported either low or
moderate association.
A stepwise multiple regression analysis was then conducted. The results of the
regression analysis showed that quality of plan was the only variable that entered the

80
model, explaining a significant portion of the variance in the HFM sub-scale score F
(1,21) = 6.85, p = .02. The standardized beta coefficient was .50 for the independent
variable, indicating that the higher the quality of plan, the greater the HFM factor. The
variable quality of plan explained 25% of the variance in the HMF sub-scale.
The sixth factor sub-scale analyzed was planning and success (PAS). The
bivariate analyses revealed that two variables had a significant correlation, maintain
revenue (r = .48, p = .01) and quality of plan (r = .41, p = .03). These correlations were
described as moderate associations based on Davis’ Descriptors magnitude of correlation
coefficients guidelines. The remaining four variables reported low, moderate, or
negligible associations.
A stepwise multiple regression analysis was then conducted. The results of the
regression analysis showed that maintained revenue was the only variable that entered the
model, explaining a significant portion of the variance in the PAS sub-scale score F
(1,21) = 6.42, p = .02. The standardized beta coefficient was .484 for maintained
revenue, indicating that if revenue was maintained or increased, the PAS factor score
would be greater. The variable maintained revenue explained 23% of the variance in the
PAS sub-scale
Conclusions, Implications, and Recommendations
Based on the findings of this study, the following conclusions and
recommendations were drawn by the researcher.
Conclusion One
1. The majority of respondents did not prepare a written succession plan prior to
completing the succession process.
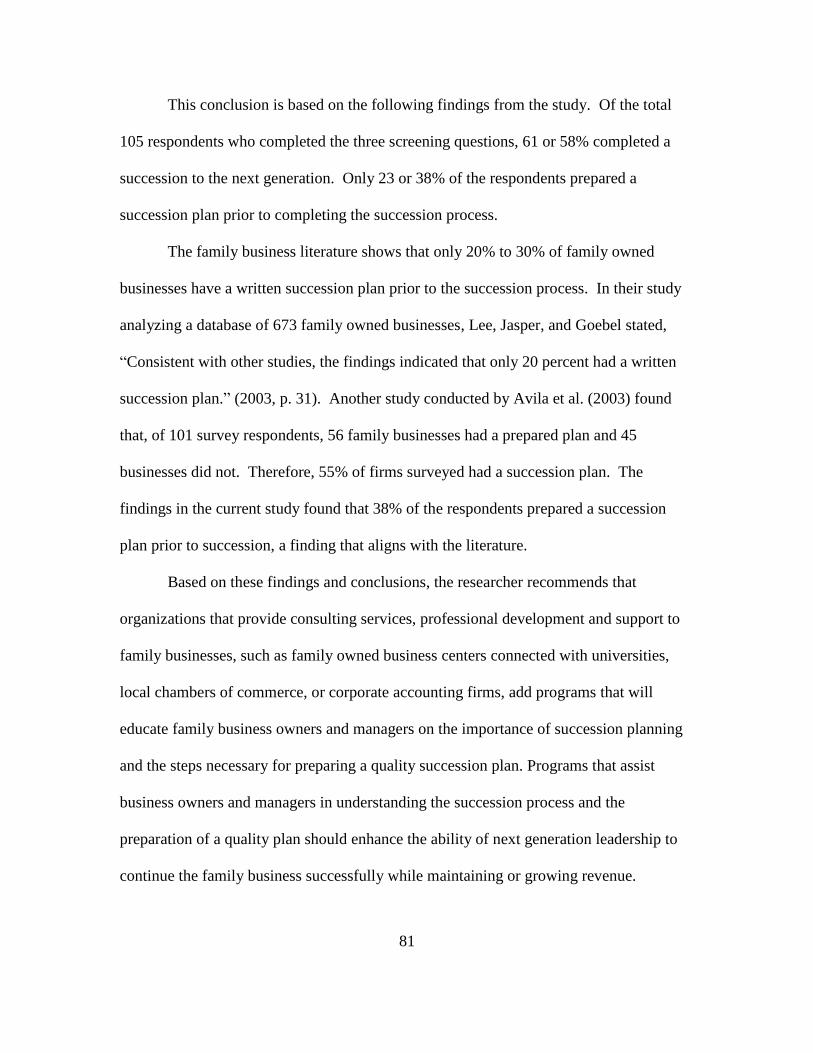
81
This conclusion is based on the following findings from the study. Of the total
105 respondents who completed the three screening questions, 61 or 58% completed a
succession to the next generation. Only 23 or 38% of the respondents prepared a
succession plan prior to completing the succession process.
The family business literature shows that only 20% to 30% of family owned
businesses have a written succession plan prior to the succession process. In their study
analyzing a database of 673 family owned businesses, Lee, Jasper, and Goebel stated,
“Consistent with other studies, the findings indicated that only 20 percent had a written
succession plan.” (2003, p. 31). Another study conducted by Avila et al. (2003) found
that, of 101 survey respondents, 56 family businesses had a prepared plan and 45
businesses did not. Therefore, 55% of firms surveyed had a succession plan. The
findings in the current study found that 38% of the respondents prepared a succession
plan prior to succession, a finding that aligns with the literature.
Based on these findings and conclusions, the researcher recommends that
organizations that provide consulting services, professional development and support to
family businesses, such as family owned business centers connected with universities,
local chambers of commerce, or corporate accounting firms, add programs that will
educate family business owners and managers on the importance of succession planning
and the steps necessary for preparing a quality succession plan. Programs that assist
business owners and managers in understanding the succession process and the
preparation of a quality plan should enhance the ability of next generation leadership to
continue the family business successfully while maintaining or growing revenue.
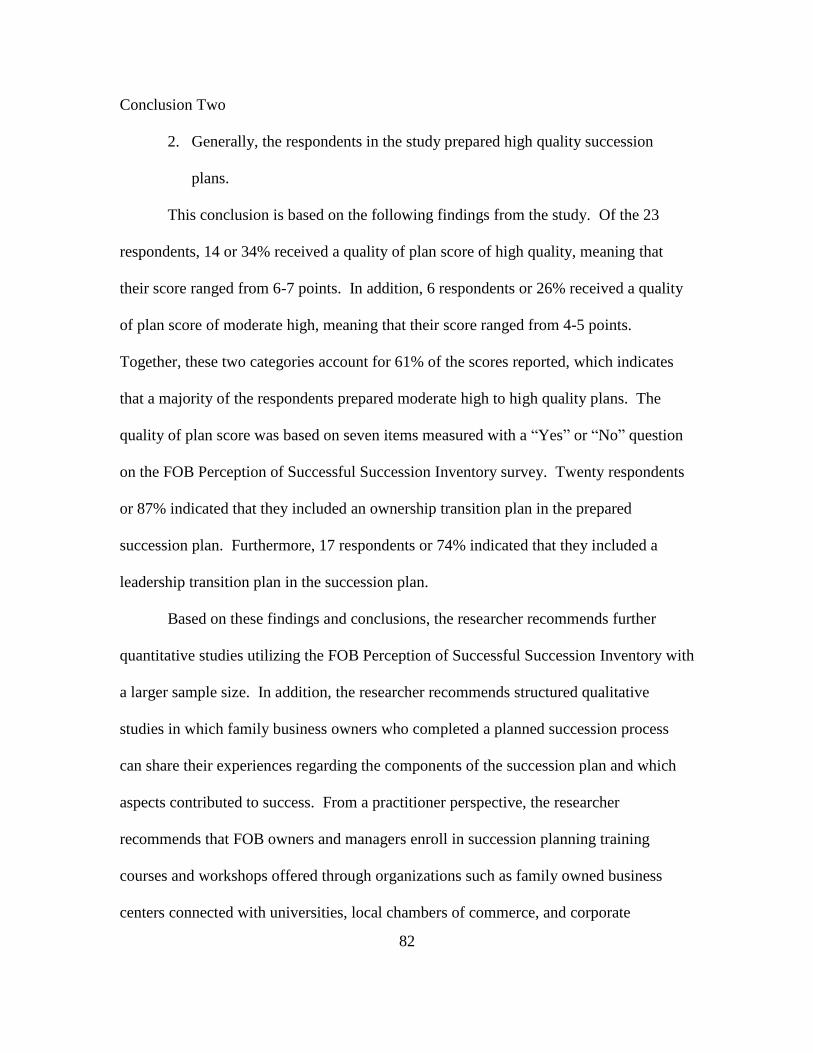
82
Conclusion Two
2. Generally, the respondents in the study prepared high quality succession
plans.
This conclusion is based on the following findings from the study. Of the 23
respondents, 14 or 34% received a quality of plan score of high quality, meaning that
their score ranged from 6-7 points. In addition, 6 respondents or 26% received a quality
of plan score of moderate high, meaning that their score ranged from 4-5 points.
Together, these two categories account for 61% of the scores reported, which indicates
that a majority of the respondents prepared moderate high to high quality plans. The
quality of plan score was based on seven items measured with a “Yes” or “No” question
on the FOB Perception of Successful Succession Inventory survey. Twenty respondents
or 87% indicated that they included an ownership transition plan in the prepared
succession plan. Furthermore, 17 respondents or 74% indicated that they included a
leadership transition plan in the succession plan.
Based on these findings and conclusions, the researcher recommends further
quantitative studies utilizing the FOB Perception of Successful Succession Inventory with
a larger sample size. In addition, the researcher recommends structured qualitative
studies in which family business owners who completed a planned succession process
can share their experiences regarding the components of the succession plan and which
aspects contributed to success. From a practitioner perspective, the researcher
recommends that FOB owners and managers enroll in succession planning training
courses and workshops offered through organizations such as family owned business
centers connected with universities, local chambers of commerce, and corporate
83
accounting firms to learn how to prepare a high quality succession plan and to learn the
influence that quality planning has on success.
Conclusion Three
3. Respondents perceived that planning for succession was important.
This conclusion is based on the following findings from the study. Based on a
four point Likert-type scale ranging from 1 (strongly disagree) to 4 (strongly agree),
respondents agreed with all perception items listed on the FOB Perception of Successful
Succession Inventory survey. Twenty-three respondents completed 19 items measuring
perception of succession planning. Of these responses, the item “Planning for succession
early is important to a successful succession” had a mean of 3.74, indicating strongly
agree. The item “Planning had a positive effect on the overall succession process” had
the second highest score, with a mean of 3.52, indicating strongly agree. The item with
the lowest mean score was “Employees were engaged throughout the succession process”
with a mean of 2.61, which still indicates agreement.
Many American family owned businesses have vanished due to the lack of
adequate succession planning (Galiano & Vinturella, 1995). According to Poutziouris et
al., “Past research suggests that there are many reasons such successions fail. They
include unclear succession plans, incompetent or unprepared successors, and family
rivalries” (2006, p. 372).
Based on these findings and conclusions the researcher recommends further
research utilizing the FOB Perception of Successful Succession Inventory survey to
better understand the succession planning perception factors. In particular, this study
should be replicated with a larger sample size to determine if the findings regarding

84
agreement with all of the items can be confirmed. More specifically, this research would
be used to determine if the items “Planning for succession early is important to a
successful succession” and “Planning had a positive effect on the overall succession
process” can be confirmed as having the highest level of agreement. In addition,
structured qualitative studies should be conducted to understand the perceptions among
FOB owners and managers regarding why planning is important in family owned
businesses and how and why it increases success. This study should include those who
were highly successful and those who experienced lower levels of success to see the
difference that exist in these groups.
Conclusion Four
4. The FOB Perception of Successful Succession Inventory is a well-designed
instrument.
This conclusion is based on the following findings from the study. The factor
structure of the instrument used in the study (FOB Perception of Successful Succession
Inventory) was supported by the data collected. Due to the low number of respondents (n
= 23) in this study, the researcher ran a factor analysis to determine the factor loading on
each of the six planning sub-scales rather than a global factor analysis. “Loadings ± .50
or greater are considered practically significant. Loadings exceeding + .70 are considered
indicative of well-defined structure and are the goal of any factor analysis.” (Hair et al.,
2006, p. 128). Of these factors, four had a minimum loading greater than .70 and two had
minimum loadings of >.50. Therefore, 4 of 6 sub-scales met Hair’s criteria for a well-
defined structure. “Planning and success” had the highest loading, which included,
“Planning had a positive effect on the overall succession process” (.929), “The succession
85
process at my company was successful” (.820), and “The transition of leadership was
smooth and there were no disruptions in the business” (.812). The second highest factor
loadings were found for “stakeholder satisfaction”, which included “The succession plan
placed the needs of the organization at the forefront” (.960), “Employee turnover
improved or remained the same after succession” (.955), “Vendor relationships improved
or remained the same after succession” (.877), and “Customer relationships improved or
remained the same after succession” (.841) (see Tables 11-16).
Based on these findings and conclusions the researcher recommends continued
research utilizing the FOB Perception of Successful Succession Inventory survey. In
particular, this study should be with a larger sample size to determine if the planning sub-
scales continue to report acceptable loading scores (≥.40) and if the items in each factor
continue to group together. Although the sub-scales in this study hold together, the
researcher acknowledges that the results reported could be suspect due to the limited
sample size. However, based on the current study results the FOB Perception of
Successful Succession Inventory is a well-designed instrument.
Conclusion Five
5. Family owned business owners and managers of older businesses tend to have
a more positive perception regarding satisfied stakeholders.
This conclusion is based on the following findings from the study. Data for this
variable were collected by asking respondents to select the appropriate business age
category. Categories included “1-2 Years”, “3-5 Years”, “6-10 Years”, “11-20 Years”,
and “20+ Years”. Of the six perception sub-scales examined, satisfied stakeholders had a
computed correlation coefficient of rs = .44, (p = .03), indicating a moderate positive

86
relationship between age of family owned businesses and perceptions of satisfied
stakeholders.
Success in succession includes subsequent positive performance of the firm, the
ultimate viability of the business, and the satisfaction of the stakeholders with the
succession process (Cabrera-Suárez et al., 2000; Dyer, 1986; Handler, 1990; Morris et al.,
1997; Sharma et al., 2001) (Barbara & Alberto Ivo, 2009, p. 46). A majority of the
respondents (n = 17, 73.9%) reported the age of the business as 20+ years. One
implication is that the owners and managers of older businesses better understand the
needs of employees, customers, and the supply chain as compared to younger companies.
When businesses focus on keeping stakeholders satisfied throughout the succession
process, the opportunity for success is greater. Older businesses have the benefit of
creating long-term relationships with employees, vendors and other stakeholders which in
return, allows business owners to fully appreciate the value of a satisfied stakeholder.
Based on these findings and conclusions, the researcher recommends additional
research designed to understand why family owned business owners and managers of
older businesses tend to have a more positive perception regarding satisfied stakeholders.
This might be done by a series of focused interviews. These interviews should include
the owners and managers of both older and younger businesses utilizing guided questions
to understand their succession processes. In addition, the researcher recommends that
practitioners enroll in continuing education courses that focus on customer satisfaction,
employee satisfaction and retention, and supply chain management. Understanding
stakeholder satisfaction, as defined in the literature, is an important factor for successful
succession (Barbara & Alberto Ivo, 2009, p. 46).

87
Conclusion Six
6. Having a high quality succession plan had a positive influence on the
perceptions of family owned business owners and managers.
This conclusion is based on the following findings from the study. A moderate
positive relationship was found between whether or not leadership prepared a quality
succession plan and “early preparation” r = .54, (p = .01), “commitment to stakeholders”
r = .50, (p = .01), and “harmonious family members” r = .50, (p = .02). Family owned
businesses that prepared a high quality succession plan tended to have a more positive
perception regarding the items in the “early preparation”, “commitment to stakeholders”,
and “harmonious family members” sub-scales compared to those who had a lower quality
plan. In addition, three of the six planning sub-scales reported a significant contribution
of quality of the plan to the explanatory regression models. The first sub-scale CTS had a
significant correlation with quality of plan (r = .50, p = .01), with quality of plan
explaining 25% of the variance in the CTS sub-scale. EP also had a significant
correlation with quality of plan (r = .54, p = .01), with quality of plan explaining 29% of
the variance in the EP sub-scale. Lastly, HFM had a significant correlation with quality of
plan (r = .50, p = .01), with quality of plan explaining 25% of the variance in the HFM
sub-scale.
Based on these findings and conclusions the researcher recommends continued
research utilizing the FOB Perception of Successful Succession inventory survey.
Because quality of plan entered the regression model for three of the six sub-scales, one
recommendation is that this study be replicated with a larger sample size to further
determine the influence that quality of plan has on perceptions of succession planning.

88
The researcher reiterates the recommendation from the first conclusion, that
organizations that provide consulting services, professional development and support to
family businesses, such as family owned business centers connected with universities,
local chambers of commerce, and corporate accounting firms, add programs that will
educate family business owners and managers on the importance of succession planning
and the steps necessary for preparing a quality succession plan. The researcher further
recommends that these organizations recruit family business owners who prepared a high
quality plan to serve as collaborators in the design and conduct of educational workshops.
Training family owned businesses to prepare high quality succession plans is important to
the longevity of family firms. Based on recent research on family business, the absence
of planning is one of the top reasons for failed succession, although little is known about
how or why planning increases success (Long & Chrisman, 2013).
89
REFERENCES
Avila, S. M., Avila, R. A., & Naffziger, D. W. (2003). A comparison of family-owned
businesses: Succession planners and nonplanners. Journal of Financial Service
Professionals, 57(3), 85-92. Retrieved from
http://search.proquest.com/docview/209614832?accountid=458
http://linksource.ebsco.com/linking.aspx?sid=ProQ%3Aabiglobal&fmt=journal&
genre=article&issn=15371816&volume=57&issue=3&date=2003-05-
01&spage=85&title=Journal+of+Financial+Service+Professionals&atitle=A+com
parison+of+family-
owned+businesses%3A+Succession+planners+and+nonplanners&au=Avila%2C+
Stephen+M%3BAvila%2C+Ramon+A%3BNaffziger%2C+Douglas+W&isbn=&j
title=Journal+of+Financial+Service+Professionals&btitle=.
Barach, J. A., & Ganitsky, J. B. (1995). Successful Succession in Family Business.
Family Business Review, 8(2), 131-155. doi:10.1111/j.1741-6248.1995.00131.x.
Barbara, B., & Alberto Ivo, D. (2009). Successful generational change in family business.
Measuring Business Excellence, 13(2), 44-50. Retrieved from
http://libezp.lib.lsu.edu/login?url=http://search.ebscohost.com/login.aspx?direct=t
rue&db=bth&AN=43355428&site=ehost-live&scope=site.
Berchelman, D. K. (2005). Succession Planning. The Journal for Quality and
Participation, 28(3), 11-12. Retrieved from
http://search.proquest.com/docview/219119331?accountid=458
http://linksource.ebsco.com/linking.aspx?sid=ProQ%3Aabiglobal&fmt=journal&
genre=unknown&issn=10409602&volume=28&issue=3&date=2005-10-
01&spage=11&title=The+Journal+for+Quality+and+Participation&atitle=Succes
sion+Planning&au=Berchelman%2C+D+Kevin&isbn=&jtitle=The+Journal+for+
Quality+and+Participation&btitle=&id=doi:.
Bruce, D., & Picard, D. (2006). Making Succession a Success: Perspectives from
Canadian Small and Medium-Sized Enterprises. Journal of Small Business
Management, 44(2), 306-309. Retrieved from
http://search.proquest.com/docview/220997308?accountid=458
http://linksource.ebsco.com/linking.aspx?sid=ProQ%3Aabiglobal&fmt=journal&
genre=article&issn=00472778&volume=44&issue=2&date=2006-04-
01&spage=306&title=Journal+of+Small+Business+Management&atitle=Making
+Succession+a+Success%3A+Perspectives+from+Canadian+Small+and+Mediu
m-
Sized+Enterprises&au=Bruce%2C+Doug%3BPicard%2C+Derek&isbn=&jtitle=J
ournal+of+Small+Business+Management&btitle=.

90
Chua, J. H., Chrisman, J. J., & Sharma, P. (1999). Defining the Family Business by
Behavior. Entrepreneurship: Theory & Practice, 23(4), 19-39. Retrieved from
http://search.ebscohost.com/login.aspx?direct=true&db=bth&AN=2553117&site=
ehost-live.
Conger, J. A., & Fulmer, R. M. (2003). Developing Your Leadership Pipeline. Harvard
Business Review, 81(12), 76-84. Retrieved from
http://search.ebscohost.com/login.aspx?direct=true&db=bth&AN=11587559&site
=ehost-live.
Duh, M. (2012). Family Businesses: The Extensiveness of Succession Problems and
Possible Solutions: INTECH.
Entry of the Next Generation: Strategic Challenge for Family. (1988). Journal of Small
Business Management, 26(2), 49. Retrieved from
http://search.proquest.com/docview/220955830?accountid=458
http://linksource.ebsco.com/linking.aspx?sid=ProQ%3Aabiglobal&fmt=journal&
genre=article&issn=00472778&volume=26&issue=2&date=1988-04-
01&spage=49&title=Journal+of+Small+Business+Management&atitle=Entry+of
+the+Next+Generation%3A+Strategic+Challenge+for+Family&au=&isbn=&jtitl
e=Journal+of+Small+Business+Management&btitle=.
File, K. M., & Prince, R. A. (1996). Attributions for Family Business Failure: The Heir's
Perspective. Family Business Review, 9(2), 171-184. doi:10.1111/j.1741-
6248.1996.00171.x.
Galiano, A. M., & Vinturella, J. B. (1995). Implications of Gender Bias in the Family
Business. Family Business Review, 8(3), 177-188. doi:10.1111/j.1741-
6248.1995.00177.x.
Garman, A. N., & Glawe, J. (2004). Succession Planning. Consulting Psychology
Journal: Practice and Research, 56(2), 119-128.
doi:http://dx.doi.org/10.1037/1061-4087.56.2.119.
Gray, D. (2014). Succession Planning 101. Professional Safety, 59(3), 35. Retrieved
fromhttp://search.proquest.com/docview/1517909754?accountid=35812http://AV
4KC7FG4G.search.serialssolutions.com/?ctx_ver=Z39.88-
2004&ctx_enc=info:ofi/enc:UTF-
8&rfr_id=info:sid/ProQ%3Aabiglobal&rft_val_fmt=info:ofi/fmt:kev:mtx:journal
&rft.genre=unknown&rft.jtitle=Professional+Safety&rft.atitle=Succession+Plann
ing+101&rft.au=Gray%2C+Doug&rft.aulast=Gray&rft.aufirst=Doug&rft.date=20
14-03-
01&rft.volume=59&rft.issue=3&rft.spage=35&rft.isbn=&rft.btitle=&rft.title=Prof
essional+Safety&rft.issn=00990027&rft_id=info:doi/.

91
Hair, J., Black, W., Babin, B., & Anderson, R. (2006). Multivariate Data Analysis. Upper
saddle River, New Jersey: Pearson Prentice Hall.
Ibrahim, N. A., Angelidis, J. P., & Parsa, F. (2008). Strategic Management of Family
Businesses: Current Findings and Directions for Future Research. International
Journal of Management, 25(1), 95-110,198. Retrieved from
http://search.proquest.com/docview/233228881?accountid=458
http://linksource.ebsco.com/linking.aspx?sid=ProQ%3Aabiglobal&fmt=journal&
genre=article&issn=08130183&volume=25&issue=1&date=2008-03-
01&spage=95&title=International+Journal+of+Management&atitle=Strategic+M
anagement+of+Family+Businesses%3A+Current+Findings+and+Directions+for+
Future+Research&au=Ibrahim%2C+Nabil+A%3BAngelidis%2C+John+P%3BPa
rsa%2C+Faramarz&isbn=&jtitle=International+Journal+of+Management&btitle.
Le Breton-Miller, Isabelle, Lloyd, D. M., & Steier, P. (2004). Toward an Integrative
Model of Effective FOB Succession. Entrepreneurship Theory and Practice,
28(4), 305-328.
Kotrlik, J. W., Williams, H. A., & Jabor, M. K. (2011). Reporting and Interpreting Effect
Size in Quantitative Agricultural Education Research. Journal of Agricultural
Education, 52(1), 132-142. doi:10.5032/jae.2011.01132.
Krishnan, R. V. (2012 May 11). SME and succession planning. Businessline. Retrieved
from
http://search.proquest.com/docview/1321759146?accountid=458http://linksource.
ebsco.com/linking.aspx?sid=ProQ%3Anewsstand&fmt=journal&genre=unknown
&issn=&volume=&issue=&date=2012-05-
11&spage=&title=Businessline&atitle=SME+and+succession+planning&au=Kris
hnan%2C+R+Venkata&isbn=&jtitle=Businessline&btitle=&id=doi:.
Larcker, D. F., & Saslow, S. (2015). 2014 Report on Senior Executive Succession
Planning and Talent Development. Retrieved from Baton Rouge, LA:
https://www.gsb.stanford.edu/sites/gsb/files/publication-pdf/cgri-survey-2014-
senior-executive-succession.pdf.
Lee, Y. G., Jasper, C. R., & Goebel, K. P. (2003). A Profile of Succession Planning
among Family Business Owners. Journal of Financial Counseling and Planning,
14(2), 31-41. Retrieved from
http://search.proquest.com/docview/1355867058?accountid=458
http://linksource.ebsco.com/linking.aspx?sid=ProQ%3Aabiglobal&fmt=journal&
genre=article&issn=10523073&volume=14&issue=2&date=2003-07-
01&spage=31&title=Journal+of+Financial+Counseling+and+Planning&atitle=A
+Profile+of+Succession+Planning+among+Family+Business+Owners&au=Lee%
2C+Yoon+G%3BJasper%2C+Cynthia+R%3BGoebel%2C+Karen+P&isbn=&jtitl
e=Journal+of+Financial+Counseling+and+Planning&btitle=.

92
Lemoine, D. (2015). Succession Planning - A Step-by-Step Guide. Retrieved from Baton
Rouge, LA: http://mysuccesslab.com/wp-
content/uploads/2014/10/Succession_Planning-A_Step-by-Step_Guide.pdf.
Littunen, H., & Hyrsky, K. (2000). The Early Entrepreneurial Stage in Finnish Family
and Nonfamily Firms. Family Business Review, 13(1), 41-53. doi:10.1111/j.1741-
6248.2000.00041.x.
Long, D. R., & Chrisman, D. J. (2013). Management Succession in Family Business.
SAGE Handbook of Family Business, 13(1), 19.
Marín, E. A. (2012). Survey research design: Sage Publications.
Miller, D., Steier, L., & Breton-Miller, I. L. (2003). Lost in time: intergenerational
succession, change, and failure in family business. Journal of Business Venturing,
18(4), 513-531.
Monk, R. (2000). Why small businesses fail. CMA Management, 74(6), 12-13. Retrieved
from http://search.proquest.com/docview/197767164?accountid=458
http://linksource.ebsco.com/linking.aspx?sid=ProQ%3Aabiglobal&fmt=journal&
genre=article&issn=14904225&volume=74&issue=6&date=2000-07-
01&spage=12&title=CMA+Management&atitle=Why+small+businesses+fail%3
A+The+Management+Accounting+Magazine&au=Monk%2C+Richard&isbn=&j
title=CMA+Management&btitle=&id=doi:.
Montgomery, B. J., & Sinclair, A. M. (2000). All in the family. Business & Economic
Review, 46(2), 3. Retrieved from
http://libezp.lib.lsu.edu/login?url=http://search.ebscohost.com/login.aspx?direct=t
rue&db=bth&AN=2762942&site=ehost-live&scope=site.
Pollitt, D. (2005). Leadership succession planning "affects commercial success". Human
Resource Management International Digest, 13(1), 36-38. Retrieved from
http://search.proquest.com/docview/214907455?accountid=458
http://linksource.ebsco.com/linking.aspx?sid=ProQ%3Aabiglobal&fmt=journal&
genre=article&issn=09670734&volume=13&issue=1&date=2005-01-
01&spage=36&title=Human+Resource+Management+International+Digest&atitl
e=Leadership+succession+planning+%22affects+commercial+success%22&au=P
ollitt%2C+David&isbn=&jtitle=Human+Resource+Management+International+
Digest&btitle=&id=doi:.
Poutziouris, P. Z., Smyrnios, K. X., & Klein, S. B. (2006). Handbook of Research on
Family Business (2006 ed.). Massachusetts, USA: Edward Elgar Publishing, Inc.
93
Pyromalis, V. D., Vozilis, G.S., Kalkanteras, T.A., Rogdaki, M.E., & Sigalas, G.P.
(2006). An Integrated Framework for Testing the Success of the Family Business
Succession Process According to Gender Specificity. MA: Edward Elgar
Publishing.
Quinn, T. (2002). Succession planning: Start today. Principal Leadership, 3(2), 24-28.
Retrieved from http://search.proquest.com/docview/234983611?accountid=458
http://linksource.ebsco.com/linking.aspx?sid=ProQ%3Aeducation&fmt=journal&
genre=article&issn=15298957&volume=3&issue=2&date=2002-10-
01&spage=24&title=Principal+Leadership&atitle=Succession+planning%3A+Sta
rt+today&au=Quinn%2C+Terry&isbn=&jtitle=Principal+Leadership&btitle=&id
=doi:.
Richard, W., & Redman, P., RN. (2006). Leadership Succession Planning: An Evidence-
based Approach for Managing the Future. THE JOURNAL OF NURSING
ADMINISTRATION, 36(6), 292-297.
Richards, P. (2008). Succession planning: does it matter in the context of corporate
leadership? Australian Journal of Adult Learning, 48(3), 445-464. Retrieved
from http://search.proquest.com/docview/89071630?accountid=458
http://linksource.ebsco.com/linking.aspx?sid=ProQ%3Aeducation&fmt=journal&
genre=article&issn=14431394&volume=48&issue=3&date=2008-11-
01&spage=445&title=Australian+Journal+of+Adult+Learning&atitle=Succession
+planning%3A+does+it+matter+in+the+context+of+corporate+leadership%3F&a
u=Richards%2C+Patricia&isbn=&jtitle=Australian+Journal+of+Adult+Learning
&btitle=&id=doi:.
Rothwell, W. J. (2001). Effective succession planning: Leadership continuity and
building talent from within (2nd ed.). New York: American Management
Association.
Scott, R. B., Jr. (2000). Consulting with family-owned businesses. The CPA Journal,
70(5), 80-81. Retrieved from
http://search.proquest.com/docview/212293615?accountid=458
http://linksource.ebsco.com/linking.aspx?sid=ProQ%3Aabiglobal&fmt=journal&
genre=article&issn=07328435&volume=70&issue=5&date=2000-05-
01&spage=80&title=The+CPA+Journal&atitle=Consulting+with+family-
owned+businesses%3A+Certified+Public+Accountant&au=Scott%2C+Robert+B
%2C+Jr&isbn=&jtitle=The+CPA+Journal&btitle=&id=doi:.
Sharma, P., Chrisman, J. J., & Chua, J. H. (2003). Succession planning as planned
behavior: Some empirical results. Family Business Review, 16(1), 1. Retrieved
from http://search.proquest.com/docview/211131617?accountid=458
http://linksource.ebsco.com/linking.aspx?sid=ProQ%3Aabiglobal&fmt=journal&
genre=article&issn=08944865&volume=16&issue=1&date=2003-03-
01&spage=1&title=Family+Business+Review&atitle=Succession+planning+as+p

94
lanned+behavior%3A+Some+empirical+results&au=Sharma%2C+Pramodita%3
BChrisman%2C+James+J%3BChua%2C+Jess+H&isbn=&jtitle=Family+Busines
s+Review&btitle=&id=doi:.
Sharma, P., Chrisman, J. J., Pablo, A. L., & Chua, J. H. (2001). Determinants of Initial
Satisfaction with the Succession Process in Family Firms: A Conceptual Model.
Entrepreneurship: Theory & Practice, 25(3), 17. Retrieved from
http://search.ebscohost.com/login.aspx?direct=true&db=bth&AN=5119777&site=
ehost-live.
Totten, V. Y., Panacek, E. A., & Price, D. (1999). Basics of research (part 14) survey
research methodology: Designing the survey instrument. Air Medical Journal,
18(1), 26-34. doi:http://dx.doi.org/10.1016/S1067-991X(99)90006-8.
U.S. Small Business Administration, O. o. A. (2013). Small Business Profile: Louisiana, .
Retrieved from https://www.sba.gov/sites/default/files/advocacy/la12.pdf.
U.S. Small Business Administration, O. o. A. (2015). Louisiana Small Business Profile.
Retrieved from https://www.sba.gov/sites/default/files/advocacy/LA_0.pdf.
USA, F. E. (2011). Annual Family Business Survey. Retrieved from
http://www.familyenterpriseusa.org/.
Van der Merwe, S., Venter, E., & Ellis, S. M. (2009). An exploratory study of some of
the determinants of management succession planning in family businesses.
Management Dynamics, 18(4), 2-17. doi:10.1111/j.1741-6248.1996.00171.x.
Vozikis, G. S., Weaver, K. M., & Gibson, B. (2009). Family business succession:
emphasis on the family not the business. Indian Journal of Economics and
Business, 139+. Retrieved from
http://find.galegroup.com/gic/infomark.do?&source=gale&idigest=f29835d933fa
9a2788cc507f0d416da0&prodId=GIC&userGroupName=uphoenix&tabID=T002
&docId=A280093144&type=retrieve&PDFRange=%5B%5D&contentSet=IAC-
Documents&version=1.0.
Weinmann, K., & Groth, A. (2011, November 17, 2011). The 10 Largest Family
Businesses In The U.S. Business Insider.
Williams, D., & Jones, O. (2010). FACTORS ASSOCIATED WITH LONGEVITY OF
SMALL, FAMILY-OWNED FIRMS. International Journal of Entrepreneurship,
14, 37-57. Retrieved from
http://search.proquest.com/docview/763150185?accountid=458
http://linksource.ebsco.com/linking.aspx?sid=ProQ%3Aabiglobal&fmt=journal&
genre=article&issn=10999264&volume=14&issue=&date=2010-01-
01&spage=37&title=International+Journal+of+Entrepreneurship&atitle=FACTO
RS+ASSOCIATED+WITH+LONGEVITY+OF+SMALL%2C+FAMILY-
95
OWNED+FIRMS&au=Williams%2C+Densil%3BJones%2C+Oniel&isbn=&jtitl
e=International+Journal+of+Entrepreneurship&btitle=&id=doi:.
Withorn, C. P. (2015, April 20, 2015). New Report Reveals The 500 Largest Family-
Owned Companies In The World. Forbes.com.
Zellweger, T. M., Nason, R. S., & Nordqvist, M. (2012). From Longevity of Firms to
Transgenerational Entrepreneurship of Families: Introducing Family
Entrepreneurial Orientation. Family Business Review, 25(2), 136-155.
doi:10.1177/0894486511423531.

96
APPENDIX A: IRB CONSENT FORM AND REQUEST FOR PARTICIPATION

97
APPENDIX B: FOB PERCEPTION OF SUCCESSFUL SUCCESSION INVENTORY
INSTRUCTIONS:
The purpose of this survey is to collect pertinent information that will assist Louisiana
State University researchers in contributing to the body of knowledge in family owned
business studies. Attached is a Likert-type scale survey instrument designed to better
understand the perceptions family owned businesses located in south Louisiana have on
succession. Please carefully read and answer each of the following items by checking
the appropriate box that best describes your answer. Thank you for taking time to
complete this survey and advancing family owned business research.
Screening Questions
1. Are you a family owned
business [FOB] (Members of
the same family are involved as
owners or managers)
Yes
No
2. My company has completed
the succession process (where
another family member took
Yes
No
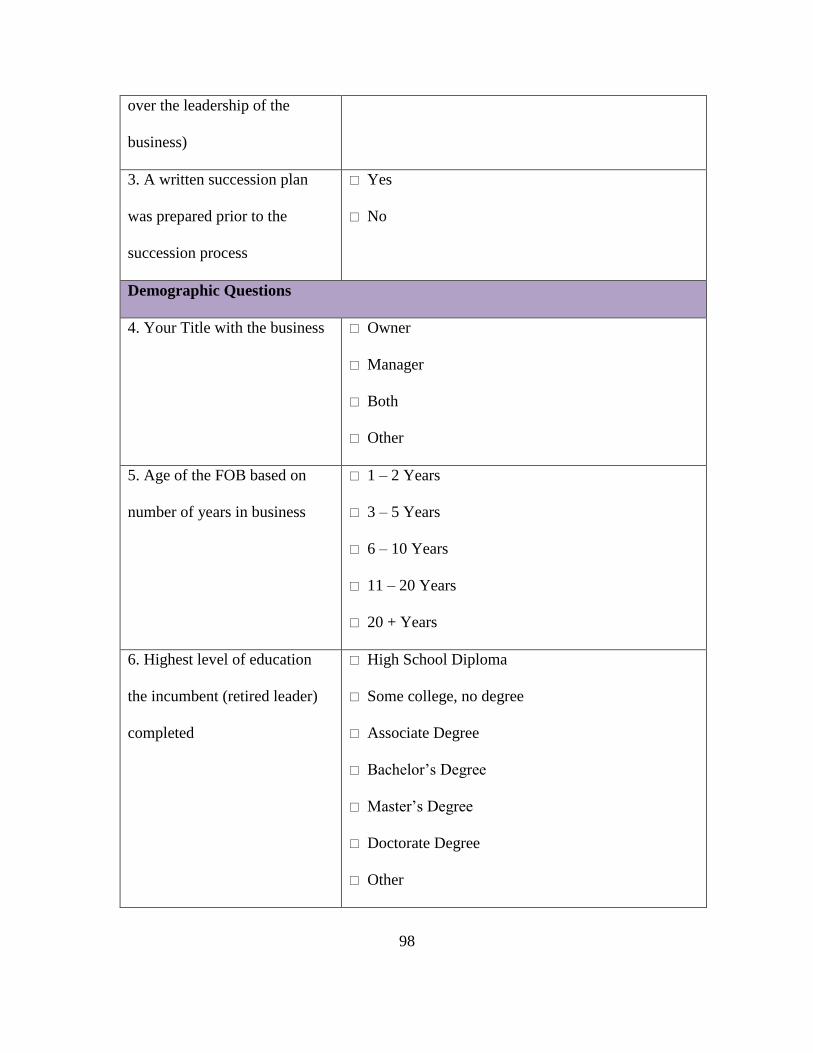
98
over the leadership of the
business)
3. A written succession plan
was prepared prior to the
succession process
Yes
No
Demographic Questions
4. Your Title with the business Owner
Manager
Both
Other
5. Age of the FOB based on
number of years in business
1 – 2 Years
3 – 5 Years
6 – 10 Years
11 – 20 Years
20 + Years
6. Highest level of education
the incumbent (retired leader)
completed
High School Diploma
Some college, no degree
Associate Degree
Bachelor’s Degree
Master’s Degree
Doctorate Degree
Other
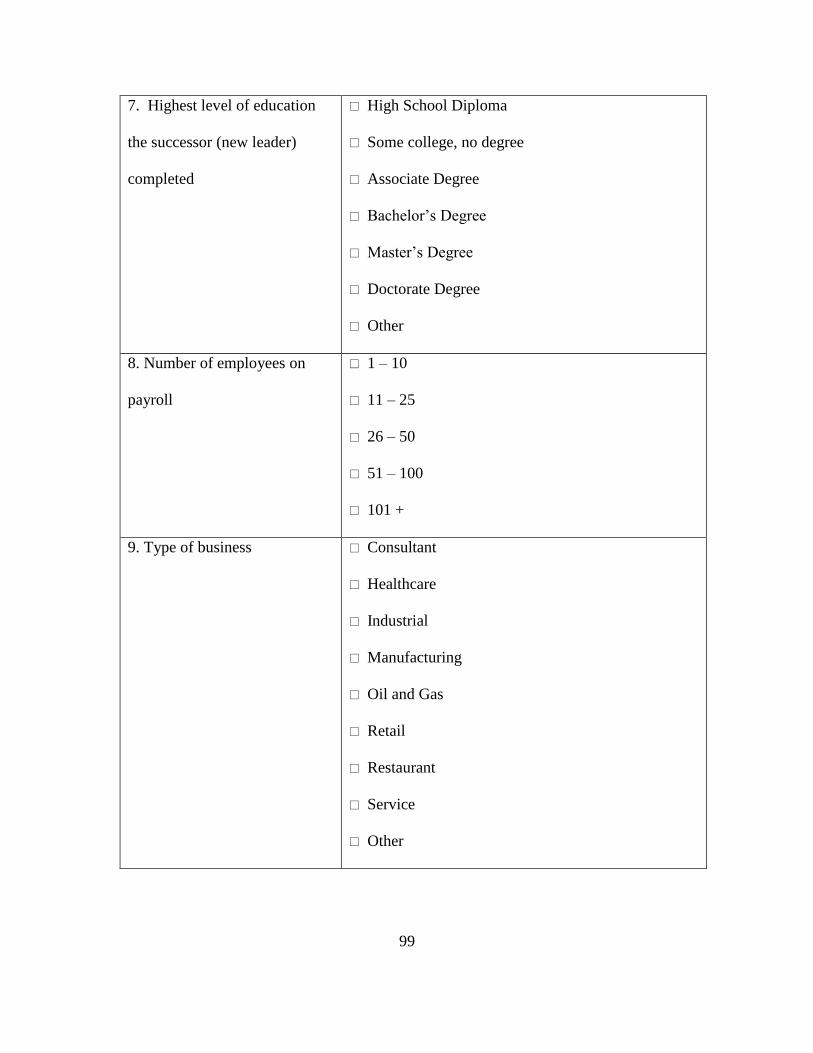
99
7. Highest level of education
the successor (new leader)
completed
High School Diploma
Some college, no degree
Associate Degree
Bachelor’s Degree
Master’s Degree
Doctorate Degree
Other
8. Number of employees on
payroll
1 – 10
11 – 25
26 – 50
51 – 100
101 +
9. Type of business
Consultant
Healthcare
Industrial
Manufacturing
Oil and Gas
Retail
Restaurant
Service
Other
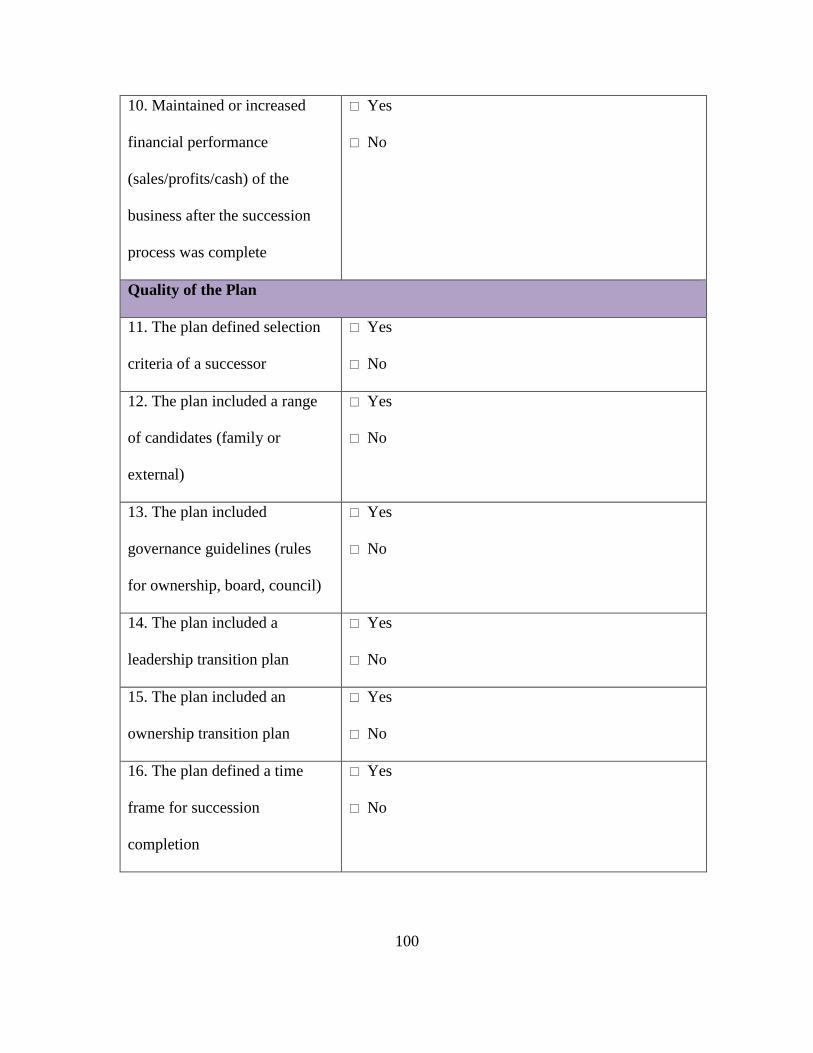
100
10. Maintained or increased
financial performance
(sales/profits/cash) of the
business after the succession
process was complete
Yes
No
Quality of the Plan
11. The plan defined selection
criteria of a successor
Yes
No
12. The plan included a range
of candidates (family or
external)
Yes
No
13. The plan included
governance guidelines (rules
for ownership, board, council)
Yes
No
14. The plan included a
leadership transition plan
Yes
No
15. The plan included an
ownership transition plan
Yes
No
16. The plan defined a time
frame for succession
completion
Yes
No
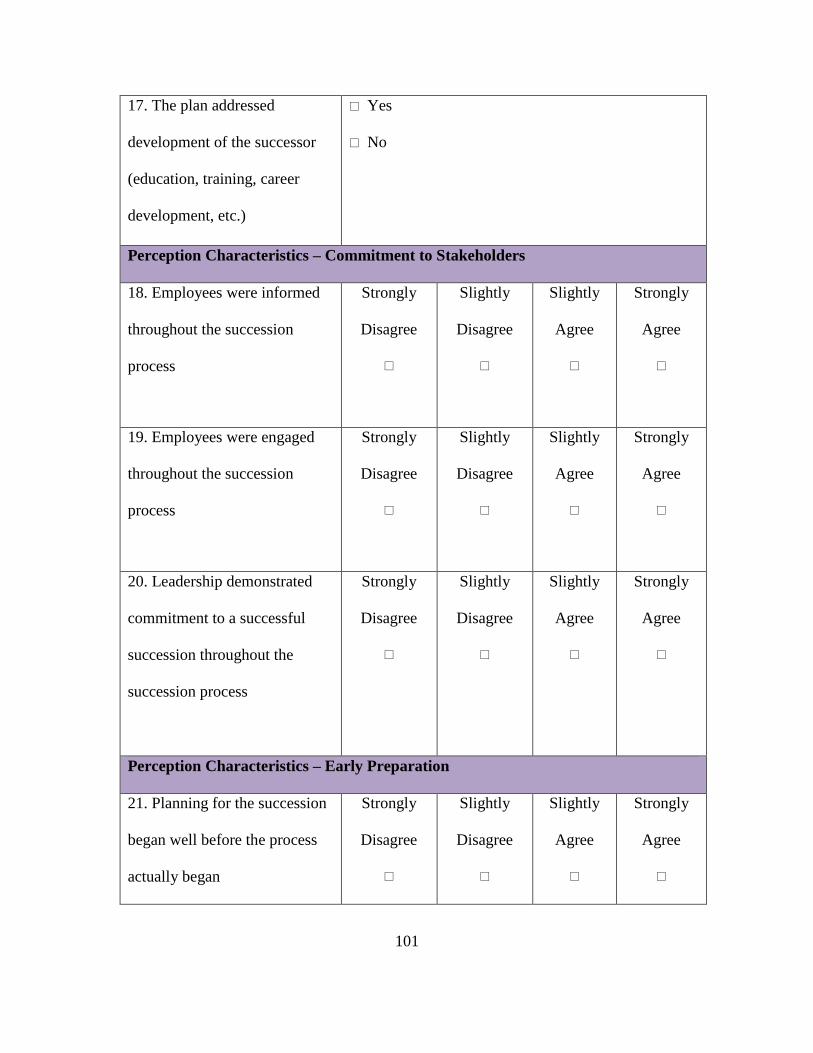
101
17. The plan addressed
development of the successor
(education, training, career
development, etc.)
Yes
No
Perception Characteristics – Commitment to Stakeholders
18. Employees were informed
throughout the succession
process
Strongly
Disagree
Slightly
Disagree
Slightly
Agree
Strongly
Agree
19. Employees were engaged
throughout the succession
process
Strongly
Disagree
Slightly
Disagree
Slightly
Agree
Strongly
Agree
20. Leadership demonstrated
commitment to a successful
succession throughout the
succession process
Strongly
Disagree
Slightly
Disagree
Slightly
Agree
Strongly
Agree
Perception Characteristics – Early Preparation
21. Planning for the succession
began well before the process
actually began
Strongly
Disagree
Slightly
Disagree
Slightly
Agree
Strongly
Agree

102
22. Regular meetings were
conducted to discuss the
succession process
Strongly
Disagree
Slightly
Disagree
Slightly
Agree
Strongly
Agree
23. Planning for succession
early is important to successful
succession
Strongly
Disagree
Slightly
Disagree
Slightly
Agree
Strongly
Agree
Perception Characteristics – Learning that Occurs
24. The successor learned
throughout the succession
planning process
Strongly
Disagree
Slightly
Disagree
Slightly
Agree
Strongly
Agree
25. The incumbent learned
throughout the succession
planning process
Strongly
Disagree
Slightly
Disagree
Slightly
Agree
Strongly
Agree
26. Employees learned
throughout the succession
planning process
Strongly
Disagree
Slightly
Disagree
Slightly
Agree
Strongly
Agree

103
Perception Characteristics – Satisfied Stakeholders
27. The succession plan placed
the needs of the organization at
the forefront
Strongly
Disagree
Slightly
Disagree
Slightly
Agree
Strongly
Agree
28. Employee turnover
improved or remained the same
after succession
Strongly
Disagree
Slightly
Disagree
Slightly
Agree
Strongly
Agree
29. Vendor relationships
improved or remained the same
after succession
Strongly
Disagree
Slightly
Disagree
Slightly
Agree
Strongly
Agree
30. Customer relationships
improved or remained the same
after succession
Strongly
Disagree
Slightly
Disagree
Slightly
Agree
Strongly
Agree
Perception Characteristics – Harmonious Family Members
31. Family members have
defined roles within the firm
Strongly
Disagree
Slightly
Disagree
Slightly
Agree
Strongly
Agree
32. There was effective
communication among family
members throughout the
succession planning process
Strongly
Disagree
Slightly
Disagree
Slightly
Agree
Strongly
Agree
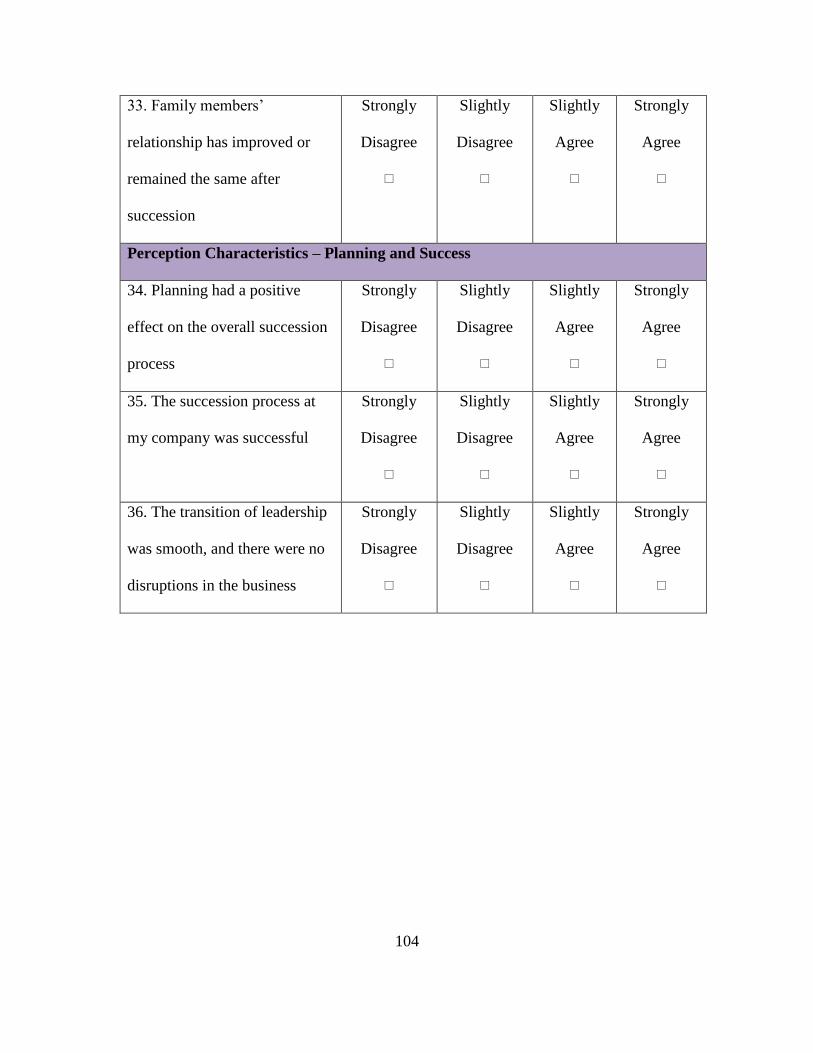
104
33. Family members’
relationship has improved or
remained the same after
succession
Strongly
Disagree
Slightly
Disagree
Slightly
Agree
Strongly
Agree
Perception Characteristics – Planning and Success
34. Planning had a positive
effect on the overall succession
process
Strongly
Disagree
Slightly
Disagree
Slightly
Agree
Strongly
Agree
35. The succession process at
my company was successful
Strongly
Disagree
Slightly
Disagree
Slightly
Agree
Strongly
Agree
36. The transition of leadership
was smooth, and there were no
disruptions in the business
Strongly
Disagree
Slightly
Disagree
Slightly
Agree
Strongly
Agree
105
VITA
Steven Thomas Perret has served as president of Letterman's, his family business
based in Baton Rouge, Louisiana, since 2005. Letterman's is Louisiana's largest privately
owned full-service reprographics company, offering custom document management and
technology solutions to the design and construction industry.
While working in the family business, he has continued his education by pursuing
pertinent graduate degrees. He earned a Master of Business Administration degree at
Louisiana State University (LSU) in 2010 and is a candidate to receive his Ph.D. in
Human Resource and Leadership Development in May 2016. In combination, these
degrees focus on two aspects of an organization: the management of operations and the
management of human capital, giving him a depth of understanding and insight into both
aspects.