Successful Green Infrastructure Planning: A Micro … · 3 Imagine the result Successful Green...
36
Successful Green Infrastructure Planning: A Micro-Scale Modeling and Field Investigation Approach Imagine the result Hazem Gheith and Vinnie Treatment, Water Division, ARCADIS-US Hunter Kelly, Department of Sewage and Drainage , City of Columbus OWEA Conference 2013
Transcript of Successful Green Infrastructure Planning: A Micro … · 3 Imagine the result Successful Green...
Successful Green Infrastructure Planning: A Micro-Scale Modeling and Field Investigation Approach
Imagine the result
Hazem Gheith and Vinnie Treatment, Water Division, ARCADIS-US
Hunter Kelly, Department of Sewage and Drainage , City of Columbus
OWEA Conference 2013
2 Imagine the result
Successful Green Infrastructure Planning: A Micro-Scale Modeling and Field Investigation Approach – June 20, 2013
Topics
• City of Columbus Integrated Plan
• IP Pilot Area: Upper Olentangy basin
• Grey Solution
• Green Solution
• Green Infrastructures SWMM Modeling
• Results and Recommendations
3 Imagine the result
Successful Green Infrastructure Planning: A Micro-Scale Modeling and Field Investigation Approach – June 20, 2013
Topics
• City of Columbus Integrated Plan
• IP Pilot Area: Upper Olentangy basin
• Grey Solution
• Green Solution
• Green Infrastructures SWMM Modeling
• Results and Recommendations
4 Imagine the result
Successful Green Infrastructure Planning: A Micro-Scale Modeling and Field Investigation Approach – June 20, 2013
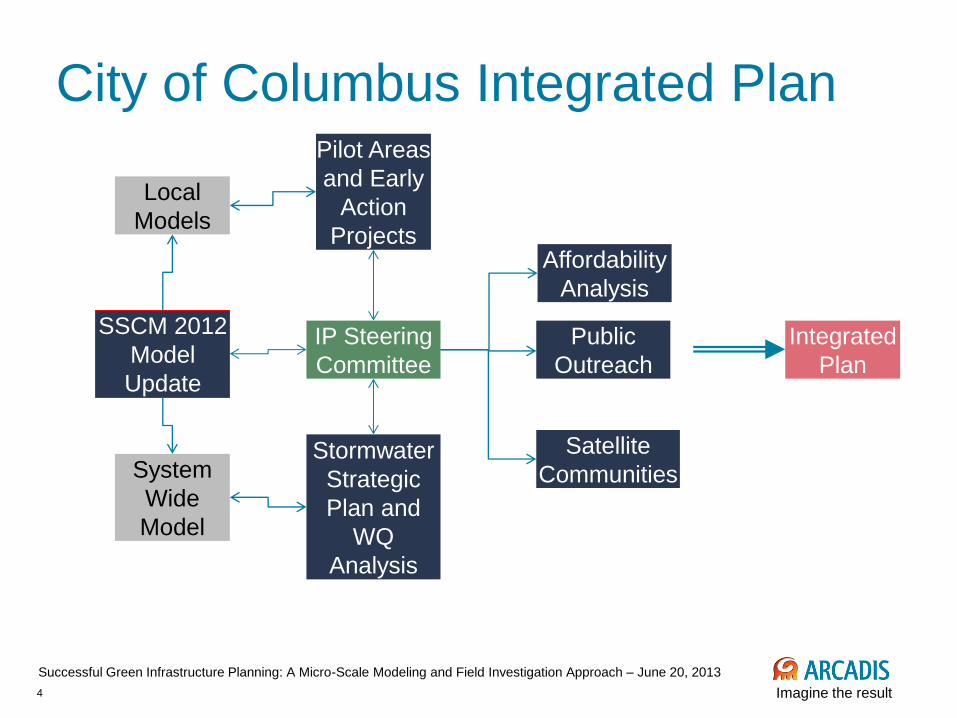
City of Columbus Integrated Plan
SSCM 2012
Model
Update
Pilot Areas
and Early
Action
Projects
Local
Models
System
Wide
Model
Affordability
Analysis
Stormwater
Strategic
Plan and
WQ
Analysis
Public
Outreach
Satellite
Communities
Integrated
Plan
IP Steering
Committee
5 Imagine the result
Successful Green Infrastructure Planning: A Micro-Scale Modeling and Field Investigation Approach – June 20, 2013
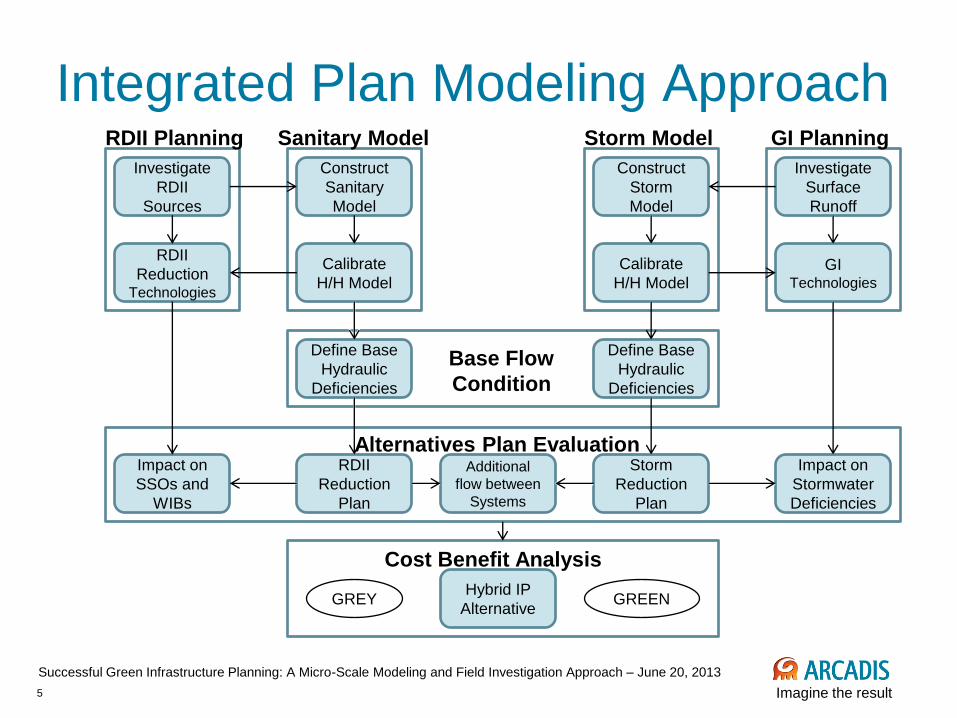
Integrated Plan Modeling Approach
RDII
Reduction
Plan
Additional
flow between
Systems
Construct
Storm
Model
Calibrate
H/H Model
Investigate
Surface
Runoff
Define Base
Hydraulic
Deficiencies
Storm
Reduction
Plan
GI Technologies
Impact on
Stormwater
Deficiencies
Construct
Sanitary
Model
Calibrate
H/H Model
Investigate
RDII
Sources
RDII
Reduction Technologies
Impact on
SSOs and
WIBs
Sanitary Model RDII Planning Storm Model GI Planning
Base Flow
Condition
Define Base
Hydraulic
Deficiencies
Alternatives Plan Evaluation
GREY Hybrid IP
Alternative GREEN
Cost Benefit Analysis

6 Imagine the result
Successful Green Infrastructure Planning: A Micro-Scale Modeling and Field Investigation Approach – June 20, 2013
City of Columbus WWMP Status
• Two Consent orders
• 2002: Remediation to SSOs
• 2004: Remediation to CSOs
• WWMP 2005
• 40 years schedule
• Three Tunnels
• Local storages
• Storm redirection projects
• OEPA approved WWMP in 2009
• 2012: OEPA approved to delay
ART and ORT. An integrated Plan
is due in September 2015.
7 Imagine the result
Successful Green Infrastructure Planning: A Micro-Scale Modeling and Field Investigation Approach – June 20, 2013
Topics
• City of Columbus Integrated Plan
• IP Pilot Area: Upper Olentangy basin
• Grey Solution
• Green Solution
• Green Infrastructures SWMM Modeling
• Results and Recommendations
8 Imagine the result
Successful Green Infrastructure Planning: A Micro-Scale Modeling and Field Investigation Approach – June 20, 2013
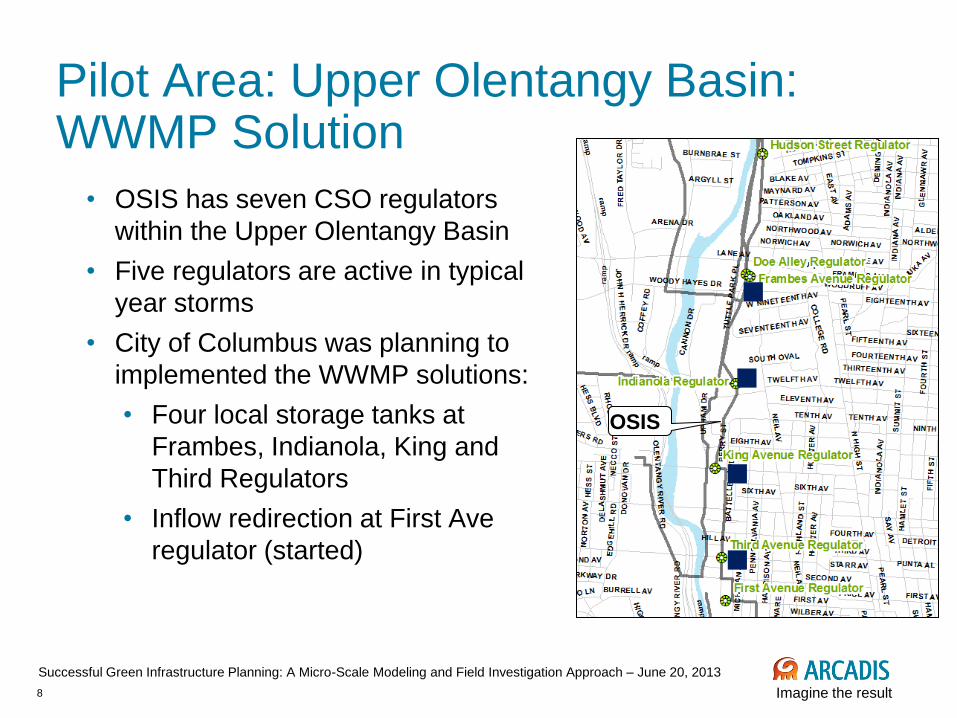
Pilot Area: Upper Olentangy Basin: WWMP Solution
• OSIS has seven CSO regulators
within the Upper Olentangy Basin
• Five regulators are active in typical
year storms
• City of Columbus was planning to
implemented the WWMP solutions:
• Four local storage tanks at
Frambes, Indianola, King and
Third Regulators
• Inflow redirection at First Ave
regulator (started)
OSIS

9 Imagine the result
Successful Green Infrastructure Planning: A Micro-Scale Modeling and Field Investigation Approach – June 20, 2013
Pilot Area: Upper Olentangy Basin Enhanced Grey Solution
• Alternative 1:
• Storages at Indianola and King Regulators
• Increase capture pipe at Frambes and Third Regulators
• Alternative 2:
• One Storage at Indianola Regulator
• Increase capture pipe at Frambes and Third Regulators
• Raise weir at King Regulator
10 Imagine the result
Successful Green Infrastructure Planning: A Micro-Scale Modeling and Field Investigation Approach – June 20, 2013
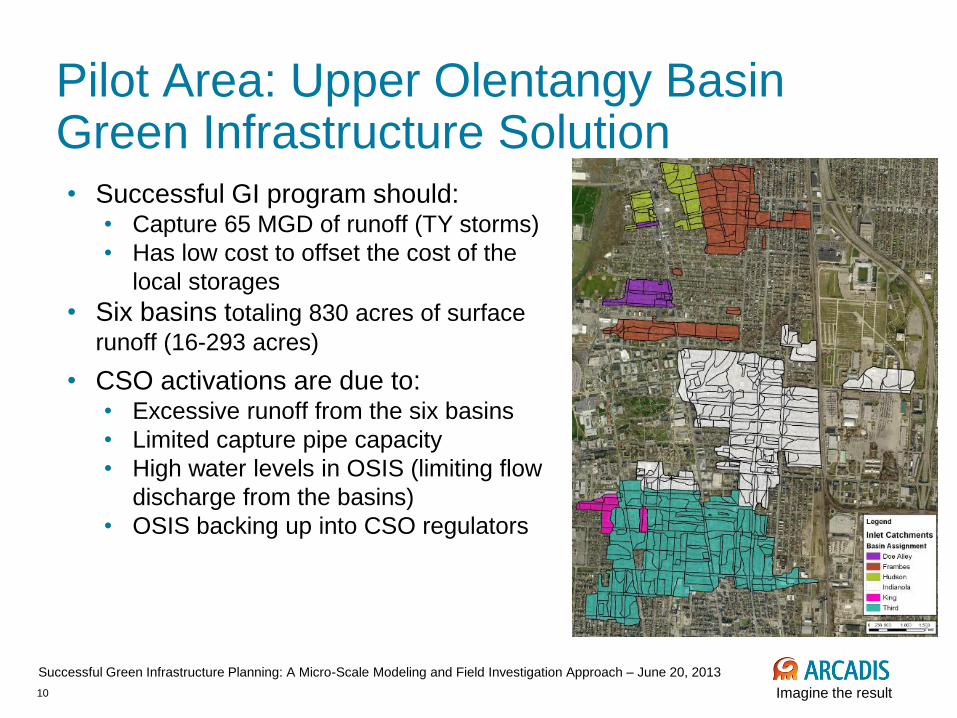
• Successful GI program should: • Capture 65 MGD of runoff (TY storms)
• Has low cost to offset the cost of the
local storages
• Six basins totaling 830 acres of surface
runoff (16-293 acres)
• CSO activations are due to: • Excessive runoff from the six basins
• Limited capture pipe capacity
• High water levels in OSIS (limiting flow
discharge from the basins)
• OSIS backing up into CSO regulators
Pilot Area: Upper Olentangy Basin Green Infrastructure Solution
11 Imagine the result
Successful Green Infrastructure Planning: A Micro-Scale Modeling and Field Investigation Approach – June 20, 2013
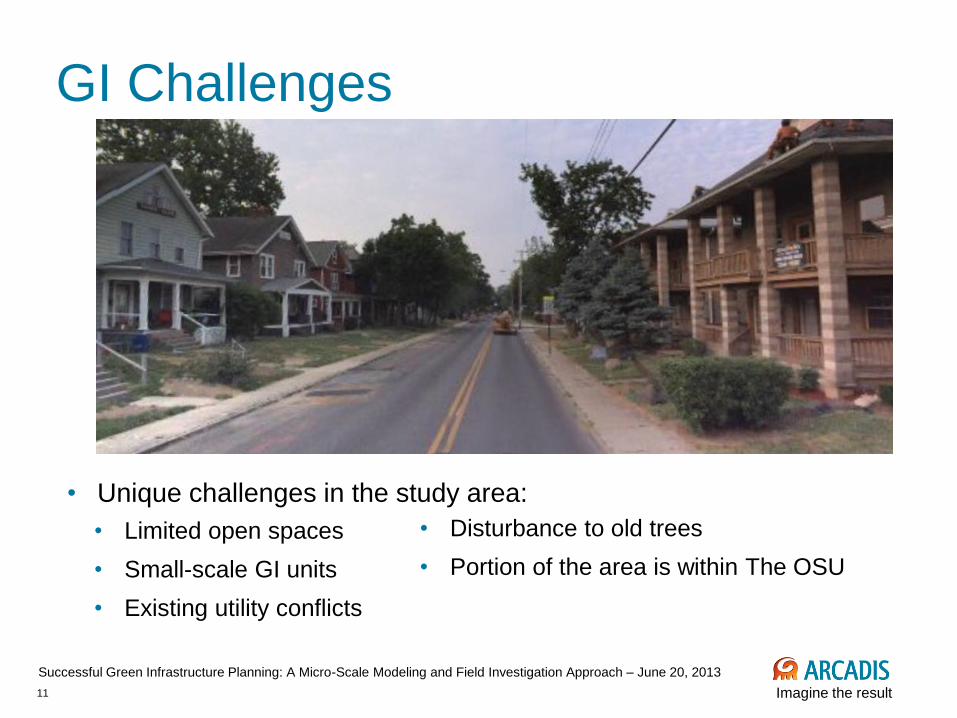
GI Challenges
• Unique challenges in the study area:
• Limited open spaces
• Small-scale GI units
• Existing utility conflicts
• Disturbance to old trees
• Portion of the area is within The OSU
12 Imagine the result
Successful Green Infrastructure Planning: A Micro-Scale Modeling and Field Investigation Approach – June 20, 2013
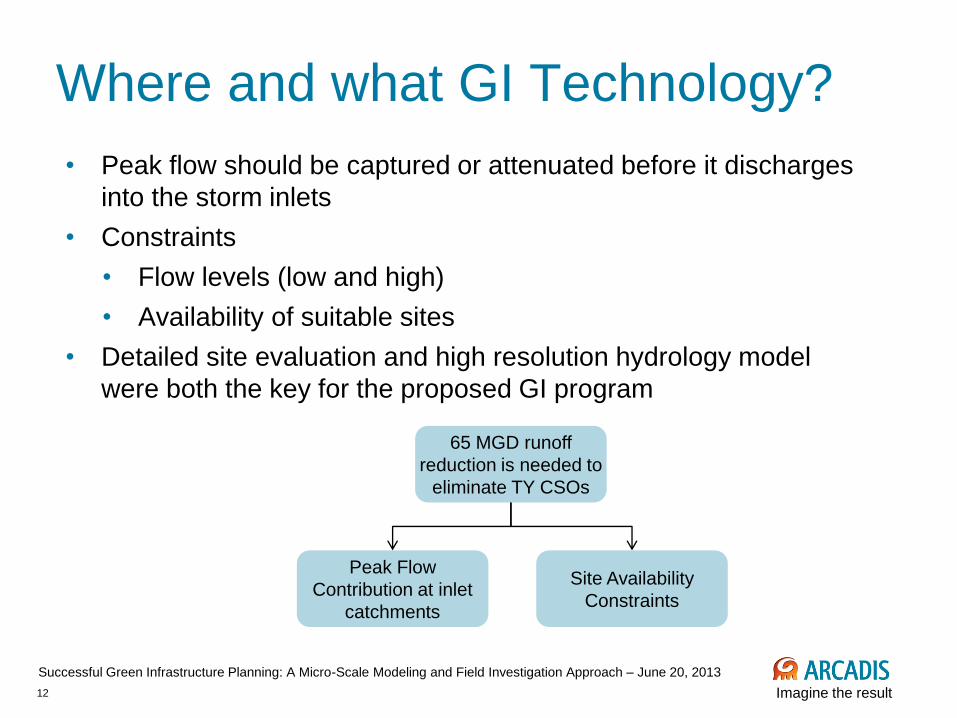
Where and what GI Technology?
• Peak flow should be captured or attenuated before it discharges
into the storm inlets
• Constraints
• Flow levels (low and high)
• Availability of suitable sites
• Detailed site evaluation and high resolution hydrology model
were both the key for the proposed GI program
65 MGD runoff
reduction is needed to
eliminate TY CSOs
Site Availability
Constraints
Peak Flow
Contribution at inlet
catchments
13 Imagine the result
Successful Green Infrastructure Planning: A Micro-Scale Modeling and Field Investigation Approach – June 20, 2013
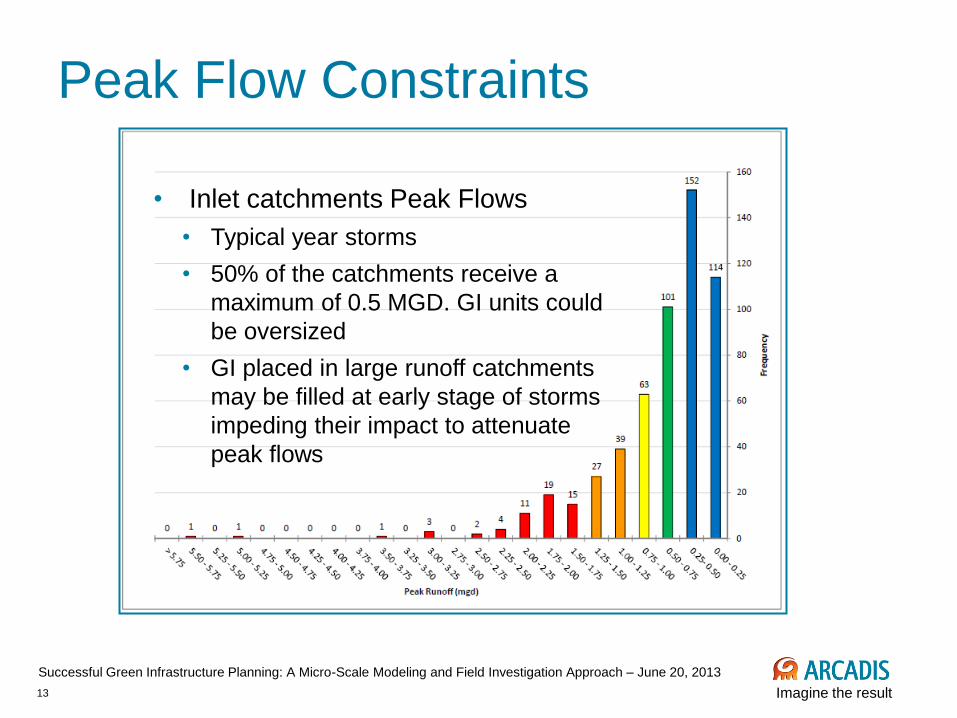
Peak Flow Constraints
• Inlet catchments Peak Flows
• Typical year storms
• 50% of the catchments receive a
maximum of 0.5 MGD. GI units could
be oversized
• GI placed in large runoff catchments
may be filled at early stage of storms
impeding their impact to attenuate
peak flows
14 Imagine the result
Successful Green Infrastructure Planning: A Micro-Scale Modeling and Field Investigation Approach – June 20, 2013
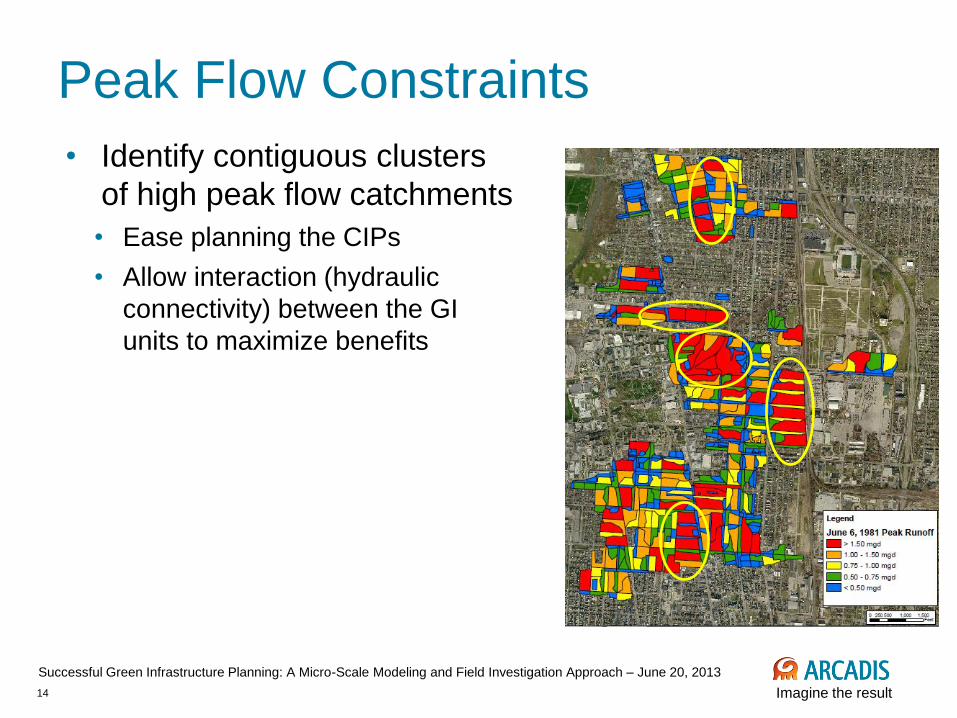
• Identify contiguous clusters
of high peak flow catchments
• Ease planning the CIPs
• Allow interaction (hydraulic
connectivity) between the GI
units to maximize benefits
Peak Flow Constraints
15 Imagine the result
Successful Green Infrastructure Planning: A Micro-Scale Modeling and Field Investigation Approach – June 20, 2013
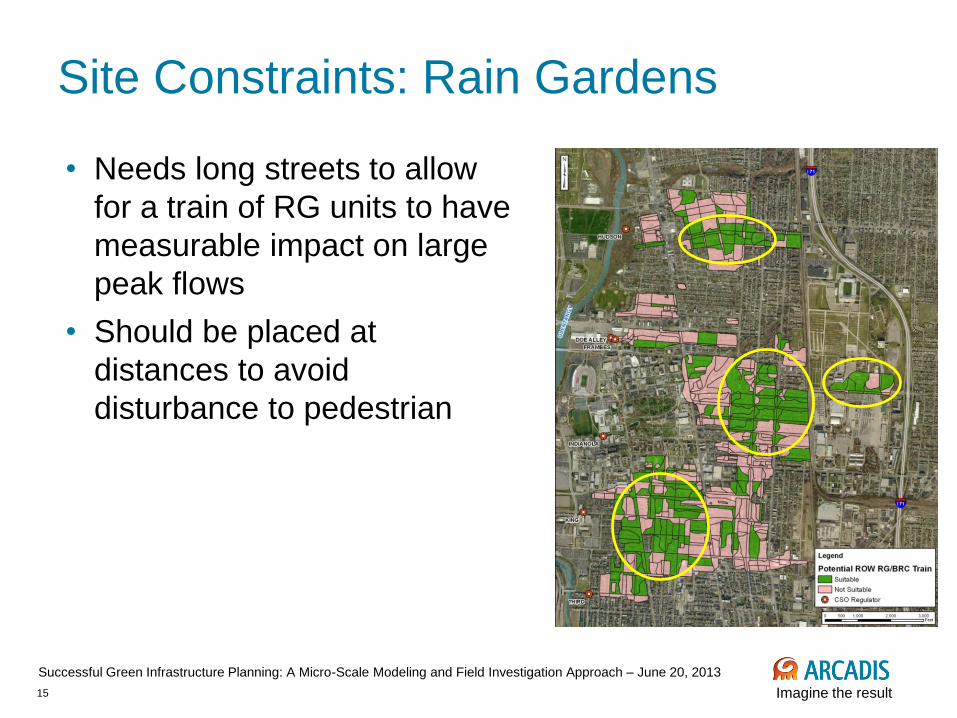
Site Constraints: Rain Gardens
• Needs long streets to allow
for a train of RG units to have
measurable impact on large
peak flows
• Should be placed at
distances to avoid
disturbance to pedestrian
16 Imagine the result
Successful Green Infrastructure Planning: A Micro-Scale Modeling and Field Investigation Approach – June 20, 2013
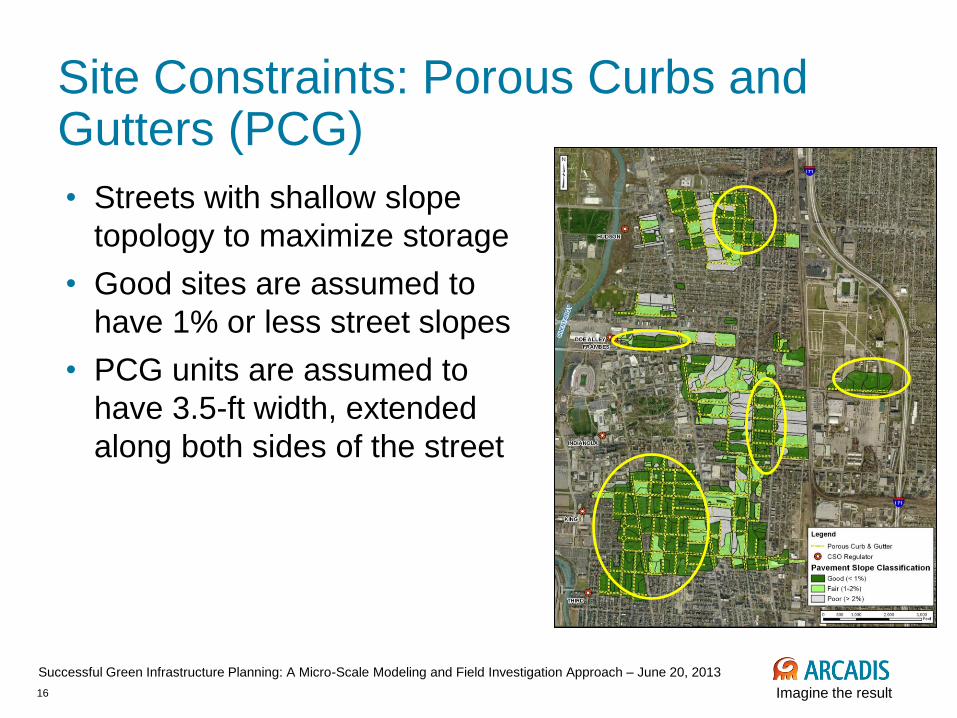
Site Constraints: Porous Curbs and Gutters (PCG)
• Streets with shallow slope
topology to maximize storage
• Good sites are assumed to
have 1% or less street slopes
• PCG units are assumed to
have 3.5-ft width, extended
along both sides of the street
17 Imagine the result
Successful Green Infrastructure Planning: A Micro-Scale Modeling and Field Investigation Approach – June 20, 2013
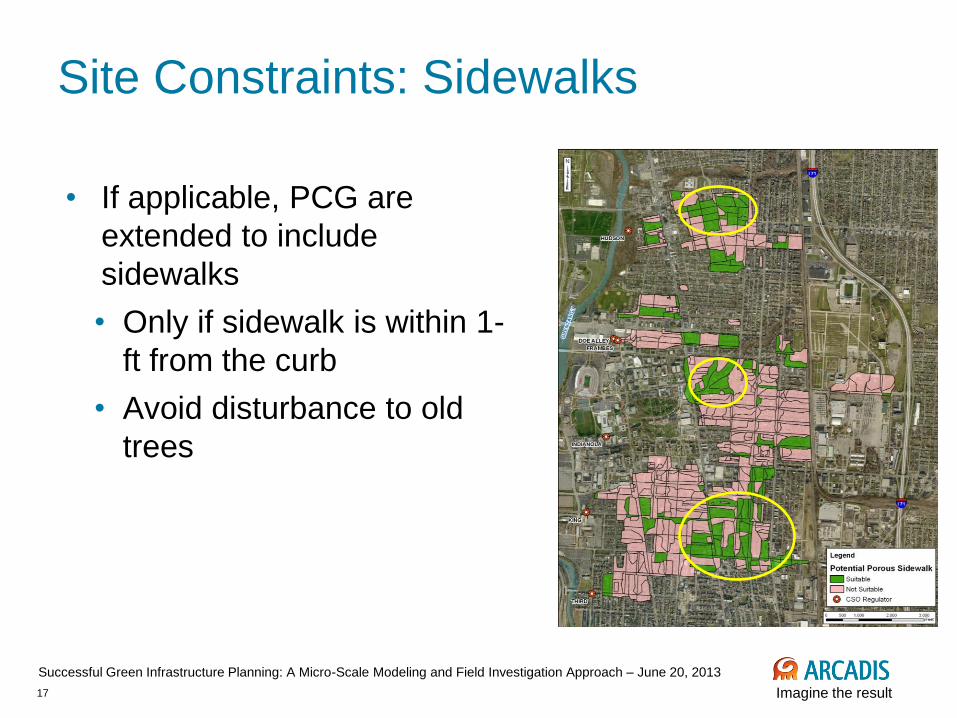
Site Constraints: Sidewalks
• If applicable, PCG are
extended to include
sidewalks
• Only if sidewalk is within 1-
ft from the curb
• Avoid disturbance to old
trees
18 Imagine the result
Successful Green Infrastructure Planning: A Micro-Scale Modeling and Field Investigation Approach – June 20, 2013
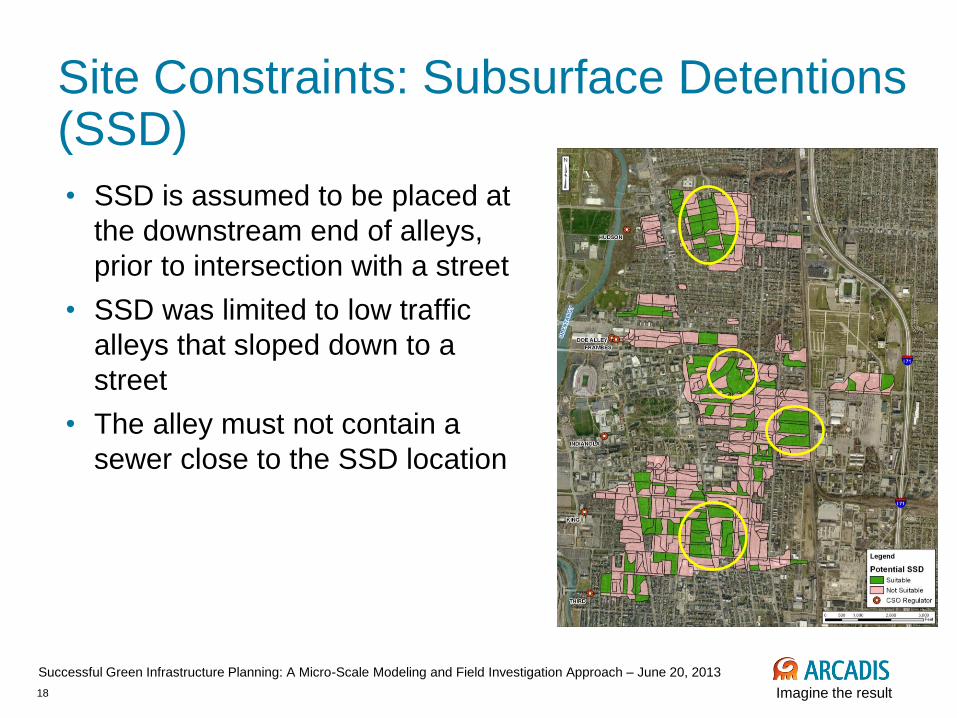
Site Constraints: Subsurface Detentions (SSD)
• SSD is assumed to be placed at
the downstream end of alleys,
prior to intersection with a street
• SSD was limited to low traffic
alleys that sloped down to a
street
• The alley must not contain a
sewer close to the SSD location
19 Imagine the result
Successful Green Infrastructure Planning: A Micro-Scale Modeling and Field Investigation Approach – June 20, 2013
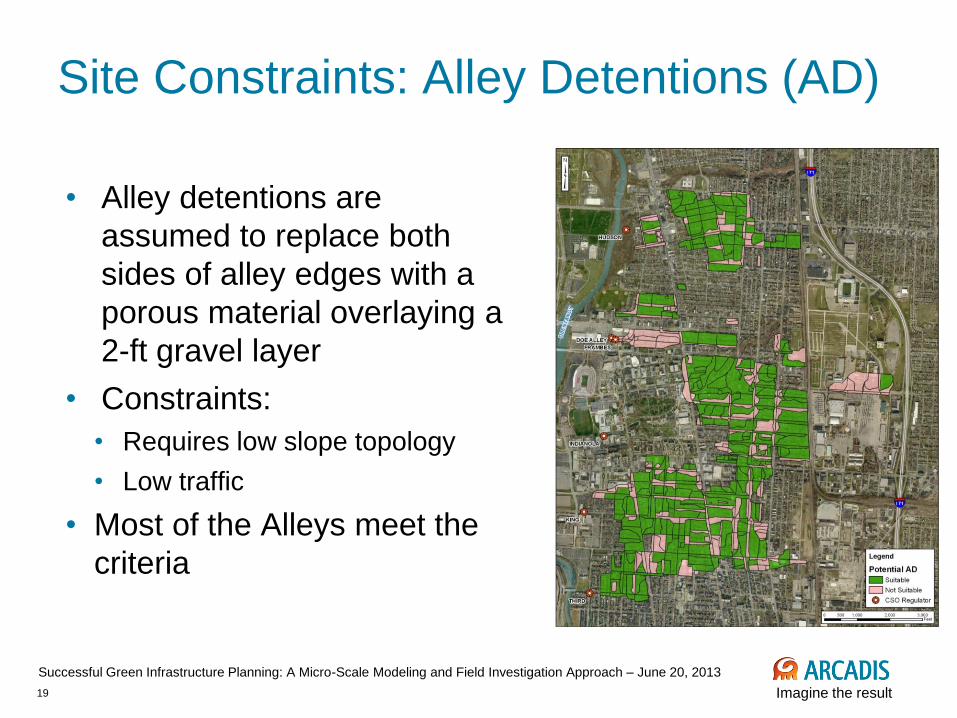
Site Constraints: Alley Detentions (AD)
• Alley detentions are
assumed to replace both
sides of alley edges with a
porous material overlaying a
2-ft gravel layer
• Constraints:
• Requires low slope topology
• Low traffic
• Most of the Alleys meet the
criteria
20 Imagine the result
Successful Green Infrastructure Planning: A Micro-Scale Modeling and Field Investigation Approach – June 20, 2013
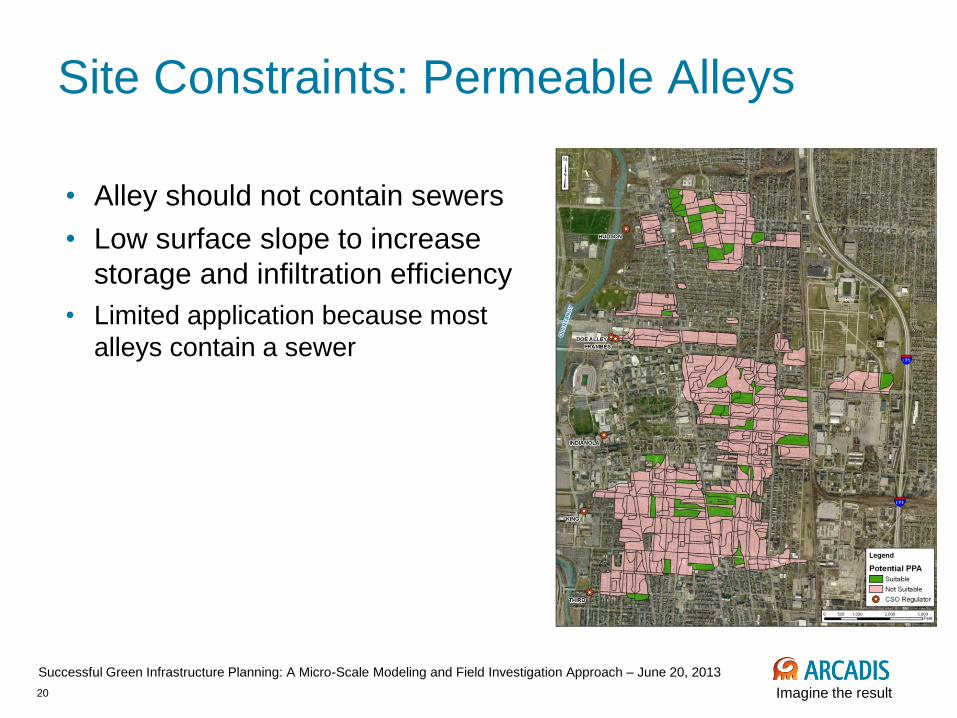
Site Constraints: Permeable Alleys
• Alley should not contain sewers
• Low surface slope to increase
storage and infiltration efficiency
• Limited application because most
alleys contain a sewer
21 Imagine the result
Successful Green Infrastructure Planning: A Micro-Scale Modeling and Field Investigation Approach – June 20, 2013
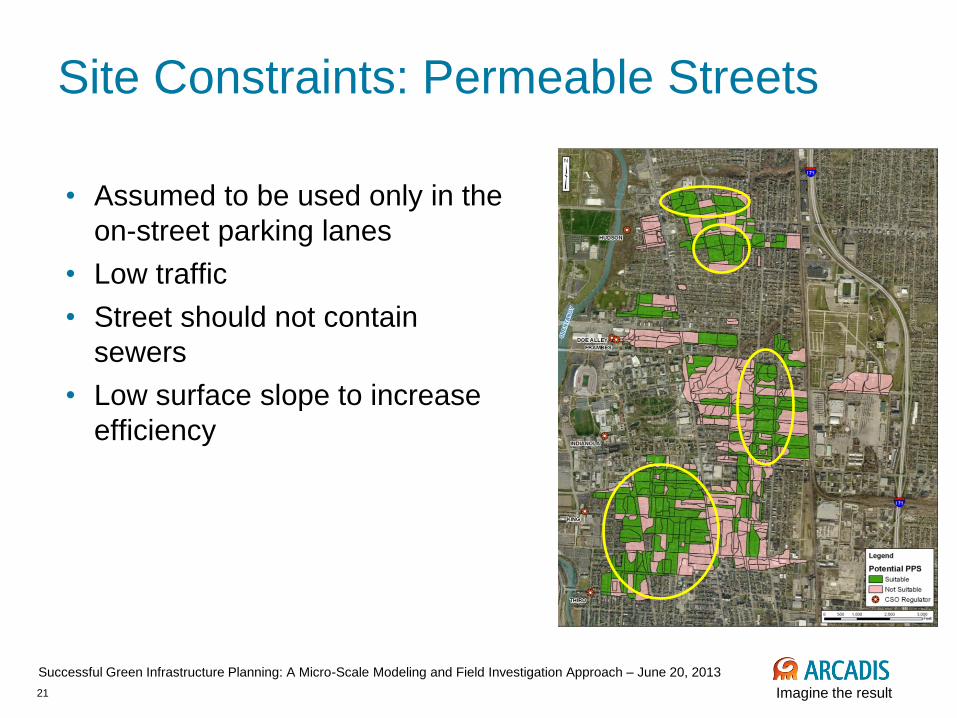
Site Constraints: Permeable Streets
• Assumed to be used only in the
on-street parking lanes
• Low traffic
• Street should not contain
sewers
• Low surface slope to increase
efficiency
22 Imagine the result
Successful Green Infrastructure Planning: A Micro-Scale Modeling and Field Investigation Approach – June 20, 2013
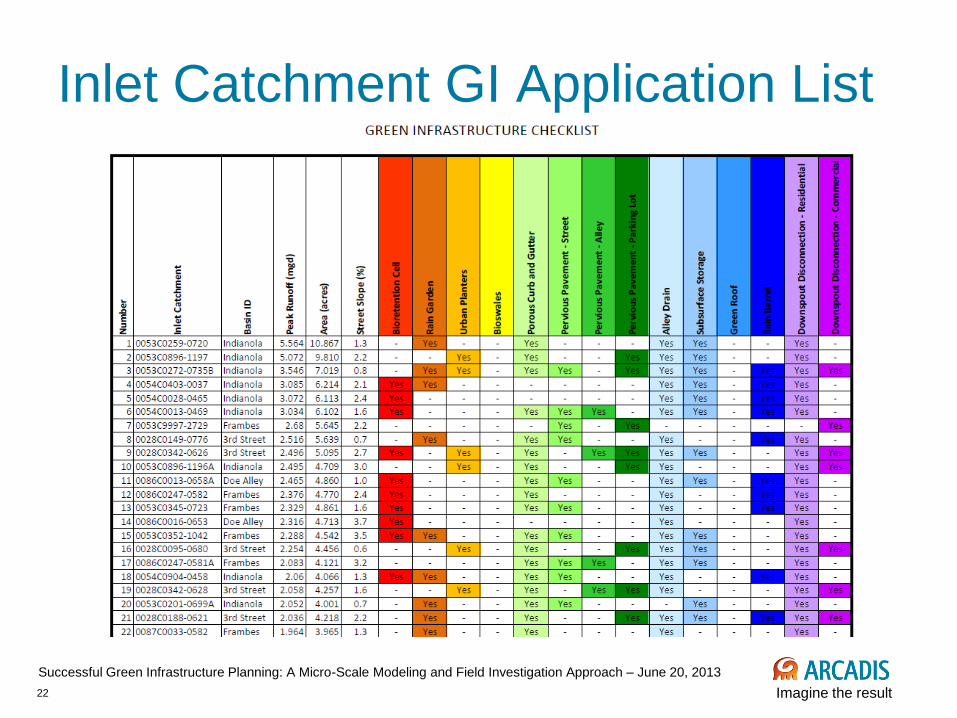
Inlet Catchment GI Application List
23 Imagine the result
Successful Green Infrastructure Planning: A Micro-Scale Modeling and Field Investigation Approach – June 20, 2013
Topics
• City of Columbus Integrated Plan
• Pilot Area: Upper Olentangy basin
• Grey Solution
• Green Solution
• Green Infrastructures SWMM Modeling
• Results and Recommendations
24 Imagine the result
Successful Green Infrastructure Planning: A Micro-Scale Modeling and Field Investigation Approach – June 20, 2013
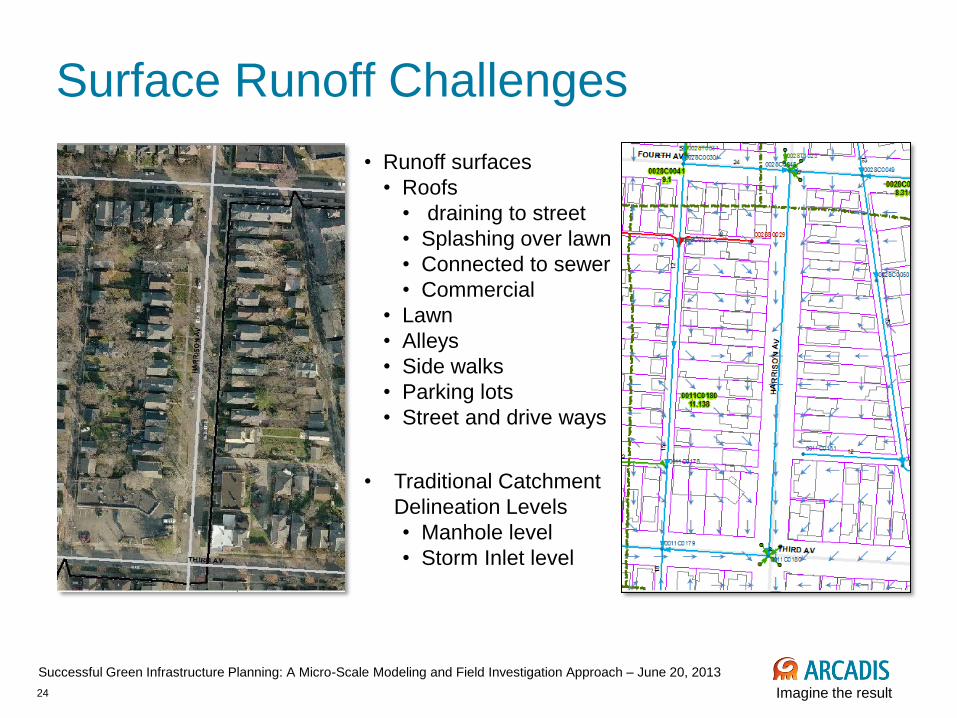
Surface Runoff Challenges
• Runoff surfaces
• Roofs
• draining to street
• Splashing over lawn
• Connected to sewer
• Commercial
• Lawn
• Alleys
• Side walks
• Parking lots
• Street and drive ways
• Traditional Catchment
Delineation Levels
• Manhole level
• Storm Inlet level
25 Imagine the result
Successful Green Infrastructure Planning: A Micro-Scale Modeling and Field Investigation Approach – June 20, 2013
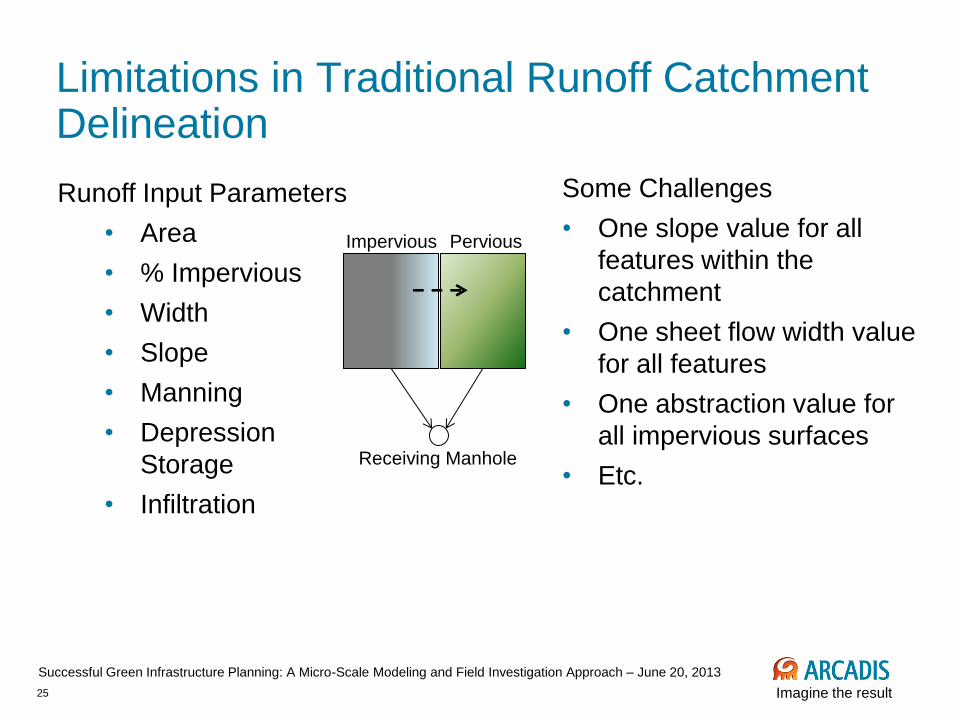
Runoff Input Parameters
• Area
• % Impervious
• Width
• Slope
• Manning
• Depression
Storage
• Infiltration
Limitations in Traditional Runoff Catchment Delineation
Some Challenges
• One slope value for all
features within the
catchment
• One sheet flow width value
for all features
• One abstraction value for
all impervious surfaces
• Etc.
Impervious Pervious
Receiving Manhole
26 Imagine the result
Successful Green Infrastructure Planning: A Micro-Scale Modeling and Field Investigation Approach – June 20, 2013
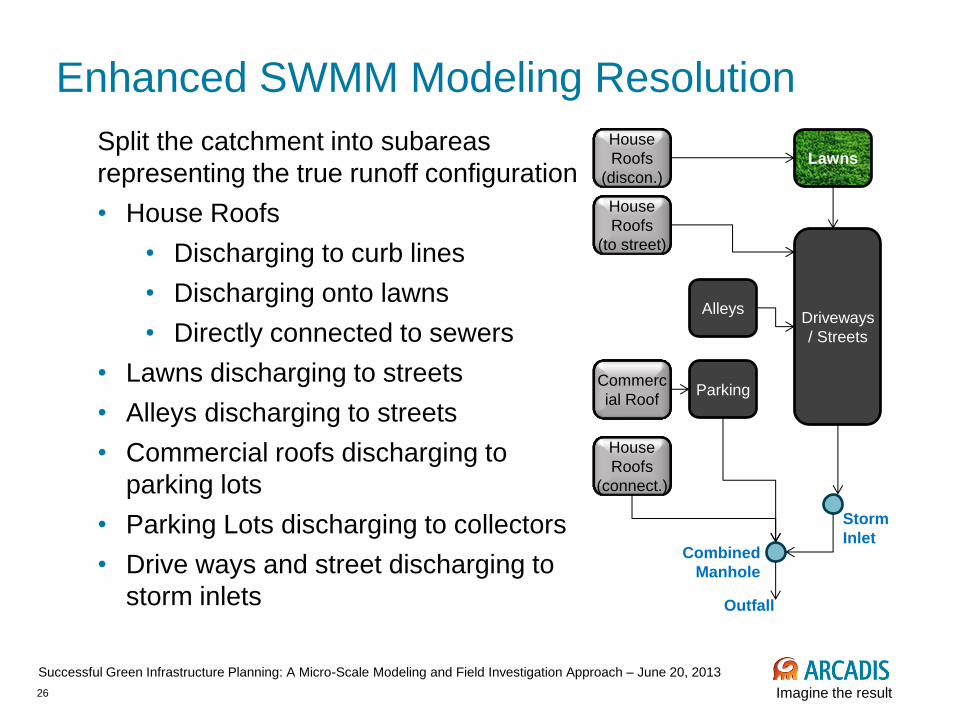
Enhanced SWMM Modeling Resolution
Lawns
Driveways
/ Streets
House
Roofs
(discon.)
Combined
Manhole
Storm
Inlet
House
Roofs
(to street)
Commerc
ial Roof Parking
House
Roofs
(connect.)
Outfall
Alleys
Split the catchment into subareas
representing the true runoff configuration
• House Roofs
• Discharging to curb lines
• Discharging onto lawns
• Directly connected to sewers
• Lawns discharging to streets
• Alleys discharging to streets
• Commercial roofs discharging to
parking lots
• Parking Lots discharging to collectors
• Drive ways and street discharging to
storm inlets
27 Imagine the result
Successful Green Infrastructure Planning: A Micro-Scale Modeling and Field Investigation Approach – June 20, 2013
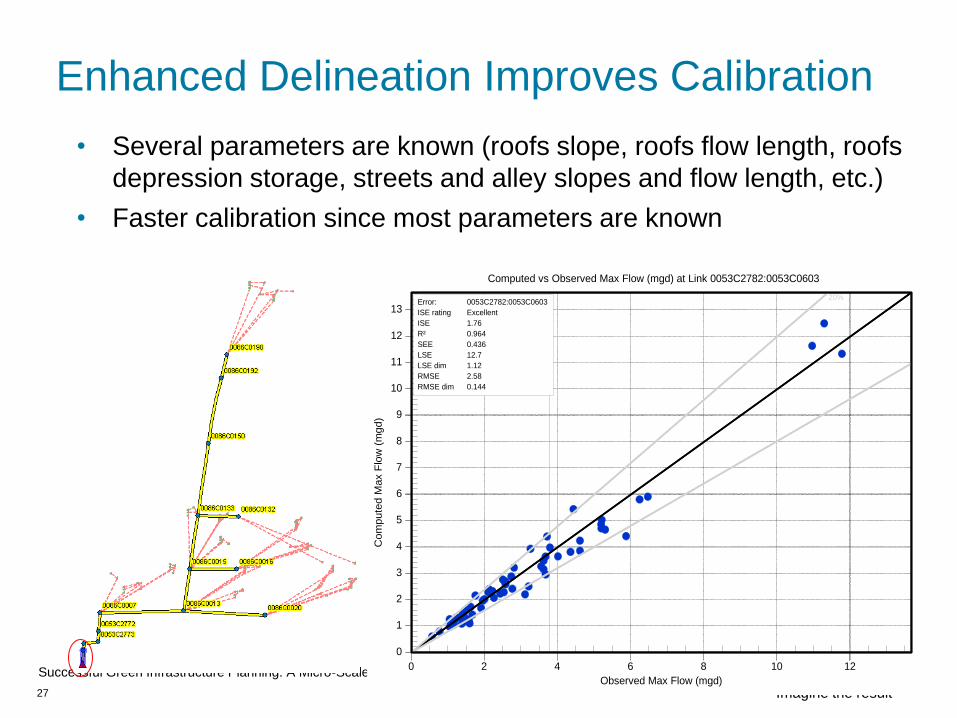
Enhanced Delineation Improves Calibration
• Several parameters are known (roofs slope, roofs flow length, roofs
depression storage, streets and alley slopes and flow length, etc.)
• Faster calibration since most parameters are known
20%Error:
ISE rating
ISE
R²
SEE
LSE
LSE dim
RMSE
RMSE dim
0053C2782:0053C0603
Excellent
1.76
0.964
0.436
12.7
1.12
2.58
0.144
0
1
2
3
4
5
6
7
8
9
10
11
12
13
0 2 4 6 8 10 12
Computed vs Observed Max Flow (mgd) at Link 0053C2782:0053C0603
Com
pute
d M
ax F
low
(m
gd)
Observed Max Flow (mgd)
28 Imagine the result
Successful Green Infrastructure Planning: A Micro-Scale Modeling and Field Investigation Approach – June 20, 2013
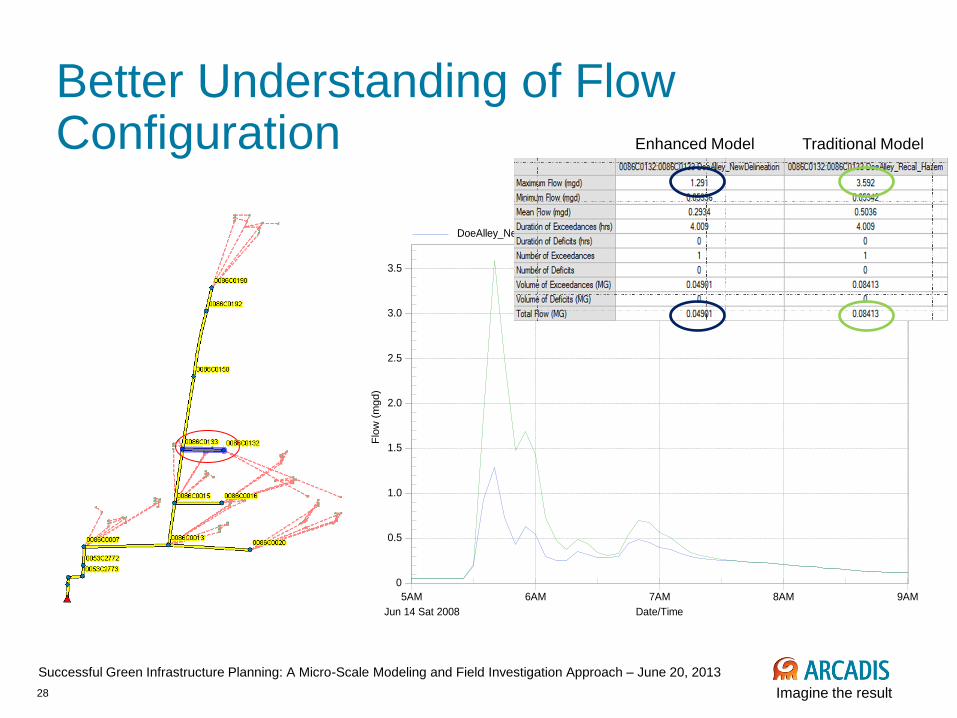
Better Understanding of Flow Configuration
0
0.5
1.0
1.5
2.0
2.5
3.0
3.5
5AM
Jun 14 Sat 2008
6AM 7AM 8AM 9AM
Link 0086C0132:0086C0133
Flo
w (
mgd)
Date/Time
DoeAlley_NewDelineation 0086C0132:0086C0133 DoeAlley_Recal_Hazem
Enhanced Model Traditional Model
29 Imagine the result
Successful Green Infrastructure Planning: A Micro-Scale Modeling and Field Investigation Approach – June 20, 2013
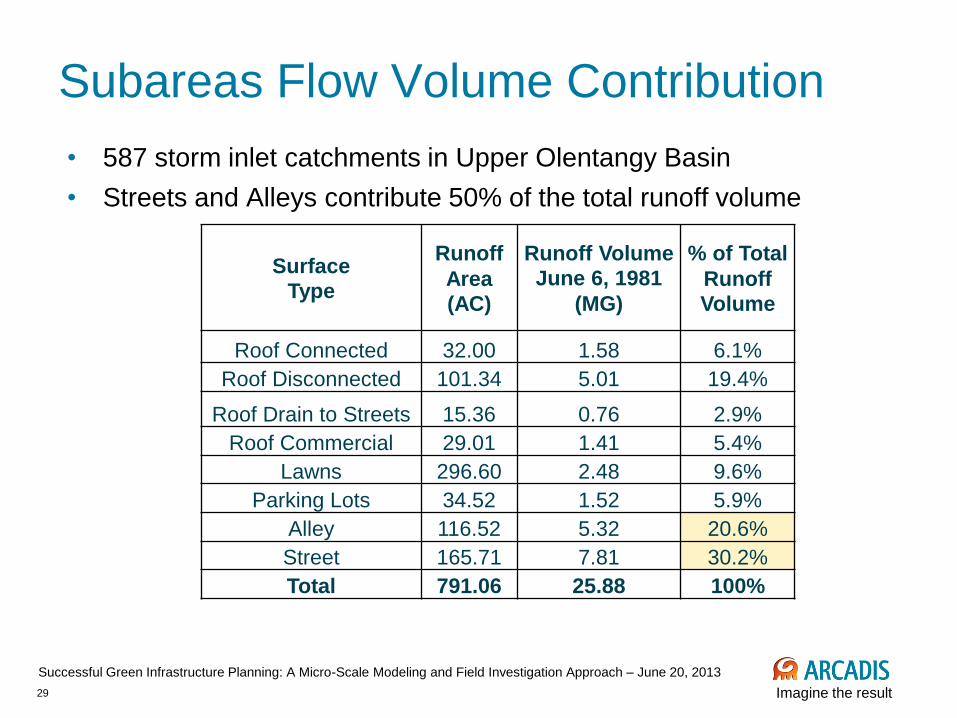
Subareas Flow Volume Contribution
• 587 storm inlet catchments in Upper Olentangy Basin
• Streets and Alleys contribute 50% of the total runoff volume
Surface Type
Runoff
Area
(AC)
Runoff Volume
June 6, 1981 (MG)
% of Total
Runoff
Volume
Roof Connected 32.00 1.58 6.1%
Roof Disconnected 101.34 5.01 19.4%
Roof Drain to Streets 15.36 0.76 2.9%
Roof Commercial 29.01 1.41 5.4%
Lawns 296.60 2.48 9.6%
Parking Lots 34.52 1.52 5.9%
Alley 116.52 5.32 20.6%
Street 165.71 7.81 30.2%
Total 791.06 25.88 100%
30 Imagine the result
Successful Green Infrastructure Planning: A Micro-Scale Modeling and Field Investigation Approach – June 20, 2013
Topics
• City of Columbus Integrated Plan
• Pilot Area: Upper Olentangy basin
• Grey Solution
• Green Solution
• Green Infrastructures SWMM Modeling
• Results and Recommendations
31 Imagine the result
Successful Green Infrastructure Planning: A Micro-Scale Modeling and Field Investigation Approach – June 20, 2013
Rainfall Receiving
Waters Collection
System Urbanized land
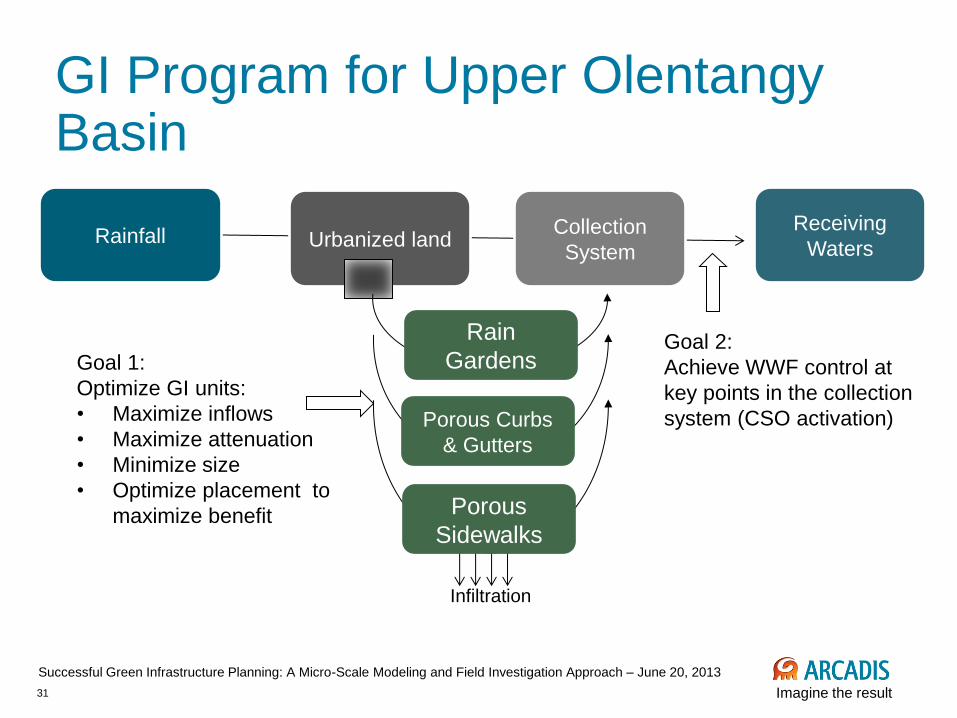
GI Program for Upper Olentangy Basin
Goal 1:
Optimize GI units:
• Maximize inflows
• Maximize attenuation
• Minimize size
• Optimize placement to
maximize benefit
Goal 2:
Achieve WWF control at
key points in the collection
system (CSO activation)
Infiltration
Rain
Gardens
Porous Curbs
& Gutters
Porous
Sidewalks
32 Imagine the result
Successful Green Infrastructure Planning: A Micro-Scale Modeling and Field Investigation Approach – June 20, 2013
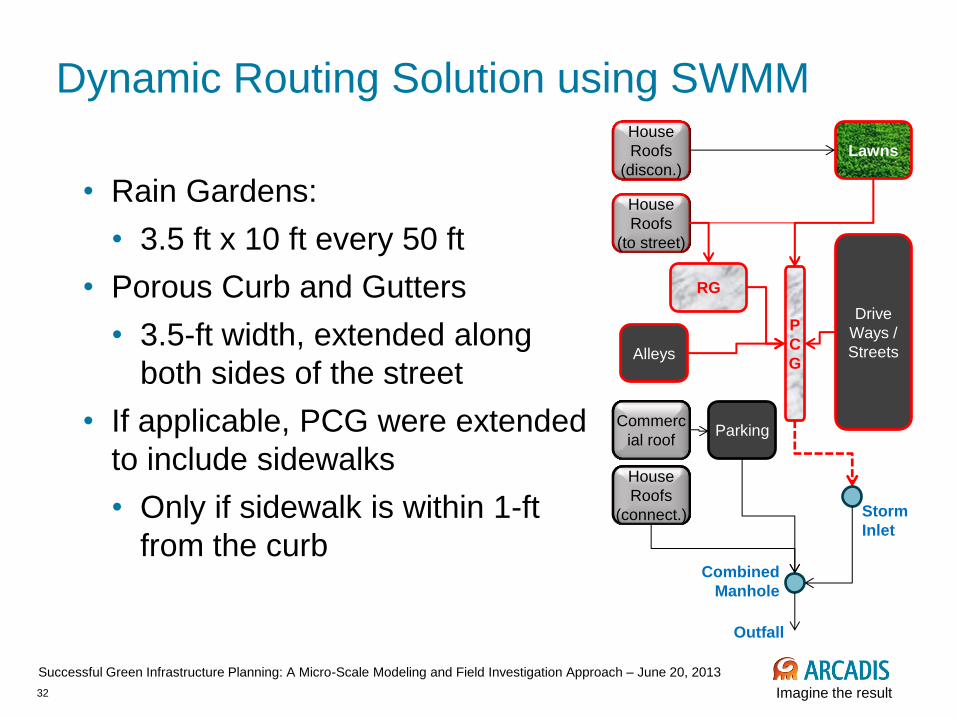
Dynamic Routing Solution using SWMM
Lawns
Drive
Ways /
Streets
House
Roofs
(discon.)
Combined
Manhole
Storm
Inlet
House
Roofs
(to street)
Commerc
ial roof Parking
House
Roofs
(connect.)
Outfall
Alleys
P
C
G
RG
• Rain Gardens:
• 3.5 ft x 10 ft every 50 ft
• Porous Curb and Gutters
• 3.5-ft width, extended along
both sides of the street
• If applicable, PCG were extended
to include sidewalks
• Only if sidewalk is within 1-ft
from the curb
33 Imagine the result
Successful Green Infrastructure Planning: A Micro-Scale Modeling and Field Investigation Approach – June 20, 2013
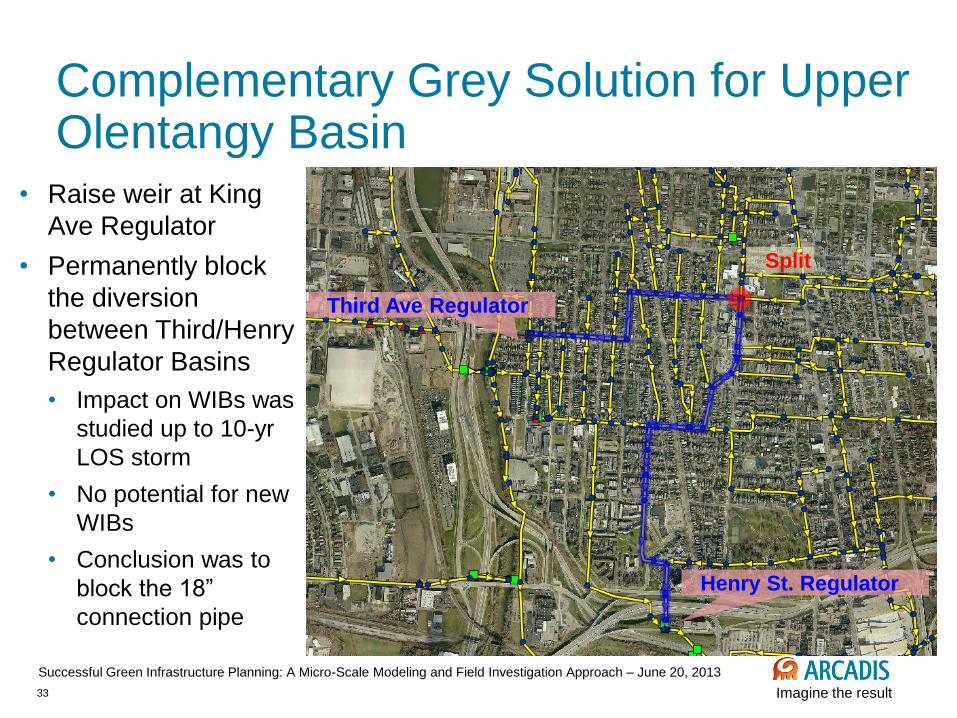
Split
Henry St. Regulator
Third Ave Regulator
Complementary Grey Solution for Upper Olentangy Basin
• Raise weir at King
Ave Regulator
• Permanently block
the diversion
between Third/Henry
Regulator Basins
• Impact on WIBs was
studied up to 10-yr
LOS storm
• No potential for new
WIBs
• Conclusion was to
block the 18”
connection pipe
34 Imagine the result
Successful Green Infrastructure Planning: A Micro-Scale Modeling and Field Investigation Approach – June 20, 2013
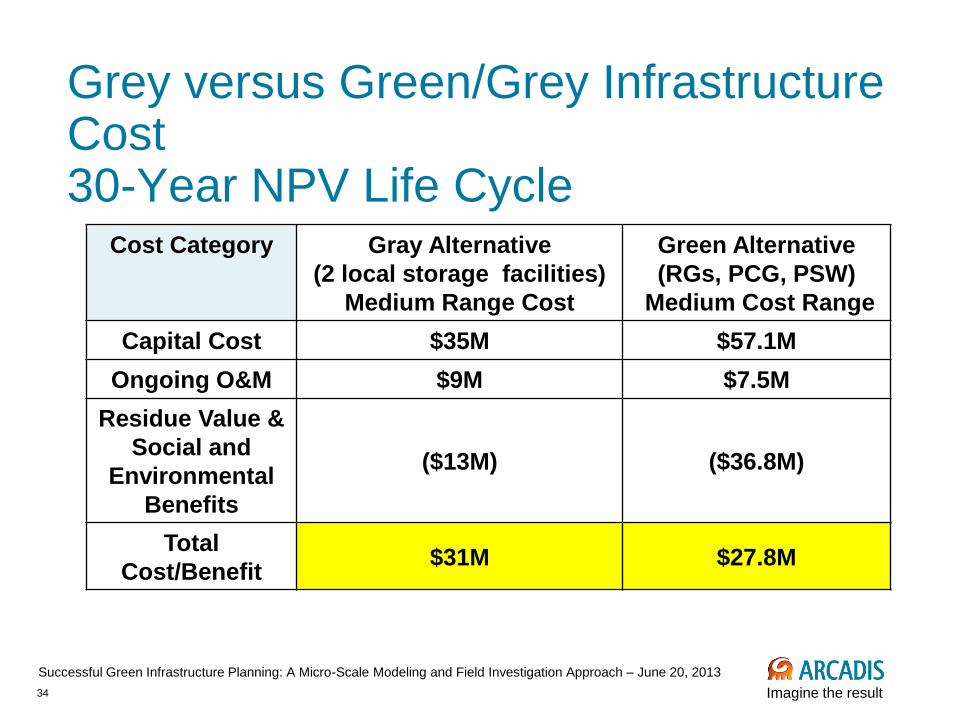
Grey versus Green/Grey Infrastructure Cost 30-Year NPV Life Cycle
Cost Category Gray Alternative
(2 local storage facilities)
Medium Range Cost
Green Alternative
(RGs, PCG, PSW)
Medium Cost Range
Capital Cost $35M $57.1M
Ongoing O&M $9M $7.5M
Residue Value &
Social and
Environmental
Benefits
($13M) ($36.8M)
Total
Cost/Benefit $31M $27.8M
35 Imagine the result
Successful Green Infrastructure Planning: A Micro-Scale Modeling and Field Investigation Approach – June 20, 2013
Conclusion • A green infrastructure program in the Upper
Olentangy basins with minimal grey
improvements could offset the need of local
storage facilities
• An educated approach utilizing GIS tools
windshield surveys helped optimizing site
selection for the different GI units
• A higher resolution modeling approach is critical
in understanding the dynamic performance and
sizing GI units
Imagine the result
Successful Green Infrastructure Planning: A Micro-Scale Modeling and Field Investigation Approach – June 20, 2013
36
Thank You Imagine the result