
Successful Biostimulation Treatment of PCE/TCE DNAPL at...
51
1 Successful Biostimulation Treatment of PCE/TCE DNAPL at Redevelopment Sites EKOS IV International Seminar on Remediation and Redevelopment of Contaminated Sites Andre Rebouças – ARCADIS Hidro Ambiente S/A
Transcript of Successful Biostimulation Treatment of PCE/TCE DNAPL at...

1
Successful Biostimulation Treatment of PCE/TCE DNAPLat Redevelopment Sites
EKOS IV International Seminar on Remediation and Redevelopment of Contaminated Sites
Andre Rebouças – ARCADIS Hidro Ambiente S/A

2
Business Reducing Risk
+
-
Remed
iation
Infra
struc
ture
Pre-D
evelo
pmen
t
New us
ers/m
arke
ts
Inves
tigati
on
value “as is” value after cleanup
Value
High risk / low profit zone of industrial property owners
Risk
Low risk/ high profit • Approved plan• Future users identified• Best/ highest use
determined • Remediation/risk
assessment completed/approved
Buildin
gs
value after development

3
Presentation Overview
• DNAPL Source Zone Characteristics – The Challenge
– Structure and cleanup problems associated with DNAPLs and other persistent contaminant sources
– The politics of DNAPL – Are regulators open to changing its approach to persistent source management?
- Adaptive design approaches- Alternative closure approaches- Alternatives for site development
• Case Studies - DNAPL Source Zones
• Conclusions and Implications
4
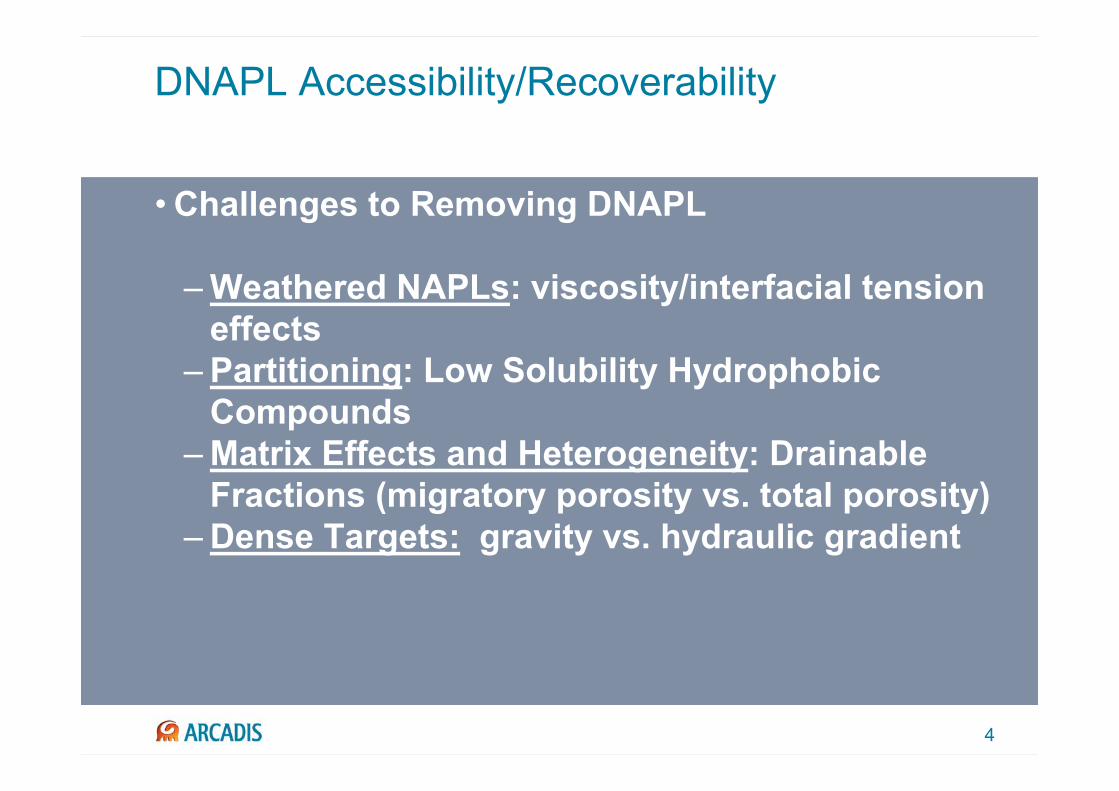
DNAPL Accessibility/Recoverability
• Challenges to Removing DNAPL
– Weathered NAPLs: viscosity/interfacial tension effects
– Partitioning: Low Solubility Hydrophobic Compounds
– Matrix Effects and Heterogeneity: Drainable Fractions (migratory porosity vs. total porosity)
– Dense Targets: gravity vs. hydraulic gradient

5
Potential Applicability of Biostimulation
Possible passive candidateDrain first then treat residual as needed
Drainable mixed DNAPL
No - drain first, then treat residualDrainable neat DNAPL
Low probability✓(possible passive)
Mixed DNAPL residual
Low probability✓Neat DNAPL residual
✓✓Sorbed phase
✓✓Dissolved phase
Achieve Standards in Groundwater
Reduce Long-Term Care Cost

6
Microbiology/Bio-Geochemistry
• Biostimulation- Electron donor loading
exceeding natural electron acceptor recharge
- Microbial ecology shift from aerobic to strongly anaerobic communities (sulfate-reducing and methanogenic)
- Fermentation reactions to enhance solubility of sorbed and NAPL mass

7
Reactive Zone Approach
0 1 2 3 4 5 6Time of travel (years)
Plan view
reactive zones
desorption zones
1 12

8
groundwater flow
Conceptual DNAPL Source Plume (Plan View)
Oil-saturated drainable
NAPL
water-saturated drainable NAPL
water-wetted residual NAPL
sorbed-phase-dominant zone
aqueous-phase-dominant zone
MCL

9
sorbed mass
drainable
residual
Aqu
ifer S
olve
nt M
ass
(kg/
m3 )
MCL
10-6
10-5
10-4
10-3
10-2
10-1
100
101
102
10310 mg/L
foc = 0.0051 mg/L
foc = 0.0001
mobile dissolved
phase
immobile dissolved
phase

10
Field Condition DNAPL - Transition from “Oil/Grease Dissolved in Solvent” to “Solvent Dissolved in Oil/Grease”
Neat PCE Neat TCEField
DNAPL 17% CVOC
Field DNAPL
<0.1% CVOCDensity (g/cm3)
Interfacial tension
(dynes/cm)
Dynamic viscosity
(cP)
1.63
44.4
1.47
34.5
0.844 0.444
1.05
11.6
10.4
1.04
14.3
51.7

11
The Aging Process - Mixed NAPLs Become Increasingly Inaccessible
Solv
ent L
each
ing
Rat
e
Solvent Mass Remaining100% 50% 0%
0
Max oil/grease dissolved in solvent
solvent dissolved in oil/grease

12
The Multi-Porosity Aquifer Matrix:NAPL Distribution and Fluid Mobility
Soil Particle
MIGRATORYW
ATER
Resident Water
Soil Organic Matter
MOVEMENT
Residual NAPL

13
Plan View
Total non-aqueous-phase mass
Sorbed mass
NAPL massdrainable
residual
Migrating aqueous-phase mass
Static aqueous-phase mass
10-6
10-5
10-4
10-3
10-2
10-1
100
101
Aqu
ifer S
olve
nt M
ass
(kg/
m3 )
Typical Treatment Standard
Total aqueous-phase mass
groundwater flow
102

14
Organic Carbon Fraction (foc)0.000 0.002 0.004 0.006 0.008 0.010
Perc
ent S
orbe
d
0
20
40
60
80
100
Koc = 265 (PCE)
Koc = 36 (cis-1,2-DCE)
Koc = 94 (TCE)
Koc = 19 (vinyl chloride)
blan
king
Koc = 1,191 (Naphthalene)
Aquifer Matrix Sorption Effects

15
What Processes are Stimulating DNAPL and Sorbed-Phase Source Mass Dissolution?
• Increased Concentration Gradients
• Co-Solvent Effects
• Biosurfactant Effects
- Decreased Interfacial Tension- Increased NAPL Surface Area

16
The Ideal ERD Outcome - Desorption

17
Anaerobic In-Situ Reactive Zones (IRZs)

18
Example: Gaining Access to Non-Aqueous Sorbed Contaminant Mass
Elapsed Time (days)-600 -400 -200 0 200 400 600 800 1000 1200
Con
cent
ratio
n (u
mol
/L)
0
10
20
30
40
50
60
70PCETCEcis-1,2-DCEVinyl chlorideEtheneEthane
The Biostimulation Process is Mining Sorbed-Phase MassIncreased DCE
Concentrations
Ethene Production –Complete Dechlorination

19
Case Studies – DNAPL Source Zone ERD
Case Study #1 – Southeastern United States
- PCE DNAPL Source Zone (100% saturation)
Case Study #2 – Location
- TCE DNAPL Source Zone (20% TCE saturation)
Case Study #3 – Location
- PCE DNAPL (25% PCE saturation)

DRYCLEANERS
1998
21
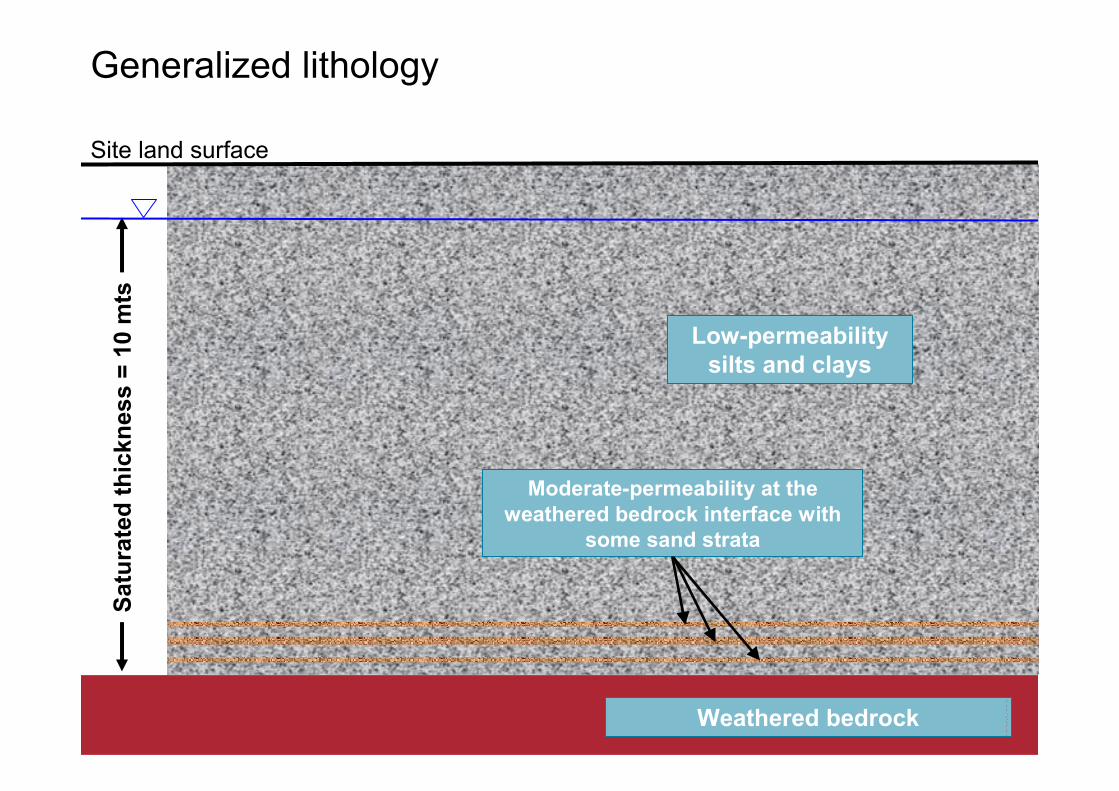
Generalized lithology
Low-permeability silts and clays
Site land surfaceSa
tura
ted
thic
knes
s =
10 m
ts
Weathered bedrock
Moderate-permeability at the weathered bedrock interface with
some sand strata

Initial Carbon Injection

23

24
Case Study #1: PCE DNAPL in Unconsolidated Formation Remedial Approach: Scope and Results
• PCE DNAPL Source Zone (100% saturation)
• Existing Pumping Sysytem: 5 to 30m3/day at 4 wells
- 15 years operation
• Challenging:- Site development requires to enhance the remediation- Risk reduction as site development step- Remediation project has to fit on the development budget

25
Case Study #1: PCE DNAPL in Unconsolidated Formation Remedial Approach: Scope and Results
• PCE DNAPL Source Zone (100% saturation)
• Existing Pumping Sysytem: 5 to 30m3/day at 4 wells- 15 years operation
• 43 IRZ Injection Wells Installed to 9 m
• 10 Monitoring Wells
• Loading: 2000 L/well at 10% TOC (6 to 12 week intervals)
• 3 Years of Enhanced Reductive Dechlorination- Concentrations in Mws peaked at one year of treatment- Mass removal increases in extraction wells increased by several
orders of magnitude

26
0 200
feet
Solvent release areawith DNAPL present
(pre-1989)
Groundwater extraction wells - installed 1989
Approximate Direction of Groundwater Flow
Baseline Site Conditions
Areal extent ≈ 1.9 ha (4.7 acres)Saturated thickness ≈ 8 m (25 ft)Conductive zone ≈ 1.5 m (5 ft)

27
PCE DNAPL Site – Injection (Source) Zone
Elapsed Time (days)
-400 -200 0 200 400 600 800 1000
Con
cent
ratio
n (u
mol
/L)
0
1000
2000
3000
4000
5000
6000
PCETCEcis-DCEVCEtheneEthanePCE solubility limit
160 PPM PCE
28
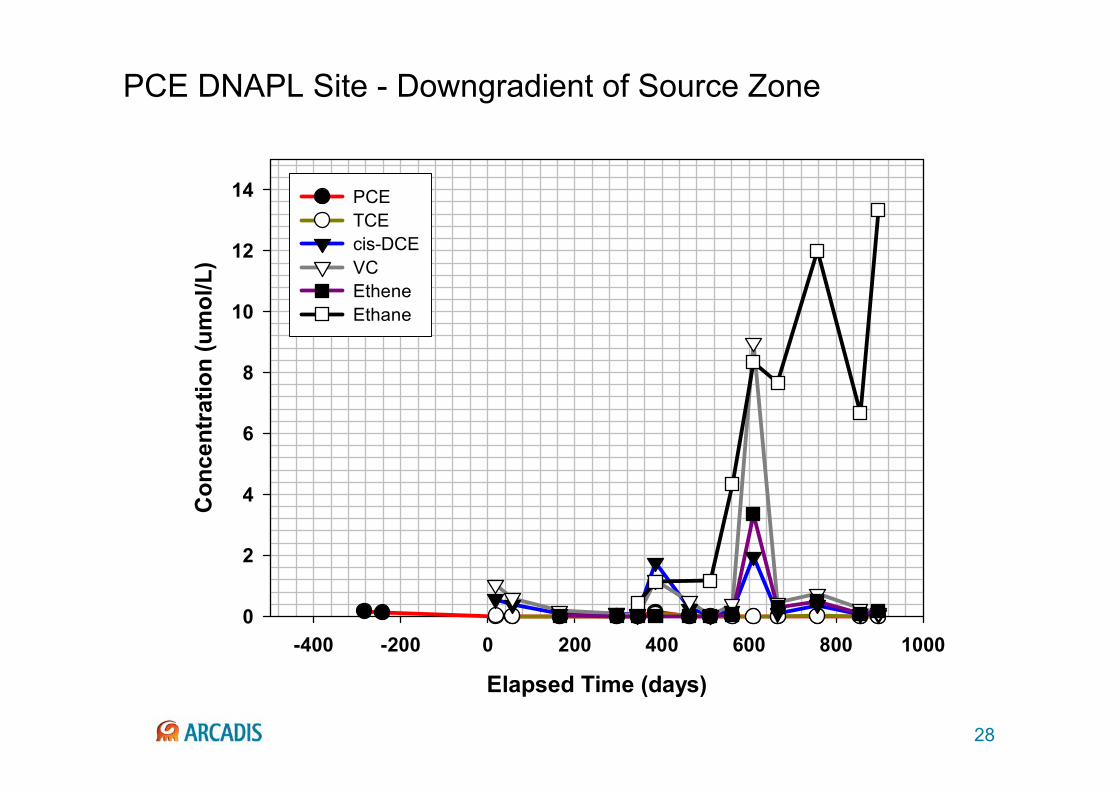
PCE DNAPL Site - Downgradient of Source Zone
Elapsed Time (days)
-400 -200 0 200 400 600 800 1000
Con
cent
ratio
n (u
mol
/L)
0
2
4
6
8
10
12
14 PCETCEcis-DCEVCEtheneEthane

29
Elapsed time (days)
-2500 -2000 -1500 -1000 -500 0 500 1000
Extr
actio
n w
ell y
ield
S u
m o
f PC
E to
VC
(mol
/day
)
0.00
0.02
0.04
0.06
0.08
0.10
0.12
EW-A
PCE DNAPL Site - Extraction Well Mass Recovery
Initial Injection

30
Elapsed time (days)
-2500 -2000 -1500 -1000 -500 0 500 1000
Extr
actio
n w
ell y
ield
S u
m o
f PC
E to
VC
(mol
/day
)
0.0
0.2
0.4
0.6
0.8
1.0
1.2
EW-B
PCE DNAPL Site - Extraction Well Mass Recovery
Initial Injection

31Elapsed time (days)
-2500 -2000 -1500 -1000 -500 0 500 1000
Extr
actio
n w
ell y
ield
S u
m o
f PC
E to
VC
(mol
/day
)
0.0
0.5
1.0
1.5
2.0
2.5
3.0
3.5
EW-C
PCE DNAPL Site - Extraction Well Mass Recovery
Initial Injection

32
Elapsed time (days)
-2000 -1500 -1000 -500 0 500 1000
Extr
actio
n w
ell y
ield
S u
m o
f PC
E to
VC
(mol
/day
)
0.0
0.2
0.4
0.6
0.8
1.0
1.2
1.4
1.6
EW-D
PCE DNAPL Site - Extraction Well Mass Recovery
Initial Injection

33
Changing Mass Flux Composition: Extraction Well EW-C
Elapsed Time (days)
-400 -200 0 200 400 600 800 1000
Con
cent
ratio
n (u
mol
/L)
0
20
40
60
80
100
120
140 PCETCEcis-DCEVCEtheneEthane

34
PCE DNAPL Site - Performance Summary
• Mass flux reduction ~ 4-fold compared to immediate pre-treatment pumping well yield
• Contaminant composition – shift from PCE and cis-DCE to VC, ethene and ethane
• Cost ~ $1.43 MM USD for 150,000 m3 = $9.50/m3
• Was it worth it?

Successful RemediationSuccessful Property Redevelopment

36
Case Study #2: TCE DNAPL
• TCE NAPL located under building with groundwater concentrations greater than 300 mg/L (25% of solubility mg/L)
• Water table aquifer consisting of silty sand to a depth of 35 feet bgs
• Anaerobic IRZ in conjunction with pump-and-treat selected as remedy for groundwater
- 43 injection wells- Quarterly injection
• Groundwater extraction used to promote migration of organic carbon beneath site building
• Anaerobic IRZ accesses NAPL and sorbed-phase mass, making it available for bioremediation

37
January 2003
January 2004
TCE up to 300 ppm(solubility ~ 1,100 ppm)

38
December 2005
November 2004

39
January 2003
January 2004
December 2005
LEGEND:

40
0
2
4
6
8
10
12
0 100 200 300 400 500 600 700 800 900 1000Time (Days)
pH (S
U)
pH
0
50
100
150
200
250
300
0 100 200 300 400 500 600 700 800 900 1000Time (Days)
TOC
(mg/
L)
0
5,000
10,000
15,000
20,000
25,000
30,000
TOCInjectionsMethane
0
50
100
150
200
250
0 100 200 300 400 500 600 700 800 900 1000Time (Days)
Mol
arity
(µm
oles
/L)
TCEc-DCEVCEtheneTotal
pH (>6) in optimal range for ERD
Increased methane (methanogenesis) with arrival of TOC
Sequential dechlorination of parent and daughter products

41
Degradation Trends Demonstrating Solubilization and Treatment of NAPL
0
50
100
150
200
250
May-03 Jul-03 Sep-03 Nov-03 Jan-04 Nov-04 Feb-05 May-05 Sep-05 Dec-05
Date
Mol
ar T
CE,
cis
-DC
E, V
C, &
Eth
ene
Con
cent
ratio
ns (u
mol
/L)
Ethene
VC
cis-DCE
TCE
0.01
0.1
1
10
100
1000
10000
Met
hane
and
TO
C
conc
entra
tion
(mg/
L)
TOCMethane
2x increase in total molarity from baseline demonstrates mining/solubilization of NAPL, making it available for treatment

42
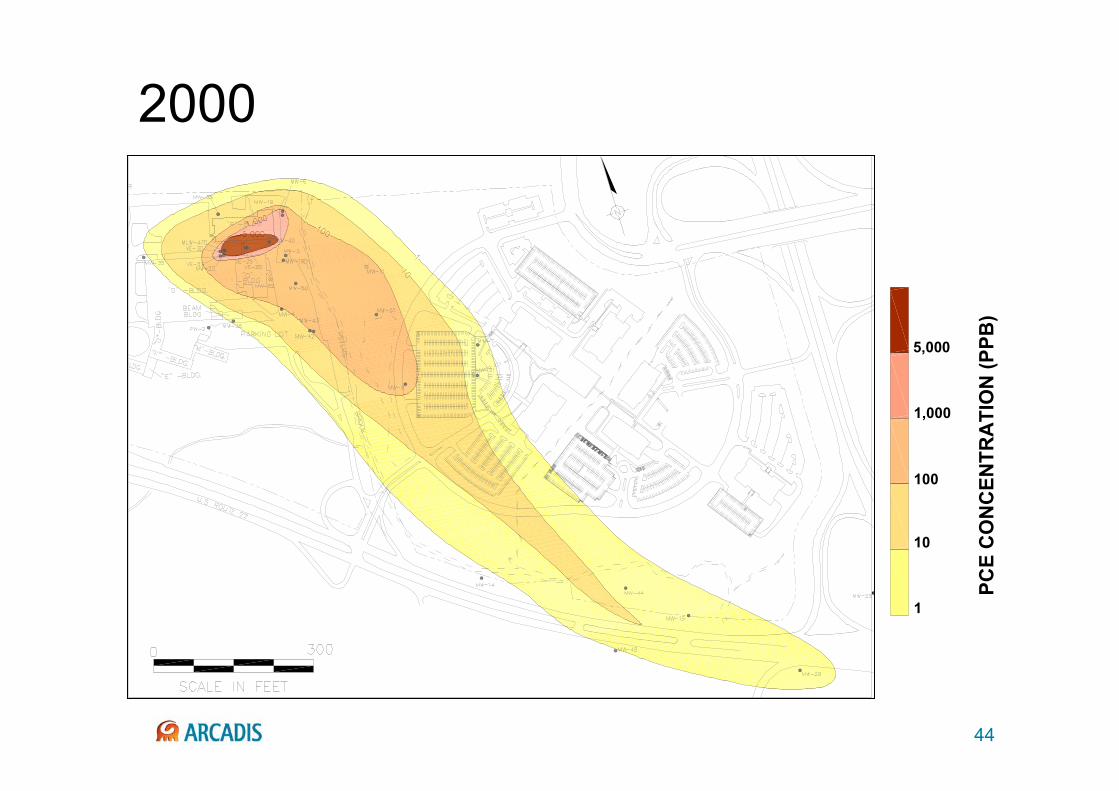
Case Study #3: TCE DNAPL in Fractured Rock
• Property Boundary IRZ
- ERD system controls plume at property boundary- Replaced former pump and treat system- Optimization of injection program (frequency and volume) used to
maximize cost savings- IRZ Line #2 shutdown in 2006- Initiated plume control prior to implementing source zone IRZ
• Source Area IRZ- Innovative combination of pneumatic fracturing and ZVI/molasses
injection has resulted in accelerated source reduction- Molasses injection supports active PCE biodegradation- PCE declined 77-99.9% in all source area wells following ZVI injection

43
1,000
100
10
1
5,000
PCE
CO
NC
ENTR
ATI
ON
(PPB
)
1998
44
1,000
100
10
1
5,000
PCE
CO
NC
ENTR
ATI
ON
(PPB
)
2000

45
IRZ TREATMENTLINE 2
IRZ TREATMENT LINE 1(SOURCE AREA TREATMENT)
1,000
100
10
1
5,000
PCE
CO
NC
ENTR
ATI
ON
(PPB
)
2002

46
IRZ TREATMENTLINE 2
IRZ TREATMENT LINE 1(SOURCE AREA TREATMENT)
1,000
100
10
1
5,000
PCE
CO
NC
ENTR
ATI
ON
(PPB
)
2003

47
IRZ TREATMENTLINE 2
IRZ TREATMENT LINE 1(SOURCE AREA TREATMENT)
1,000
100
10
1
5,000
PCE
CO
NC
ENTR
ATI
ON
(PPB
)
2004

48
IRZ TREATMENTLINE 2
IRZ TREATMENT LINE 1(SOURCE AREA TREATMENT)
1,000
100
10
1
5,000
PCE
CO
NC
ENTR
ATI
ON
(PPB
)
2005

49
Case Study #3 - Summary of Biostimulation Results
• Substantial dissolution/desorption in areas of sorbed mass and residual DNAPL
• Complete dechlorination achieved at sites with moderate contaminant levels
• Strong association between carbon distribution, onset of methanogenesis and late-stage dechlorination

50
Imagine the Result
……. Questions?

51
Thank You …….
Andre Rebouças Arcadis Hidro Ambiente S/AR. Dom Joaquim 1168 - Granja Viana - Cotia06709 202 – BRASIL
Tel: +55 11 4612 7799 Email: [email protected]
www.hidroambiente.com.br


![REVIEW [REVISIÓN] BIOSTIMULATION IN CATTLE: STIMULATION ...](https://static.fdocuments.net/doc/165x107/62daefe853e65f03c93991b0/review-revisin-biostimulation-in-cattle-stimulation-.jpg)