
Success on ACT’s Eighth Grade Explore Exam Jeffrey D ... · Abstract Jeffrey Potts.THE ROLE OF...
112
The Role of Stanford Achievement Test 10 TM Subtests in Sixth Grade as a Predictor of Success on ACT’s Eighth Grade Explore Exam TM Jeffrey D. Potts Liberty University
Transcript of Success on ACT’s Eighth Grade Explore Exam Jeffrey D ... · Abstract Jeffrey Potts.THE ROLE OF...

The Role of Stanford Achievement Test 10TM Subtests in Sixth Grade as a Predictor of
Success on ACT’s Eighth Grade Explore ExamTM
Jeffrey D. Potts
Liberty University

Copyright ©Jeffrey Dale Potts 2011 All Rights Reserved

The Role of Stanford Achievement Test 10TM Subtests in Sixth Grade as a Predictor of
Success on ACT’s Eighth Grade Explore ExamTM
by Jeffrey Dale Potts
A Dissertation Presented in Partial Fulfillment
Of the Requirements for the Degree Doctor of Education
Liberty University, Lynchburg, VA April, 2011
APPROVED BY: Ellen Lowrie Black, Ed.D., Chair Date
Byron R. Greene, Ed.D., Committee Date
Andrew T. Alexson, Ed.D., Committee Date
Scott B. Watson, Ph.D., Chair of Graduate Studies Date

Abstract
Jeffrey Potts. THE ROLE OF STANFORD ACHIEVEMENT TEST 10TM SUBTESTS IN
SIXTH GRADE AS A PREDICTOR OF SUCCESS ON ACT’S EIGHTH GRADE
EXPLORE EXAMTM Under the direction of Dr. Ellen Lowrie Black, School of
Education, April, 2011.
The purpose of this study was to determine if there was a predictive correlation between a
specific sixth grade achievement test known as the Stanford Achievement Test 10 and the
eighth grade college readiness assessment instrument known as the Explore Exam for a
group of North Texas students. Following an assessment during sixth grade, via the sixth
grade Stanford Achievement Test 10, the sample of 123 students was later administered
the Explore Exam during their eighth grade year. A subsequent analysis of the data using
the Pearson product-moment correlation coefficient revealed a statistically significant
predictive relationship between the respective instruments. The Pearson correlation
coefficients ranged from .25 to .69. Multiple linear regression analysis was also
completed in order to identify the Stanford Achievement Test 10 subtests that were the
most important predictors of performance on the Explore Exam. The R-square values
ranged from .32 to .51. The results suggest a predictive relationship between the two
instruments in the areas of math, science, English, and reading.

ii
Acknowledgements This project would not have been possible without the help of so many. First, to
my wife Kristin, who is the love of my life, a tremendous encourager, and a prayer
warrior. You are truly my inspiration. To Dr. Ellen Lowrie Black, your passion,
expertise, and support have meant more to me than you will ever know. I look forward to
continuing our friendship for many years. To my committee, your feedback and direction
made this project what it is. To Dr. Ed Smith, who has promoted my success every step
of the way, I am indebted forever for your support, mentoring, and friendship. To the
staff at Grapevine Faith, your understanding and love during this journey has been
incredible. Finally, to my Lord and Savior Jesus Christ, whose grace and strength sustain
me, I am eternally yours.

iii
Table of Contents
Chapter One: Introduction ...................................................................................................1
Background......................................................................................................................3 Problem Statement...........................................................................................................5 Purpose Statement ...........................................................................................................7 Limitations of the Study ..................................................................................................7 Significance of the Study.................................................................................................8 Research Questions........................................................................................................10 Null and Research Hypotheses ......................................................................................11 Identification of Variables .............................................................................................13
Chapter Two: Literature Review .......................................................................................16
Introduction to Literature Review .................................................................................16 Conceptual Framework..................................................................................................20 Site Characteristics for the Present Study......................................................................26 Overview of the History of Standardized Testing .........................................................27 Today’s Testing Landscape ...........................................................................................28 Opportunities for Early Intervention .............................................................................29 Minorities and Standardized Testing.............................................................................32 Socioeconomic Factors Affecting Test Performance ....................................................33 Non-Native English Speakers’ Test Performance .........................................................35 Students With Learning Disabilities and Test Performance..........................................36 Emphasis on School and Teacher Accountability .........................................................38 Pedagogical Changes and Effects on Student Motivation.............................................39 Predictors of College Success........................................................................................41 College Entrance Exams................................................................................................42 Summary........................................................................................................................47
Chapter Three: Methodology.............................................................................................48
Introduction ...................................................................................................................48 Design............................................................................................................................49 Research Questions and Hypotheses .............................................................................49 Participants ....................................................................................................................51 Setting............................................................................................................................52 Instrumentation..............................................................................................................53 Procedures .....................................................................................................................54
iv
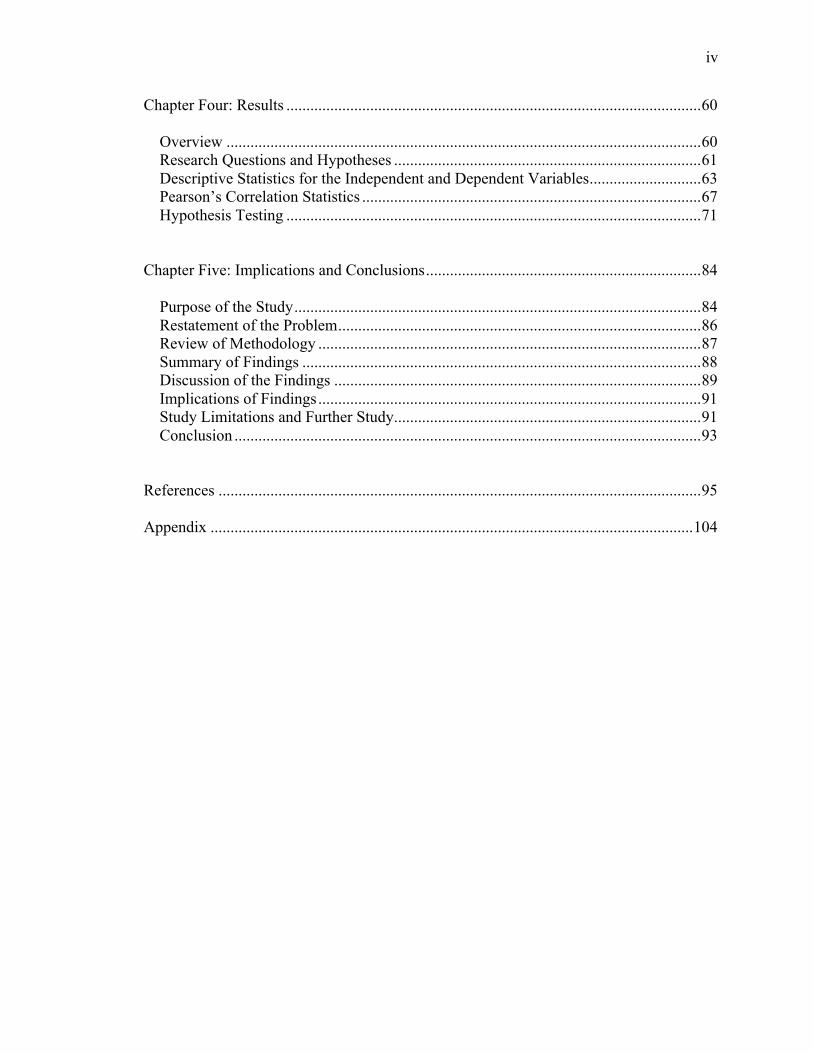
Chapter Four: Results ........................................................................................................60
Overview .......................................................................................................................60 Research Questions and Hypotheses .............................................................................61 Descriptive Statistics for the Independent and Dependent Variables............................63 Pearson’s Correlation Statistics .....................................................................................67 Hypothesis Testing ........................................................................................................71
Chapter Five: Implications and Conclusions.....................................................................84
Purpose of the Study......................................................................................................84 Restatement of the Problem...........................................................................................86 Review of Methodology ................................................................................................87 Summary of Findings ....................................................................................................88 Discussion of the Findings ............................................................................................89 Implications of Findings................................................................................................91 Study Limitations and Further Study.............................................................................91 Conclusion .....................................................................................................................93
References .........................................................................................................................95
Appendix .........................................................................................................................104
v
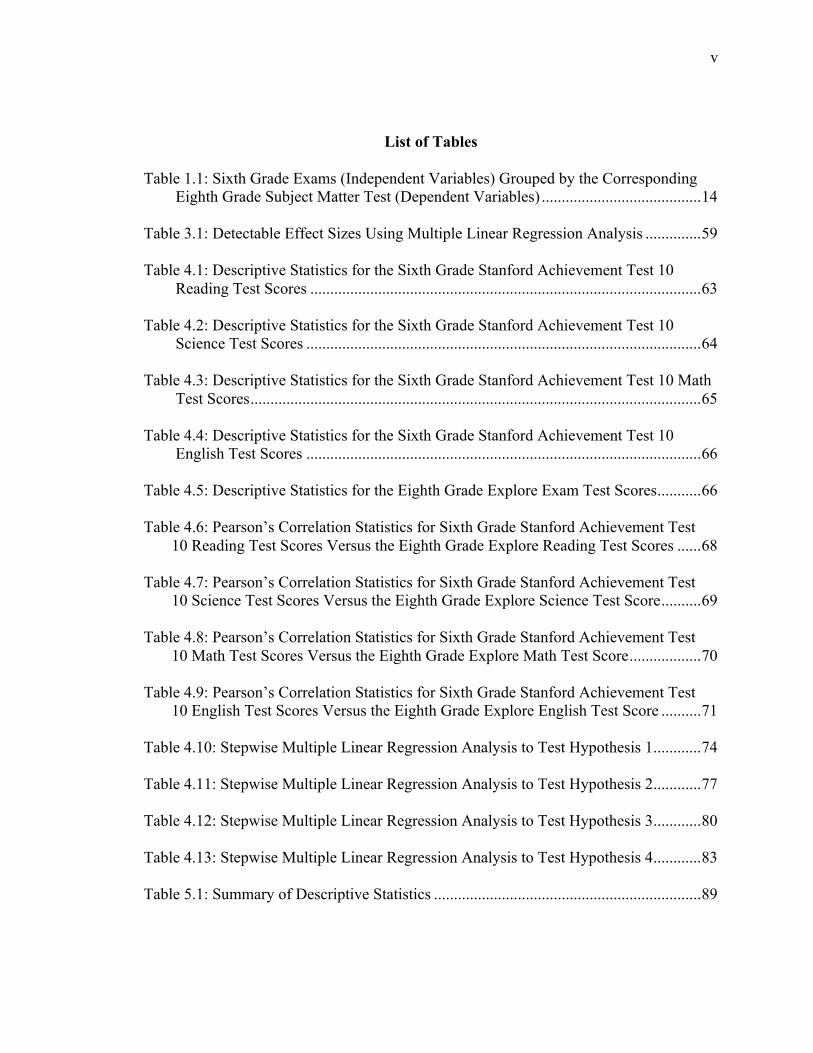
List of Tables
Table 1.1: Sixth Grade Exams (Independent Variables) Grouped by the Corresponding Eighth Grade Subject Matter Test (Dependent Variables) ........................................14
Table 3.1: Detectable Effect Sizes Using Multiple Linear Regression Analysis ..............59 Table 4.1: Descriptive Statistics for the Sixth Grade Stanford Achievement Test 10
Reading Test Scores ..................................................................................................63 Table 4.2: Descriptive Statistics for the Sixth Grade Stanford Achievement Test 10
Science Test Scores ...................................................................................................64 Table 4.3: Descriptive Statistics for the Sixth Grade Stanford Achievement Test 10 Math
Test Scores.................................................................................................................65 Table 4.4: Descriptive Statistics for the Sixth Grade Stanford Achievement Test 10
English Test Scores ...................................................................................................66 Table 4.5: Descriptive Statistics for the Eighth Grade Explore Exam Test Scores...........66 Table 4.6: Pearson’s Correlation Statistics for Sixth Grade Stanford Achievement Test 10 Reading Test Scores Versus the Eighth Grade Explore Reading Test Scores ......68 Table 4.7: Pearson’s Correlation Statistics for Sixth Grade Stanford Achievement Test 10 Science Test Scores Versus the Eighth Grade Explore Science Test Score..........69 Table 4.8: Pearson’s Correlation Statistics for Sixth Grade Stanford Achievement Test 10 Math Test Scores Versus the Eighth Grade Explore Math Test Score..................70 Table 4.9: Pearson’s Correlation Statistics for Sixth Grade Stanford Achievement Test 10 English Test Scores Versus the Eighth Grade Explore English Test Score ..........71 Table 4.10: Stepwise Multiple Linear Regression Analysis to Test Hypothesis 1............74 Table 4.11: Stepwise Multiple Linear Regression Analysis to Test Hypothesis 2............77 Table 4.12: Stepwise Multiple Linear Regression Analysis to Test Hypothesis 3............80 Table 4.13: Stepwise Multiple Linear Regression Analysis to Test Hypothesis 4............83 Table 5.1: Summary of Descriptive Statistics ...................................................................89

1
Chapter One: Introduction
There appear to be two separate discourses in America surrounding student
achievement. The first deals with student achievement in terms of state exams in concert
with the No Child Left Behind Act of 2001. This legislation mandated that students
achieve proficiency on state adopted goals in order to receive federal education funds.
The result has been a plethora of politically charged rhetoric over the assessment of these
goals by what has become known as high stakes testing. The tests are actually a wide
array of achievement based assessment instruments that vary by state, and critics
maintain that such testing is solely focused on students’ receiving a passing mark on
questions with debatable value (Tehrani, 2007). The second discourse is the product of
educational theorists and practitioners concerned with student learning who devote
themselves to sound pedagogical practice regardless of politics. These educators grapple
with the question of whether or not the educational goals they pursue are truly preparing
their students for college, the workforce, and life in the 21st century.
There is an increasing emphasis on student performance in the American
educational environment. As a result, data are generated that demonstrate student aptitude
at key benchmarks in a student’s educational career. In this study, standardized test data
was analyzed for a group of students at the sixth grade level. Subsequently, the same
students were evaluated in eighth grade on their first college readiness exam. The
analysis and results determined whether a correlation exists between scores on one sixth-
grade achievement test and an eighth grade college readiness exam for a population of
North Texas students. The ACT Corporation’s Explore Exam is the first college readiness
2
exam available to the nation’s K-12 student population from an organization that also
offers college admissions testing. As is discussed in detail later, the company continually
engages in a correlational statistical study that tracks eighth grade student performance on
the Explore Exam and correlates it to the student’s ultimate college success. The Stanford
Achievement Test 10 is an achievement test that is commonly used among K-12
institutions and has been historically used by states as the compliance component of the
No Child Left Behind Act of 2002. The statistical association between these two
assessments, as representative of America’s larger assessment landscape, may suggest
further study is warranted. The association between the tests involves a potential impact
on a wide array of areas including curricular decisions, the validity of achievement
testing for college preparation, and early intervention for students who lack adequate
college preparation. This study specifically contributed in these areas for schools that
utilize the sixth grade Stanford Achievement Test 10 and the ACT Corporation’s eighth
grade Explore Exam for these purposes.
There were four research questions and subsequent hypotheses that were used to
accomplish this study. Each question and hypothesis was similar, with the notable
difference being the subject matter. For example, what, if any, correlation was there
between the 11 sixth grade English scores on the Stanford Achievement Test, and the
eighth grade ACT Explore Exam English test scores for a given set of students who were
tested in sixth grade and then subsequently tested in eighth grade. The associated null
hypothesis was that there is no correlation between any of the 11 sixth grade standardized
test strand scores relating to English, and the eighth grade ACT Explore English test

3
scores. These questions and hypotheses were repeated for the subject tests common to
both exams and also includes reading, math, and science.
Background
As a backdrop to today’s standardized testing landscape, it was important to
review the literature and research that contributed to today’s setting. On the heels of the
educational reform movements of the 1960s, in 1975 the New York Times published a
front page article entitled, “College Entry Test Scores Drop Sharply” (Fiske, 1978). The
result was a 2-year national discourse and commission led by the College Board that
attempted to surmise the reasons behind the decade long decline in scores as highlighted
by the New York Times article.
President Reagan’s Secretary of Education, Terrel Bell (1983), released the
educational report “A Nation at Risk.” This report, according to author Diane Ravitch
(2010), was alarming and caused notice among policy makers. Among the findings of the
report were accusations that secondary school curricula had been homogenized, diluted,
and diffused, no longer having a central purpose (U.S. Department of Education, 1983).
As a result, the nation embarked on a quest to identify standards that should be the basis
for a quality American educational system. Tensions arose as state standards and national
standards came into conflict. Consequently, the nation’s focus quickly shifted from
foundational educational concepts such as standards, course requirements, and teacher
certification standards to student performances on outcome-based tests (Hunt, 2008). By
1995, the only standards that existed were vague state standards that differed from state
to state and were largely ignored by educational practitioners at the local level.

4
On July 1, 2002, President George W. Bush introduced what has become known
as the high stakes test by signing into law the No Child Left Behind Act (NCLB). This
legislation allowed states to set their own standards and assess programs via their own
testing instruments in the fields of math and English. At the heart of the legislation is the
connection of government funding to student performance on state assessments.
Since the passage of the No Child Left Behind Act in July 2002, there has been
research advancing the merits of standardized testing. This research disproportionately
consists of promotional material by companies who administer standardized tests such as
the Education Testing Service (2001). Proponents of standardized testing assert that the
tests have contributed to high expectations and have thus raised the bar for student
performance (McCabe, 2003). According to Linn and Kiplinger (1995), standardized
testing has greatly helped answer the call for school reforms through the use of
systematized, objective methods for measuring student achievement.
As the political debate persists, the question still remains regarding the connection
achievement tests have to college readiness. Past research has attempted to link a number
of factors to college success. Such factors include the courses students take in high school
and high school grade point averages (Does AP Predict College Success, 2006). The
problem is that very little research exists that quantifiably connects the achievement
testing phenomenon to college success. This study contributed to the national discourse
on standardized testing by offering tangible evidence of the connection that may or may
not exist between one K-12 achievement test and one college readiness benchmark
assessment instrument among a population of students in one Texas school.

5
For the purposes of this study, it should be noted that the term high stakes testing
was reserved for usage when the researcher intends to link the notion of student
assessment specifically to compliance with the No Child Left Behind Act of 2002. The
term has been used negatively by political detractors of the legislation and as a result has
associated negative connotations that are detailed further in a section of the literature
review. It was not the purpose of this study to engage in politically charged rhetoric;
therefore, the terms achievement or standardized assessments are used except when
discussing the usage of said tests for the purposes of compliance with the No Child Left
Behind Act of 2002.
Problem Statement
What should be the goal of K-12 education in America? While this is a somewhat
rudimentary question, the answer is not readily apparent when considered in the context
of America’s educational emphasis. According to the ACT Corporation, less than one in
four high school graduates in America were prepared for college entry-level coursework
in each of the subjects of math, science, reading, and English. Furthermore, 28% of high
school graduates met none of the predetermined benchmarks for college readiness as
defined by the ACT Corporation (2010a). This is particularly alarming considering the
ACT Corporation is the fastest growing college entrance exam administered in the United
States and offers the most in-depth analysis of skills obtained by high school seniors
(ACT Corporation, 2010b).
With the passage of the No Child Left Behind Act of 2002, a system of
educational accountability was established whereby government funds were issued to
states based upon their respective students’ performance on annual high stakes testing.

6
Subsequently, states have increasingly begun to create their own high stakes instruments.
The inevitable questions arose surrounding the purpose of the state-constructed
assessment instrument. While seven states—Colorado, Illinois, Kentucky, Michigan,
North Dakota, Tennessee, and Wyoming—have adopted the ACT Exam as their
graduation exam and may appear to be committed to college readiness, some states
appear to be most interested in crafting exams that allow more students to achieve
acceptable scores to allow the schools to qualify for No Child Left Behind federal
funding. This is highlighted by recent data trends that showed student performance on
state tests was improving while assessments of students’ college readiness was in annual
decline (Chudowski & Chudowski, 2010).
With the overarching problem of competing goals for K-12 standardized testing,
little research exists that attempted to quantify the connection between achievement tests
and college readiness. This study attempted to determine if a predictive correlation
existed between one such achievement test and a college readiness assessment instrument
among the same population of students who were assessed via each respective instrument
at the appropriate stage of their education. Specifically, this study correlated a North
Texas school’s sixth grade student population’s performance on the Stanford
Achievement Test 10 with the same students’ subsequent performance on the eighth
grade ACT Corporation’s Explore Exam. Without this information, stakeholders such as
school administrators, teachers, and educational researchers may not have all the
information they need to improve student performance on college readiness exams.

7
Purpose Statement
With America’s focus turning over the last decade to K-12 standardized testing,
the data suggest the country’s college bound seniors were increasingly less prepared for
the academic rigor of college (ACT Corporation, 2010b). The purpose of this study was
to determine if there was a predictive correlation between a specific sixth grade
achievement test known as the Stanford Achievement Test 10 and the eighth grade
college readiness assessment instrument known as the Explore Exam for a group of North
Texas students. As was discussed in the literature review, the ACT Corporation conducts
an annual correlation study that tracks subjects’ performance on the eighth grade Explore
Exam and their respective college success as defined by their college grade point
averages. Building upon this research, this study determined if a predictive correlation
exists between one group of students’ performance on the sixth grade Stanford
Achievement Test 10 and the Explore Exam. As evidence gathers that the Stanford
Achievement Test 10 is a valid predictor of scores on the Explore Exam, the
ramifications for educators could impact a myriad of educational strategies and practices
for schools that utilize both instruments. A statistically significant correlation between the
two exams supports the rationale behind administering the Stanford Achievement Test
10.
Limitations of the Study
This study was limited to a single school. Four classes of students passed through
sixth grade in successive years beginning in 2005. The classes also completed eighth
grade in successive years beginning in 2007. While the instructional program at the
school did not undergo any systemic changes, it should be noted that there were minimal

8
personnel changes in the instructional program. Furthermore, students in each class
varied by academic ability, as would be expected among any school population.
However, there were no known factors in the pedagogical program that would influence
student performance in this study.
The study was limited to students who completed sixth through eighth grades at
the host site. The national economic downturn during the course of this study impacted
the stability of the enrollment at the tuition-based host site. While there was a transient
nature to some members of the school population, the classes that were the focus of this
study maintained a re-enrollment rate above 90%.
The generalizability of this study to other dissimilar populations is limited. The
findings of this study are applicable only to institutions where the Stanford Achievement
Exam 10 and the Explore Exam are utilized at the same grade levels that they are used in
the present study. Furthermore, generalizability may be limited since the school where
the study takes place is a tuition-based, predominately White, non-public setting with an
admission requirement that yields a student population with above average ability.
Furthermore, although the researcher went to great lengths to protect the integrity of this
study, it could be limited by potential researcher bias that would threaten internal validity
by virtue of the researcher’s employment at the host site.
Significance of the Study
The significance of this study can first be found in its contribution to the research
linking achievement testing to college readiness exams and ultimately student preparation
for college. The literature and research on the topic was limited and was generally
associated with somewhat obscure state-authored assessments, as the subsequent

9
literature review in this study shows. If a correlation between the Stanford Achievement
Test 10 and the ACT Explore Exam had not been found for the study participants, these
findings could have suggested that hundreds of schools should question why they utilize
the Stanford Achievement Test 10 and what is the overall goal of their respective
standardized testing program. As is highlighted later in this study, many stakeholders
erroneously assume performance on a given achievement test equates to a measure of
college readiness. For many private schools, such as those accredited by the Association
of Christian Schools International, achievement testing was not compulsory for state
funding. The importance of this study for such schools was that if this study and others
like it failed to find a significant correlation, this could result in a call to evaluate the
testing program for hundreds of thousands of students. On a national level, the
importance of an absence of a corollary relationship between the two instruments may
mean a national discourse is warranted to determine the goal of K-12 standardized
testing. Is it to secure government funding through passing student scores or is it college
preparation?
Given that in the present study a predictive relationship was found between
student performance on the Stanford Achievement Test 10 and the Explore Exam, the
significance of this study is not limited to simply adding to the field of research and
prompting debate. For the educational practitioner who utilizes both instruments, a
statistically valid correlation between the two instruments carries a wide range of
implications. A correlation demonstrates that the K-12 educator who utilizes the Stanford
Achievement Test 10 could rely on student scores at the sixth grade level for predictive
purposes when evaluating college readiness. This impact could affect early intervention

10
strategies, pedagogical practices, and curriculum selection. The implication of a
predictive correlation for the K-12 school where the Stanford Achievement Test was
utilized is wide-ranging in scope. Additionally, a correlation among several subtests on
the Stanford Achievement Test 10, the accompanied regression analysis included in this
study, demonstrates which subtests have the strongest correlation to the Explore Exam.
Research Questions
With the goal of the study to link standardized test scores from a single
achievement test to a single college readiness exam, the overarching research question
that was answered was, which, if any sixth grade Stanford Achievement Test scores
explain the greatest percentage of variance in the eighth grade ACT Explore Exam scores
among students who attend a K-12 school in North Texas? Four specific questions were
answered to determine the relationships between the sixth grade test scores (independent
variables) and the eighth grade test scores (dependent variables). These four questions
were centered on the areas of reading, science, math, and English. First, which, if any of
the 12 reading strand scores on the sixth grade Stanford Achievement Test explain the
greatest percentage of variance in the eighth grade ACT Explore reading test score
among students who attended a K-12 school in North Texas? Secondly, which, if any of
the eight science strand scores on the sixth grade Stanford Achievement Test explain the
greatest percentage of variance in the eighth grade ACT Explore science test score among
students who attended a K-12 school in North Texas? Third, which, if any of the 15 math
strand scores on the sixth grade Stanford Achievement Test explain the greatest
percentage of variance in the eighth grade ACT Explore math test score among students
who attended a K-12 school in North Texas? Finally, which, if any of the 11 sixth grade

11
English scores on the Stanford Achievement Test explain the greatest percentage of
variance in the eighth grade ACT Explore English test score among students who
attended a K-12 school in North Texas?
Later portions of this study detail the relevant literature surrounding student
achievement scores; however, to understand what types of comparative studies were
found involving student achievement data, at the outset it is important to note that the
aforementioned four specific questions were illustrated by previous researchers’ work.
One area of note was the link between student health and student achievement scores.
Previous corollary studies found that student health has affected achievement trajectories
in students (Garcy, 2009). Similarly, student behavior has been the subject of research.
Efforts to determine the value of classroom management and early behavioral
interventions have led to researchers seeking correlations between student achievement
and student behavior (Rutchick, Smyth, Lopoo, & Dusek, 2009). Over the past decade,
studies have also attempted to correlate student achievement with school leadership,
specifically principal leadership. These studies suggest a positive correlation can be
found in schools where school leaders exhibit certain leadership qualities (Mackey,
Pitcher, & Decman, 2006).
Null and Research Hypotheses
• Hypothesis 1: H0: None of the 12 sixth grade standardized test strand scores
relating to reading explain any variance in the eighth grade ACT Explore reading
test score among students who attend a K-12 school in North Texas.
Ha: One or more of the 12 sixth grade standardized test strand scores relating to
reading explain a statistically significant percentage of variance in the eighth

12
grade ACT Explore reading test score among students who attend a K-12 school
in North Texas.
• Hypothesis 2: H0: None of the 8 sixth grade standardized test strand scores
relating to science explain any variance in the eighth grade ACT Explore science
test score among students who attend a K-12 school in North Texas.
Ha: One or more of the 8 sixth grade standardized test strand scores relating to
science explain a statistically significant percentage of variance in the eighth
grade ACT Explore science test score among students who attend a K-12 school
in North Texas.
• Hypothesis 3: H0: None of the 15 sixth grade standardized test strand scores
relating to math explain any variance in the eighth grade ACT Explore math test
score among students who attend a K-12 school in North Texas.
Ha: One or more of the 15 sixth grade standardized test strand scores relating to
math explain a statistically significant percentage of variance in the eighth grade
ACT Explore math test score among students who attend a K-12 school in North
Texas.
• Hypothesis 4: H0: None of the 11 sixth grade standardized test strand scores
relating to English explain any variance in the eighth grade ACT Explore English
test score among students who attend a K-12 school in North Texas.
Ha: One or more of the 11 sixth grade standardized test strand scores relating to
English explain a statistically significant percentage of variance in the eighth
grade ACT Explore Exam English test score among students who attend a K-12
school in North Texas.

13
Identification of Variables
Independent variables. The independent variables for this study were the sixth
grade Stanford Achievement Test 10 subtest scores. These variables were measured on a
continuous measurement scale with a range of 0 to 100. The scores represent the
percentage of test questions that were answered correctly. Thus, smaller scores indicated
less knowledge of the subject while larger scores indicated greater knowledge of the
subject. Table 1.1 shows the names of the sixth grade exam topics (independent
variables) grouped by the corresponding eighth grade subject matter test (dependent
variables).
Dependent variables. The following list defines in detail the dependent variables
in use in the present study.
• Eighth Grade Explore Exam Reading Test Score (REA): This variable was
measured on a continuous measurement scale with a range of 0 to 100. This score
represented the percentage of eighth grade reading test questions that were
answered correctly. Thus, smaller scores indicated less knowledge of reading
while larger scores indicated greater knowledge of reading.
• Eighth Grade Explore Exam Science Test Score (SCI): This variable was
measured on a continuous measurement scale with a range of 0 to 100. This score
represented the percentage of eighth grade science test questions that were
answered correctly. Thus, smaller scores indicated less knowledge of science
while larger scores indicated greater knowledge of science.
• Eighth Grade Explore Exam Math Test Score (MAT): This variable was
measured on a continuous measurement scale with a range of 0 to 100. This score

14
represented the percentage of eighth grade math test questions that were answered
correctly. Thus, smaller scores indicated less knowledge of math while larger
scores indicated greater knowledge of math.
• Eighth Grade Explore Exam English Test Score (ENG): This variable was
measured on a continuous measurement scale with a range of 0 to 100. This score
represented the percentage of eighth grade English test questions that were
answered correctly. Thus, smaller scores indicated less knowledge of English
while larger scores indicated greater knowledge of English.
Table 1.1
Sixth Grade Exams (Independent Variables) Grouped by the Corresponding Eighth Grade Subject Matter Test (Dependent Variables) Sixth Grade Exam
Topic Eighth Grade Exam Topic
Reading
Synonyms Multiple meaning words Context clues Thinking skills – Vocabulary Literary Informational Functional Initial understanding Interpretation Critical analysis Strategies Thinking skills – Comprehension
Science Life Physical Earth Nature of science Models Constancy Form & function Thinking skills – Science
(Table continues)

15
Math Number sense & operations Patterns/relationships/algebra Data, statistics, & probability Geometry & measurement Communication & representation Estimation Mathematical connections Reasoning & problem solving Thinking skills – Problem solving Computation with whole numbers Computation with decimals Computation with fractions Computation in context Computation / Symbolic notation Thinking skills – Procedures
English Capitalization Usage Punctuation Sentence structure Prewriting Content and organization Thinking skills – Language expression Phonetic principles Structural principles No mistake Homophones

16
Chapter Two: Literature Review
Introduction to Literature Review
On today’s educational landscape, there is a seemingly limitless supply of high
stakes tests. These tests and their subsequent results differ greatly from state to state and
are often the topic of media scrutiny. Once a school’s results are published, the school is
often evaluated formally by the state and informally by the stakeholders of the school.
The ramifications of each evaluation bring with them specific issues related to public
opinion and funding. From here, school leaders are left with evaluating results in a
reactive manner and addressing only the most glaring deficiencies as highlighted by
student assessments. What is more, there is often little connection between the
aforementioned achievement tests in the K-12 school and college readiness standards that
are evaluated on college admissions exams.
The purpose of this study was to determine what, if any, were the sixth grade
Stanford Achievement Test 10 strands that serve as valid predictors of performance on
the eighth grade ACT Explore Exam for a given population of North Texas students. An
analysis of the data was intended to demonstrate whether a correlation existed between a
given student’s performance on the sixth grade Stanford Achievement Test 10 and his or
her subsequent performance on the eighth grade college readiness assessment known as
the Explore Exam.
One may interpret a positive correlation as suggesting that sixth grade Stanford
Achievement Test 10 test data on the strand level included in this study predicts future
performance on the eighth grade Explore Exam among the students used in this study.

17
This was important because it offers the school the opportunity to utilize statistically
valid data 2 full years earlier than what was previously available. According to the
president of the ACT Corporation, it is generally agreed that college readiness begins at
the sixth grade level; however, it is only during the eighth grade year that schools are
currently able to evaluate progress (C. Schmeiser, personal interview, April 12, 2007).
With this new study, it may now be possible to justifiably evaluate valid data for college
readiness for sixth grade students who utilize both instruments. This study drew attention
to and relied heavily on previous correlational research done by the ACT Corporation
linking Explore Exam results to future college success. These data may be used to direct
the decision-making process in a wide array of curricular areas beginning at the sixth
grade level.
This study was one of the first of its kind to connect college readiness standards to
K-12 achievement test objectives. Additional research has been needed to understand
what relationships may exist between achievement tests and college readiness exams.
Through this research, it is hoped that K-12 objectives can become more aligned with
college readiness objectives leading to curricular enhancements in the K-12 institution
that utilizes both assessment instruments included in this study.
Existing literature on the topic of test data can be grouped into three primary
components. The first category was the research on achievement tests, such as the
Stanford Achievement Test 10. The research was quite diverse and included studies and
articles dedicated to proving that standardized testing, in its many forms, is inherently
valuable for a myriad of reasons. Some of the most compelling reasons, some maintain,
are that early intervention and post-assessment strategies can positively impact overall

18
student learning (Ross et al., 2004). In addition, previous studies offered significant
support for the notion that improving individual and collective test scores is possible, and
students are not necessarily limited in their ability to improve from year to year (Randolf,
2007). The literature on standardized testing was not all positive. In reality, the majority
of discussion was devoted to the inherent problems found in standardized testing (Beyer
& Gillmore, 2007) as a part of the No Child Left Behind Act of 2002. This research
included the public’s misunderstanding of achievement test scores and the resultant
challenges for schools (Newton, 2005). However, a meta-analysis of the research on the
topic revealed an assemblage of groups that maintain the view that the current testing in
the United States was problematic for various groups of students that are discussed later.
The second category dealt primarily with the improvement of college admissions
test scores. College admissions tests have created a multi-million dollar test preparation
industry predicated upon the belief that students are ill prepared for the exams by their K-
12 education. The research dedicated to simply identifying the objectives that must be
mastered in order to maximize college entrance exam scores best illustrates this point
(Black, 2005). Furthermore, the research suggests that states do not consult colleges
when adopting K-12 standards and that the two primary national tests are quite different
(Kirst, 2005).
The final component of literature reviewed was the sparse research on connecting
K-12 achievement tests to college entrance exams and ultimately college success. While
there were limited examples of achievement tests being linked to various types of other
tests, such as intelligence quotient tests (Antonek, King, & Lowy, 1982), there were
surprisingly few resources available to assist in drawing connections between the K-12

19
standardized tests and college entrance exams. The research available included a study
completed by the state of Minnesota in an effort to determine the predictive nature of the
Reading-Curriculum Based Measurement (R-CBM) exam with the Minnesota
Comprehensive Assessment (MCA exam). This study determined that a statistically
significant relationship existed between the two instruments among the 1,766 student
participants (Hintze, & Silberglitt, 2005). The state of Washington has performed similar
studies among elementary students that yielded similar predictive results between the
state’s high stakes test and achievement tests among 174 fourth grade students in reading
fluency (Stage & Jacobsen, 2001). It is important to note that existing research appears to
be limited to elementary age students. In order to prevent any oversight of a collection of
research on the topic, for the present study there were two separate personal interviews
held with leading experts in the field of educational assessment. First, Dr. Cyndie
Schmeiser, President of the ACT Corporation, was interviewed. During this interview,
Dr. Schmeiser indicated that she was not aware of any such research that had previously
been completed on the connection between K-12 assessment and the ACT Exam
(personal communication, April 25, 2008). Subsequently, the National Center for
Educational Achievement was contacted, and an interview was arranged with Dr. Chrys
Dougherty, Director of Research. Through this interview, it was once again confirmed
that the reason for the lack of resources in this area is believed to be simply the need for
more research (C. Daugherty, personal communication, April 30, 2008). As a result, a by-
product of this study was to contribute to this third component of research, which was an
area deficient in research.

20
Conceptual Framework
The nation’s educational crisis is highlighted by reports of annual testing that
seemingly pose a limitless supply of disappointing news regarding the student
performance of America’s K-12 classroom students. The news comes from all corners of
the country and revolves around two themes including (a) declining annual achievement
test scores among the nation’s K-12 population and (b) declining college admissions
scores. The phenomenon of an annual decline in America’s testing scores is one with an
unfortunate history that could be traced in the literature beginning in the 1970s (Savage,
1978) and continuing through the 1980s (Howe II, 1985), the 1990s (Huber, 1993), and
the first decade of the current century (Kahn, 2006). Educators and policymakers have
subsequently spent their combined efforts over that time on various strategies that range
from fiscal policy to chasing the latest educational trends. Meanwhile educational
research has devoted an ample amount of time surveying successful schools and reporting
the findings; however, this effort has failed to curb the tide of falling scores in what has
become a national crisis (Ornstein, 2010). What appears to be lacking is valid,
quantifiable research that allows school leaders to make systematic changes to the K-12
course of study with the goal of college readiness.
The system-wide efforts that have been employed to improve student performance
appear to be a disjointed menagerie of movements without a common theme and without
a basis in quantifiable research. With the current federal education program allowing
states to develop their own achievement tests before receiving federal funding, there
appears to be little connection between the federal funding and the largely private
industry devoted to performance by students on college entrance exams. In addition, there

21
appears to be even less use of previous research on the connection between achievement
testing and college admission testing for various segments of the nation’s student
population, such as students with learning disabilities, non-native English speakers, and
minority students.
To organize the nation’s testing movement, education policy-makers must begin
to include elements of the quantitative analysis of the various assessment instruments in
an effort to correlate student performance on K-12 assessment instruments with college
admissions exams, if the goal is college readiness for America’s youth. Once the strength
of correlations is found, educators must begin shifting to instruments in the K-12 program
that possess the strongest possible correlations to college readiness exams. The results of
the correlational studies should include as much detailed information as possible on
student performance to include their respective performances at the sub-test level.
Additionally, an element of intentionality must be present in the K-12 institutions that
facilitates the usage of test data in an effort to make meaningful changes to the course of
study based upon valid, quantitative research of their respective achievement tests.
Conceptually, educational leaders need to be empowered with the knowledge of
what their students’ performance means for college readiness in the areas of English,
reading, math, and science. When achievement test score reports are returned to the K-12
school, the school leader and classroom teacher alike should know the effects on college
readiness for improving each subject score and which sub-test scores within the subject
are the most powerful agents of change for improving college readiness. Furthermore,
through statistical analysis, school leaders could identify the synergy that exists through

22
focusing on two or more of the most important sub-tests, as defined by multi-linear
regression analysis.
The crux of the issue surrounding high stakes tests was that many schools across
the United States spend an inordinate amount of taxpayer money to assess students. Yet
few independent studies have yet firmly established that the exams serve to indicate a
level of college preparation. Such studies would be useful by suggesting areas to improve
college preparation for the student. The ACT Corporation’s Explore Exam was the first
assessment to measure college readiness between the two major entities that administer
college entrance exams in the United States. The Scholastic Aptitude Test offers the
Preliminary Scholastic Aptitude Test (PSAT) directed towards high school juniors,
although it may be administered as early as ninth grade. The purpose of this exam is to
serve as practice for the Scholastic Aptitude Test and serves as a qualifier for the
National Merit Scholarship (College Board, 2010). The other most prominent college
preparation testing institution, the ACT Corporation, offers a test suite designed to
measure student performance beginning in eighth grade with the Explore Exam,
continuing with the PLAN Exam in 10th grade, and culminating with the ACT Exam
following 11th grade. The purpose of the exam suite is to support student planning, aid
instructional support, provide assessment opportunities, and evaluate scholastic progress
(ACT Corporation, 2010b). The selection of the ACT Corporation’s Explore Exam for
this study was based upon the opportunity that exists in assessing eighth graders via an
instrument conceptually linked to the ACT Exam. At the time of this study, the majority
of Explore Exam participants were eighth graders across the United States, while the

23
majority of PSAT Exam participants were 10th and 11th graders (J. Noble, personal
communication, October 5, 2010).
One important conceptual link of importance to the present study was the
previous work accomplished by the ACT Corporation that linked a given eighth grade
student’s performance on the Explore Exam with his or her subsequent college
performance many years later. The ACT Corporation has a history of over 40 years of
educational research that linearly tracks student performance on college admissions tests
and subsequent college success as measured by the students’ college grade point averages
(ACT Corporation, 2010d). An interview with Dr. Jeff Allen, Director of Statistical
Services-Research of the ACT Corporation, revealed that the Explore Exam has benefited
from the same longitudinal monitoring process. While the results were unpublished
proprietary data used within the corporation, Dr. Allen stated that the Explore Exam was
a valid predictor of college grade point averages as verified by the company’s
commitment to measuring student performance on the Explore Exam at the eighth grade
level and then subsequently tracking the students’ academic records through college
graduation (J. Allen, personal communication, February 18, 2010).
A review of the types of studies that have been published by the ACT Corporation
may illustrate what types of research were being done specific to the Explore Exam. In
2002, the company published a study that included over 200,000 students and 84 large
post-secondary institutions. The research used logistic regression models to determine
that student scores on the ACT Exam were valid predictors of college grade point
averages (Noble & Sawyer, 2002). Similarly, outside university research concluded that
student ACT Exam scores were valid predictors of college success. This was especially

24
true when ACT composite scores were combined with the students’ high school grade
point averages (Bleyaert, 2010).
The marketing material from the ACT Corporation’s Explore Exam touts the
aforementioned linkage to college success through what it calls college readiness
standards. The company defines college readiness standards as statements that describe
what students were likely to know and to be able to do, based on their ACT scores (ACT
Corporation, 2009d). The company then used its longitudinal data to determine if a given
student, or set of students, was on track for college success in each of the four core areas
of reading, math, science, and English. The ACT Corporation (2009) uses this model for
what it calls early preparation for college. The Explore Exam was documented as the
first college readiness assessment instrument between the two major entities that offer
college admissions testing in the United States. However, an interview with the president
of the ACT Corporation, Dr. Cyndie Schmeiser, revealed she believes that “college
readiness really begins at the sixth grade level” (personal communication, April 25,
2008). One of the products of this present study was to establish an association between
one sixth-grade achievement test and the Explore Exam.
The ACT Corporation’s Explore Exam is a component of the company’s EPAS
test suite, which includes the aforementioned college readiness exams known as the
PLAN and ACT Exams. It is focused on age appropriate objectives derived from the
ACT Exam. The literature review demonstrates that very little research exists connecting
college entrance exams to K-12 standardized testing. Similarly, there was no known
research linking the classroom performance of students to the Explore Exam and
standardized testing, including the Stanford Achievement Test 10. The Stanford

25
Achievement Test 10 was selected because of the accessibility of the data at the subject
school due to its testing policy. The Stanford Achievement Test 10 has a statistical
reliability figure of .87 (Technical Manual, 2003) and is an achievement test that serves
as the state assessment for thousands of students in states such as Arkansas and Alabama
as required by the No Child Left Behind Act of 2002.
When considering the instruments to be used, comparing two exams that are
achievement based significantly enhanced the conceptual framework. The Explore Exam
and all exams in the EPAS suite of tests are achievement based, similar to the Stanford
Achievement Test 10, while the Scholastic Aptitude Test 10 is primarily reasoning based.
It should be noted that one exception exists in the subject of science. The Explore Exam
and all EPAS exams are reasoning assessments in the subject of science. This was
highlighted in measuring and quantifying any predictive correlation that existed between
the two instruments.
A correlation of a predictive nature between the two instruments would indicate
that earlier intervention in the K-12 academic program could prove to enhance college
readiness. The prior research suggested that much of school improvement prior to high
school was indictated by student performance on achievement based, high-stakes tests. At
the high school level, some schools make the transition to preparation for student
performance based on college admission exams such as the ACT Exam. However, with
the benefit of results from this present study, schools that make use of the Stanford
Achievement Test 10 at the sixth grade level could confidently make the transition at the
sixth grade level if a correlation of a predictive nature was found between individual
aspects of the Stanford Achievement Test 10 and the Explore Exam. As further

26
illustration of the need, the Stanford Achievement Test 10 has historically served as the
state test for Arkansas and Alabama. In addition, there are over 5,700 private schools
accredited by Association of Christian Schools International (2009a; ACSI) in the United
States and 600,000 students in international ACSI schools who are subject to assessment
by the Stanford Achievement Test 10 annually.
Site Characteristics for the Present Study
This study was limited to a single school. Four cohorts of students passed through
sixth grade in successive years beginning in 2005. These cohorts also completed eighth
grade in successive years beginning in 2007. The instructional program at the school did
not undergo any systemic changes. In addition, it should be noted that there were minimal
personnel changes in the instructional program. Furthermore, students in each class
varied by academic ability, as would be expected among any school population. There
were no known unique factors in the pedagogical program that would influence student
performance in this study.
The study was limited to students who completed sixth through eighth grades at
the host site. The national economic downturn during the course of this study impacted
the stability of the enrollment at the tuition-based host site, as a result of some transience
for some segments of the school population. Yet the classes that were the focus of this
study maintained a re-enrollment rate above 90%.
The generalizability of this study to other dissimilar populations is limited. The
findings of this study are applicable only to institutions for which the Stanford
Achievement Exam 10 and the Explore Exam are utilized at the same grade levels.
Furthermore, generalizability may be limited by the fact that the school where the study

27
took place was a tuition-based, predominately White, non-public setting with an
admission requirement that yielded a student population with above average ability.
Furthermore, although the researcher went to great lengths to protect the integrity of this
study, it could be limited by potential researcher bias that would threaten internal validity
by virtue of the researcher’s employment at the host site.
Overview of the History of Standardized Testing
In the mid-19th Century, education became more readily available to the influx of
immigrants who arrived in America. As the availability of an education moved from the
socially elite to the mass population, educators sought ways to ensure that all students
were receiving an adequate education. This led to standardized testing in American
schools (Haladyna & Haas, 1998). In 1905, French psychologist Alfred Binet published
the first intelligence test that was rapidly adopted in the United States and implemented
by the military. The use of the intelligence test reached its peak in the 1950s shortly after
the Russian launch of the Sputnik satellite and American’s resultant concern about
science and math education (Rise of Testing, 2001). Following the 1950s, American
educators began to place an emphasis on the aggregation of standardized test data. This
emphasis led to the observance of trends in student performance that critics argued
pointed to social inequalities in the areas of race, gender, and socio-economic background
(Grodsky, Warren, & Felts, 2008). Standardized testing in the United States was long
considered to be synonymous with the Scholastic Aptitude Test and the American
College Testing Exam (Fletcher, 2009). During the educational reform era of the 1960s
and 1970s, standardized testing had became part of the mainstream educational culture.
Standardized testing has recently become a political issue as billions of taxpayer dollars

28
are distributed to states based on student performance, and testing quickly began to
dominate the national discourse on education.
Today’s Testing Landscape
In political circles, the goal of standardized testing, as it relates to what has
become known as high stakes testing, is to provide data on student performance that is
readily comparable from student to student, district to district, and state to state. Students
are assessed amid strict administrative standards that include directives such as time
limits and scripts for test proctors. According to Karantonis and Sireci (1997),
standardized tests in American public schools are intended to be administered under
similar testing environments for all students. Many standardized tests, such as the
Stanford Achievement Test 10, report scores to students and schools along with a sample
norm or group norm. Framer and Wall (1997) state that statistical methods determine
placement of the test scores on a normal curve, which should appear in a bell-shaped
curve when graphed. The scores are then plotted and used to compare students from
different locales.
Proponents of standardized testing point to several benefits of the practice.
Supporters argue that standardized testing provides necessary accountability for schools.
Specifically, schools that receive federal funds through the No Child Left Behind Act are
required to meet minimum proficiency benchmarks as set forth by the respective state.
Goldenberg (2005) emphasizes that testing plays a vital role in upholding accountability
in school systems in order to determine whether students are mastering the necessary
critical concepts and skills.

29
Advocates maintain that standardized testing is helpful in determining subject
matter proficiencies of the individual student for placement in advanced classes. In
addition, as science has advanced its understanding of learning disabilities, standardized
testing has become a useful tool in identifying students who require special attention for
successful testing (Cheek & Joy, 2003). Fremmer and Wall (2003) point out that
standardized tests can identify particular issues in individual students whose progress is
hindered by a potential learning disability, thus identifying the need for further diagnostic
testing.
Opportunities for Early Intervention
One of the benefits of standardized testing is the opportunity for proven early
intervention strategies on behalf of students who are failing to meet age-appropriate
educational objectives. A review of the literature on early intervention strategies revealed
that students consistently benefit from early intervention. Prior to the No Child Left
Behind Act of 2002, early intervention strategies were based on a broader range of
subject matter. However, the No Child Left Behind Act of 2002 focused the entirety of its
accountability mechanism on student performance in the subjects of English and Math. A
major research project in 2007, published by the Arizona Department of Education, found
that students in 10 schools who received early intervention for math deficiencies
significantly outperformed similar schools across the state (Judson, 2007).
Intervention strategies can be included in the course program or in alternative
settings such as after school programs. In Chicago, a group of over 650 early childhood
students were assessed and tracked linearly on a 3-year and 5-year year basis. The results
supported the conclusion that students who received intervention in both reading and

30
math consistently outperformed students outside the treatment group (Reynolds &
Temple, 1998). Third and fourth grade students demonstrated a similar response to early
intervention in a 2006 study by the University of Washington (Berninger et al., 2006).
Early intervention in English and math with adolescents has also been shown to
benefit student scores on achievement exams. A study of high performing math students
in one Tennessee high school demonstrated that the school population benefited from
content mastery through post-intervention remediation. The sample of 886 students
collectively scored higher than other Tennessee students and an accompanied survey
indicated students’ self-reported higher motivation levels (Zimmerman & Dibenedetto,
2008). Similarly, high school reading and writing intervention in the subject of English
has also been demonstrated to be effective (Voyager, 2006). Additionally, various types
of research are devoted to early intervention strategies for students with various
conditions such as test anxiety and learning disabilities. Much of this research is devoted
to the effects of intervention strategies prior to student failure. One such study found that
students benefited from simple test taking strategies and accommodations to a
statistically significant degree on graduation exams (Carter et al., 2005).
While research was available that highlights beneficial early intervention
strategies, it should be noted that not all intervention strategies were generally accepted
as successful. This was the case with much of the research surroundings the nation’s
Head Start Program. Founded in 1965, Head Start was an example of social policy
intervention that was designed to offer educational services to underprivileged families of
pre-school children (Welshman, 2010). While a noble goal, a meta-analysis of the
research suggested that the long-term benefits of Head Start are not clear. Specifically,

31
much of the research suggested that although students benefited while enrolled in the
program, these benefits were deemed to be mostly absent by the time the student finished
first grade (Viadero, 2010). In addition to broad impact studies on the overall effect of the
Head Start Program, more specific research has called into question specific aspects of
the program. One such study determined that low and middle-income students achieved
no significant gains in phonological and vocabulary knowledge as a result of their
participation in Head Start pre-kindergarten programs (O'Leary, Cockburn, Powell, &
Diamond, 2010). While proponents of the Head Start Program maintained the costs of the
program are off-set by the cost of later remediation of student learning outcomes, as of
the spring of 2011 many states were considering cutting funding to the program in favor
of alternative programs (Kelleher, 2011). The research suggested that some educators
favored the consideration of other models such as the United Kingdom’s Sure Start
Program (Welshman, 2010).
In addition, research was found that highlighted failures of intervention strategies
in a broad range of areas. Some of these included research that found the intervention
itself was not inherently inadequate, rather the implementation of the intervention
strategy led to no significant gains in student performance. This was especially true in the
research surrounding early literacy intervention strategies (Dickinson & Neuman, 2006).
Also, ample research was discovered that has historically contributed to the treatment of
students with disabilities. One such study found that the traditional practice of grade
retention of students with socio-emotional issues offered no significant advantage to the
student (Anderson, Whipple, & Jimerson, 2011).

32
Minorities and Standardized Testing
The literature that exists on high stakes testing in the United States as it relates to
minority participation is largely qualitative and anecdotal. However, statistics are present
in the research that suggest the high stakes testing environment has had a
disproportionate negative affect on Blacks verses Whites. As evidence, in 2006, a study
found that 40% of Black students passed the Math portion of North Carolina’s high
stakes exam, versus 93% of their White counterparts. Similarly, 94% of North Carolina’s
White student population passed the English portion of the same exam versus 80% of
Black students (McNeil, 2008). North Carolina’s statistics are representative of a larger
problem across the country as evidenced by the Harvard University Civil Rights Project
findings that minorities in the United States consistently experience a higher failure rate
on state assessments (Chenoweth, 2000).
According to some, this phenomenon has led to precisely the opposite of the
desired effect of the No Child Left Behind Act for minority students. As schools become
increasingly focused on high stakes test performance and less focused on college
preparation, students who are upwardly mobile are seeking K-12 educational
opportunities outside of standard public education. This leaves a disproportionate number
of minorities in schools that emphasize low level thinking skills in an effort to pass state
assessments (Lattimore, 2001). In Florida, the National Association for the Advancement
of Colored People (NAACP) has leveled charges that the aforementioned phenomenon
has led to significantly segregated schools. The group points out the addition of programs
for gifted students, while ignoring programs devoted to high stakes test preparation,
further polarizes schools along racial lines (Richard, 2003).

33
In addition to the statistics regarding minority performance on high stakes testing,
qualitative studies suggest minority students experience negative consequences as a result
of the assessments. In Ohio, minority students interviewed for qualitative research report
discontentment with a pedagogical program that is defined by a narrow curriculum
devoted to the sole purpose of passing the state exam (Lattimore, 2005). This research is
echoed repeatedly across the country where minority success on high stakes testing is
disproportionately negative and problems reported by all test takers are seemingly
exacerbated among minorities (Stutz, 2005).
The compilation of this research over the past decade has led to the inevitable and
immediate lawsuits in such states as Louisiana, where some local school districts have
reported as many as 50% of minority students failing the state’s high stakes test
(Robelen, 2000). The issue received national attention in the past 2 years as members of
the Congressional Black Caucus have called for a moratorium on all high stakes testing
nationwide due to the aforementioned minority issues with the test (Darling-Hammond,
2007). The value of high stakes testing among minorities in the United States is in
question; the literature from around the country suggests that the No Child Left Behind
Act may not have the intended consequence for many of America’s minority students.
Socioeconomic Factors Affecting Test Performance
The statistics surrounding student performance on high stakes tests by
socioeconomic background are much more clear. According to the National Poverty
Center at the University of Michigan, over 20%, or 15.4 million children, in the United
States lived in poverty (National Poverty Center, 2008). This has led many to discount
the value of high stakes testing altogether, stating that education should instead be

34
focused on ensuring that these students are sufficiently fed, do not suffer from untreated
vision or hearing problems, and generally are in acceptable health. In other words,
education should more broadly address the causes and effects of poverty on a societal
level (Strauss, 2011). Regardless of the debate surrounding the goal of education, the
current literature consistently demonstrates that poorer schools and impoverished
students underperform their respective counterparts across the country. One such study of
over 14,000 Florida eighth grade students found that students in socioeconomically
disadvantaged areas scored up to 26 percentile points lower on standardized reading tests
(Baker & Johnston, 2010).
The debate surrounding why students in lower socioeconomic classes perform
lower on high stakes test is politically charged. However, there is research that offers
some insight into the contributing factors associated with impoverished student
performance. Some ethnographic research points to the lack of upward mobility by
poorer students into areas where quality education exists (Newman & Chin, 2003).
Meanwhile, interesting anatomical research is also being done that suggests poor students
suffer very real afflictions resulting from poverty that include poor diet, lead poisoning,
and asthma (Armstrong, 2010). Regardless of the reason, in regions of the country where
teachers earn merit pay, studies show this money flows to affluent schools (Stein, 2008).
This has led some to argue that poor students have limited access to good teachers as
highly-qualified teachers are drawn to areas with a history of high merit pay (Tuerk,
2005). Consequently, and perhaps cynically, Mercogliano (2004) argues that standardized
tests only measure income levels and socioeconomic status of students and not their
academic capacity.

35
Non-Native English Speakers’ Test Performance
Another subgroup that has under-performed in the high stakes testing arena is
non-native English speakers. This group of students is assessed via the same instruments
as their native English-speaking counterparts. This raises inevitable concerns regarding
this student group’s ability to compete on the same state mandated assessments. Studies
suggest that 80% of all non-native English speaking American students are Hispanic. Of
this population of students, quantitative studies with large sample sizes suggest that
Hispanics generally perform similarly to other non-native English speaking ethnic groups
(Capraro, Capraro, Yetkiner, Rangel-Chavez, & Lewis, 2010).
Much of the research devoted to Hispanic performance on high stakes testing is
devoted to cultural and ethnic norms that are unique to the Hispanic culture. Evidence of
this is found in surveys of Hispanic individuals via opinion surveys regarding high stakes
testing. In general, Hispanics have been found to have a higher opinion of state mandated
testing and have been found to be more optimistic about the public education system (Lay
& Stokes-Brown, 2009). However, when research is performed in areas with a high
Hispanic population coupled with a high poverty rate, researchers found student attitudes
to closely align with minority students who generally oppose state assessments. The
reasons for dissatisfaction in these surveys generally include poor instructional strategies
and curriculum integration (Bussert-Webb, 2009).
Some recent research suggests that stakeholders in the Hispanic community
believe that their respective performance on high stakes testing is significantly impacted
by a cultural bias (Altshuler & Schmautz, 2006). In essence, it is argued that the cultural
and ethnic norms present in the Hispanic community limit the success of the student on

36
an assessment instrument written for predominantly White, native English-speaking
students. While there may be disparate performance between Hispanics and native
English-speaking students, it is difficult to ascribe this to specific Hispanic cultural and
ethnic differences in light of research by Capraro et al. (2010), who suggest Hispanic
performance is consistent with all other non-native English speaking students of varied
ethnic backgrounds. It seems more likely that Hispanic struggles are similar to other
ethnic groups who consistently score lower on the English portion of high stakes
assessment due in part to their unfamiliarity with the language (Dobbs, 2003).
Students With Learning Disabilities and Test Performance
In recent decades, as a better understanding of students with learning disabilities
reaches the forefront of the American educational system, so has the research improved
on the interaction between learning disabilities and high stakes testing. By and large,
gone are the days where students with learning disabilities were simply referred to as
dumb, and pundits could write articles in major newspapers with titles such as “Extra
Credit for Doing Poorly” when referring to educational accommodations (Robert, 1997,
p. 23). Today, the research is more appropriately focused on the specific accommodations
that may be used to assist students with learning disabilities who are subject to the high
stakes test environment.
Research studies exist in three primary forms for students with learning
disabilities. The research includes studies on reading disabilities, math disabilities, and
writing disabilities. While other research exists, the vast majority of it falls within one of
these three categories, and variations within the categories primarily involve the age of
the learner. A representation of the latest research available for students with reading

37
disabilities includes a study of seventh grade students with reading disabilities.
Researchers found that the subjects were able to perform markedly better versus the
control group when questions were read aloud to them and the exam was administered
over a 2 day period (Fletcher et al., 2009). Similar research suggests that students with
math disabilities also benefit from extended time. In a large 2005 study of 2500 ninth
grade students, it was determined that one of the key contributors to success among
students with math disabilities was an additional allotment of time (Cohen, Gregg, &
Meng, 2005).
The research regarding students with writing disabilities and their performance on
high stakes testing centers around accommodations for students with dyslexia. Students
with dyslexia typically underperform in the areas of vocabulary, spelling, and
handwriting. Quantitative research suggests that allowing students to type their
assessments can significantly help students with dyslexia. Further increases in student
performance are also found when students are allowed the opportunity to edit their typed
answers to high stakes test questions (Gregg, Coleman, Davis, & Chalk, 2007).
The remaining research devoted to the assessment of students with learning
disabilities can be characterized as non-accommodated testing strategies. Current
research suggests that students with learning disabilities can see measurable gains in
performance through an emphasis by the instructor on explicit and detailed instructions
prior to the administration of a given exam (Swain, 2006). Further, the latest research has
found that in addition to accommodations, simple study skill improvements offer students
increased performance on state mandated testing (Steele, 2010).

38
Emphasis on School and Teacher Accountability
Today’s critics of K-12 standardized testing point to the high stakes nature of the
testing process, created by the No Child Left Behind Act of 2002. The act links federal
funding to district performance on state standardized testing. According to critics, this
presents several problems. A system that depends upon a single test to gauge student
performance in a district places a large amount of stress on teachers and administrators
and may contribute to negative outcomes (Popham, 2003). Each year, the news media
includes stories of test fraud from around the country. Reports continue to surface of
teacher impropriety as the pressure leads some educators to outright cheating. According
to one recent article, 1% to 3% of all teachers actually compromise the validity of testing
in order to ensure student performance (Gabriel, 2010). However, a much more subtle
quandary may exist in the classroom instruction amidst the high stakes test culture. Many
teachers will admit to adapting their classroom objectives and instruction for the sole
purpose of teaching particular content covered in the high stakes test (Widemuth,
Madaus, & Haney, 1994). Some authors have suggested this is the primary reason why
American students have continued to decline in their performance on exams administered
around the world. As curriculum continues to narrow in order to achieve passing scores
on high stakes testing, broader knowledge required to compete on global exams has
diminished (Ravitch & Cortese, 2009). This raises a wide range of pedagogical and
ethical questions including the validity of any score improvements and the overall goal of
American education.
With the advent of the No Child Left Behind Act, an increased emphasis was
placed on teacher training. Schools whose students fail to make adequate progress are

39
required to send teachers of the topics in the areas of student academic deficiency to
training workshops in order for the school to receive federal funding. While it is difficult
to ascertain the benefits of this emphasis on teacher accountability, some point out that
the threat of additional professional workshops has contributed to teachers placing too
much emphasis on high stakes test results (Fremmer & Wall, 2003). Once student
performance became linked to teacher pay, teacher unions wasted little time in making
the issue political (Maxwell, 2010).
As administrators feel greater pressure to show adequate proficiency levels,
unintended consequences have arisen for the disadvantaged students that legislation was
purportedly intended to not leave behind. Administrators have disincentives to retain in
their schools the students who tend to score poorly and can be shifted to groups whose
scores will not be included in the aggregated test scores, such as students with behavior
problems and/or learning disorders that can be assigned to alternative and remedial
programs. In these programs outside the mainstream schools and classrooms, they may
have more specialized attention but also fewer opportunities to obtain a standard diploma
than would be afforded them in the mainstream setting (Motley-King, 2008).
Pedagogical Changes and Effects on Student Motivation
Pedagogical concerns resulting from high stakes testing include the over emphasis
on rote memorization and the rehearsal of a process for successfully performing on a
single objective exam. For example, recent research has been focused on how to
effectively integrate proven teaching strategies such as differentiated instruction in an
atmosphere where there appears to be limited time for such practices (Brimijoin, 2005).

40
Critics also maintain that this environment has contributed to an abandonment of many
effective teaching strategies that engage critical thinking skills (Jones et al., 1999).
Teachers, administrators, and communities feel the pressure exerted by the
accountability system prevalent on today’s educational landscape. However, if students
are the objects of education, it is important to consider the affects of the system on the
learner. Student motivation has long been regarded as the key to classroom teaching. In
decades past, students could be expected to desire learning for its intrinsic value.
However, research in recent years suggests that educators are relying heavily upon
determining the best extrinsic motivators for ensuring student success on state mandated
testing (Hoffman & Nottis, 2008). Research on motivation for learning consistently has
shown that intrinsic motivation is more effective for learning, and the presence of
extrinsic motivators can actually detract from and lesson intrinsic motivation to learn
(Crow & Small, 2011).
In addition, some researchers raise questions about the emotional ramifications
for students when basing grade level promotions or even graduation on a student’s
performance on a single objective exam (Gay, 1990). The pressure on a student to
succeed on a single quantitative high stakes test that is administered annually can be
immense, leading to self-esteem issues for students who fall short of the mark (Kruger,
Wandle, & Struzziero, 2007). Some researchers suggest that the failure to recognize
qualitative learning and the resultant impact on a student’s self-esteem is the largest
drawback to high stakes testing (Bracey, 2001).

41
Predictors of College Success
Many students, regardless of language, ethnicity, or learning disability, associate
their performance on the K-12 standardized test with predictive college success. It should
be noted that the goal of many of these exams is to measure proficiency on state or
national educational objectives. As such, the quality of a given test as a predictor of
college success is predicated upon the state adopting objectives that are set forth by
colleges and universities. Therefore, it would be erroneous to assume K-12 standardized
test performance is a valid predictor of student performance in college. This
determination would only come through a correlational evaluation of each respective
exam, such as the ACT Corporation’s college entrance exam.
Since many of America’s colleges and universities require a college entrance
exam for admission, many prospective college students believe their performance on the
assessment is the primary indicator of their potential college success. An analysis of the
research indicates this may not be true. When considering prospective college success,
the research suggests K-12 performance, curriculum, cultural issues, and other factors
associated with the students’ previous education may be a better predictor of college
success versus a single admission exam.
Gronna (1998) states that when most people are asked about the uses of K-12
standardized tests, they usually reference future college success; however, he points out a
better predictor of success may be student grade point averages for the junior and senior
years of high school. In fact, colleges and universities find that utilizing student grades in
conjunction with college entrance exams offers better prediction of college success.

42
According to one study of 81,000 California students, the single biggest predictor of
second-year college grade point average was success during high school on an Advanced
Placement Exam (AP Courses, 2005). Similarly, research suggests that high school grade
point averages and class rank are often better predictors of college success than
admission scores (Kirby, White, & Aruguete, 2007). The review of the literature suggests
this is particularly true for minority students and has led some colleges and universities to
abandon the college admission exam altogether (Cloud, 1997). Additionally, certain
ethnic populations have pointed to cultural bias in admissions tests and proposed other
factors to consider, such as student motivation, when evaluating a student’s potential
college success (Strage, 2000). Finally, a review of the literature on predictors of college
success reveals an eclectic amalgam of studies that range from proposed alternative tests
(Olson, 2006) to studies that suggest a correlation between low college grade point
averages and the existence of a large percentage of part-time instructional staff (Burgess
& Samuels, 1999).
College Entrance Exams
For admission to a college or university in the United States, most high school
diploma holders are required to be assessed via one of two college entrance exams. The
Scholastic Aptitude Test and the ACT exam (formerly known as the American College
Testing Exam) are the two major college entrance exams, which have been in existence
for over the past 50 years (Rothstein & Jesse, 2004). The exams are used for the
evaluation of prospective students in American colleges and universities along with other
factors such as high school grade point averages and extra-curricular activities. The two
exams are both widely accepted for admissions purposes, however some colleges still

43
require one exam over the other as an admission criteria (Doyle, 2006). College entrance
exams have been in existence since the early 1900s (Pine, 2008). Initially they were
necessitated by the existence of great disperity in the quality of the educational system
across the United States. Though the ACT Exam and the Scholastic Aptitude Test hold
similar roles, there are differences in the content, administration, subjects assessed, and
timing of the tests. The Scholastic Aptitude Test is administered by a national body
known as the College Board, while ACT is administered by a private company known as
The ACT Corporation (Rothstein & Jesse, 2004). The exams have registered increasing
popularity not only in the United States but also in other countries (Doyle, 2006).
Colleges have found the subjects included in the exams to be an essential way of
assessing the eligibility of students joining the colleges and universities from across the
world.
The ACT exam. According to Contreras (2005), the ACT Exam is a college
entrance exam used in the United States and its territories for admission into various
colleges. The exam was developed and is administered by an American company
formerly known as the American College Testing Company. The subjects included in the
exams are considered the most important subjects in the high school curriculum as a
predictor for college success. The subjects included on the ACT Exam are mathematics,
English, reading, and science. Contreras (2005) maintains that the exam measures the
academic knowledge in core subjects that a student has acquired in his or her formal
education prior to college admission. Colleges and universities use student performance
on the ACT Exam in two primary ways. Colleges use individual student scores to
compare students’ academic preparation from high schools all over the country. In
44
addition, the ACT Exam, along with other factors, plays a significant role in merit-based
scholarship awards by colleges and universities each year. The fact that the results of
student performance on the ACT Exam can be used to enable accessibility to funds and
scholarships is indicative of the vital role the exam plays for millions of Americans who
are seeking higher education (Shavelson, 2007).
The Scholastic Aptitude Test. The Scholastic Aptitude Test is administered by
the College Board to junior and senior high school students. The College Board is a
nation-wide, non-profit association whose stated mission is to connect students to college
success and opportunity (College Board, 2010). The College Board was started in 1900
and has to its credit 3800 schools, colleges, and universities as its members. The original
rise in popularity of the Scholastic Aptitude Test was a result of the increasing number of
colleges requiring the exam for admission and other services the corporation offered
(Napoli & Raymond, 2004). In 1901, 973 students were administered the Scholastic
Aptitude Test in the United States and Europe (Doyle, 2006). Today, according to Napoli
and Raymond (2004), the College Board connects over 22,000 high school graduates
with 3500 colleges every year. Colleges use the entrance exams such as the Scholastic
Aptitude Test in two primary ways. The initial use was a standardization tool to compare
students from across the United States that have different educational backgrounds. In
addition, exams such as the Scholastic Aptitude Test are used as a key component in
evaluating students for merit-based scholarships. The Scholastic Aptitude Test was
originally developed by Carl Brigham, a psychologist who also worked on the Army
Alpha and Beta tests. These tests were initially used by colleges and universities in the
northeastern parts of the United States to eliminate bias in exams, especially between

45
people of different social-economic backgrounds. Authors argue that this humble
background of the Scholastic Aptitude Test has enabled its success.
Most authors agree that the importance of college entrance exams is found in the
measurement of literacy, level of numeracy, and writing skills. These are important skills
needed for academic success in the college. For example, the Scholastic Aptitude Test is
focused on assessing how college entrants taking the exam can analyze and solve
problems (Napoli & Raymond, 2004). This means that the exam attempts to ensure that
those students joining colleges possess these important skills. Colleges depend on the
outcomes of college entrance exams, together with grade point averages and other
factors, to determine who receives admission to the college or university. Studies suggest
that performance on college admissions tests and high school gradepoint averages serve
as a valid predictor of success by students during their freshmen year of college
(Frederick, 2005).
Despite the popularity of the Scholastic Aptitude Test, the test has met with
criticism throughout its history. There were wide spread accusations that the exams were
designed with open bias to certain segments of the population. This was depicted in the
structure and terminology of questions commonly associated with analogy questions.
Detractors of the Scholastic Aptitude Test maintained that certain questions possessed
bias that led under-privileged or minority students to underperform on the exam when
compared to their counterparts. Ultimately, analogy questions were replaced with short
reading comprehension questions. Throughout the last decade, claims of test bias have
led some colleges and universities to waive the Scholastic Aptitude Test as a requirment
for admission (Frederick, 2005).

46
A comparison. A survey of the current competition between the Scholastic
Aptitude Test and ACT exams reveals that the Scholastic Aptitude Test has always had a
larger number of test-takers nationwide. However, in the past decade the ACT has closed
the gap and gained in popularity. In 2007, 1.5 million students took the Scholastic
Aptitude Test while 1.2 million took the ACT exam (DeGregorio & Bartosiewicz, 2007).
This marked the closest the ACT had come to rivaling its Scholastic Aptitude Test
counterpart. Experts suggest this narrowing gap between the two tests is a result of
students’ comfort level with a test that more closely resembles their high school
achievement tests and resultant curriculum. Students who are subject to standardized
testing apparently prefer an achievement-based test versus an aptitude test when it comes
to college admission testing (DeGregorio & Bartosiewicz, 2007).
Interestingly, the popularity of each exam appears to be somewhat linked to the
geography of the United States. The Scholastic Aptitude Test is most popular on the East
and West coasts of the country while the ACT has consistently assessed more students in
America’s heartland (Barnes, 2002). While it is unknown why this phenomenon exists,
each exam has taken on a different reputation. The Scholastic Aptitude Test exam, with
its aptitude emphasis, has become the assessment known as the test that measures a
student’s ability to learn. Meanwhile, the ACT exam, with its achievement emphasis, has
become the assessment known as the best option for determining what a student has
learned (Barnes, 2002). One must ask if the research supports these stereotypes. When
evaluating the ACT exam, the answer appears to be “no.” Recent quantitative studies
suggest that the ACT exam can also adequately predict student aptitude and intelligence
quotient (IQ). One such study measured approximately 1200 student ACT scores with

47
two separate intelligence tests and found a high correlation of a predictive nature between
the ACT and both intelligence exams (Koenig, Frey, & Detterman, 2008). What is more,
studies completed in the last year indicate self-reported student anxiety is lower with the
ACT, and minorities are showing marked improvement on the ACT exam, leading some
to suggest it may increase minority interest in attending college (Galuska, 2010).
Summary
It is important to note that high stakes tests in the United States have become a
debate that extends far beyond educational circles. In reality, the topic has become a
political issue with far more stakeholders than the educational theorist or practitioner.
The students continue to be caught in the debate as high school exit exams and college
admission tests redefine success as showing the least student decline each year on test
scores (Marklein, 2010).

48
Chapter Three: Methodology
Introduction
This study was designed to determine if there was a predictive correlation
between student performance on the sixth grade Stanford Achievement Test 10 and the
eighth grade Explore Exam among a population of North Texas students. If certain
strands of the sixth grade exam were found to be valid predictors of performance on the
eighth grade exam’s subject tests, then early interventions can be designed to help under-
performing members of the population in sixth grade. This will serve to better prepare
this population of students for their eighth grade exams. The Stanford Achievement Test
is a typical representation of the K-12 high stakes test that was mandated by the 2002
legislation known as the No Child Left Behind Act. The Explore Exam is the first college
readiness exam available to students offered by either the College Board or the ACT
Corporation. The Explore Exam is available to students beginning in eighth grade and
offers a prediction of student performance on the subsequent college admissions test
known as the ACT Exam. In addition, the ACT Corporation engages in an ongoing study
that correlates student performance on the Explore Exam with subsequent college success
as measured by the students’ grade point averages. The findings of this study were
noteworthy as much of the current research ignores the lack of an established statistical
connection between K-12 achievement testing and college readiness.
This quantitative study measures student performance on the Stanford
Achievement Test 10 in sixth grade and subsequently measures the same students’
performance on the eighth grade Explore Exam for a given population of students in

49
North Texas. Each strand from the sixth grade assessment in the areas of reading,
science, math, and English is measured against the subject test score of the eighth grade
assessment. The analysis includes the use of the Pearson correlation statistic, multi-linear
regression analysis, and R-square analysis.
Design
This was a quantitative, cross-sectional correlational study that used archived
student performance data. According to Creswell (2008), this research design provided an
objective means for analyzing student performance via two valid instruments to
determine the relationships among variables imbedded within each respective exam. A
quantitative correlation study design was used in order to isolate the quantifiable
variables of interest. The purpose of this study was to evaluate the correlation between
the variables through Pearson’s correlation statistic, multi-linear regression analysis, and
R-square analysis. This research analysis was chosen for its thorough methodology and
likelihood of identifying statistical significance between the variables, should it exist. The
research includes four main hypotheses.
Research Questions and Hypotheses
The following research questions and hypotheses have guided the present study.
Research question 1. Which, if any, of the 12 reading strand scores on the sixth
grade Stanford Achievement Test explain the greatest percentage of variance in the
eighth grade ACT Explore reading test score among students who attended a K-12 school
in North Texas?

50
• Hypothesis 1: H0: None of the 12 sixth grade standardized test strand scores
relating to reading explain any variance in the eighth grade ACT Explore reading
test score among students who attend a K-12 school in North Texas.
• Ha: One or more of the 12 sixth grade standardized test strand scores relating to
reading explain a statistically significant percentage of variance in the eighth
grade ACT Explore reading test score among students who attend a K-12 school
in North Texas.
Research question 2. Which, if any, of the eight science strand scores on the
sixth grade Stanford Achievement Test explain the greatest percentage of variance in the
eighth grade ACT Explore science test score among students who attended a K-12 school
in North Texas?
• Hypothesis 2: H0: None of the eight sixth grade standardized test strand scores
relating to science explain any variance in the eighth grade ACT Explore science
test score among students who attend a K-12 school in North Texas.
• Ha: One or more of the eight sixth grade standardized test strand scores relating to
science explain a statistically significant percentage of variance in the eighth
grade ACT Explore science test score among students who attend a K-12 school
in North Texas.
Research question 3. Which, if any, of the 15 math strand scores on the sixth
grade Stanford Achievement Test explain the greatest percentage of variance in the
eighth grade ACT Explore math test score among students who attended a K-12 school in
North Texas?

51
• Hypothesis 3: H0: None of the 15 sixth grade standardized test strand scores
relating to math explain any variance in the eighth grade ACT Explore math test
score among students who attend a K-12 school in North Texas.
• Ha: One or more of the 15 sixth grade standardized test strand scores relating to
math explain a statistically significant percentage of variance in the eighth grade
ACT Explore math test score among students who attend a K-12 school in North
Texas.
Research question 4. Which, if any, of the 11 sixth grade English scores on the
Stanford Achievement Test explain the greatest percentage of variance in the eighth
grade ACT Explore English test score among students who attended a K-12 school in
North Texas?
• Hypothesis 4: H0: None of the 11 sixth grade standardized test strand scores
relating to English explain any variance in the eighth grade ACT Explore English
test score among students who attend a K-12 school in North Texas.
• Ha: One or more of the 11 sixth grade standardized test strand scores relating to
English explain a statistically significant percentage of variance in the eighth
grade ACT Explore Exam English test score among students who attend a K-12
school in North Texas.
Participants
The study took place in a private Christian day school in its 9th year of existence.
The school’s admissions policy required students to be academically above average.
Specifically, prospective students are required to have a minimum complete battery
stanine of five on the Stanford Achievement Test 10. There were 191 potential subjects

52
eligible for inclusion in this research. Selection and participation in the research was
based on a convenience sample with a selection solely determined by the enrollment date
and subsequent administering of the two assessment tools between the years of 2005-
2009. All students included in the study were enrolled in sixth grade during 2005 and
subsequently completed eighth grade at the same school in 2009. Eligibility for inclusion
in the study began with 191 sixth graders who were initially administered the Stanford
Achievement Test 10 by the school; and, 123 of these students were subsequently tested
in eighth grade. During the study, 68 students were considered dropouts and several
factors could have attributed to this. First, as a tuition based school and given the national
economic environment during the period of this study, the school population became
somewhat transient with some students seeking alternative educational venues. In
addition, absenteeism on a single portion of either exam precluded student participation
in this study. It should also be noted that the school’s program for homeschooling
students offered student testing as an optional service and therefore impacted the number
of students assessed via each instrument in a given year. Stringent measures were taken
to safeguard the anonymity of the students and their respective scores, as described in
detail in the subsequent section on data collection procedures. Of the 123 subjects, 11%
identified themselves as minority, 54% were female, and 46% were male.
Setting
The school site for this study was located in the southern United States, in what is
known as the Dallas-Fort Worth Metroplex, situated in North Texas. The region includes
a dense urban population of over 10 million people (North Central Texas Council of
Governments, 2009). Included in this population are a myriad of K-12 private education

53
entities, including 80 schools accredited or recognized by the Association of Christian
Schools International (2009b). The dynamic created by the competition of many different
tuition based schools has created the need for schools in the area to offer a broad range of
student activities while maintaining academic proficiency. In addition to the academic
program, the school offers a wide array of athletic and fine art opportunities for students.
Also, the school incorporated a program for a limited number of students with learning
disabilities and included an enrichment program for K-8 home-school students.
The school where the research was conducted is a PK4-12, co-educational, private
Christian day school. The student enrollment was 731 students and had steadily increased
since the school’s inception in 1999. The demographic breakdown of the school mirrored
the local community with approximately 11% of students identifying themselves as
minority. The school was registered as a 501.C3 not-for-profit tax entity and incorporated
an undisclosed amount of funds for financial aid in each annual budget. An independent,
self-perpetuating board that was not connected to any outside church led the institution
through the onsite management of a school president and leadership team. The school
was self-described as a Christian educational institution and sought to hire teachers and
enroll students in concert with its statement of faith. The school was concurrently
accredited by the Southern Association of Christian Schools and the Association of
Christian Schools International.
Instrumentation
The two assessment instruments used in this project were the Stanford
Achievement Test 10, published by Pearson Education, and the ACT Corporation’s
Explore Exam. The Stanford Achievement Test 10 was selected because of the

54
accessibility of the data at the subject school due to its testing policy. However, it should
be noted that the Stanford Achievement Test 10 is an extremely popular achievement test
that was administered in over 5700 private schools last year as well as serving as the state
tests for Arkansas and Alabama (ACSI, 2008). The Stanford Achievement Test 10 has a
statistical reliability figure of .87 (Technical Manual, 2003).
The ACT Corporation’s Explore Exam was selected because it is the only college
readiness assessment available to students as young as eighth grade. The Explore Exam is
a fast growing college assessment that is a component of the ACT Corporation’s EPASS
program, which seeks to gauge college readiness as students enter high school (ACT
Corporation, 2010c). The EPASS program includes subsequent assessment components
during each year of high school. The assessment program concludes with students being
administered the ACT college entrance exam. The reliability of the Explore Exam is .85
(ACT Corporation, 2007). It should be further noted that the ACT Corporation monitors
select students’ college grade point averages and has found a statistically significant
correlation between the students’ scores and their previous performance on the eighth
grade Explore Exam.
Procedures
Data collection procedures. For the purposes of this study, students were
required to be assessed by the Stanford Achievement Test 10 and the ACT Explore
Exam. These assessments are an annual practice at the school site as a part of the school’s
curriculum evaluation cycle. The sixth grade students are assessed by the Stanford
Achievement Test 10 and the eighth grade students were assessed with the ACT Explore
Exam during the spring of the sixth grade and eighth grade years respectively. Scores are

55
reported back to the school with group summaries and individual student reports. The
parents of these students are also issued score reports. Once the testing is completed,
there are no further requirements of the students.
The following steps were taken in the data collection process to ensure subject
anonymity. First, following a formal, verbal request, the Office of the President of the
subject school took the existing data from the sixth grade Stanford Achievement Test
scores and reconciled the list of students with students who were subsequently assessed
by the school via the ACT Explore Exam in the eighth grade year. Once the list was
compiled, the Office of the President made a request to the President of the ACT
Corporation. The request was for the Detailed Item Analysis scores from the Explore
Exam for the students in question. Upon receipt of the Explore Exam scores, the Office
of the President removed all identifying student information including, but not limited to,
the student name, identification number, and date of birth. Instead, students were
assigned a random number beginning with 01. Once the initial compilation of data was
complete, it was entered into a Microsoft Office Excel spreadsheet that was used for
SPSS analysis. After the initial data entry was completed, two additional individuals
manually reviewed all score inputs to ensure accuracy. Once completed and agreed to by
the Office of the President of the school, the data were sent to the researcher for analysis.
Data analysis. All statistical analyses were performed using SPSS Statistics for
Windows. All of the analyses were two-tailed with a 5% alpha level. Demographic
characteristics of the study sample were described using (a) the mean, standard deviation,
and range for continuous scaled variables, and (b) frequency and percent for categorical
scaled variables. Pearson’s correlation statistic was used to analyze the relationship

56
among each of the sixth-grade Stanford Achievement Test sub-strand scores in the areas
of reading, science, math, and English with the overall Explore Exam score within each
subject area. Specifically, Pearson’s correlation statistic was used to relate each of the 12
sixth grade standardized test strand scores relating to reading individually with the eighth
grade ACT Explore reading test score. Next, Pearson’s correlation statistic was used to
compare each of the 8 sixth grade standardized test strand scores relating to science
individually with the eighth grade ACT Explore science test score. In addition, Pearson’s
correlation statistic was used to compare each of the 15 sixth grade standardized test
strand scores relating to math individually with the eighth grade ACT Explore math test
score. Finally, Pearson’s correlation statistic was used to compare each of the 11 sixth
grade standardized test strand scores relating to English individually with the eighth
grade ACT Explore English test score. For a visual breakdown of the sixth grade strands
grouped by the eighth grade subject matter test, please reference Table 1.1.
Hypothesis 1 was tested using stepwise multiple linear regression analysis.
Stepwise model selection was chosen in order to avoid multicollinearity and over fitting
the model (Friedman, & Wall, 2005). The dependent variable in the regression model was
the eighth grade ACT Explore reading test score. The candidate independent variables
were the 12 sixth grade standardized test strand scores relating to reading (see Table 1.1).
If any one of the 12 sixth grade standardized test strand scores relating to reading were
found to be statistically significant, then the null hypothesis would be rejected and it
would be concluded that one or more sixth grade standardized test strand scores relating
to reading is a valid predictor of the eighth grade ACT Explore reading test score. The

57
equation of the model was reported and statistically significant regression coefficients
were interpreted. The R-square for the final model was also presented and interpreted.
Similarly, Hypothesis 2 was tested using stepwise multiple linear regression
analysis. The dependent variable in the regression model was the eighth grade ACT
Explore science test score. The candidate independent variables were the 8 sixth grade
standardized test strand scores relating to science (see Table 1.1). If any one of the 8 sixth
grade standardized test strand scores relating to science were to be statistically
significant, then the null hypothesis would be rejected, and it would be concluded that
one or more sixth grade standardized test strand scores relating to science is a valid
predictor of the eighth grade ACT Explore reading test score. The equation of the model
was reported and statistically significant regression coefficients were interpreted. The R-
square for the final model was also presented and interpreted.
Likewise, Hypothesis 3 was tested using stepwise multiple linear regression
analysis. The dependent variable in the regression model was the eighth grade ACT
Explore math test score. The candidate independent variables were the 15 sixth grade
standardized test strand scores relating to math (see Table 1.1). If any one of the 15 sixth
grade standardized test strand scores relating to math were to be statistically significant,
then the null hypothesis would be rejected, and it would be concluded that one or more
sixth grade standardized test strand scores relating to math is a valid predictor of the
eighth grade ACT Explore math test score. The equation of the model was reported and
statistically significant regression coefficients were interpreted. The R-square for the
final model was presented and interpreted.

58
Finally, Hypothesis 4 was tested using stepwise multiple linear regression
analysis. The dependent variable in the regression model was the eighth grade ACT
Explore English test score. The candidate independent variables were the 11 sixth grade
standardized test strand scores relating to English (see Table 1.1). If any one of the 11
sixth grade standardized test strand scores relating to English were to be statistically
significant, then the null hypothesis would be rejected, and it would be concluded that
one or more sixth grade standardized test strand scores relating to English is a valid
predictor of the eighth grade ACT Explore English test score. The equation of the model
was reported and statistically significant regression coefficients were interpreted. The R-
square for the final model was also presented and interpreted.
Sample size justification. The power calculations were performed using the
Power Analysis and Sample Size (PASS) software (Hintze, 2008). As discussed
elsewhere in the research, the researcher had access to a sample size of 123 for this study.
Hypotheses 1 through 4 were tested using multiple linear regression analysis. Power
analysis for multiple linear regression analysis is based on the amount of change in R-
squared attributed to the variables of interest. According to Cohen (1988), small,
medium, and large effect sizes for hypothesis tests about R-squared are: R-squared =
0.0196, R-squared = 0.13, and R-squared = 0.26 respectively. A sample size of 123
achieves 80% power to detect an R-squared of 0.06 (which is a small to medium effect
size) attributed to one independent variable using an F-test with a significance level
(alpha) of 0.05. However, the number of independent variables in the model has an
influence on the effect size that can be detected with a given sample size, alpha level, and
power. Since stepwise model selection was used to test the hypotheses, the number of

59
independent variables that were actually included in the model could not be known prior
to conducting the analysis. Nevertheless, the fewest number of independent variables that
could be in the model was 1 and the most was 15 (hypothesis 3). Thus, Table 3.1 shows
the detectable effect sizes with a sample size of 123, an alpha level of 0.05, and power of
0.80 for various numbers of independent variables. Based on Table 3.1, a sample size of
123 was justifiable for detecting medium to large effect sizes for hypotheses 1 through 4.
Table 3.1
Detectable Effect Sizes Using Multiple Linear Regression Analysis
Number of Independent Variables
Effect Size
1
0.06
2 0.07 3 0.08 4 0.09 5 0.10 6 0.10 7 0.11 8 0.11 9 0.12 10 0.12 11 0.13 12 0.13 13 0.14 14 0.14 15 0.14
Note. The analysis uses a sample size of 123, alpha of 0.05, power of 0.80 for various numbers of independent variables.

60
Chapter Four: Results
Overview
As was discussed in Chapter One, the purpose of this study was to determine if
there is a predictive correlation between a specific sixth grade achievement test known as
the Stanford Achievement Test 10 and the eighth grade college readiness assessment
instrument known as the Explore Exam for a group of North Texas students. Within each
of the four subjects of reading, science, math, and English, the research question that was
answered is what, if any, correlation is there between sixth grade Stanford Achievement
Test 10 scores and eighth grade ACT Explore Exam scores among 123 students who
attend a K-12 school in North Texas. This study evaluated the correlation between the
variables through Pearson’s correlation statistic and multi-linear regression analysis. The
independent variables for this study were the sixth grade Stanford Achievement Test 10
subtest scores, while the dependent variables were the corresponding eighth grade
Explore Exam subject test scores as described in Chapter One. As also discussed in
Chapter One, all scores are reported in percentiles. After an initial reporting of the
descriptive statistics for student performance on the Stanford Achievement Test 10 and
the Explore Exam, this chapter is organized by reported findings according to the
research questions and hypotheses as described in Chapter One and in the following
subsections.

61
Research Questions and Hypotheses
The following research questions and hypotheses have guided the present study.
Research question 1. Which, if any, of the 12 reading strand scores on the sixth
grade Stanford Achievement Test explain the greatest percentage of variance in the
eighth grade ACT Explore reading test score among students who attended a K-12 school
in North Texas?
• Hypothesis 1: H0: None of the 12 sixth grade standardized test strand scores
relating to reading explain any variance in the eighth grade ACT Explore reading
test score among students who attend a K-12 school in North Texas.
• Ha: One or more of the 12 sixth grade standardized test strand scores relating to
reading explain a statistically significant percentage of variance in the eighth
grade ACT Explore reading test score among students who attend a K-12 school
in North Texas.
Research question 2. Which, if any, of the eight science strand scores on the
sixth grade Stanford Achievement Test explain the greatest percentage of variance in the
eighth grade ACT Explore science test score among students who attended a K-12 school
in North Texas?
• Hypothesis 2: H0: None of the eight sixth grade standardized test strand scores
relating to science explain any variance in the eighth grade ACT Explore science
test score among students who attend a K-12 school in North Texas.
• Ha: One or more of the eight sixth grade standardized test strand scores relating to
science explain a statistically significant percentage of variance in the eighth

62
grade ACT Explore science test score among students who attend a K-12 school
in North Texas.
Research question 3. Which, if any, of the 15 math strand scores on the sixth
grade Stanford Achievement Test explain the greatest percentage of variance in the
eighth grade ACT Explore math test score among students who attended a K-12 school in
North Texas?
• Hypothesis 3: H0: None of the 15 sixth grade standardized test strand scores
relating to math explain any variance in the eighth grade ACT Explore math test
score among students who attend a K-12 school in North Texas.
• Ha: One or more of the 15 sixth grade standardized test strand scores relating to
math explain a statistically significant percentage of variance in the eighth grade
ACT Explore math test score among students who attend a K-12 school in North
Texas.
Research question 4. Which, if any, of the 11 sixth grade English scores on the
Stanford Achievement Test explain the greatest percentage of variance in the eighth
grade ACT Explore English test score among students who attended a K-12 school in
North Texas?
• Hypothesis 4: H0: None of the 11 sixth grade standardized test strand scores
relating to English explain any variance in the eighth grade ACT Explore English
test score among students who attend a K-12 school in North Texas.
• Ha: One or more of the 11 sixth grade standardized test strand scores relating to
English explain a statistically significant percentage of variance in the eighth

63
grade ACT Explore Exam English test score among students who attend a K-12
school in North Texas.
Descriptive Statistics for the Independent and Dependent Variables
Table 4.1 shows descriptive statistics for the sixth grade Stanford Achievement
Test 10 reading test scores. Considering the lowest possible score was 0 and the highest
possible score was 100, all of the test scores were relatively high on average. The average
test scores ranged from 76.0 to 88.5. The test with the lowest average was Informational,
and the test with the highest average was Context Clues. The Strategies test score had the
greatest variability with a minimum score of 20 and a maximum of 100. The Initial
Understanding test had the least variability, with a minimum of 58.3 and a maximum of
100.
Table 4.1
Descriptive Statistics for the Sixth Grade Stanford Achievement Test 10 Reading Test Scores
Topic Valid N Missing N Mean SD Min. Max. Synonyms
123
0
84.4173
13.36742
41.67
100.00
Multiple meaning words 123 0 88.4372 12.91374 44.44 100.00 Context clues 123 0 88.5276 13.18796 33.33 100.00 Thinking skills – Vocabulary
123 0 88.0307 11.40398 38.89 100.00
Literary 123 0 84.5980 13.09310 44.44 100.00 Informational 123 0 76.0163 15.02742 38.89 100.00 Functional 123 0 83.5592 13.96425 38.89 100.00 Initial understanding 123 0 84.6883 10.74279 58.33 100.00 Interpretation 123 0 83.3333 12.34190 45.00 100.00 Critical analysis 123 0 79.0650 15.80296 33.33 100.00 Strategies 123 0 77.0732 17.63620 20.00 100.00 Thinking skills – Comprehension
123 0 80.4684 13.14379 42.86 100.00

64
Table 4.2 shows descriptive statistics for the sixth grade Stanford Achievement
Test 10 science test scores. The average test scores were generally lower than the average
test scores for reading. The average test scores ranged from 67.8 to 80.0. The Physical
test score had the lowest average while the Constancy test score had the highest average.
The Physical test score had the greatest amount of variation with a minimum of 18.2 and
a maximum of 100. The Life score had the least amount of variation with a range of 45.5
to 100.
Table 4.2
Descriptive Statistics for the Sixth Grade Stanford Achievement Test 10 Science Test Scores
Topic Valid N Missing N Mean SD Min. Max. Life
123
0
78.9357
13.13366
45.45
100.00
Physical 123 0 67.8492 16.09873 18.18 100.00 Earth 123 0 77.3097 15.10358 36.36 100.00 Nature of science 123 0 76.0743 17.10925 14.29 100.00 Models 123 0 71.8351 15.06373 28.57 100.00 Constancy 123 0 79.9875 13.60230 23.08 100.00 Form and function 123 0 73.1707 13.37310 38.46 100.00 Thinking skills – Science
123 0 75.2033 13.14170 35.00 100.00
Table 4.3 shows descriptive statistics for the sixth grade Stanford Achievement
Test 10 math test scores. The average test scores ranged from 56.1 to 81.9. The
Reasoning and Problem Solving test score had the lowest average while the Computation
with Whole Numbers test score had the highest average. The Communication and
Representation test score had the greatest amount of variation with a minimum of 0.0 and
a maximum of 100. The Thinking Skills – Problem Solving score had the least amount of
variation with a range of 24.4 to 95.1.

65
Table 4.3
Descriptive Statistics for the Sixth Grade Stanford Achievement Test 10 Math Test Scores
Topic Valid N Missing N Mean SD Min. Max. Number sense and operations
123
0
63.3407
19.46601
18.18
100.00
Patterns, relationships, and algebra
123 0 66.0859 25.56804 14.29 100.00
Data, statistics, and probability
123 0 63.1098 21.04187 12.50 100.00
Geometry and measurement 123 0 71.9143 19.51200 18.18 100.00 Communication and representation
123 0 66.6667 25.30686 .00 100.00
Estimation 123 0 66.7480 20.02031 20.00 100.00 Mathematical connections 123 0 70.0736 18.23522 19.05 100.00 Reasoning and problem solving
123 0 56.0976 21.55375 8.33 100.00
Thinking skills – Problem solving
123 0 65.4174 16.93562 24.39 95.12
Computation with whole numbers
123 0 81.8699 17.28970 20.00 100.00
Computation with decimals 123 0 70.7317 20.84961 20.00 100.00 Computation with fractions 123 0 58.1301 26.27581 8.33 100.00 Computation in context 123 0 69.9695 19.29964 18.75 100.00 Computation and symbolic notation
123 0 69.0041 19.77069 12.50 100.00
Thinking skills – Procedures
123 0 69.9695 19.29964 18.75 100.00
Table 4.4 shows descriptive statistics for the sixth grade Stanford Achievement
Test 10 English test scores. The average test scores ranged from 71.2 to 90.2. The
Phonetic Principles test score had the lowest average while the Usage test score had the
highest average. The Content and Organization test score had the greatest amount of
variation with a range of 11.1 to 100. The No Mistakes score had the least amount of
variation with a range of 42.9 to 100.

66
Table 4.4
Descriptive Statistics for the Sixth Grade Stanford Achievement Test 10 English Test Scores
Topic Valid N Missing N Mean SD Min. Max. Capitalization
123
0
81.3008
16.81429
12.50
100.00
Usage 123 0 90.2439 12.85725 37.50 100.00 Punctuation 123 0 75.0000 18.45742 25.00 100.00 Sentence structure 123 0 83.4146 16.08529 30.00 100.00 Prewriting 123 0 84.8780 15.85621 40.00 100.00 Content and organization
123 0 81.8428 15.92257 11.11 100.00
Thinking skills – Language expression
123 0 82.1138 14.30234 33.33 100.00
Phonetic principles 123 0 71.1834 18.52633 27.78 100.00 Structural principles 123 0 75.8537 20.20091 30.00 100.00 No mistakes 123 0 87.6887 14.44006 42.86 100.00 Homophones 123 0 74.6341 23.05705 20.00 100.00
Table 4.5 shows descriptive statistics for the eighth grade Explore Exam test
scores. The average test scores ranged from 64.6 to 77.9. The Math test score had the
lowest average while the English test score had the highest average. The Science test
score had the greatest amount of variation with a range of 21.4 to 100. The English score
had the least amount of variation with a range of 45.0 to 100.
Table 4.5
Descriptive Statistics for the Eighth Grade Explore Exam Test Scores
Test Topic N Mean SD Min. Max. 8th grade reading
123
0
72.6829
18.23575
23.33
100.00
8th grade science 123 0 66.8118 18.76906 21.43 100.00 8th grade math 123 0 64.5528 15.68862 23.33 96.67 8th grade English
123 0 77.8659 12.03514 45.00 100.00

67
Pearson’s Correlation Statistics
Each individual sixth grade sub-test was compared with the eighth grade test
using Pearson’s correlation statistic. It is possible for each of the subtests to be
individually correlated with the dependent variable, yet not all may be statistically
significant in the same multiple linear regression analysis. The various sub-tests may not
explain independent variance in the dependent variable. For example, it is possible that
all 12 subtests are individually correlated with the eighth grade test, and yet, once one
knows a student’s scores on the first three subtests, the other nine test scores may not add
additional predictive information about the eighth grade test beyond the predictive
information provided by the first three subtests.
Reading. Table 4.6 shows the Pearson correlation statistics for comparing each
of the sixth grade Stanford Achievement Test 10 reading subtest scores with the eighth
grade Explore reading test score. There were statistically significant, positive correlations
between each of the sixth grade subtest scores and the eighth grade test score. The
strength of the correlations ranged from .362 to .621. The Multiple Meaning Words test
score had the weakest correlation with the eighth grade test score while the Thinking
Skills – Comprehension test score had the strongest correlation with the eighth grade test
score.

68
Table 4.6
Pearson’s Correlation Statistics for Sixth Grade Stanford Achievement Test 10 Reading Test Scores Versus the Eighth Grade Explore Reading Test Scores
Test Topic Pearson Correlation Synonyms
.512*
Multiple meaning words .362* Context clues .405* Thinking skills – Vocabulary .518* Literary .499* Informational .585* Functional .563* Initial understanding .553* Interpretation .603* Critical analysis .516* Strategies .609* Thinking skills – Comprehension
.621*
Note. N = 123, * indicates p < .001
Science. Table 4.7 shows the Pearson correlation statistics for comparing each of
the sixth grade Stanford Achievement Test 10 science subtest scores with the eighth
grade Explore science test score. There were statistically significant, positive correlations
between each of the sixth grade subtest scores and the eighth grade test score. The
strength of the correlations ranged from .322 to .499. The Earth test score had the
weakest correlation with the eighth grade test score while the Physical test score had the
strongest correlation with the eighth grade test score.

69
Table 4.7
Pearson’s Correlation Statistics for Sixth Grade Stanford Achievement Test 10 Science Test Scores Versus the Eighth Grade Explore Science Test Score
Test Topic Pearson Correlation Life
.384*
Physical .499* Earth .322* Nature of science .329* Models .461* Constancy .374* Form and function .419* Thinking skills – Science
.462*
Note. N = 123; * indicates p-value = <.001
Math. Table 4.8 shows the Pearson correlation statistics for comparing each of
the sixth grade Stanford Achievement Test 10 math subtest scores with the eighth grade
Explore math test score. There were statistically significant, strong positive correlations
between each of the sixth grade subtest scores and the eighth grade test score. The
strength of the correlations ranged from .420 to .688. The Computation with Whole
Numbers test score had the weakest correlation with the eighth grade test score while the
Thinking Skills – Problem Solving test score had the strongest correlation with the eighth
grade test score.

70
Table 4.8
Pearson’s Correlation Statistics for Sixth Grade Stanford Achievement Test 10 Math Test Scores Versus the Eighth Grade Explore Math Test Score
Test Topic Pearson Correlation Number sense and operations
.644*
Patterns, relationships, and algebra .572* Data, statistics, and probability .454* Geometry and measurement .510* Communication and representation .479* Estimation .496* Mathematical connections .624* Reasoning and problem solving .626* Thinking skills-problem solving .688* Computation with whole numbers .420* Computation with decimals .509* Computation with fractions .616* Computation in context .612* Computation and symbolic notation .581* Thinking skills – procedures
.612*
Note. N = 123, * indicates p < .001
English. Table 4.9 shows the Pearson correlation statistics for comparing each of
the sixth grade Stanford Achievement Test 10 English subtest scores with the eighth
grade Explore English test score. There were statistically significant, positive correlations
between each of the sixth grade subtest scores and the eighth grade test score. The
strength of the correlations ranged from .250 to .501. The Capitalization test score had
the weakest correlation with the eighth grade test score while the Content and
Organization test score had the strongest correlation with the eighth grade test score.

71
Table 4.9
Pearson’s Correlation Statistics for Sixth Grade Stanford Achievement Test 10 English Test Scores Versus the Eighth Grade Explore English Test Score
Test Topic Pearson Correlation Capitalization
.245*
Usage .364* Punctuation .379* Sentence structure .440* Prewriting .242* Content and organization .501* Thinking skills – Language expression .497* Phonetic principles .357* Structural principles .421* No mistakes .270* Homophones .495*
Note. N = 123, * indicates p < .001
Hypothesis Testing
Hypothesis 1: Reading. Research Question 1: Which, if any, of the 12 reading
strand scores on the sixth grade Stanford Achievement Test explain the greatest
percentage of variance in the eighth grade ACT Explore reading test score among
students who attended a K-12 school in North Texas?
• Hypothesis 1: H0: None of the 12 sixth grade standardized test strand scores
relating to reading explain any variance in the eighth grade ACT Explore reading
test scores among students who attend a K-12 school in North Texas.
• Ha: One or more of the 12 sixth grade standardized test strand scores relating to
reading explain a statistically significant percentage of variance in the eighth
grade ACT Explore reading test score among students who attend a K-12 school
in North Texas.

72
Hypothesis 1 was tested using stepwise multiple linear regression analysis. The
dependent variable in the regression model was the eighth grade ACT Explore reading
test score. The candidate independent variables were the 12 sixth grade standardized
subtest scores relating to reading. The normal probability plot was inspected and there
was no indication of a violation of the normality assumption. Scatter plots were inspected
and there were no indications that the linearity assumption was violated. The variance
inflation factor for each of the independent variables was less than 2.0, indicating
multicollinearity was not a problem. A scatter plot of the standardized residuals against
the standardized predicted values did not give any indication of a violation of the constant
variance assumption. Table 4.10 shows that Thinking Skills – Comprehension, Thinking
Skills – Vocabulary, and Initial Understanding were statistically significant, F(3, 119) =
36.1, p < .001. Therefore, the null hypothesis was rejected and it was concluded that the
sixth grade Thinking Skills – Comprehension, Thinking Skills – Vocabulary, and Initial
Understanding test scores explain a statistically significant percentage of the variance in
the eighth grade ACT Explore reading test score.
The equation of the model was: RE = -34.2 + 5.15*TC + 4.08*TV + 3.49*IU
Where:
• RE = The average eighth grade ACT Explore reading test score
• TC = The sixth grade Thinking Skills – Comprehension test score, measured in
units of 10%
• TV = The sixth grade Thinking Skills – Vocabulary test score, measured in units
of 10%
• TC = The sixth grade Initial Understanding test score, measured in units of 10%

73
The interpretation of the model is, when controlling for Thinking Skills –
Vocabulary and Initial Understanding, the average eighth grade ACT Explore reading test
score is expected to increase by 5.14 points for every 10-point increase in the sixth grade
Thinking Skills – Comprehension test score. When controlling for Thinking Skills –
Comprehension and Initial Understanding, the average eighth grade ACT Explore
reading test score is expected to increase by 4.08 points for every 10-point increase in the
sixth grade Thinking Skills – Vocabulary test score. When controlling for Thinking
Skills – Comprehension and Thinking Skills - Vocabulary, the average eighth grade ACT
Explore reading test score is expected to increase by 3.49 points for every 10-point
increase in the sixth grade Initial Understanding test score. The R-square for the final
model was .476, which means that collectively, Thinking Skills – Comprehension,
Thinking Skills – Vocabulary, and Initial Understanding explain 47.6% of the total
variance in eighth grade ACT Explore reading test scores. Since the adjusted R-square
(.46) was very close to the R-square (.48), the sample size was deemed large enough to be
confident in the R-square value. A post-hoc power analysis revealed that this study had
greater than 99% power to detect an R-square of .48 with a sample size of 123 and an
alpha level of .05.
Among the three independent variables, Thinking Skills – Comprehension was
the most important predictor of the eighth grade reading test because it explained 38.6%
(as measured by squaring the semi-partial correlation coefficient) of the total variance in
the eighth grade reading test scores. After controlling for Thinking Skills –
Comprehension, Thinking Skills – Vocabulary explained only an additional 6.6% of
variance in the eighth grade reading test scores. When controlling for both the Thinking

74
Skills – Comprehension and Thinking Skills – Vocabulary test scores, Initial
Understanding explained only an additional 2.4% of variance in the eighth grade reading
test scores.
Table 4.10
Stepwise Multiple Linear Regression Analysis to Test Hypothesis 1 Unstandardized
Coefficients Standardized Coefficients
Model
B
Std. Error
Beta T p-value
(Constant)
-34.224
11.200
-
Thinking skills – Comprehension
5.146 1.239 .371 4.152 <.001
Thinking skills – Vocabulary 4.080 1.226 .255 3.329 .001
Initial understanding
3.492 1.490 .206 2.343 .021
Note. Dependent variable: eighth grade reading Candidate independent variables: All 12 sixth grade standardized subtest scores relating to reading Independent variables were divided by 10 in order to aid in the interpretation of the regression coefficients R-Square attributed to Thinking Skills Comprehension = .386 R-Square attributed to Thinking Skills Vocabulary = .066 R-Square attributed to Initial Understanding = .024 R-Square attributed to full model = .4476
Hypothesis 2: Science. Research Question 2: Which, if any, of the eight science
strand scores on the sixth grade Stanford Achievement Test explain the greatest
percentage of variance in the eighth grade ACT Explore science test score among
students who attended a K-12 school in North Texas?
• Hypothesis 2: H0: None of the eight sixth grade standardized test strand scores
relating to science explain any variance in the eighth grade ACT Explore science
test score among students who attend a K-12 school in North Texas.

75
• Ha: One or more of the eight sixth grade standardized test strand scores relating to
science explain a statistically significant percentage of variance in the eighth
grade ACT Explore science test score among students who attend a K-12 school
in North Texas.
Hypothesis 2 was tested using stepwise multiple linear regression analysis. The
dependent variable in the regression model was the eighth grade ACT Explore science
test score. The candidate independent variables were the eight sixth grade standardized
subtest scores relating to science. The normal probability plot was inspected and there
was no indication of a violation of the normality assumption. Scatter plots were inspected
and there were no indications that the linearity assumption was violated. The variance
inflation factor for each of the independent variables was less than 2.0, indicating
multicollinearity was not a problem. A scatter plot of the standardized residuals against
the standardized predicted values did not give any indication of a violation of the constant
variance assumption. Table 4.11 shows that Physical, as well as Life and Models, were
statistically significant, F(3, 119) = 18.6, p < .001. Therefore, the null hypothesis was
rejected and it was concluded that the sixth grade Physical, Life, and Models test scores
explain a statistically significant percentage of the variance in the eighth grade ACT
Explore science test score.
The equation of the model was: SC = 3.62 + 3.65*PH + 2.57*LI + 2.53*MO
Where:
• SC = The average eighth grade ACT Explore science test score
• PH = The sixth grade Physical test score, measured in units of 10%
• LI = The sixth grade Life test score, measured in units of 10%

76
• MO = The sixth grade Models test score, measured in units of 10%
The interpretation of the model is, when controlling for Life and Models, the
average eighth grade ACT Explore science test score is expected to increase by 3.65
points for every 10-point increase in the sixth grade Physical test score. When
controlling for Physical and Models, the average eighth grade ACT Explore science test
score is expected to increase by 2.57 points for every 10-point increase in the sixth grade
Life test score. When controlling for Physical and Life, the average eighth grade ACT
Explore science test score is expected to increase by 2.53 points for every 10-point
increase in the sixth grade Models test score. The R-square for the final model was .319,
which means that collectively, Physical, Life, and Models explain 31.9% of the total
variance in eighth grade ACT Explore science test scores. Since the adjusted R-square
(.30) was very close to the R-square (.32), the sample size was deemed large enough to be
confident in the R-square value. A post-hoc power analysis revealed that this study had
greater than 99% power to detect an R-square of .32 with a sample size of 123 and an
alpha level of .05.
Among the three independent variables, Physical was the most important
predictor of the eighth grade science test because it explained 24.9% (as measured by
squaring the semi-partial correlation coefficient) of the total variance in the eighth grade
science test scores. After controlling for Physical, the Life test score explained only an
additional 4.5% of variance in the eighth grade science test scores. When controlling for
both the Physical and Life test scores, Models explained only an additional 2.5% of
variance in the eighth grade science test scores.

77
Table 4.11
Stepwise Multiple Linear Regression Analysis to Test Hypothesis 2
Unstandardized Coefficients
Standardized Coefficients
Model
B
Std. Error
Beta T p-value
(Constant)
3.619
9.436
-
.384
.702
Physical 3.653 1.102 .313 3.316 .001 Life 2.567 1.213 .180 2.116 .036
Models
2.526 1.203 .203 2.100 .038
Note. Dependent variable: eighth grade science Candidate independent variables: All 8 sixth grade standardized subtest scores relating to science. Independent variables were divided by 10 in order to aid in the interpretation of the regression coefficients R-Square attributed to Physical = .249 R-Square attributed to Life = .045 R-Square attributed to Models = .025 R-Square attributed to full model = .319
Hypothesis 3: Math. Research Question 3: Which, if any, of the 15 math strand
scores on the sixth grade Stanford Achievement Test explain the greatest percentage of
variance in the eighth grade ACT Explore math test score among students who attended a
K-12 school in North Texas?
• Hypothesis 3: H0: None of the 15 sixth grade standardized test strand scores
relating to math explain any variance in the eighth grade ACT Explore math test
score among students who attend a K-12 school in North Texas.
• Ha: One or more of the 15 sixth grade standardized test strand scores relating to
math explain a statistically significant percentage of variance in the eighth grade
ACT Explore math test score among students who attend a K-12 school in North
Texas.

78
Hypothesis 3 was tested using stepwise multiple linear regression analysis. The
dependent variable in the regression model was the eighth grade ACT Explore math test
score. The candidate independent variables were the 15 sixth grade standardized subtest
scores relating to math. The normal probability plot was inspected and there was no
indication of a violation of the normality assumption. Scatter plots were inspected and
there were no indications that the linearity assumption was violated. The variance
inflation factor for each of the independent variables was less than 2.0, indicating
multicollinearity was not a problem. A scatter plot of the standardized residuals against
the standardized predicted values did not give any indication of a violation of the constant
variance assumption. Table 4.12 shows that Thinking Skills – Problem Solving and
Computation with Fractions were statistically significant, F(2, 120) = 61.7, p < .001.
Therefore, the null hypothesis was rejected and it was concluded that the sixth grade
Thinking Skills – Problem Solving and Computation with Fractions test scores explain a
statistically significant percentage of the variance in the eighth grade ACT Explore math
test score.
The equation of the model was: MA = 24.96 + 4.68*TS + 1.55*CF
Where:
• MA = The average eighth grade ACT Explore math test score
• TS = The sixth grade Thinking Skills – Problem Solving test score, measured in
units of 10%
• CF = The sixth grade Computation with Fractions test score, measured in units of
10%

79
The interpretation of the model is, when controlling for Computation with
Fractions, the average eighth grade ACT Explore math test score is expected to increase
by 4.68 points for every 10-point increase in the sixth grade Thinking Skills – Problem
Solving test score. When controlling for Thinking Skills – Problem Solving, the average
eighth grade ACT Explore math test score is expected to increase by 1.55 points for every
10-point increase in the sixth grade Computation with Fractions test score. The R-square
for the final model was .507, which means that collectively, Thinking Skills – Problem
Solving and Computation with Fractions explain 50.7% of the total variance in eighth
grade ACT Explore math test scores. Since the adjusted R-square (.50) was very close to
the R-square (.51), the sample size was deemed large enough to be confident in the R-
square value. A post-hoc power analysis revealed that this study had greater than 99%
power to detect an R-square of .51 with a sample size of 123 and an alpha level of .05.
Among the two independent variables, Thinking Skills – Problem Solving was the
most important predictor of the eighth grade math test because it explained 47.3% (as
measured by squaring the semi-partial correlation coefficient) of the total variance in the
eighth grade math test scores. After controlling for Thinking Skills – Problem Solving,
Computation with Fractions explained only an additional 3.4% of variance in the eighth
grade math test scores.

80
Table 4.12
Stepwise Multiple Linear Regression Analysis to Test Hypothesis 3 Unstandardized
Coefficients Standardized Coefficients
Model
B
Std. Error Beta T
p-value
(Constant)
24.955
4.077
-
6.122
<.001
Thinking Skills-Problem Solving (An increase of 1 point = 10% increase on the test score)
4.676 .838 .505 5.579 <.001
Computation with Fractions (An increase of 1 point = 10% increase on the test score)
1.550 .540 .260 2.869 .005
Note. Dependent variable: eighth grade math Candidate independent variables: All 15 sixth grade standardized subtest scores relating to math. Independent variables were divided by 10 in order to aid in the interpretation of the regression coefficients R-Square attributed to Thinking Skills - Problem Solving = .473 R-Square attributed to Computation with Fractions = .034 R-Square attributed to full model = .507
Hypothesis 4: English. Research Question 4: Which, if any, of the 11 sixth
grade English scores on the Stanford Achievement Test explain the greatest percentage of
variance in the eighth grade ACT Explore English test score among students who
attended a K-12 school in North Texas?
• Hypothesis 4: H0: None of the 11 sixth grade standardized test strand scores
relating to English explain any variance in the eighth grade ACT Explore English
test score among students who attend a K-12 school in North Texas.
• Ha: One or more of the 11 sixth grade standardized test strand scores relating to
English explain a statistically significant percentage of variance in the eighth

81
grade ACT Explore Exam English test score among students who attend a K-12
school in North Texas.
Hypothesis 4 was tested using stepwise multiple linear regression analysis. The
dependent variable in the regression model was the eighth grade ACT Explore English
test score. The candidate independent variables were the 11 sixth grade standardized
subtest scores relating to English. The normal probability plot was inspected and there
was no indication of a violation of the normality assumption. Scatter plots were inspected
and there were no indications that the linearity assumption was violated. The variance
inflation factor for each of the independent variables was less than 2.0, indicating
multicollinearity was not a problem. A scatter plot of the standardized residuals against
the standardized predicted values did not give any indication of a violation of the constant
variance assumption. Table 4.13 shows that Content and Organization, Homophones, and
Structural Principles were statistically significant, F(3, 119) = 27.9, p < .001. Therefore,
the null hypothesis was rejected and it was concluded that the sixth grade Content and
Organization, Homophones, and Structural Principles test scores explain a statistically
significant percentage of the variance in the eighth grade ACT Explore English test
scores.
The equation of the model was: EN = 34.57 + 2.88*CO + 1.53*HO + 1.10*SP
Where:
• EN = The average eighth grade ACT Explore English test score
• CO = The sixth grade Content and Organization test score, measured in units of
10%
• HO = The sixth grade Homophones test score, measured in units of 10%

82
• SP = The sixth grade Structural Principles test score, measured in units of 10%
The interpretation of the model is, when controlling for Homophones and
Structural Principles, the average eighth grade ACT Explore English test score is
expected to increase by 2.88 points for every 10-point increase in the sixth grade Content
and Organization test score. When controlling for Content and Organization as well as
Structural Principles, the average eighth grade ACT Explore English test score is
expected to increase by 1.53 points for every 10-point increase in the sixth grade
Homophones test score. When controlling for Content and Organization as well as
Homophones, the average eighth grade ACT Explore English test score is expected to
increase by 1.10 points for every 10-point increase in the sixth grade Structural Principles
test score. The R-square for the final model was .413, which means that collectively,
Content and Organization, Homophones, and Structural Principles explain 41.3% of the
total variance in eighth grade ACT Explore English test scores. Since the adjusted R-
square (.40) was very close to the R-square (.41), the sample size was deemed large
enough to be confident in the R-square value. A post-hoc power analysis revealed that
this study had greater than 99% power to detect an R-square of .41 with a sample size of
123 and an alpha level of .05.
Among the three independent variables, Content and Organization was the most
important predictor of the eighth grade English test because it explained 25.1% (as
measured by squaring the semipartial correlation coefficient) of the total variance in the
eighth grade English test scores. After controlling for Content and Organization,
Homophones explained an additional 13.8% of variance in the eighth grade English test
scores. After controlling for Content and Organization as well as Homophones, Structural

83
Principles explained only an additional 2.4% of variance in the eighth grade English test
scores.
Table 4.13
Stepwise Multiple Linear Regression Analysis to Test Hypothesis 4 Unstandardized
Coefficients Standardized Coefficients
Model
B
Std. Error
Beta T p-value
(Constant)
34.567
5.010
-
6.900
<.001
Content and Organization (An increase of 1 point = 10% increase on the test score)
2.876 .554 .380 5.191 <.001
Homophones (An increase of 1 point = 10% increase on the test score)
1.534 .439 .294 3.495 .001
Structural Principles (An increase of 1 point = 10% increase on the test score)
1.096 .494 .184 2.220 .028
Note. Dependent variable: eighth grade English Candidate independent variables: All 11 sixth grade standardized subtest scores relating to English. Independent variables were divided by 10 in order to aid in the interpretation of the regression coefficients R-Square attributed to Content and Organization = .251 R-Square attributed to Homophones = .138 R-Square attributed to Structural Principles = .024
R-Square attributed to full model = .413

84
Chapter Five: Implications and Conclusions
This chapter briefly reviews and summarizes the current correlational research
study and provides discussion on the findings. Specifically, this chapter is divided into
the following sections: (a) the purpose of this study, (b) restatement of the problem, (c)
review of the methodology, (d) summary of findings, (e) discussion of the findings with
respect to the relevant literature, (f) outline of the study limitations and recommendations
for further research, and (g) conclusion.
Purpose of the Study
The purpose of this study was to determine if there is a correlation between a
specific sixth grade achievement test known as the Stanford Achievement Test 10 and the
eighth grade college readiness assessment instrument known as the Explore Exam for a
group of North Texas students. As was discussed in the literature review, the ACT
Corporation conducts an annual correlation study that tracks subjects’ performance on the
eighth grade Explore Exam and their respective college success as defined by their
college grade point averages. Building upon this research, this study was to determine if a
predictive correlation exists between one group of students’ performance on the sixth
grade Stanford Achievement Test 10 and the Explore Exam. The specific research
questions and associated hypotheses are as follows:
Research question 1. Which, if any, of the 12 reading strand scores on the sixth
grade Stanford Achievement Test explain the greatest percentage of variance in the
eighth grade ACT Explore reading test score among students who attended a K-12 school
in North Texas?

85
• Hypothesis 1: H0: None of the 12 sixth grade standardized test strand scores
relating to reading explain any variance in the eighth grade ACT Explore reading
test score among students who attend a K-12 school in North Texas.
• Ha: One or more of the 12 sixth grade standardized test strand scores relating to
reading explain a statistically significant percentage of variance in the eighth
grade ACT Explore reading test score among students who attend a K-12 school
in North Texas.
Research question 2. Which, if any, of the eight science strand scores on the
sixth grade Stanford Achievement Test explain the greatest percentage of variance in the
eighth grade ACT Explore science test score among students who attended a K-12 school
in North Texas?
• Hypothesis 2: H0: None of the eight sixth grade standardized test strand scores
relating to science explain any variance in the eighth grade ACT Explore science
test score among students who attend a K-12 school in North Texas.
• Ha: One or more of the eight sixth grade standardized test strand scores relating to
science explain a statistically significant percentage of variance in the eighth
grade ACT Explore science test score among students who attend a K-12 school
in North Texas.
Research question 3. Which, if any, of the 15 math strand scores on the sixth
grade Stanford Achievement Test explain the greatest percentage of variance in the
eighth grade ACT Explore math test score among students who attended a K-12 school in
North Texas?

86
• Hypothesis 3: H0: None of the 15 sixth grade standardized test strand scores
relating to math explain any variance in the eighth grade ACT Explore math test
score among students who attend a K-12 school in North Texas.
• Ha: One or more of the 15 sixth grade standardized test strand scores relating to
math explain a statistically significant percentage of variance in the eighth grade
ACT Explore math test score among students who attend a K-12 school in North
Texas.
Research question 4. Which, if any, of the 11 sixth grade English scores on the
Stanford Achievement Test explain the greatest percentage of variance in the eighth
grade ACT Explore English test score among students who attended a K-12 school in
North Texas?
• Hypothesis 4: H0: None of the 11 sixth grade standardized test strand scores
relating to English explain any variance in the eighth grade ACT Explore English
test score among students who attend a K-12 school in North Texas.
• Ha: One or more of the 11 sixth grade standardized test strand scores relating to
English explain a statistically significant percentage of variance in the eighth
grade ACT Explore Exam English test score among students who attend a K-12
school in North Texas.
Restatement of the Problem
With the passage of the No Child Left Behind Act of 2002, a system of
educational accountability was established whereby government funds were issued to
states based upon their respective students’ performance on annual achievement based,
high stakes testing. Subsequently, states have increasingly begun to create their own high

87
stakes instruments. The inevitable questions arise surrounding the purpose of the state
constructed assessment instrument. Is determination of college and career readiness the
common goal for the state tests or are states crafting assessment instruments in order to
ensure student success and secure government funding? With the potential problem of
competing goals for K-12 standardized testing, little research exists that attempts to
quantify the connection between achievement tests and college readiness. This study
determines that a predictive correlation exists between one such achievement test and a
college readiness assessment instrument among the same population of students who
were assessed via each respective instrument at the appropriate stage of their education.
Specifically, this study correlates a North Texas school’s sixth grade student population’s
performance on the Stanford Achievement Test 10 with their subsequent performance on
the eighth grade ACT Corporation’s Explore Exam.
Review of Methodology
As explained in Chapter Three, the study reported here is a quantitative
correlational study that examined the association between student performance on the
sixth grade Stanford Achievement Test 10 and the eighth grade ACT Corporation’s
Explore Exam among a population of North Texas students. The research population was
123 students who were assessed the Stanford Achievement Test 10 in sixth grade and
subsequently assessed via the eighth grade Explore Exam. The school site was a private
educational institution that has been in existence since 1999. The research relied on
Stanford Achievement Test 10 scores reported by the host school and detailed Explore
Exam scores that were secured through a special request to the ACT Corporation.

88
Quantitative, non-experimental statistical methods were used to analyze the data.
Demographic characteristics of the study sample were described using (a) the mean,
standard deviation, and range for continuous scaled variables, and (b) frequency and
percent for categorical scaled variables. Pearson’s correlation statistic was used to
compare each of the sixth grade Stanford Achievement Test sub-strand scores in the areas
of reading, science, math, and English with the overall eighth grade Explore Exam score
within each subject area.
Each of four hypotheses was tested using stepwise multiple linear regression
analysis. The dependent variable in the regression model was the eighth grade ACT
Explore subject test score. The candidate independent variables were the sixth grade
standardized test strand scores relating to the corresponding Explore Exam subject score
(see Table 1.1). If any one of the sixth grade standardized test strand scores, in a given
subject, was statistically significant, then the null hypothesis was rejected, and it was
concluded that one or more sixth grade standardized test strand scores relating to the
given subject was a valid predictor of the corresponding eighth grade ACT Explore test
score. The equation of the model was reported and statistically significant regression
coefficients were interpreted. The R-square for the final model was also presented and
interpreted.
Summary of Findings
This study showed that there are statistically significant positive correlations
between each of the sixth grade standardized subtest scores and the respective eighth
grade subject matter ACT Explore test scores. Thinking Skills – Comprehension,
Thinking Skills – Vocabulary, and Initial Understanding explained 47.6% of the total

89
variance in eighth grade ACT Explore reading test scores. Scores for Physical, Life, and
Models explained 31.9% of the total variance in eighth grade ACT Explore science test
scores. Thinking Skills – Problem Solving and Computation with Fractions explained
50.7% of the total variance in eighth grade ACT Explore math test scores. Content and
Organization, Homophones, and Structural Principles explained 41.3% of the total
variance in eighth grade ACT Explore English test scores.
Discussion of the Findings
This study provides strong evidence that sixth grade Stanford Achievement Test
10 subtest scores are positively correlated with respective eighth grade subject matter
ACT Explore test scores. It is also interesting to note that the consistency among student
performance on each respective exam further contributes to the findings. Table 5.1 shows
a summary of the descriptive statistics for both instruments.
Table 5.1 Summary of Descriptive Statistics
Test Topic
Valid N
Missing N ACT Mean
Stanford Achievement Test 10
Score Range Maximum 8th Grade Reading
123
0
8th Grade Science 123 0 66.8118 67.8 - 80.0 100.00 8th Grade Math 123 0 64.5528 56.1 - 81.9 100.00 8th Grade English
123 0 77.8659 71.2 - 90.2 100.00

90
Table 5.1 illustrates that student performance on both assessment instruments is
lower in math and science. Student performance on the Explore Exam in math is a full 13
points lower than English. This is similarly shown when comparing the Stanford
Achievement Test 10 score ranges for math and English.
A review of the strength of correlations among the Stanford Achievement Test 10
subtests reveals that all subtests have a considerably strong correlation to the subject tests
of the Explore Exam, however the correlations are not equally strong. For example, the
English subtest known as Prewriting has a correlation of .242, which according to Cohen
(1988) is a medium effect. However, when compared to the correlation of .50 in the
Content and Organization subtest the correlation for Prewriting is relatively weak (See
Table 4.9).
It is also interesting to note the relative strength of correlations among the
subjects. For example, while the descriptive statistics allude to an overall weaker
performance by students in the area of math (see Table 5.1), the strength of correlation is
strongest in this subject area with a range on the subtests of .42 to .69 (see Table 4.8). In
contrast, the strongest student performances according to the descriptive statistics were in
the area of English, which only has subtest correlations ranging from .25 to .50. As stated
earlier, all correlations have at least a medium effect size according to Cohen (1988),
however the ranges of strengths are not equal and not necessarily what one would expect.
Similarly, an analysis of the R-square values relative to each subject continues to
show somewhat unexpected results relative to overall student performance as highlighted
by the descriptive statistics. The strongest R-square value is found in Math with an R-
square value of .51 with the subtest Thinking Skills - Problem Solving accounting for

91
47% of the change (see Table 4.12). However, the weakest R-square value is found in
science, with the subtest Physical representing 25% of the change (see Table 4.11). It is
noteworthy that the subjects of math and science had the lowest student performances
overall on both assessment instruments.
Implications of Findings
This study provides strong evidence that sixth grade Stanford Achievement Test
10 subtest scores are positively correlated with respective eighth grade subject matter
ACT Explore test scores. Therefore, it may be possible to use sixth grade subtest
performance as an early predictor of eighth grade ACT Explore test performance. The
implication for schools that utilize these two assessment instruments at the sixth and
eighth grade respectively include valid data for making educational decisions and greater
certainty that decisions based this data will affect college readiness as defined by
performance on the ACT Explore Exam.
Study Limitations and Further Study
This study was limited to a single school. Four classes of students passed through
sixth grade in successive years beginning in 2005. The classes also completed eighth
grade in successive years beginning in 2007. The instructional program at the school did
not undergo any systemic changes, and it should be noted that there were minimal
personnel changes in the instructional program. Furthermore, students in each class
varied by academic ability, as would be expected among any school population.
However, there are no known factors in the pedagogical program that would influence
student performance in this study.

92
The study was limited to students who completed sixth to eighth grades at the host
site. The national economic downturn during the course of this study impacted the
stability of the enrollment at the tuition-based host site. While there was a transient nature
to some members of the school population, the classes that were the focus of this study
maintained a re-enrollment rate above 90%.
The generalizability of this study to other dissimilar populations is limited. The
findings of this study are applicable only to institutions where the Stanford Achievement
Exam 10 and the Explore Exam are utilized at the same grade levels. Furthermore,
generalizability may be limited since the school where the study takes place is a tuition-
based, predominately White, non-public setting with an admission requirement that yields
a student population with above average ability. Furthermore, although the researcher
went to great lengths to protect the integrity of this study, it could be limited by potential
researcher bias that would threaten internal validity by virtue of the researcher’s
employment at the host site.
For further study, it would be interesting to determine if the correlations found in
this study are consistent across various demographic subgroups mentioned in the
literature review such as gender, ethnicity, socio-economic status, non-native English
speakers, and students with learning disabilities. In addition, the results of this study
would benefit greatly from being placed in a broader context. Therefore, further study is
needed with other standardized achievement tests in order to determine if the correlations
of the Stanford Achievement Test 10 are the strongest available for measuring college
readiness. With a myriad of K-8 achievement tests available for educators, it would seem
unlikely this study utilizing the Stanford Achievement Test 10 offered the highest

93
correlations of available instruments to college performance. When considering
additional research on this topic, it would be important to consider increasing the sample
size and the aforementioned diversity of the student population. Furthermore, additional
research would be benefitted by the removal of the researcher bias that is inherent with
studying a school that is one’s own workplace.
Perhaps the most interesting study could be done on the effects on eighth grade
student scores by implementing curricular changes and teaching strategies in sixth grade
based upon the correlations found in this study. Furthermore, additional correlational
studies need to be accomplished using a variety of achievement tests in a wide array of
grade levels. If college readiness is the goal of a particular school, the school must utilize
intermittent assessment instruments that gauge proficiency in age-appropriate objectives
that will promote college readiness. This can only be done through additional research
that quantifies the statistical relationship between a given achievement assessment and
student performance on college readiness exams with proven correlation to college
performance.
Conclusion
This study provides strong evidence that sixth grade strand test scores are
positively correlated with respective eighth grade subject matter ACT Explore test scores.
Therefore, it may be possible to use sixth grade strand test performance as an early
predictor of eighth grade ACT Explore test performance. A major limitation of this study
was that it consisted of students from only one school. Therefore, this study needs to be
replicated at other schools to determine if the findings are consistent in other geographic
areas and in different types of schools in terms of socio-economic factors. Also, for

94
further study, it would be interesting to determine if the correlations found in this study
are consistent across various demographic subgroups such as gender, ethnicity, and
socio-economic status and at various grade levels.
95
References
ACT Corporation. (2007). Explore technical manual. Iowa City, IA: Author. ACT Corporation. (2009). Connecting college readiness standards to the classroom.
Retrieved from http://www.act.org/standard/guides/explore/pdf/ EXPLORE_Admin.pdf
ACT Corporation. (2010a). The condition of college and career readiness 2010.
Retrieved from http://www.act.org/research/policymakers/cccr10/page_9.html? utm_campaign=cccr10&utm_source=random_fact&utm_medium=web
ACT Corporation. (2010b). 2010 ACT college and career readiness report. Retrieved
from http://www.stateuniversity.com/blog/permalink/2010-act-college-and-career-readiness-report.html
ACT Corporation. (2010c). EPAS. Retrieved from http://www.act.org/epas/index.html ACT Corporation. (2010d, June 6). ACT's college readiness standards. Retrieved from
http://www.act.org/standard/index.html AP Courses as Predictors of College Success. (2005). Recruitment & Retention in Higher
Education, 19(2), 5. Armstrong, A. (2010). Myths of poverty: Realities for students. Education Digest, 75(8),
49-53. Association of Christian Schools International. (n.d.). About ACSI. Retrieved from
http://www.acsi.org/About/AboutACSI/tabid/870/Default.aspx Association of Christian Schools International. (2009a). 2009 ACSI annual report.
Colorado Springs, CO: ACSI. Association of Christian Schools International. (2009b). Membership directory.
Retrieved from http://www.acsi.org/www.acsi.org/FooterLinks/MemberDirectory /tabid/577/Default.aspx
Altshuler, S., & Schmautz, T. (2006). No Hispanic student left behind: The consequences
of "high stakes" testing. Children & Schools, 28(1), 5-14. Anderson, G., Whipple, A., & Jimerson, S. (n.d.). Grade retention: Achievement and
mental health outcomes. Retrieved from http://www.cdl.org/resource-library/articles/grade_retention.php

96
Antonak, R. F., King, S., & Lowy, J. J. (1982). Otis-Lennon Mental Ability Test, Stanford Achievement Test, and three demographic variables as predictors of achievement in grades 2 and 4. Journal of Educational Research, 75, 366-374.
Baker, M., & Johnston, P. (2010). The impact of socioeconomic status on high stakes
testing reexamined. Journal of Instructional Psychology, 37(3), 193-199. Barnes, J. (2002). The SAT revolution. U.S. News & World Report, 133(18), 50. Berninger, V., Rutberg, J., Abbott, R., Garcia, N., Anderson-Youngstrom, M., Brooks,
A., & Fulton, C. (2006). Tier 1 and Tier 2 early intervention for handwriting and composing. Journal of School Psychology, 44(1), 3-30. doi: 10.1016/j.jsp.2005. 12.003
Beyer, C. H., Gillmore, G. M. (2007). Longitudinal assessment of student learning:
Simplistic measures aren’t enough. Change, 39, 43-47. Black, S. (2005). Acing the exam. American School Board Journal, 192(1), 35-46. Bracey, G. (2001). Test scores in the long run. Phi Delta Kappan, 82, 637-638. Bleyaert, B. (2010). Act and college success. Retrieved from http://www.principals
partnership.com/ACTandCollegeSuccess.pdf Brimijoin, K. (2005). Differentiation and high-stakes testing: An oxymoron? Theory Into
Practice, 44(3), 254-261. doi:10.1207/s15430421tip4403_10 Burgess, L. A., & Samuels, C. (1999). Impact of full-time versus part-time instructor
status on college student retention and academic performance in sequential courses. Community College Journal of Research & Practice, 23(5), 487-498. doi: 10.1080/106689299264684
Bussert-Webb, K. (2009). ¿Que Hago? Latino/a children describe their activities in an
“exemplary” school. Journal of Latinos & Education, 8(1), 38-54. doi: 10.1080/15348430802466753
Capraro, M., Capraro, R., Yetkiner, Z., Rangel-Chavez, A., & Lewis, C. (2010).
Examining Hispanic student mathematics performance on high-stakes tests: An examination of one urban school district in Colorado. Urban Review, 42(3), 193-209. doi: 10.1007/s11256-009-0127-0
Carter, E., Wehby, J., Hughes, C., Johnson, S., Plank, D., Barton-Arwood, S., &
Lunsford, L. B. (2005). Preparing adolescents with high-incidence disabilities for high-stakes testing with strategy instruction. Preventing School Failure, 49(2), 55-62.

97
Cheek, J., Reynolds, J., & Coy, D. (2002). An intervention for helping elementary students reduce test anxiety. Professional School Counseling, 6(2), 162-164.
Chenoweth, K. (2000). Judge's ruling effectively acquits high-stakes test. Black Issues in
Higher Education, 16(25), 12. Chudowski, N., & Chudowski, V. (2010, September, 15). State test score trends through
2008-09, Part 1: Rising scores on state tests and NAEP. Retrieved from www.cep-dc.org/
Cloud, J. (1997). What does SAT stand for? Time, 150(20), 54. Cohen, A., Gregg, N., & Meng, D. (2005). The role of extended time and item content on
a high-stakes mathematics test. Learning Disabilities Research & Practice, 20(4), 225-233. doi: 10.1111/j.1540-5826.2005.00138.x
Cohen, J. (1988). Statistical power analysis for the behavioral science. Hillsdale, NY:
Lawrence Erlbaum Associates. College Board. (2010). About us. Retrieved from http://www.collegeboard.com/about
/index.html Contreras, F. (2005). Access, achievement, and social capital: Standardized exams and
the Latino college-bound population. Journal of Hispanic Higher Education, 4(3), 197-214.
Creswell, J. (2008). Research design: Qualitative, quantitative, and mixed methods
approaches. Thousand Oaks, CA: Sage Publications.
Crow, S. R., & Small, R. V. (2011). Developing the motivation within: Using praise and rewards effectively. School Library Monthly, 27(5), 5-7.
Darling-Hammond, L. (2007). Race, inequality and educational accountability: The irony of No Child Left Behind. Race, Ethnicity & Education, 10(3), 245-260. doi: 10.1080/13613320701503207
DeGregorio, J., & Bartosiewicz, P. (2007). SAT? ACT? NP! U.S. News & World Report,
143(6), 88. Dickinson, D. & Neuman. S. (2006). Handbook of Early Literacy Research. New York,
NY: The Guilford Press. Dobbs, M. (2003, November 14). Students fare well in national math tests; but lag in
reading skills is questioned. Washington Post, p. A3. Does AP predict college success? (2006). CQ Researcher, 16(9), 208.

98
Doyle, W. (2006). Adoption of merit-based student grant programmes: An event history
analysis. Educational evaluation and Policy Analysis, 28(3), 259-285. Educational Testing Service. (2001). A measured response: Americans on speak on
education reform. Retrieved from www.ets.org/americans_speak/education _reform/
Federal News Service. (2010). Act assessments of college, career readiness to be made
available to Kansas junior high, high school students. Retrieved from http://global.factiva.com.ezproxy.liberty.edu:2048/ga/default.aspx
Fiske, E. B. (1978, July 9). College entry test scores drop sharply. New York Times, pp.
47, 49. Fletcher, D (2009). Brief history of standardized testing. Time Magazine. Retrieved from
http://www.time.com/time/nation/article/0,8599,1947019,00.html Fletcher, J., Francis, D., O'malley, K., Copeland, K., Mehta, P., Calowell, C. . . . Vaughn,
S. (2009). Effects of a bundled accommodations package on high-stakes testing for middle school students with reading disabilities. Exceptional Children, 75(4), 447-463.
Frederick, S. (2005). Cognitive reflection and decision making. Journal of Economic
Perspectives, 19(4), 25-42. Fremmer, J. & Wall, J. (2003). Why use test and assessments? Greensborough, NC:
Counseling and Student Services. Friedman, L., & Wall, M. (2005). Graphical views of suppression and multicollinearity in
multiple linear regression. The American Statistician, 59(2), 127. Gabriel, T (2010, June 10). Pressed to show progress, educators tamper with test scores.
New York Times, p. A1. Galuska, P. (2010). For good measure. Diverse: Issues in Higher Education, 27(5), 16-
17. Garcy, A. (2009). The longitudinal link between student health and math achievement
scores. Journal of Education for Students Placed at Risk, 14(4), 283-310. doi: 10.1080/10824660903448755
Gay, G. (1990). Standardized tests: Irregularities in administering of tests which affect
test results. Educational Test & Measurements, 17(2), 93-103.

99
Goldenberg, M. (2005). Losing students to high-stakes testing. Education Digest, 70(7), 10-19.
Gregg, N., Coleman, C., Davis, M., & Chalk, J. (2007). Timed essay writing:
Implications for high-stakes tests. Journal of Learning Disabilities, 40(4), 306-318.
Grodsky, E., Warren, J., & Felts, E. (2008). Testing and Social Stratification in American
Education. Annual Review of Sociology, 34(1), 385-404. Gronna, S., & Chin-Chance, S. (1998). The performance of students with disabilities in
norm-referenced, statewide standardized testing program. Journal of Learning Disabilities, 31, 482-493.
Haladyna, T., & Haas, N. (1998). Continuing tensions in standardized testing. Childhood
Education, 74(5), 262. Hintze, J. (2008). PASS 2008. Kaysville, UT: NCSS. Hoffman, L., & Nottis, K. (2008). Middle school students' perceptions of effective
motivation and preparation factors for high-stakes tests. NASSP Bulletin, 92(3), 209-223.
Howe II, H. (1985). Let's have another SAT score decline. Phi Delta Kappan, 66(9), 599-
602. Huber, P. (1993). The lie of averages. Forbes, 152(14), 252. Hunt, J. (2008). A nation at risk and No Child Left Behind: Déjà vu for administrators?
Delta Kappan, 89(8), 580-585. Jones, M. G., Jones, B. D., Hardin, B., Chapman, L., Yarbrough, T., & Davis, M. (1999).
The impact of high-stakes testing on teachers and students in North Carolina. Phi Delta Kappan, 81(3), 193-203.
Judson, E. (2007). Retaking a high stakes mathematics test: Examination of school
interventions and environments. American Secondary Education, 36(1), 15-30. Kahn, D. S. (2006, May 26). How low can we go? Wall Street Journal, p. W11. Karantonis, A., & Sireci, S. G. (2006). The bookmark standard-setting method: A
literature review. Educational Measurements: Issues & Practice, 25(1), 19–20. Kelleher, M. (2011). Head start supporters fear impact of threatened cutbacks. Education
Week, 30(24), 18.

100
Kirby, E., White, S., & Aruguete, M. (2007). Predictors of white and minority student success at a private women's college. College Student Journal, 41(2), 460-465.
Kirst, M. (2005). Most college-bound students underprepared, studies say. Recruitment &
Retention in Higher Education, 19(11), 6. Koenig, K., Frey, M., & Detterman, D. (2008). ACT and general cognitive ability.
Intelligence, 36(2), 153-160. doi: 10.1016/j.intell.2007.03.005 Kruger, L., Wandle, C., & Struzziero, J. (2007). Coping with the stress of high stakes
testing. Journal of Applied School Psychology, 23(2), 109-128. doi: 10.1300/J370v23n02_07
Lattimore, R. (2005). African American students' perceptions of their preparation for a
high-stakes mathematics test. Negro Educational Review, 56(2/3), 135-146. Lattimore, R. (2001). The wrath of high-stakes tests. Urban Review, 33(1), 57. Lay, J., & Stokes-Brown, A. (2009). Put to the test: Understanding differences in support
for high-stakes testing. American Politics Research, 37(3), 429-448. Linn, R, & Kiplinger, V. (1995). Linking statewide tests to the national assessment of
education of education progress: Stability of results. Applied Measurement in Education, 10, 145-159.
Mackey, B., Pitcher, S., & Decman, J. (2006). The influence of four elementary
principals upon their schools' reading programs and students' reading scores. Education, 127(1), 39-55.
Marklein, M. B. (2010, September 14). College board encouraged by lack of change in
SAT results. USA Today, p. 2A. Maxwell, L. (2010). Union takes on high-stakes test in running troubled L.A. schools.
Education Week, 29(24), 10-11. McNeil, M. (2008). Exit scramble. Education Week, 27(45), 21-23. Mercogliano, C. (2004). No Child Left Behind. Paths of Learning, 22, 7. Motley-King, J. V. (2008). Perception of the high school exit examination and its
alternatives from African American parents with children in special education. Available from ProQuest Dissertations and Theses database. (UMI No. 3374316)
Napoli, A., & Raymond, L. (2004). How reliable are our assessment data: A comparison
of the reliability of data produced in graded and un-graded conditions. Research in higher Education, 45(8), 921-929.

101
National Poverty Center. (2008). Poverty in the United States. Retrieved from
http://www.npc.umich.edu/poverty/ Newman, K. S., & Chin, M. M. (2003). High stakes: Time poverty, testing, and the
children of the working poor. Qualitative Sociology, 26(1), 3. Newton, P. E. (2005). The public understanding of measurement inaccuracy. British
Educational Research Journal, 31, 419-442. Noble, J., & Sawyer, R. (2002). Predicting different levels of academic success in college
using high school GPA and act composite score. Retrieved from http://www.act.org/research/reports/pdf/ACT_RR2002-4.pdf
North Central Texas Council of Governments. (2009). Population estimates. Retrieved
from http://www.nctcog.dst.tx.us/ris/demographics/population.asp O'Leary, P., Cockburn, M., Powell, D., & Diamond, K. (2010). Head start teachers' views
of phonological awareness and vocabulary knowledge instruction. Early Childhood Education Journal, 38(3), 187-195. doi:10.1007/s10643-010-0394-0
Olson, L. (2006). Report finds Connecticut high school test a strong predictor of college
success. Education Week, 25(22), 21. Ornstein, A. (2010, September). Achievement gaps in education. Society, 424-429. doi:
10.1007/s12115-010-9354-y Pine, P. (2008). Master the SAT. Princeton, NJ: Peterson’s.
Popham, M. L. (2003). Raising standards or raising barriers? Inequality and high-stakes testing in public education. New York, NY: The Century Foundation Press.
Randolf, J. J. (2007). Meta-analysis of the research on response cards: Effects on test
achievement, quiz achievement, participation, and off-task behavior. Journal of Positive Behavior Interventions, 9, 113-128.
Ravitch, D. (2010). The death and life of the great American school system. New York,
NY: Basic Books. Ravitch, D., & Cortese, A. (2009). Why we're behind: What top nations teach their
students but we don't. Education Digest, 75(1), 35-38. Reynolds, A., & Temple, J. (1998). Extended early childhood intervention and school
achievement: Age thirteen findings from the Chicago longitudinal study. Child Development, 69(1), 231-246.

102
Richard, A. (2003). Florida leaders respond to NAACP bias complaint. Education Week, 23(3), 22.
Rise of Testing. (2001). CQ Researcher, 11(15), 330. Robelen, E. (2000). Parents seek civil rights probe of high-stakes tests in LA. Education
Week, 20(6), 14. Robert J. S. (1997, August 25). Extra credit for doing poorly. New York Times, p. 23. Ross, S. M., Nunnery, J. A., Goldfeder, E., McDonald, A., Rachor, R., Hornbeck, M., &
Fleischman, S. (2004). Using school reform models to improve reading achievement: A longitudinal study of direct instruction and success for all in an urban district. Journal of Education for Students Placed at Risk, 9, 357-388.
Rothstein, M., & Jesse, J. (2004). College performance predictions and the SAT. Journal
of Econometrics, 121(1-2) 297-317. Rutchick, A., Smyth, J., Lopoo, L., & Dusek, J. (2009). Great expectations: The biasing
effects of reported child behavior problems on educational expectancies and subsequent academic achievement. Journal of Social & Clinical Psychology, 28(3), 392-413.
Shavelson, R. (2007). Assessing student learning responsibly: From history to an
audacious proposal. The Magazine of Higher Learning, 39(1), 26-33. Steele, M. (2010). High school students with learning disabilities: mathematics
instruction, study skills, and high stakes tests. American Secondary Education, 38(3), 21-27.
Stein, L. (2008, February 24). Merit pay flows to affluent schools. St. Petersburg Times,
p. 1A. Strage, D. (2000). Predictors of college adjustment and success: Similarities and
differences among Southeast-Asian-American, Hispanic and White students. Education, 120(4), 731-721.
Strauss, V. (2011, January 10). The American disdain for children. Washington Post, p.
B02. Stutz, T. (2005, Sept., 25). Study faults high-stakes testing, authors cite low rate of
improvement, effect on minorities. The Dallas Morning News, p. 4A. Swain, K. (2006). Students with disabilities meeting the challenge of high-stakes writing
assessments. Education, 126(4), 660-665.

103
Technical Manual: Stanford Achievement Test Series (10th ed.). (2003). San Antonio, TX: Harcourt Publishing.
Tehrani, A. (2007, May 24). How to fix No Child Left Behind. Time. Retrieved from
http://www.time.com/time/magazine/article/0,9171,1625192,00.html Tuerk, P. W. (2005). Research in the high-stakes era. Psychological Science, 16(6), 419-
425. doi: 10.1111/j.0956-7976.2005.01550.x U.S. Department of Education. (1983). A nation at risk. Retrieved from
http://www2.ed.gov/pubs/NatAtRisk/findings.html Viadero, D. (2010). Researchers argue head start study delayed, ignored. Education
Week, 29(28), 12. Voyager Launches Multimedia Adolescent Reading Intervention Program. (2006).
Electronic Education Report, 13(2), 1-2. Welshman, J. (2010). From Head Start to Sure Start: Reflections on Policy Transfer.
Children & Society, 24(2), 89-99. doi:10.1111/j.1099-0860.2008.00201.x Widemuth, H., Madaus, G. F., & Haney, W. (1994). Competency testing and dropouts.
Dropouts from school: Issues, dilemmas, and solutions. Albany, NY: State University of New York Press.
Zimmerman, B., & Dibenedetto, M. (2008). Mastery learning and assessment:
Implications for students and teachers in an era of high-stakes testing. Psychology in the Schools, 45(3), 206-216.

104
Appendix