
Subthalamic nucleus beta and gamma activity is modulated ... · Subthalamic nucleus beta and gamma...
9
Research Paper Subthalamic nucleus beta and gamma activity is modulated depending on the level of imagined grip force Petra Fischer a,b, ⁎, Alek Pogosyan a,b , Binith Cheeran b , Alexander L. Green b , Tipu Z. Aziz b , Jonathan Hyam c , Simon Little c , Thomas Foltynie c , Patricia Limousin c , Ludvic Zrinzo c , Marwan Hariz c , Michael Samuel d , Keyoumars Ashkan d , Peter Brown a,b , Huiling Tan a,b a Medical Research Council Brain Network Dynamics Unit at the University of Oxford, OX1 3TH Oxford, United Kingdom b Nuffield Department of Clinical Neurosciences, John Radcliffe Hospital, University of Oxford, OX3 9DU Oxford, United Kingdom c Unit of Functional Neurosurgery, Sobell Department of Motor Neuroscience and Movement Disorders, University College London Institute of Neurology, WC1N 3BG London, United Kingdom d Departments of Neurology and Neurosurgery, King's College Hospital, King's College London, United Kingdom abstract article info Article history: Received 15 December 2016 Received in revised form 5 March 2017 Accepted 22 March 2017 Available online 22 March 2017 Motor imagery involves cortical networks similar to those activated by real movements, but the extent to which the basal ganglia are recruited is not yet clear. Gamma and beta oscillations in the subthalamic nucleus (STN) vary with the effort of sustained muscle activity. We recorded local field potentials in Parkinson's disease patients and investigated if similar changes can be observed during imagined gripping at three different ‘forces’. We found that beta activity decreased significantly only for imagined grips at the two stronger force levels. Additionally, gamma power significantly scaled with increasing imagined force. Thus, in combination, these two spectral features can provide information about the intended force of an imaginary grip even in the absence of sensory feedback. Mod- ulations in the two frequency bands during imaginary movement may explain the rehabilitating benefit of motor imagery to improve motor performance. The results also suggest that STN LFPs may provide useful information for brain-machine interfaces. © 2017 The Authors. Published by Elsevier Inc. This is an open access article under the CC BY license (http:// creativecommons.org/licenses/by/4.0/). Keywords: STN Basal ganglia Force decoding Motor imagery Imagined force Beta suppression Gamma oscillations Neuro-feedback Brain machine interface Brain computer interface 1. Introduction Mental imagery, in addition to physical practice, is known to boost motor performance in comparison to physical practice alone (Avanzino et al., 2009). Two studies have indicated that physical train- ing combined with mental imagery or autogenic training can improve motor performance more than physical exercises alone in patients with Parkinson's disease (Ajimsha et al., 2014; Tamir et al., 2007). Ac- cordingly, it has been suggested that motor imagery exercises might be useful in improving motor control during physical rehabilitation in Parkinson's disease (Abbruzzese et al., 2015). This might be fruitful, as in Parkinson's disease not only motor execution, but also motor plan- ning seems to be impaired (Avanzino et al., 2013; Conson et al., 2014). This idea is corroborated by imaging and transcranial magnetic stimula- tion studies that have demonstrated abnormal network activity during motor imagery in this patient group (Cunnington et al., 2001; Helmich et al., 2007; Maillet et al., 2015; Rienzo et al., 2014; Thobois et al., 2000; Tremblay et al., 2008). However, the neural basis of the rehabili- tating effect of motor imagery in Parkinson's disease is still not known. Better understanding of the network activity underpinning motor imag- ery might help inform how best to leverage this potential therapeutic adjunct to physical rehabilitation in Parkinsonian patients. Here we hypothesize that motor imagery involves the basal ganglia in humans in a similar fashion to real movements. We test this by inves- tigating if activity recorded during motor imagery in the basal ganglia is modulated in a task-dependent manner similarly as during real move- ments. It has already been shown that beta activity decreases in the sub- thalamic nucleus (STN) local field potential (LFP) during mental imagery of brief wrist extension movements, and that this is not the case during non-motor visual imagery (Kühn et al., 2006). Similar de- creases in beta activity have also been reported during passive action observation in the STN (Alegre et al., 2010; Marceglia et al., 2009). But it is still not established whether the extent of such beta changes de- pends on the intended effort or force of the movement that is imagined. In addition, in motor cortex, mu and beta activity are reduced during motor imagery whereas gamma activity tends to increase, with the Experimental Neurology 293 (2017) 53–61 ⁎ Corresponding author at: Nuffield Department of Clinical Neurosciences, Level 6, West Wing, John Radcliffe Hospital, University of Oxford, OX3 9DU Oxford, United Kingdom. E-mail address: petra.fi[email protected] (P. Fischer). http://dx.doi.org/10.1016/j.expneurol.2017.03.015 0014-4886/© 2017 The Authors. Published by Elsevier Inc. This is an open access article under the CC BY license (http://creativecommons.org/licenses/by/4.0/). Contents lists available at ScienceDirect Experimental Neurology journal homepage: www.elsevier.com/locate/yexnr
Transcript of Subthalamic nucleus beta and gamma activity is modulated ... · Subthalamic nucleus beta and gamma...

Experimental Neurology 293 (2017) 53–61
Contents lists available at ScienceDirect
Experimental Neurology
j ourna l homepage: www.e lsev ie r .com/ locate /yexnr
Research Paper
Subthalamic nucleus beta and gamma activity is modulated dependingon the level of imagined grip force
Petra Fischer a,b,⁎, Alek Pogosyan a,b, Binith Cheeran b, Alexander L. Green b, Tipu Z. Aziz b, Jonathan Hyam c,Simon Little c, Thomas Foltynie c, Patricia Limousin c, Ludvic Zrinzo c, Marwan Hariz c, Michael Samuel d,Keyoumars Ashkan d, Peter Brown a,b, Huiling Tan a,b
a Medical Research Council Brain Network Dynamics Unit at the University of Oxford, OX1 3TH Oxford, United Kingdomb Nuffield Department of Clinical Neurosciences, John Radcliffe Hospital, University of Oxford, OX3 9DU Oxford, United Kingdomc Unit of Functional Neurosurgery, Sobell Department of Motor Neuroscience and Movement Disorders, University College London Institute of Neurology, WC1N 3BG London, United Kingdomd Departments of Neurology and Neurosurgery, King's College Hospital, King's College London, United Kingdom
⁎ Corresponding author at: NuffieldDepartment of CliniWing, John Radcliffe Hospital, University of Oxford, OX3 9
E-mail address: [email protected] (P. Fische
http://dx.doi.org/10.1016/j.expneurol.2017.03.0150014-4886/© 2017 The Authors. Published by Elsevier Inc
a b s t r a c t
a r t i c l e i n f oArticle history:Received 15 December 2016Received in revised form 5 March 2017Accepted 22 March 2017Available online 22 March 2017
Motor imagery involves cortical networks similar to those activated by real movements, but the extent to whichthe basal ganglia are recruited is not yet clear. Gamma and beta oscillations in the subthalamic nucleus (STN) varywith the effort of sustainedmuscle activity.We recorded local field potentials in Parkinson's disease patients andinvestigated if similar changes can beobserved during imaginedgripping at threedifferent ‘forces’.We found thatbeta activity decreased significantly only for imagined grips at the two stronger force levels. Additionally, gammapower significantly scaled with increasing imagined force. Thus, in combination, these two spectral features canprovide information about the intended force of an imaginary grip even in the absence of sensory feedback.Mod-ulations in the two frequency bands during imaginarymovementmay explain the rehabilitating benefit ofmotorimagery to improve motor performance. The results also suggest that STN LFPs may provide useful informationfor brain-machine interfaces.
© 2017 The Authors. Published by Elsevier Inc. This is an open access article under the CC BY license (http://creativecommons.org/licenses/by/4.0/).
Keywords:STNBasal gangliaForce decodingMotor imageryImagined forceBeta suppressionGamma oscillationsNeuro-feedbackBrain machine interfaceBrain computer interface
1. Introduction
Mental imagery, in addition to physical practice, is known toboost motor performance in comparison to physical practice alone(Avanzino et al., 2009). Two studies have indicated that physical train-ing combined with mental imagery or autogenic training can improvemotor performance more than physical exercises alone in patientswith Parkinson's disease (Ajimsha et al., 2014; Tamir et al., 2007). Ac-cordingly, it has been suggested that motor imagery exercises mightbe useful in improving motor control during physical rehabilitation inParkinson's disease (Abbruzzese et al., 2015). This might be fruitful, asin Parkinson's disease not only motor execution, but also motor plan-ning seems to be impaired (Avanzino et al., 2013; Conson et al., 2014).This idea is corroborated by imaging and transcranialmagnetic stimula-tion studies that have demonstrated abnormal network activity duringmotor imagery in this patient group (Cunnington et al., 2001; Helmich
cal Neurosciences, Level 6,WestDU Oxford, United Kingdom.r).
. This is an open access article under
et al., 2007; Maillet et al., 2015; Rienzo et al., 2014; Thobois et al.,2000; Tremblay et al., 2008). However, the neural basis of the rehabili-tating effect of motor imagery in Parkinson's disease is still not known.Better understanding of the network activity underpinningmotor imag-ery might help inform how best to leverage this potential therapeuticadjunct to physical rehabilitation in Parkinsonian patients.
Here we hypothesize that motor imagery involves the basal gangliain humans in a similar fashion to realmovements.We test this by inves-tigating if activity recorded duringmotor imagery in the basal ganglia ismodulated in a task-dependent manner similarly as during real move-ments. It has already been shown that beta activity decreases in the sub-thalamic nucleus (STN) local field potential (LFP) during mentalimagery of brief wrist extension movements, and that this is not thecase during non-motor visual imagery (Kühn et al., 2006). Similar de-creases in beta activity have also been reported during passive actionobservation in the STN (Alegre et al., 2010; Marceglia et al., 2009). Butit is still not established whether the extent of such beta changes de-pends on the intended effort or force of themovement that is imagined.In addition, in motor cortex, mu and beta activity are reduced duringmotor imagery whereas gamma activity tends to increase, with the
the CC BY license (http://creativecommons.org/licenses/by/4.0/).

54 P. Fischer et al. / Experimental Neurology 293 (2017) 53–61
latter outperforming changes in mu/beta for decoding of individualimaginedfingermovements (Liao et al., 2014).Whether gammaactivityalso increases in the STN duringmotor imagery is not known. However,there is some reason to suspect that reciprocal changes in beta andgamma activity in the STN might occur during motor imagery andscale with task demands. When patients with Parkinson's disease per-form realmanual grips at different force levels, beta and gamma activityin the STN are modulated such that the change in the gamma-bandsubtracted by the change in the beta-band linearly scales with theamount of force applied (Tan et al., 2013). If imagined gripping involvessimilar network dynamics as real gripping (Jeannerod, 2001), wewouldpredict not only a beta decrease in the STN but also a gamma increasethat is amplified with increasing force. Here we test this prediction byanalysing local field potential recordings from the STN in Parkinson'sdisease patients who have undergone deep brain stimulation surgery.
2. Materials and methods
2.1. Participants
We recorded 11 Parkinson's disease patientswhohad undergone bi-lateral implantation of deep brain stimulation (DBS) leads in the STN 2–7 days prior to the recording. Patients underwentDBS surgery to receivechronic high-frequency stimulation of the STN to improvemotor symp-toms. In the first operation, electrode extension cables were external-ized through the scalp to enable recordings. In a second operativeprocedure, up to 7 days later, a subcutaneous DBS pacemaker was im-planted and connected to the electrodes used for chronic stimulation.In this relatively small cohort the number of post-operative days beforerecording had no obvious effect on the spectral reactivity patterns. Thestudywas approved by the local ethics committee and patients were re-corded after obtaining informed written consent. One patient had to beexcluded because of excessive movement artefacts during real gripping.This patient had Boston Scientific DB-2201™ leads implanted. Clinicaldetails of all patients included (mean age 61.3 ± 7 years, mean diseaseduration 9.6 ± 4 years, all right-handed, three female) are listed inTable 1. Recordingswere performed in three surgical centres: King's Col-lege Hospital and University College Hospital in London and the JohnRadcliffe hospital in Oxford, UK. For each patient one of the followingthree macroelectrode models was used: Medtronic 3389 (quadripolar,n= 6), Boston Scientific DB-2201 Vercise (octopolar, n=2) and BostonScientific DB-2202 Vercise directional (octopolar, directional, n = 3).
2.2. Task
Patients were seated in a comfortable chair with their elbows flexedat about 90°. They held a dynamometer (G200; Biometrics Ltd.,Cwmfelinfach, Gwent, UK) in each hand and were asked to grip it with
Table 1Clinical details. Age and disease duration are given in years. UPDRS-III: Unified Parkinson's diseaal. (2010). JR = John Radcliffe hospital, KC = King's College Hospital, UCL = University Colleg
ID Age/sex UPDRS-III off/on levodopa Disease duration Main symptom
1 71/m 22/8 12 Tremor2 55/m 27/8 6 Rigidity, gait3 56/m 17/9 3 Tremor
4 75/m 31/10 11 Gait, tremor5 55/f 84/25 7 Gait, dystonia
6 62/m 27/4 12 Freezing of gait7 60/m 52/30 8 Freezing of gait,8 59/m 53/18 7 Tremor, bradykin
9 60/f 56/31 14 Tremor, dyskines10 64/f 66/36 16 Rigidity, tremor
maximal effort three times to obtain the maximum sustainable force be-fore starting the main session. They had to hold the grip for as long as awhite dot was presented on a computer screen (4.5 s), and performedthis procedure separately for eachhand. The timepoint of themost stableforce production was selected manually in each trial and the maximumsustainable forcewas then computed as themaximumof the three trials.
In the first part of the main experiment, patients were presentedwith a red bar on the screen that instructed them to grip at 15, 50 or85% of the maximum sustainable force (Fig. 1). The white dot and redbar both appeared either on the left or right field of the screen, whichinstructed themwith which hand they should grip (left or right respec-tively). Thesewere selected in a pseudo-randomorder. The redhorizon-tal bars were presented at three different heights, corresponding to thedifferent desired forces. The horizontal red bars were presented for 4.5 sin each trial. The exerted grip force was presented in real time as a ver-tical red column that increased in proportion to the force delivered. Itreplaced a vertical white column that corresponded tomaximal sustain-able force. The inter-trial interval was chosen randomly between 4 and4.5 s. The time windows and force levels requested were set such thatfatiguewas kept to aminimum in the context of a time-limited post-op-erative study. Prior to the first recorded block, patients performed prac-tice trials until they were comfortable with the task. We recorded threeblocks in each condition. Each block contained 3–5 trials for each handand force level (depending on the patient's fatigue, see Fig. 2). Aftercompletion of a block, patients were allowed to rest for as long as theywished. This resulted in an overall average number of 11± (SD) 2.8 tri-als per hand and force level.
In the second part of the main experiment, the dynamometers wereput aside and patients were asked to rest their arms still on their lap forimagined gripping. Patients were instructed to imagine the gripping ac-tion they had just performed without activating any muscles. Theywere told to keep their arms fully relaxed, and it was pointed out thatthis would be assessed via recordings from the electromyographic(EMG) electrodes placed on their forearm (Fig. 3). However, they werenot provided with real-time visual feedback of EMG or electrophysiolog-ical activity. The duration of the cue presentation was shortened to 2.5 sfor the imagery condition tomake it easier for patients tomaintain imag-ery at the correct level for the whole trial duration and to avoid mind-wandering. Otherwise timingswere kept the same as above. The imageryrecordings were also split into three blocks allowing for breaks betweenblocks. Each block contained three trials per hand and force level resultingin an overall average number of 9± 1 trials for each hand and force level.
2.3. Recordings
Monopolar LFPs were recordedwith a TMSi Porti amplifier (2048Hzsampling rate, common average reference, TMS International, Nether-lands) simultaneously with the force data from two dynamometers
se rating scale part III. Levodopa equivalent dose was calculated according to Tomlinson ete London Hospital.
Medication (mg/day) DBS lead Surgical centre
923 mg Medtronic 3389™ KC, London1009 mg Medtronic 3389™ JR, Oxford328 mg Boston Scientific
DB-2201™KC, London
565 mg Medtronic 3389™ KC, London1618 mg Boston Scientific
DB-2202™JR, Oxford
955 mg Medtronic 3389™ KC, London1282 mg Medtronic 3389™ UCL, London
esia, dyskinesia 1195 mg Boston ScientificDB-2202™
JR, Oxford
ia 1750 mg Medtronic 3389™ KC, London1628 mg Boston Scientific
DB-2202™JR, Oxford

Fig. 1. Sequence of visual cues. A) In inter-trial intervals the armswere relaxed and the red cursor bars indicating the grip force registered by the dynamometerswere down at the bottomof the white vertical bars. B) At the start of each trial, a white dot and a red horizontal bar appeared either behind the left or the right white bar corresponding to the left and right handrespectively. The cue displayed here instructs patients to grip with their right hand at the lightest level (15% ofmaximum sustainable force). C) Patients adjusted their grip force such thatthe red vertical column rises to the same level of the red horizontal bar. D) Example of a trial instructing gripping at the strongest level (85% of maximum sustainable force) with the lefthand. In the imagined condition, the red horizontal cues indicate the force level and effector side as during real gripping, however the red vertical bar remaineddown. (For interpretation ofthe references to colour in this figure legend, the reader is referred to the web version of this article.)
55P. Fischer et al. / Experimental Neurology 293 (2017) 53–61
and two EMGelectrodes placed on the left and right extensormuscles ofthe forearm (data available on request). The data were re-referencedoffline to obtain spatially focal bipolar signals by subtracting the datafrom neighbouring electrode contacts. If single channels were saturatedor inactive, the remaining surrounding contacts were used instead.
Subjective performance ratings after each of the three motor imag-ery blocks were recorded with a questionnaire asking “How well wereyou able to imagine gripping?” Patients indicated their subjective per-ception on a visual analogue scale ranging from 0 to 10 with 10 corre-sponding to “Very well” and 0 to “Not at all”.
2.4. Data pre-processing
All data analyses apart from the computation of ANOVAs wereperformed in MATLAB (v. 2016a, The MathWorks Inc., Natick, Massa-chusetts). Trials containing artefacts in the force signal ormovement ar-tefacts in the LFP signal were removed following visual inspection. Datawere down-sampled to 1000 Hz and high-pass filtered with a 5 Hz cut-off (Butterworth filter with a filter order of 6, passed forwards and back-wards). Continuous wavelet transform with Morlet wavelets was thenapplied using the fieldtrip-function ft_freqanalysis (Oostenveld et al.,2011). The wavelet width was set to 8 cycles for frequencies below30 Hz and to 26 cycles for frequencies higher than 50 Hz. For thegamma-band, power was averaged between 55 and 85 Hz. This range
Fig. 2. Time course of one block. The inter-trial interval (ITI)was followed by the cue onset(horizontal red bar), which remained present for 4.5 s in the executed gripping conditionand for 2.5 s in the imagined gripping condition. Patients relaxed their arms between eachtrial in the ITI, which varied randomly between 4 and 4.5 s. Each hand and force level wasperformed 3–5 times depending on the patient's fatigue. (For interpretation of thereferences to colour in this figure legend, the reader is referred to the web version ofthis article.)
was selected to avoid line interference and to capture the reactivity ob-served particularly in this range (Fig. 4; resultswere highly similar if sta-tistics were computed with a 55–81 Hz band). 26 cycles thus providedan estimate of power within a window of about 0.37 s, which was sim-ilar to the 0.40s window including 8 cycles at 20 Hz.
In the next step, the power of the resulting time-frequency decom-position was down-sampled to 50 Hz and baseline-normalized. Aftercomputing the median across trials, a window ranging from −2 to−0.5 s prior to cue onset was chosen as baseline (−0.5 s to limitinclusion of any preparatory beta decrease that might have occurredclose to the cue). We analysed only bipolar contacts that showed a sig-nificant movement-related beta decrease upon real gripping across allcontralateral grip trials irrespective of force level (assessed by one-sam-ple t-tests against zero) and thus should be located close to the dorsal,i.e. sensorimotor region, of the STN (Levy et al., 2002; Weinberger etal., 2006;Williams et al., 2005). From these bipolar contacts, the bipolarcontact and the frequency (±2 Hz) with the largest beta decrease wasselected. If none of the bipolar contacts of an electrode recorded a signif-icant beta decrease, this electrode was excluded from further analyses.In total, 1 of 20 electrodes was excluded.
To assess the spectral change, we tested the time-averaged normal-ized power from 0.5 to 2.5 s after the cue for frequencies in the betarange (12–30 Hz in 2 Hz steps). The window started at 0.5 s to allowfor reaction times, which were around 0.5 s as displayed in Fig. 3. EMGactivitywasfiltered between 3 and 400Hz (Butterworth filter with a fil-ter order of 6, passed forwards and backwards) and rectified. To exam-ine if the velocity of grip onset differed between force levels, the peakrate of force generation was calculated as themaximum of the differen-tiated force.
2.5. Statistical analyses
Gripping consists of an onset phase and a later period during whichgrip force is more or less sustained. Thus, we separated the data into anearly and late time window. Fig. 3 shows that movement started onlyabout 0.5 s after the cue and that it took up to 1.7 s after the cue toreach the desired level across the different cued grip strengths. Thus,the early window was defined to span 0.5–1.7 s and the late window1.7–2.5 s. As durations of executed and imagined movements havebeen reported to be similar (Papaxanthis et al., 2002), we assumedthat these windows adjusted to the time course observed during realgripping reflected similar time periods related to the motor process inthe imagined condition.
For each subject, the median power change across trials was com-puted for each force level to obtain a robust estimate of power changes,and then this was averaged within the two time windows. The datawere then subjected to the following repeated-measures ANOVAusing SPSS (v. 22, IBM SPSS Statistics for Windows, Armonk, NY: IBMCorp.):
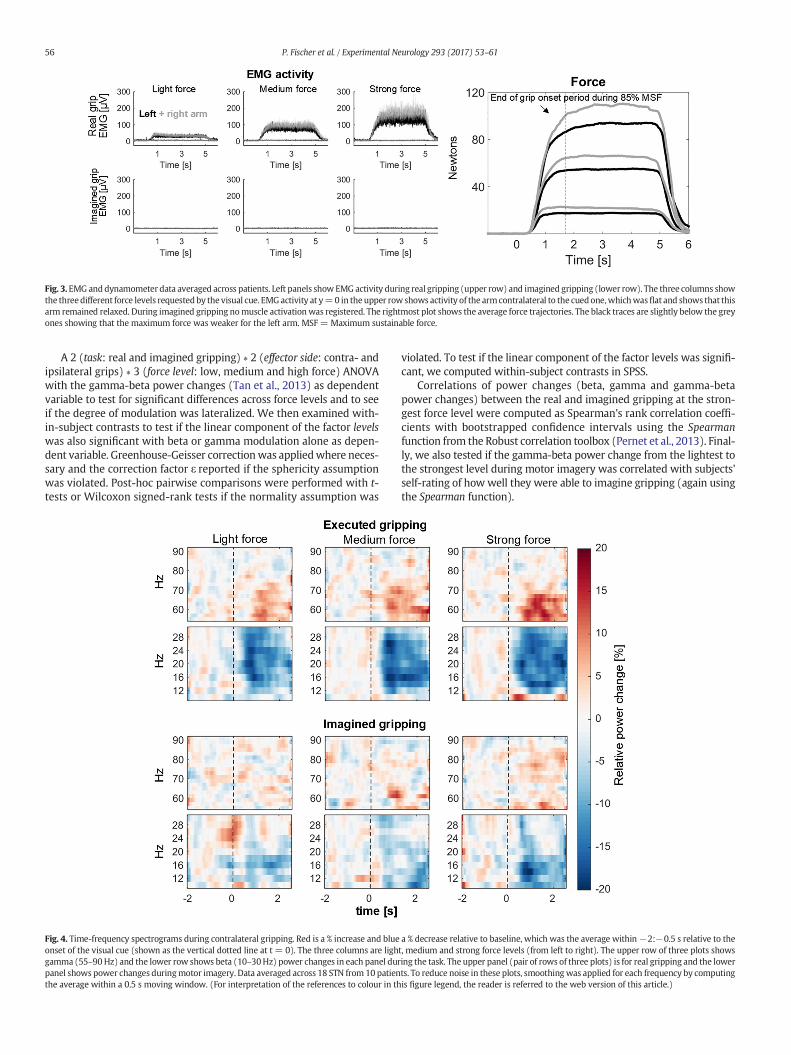
Fig. 3. EMG anddynamometer data averaged across patients. Left panels showEMG activity during real gripping (upper row) and imagined gripping (lower row). The three columns showthe threedifferent force levels requestedby the visual cue. EMGactivity at y=0 in theupper row shows activity of the armcontralateral to the cuedone,whichwasflat and shows that thisarm remained relaxed. During imagined gripping nomuscle activationwas registered. The rightmost plot shows the average force trajectories. The black traces are slightly below the greyones showing that the maximum force was weaker for the left arm. MSF = Maximum sustainable force.
56 P. Fischer et al. / Experimental Neurology 293 (2017) 53–61
A 2 (task: real and imagined gripping) ∗ 2 (effector side: contra- andipsilateral grips) ∗ 3 (force level: low, medium and high force) ANOVAwith the gamma-beta power changes (Tan et al., 2013) as dependentvariable to test for significant differences across force levels and to seeif the degree of modulation was lateralized. We then examined with-in-subject contrasts to test if the linear component of the factor levelswas also significant with beta or gamma modulation alone as depen-dent variable. Greenhouse-Geisser correctionwas appliedwhere neces-sary and the correction factor ɛ reported if the sphericity assumptionwas violated. Post-hoc pairwise comparisons were performed with t-tests or Wilcoxon signed-rank tests if the normality assumption was
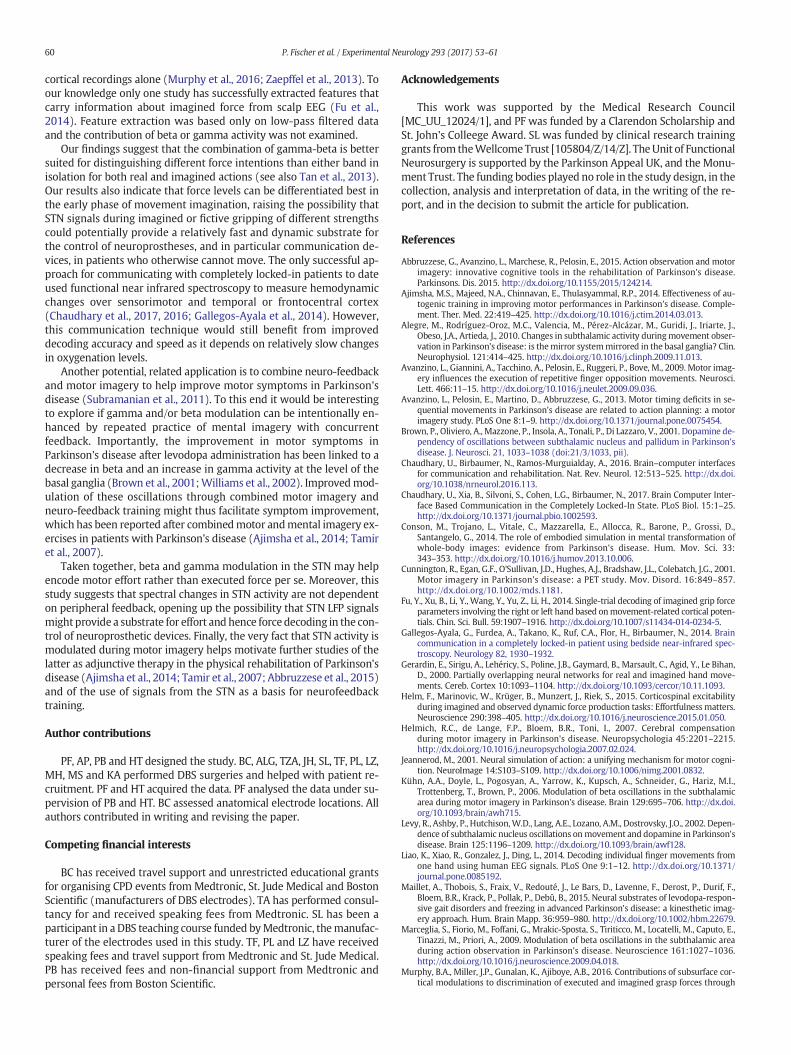
Fig. 4. Time-frequency spectrograms during contralateral gripping. Red is a % increase and blueonset of the visual cue (shown as the vertical dotted line at t = 0). The three columns are lighgamma (55–90Hz) and the lower row shows beta (10–30Hz) power changes in each panel durpanel shows power changes duringmotor imagery. Data averaged across 18 STN from 10 patienthe average within a 0.5 s moving window. (For interpretation of the references to colour in th
violated. To test if the linear component of the factor levels was signifi-cant, we computed within-subject contrasts in SPSS.
Correlations of power changes (beta, gamma and gamma-betapower changes) between the real and imagined gripping at the stron-gest force level were computed as Spearman's rank correlation coeffi-cients with bootstrapped confidence intervals using the Spearmanfunction from the Robust correlation toolbox (Pernet et al., 2013). Final-ly, we also tested if the gamma-beta power change from the lightest tothe strongest level during motor imagery was correlated with subjects'self-rating of how well they were able to imagine gripping (again usingthe Spearman function).
a % decrease relative to baseline, which was the average within−2:−0.5 s relative to thet, medium and strong force levels (from left to right). The upper row of three plots showsing the task. The upper panel (pair of rows of three plots) is for real gripping and the lowerts. To reduce noise in these plots, smoothingwas applied for each frequency by computingis figure legend, the reader is referred to the web version of this article.)

Fig. 6. Force-dependent changes of gamma-beta activity averaged across task and effectorside. Force-dependent contralateral power changes are separately displayed for each taskin this figure. In both the early and late time window force increases with force level. Thedifference between power at the highest and lowest force level is significant in bothwindows. * denotes that power significantly differed between levels after controlling formultiple comparisons with FDR-correction (*b0.05, **b0.01).
57P. Fischer et al. / Experimental Neurology 293 (2017) 53–61
3. Results
3.1. Behavioural data
Force and EMG trajectories show that patients were able to adjusttheir grip force according to the cues provided during real gripping(Fig. 3). The average maximum sustainable force was 132 ± (SD)69 N for the right and 121 ± 54 N for the left hand. The force appliedin the sustained period (1.7–2.5 s) during low, medium and highforce trials was on average 17 ± 3%, 49 ± 4% and 81 ± 8% of themaximum sustainable force. A 2 × 3 ANOVA with peak velocity ofthe force onset as dependent variable and side (left, right) and forcelevels as factor showed that only the factor force level was significant(F2,18 = 6.1, P = 0.010), and not the factor side (P = 0.083) nor the in-teraction (P = 0.780). Peak rate of force generation during light gripsdiffered significantly from the peak velocity of medium (P = 0.002)and strong (P = 0.002) grips, whereas peak rate of force generation didnot differ significantly between medium and strong grips (P = 0.084).The EMG activity of the arm contralateral to the cued one was flat show-ing that muscles in this arm were not co-activated (Fig. 3).
In the imagined condition, no EMGactivitywas visible on either side,confirming that patients kept their arms relaxed as instructed (Fig. 3,bottom row). Patients' subjective rating of how well they were able toimagine gripping was on average 6.6 ± 1.3 on a scale from 0 to 10,with 0 meaning “Not at all” and 10 meaning “Very well”.
3.2. Contact and frequency band selection
In one patient, beta was significantly modulated only in the rightelectrode, and in another patient the maximum sustainable force wasset too low for one side because of a technical error and thus wasdiscarded. In total, 18 STN from 10 patients were included for analysisof the LFP data. The average beta frequency with the highest move-ment-related reactivity was 22 ± 6 Hz. Fig. 5 shows LFP recordingsfrom one patient performing a representative trial of executed and ofimagined gripping at the strongest force level. The 20–25 Hz filteredbeta oscillations decrease clearly with cue onset.
3.3. Gamma-beta power changes depend on the force level
To assess if the observed power changes (Fig. 4)weremodulated in aforce-dependentmanner, and if these changeswere lateralized,we per-formed a 2 (task: real and imagined gripping) ∗ 2 (effector side: contra-and ipsilateral grips) ∗ 3 (force level: low, medium and high force)ANOVAwith the gamma-beta power changes as the dependent variable(see Tan et al., 2013).
Fig. 5. LFP recording from one representative patient. The first row shows the raw bipolar looscillations within the same data filtered between 20 and 25 Hz and the third row showsgripping with the contralateral hand and strongest force (4.5 s cue duration, onset at 0 s). Ththe same hand and same force level (2.5 s cue duration).
All threemain effectswere significant for both the early (task: F1, 17=13.8, ɛ = 1.0, P = 0.002; effector side: F1, 17 = 28.8, ɛ = 1.0, P b 0.001;force level: F2, 34 = 5.0, ɛ = 0.98, P = 0.013) and the late time window(task: F1, 17 = 14.1, ɛ = 1.0, P = 0.002; effector side: F1, 17 = 37.9, ɛ =1.0, P b 0.001; force level: F2, 34 = 4.3, ɛ = 0.92, P = 0.026). Post-hocpairwise comparisons between force levels are shown in Fig. 6. Within-subject contrasts were also computed to test if the linear component ofthe factor levels was significant, which was confirmed again for boththe early and the late time window (Table 2).
In addition to the main effect, we found a significant interaction ofeffector side ∗ task in both the early (F1, 17 = 6.4, ɛ = 1.0, P = 0.022)and late window (F1, 17 = 5.2, ɛ = 1.0, P = 0.037). Post-hocpairwise comparisons for both windows showed that power differedbetween contra- and ipsilateral grips only significantly in thereal gripping condition (early window: realContra = 26.0 ± 17.9,realIpsi = 10.9 ± 15.4, P b 0.001; late window: realContra = 22.6 ±14.3, realIpsi = 8.7 ± 15.0, P b 0.001) and not in the imagined con-dition (early window: imaginedContra = 9.9 ± 10.1, imaginedIpsi =6.2 ± 10.3, P = 0.111; late window: imaginedContra = 7.6 ± 9.6,imaginedIpsi = 3.5 ± 10.4, P = 0.063). The beta and gamma powertraces in Fig. 7 also depict this difference over time.
None of the other interactions were significant (early window:effector side ∗ force level P=0.503, task ∗ force level P=0.835, effectorside ∗ task ∗ force level P = 0.231; late window: effector side ∗ forcelevel P = 0.360, task ∗ force level P = 0.291, effector side ∗ task ∗ forcelevel P = 0.976). Even though the relative power modulation was lessin the imagined condition than during real gripping, as confirmed bythe main effect of task, the fact that the interaction task ∗ force levelwas not significant indicates that the force-dependent modulation of
cal field potential (2 s drift correction removal applied), the second row shows the betathe force trajectory recorded with the dynamometer. The left panel shows one trial ofe right panel shows the same channel in a trial prompting imagination of gripping with

Table 2Linear within-subject contrasts of the factor levels. The F-statistic, which tests if powerchanges were linearly related to the increasing force levels, was significant and highestfor the combined change in gamma - beta.
Power Early window Late window
Gamma - beta F1, 17 = 9.4, P = 0.007 F1, 17 = 9.0, P = 0.008Beta only F1, 17 = 6.3, P = 0.023 F1, 17 = 6.2, P = 0.024Gamma only F1, 17 = 5.9, P = 0.027 F1, 17 = 5.0, P = 0.040
Fig. 8. Mean power across patients for the three force levels in the real and imaginedgripping condition. * above markers denote that beta ERD was significantly differentfrom zero (*b0.05, **b0.01, ***b0.001, FDR-correction was applied in each plot for the 6multiple comparisons, grey * did not survive FDR-correction).
58 P. Fischer et al. / Experimental Neurology 293 (2017) 53–61
power observed during real gripping resembled that during imaginedgripping.
We also tested if the individual frequency bands, i.e. gamma or betaalonewould result in a similar or possibly larger F-statistic for the linearcomponent of the within-subject contrast of levels. The linear compo-nentwas significant in the latewindow for both cases, but the F-statisticwas reduced indicating that the combination of the two featureswas su-perior in detecting a linear relationship (Table 2).
It has not yet been shown whether gamma activity in the STN ismodulated duringmotor imagery. Thuswe computed pairwise compar-isons between the three combinations of force levels for the gamma andbeta-band separately for the two tasks. Fig. 8 shows how combinedgamma-beta power (top row), and how beta and gamma power sepa-rately change across the three different force levels in the two condi-tions. Beta activity in the sustained period (and in the early windowduring motor imagery) differed most strongly between the lowestlevel and the highest two force levels, whereas for gamma activity theincrease seemed to be more linear. Such a floor effect of the beta de-crease at medium force levels has previously been reported duringreal gripping (Tan et al., 2013). Gamma activity was significantly in-creased during imagination of gripping at the highest force level, partic-ularly in the early time window. The average increase in the late timewindow did not survive FDR-correction.
To examine if reactivity in one task was related to reactivity in theother condition, we also computed correlations between power chang-es during gripping and imagination at the highest force level. This corre-lation was significant for gamma-beta and for beta alone in the earlytime window (Fig. 9).
Fig. 7. Subject-averaged power changes (median across trials). The upper and lower rows showand the right column ipsilateral grips. Onset of the visual cue is shown as the vertical dotted linmoving window for this visualization. Shaded regions denote standard error of the mean.
We also tested if the amount of power reactivity during imaginedgripping was correlated with patients' self-rating of how well theywere able to imagine gripping.We correlated the relative power changefrom the light to the strong force level (averaged across both STN) withthe self-rating (averaged across individual ratings following each
beta and gamma power changes, respectively. The left column shows contralateral gripse at t = 0. To reduce noise, smoothing was applied by computing the average within a 1 s

Fig. 9. Correlations of power changes between the imagined and real grip condition. Eachpoint denotes one recorded STN displaying its power change in the imagined (x-axis) andreal grip condition (y-axis). Correlations were significant only for beta power and thecombination of gamma-beta power taken from the early window (during grip onset).Plot titles denote Spearman's rho followed by its 95% bootstrapped confidence intervalsand P-value. Lines were fitted with a least squares linear regression and shaded areasdenote 95% confidence intervals.
59P. Fischer et al. / Experimental Neurology 293 (2017) 53–61
block). The correlation was positive but it was not significant(Spearman's rho = 0.41, 95% CI = [−0.39, 0.89], P = 0.244).
4. Discussion
We found that STN LFP activitywasmodulated by the intended forceduring imagined gripping, suggesting that the STN LFP carries informa-tion about intended force generation even in the absence of actual mus-cle activity or movement-related peripheral proprioceptive feedback. Inaddition, to our knowledge, this is the first report of increased STNgamma activity during motor imagery, and shows that the increase ofgamma activity in the STN is not only associated with actual movementor muscle activation. The spectral changes identified during imaginedmovements further strengthen the idea that these changes relate tomotor effort rather than force coding per se (Tan et al., 2015). This signalmay then be transcribed into force through themotor cortex and relatedeffectors. The evidence that STN LFP activity is modulated and linearlyscaled with planned force duringmotor imagination also helps to moti-vate the exploration of the role of motor imagination in promoting theeffects of physical rehabilitation (Abbruzzese et al., 2015). In addition,the results suggest that similar spectral reactivity might be retainedwithin the STN in patients who cannot move and therefore have nomovement-related sensory feedback. This is important, as it maymean that the STN LFP could provide an ancillary brain-machine-inter-face signal for graded response control, such as grasp force control, inparalysed patients.
Although within-subject contrasts confirmed linear scaling of spec-tral changes during early and later phases of real and imaginary grip-ping, the average reactivity of beta and gamma oscillations was less inthe imagined condition than during real gripping. This may have beendue to several reasons. Firstly, patients may have been inattentive orfailed to sustain the imagined grip in spite of the short duration of theimagination blocks. Secondly, although sensory reafference may notbe necessary for modulating oscillations it may act to reinforce any
modulation. Finally, if changes in beta and gamma activity reflect effortas previously suggested (Tan et al., 2015), then the reducedmodulationmight also reflect reduced effort during imagined gripping, assumingthat motor imagery might present the motor network with fewer de-mands than real movement.
We also found that beta-gamma reactivity during imagined grippingat the highest force level significantly correlated with reactivity duringreal gripping, in the early time window at least. This predominatelyoriginated from a relationship within the beta-band. A similar relation-ship between beta activity modulation during real and imaginedmove-ment has also been reported previously in another motor imagery task(Kühn et al., 2006). The correlation provides some evidence that thespectral reactivity during real and imagined tasks comes from a similargenerator within the subthalamic area, perhaps the dorsolateral ‘motor’STN. Our study thus provides further evidence that imagined and realmovements may share common pathways (Gerardin et al., 2000).
4.1. Study limitations
It should be acknowledged that the observed spectral modulationmay not necessarily reflect normal physiological activity aswe recordedfrom patients with Parkinson's disease. However, patients were record-ed on dopaminergicmedication tominimize pathological activity linkedto depletion of dopamine (Weinberger et al., 2006) and vividness ofmotor imagery seems to be preserved in comparison to age-matchedcontrols even after medication withdrawal (Peterson et al., 2012).
Even though we found that gamma-beta activity during real andimagined gripping at ~15% of the maximum sustainable force differedfrom gripping at ~50 or ~85%, the latter two levels were not clearly dis-tinguishable in terms of power changes. Moreover, the beta decreaseduring onset of real gripping seemed to be saturated as it was similaracross all three different levels of force. These findings differ fromthose in our previous report of real gripping (Tan et al., 2013), andmay be related to the fact that in the current study the peak rate offorce development only differed between the lowest level and the me-dium or highest force levels but not between the latter two. In addition,Tan et al.'s study had no visual cues and thus task demands may havediffered slightly considering that the initial effort of matching gripforce to a visual cue may be similarly high for light and strong grips.Also, power changes were aligned to grip onset in their analysis insteadof cue onset as in our study, whichwas necessary for comparing execut-ed and imagined movements lacking a measurable grip onset.
Although we monitored muscle activity of the arm and closelywatched if patients sat still during the task, we cannot entirely ruleout subtle contractions of other muscle groups. However, this is a gen-eral problem in BCI control and can only ever be tested with certaintyin patients who are completely locked-in.
4.2. Translational significance of the findings
Beta and gamma activities were not only modulated during imag-ined gripping of the contralateral, but also of the ipsilateral hand. Signif-icant lateralization only occurred during real gripping. Thus, althoughthe STN LFP signal might provide a potential substrate for forcedecoding in applications involving brain machine interfaces, it maynot provide sufficient information for the selection of the limb prosthe-sis to be activated. Accordingly, selection of an effector might requirethe consideration of additional signals, such as from the cerebral cortex,asmotor cortex also seems to carry, at least to some extent, informationabout imagined force levels: Cortico-spinal excitability has been foundto differ between low and high imagined force levels with higher excit-ability at higher forces (Helm et al., 2015). In addition, cortical activityduring imagery of sustained grasping at different force levels seems tobe distinguishable from activity during rest and during imagined alter-nating movements (Murphy et al., 2016; Yin et al., 2015). Yet it seemsdifficult to discriminate between different imagined force levels from
60 P. Fischer et al. / Experimental Neurology 293 (2017) 53–61
cortical recordings alone (Murphy et al., 2016; Zaepffel et al., 2013). Toour knowledge only one study has successfully extracted features thatcarry information about imagined force from scalp EEG (Fu et al.,2014). Feature extraction was based only on low-pass filtered dataand the contribution of beta or gamma activity was not examined.
Our findings suggest that the combination of gamma-beta is bettersuited for distinguishing different force intentions than either band inisolation for both real and imagined actions (see also Tan et al., 2013).Our results also indicate that force levels can be differentiated best inthe early phase of movement imagination, raising the possibility thatSTN signals during imagined or fictive gripping of different strengthscould potentially provide a relatively fast and dynamic substrate forthe control of neuroprostheses, and in particular communication de-vices, in patients who otherwise cannot move. The only successful ap-proach for communicating with completely locked-in patients to dateused functional near infrared spectroscopy to measure hemodynamicchanges over sensorimotor and temporal or frontocentral cortex(Chaudhary et al., 2017, 2016; Gallegos-Ayala et al., 2014). However,this communication technique would still benefit from improveddecoding accuracy and speed as it depends on relatively slow changesin oxygenation levels.
Another potential, related application is to combine neuro-feedbackand motor imagery to help improve motor symptoms in Parkinson'sdisease (Subramanian et al., 2011). To this end it would be interestingto explore if gamma and/or beta modulation can be intentionally en-hanced by repeated practice of mental imagery with concurrentfeedback. Importantly, the improvement in motor symptoms inParkinson's disease after levodopa administration has been linked to adecrease in beta and an increase in gamma activity at the level of thebasal ganglia (Brown et al., 2001;Williams et al., 2002). Improvedmod-ulation of these oscillations through combined motor imagery andneuro-feedback training might thus facilitate symptom improvement,which has been reported after combinedmotor andmental imagery ex-ercises in patients with Parkinson's disease (Ajimsha et al., 2014; Tamiret al., 2007).
Taken together, beta and gamma modulation in the STN may helpencode motor effort rather than executed force per se. Moreover, thisstudy suggests that spectral changes in STN activity are not dependenton peripheral feedback, opening up the possibility that STN LFP signalsmight provide a substrate for effort and hence force decoding in the con-trol of neuroprosthetic devices. Finally, the very fact that STN activity ismodulated during motor imagery helps motivate further studies of thelatter as adjunctive therapy in the physical rehabilitation of Parkinson'sdisease (Ajimsha et al., 2014; Tamir et al., 2007; Abbruzzese et al., 2015)and of the use of signals from the STN as a basis for neurofeedbacktraining.
Author contributions
PF, AP, PB and HT designed the study. BC, ALG, TZA, JH, SL, TF, PL, LZ,MH, MS and KA performed DBS surgeries and helped with patient re-cruitment. PF and HT acquired the data. PF analysed the data under su-pervision of PB and HT. BC assessed anatomical electrode locations. Allauthors contributed in writing and revising the paper.
Competing financial interests
BC has received travel support and unrestricted educational grantsfor organising CPD events from Medtronic, St. Jude Medical and BostonScientific (manufacturers of DBS electrodes). TA has performed consul-tancy for and received speaking fees from Medtronic. SL has been aparticipant in a DBS teaching course funded byMedtronic, themanufac-turer of the electrodes used in this study. TF, PL and LZ have receivedspeaking fees and travel support from Medtronic and St. Jude Medical.PB has received fees and non-financial support from Medtronic andpersonal fees from Boston Scientific.
Acknowledgements
This work was supported by the Medical Research Council[MC_UU_12024/1], and PF was funded by a Clarendon Scholarship andSt. John's Colleege Award. SL was funded by clinical research traininggrants from theWellcomeTrust [105804/Z/14/Z]. TheUnit of FunctionalNeurosurgery is supported by the Parkinson Appeal UK, and the Monu-ment Trust. The funding bodies played no role in the study design, in thecollection, analysis and interpretation of data, in the writing of the re-port, and in the decision to submit the article for publication.
References
Abbruzzese, G., Avanzino, L., Marchese, R., Pelosin, E., 2015. Action observation and motorimagery: innovative cognitive tools in the rehabilitation of Parkinson's disease.Parkinsons. Dis. 2015. http://dx.doi.org/10.1155/2015/124214.
Ajimsha, M.S., Majeed, N.A., Chinnavan, E., Thulasyammal, R.P., 2014. Effectiveness of au-togenic training in improving motor performances in Parkinson's disease. Comple-ment. Ther. Med. 22:419–425. http://dx.doi.org/10.1016/j.ctim.2014.03.013.
Alegre, M., Rodríguez-Oroz, M.C., Valencia, M., Pérez-Alcázar, M., Guridi, J., Iriarte, J.,Obeso, J.A., Artieda, J., 2010. Changes in subthalamic activity duringmovement obser-vation in Parkinson's disease: is themirror systemmirrored in the basal ganglia? Clin.Neurophysiol. 121:414–425. http://dx.doi.org/10.1016/j.clinph.2009.11.013.
Avanzino, L., Giannini, A., Tacchino, A., Pelosin, E., Ruggeri, P., Bove, M., 2009. Motor imag-ery influences the execution of repetitive finger opposition movements. Neurosci.Lett. 466:11–15. http://dx.doi.org/10.1016/j.neulet.2009.09.036.
Avanzino, L., Pelosin, E., Martino, D., Abbruzzese, G., 2013. Motor timing deficits in se-quential movements in Parkinson's disease are related to action planning: a motorimagery study. PLoS One 8:1–9. http://dx.doi.org/10.1371/journal.pone.0075454.
Brown, P., Oliviero, A., Mazzone, P., Insola, A., Tonali, P., Di Lazzaro, V., 2001. Dopamine de-pendency of oscillations between subthalamic nucleus and pallidum in Parkinson'sdisease. J. Neurosci. 21, 1033–1038 (doi:21/3/1033, pii).
Chaudhary, U., Birbaumer, N., Ramos-Murguialday, A., 2016. Brain–computer interfacesfor communication and rehabilitation. Nat. Rev. Neurol. 12:513–525. http://dx.doi.org/10.1038/nrneurol.2016.113.
Chaudhary, U., Xia, B., Silvoni, S., Cohen, L.G., Birbaumer, N., 2017. Brain Computer Inter-face Based Communication in the Completely Locked-In State. PLoS Biol. 15:1–25.http://dx.doi.org/10.1371/journal.pbio.1002593.
Conson, M., Trojano, L., Vitale, C., Mazzarella, E., Allocca, R., Barone, P., Grossi, D.,Santangelo, G., 2014. The role of embodied simulation in mental transformation ofwhole-body images: evidence from Parkinson's disease. Hum. Mov. Sci. 33:343–353. http://dx.doi.org/10.1016/j.humov.2013.10.006.
Cunnington, R., Egan, G.F., O'Sullivan, J.D., Hughes, A.J., Bradshaw, J.L., Colebatch, J.G., 2001.Motor imagery in Parkinson's disease: a PET study. Mov. Disord. 16:849–857.http://dx.doi.org/10.1002/mds.1181.
Fu, Y., Xu, B., Li, Y., Wang, Y., Yu, Z., Li, H., 2014. Single-trial decoding of imagined grip forceparameters involving the right or left hand based onmovement-related cortical poten-tials. Chin. Sci. Bull. 59:1907–1916. http://dx.doi.org/10.1007/s11434-014-0234-5.
Gallegos-Ayala, G., Furdea, A., Takano, K., Ruf, C.A., Flor, H., Birbaumer, N., 2014. Braincommunication in a completely locked-in patient using bedside near-infrared spec-troscopy. Neurology 82, 1930–1932.
Gerardin, E., Sirigu, A., Lehéricy, S., Poline, J.B., Gaymard, B., Marsault, C., Agid, Y., Le Bihan,D., 2000. Partially overlapping neural networks for real and imagined hand move-ments. Cereb. Cortex 10:1093–1104. http://dx.doi.org/10.1093/cercor/10.11.1093.
Helm, F., Marinovic, W., Krüger, B., Munzert, J., Riek, S., 2015. Corticospinal excitabilityduring imagined and observed dynamic force production tasks: Effortfulness matters.Neuroscience 290:398–405. http://dx.doi.org/10.1016/j.neuroscience.2015.01.050.
Helmich, R.C., de Lange, F.P., Bloem, B.R., Toni, I., 2007. Cerebral compensationduring motor imagery in Parkinson's disease. Neuropsychologia 45:2201–2215.http://dx.doi.org/10.1016/j.neuropsychologia.2007.02.024.
Jeannerod, M., 2001. Neural simulation of action: a unifying mechanism for motor cogni-tion. NeuroImage 14:S103–S109. http://dx.doi.org/10.1006/nimg.2001.0832.
Kühn, A.A., Doyle, L., Pogosyan, A., Yarrow, K., Kupsch, A., Schneider, G., Hariz, M.I.,Trottenberg, T., Brown, P., 2006. Modulation of beta oscillations in the subthalamicarea during motor imagery in Parkinson's disease. Brain 129:695–706. http://dx.doi.org/10.1093/brain/awh715.
Levy, R., Ashby, P., Hutchison,W.D., Lang, A.E., Lozano, A.M., Dostrovsky, J.O., 2002. Depen-dence of subthalamic nucleus oscillations onmovement and dopamine in Parkinson'sdisease. Brain 125:1196–1209. http://dx.doi.org/10.1093/brain/awf128.
Liao, K., Xiao, R., Gonzalez, J., Ding, L., 2014. Decoding individual finger movements fromone hand using human EEG signals. PLoS One 9:1–12. http://dx.doi.org/10.1371/journal.pone.0085192.
Maillet, A., Thobois, S., Fraix, V., Redouté, J., Le Bars, D., Lavenne, F., Derost, P., Durif, F.,Bloem, B.R., Krack, P., Pollak, P., Debû, B., 2015. Neural substrates of levodopa-respon-sive gait disorders and freezing in advanced Parkinson's disease: a kinesthetic imag-ery approach. Hum. Brain Mapp. 36:959–980. http://dx.doi.org/10.1002/hbm.22679.
Marceglia, S., Fiorio, M., Foffani, G., Mrakic-Sposta, S., Tiriticco, M., Locatelli, M., Caputo, E.,Tinazzi, M., Priori, A., 2009. Modulation of beta oscillations in the subthalamic areaduring action observation in Parkinson's disease. Neuroscience 161:1027–1036.http://dx.doi.org/10.1016/j.neuroscience.2009.04.018.
Murphy, B.A., Miller, J.P., Gunalan, K., Ajiboye, A.B., 2016. Contributions of subsurface cor-tical modulations to discrimination of executed and imagined grasp forces through

61P. Fischer et al. / Experimental Neurology 293 (2017) 53–61
stereoelectroencephalography. PLoS One 11, e0150359. http://dx.doi.org/10.1371/journal.pone.0150359.
Oostenveld, R., Fries, P., Maris, E., Schoffelen, J.M., 2011. FieldTrip: open source softwarefor advanced analysis of MEG, EEG, and invasive electrophysiological data. Comput.Intell. Neurosci. 2011. http://dx.doi.org/10.1155/2011/156869.
Papaxanthis, C., Pozzo, T., Skoura, X., Schieppati, M., 2002. Does order and timing in per-formance of imagined and actual movements affect the motor imagery process? Theduration of walking and writing task. Behav. Brain Res. 134:209–215. http://dx.doi.org/10.1016/S0166-4328(02)00030-X.
Pernet, C.R., Wilcox, R., Rousselet, G.A., 2013. Robust correlation analyses: false positiveand power validation using a new open source matlab toolbox. Front. Psychol. 3.
Peterson, D.S., Pickett, K.A., Earhart, G.M., 2012. Effects of levodopa on vividness of motorimagery in Parkinson disease. J. Parkinsons. Dis. 2:127–133. http://dx.doi.org/10.3233/JPD-2012-12077.
Rienzo, F. Di, Collet, C., Hoyek, N., Guillot, A., 2014. Impact of neurologic deficits on motorimagery: a systematic review of clinical evaluations. Neuropsychol. Rev. 24:116–147.http://dx.doi.org/10.1007/s11065-014-9257-6.
Subramanian, L., Hindle, J.V., Johnston, S., Roberts, M.V., Husain, M., Goebel, R., 2011. Real-time functional magnetic resonance imaging neurofeedback for treatment ofParkinson's disease. Neurobiol. Dis. 31:16309–16317. http://dx.doi.org/10.1523/JNEUROSCI.3498-11.2011.
Tamir, R., Dickstein, R., Huberman, M., 2007. Integration of motor imagery and physicalpractice in group treatment applied to subjects with Parkinson's disease. Neurorehabil.Neural Repair 21:68–75. http://dx.doi.org/10.1177/1545968306292608.
Tan, H., Pogosyan, A., Anzak, A., Ashkan, K., Bogdanovic, M., Green, A.L., Aziz, T., Foltynie,T., Limousin, P., Zrinzo, L., Brown, P., 2013. Complementary roles of different oscilla-tory activities in the subthalamic nucleus in coding motor effort in Parkinsonism.Exp. Neurol. 248:187–195. http://dx.doi.org/10.1016/j.expneurol.2013.06.010.
Tan, H., Pogosyan, A., Ashkan, K., Cheeran, B., Fitzgerald, J.J., Green, A.L., Aziz, T., Foltynie,T., Limousin, P., Zrinzo, L., Brown, P., 2015. Subthalamic nucleus local field potential
activity helps encode motor effort rather than force in parkinsonism. J. Neurosci.35:5941–5949. http://dx.doi.org/10.1523/JNEUROSCI.4609-14.2015.
Thobois, S., Dominey, P.F., Decety, J., Pollak, P., Gregoire, M.C., Bars, D. Le, 2000. Motor im-agery in normal subjects and in asymmetrical Parkinson's disease - a PET study. Neu-rology 55, 996–1002.
Tomlinson, C.L., Stowe, R., Patel, S., Rick, C., Gray, R., Clarke, C.E., 2010. Systematic reviewof levodopa dose equivalency reporting in Parkinson's disease. Mov. Disord. 25:2649–2653. http://dx.doi.org/10.1002/mds.23429.
Tremblay, F., Léonard, G., Tremblay, L., 2008. Corticomotor facilitation associated with ob-servation and imagery of hand actions is impaired in Parkinson's disease. Exp. BrainRes. 185:249–257. http://dx.doi.org/10.1007/s00221-007-1150-6.
Weinberger, M., Mahant, N., Hutchison, W.D., Lozano, A.M., Moro, E., Hodaie, M., Lang,A.E., Dostrovsky, J.O., 2006. Beta oscillatory activity in the subthalamic nucleus andits relation to dopaminergic response in Parkinson's disease. J. Neurophysiol. 96:3248–3256. http://dx.doi.org/10.1152/jn.00697.2006.
Williams, D., Tijssen, M., Van Bruggen, G., Bosch, A., Insola, A., Di Lazzaro, V., Mazzone, P.,Oliviero, A., Quartarone, A., Speelman, H., Brown, P., 2002. Dopamine-dependentchanges in the functional connectivity between basal ganglia and cerebral cortex inhumans. Brain 125:1558–1569. http://dx.doi.org/10.1093/brain/awf156.
Williams, D., Kühn, A., Kupsch, A., Tijssen, M., Van Bruggen, G., Speelman, H., Hotton, G.,Loukas, C., Brown, P., 2005. The relationship between oscillatory activity andmotor reaction time in the parkinsonian subthalamic nucleus. Eur. J. Neurosci. 21,249–258.
Yin, X., Xu, B., Jiang, C., Fu, Y., Wang, Z., Li, H., Shi, G., 2015. A hybrid BCI based on EEG andfNIRS signals improves the performance of decodingmotor imagery of both force andspeed of hand clenching. J. Neural Eng. 12:36004. http://dx.doi.org/10.1088/1741-2560/12/3/036004.
Zaepffel, M., Trachel, R., Kilavik, B.E., Brochier, T., 2013. Modulations of EEG beta powerduring planning and execution of grasping movements. PLoS One 8. http://dx.doi.org/10.1371/journal.pone.0060060.


