SUBSTATION AND ASSOCIATED 400KV … - EIA for Solar Park...SUBSTATION AND ASSOCIATED 400KV...
91
SUBSTATION AND ASSOCIATED 400KV TRANSMISSION AND 132KV DISTRIBUTION LINES FOR A PROPOSED SOLAR PARK AND CSP SITE IN THE NORTHERN CAPE VISUAL IMPACT ASSESSMENT Produced for: ESKOM HOLDINGS (LTD) Produced by: MetroGIS (Pty) Ltd. PO Box 384, La Montagne, 0184 Tel: (012) 349 2884/5 Fax: (012) 349 2880 E-mail: [email protected] Web: www.metrogis.co.za On behalf of: Zitholele Consulting (Pty) Ltd. - October 2012 -
Transcript of SUBSTATION AND ASSOCIATED 400KV … - EIA for Solar Park...SUBSTATION AND ASSOCIATED 400KV...

SUBSTATION AND ASSOCIATED 400KV TRANSMISSION AND
132KV DISTRIBUTION LINES FOR A PROPOSED SOLAR PARK AND CSP SITE IN THE NORTHERN CAPE
VISUAL IMPACT ASSESSMENT
Produced for:
ESKOM HOLDINGS (LTD)
Produced by: MetroGIS (Pty) Ltd.
PO Box 384, La Montagne, 0184 Tel: (012) 349 2884/5 Fax: (012) 349 2880
E-mail: [email protected] Web: www.metrogis.co.za
On behalf of: Zitholele Consulting (Pty) Ltd.
- October 2012 -

1
CONTENTS 1. STUDY APPROACH 1.1. Qualification and Experience of the Practitioner 1.2. Assumptions and Limitations 1.3. Level of Confidence 1.4. Methodology 2. BACKGROUND 3. SCOPE OF WORK 4. RELEVANT LEGISLATION AND GUIDELINES 5. THE AFFECTED ENVIRONMENT 6. RESULTS 6.1 Potential visual exposure 6.2 Visual distance / observer proximity to the facility 6.3. Viewer incidence / viewer perception 6.4. Visual absorption capacity 6.5. Visual impact index 6.6 Visual impact assessment: methodology 6.7 Visual impact assessment: primary impacts 6.8. Visual impact assessment: secondary impacts 6.9. The potential to mitigate visual impacts 7. COMPARATIVE ASSESSMENT OF THE ALTERNATIVES 7.1. Approach 7.2. Comparative Visual Assesment: Aries Corridor Alternatives 7.3. Comparative Visual Assesment: Ferrum Corridor Alternatives 7.4. Comparative Visual Assesment: Niewehoop Corridor Alternatives 8. CONCLUSION / RECOMMENDATIONS 9. IMPACT STATEMENT 10. MANAGEMENT PROGRAMME 11. REFERENCES / DATA SOURCES MAPS Map 1a: Locality and proposed alignment of the Aries Corridor and alternatives. Map 1b: Locality and proposed alignment of the Ferrum Corridor and alternatives. Map 1c: Locality and proposed alignment of the Niewehoop Corridor and
alternatives. Map 2a: Land cover and land use along the Aries Corridor and alternatives. Map 2b: Land cover and land use along the Ferrum Corridor and alternatives. Map 2c: Land cover and land use along the Niewehoop Corridor and alternatives. Map 3a_1: Potential Visual Exposure of the Aries Corridor Alternative A_1. Map 3a_2: Potential Visual Exposure of the Aries Corridor Alternative A_2. Map 3a_3: Potential Visual Exposure of the Aries Corridor Alternative A_3. Map 3b_1: Potential Visual Exposure of the Ferrum Corridor Alternative F_1. Map 3b_2: Potential Visual Exposure of the Ferrum Corridor Alternative F_2.

2
Map 3b_3: Potential Visual Exposure of the Ferrum Corridor Alternative F_3. Map 3b_4: Potential Visual Exposure of the Ferrum Corridor Alternative F_3 Alt. Map 3c_1: Potential Visual Exposure of the Niewehoop Corridor Alternative N_1. Map 3c_2: Potential Visual Exposure of the Niewehoop Corridor Alternative N_2. Map 3c_3: Potential Visual Exposure of the Niewehoop Corridor Alternative N_3. Map 4a: Visual Distance and Observer Proximity to the Aries Corridor Alternatives. Map 4b_1: Visual Distance and Observer Proximity to the Ferrum Corridor Alternatives
(western section). Map 4b_2: Visual Distance and Observer Proximity to the Ferrum Corridor Alternatives
(eastern section). Map 4c: Visual Distance and Observer Proximity to the Niewehoop Corridor
Alternatives. Map 5a: Visual Impact Index of the Aries Corridor Alternatives. Map 5b_1: Visual Impact Index of the Ferrum Corridor Alternatives (western section). Map 5b_2: Visual Impact Index of the Ferrum Corridor Alternatives (eastern section). Map 5c: Visual Impact Index of the Niewehoop Corridor Alternatives. TABLES Table 1: Level of confidence. Table 2a: Impact table summarising the significance of visual impacts on users of
national, arterial and secondary roads in close proximity to the infrastructure: Aries Corridor
Table 2b: Impact table summarising the significance of visual impacts on users of national, arterial and secondary roads in close proximity to the infrastructure: Ferrum Corridor
Table 2c: Impact table summarising the significance of visual impacts on users of national, arterial and secondary roads in close proximity to the infrastructure: Niewehoop Corridor
Table 3a: Impact table summarising the significance of visual impacts on residents of built up areas and towns in close proximity to the proposed infrastructure: Aries Corridor
Table 3b: Impact table summarising the significance of visual impacts on residents of built up areas and towns in close proximity to the proposed infrastructure: Ferrum Corridor
Table 3c: Impact table summarising the significance of visual impacts on residents of built up areas and towns in close proximity to the proposed infrastructure: Niewehoop Corridor
Table 4a: Impact table summarising the significance of visual impacts on residents of farmsteads and settlements in close proximity to the proposed infrastructure: Aries Corridor
Table 4b: Impact table summarising the significance of visual impacts on residents of farmsteads and settlements in close proximity to the proposed infrastructure: Ferrum Corridor
Table 4c: Impact table summarising the significance of visual impacts on residents of farmsteads and settlements in close proximity to the proposed infrastructure: Niewehoop Corridor
Table 5a: Impact table summarising the significance of visual impacts on sensitive visual receptors within the region: Aries Corridor
Table 5b: Impact table summarising the significance of visual impacts on sensitive visual receptors within the region: Ferrum Corridor
Table 5c: Impact table summarising the significance of visual impacts on sensitive visual receptors within the region: Niewehoop Corridor
Table 6a: Impact table summarising the significance of visual impacts on conservation areas within the region: Aries Corridor

3
Table 6b: Impact table summarising the significance of visual impacts on conservation areas within the region: Furrum Corridor
Table 6c: Impact table summarising the significance of visual impacts on conservation areas within the region: Niewehoop Corridor
Table 7a: Impact table summarising the significance of visual impact of associated infrastructure on sensitive visual receptors in close proximity thereto: Aries Corridor
Table 7b: Impact table summarising the significance of visual impact of associated infrastructure on sensitive visual receptors in close proximity thereto: Ferrum Corridor
Table 7c: Impact table summarising the significance of visual impact of associated infrastructure on sensitive visual receptors in close proximity thereto: Niewehoop Corridor
Table 8a: Impact table summarising the significance of visual impact of construction on visual receptors in close proximity to the proposed infrastructure: Aries Corridor
Table 8b: Impact table summarising the significance of visual impact of construction on visual receptors in close proximity to the proposed infrastructure: Ferrum Corridor
Table 8c: Impact table summarising the significance of visual impact of construction on visual receptors in close proximity to the proposed infrastructure: Niewehoop Corridor
Table 9a: Impact table summarising the significance of visual impacts on scenic and visually sensitive topographic features within the region: Aries Corridor
Table 9b: Impact table summarising the significance of visual impacts on scenic and visually sensitive topographic features within the region: Ferrum Corridor
Table 9c: Impact table summarising the significance of visual impacts on scenic and visually sensitive topographic features within the region: Niewehoop Corridor
Table 10a: Impact table summarising the significance of visual impacts on tourist access routes and tourist destinations within the region: Aries Corridor
Table 10b: Impact table summarising the significance of visual impacts on tourist access routes and tourist destinations within the region: Ferrum Corridor
Table 10c: Impact table summarising the significance of visual impacts on tourist access routes and tourist destinations within the region: Niewehoop Corridor
Table 11a: Comparative visual assessment of the Aries Corridor Alternatives Table 11b: Comparative visual assessment of the Ferrum Corridor Alternatives Table 11c: Comparative visual assessment of the Niewehoop Corridor Alternatives Table 12: Management Programme: Planning. Table 13: Management Programme: Construction. Table 14: Management Programme: Operation. Table 15: Management Programme: Decommissioning.

1
1. STUDY APPROACH 1.1. Qualification and Experience of the Practitioner MetroGIS (Pty) Ltd, specialising in visual assessment and Geographic Information Systems, undertook this visual assessment in collaboration with Nu Leaf Planning and Environmental (Pty) Ltd. Lourens du Plessis, the lead practitioner undertaking the assessment, has been involved in the application of Geographical Information Systems (GIS) in Environmental Planning and Management since 1990. The team undertaking the visual assessment has extensive practical knowledge in spatial analysis, environmental modeling and digital mapping, and applies this knowledge in various scientific fields and disciplines. The expertise of these practitioners is often utilised in Environmental Impact Assessments, State of the Environment Reports and Environmental Management Plans. The visual assessment team is familiar with the "Guidelines for Involving Visual and Aesthetic Specialists in EIA Processes" (Provincial Government of the Western Cape: Department of Environmental Affairs and Development Planning) and utilises the principles and recommendations stated therein to successfully undertake visual impact assessments. Although the guidelines have been developed with specific reference to the Western Cape Province of South Africa, the core elements are more widely applicable. Zitholele Consulting (Pty) Ltd appointed MetroGIS (Pty) Ltd as an independent specialist consultant to undertake the visual impact assessment for a Substation and associated 400kv Transmission and 132kv Distribution lines for a proposed Solar Park and CSP site in the Northern Cape. Neither the author, MetroGIS or Nu Leaf Planning and Environmental will benefit from the outcome of the project decision-making. 1.2. Assumptions and Limitations This assessment was undertaken during the planning stage of the project and is based on information available at that time. 1.3. Level of Confidence Level of confidence1 is determined as a function of:
• The information available, and understanding of the study area by the practitioner:
3: A high level of information is available of the study area and a
thorough knowledge base could be established during site visits, surveys etc. The study area was readily accessible.
2: A moderate level of information is available of the study area and a moderate knowledge base could be established during site visits, surveys etc. Accessibility to the study area was acceptable for the level of assessment.
1 Adapted from Oberholzer (2005).

2
1: Limited information is available of the study area and a poor knowledge base could be established during site visits and/or surveys, or no site visit and/or surveys were carried out.
• The information available, understanding of the project and experience of this
type of project by the practitioner:
3: A high level of information and knowledge is available of the project and the visual impact assessor is well experienced in this type of project and level of assessment.
2: A moderate level of information and knowledge is available of the project and the visual impact assessor is moderately experienced in this type of project and level of assessment.
1: Limited information and knowledge is available of the project and the visual impact assessor has a low experience level in this type of project and level of assessment.
These values are applied as follows: Table 1: Level of confidence. Information on the project & experience of the
practitioner Information on the study area
3 2 1 3 9 6 3 2 6 4 2 1 3 2 1
The level of confidence for this assessment is determined to be 6 and indicates that the author’s confidence in the accuracy of the findings is moderate to high:
• The information available, and understanding of the study area by the practitioner is rated as 2 and
• The information available, understanding and experience of this type of project by the practitioner is rated as 3.
1.4. Methodology The study was undertaken using Geographic Information Systems (GIS) technology as a tool to generate viewshed analyses and to apply relevant spatial criteria to the proposed facility. A detailed Digital Terrain Model (DTM) for the study area was created from 20m interval contours supplied by the Chief Directorate National Geo-Spatial Information. The approach utilised to identify potential issues related to the visual impact included the following activities:
• The creation of a detailed digital terrain model (DTM) of the potentially affected environment;
• The sourcing of relevant spatial data. This included cadastral features, vegetation types, land use activities, topographical features, site placement, etc;
• The identification of sensitive environments upon which the proposed facility could have a potential impact;
• The creation of viewshed analyses from the proposed development area in order to determine the visual exposure and the topography's potential to absorb the potential visual impact. The viewshed analyses take into account the dimensions of the proposed structures.

3
This report (visual impact assessment) sets out to identify and quantify the possible visual impacts related to the proposed facility, including related infrastructure, as well as offer potential mitigation measures, where required. The following methodology has been followed for the assessment of visual impact:
• Determine Potential visual exposure The visibility or visual exposure of any structure or infrastructure is the point of departure for the visual impact assessment. It stands to reason that if the proposed infrastructure were not visible, no impact would occur. Viewshed analyses of the proposed infrastructure indicate the potential visibility.
• Determine Visual Distance/Observer Proximity to the facility In order to refine the visual exposure of the infrastructure on surrounding areas/receptors, the principle of reduced impact over distance is applied in order to determine the core area of visual influence. Proximity radii for the proposed alignment corridors are created in order to indicate the scale and viewing distance of the infrastructure and to determine the prominence thereof in relation to their environment. The visual distance theory and the observer's proximity to the infrastructure are closely related, and especially relevant, when considered from areas with a high viewer incidence and a predominantly negative visual perception of the proposed infrastructure.
• Determine Viewer Incidence/Viewer Perception The number of observers and their perception of a structure determine the concept of visual impact. If there are no observers, then there would be no visual impact. If the visual perception of a structure is favourable to all observers, then the visual impact would be positive. It is therefore necessary to identify areas of high viewer incidence and to classify certain areas according to the observer's visual sensitivity towards the proposed facility and its related infrastructure. It would be impossible not to generalise the viewer incidence and sensitivity to some degree, as there are many variables when trying to determine the perception of the observer; regularity of sighting, cultural background, state of mind, and purpose of sighting which would create a myriad of options.
• Determine the Visual Absorption Capacity of the natural vegetation This is the capacity of the receiving environment to absorb the potential visual impact of the proposed infrastructure. The VAC is primarily a function of the vegetation, and will be high if the vegetation is tall, dense and continuous. Conversely, low growing sparse and patchy vegetation will have a low VAC. The VAC would also be high where the environment can readily absorb the structure in terms of texture, colour, form and light / shade characteristics of the structure. On the other hand, the VAC for a structure contrasting markedly with one or more of the characteristics of the environment would be low.

4
The VAC also generally increases with distance, where discernible detail in visual characteristics of both environment and structure decreases. The digital terrain model utilised in the calculation of the visual exposure of the facility does not incorporate the potential visual absorption capacity (VAC) of the natural vegetation of the region. It is therefore necessary to determine the VAC by means of the interpretation of the vegetation cover and other landscape characteristics.
• Determine the Visual impact index The results of the above analyses are merged in order to determine where the areas of likely visual impact would occur. These areas are further analysed in terms of the previously mentioned issues (related to the visual impact) and in order to judge the magnitude of each impact.
• Determine Impact significance The potential visual impacts identified and described are quantified in their respective geographical locations in order to determine the significance of the anticipated impact. Significance is determined as a function of extent, duration, magnitude and probability.
2. BACKGROUND Eskom Holdings Limited is proposing the establishment of electrical infrastructure to support the development of a Solar Park and CSP site located approximately 15km south west of Upington. The primary infrastructure includes three 400kV Transmission Lines (with an assumed corridor width of 2km) and associated feeder bays. Each of the three Transmission Lines have a number of alternative corridor alignments, as follows:
• The Aries Corridor links the Solar Park to the 400kV Aries Substation located approximately 110 km to the south west of Upington, near Kenhardt. Three alternative corridors are being considered (refer also to Map 1a):
o Corridor A_1 is the western most alignment, and runs in a slightly north north westerly direction from the Aries Substation. Once the corridor has crossed the Orange River and the N14, it swings to the north east to link with the new substation at the Solar Park. This corridor is approximately 131km in length.
o Corridor A_2, which is the central alignment, runs due north from the Aries Substation, until it reaches the Orange River and the N14, whereafter it banks to the north east to link with the new substation at the Solar Park. This corridor is approximately 121km in length.
o Corridor A_3 is the eastern most alignment, and runs in a slightly north north easterly direction from the Aries Substation. Once the corridor has crossed the Orange River and the N14, it swings to the north east to link with the new substation at the Solar Park. This corridor is approximately 114km in length.
• The Ferrum Corridor links the Solar Park to the 400kV Ferrum Substation located
approximately 210 km to the north east of Upington, near Kathu. Four alternative corridors are being considered (refer also to Map 1b):

5
o Corridor F_1 is the central alignment, and runs in a south westerly direction from the Ferrum Substation. Close to Upington, the alignment banks to the west, south west and south east, curving around the north west of the city before linking with the new substation at the Solar Park. This corridor is approximately 252km in length.
o Corridor F_2 is the northern most alignment, and runs in a westerly direction from the Ferrum Substation before turning to the south west. Just beyond Upington, the alignment banks to the south east to link with the new substation at the Solar Park. This corridor is approximately 248km in length.
o Corridor F_3 also runs in a westerly direction from the Ferrum Substation before turning sharply to the south, and then to the west at the N14. The alignment follows the road for a distance, before it banks to the north west, west, south west and south east, curving around the north west of Upington before linking with the new substation at the Solar Park. This corridor is approximately 282km in length.
o Corridor F_3 Alt follows the central alignment in a south westerly direction from the Ferrum Substation, but then turns sharply to the south. At the N14, the alignment turns to the south west, and follows the same alignment at Corridor F_3 to the new substation at the Solar Park. This corridor is approximately 270km in length.
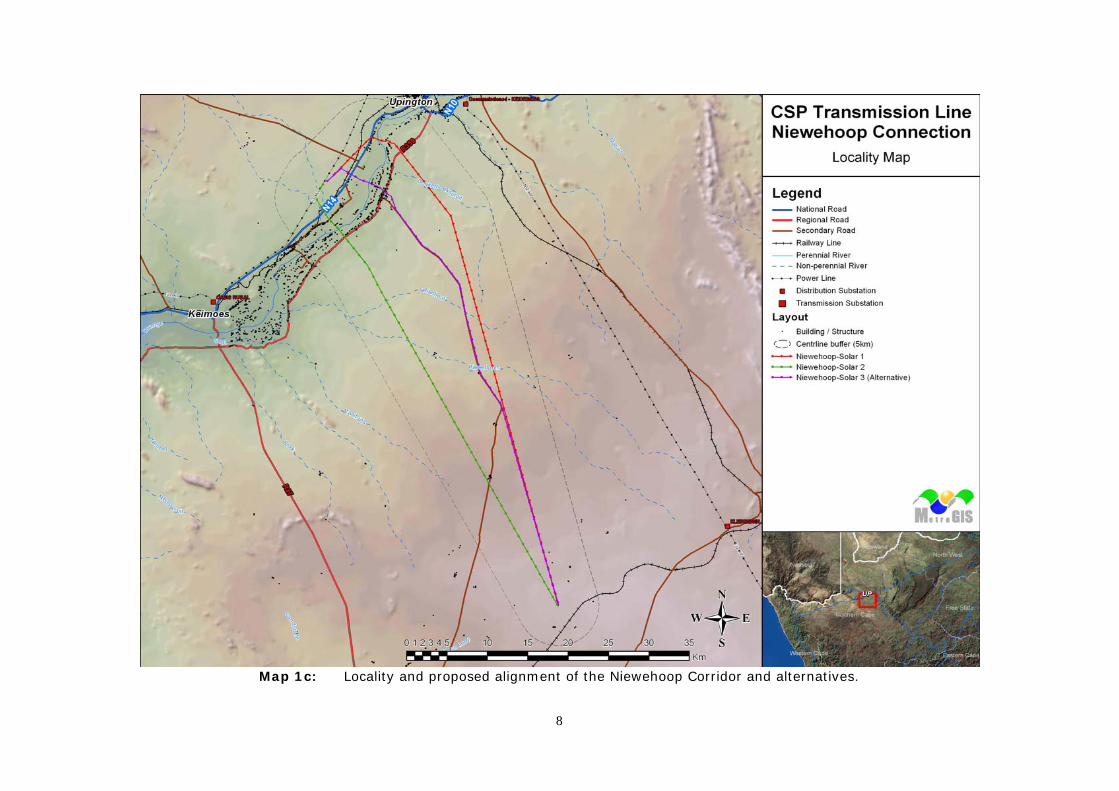
• The Niewehoop Corridor links the Solar Park to the 400kV Niewehoop Substation
located approximately 70 km to the south east of Upington. Three alternative corridors are being considered (refer also to Map 1c):
o Corridor N_1 is the eastern alignment, and runs in a north north
westerly direction from the Niewehoop Substation. Before reaching the R359, the line banks to the north west, and then to the west and south west, crossing over both the Orange River and the N14 before linking with the new substation at the Solar Park. This corridor is approximately 73km in length.
o Corridor N_2 is the western alignment, and runs in a north westerly direction from the Niewehoop Substation. After crossing over the Orange River and the N14, the line makes a sharp turn to the north east to link with the new substation at the Solar Park. This corridor is approximately 63km in length.
o Corridor N_3 is the central alignement and also runs in a north westerly direction from the Ferrum Substation. After about 20km the line intersects with a secondary road, which ultimately joins with the R359. This corridor alternative follows this road for some distance before banking to the north west and crossing over the Orange River and the N14. The alignment then banks to the south west before linking with the new substation at the Solar Park. This corridor is approximately 67km in length.
Additional infrastructure includes the following:
• The construction of a 400kV and 132kV Tx substation at the CSP site; • The construction of five 500MVA 400/132kV transformers and associated
switchgear at the Solar Park site; • The upgrade of substations along the Transmission Line corridors and • The phased construction of a number of 132kV distribution lines, including:
o Three 132kV lines for the IPP’s around Solar Park; o Three 132kV lines and two 20MVA Transformers at the CSP site o Five 132kV lines for the DoE Solar Park; o Five 132kV lines to the Gordonia Substation (measuring approx. 25km).

6
Map 1a: Locality and proposed alignment of the Aries Corridor and alternatives.

7
Map 1b: Locality and proposed alignment of the Ferrum Corridor and alternatives.
8
Map 1c: Locality and proposed alignment of the Niewehoop Corridor and alternatives.

9
3. SCOPE OF WORK The study area for the visual assessment encompasses a total geographical area of approximately 285 km x 240 km. Each Transmission line corridor, however, has been addresed in terms of its own receiving environment. The size of each sub-study area depends on the length of the relevant corridor, and includes a minimum 5km buffer (i.e. extending 5km on either side of each of Transmission line). Refer to Maps 1a, b and c in this regard. The scope of work for this assessment includes the determination of the potential visual impacts in terms of nature, extent, duration, magnitude, probability and significance of the construction and operation of the three proposed Transmission Line Corridors (i.e. Aries, Ferrum and Niewehoop), and the alternatives identified for each. Mitigation measures are recommended where appropriate. In addition, the scope includes a comparative assessment of all alternatives, and a recommendation of a preferred alternative for each corridor from a visual perspective. Issues related to the three proposed Transmission Lines include the following:
• The visibility of the Transmission Lines to, and potential visual impact on, users of national roads (N14, N10), arterial roads (R359, R27, R380, R325) and secondary roads.
• The visibility of the Transmission Lines to, and potential visual impact on residents of built-up centres and populated places (i.e. the towns of Upington, Keimoes, Kakamas, Dibeng, Kathu, Sishen, Olifantshoek).
• The visibility of the Transmission Lines to, and potential visual impact on farmsteads and settlements.
• The visibility of the Transmission Lines to, and potential visual impact on protected and conservation areas (i.e. the Augrabies National Park and the Spitskop Nature Reserve)2.
• The visibility of the Transmission Lines to, and potential visual impact on scenic and visually sensitive topographical features (i.e. rivers and mountains).
• The potential impact of the Transmission Lines on the visual character and sense of place of the region and of the scenic Northern Cape3.
• The potential impact of the Transmission Lines on tourism, with specific reference to tourist access routes (i.e. the N14, N10, R27, R360, R325 and R359) and tourist destinations (i.e. attractions and accommodation).
• The potential visual impact of associated infrastructure (i.e. distribution lines, substations, transformers, switchgear, access roads and cleared servitudes) on sensitive visual receptors.
• Potential cumulative visual impacts. • Potential visual impacts associated with the construction phase. • The potential to mitigate visual impacts and inform the design process.
2 These Provincial and National conservation areas have been sourced from the SANBI database. Additional conservation initiatives, such as Private Nature Reserves, Conservancies and Game Farms are likely to exist within the study area, but as the locations of these are not known at this stage, the visual impact on them cannot be determined. These assessments may be undertaken at a later stage of the EIA process, once a site visit has been undertaken, and more information has been forthcoming from the public participation process. 3 As this is a desktop study, no site visit has been undertaken. In this respect, the visual character and sense of place of the region cannot be assessed. These assessments may be undertaken at a later stage of the EIA process, following a site visit.

10
4. RELEVANT LEGISLATION AND GUIDELINES The following legislation and guidelines have been considered in the preparation of this report:
• The Environmental Impact Assessment Amendment Regulations, 2010; • Guideline on Generic Terms of Reference for EAPS and Project Schedules
(DEADP, Provincial Government of the Western Cape, 2011). 5. THE AFFECTED ENVIRONMENT Regionally, the study area is located in the centre of the Northern Cape Province. The elevation of the region ranges from about 650m a.s.l. along the Orange River to 1200m a.s.l. in the Koranaberg Mountains west of Kathu. The terrain north of Upington is generally described as Dune hills (parallel crests) and lowlands. To the south are mostly Lowlands with hills with Extremely irregular plans and Slightly irregular plains to the south west and south east respectively. Hills are to be found east of Upington and west of Kathu. The Orange River is the most prominent hydrological feature in the area, meandering generally from the east of the study area to the west. A large number of non-perennial drainage lines are present within the study area, all of which drain towards he Orange River. Refer to Maps 1a to c. The river has, to a large degree, dictated the settlement pattern in this arid region by providing a source of perennial water for the cultivation of grapes. This and the associated production of wine is the primary agricultural activity of this district. Cattle and game farming practises also occur, but are less intensive. Other prominent land-use activities include mining, especially in the east, beyond the Koranaberg. Conservation and nature oriented tourism is also known to occur along the Orange River and within the region. Upington is the largest urban centre in the study area. Smaller towns include Augrabies, Marchland, Kakmas, Keimoes, Groblershoop, Hotazel, Dibeng, Kathu, Sishen, Olifantshoek, Lohatlha, beeshoek and Posmasburg. In addition, a large number of farms and homesteads also occur within the study area, especially along the Orange River, and east of the Koranaberg. The above mentioned towns account for the highest population concentration within the region, which is sparsely populated (less than 10 people per km2). Industrial infrastructure includes existing power lines which follow the river and main roads to some extent, as well as a number of substations. The N10, N14 and a number of regional arterial roads traverse the area, as does a railway line (mostly freight). In addition, a number of secondary roads interconnect within the region. Land cover is mostly Shrubland and Thicket to the south of the Orange River, and Thicket, interspersed with Shrubland and Woodland characterises the region to the north. Cultivated land (irrigated agriculture) is common along the Orange River, and Mining and quAries occurs in the east, beyond the Koranaberg. Refer to Maps 2a to c.
11
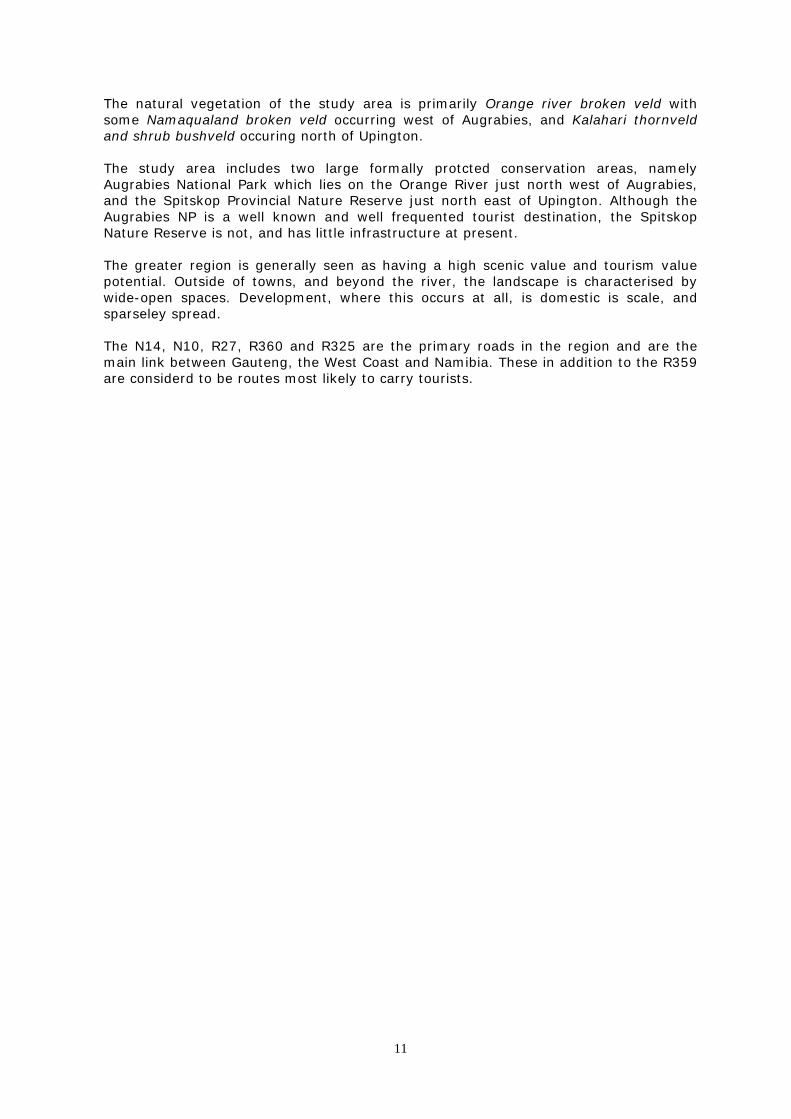
The natural vegetation of the study area is primarily Orange river broken veld with some Namaqualand broken veld occurring west of Augrabies, and Kalahari thornveld and shrub bushveld occuring north of Upington. The study area includes two large formally protcted conservation areas, namely Augrabies National Park which lies on the Orange River just north west of Augrabies, and the Spitskop Provincial Nature Reserve just north east of Upington. Although the Augrabies NP is a well known and well frequented tourist destination, the Spitskop Nature Reserve is not, and has little infrastructure at present. The greater region is generally seen as having a high scenic value and tourism value potential. Outside of towns, and beyond the river, the landscape is characterised by wide-open spaces. Development, where this occurs at all, is domestic is scale, and sparseley spread. The N14, N10, R27, R360 and R325 are the primary roads in the region and are the main link between Gauteng, the West Coast and Namibia. These in addition to the R359 are considerd to be routes most likely to carry tourists.

12
Map 2a: Land cover and land use along the Aries Corridor and alternatives.

13
Map 2b: Land cover and land use along the Ferrum Corridor and alternatives.

14
Map 2c: Land cover and land use along the Niewehoop Corridor and alternatives.

15
6. RESULTS 6.1. Potential visual exposure The visibility analyses for each of the Transmission Line corridors and their alternatives was calculated from the centreline of each corridor, for a distance of 5km on either side at an offset height of 42m above ground level (i.e. the maximum height of a 400kV structures) in order to simulate a worst case scenario. All three corridors and their alternatives will be visually exposed to large areas within their respective 5km offsets. This is due mainly to the relatively tall Transmission Line infrastructure. In addition, all three corridors and their alternatives tend to display an even potential exposure pattern where they traverse flat terrain and more scattered patterns where they encounter elevated and hilly topography. It is envisaged that all three corridors and their alternatives would be easily and comfortably visible to observers (i.e. people travelling along roads, residing in towns and at homesteads or visiting the region), especially within a 5km offset of the corridor in question, and could potentially constitute a high visual prominence, potentially resulting in a visual impact. The following is of specific relevance regarding the proposed corridors and their alternatives: 6.1.1. The Aries Corridor The Aries Corridor links the Solar Park to the 400kV Aries Substation located approximately 110 km to the south west of Upington, near Kenhardt. Three alternative corridors are being considered. 6.1.1.1 Corridor A_1 Refer to Map 3a_1. This Alternative runs alongside an existing power line for a short stretch in the south and for another short stretch just to the north of the N14. The alignment does not follow a road alignment, but short stretches of the R359 and N14 will be visually affected as the line crosses over. Five secondary roads also lie within the zone of potential visual exposure. Additional stretches of the N14 will be affected in the vicinity of the Solar Park. Of note is that the N14 and the R359 are considered to be tourist access routes. The alignment crosses the Orange River and nine non-perennial streams fall within the viewshed. No significant hills or mountains are likely to be visually exposed, but some low hills are affected to the east of Kakamas. No conservation areas lie within the zone of potential visual exposure, nor do any towns or urban areas. The eastern outskirts of Kakamas fall just beyond the zone of potential visual exposure. A low to moderate number of settlements and homesteads, especially along the Orange River and the N14, will be visually affected by the proposed infrastructure. 6.1.1.2 Corridor A_2

16
Refer to Map 3a_2. This Alternative does not follow the alignment of any existing power line, nor any existing road. Short stretches of the R359 and N14 will be visually affected as the line crosses over. Five secondary roads also lie within the zone of potential visual exposure. Additional stretches of the N14 will be affected in the vicinity of the Solar Park. Of note is that the N14 and the R359 are considered to be tourist access routes. The alignment crosses the Orange River and ten non-perennial streams fall within the viewshed. No significant hills or mountains are likely to be visually exposed, but a couple of low hills are affected to the east of Kakamas. No conservation areas lie within the zone of potential visual exposure, nor do any towns or urban areas. The north western outskirts of Keimoes fall just beyond the zone of potential visual exposure. A moderate number of settlements and homesteads, especially along the Orange River and the N14, will be visually affected by the proposed infrastructure. 6.1.1.3 Corridor A_3 Refer to Map 3a_3. This Alternative does not follow the alignment of any existing power line, nor any existing road. Short stretches of the R359, R27 and N14 will be visually affected as the line crosses over. Three secondary roads also lie within the zone of potential visual exposure. Additional, slightly longer stretches of the N14 will be affected in the vicinity of the Solar Park. Of note is that the R359, R27 and N14 are considered to be tourist access routes. The alignment crosses the Orange River and seven non-perennial streams fall within the viewshed. No significant hills or mountains are likely to be visually exposed, nor are any conservation areas. The town of Keimoes falls within the viewshed of this alternative, as do a a moderately high number of settlements and homesteads, especially along the Orange River and the N14. These receptors are likely to be visually affected by the proposed infrastructure.

17
Map 3a_1: Potential Visual Exposure of the Aries Corridor Alternative A_1.

18
Map 3a_2: Potential Visual Exposure of the Aries Corridor Alternative A_2.

19
Map 3a_3: Potential Visual Exposure of the Aries Corridor Alternative A_3.
20
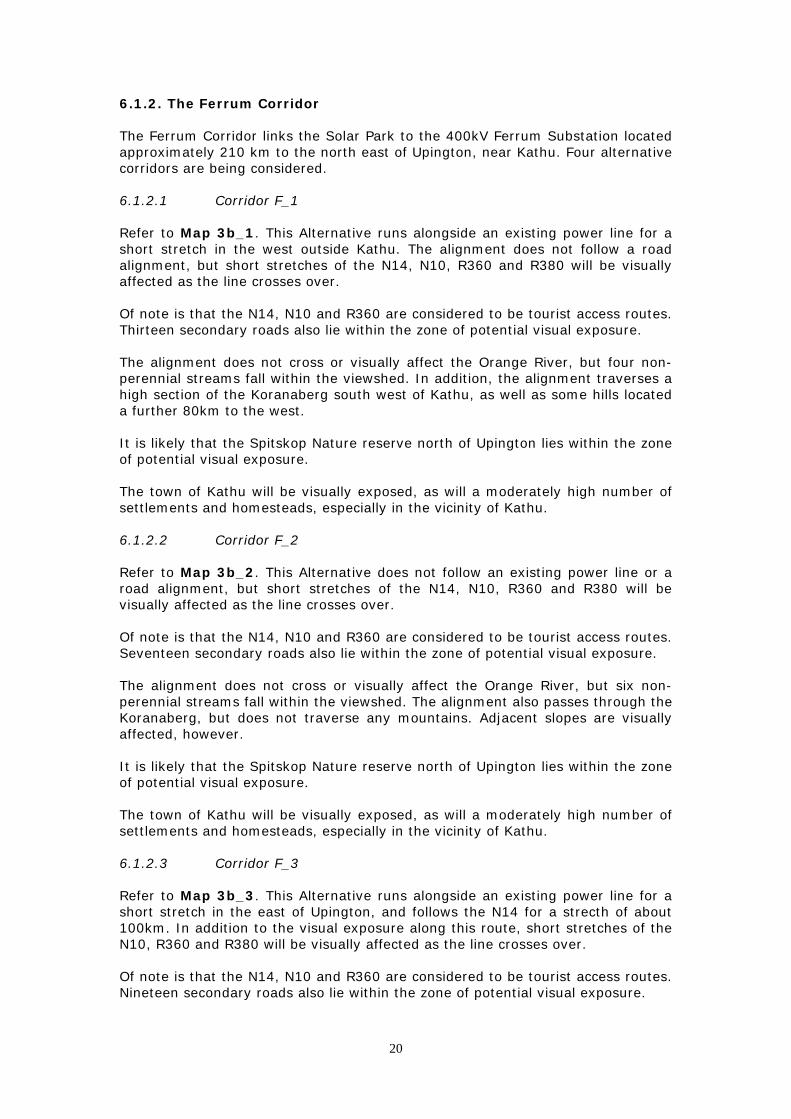
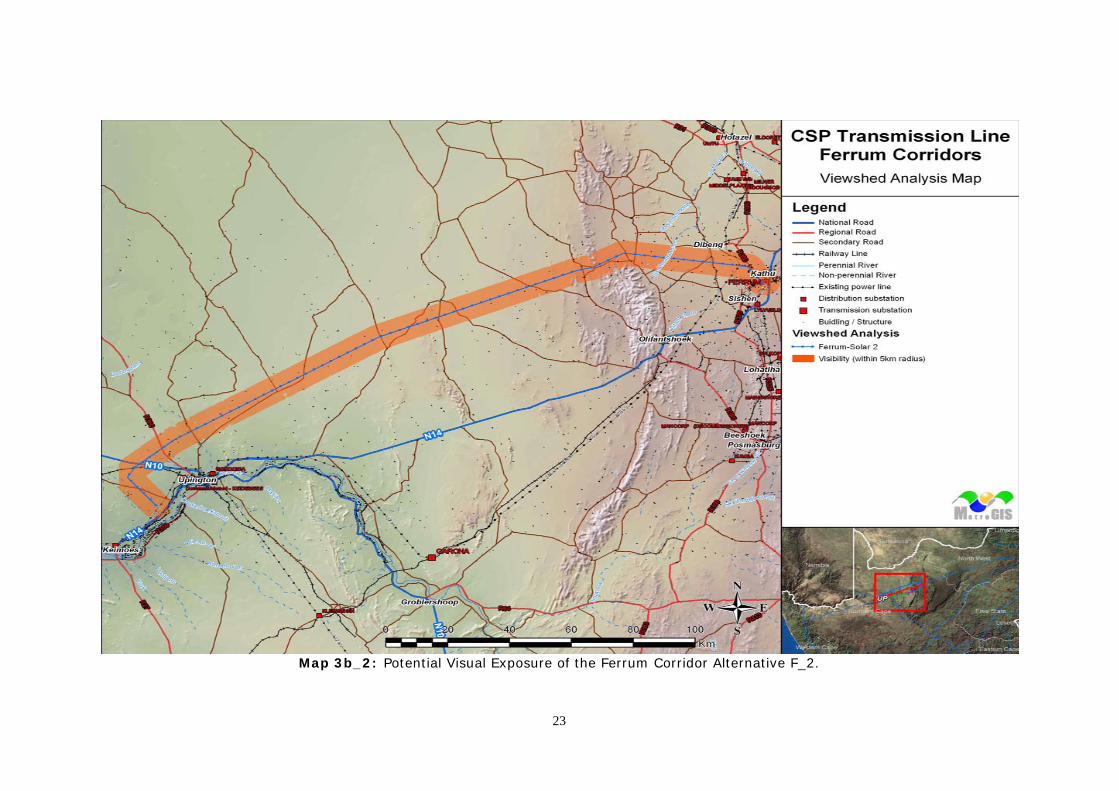
6.1.2. The Ferrum Corridor The Ferrum Corridor links the Solar Park to the 400kV Ferrum Substation located approximately 210 km to the north east of Upington, near Kathu. Four alternative corridors are being considered. 6.1.2.1 Corridor F_1 Refer to Map 3b_1. This Alternative runs alongside an existing power line for a short stretch in the west outside Kathu. The alignment does not follow a road alignment, but short stretches of the N14, N10, R360 and R380 will be visually affected as the line crosses over. Of note is that the N14, N10 and R360 are considered to be tourist access routes. Thirteen secondary roads also lie within the zone of potential visual exposure. The alignment does not cross or visually affect the Orange River, but four non-perennial streams fall within the viewshed. In addition, the alignment traverses a high section of the Koranaberg south west of Kathu, as well as some hills located a further 80km to the west. It is likely that the Spitskop Nature reserve north of Upington lies within the zone of potential visual exposure. The town of Kathu will be visually exposed, as will a moderately high number of settlements and homesteads, especially in the vicinity of Kathu. 6.1.2.2 Corridor F_2 Refer to Map 3b_2. This Alternative does not follow an existing power line or a road alignment, but short stretches of the N14, N10, R360 and R380 will be visually affected as the line crosses over. Of note is that the N14, N10 and R360 are considered to be tourist access routes. Seventeen secondary roads also lie within the zone of potential visual exposure. The alignment does not cross or visually affect the Orange River, but six non-perennial streams fall within the viewshed. The alignment also passes through the Koranaberg, but does not traverse any mountains. Adjacent slopes are visually affected, however. It is likely that the Spitskop Nature reserve north of Upington lies within the zone of potential visual exposure. The town of Kathu will be visually exposed, as will a moderately high number of settlements and homesteads, especially in the vicinity of Kathu. 6.1.2.3 Corridor F_3 Refer to Map 3b_3. This Alternative runs alongside an existing power line for a short stretch in the east of Upington, and follows the N14 for a strecth of about 100km. In addition to the visual exposure along this route, short stretches of the N10, R360 and R380 will be visually affected as the line crosses over. Of note is that the N14, N10 and R360 are considered to be tourist access routes. Nineteen secondary roads also lie within the zone of potential visual exposure.

21
The alignment does not cross over the Orange River, but a short stretch is visually impacted upon to the east of Upington. In addition, six non-perennial streams fall within the viewshed. The alignment also passes through the Koranaberg, but does not traverse any mountains. Adjacent slopes are visually affected, however. It is likely that the Spitskop Nature reserve north of Upington lies within the zone of potential visual exposure. The town of Kathu will be visually exposed, as will a moderately high number of settlements and homesteads, especially in the vicinity of Kathu. 6.1.2.4 Corridor F_3 Alt Refer to Map 3b_4. This Alternative runs alongside an existing power line for a short stretch in the west outside Kathu and to the east of Upington. It also follows the N14 for a strecth of about 140km. In addition to the visual exposure along this route, short stretches of the N10, R360 and R380 will be visually affected as the line crosses over. Of note is that the N14, N10 and R360 are considered to be tourist access routes. Fifteen secondary roads also lie within the zone of potential visual exposure. The alignment does not cross over the Orange River, but a short stretch is visually impacted upon to the east of Upington. In addition, six non-perennial streams fall within the viewshed. In addition, the alignment traverses a high section of the Koranaberg south west of Kathu. It is likely that the Spitskop Nature reserve north of Upington lies within the zone of potential visual exposure. The town of Kathu will be visually exposed, as will a moderately high number of settlements and homesteads, especially in the vicinity of Kathu.

22
Map 3b_1: Potential Visual Exposure of the Ferrum Corridor Alternative F_1.
23
Map 3b_2: Potential Visual Exposure of the Ferrum Corridor Alternative F_2.
24
Map 3b_3: Potential Visual Exposure of the Ferrum Corridor Alternative F_3.

25
Map 3b_4: Potential Visual Exposure of the Ferrum Corridor Alternative F_3 Alt.

26
6.1.3. The Niewehoop Corridor The Niewehoop Corridor links the Solar Park to the 400kV Niewehoop Substation located approximately 70 km to the south east of Upington. Three alternative corridors are being considered. 6.1.3.1 Corridor N_1 Refer to Map 3c_1. This Alternative does not run along an existing power line nor follow a road alignment, but short stretches of the R359 and N14 will be visually affected as the line crosses over. Three secondary roads also lie within the zone of potential visual exposure. Additional stretches of the N14 will be affected in the vicinity of the Solar Park. Of note is that the N14 and the R359 are considered to be tourist access routes. The alignment crosses the Orange River and seven non-perennial streams fall within the viewshed. No significant hills or mountains are likely to be visually exposed. No conservation areas lie within the zone of potential visual exposure, nor do any towns or urban areas. The southern outskirts of Upington fall just beyond the zone of potential visual exposure. A low to moderate number of settlements and homesteads, especially along the Orange River, the N14 and the R359 will be visually affected by the proposed infrastructure. 6.1.3.2 Corridor N_2 Refer to Map 3c_2. This Alternative does not run along an existing power line nor follow a road alignment, but short stretches of the R359 and N14 will be visually affected as the line crosses over. Three secondary roads also lie within the zone of potential visual exposure. Of note is that the N14 and the R359 are considered to be tourist access routes. The alignment crosses the Orange River and five non-perennial streams fall within the viewshed. No significant hills or mountains are likely to be visually exposed. No conservation areas lie within the zone of potential visual exposure, nor do any towns or urban areas. A low to moderate number of settlements and homesteads, especially along the Orange River, the N14 and the R359 will be visually affected by the proposed infrastructure. 6.1.3.3 Corridor N_3 Refer to Map 3c_3. This Alternative does not run along an existing power line, but does follow a secondary road for about 30km. Short stretches of the R359 and N14 will be visually affected as the line crosses over. Three secondary roads also lie within the zone of potential visual exposure. Of note is that the N14 and the R359 are considered to be tourist access routes. The alignment crosses the Orange River and six non-perennial streams fall within the viewshed. No significant hills or mountains are likely to be visually exposed.

27
No conservation areas lie within the zone of potential visual exposure, nor do any towns or urban areas. A low to moderate number of settlements and homesteads, especially along the Orange River, the N14 and the R359 will be visually affected by the proposed infrastructure.

28
Map 3c_1: Potential Visual Exposure of the Niewehoop Corridor Alternative N_1.

29
Map 3c_2: Potential Visual Exposure of the Niewehoop Corridor Alternative N_2.

30
Map 3c_3: Potential Visual Exposure of the Niewehoop Corridor Alternative N_3.

31
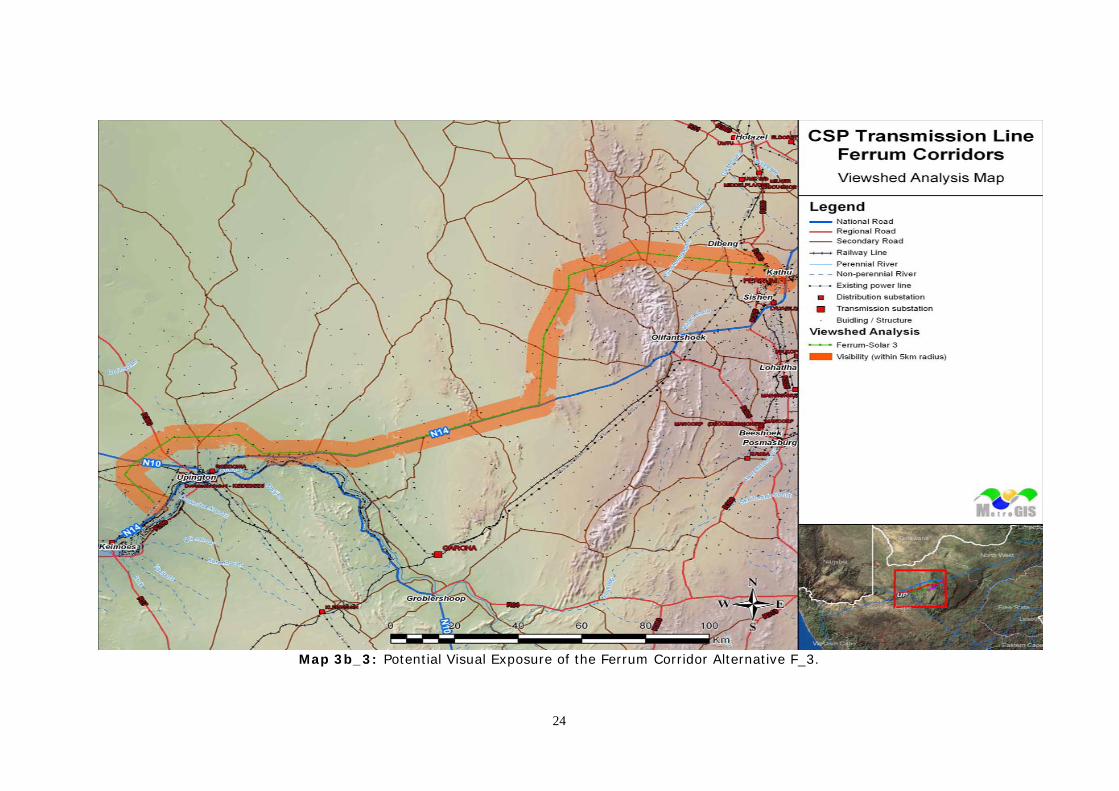
6.2. Visual distance / observer proximity MetroGIS determined proximity offsets based on the anticipated visual experience of the observer over varying distances. The distances are adjusted upwards for larger facilities and downwards for smaller facilities (i.e. depending on the size and nature of the proposed infrastructure). The proximity offsets (calculated from the centre line of each Alignment) are as follows:
• 0 – 500m - Short distance view where the infrastructure would dominate the frame of vision and constitute a very high visual prominence.
• 500 - 1000m - Medium distance views where the infrastructure would be easily and comfortably visible and constitute a high visual prominence.
• 1000 – 2000m - Medium to longer distance view where the infrastructure would become part of the visual environment, but would still be visible and recognisable. This zone constitutes a medium visual prominence.
• Greater than 2000m - Long distance view where the infrastructure would still be visible though not as easily recognisable. This zone constitutes a low visual prominence for the infrastructure.
These offsets have been illustated on the maps that follow:
• Map 4a: Visual Distance and Observer Proximity to the Aries Corridor Alternatives
• Map 4b: Visual Distance and Observer Proximity to the Ferrum Corridor Alternatives
• Map 4c: Visual Distance and Observer Proximity to the Niewehoop Corridor Alternatives
32
Map 4a: Visual Distance and Observer Proximity to the Aries Corridor Alternatives.

33
Map 4b_1: Visual Distance and Observer Proximity to the Ferrum Corridor Alternatives (western section).

34
Map 4b_2: Visual Distance and Observer Proximity to the Ferrum Corridor Alternatives (eastern section).

35
Map 4c: Visual Distance and Observer Proximity to the Niewehoop Corridor Alternatives.

36
6.3. Viewer incidence / viewer perception Viewer incidence is calculated to be the highest along the national and main arterial roads (i.e. the N14, N10, R27, R360, R325) as well other arterial and secondary roads within the study area. Commuters and tourists using these roads may be negatively impacted upon by visual exposure to the proposed power line. Other than along the above roads, viewer incidence is concentrated in the populated places within the study area. These include the major town of Upington and the smaller towns (i.e. Augrabies, Marchland, Kakmas, Keimoes, Groblershoop, Hotazel, Dibeng, Kathu, Sishen, Olifantshoek, Lohatlha, beeshoek and Posmasburg). Despite the populations in these areas, these receptors are not considered to be particularly sensitive to visual impact, due to the presence of the urban are (and its associated visual clutter). Homesteads and settlements, by virtue of their visully exposed nature, are considered to be sensitive visual receptors. A high concentration of homesteads and settlements occur along the N14, R358, the Orange River and east of the Koranaberg. The remainder of the study area is much more sparesely populated. It is uncertain whether all of the potentially affected settlements are inhabited or not, so it is assumed that they are all inhabited. The region as a whole has a high scenic value, and an associated tourism value. Tourists and visitors to this area are therefore seen as sensitive visual receptors upon which the construction of the new power line could have a negative visual impact. The severity of the visual impact on these receptors decreases with increased distance from the proposed infrastructure. 6.4 Visual absorption capacity The broader study area receives between 123 mm and 185 mm of rainfall per year and the proposed site is situated mostly within the Orange River broken veld vegetation type. Land use along the Orange River consists of irrigated agriculture, but this is limited to a strip along the river. The remainder of the study area consists mostly of Shrubland, Thicket and Woodland with limited grazing potential. Overall, the Visual Absorption Capacity (VAC) of the receiving environment is deemed to be low by virtue of the nature of the vegetation and the low occurrence of urban development. Where homesteads and settlements occur, some more significant vegetation and trees may have been planted, which would contribute to visual absorption. As this is not a consistent occurrence, however, VAC will not be taken into account for any of the homesteads or settlements, thus assuming a worst case scenario in the impact assessment. Within the towns and built-up areas, as well as within the mining areas, VAC will be of relevance, due to the presence of buildings, structures and equipment, also known as visual clutter. In this respect, the presence of the built-up environment will ‘absorb’ the visual impact to some extent. The scale and form of the Transmission Line infrastructure means that there is some potential that the receiving environment will visually absorb it in terms of

37
texture, colour, form and light / shade characteristics. This is more likely in areas where power lines or other infrastructure are already present, and less likely where there is no infrastructure at all. In summary, therefore, VAC will not be taken into account for the impact assessment, except in towns, industrial areas (such as mines) and along existing power line routes. 6.5. Visual impact index The combined results of the visual exposure, viewer incidence/perception and visual distance of the respective power line corridor Alternatives are displayed on the Visual Impact Index Maps that follow. Here the weighted impact and the likely areas of impact are indicated as a visual impact index. Values have been assigned for each potential visual impact per data category and merged in order to calculate the visual impact index. An area with short distance, high frequency of visual exposure to the proposed infrastructure, a high viewer incidence and a predominantly negative perception would therefore have a higher value (greater impact) on the index. This helps in focussing the attention to the critical areas of potential impact when evaluating the issues related to the visual impact. The following is of specific relevance regarding the three proposed Transmission Line corridors and their alternative: 6.5.1. The Aries Corridor 6.5.1.1 Corridor A_1 Refer to Map 5a.
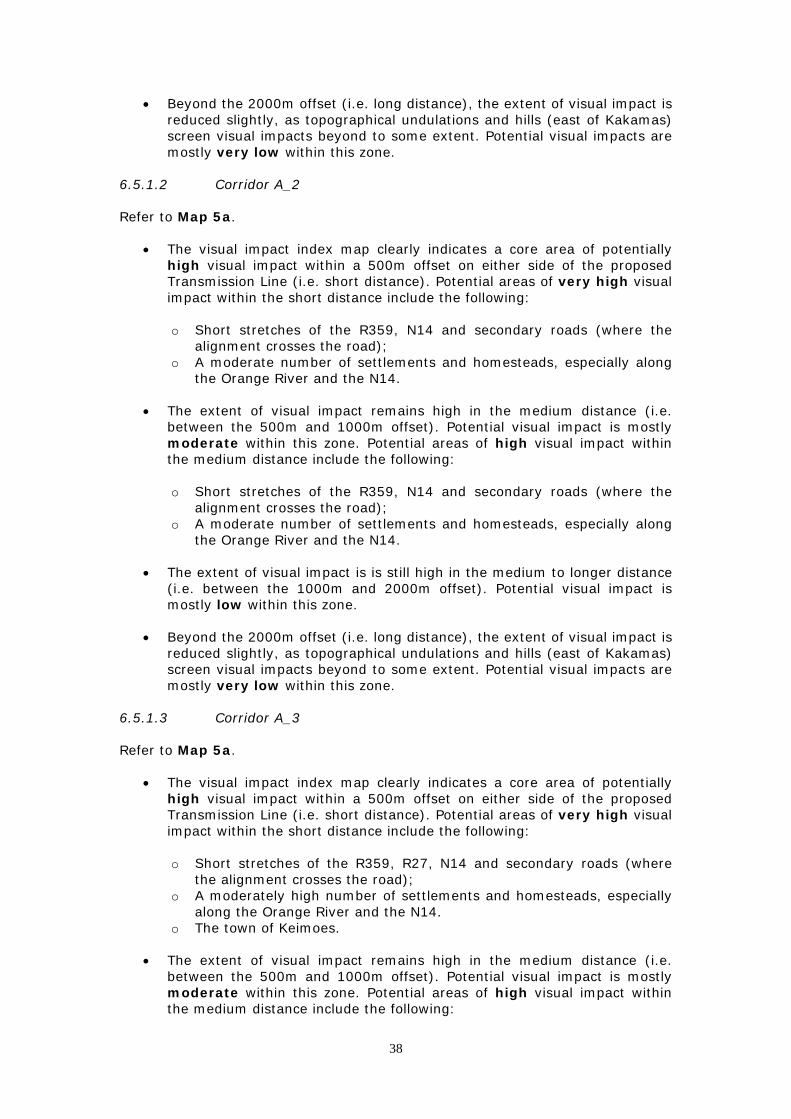
• The visual impact index map clearly indicates a core area of potentially high visual impact within a 500m offset on either side of the proposed Transmission Line (i.e. short distance). Potential areas of very high visual impact within the short distance include the following: o Short stretches of the R359, N14 and secondary roads, as the line
crosses over (where the alignment crosses the road); o A low to moderate number of settlements and homesteads, especially
along the Orange River and the N14.
• The extent of visual impact remains high in the medium distance (i.e. between the 500m and 1000m offset). Potential visual impact is mostly moderate within this zone. Potential areas of high visual impact within the medium distance include the following: o Short stretches of the R359, N14 and secondary roads (where the
alignment crosses the road); o A low to moderate number of settlements and homesteads, especially
along the Orange River and the N14.
• The extent of visual impact is is still high in the medium to longer distance (i.e. between the 1000m and 2000m offset). Potential visual impact is mostly low within this zone.
38
• Beyond the 2000m offset (i.e. long distance), the extent of visual impact is reduced slightly, as topographical undulations and hills (east of Kakamas) screen visual impacts beyond to some extent. Potential visual impacts are mostly very low within this zone.
6.5.1.2 Corridor A_2 Refer to Map 5a.
• The visual impact index map clearly indicates a core area of potentially high visual impact within a 500m offset on either side of the proposed Transmission Line (i.e. short distance). Potential areas of very high visual impact within the short distance include the following: o Short stretches of the R359, N14 and secondary roads (where the
alignment crosses the road); o A moderate number of settlements and homesteads, especially along
the Orange River and the N14.
• The extent of visual impact remains high in the medium distance (i.e. between the 500m and 1000m offset). Potential visual impact is mostly moderate within this zone. Potential areas of high visual impact within the medium distance include the following: o Short stretches of the R359, N14 and secondary roads (where the
alignment crosses the road); o A moderate number of settlements and homesteads, especially along
the Orange River and the N14.
• The extent of visual impact is is still high in the medium to longer distance (i.e. between the 1000m and 2000m offset). Potential visual impact is mostly low within this zone.
• Beyond the 2000m offset (i.e. long distance), the extent of visual impact is reduced slightly, as topographical undulations and hills (east of Kakamas) screen visual impacts beyond to some extent. Potential visual impacts are mostly very low within this zone.
6.5.1.3 Corridor A_3 Refer to Map 5a.
• The visual impact index map clearly indicates a core area of potentially high visual impact within a 500m offset on either side of the proposed Transmission Line (i.e. short distance). Potential areas of very high visual impact within the short distance include the following: o Short stretches of the R359, R27, N14 and secondary roads (where
the alignment crosses the road); o A moderately high number of settlements and homesteads, especially
along the Orange River and the N14. o The town of Keimoes.
• The extent of visual impact remains high in the medium distance (i.e.
between the 500m and 1000m offset). Potential visual impact is mostly moderate within this zone. Potential areas of high visual impact within the medium distance include the following:

39
o Short stretches of the R359, R27, N14 and secondary roads (where
the alignment crosses the road); o A moderately high number of settlements and homesteads, especially
along the Orange River and the N14. o The town of Keimoes.
• The extent of visual impact is is still high in the medium to longer distance
(i.e. between the 1000m and 2000m offset). Potential visual impact is mostly low within this zone.
• Beyond the 2000m offset (i.e. long distance), the extent of visual impact is reduced slightly, as topographical undulations screen visual impacts beyond to some extent. Potential visual impacts are mostly very low within this zone.

40
Map 5a: Visual Impact Index of the Aries Corridor Alternatives.

41
6.5.2. The Ferrum Corridor The Ferrum Corridor links the Solar Park to the 400kV Ferrum Substation located approximately 210 km to the north east of Upington, near Kathu. Four alternative corridors are being considered. 6.5.2.1 Corridor F_1 Refer to Map 5b.
• The visual impact index map clearly indicates a core area of potentially high visual impact within a 500m offset on either side of the proposed Transmission Line (i.e. short distance). Potential areas of very high visual impact within the short distance include the following: o Short stretches of the N14, N10, R360, R380 and secondary roads
(where the alignment crosses the road); o A moderately high number of settlements and homesteads, especially
along the Orange River and the N14. o The town of Kathu.
• The extent of visual impact remains high in the medium distance (i.e.
between the 500m and 1000m offset). Potential visual impact is mostly moderate within this zone. Potential areas of high visual impact within the medium distance include the following:
o Short stretches of the N14, N10, R360, R380 and secondary roads
(where the alignment crosses the road); o A moderately high number of settlements and homesteads, especially
along the Orange River and the N14. o The town of Kathu.
• The extent of visual impact is is still high in the medium to longer distance
(i.e. between the 1000m and 2000m offset). Potential visual impact is mostly low within this zone.
• Beyond the 2000m offset (i.e. long distance), the extent of visual impact is reduced slightly, as topographical undulations, hills and the Koranaberg mountains screen visual impacts beyond to some extent. Potential visual impacts are mostly very low within this zone.
The Spitskop Nature reserve lies within this zone, just north of Upington. Potential visual impacts are mostly low
6.5.2.2 Corridor F_2 Refer to Map 5b.
• The visual impact index map clearly indicates a core area of potentially high visual impact within a 500m offset on either side of the proposed Transmission Line (i.e. short distance). Potential areas of very high visual impact within the short distance include the following: o Short stretches of the N14, N10, R360, R380 and secondary roads
(where the alignment crosses the road); o A moderately high number of settlements and homesteads, especially
along the Orange River and the N14.

42
o The town of Kathu.
• The extent of visual impact remains high in the medium distance (i.e. between the 500m and 1000m offset). Potential visual impact is mostly moderate within this zone. Potential areas of high visual impact within the medium distance include the following:
o Short stretches of the N14, N10, R360, R380 and secondary roads, as
the line crosses over (where the alignment crosses the road); o A moderately high number of settlements and homesteads, especially
along the Orange River and the N14. o The town of Kathu.
• The extent of visual impact is is still high in the medium to longer distance
(i.e. between the 1000m and 2000m offset). Potential visual impact is mostly low within this zone.
• Beyond the 2000m offset (i.e. long distance), the extent of visual impact is reduced slightly, as topographical undulations and hills screen visual impacts beyond to some extent. Potential visual impacts are mostly very low within this zone. The Spitskop Nature reserve lies within this zone, just north of Upington. Potential visual impacts are mostly low
6.5.2.3 Corridor F_3 Refer to Map 5b.
• The visual impact index map clearly indicates a core area of potentially high visual impact within a 500m offset on either side of the proposed Transmission Line (i.e. short distance). Potential areas of very high visual impact within the short distance include the following: o Short stretches of the N14, N10, R360, R380 and secondary roads
(where the alignment crosses the road); o A 100km strtch of the N14 (where the alignment runs adjacent to the
road); o A moderately high number of settlements and homesteads, especially
along the Orange River and the N14. o The town of Kathu.
• The extent of visual impact remains high in the medium distance (i.e.
between the 500m and 1000m offset). Potential visual impact is mostly moderate within this zone. Potential areas of high visual impact within the medium distance include the following:
o Short stretches of the N14, N10, R360, R380 and secondary roads
(where the alignment crosses the road); o A 100km strtch of the N14 (where the alignment runs adjacent to the
road); o A moderately high number of settlements and homesteads, especially
along the Orange River and the N14. o The town of Kathu.

43
• The extent of visual impact is is still high in the medium to longer distance (i.e. between the 1000m and 2000m offset). Potential visual impact is mostly low within this zone.
• Beyond the 2000m offset (i.e. long distance), the extent of visual impact is reduced slightly, as topographical undulations and hills screen visual impacts beyond to some extent. Potential visual impacts are mostly very low within this zone. The Spitskop Nature reserve lies within this zone, just north of Upington. Potential visual impacts are mostly low
6.5.2.4 Corridor F_3 Alt Refer to Map 5b.
• The visual impact index map clearly indicates a core area of potentially high visual impact within a 500m offset on either side of the proposed Transmission Line (i.e. short distance). Potential areas of very high visual impact within the short distance include the following: o Short stretches of the N14, N10, R360, R380 and secondary roads
(where the alignment crosses the road); o A 140km strtch of the N14 (where the alignment runs adjacent to the
road); o A moderately high number of settlements and homesteads, especially
along the Orange River and the N14. o The town of Kathu.
• The extent of visual impact remains high in the medium distance (i.e.
between the 500m and 1000m offset). Potential visual impact is mostly moderate within this zone. Potential areas of high visual impact within the medium distance include the following:
o Short stretches of the N14, N10, R360, R380 and secondary roads
(where the alignment crosses the road); o A 140km strtch of the N14 (where the alignment runs adjacent to the
road); o A moderately high number of settlements and homesteads, especially
along the Orange River and the N14. o The town of Kathu.
• The extent of visual impact is is still high in the medium to longer distance
(i.e. between the 1000m and 2000m offset). Potential visual impact is mostly low within this zone.
• Beyond the 2000m offset (i.e. long distance), the extent of visual impact is reduced slightly, as topographical undulations, hills and the Koranaberg mountains screen visual impacts beyond to some extent. Potential visual impacts are mostly very low within this zone.
The Spitskop Nature reserve lies within this zone, just north of Upington. Potential visual impacts are mostly low

44
Map 5b_1: Visual Impact Index of the Ferrum Corridor Alternatives (western section).

45
Map 5b_2: Visual Impact Index of the Ferrum Corridor Alternatives (eastern section).

46
6.5.3. The Niewehoop Corridor The Niewehoop Corridor links the Solar Park to the 400kV Niewehoop Substation located approximately 70 km to the south east of Upington. Three alternative corridors are being considered. 6.5.3.1 Corridor N_1 Refer to Map 5c.
• The visual impact index map clearly indicates a core area of potentially high visual impact within a 500m offset on either side of the proposed Transmission Line (i.e. short distance). Potential areas of very high visual impact within the short distance include the following: o Short stretches of the R359, N14 and secondary roads (where the
alignment crosses the road); o A moderate number of settlements and homesteads, especially along
the Orange River, the N14 and the R359.
• The extent of visual impact remains high in the medium distance (i.e. between the 500m and 1000m offset). Potential visual impact is mostly moderate within this zone. Potential areas of high visual impact within the medium distance include the following:
o Short stretches of the R359, N14 and secondary roads (where the
alignment crosses the road); o A moderate number of settlements and homesteads, especially along
the Orange River, the N14 and the R359.
• The extent of visual impact is is still high in the medium to longer distance (i.e. between the 1000m and 2000m offset). Potential visual impact is mostly low within this zone.
• Beyond the 2000m offset (i.e. long distance), the extent of visual impact remains high, as topographical undulations are largely absent. Potential visual impacts are mostly very low within this zone.
6.5.3.2 Corridor N_2 Refer to Map 5c.
• The visual impact index map clearly indicates a core area of potentially high visual impact within a 500m offset on either side of the proposed Transmission Line (i.e. short distance). Potential areas of very high visual impact within the short distance include the following: o Short stretches of the R359, N14 and secondary roads (where the
alignment crosses the road); o A moderate number of settlements and homesteads, especially along
the Orange River, the N14 and the R359.
• The extent of visual impact remains high in the medium distance (i.e. between the 500m and 1000m offset). Potential visual impact is mostly moderate within this zone. Potential areas of high visual impact within the medium distance include the following:

47
o Short stretches of the R359, N14 and secondary roads (where the alignment crosses the road);
o A moderate number of settlements and homesteads, especially along the Orange River, the N14 and the R359.
• The extent of visual impact is is still high in the medium to longer distance
(i.e. between the 1000m and 2000m offset). Potential visual impact is mostly low within this zone.
• Beyond the 2000m offset (i.e. long distance), the extent of visual impact remains high, as topographical undulations are largely absent. Potential visual impacts are mostly very low within this zone.
6.5.3.3 Corridor N_3 Refer to Map 5c.
• The visual impact index map clearly indicates a core area of potentially high visual impact within a 500m offset on either side of the proposed Transmission Line (i.e. short distance). Potential areas of very high visual impact within the short distance include the following: o Short stretches of the R359, N14 and secondary roads (where the
alignment crosses the road); o A 140km strtch of the a secondary road (where the alignment runs
adjacent to the road); o A moderate number of settlements and homesteads, especially along
the Orange River, the N14 and the R359.
• The extent of visual impact remains high in the medium distance (i.e. between the 500m and 1000m offset). Potential visual impact is mostly moderate within this zone. Potential areas of high visual impact within the medium distance include the following:
o Short stretches of the R359, N14 and secondary roads (where the
alignment crosses the road); o A 140km strtch of the a secondary road (where the alignment runs
adjacent to the road); o A moderate number of settlements and homesteads, especially along
the Orange River, the N14 and the R359.
• The extent of visual impact is is still high in the medium to longer distance (i.e. between the 1000m and 2000m offset). Potential visual impact is mostly low within this zone.
• Beyond the 2000m offset (i.e. long distance), the extent of visual impact remains high, as topographical undulations are largely absent. Potential visual impacts are mostly very low within this zone.

48
Map 5c: Visual Impact Index of the Niewehoop Corridor Alternatives.
49
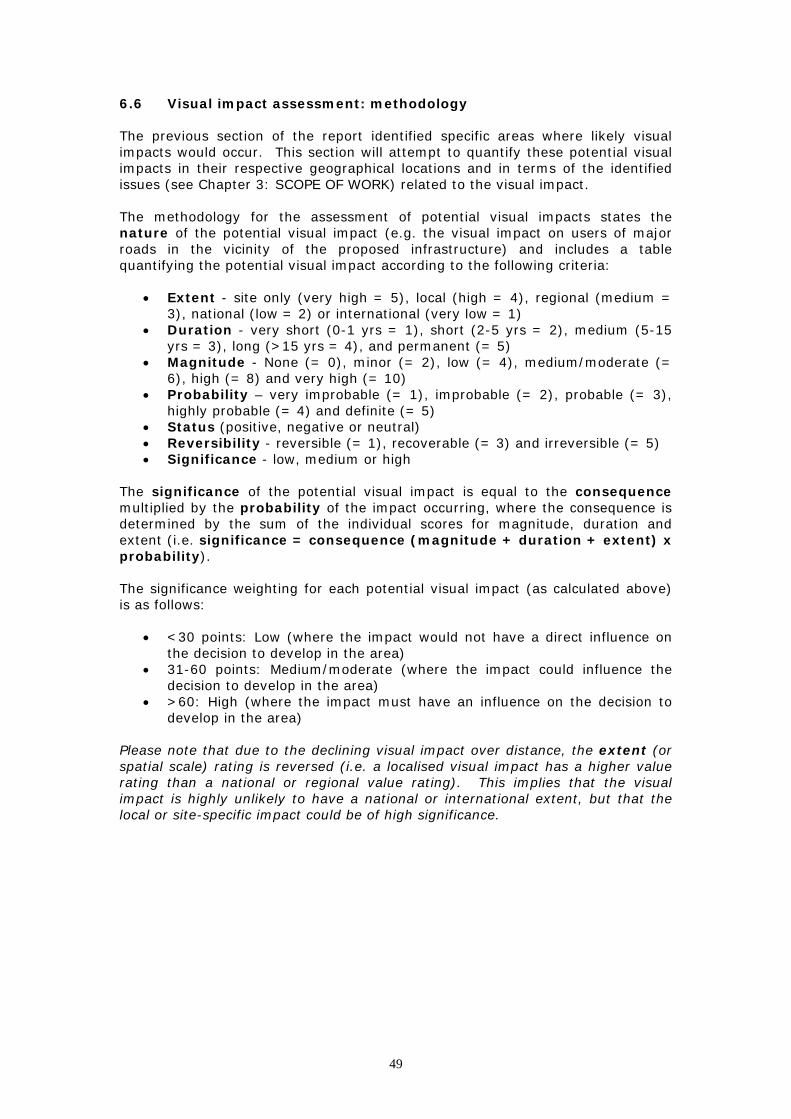
6.6 Visual impact assessment: methodology The previous section of the report identified specific areas where likely visual impacts would occur. This section will attempt to quantify these potential visual impacts in their respective geographical locations and in terms of the identified issues (see Chapter 3: SCOPE OF WORK) related to the visual impact. The methodology for the assessment of potential visual impacts states the nature of the potential visual impact (e.g. the visual impact on users of major roads in the vicinity of the proposed infrastructure) and includes a table quantifying the potential visual impact according to the following criteria:
• Extent - site only (very high = 5), local (high = 4), regional (medium = 3), national (low = 2) or international (very low = 1)
• Duration - very short (0-1 yrs = 1), short (2-5 yrs = 2), medium (5-15 yrs = 3), long (>15 yrs = 4), and permanent (= 5)
• Magnitude - None (= 0), minor (= 2), low (= 4), medium/moderate (= 6), high (= 8) and very high (= 10)
• Probability – very improbable (= 1), improbable (= 2), probable (= 3), highly probable (= 4) and definite (= 5)
• Status (positive, negative or neutral) • Reversibility - reversible (= 1), recoverable (= 3) and irreversible (= 5) • Significance - low, medium or high
The significance of the potential visual impact is equal to the consequence multiplied by the probability of the impact occurring, where the consequence is determined by the sum of the individual scores for magnitude, duration and extent (i.e. significance = consequence (magnitude + duration + extent) x probability). The significance weighting for each potential visual impact (as calculated above) is as follows:
• <30 points: Low (where the impact would not have a direct influence on the decision to develop in the area)
• 31-60 points: Medium/moderate (where the impact could influence the decision to develop in the area)
• >60: High (where the impact must have an influence on the decision to develop in the area)
Please note that due to the declining visual impact over distance, the extent (or spatial scale) rating is reversed (i.e. a localised visual impact has a higher value rating than a national or regional value rating). This implies that the visual impact is highly unlikely to have a national or international extent, but that the local or site-specific impact could be of high significance.
50
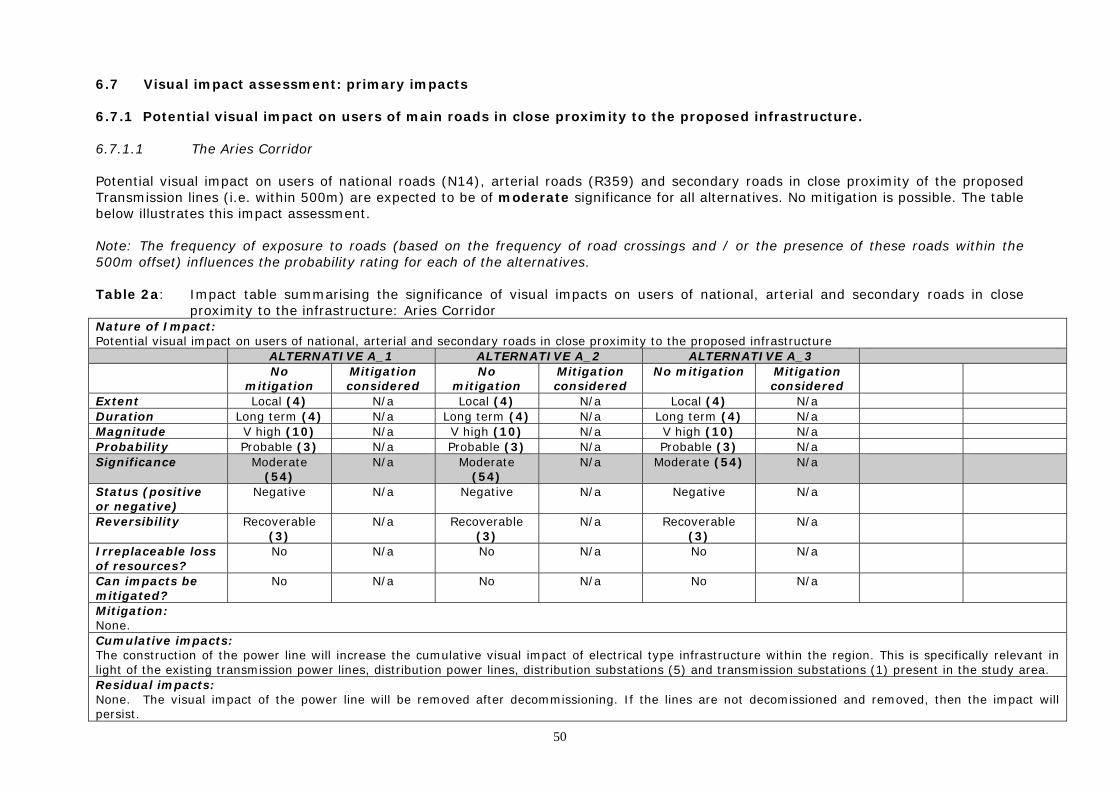
6.7 Visual impact assessment: primary impacts 6.7.1 Potential visual impact on users of main roads in close proximity to the proposed infrastructure. 6.7.1.1 The Aries Corridor Potential visual impact on users of national roads (N14), arterial roads (R359) and secondary roads in close proximity of the proposed Transmission lines (i.e. within 500m) are expected to be of moderate significance for all alternatives. No mitigation is possible. The table below illustrates this impact assessment. Note: The frequency of exposure to roads (based on the frequency of road crossings and / or the presence of these roads within the 500m offset) influences the probability rating for each of the alternatives. Table 2a: Impact table summarising the significance of visual impacts on users of national, arterial and secondary roads in close
proximity to the infrastructure: Aries Corridor Nature of Impact: Potential visual impact on users of national, arterial and secondary roads in close proximity to the proposed infrastructure
ALTERNATIVE A_1 ALTERNATIVE A_2 ALTERNATIVE A_3 No
mitigation Mitigation considered
No mitigation
Mitigation considered
No mitigation Mitigation considered
Extent Local (4) N/a Local (4) N/a Local (4) N/a Duration Long term (4) N/a Long term (4) N/a Long term (4) N/a Magnitude V high (10) N/a V high (10) N/a V high (10) N/a Probability Probable (3) N/a Probable (3) N/a Probable (3) N/a Significance Moderate
(54) N/a Moderate
(54) N/a Moderate (54) N/a
Status (positive or negative)
Negative N/a Negative N/a Negative N/a
Reversibility Recoverable (3)
N/a Recoverable (3)
N/a Recoverable (3)
N/a
Irreplaceable loss of resources?
No N/a No N/a No N/a
Can impacts be mitigated?
No N/a No N/a No N/a
Mitigation: None. Cumulative impacts: The construction of the power line will increase the cumulative visual impact of electrical type infrastructure within the region. This is specifically relevant in light of the existing transmission power lines, distribution power lines, distribution substations (5) and transmission substations (1) present in the study area. Residual impacts: None. The visual impact of the power line will be removed after decommissioning. If the lines are not decomissioned and removed, then the impact will persist.

51
6.7.1.2 The Ferrum Corridor Potential visual impact on users of national roads (N14, N10), arterial roads (R360, R380) and secondary roads in close proximity of the proposed Transmission lines (i.e. within 500m) are expected to be of moderate significance for Alternatives F_1 and F_2, and of high significance for Alternatives F_3 and F_4. No mitigation is possible. The table below illustrates this impact assessment. Note: The frequency of exposure to roads (based on the frequency of road crossings and / or the presence of these roads within the 500m offset) influences the probability rating for each of the alternatives. Table 2b: Impact table summarising the significance of visual impacts on users of national, arterial and secondary roads in close
proximity to the infrastructure: Ferrum Corridor Nature of Impact: Potential visual impact on users of national, arterial and secondary roads in close proximity to the proposed infrastructure
ALTERNATIVE F_1 ALTERNATIVE F_2 ALTERNATIVE F_3 ALTERNATIVE F_3 alt No
mitigation Mitigation considered
No mitigation
Mitigation considered
No mitigation Mitigation considered
No mitigation
Mitigation considered
Extent Local (4) N/a Local (4) N/a Local (4) N/a Local (4) N/a Duration Long term (4) N/a Long term (4) N/a Long term (4) N/a Long term (4) N/a Magnitude V high (10) N/a V high (10) N/a V high (10) N/a V high (10) N/a Probability Probable (3) N/a Probable (3) N/a Definite (5) N/a Definite (5) N/a Significance Moderate
(54) N/a Moderate
(54) N/a High (90) N/a High (90) N/a
Status (positive or negative)
Negative N/a Negative N/a Negative N/a Negative N/a
Reversibility Recoverable (3)
N/a Recoverable (3)
N/a Recoverable (3)
N/a Recoverable (3)
N/a
Irreplaceable loss of resources?
No N/a No N/a No N/a No N/a
Can impacts be mitigated?
No N/a No N/a No N/a No N/a
Mitigation: None. Cumulative impacts: The construction of the power line will increase the cumulative visual impact of electrical type infrastructure within the region. This is specifically relevant in light of the existing transmission power lines, distribution power lines, distribution substations (14) and transmission substations (2) present in the study area. Residual impacts: None. The visual impact of the power line will be removed after decommissioning. If the lines are not decomissioned and removed, then the impact will persist.
52
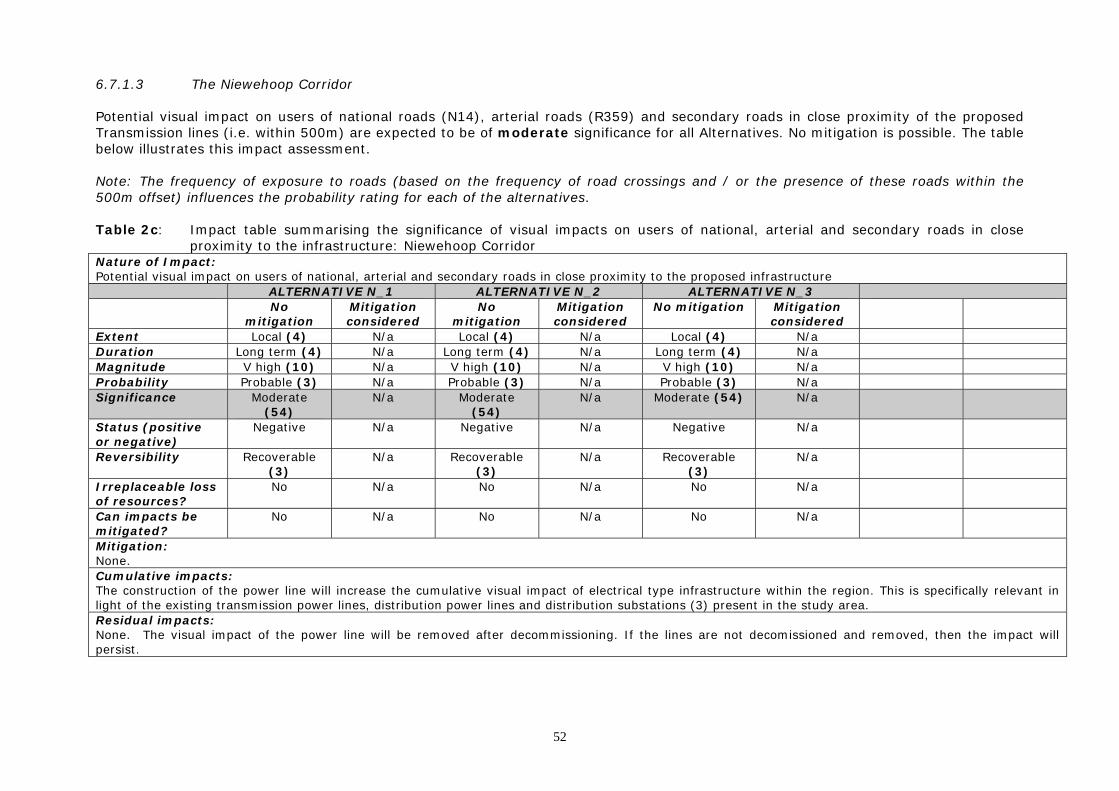
6.7.1.3 The Niewehoop Corridor Potential visual impact on users of national roads (N14), arterial roads (R359) and secondary roads in close proximity of the proposed Transmission lines (i.e. within 500m) are expected to be of moderate significance for all Alternatives. No mitigation is possible. The table below illustrates this impact assessment. Note: The frequency of exposure to roads (based on the frequency of road crossings and / or the presence of these roads within the 500m offset) influences the probability rating for each of the alternatives. Table 2c: Impact table summarising the significance of visual impacts on users of national, arterial and secondary roads in close
proximity to the infrastructure: Niewehoop Corridor Nature of Impact: Potential visual impact on users of national, arterial and secondary roads in close proximity to the proposed infrastructure
ALTERNATIVE N_1 ALTERNATIVE N_2 ALTERNATIVE N_3 No
mitigation Mitigation considered
No mitigation
Mitigation considered
No mitigation Mitigation considered
Extent Local (4) N/a Local (4) N/a Local (4) N/a Duration Long term (4) N/a Long term (4) N/a Long term (4) N/a Magnitude V high (10) N/a V high (10) N/a V high (10) N/a Probability Probable (3) N/a Probable (3) N/a Probable (3) N/a Significance Moderate
(54) N/a Moderate
(54) N/a Moderate (54) N/a
Status (positive or negative)
Negative N/a Negative N/a Negative N/a
Reversibility Recoverable (3)
N/a Recoverable (3)
N/a Recoverable (3)
N/a
Irreplaceable loss of resources?
No N/a No N/a No N/a
Can impacts be mitigated?
No N/a No N/a No N/a
Mitigation: None. Cumulative impacts: The construction of the power line will increase the cumulative visual impact of electrical type infrastructure within the region. This is specifically relevant in light of the existing transmission power lines, distribution power lines and distribution substations (3) present in the study area. Residual impacts: None. The visual impact of the power line will be removed after decommissioning. If the lines are not decomissioned and removed, then the impact will persist.

53
6.7.2 Potential visual impact on residents of built up areas and towns in close proximity to the proposed infrastructure. 6.7.2.1 The Aries Corridor The potential visual impact on residents of residents of built-up centres and populated places (i.e. Keimoes) within 500m of the proposed Transmission lines is expected to be of moderate significance for Alternative A_3, and of low significance for the other Alternatives. The presence of visual clutter within the urban environment reduces the probability of this impact occurring. No mitigation is possible. The table below illustrates this impact assessment. Table 3a: Impact table summarising the significance of visual impacts on residents of built up areas and towns in close proximity to
the proposed infrastructure: Aries Corridor Nature of Impact: Potential visual impact on residents of built up areas and towns in close proximity to the proposed infrastructure.
ALTERNATIVE A_1 ALTERNATIVE A_2 ALTERNATIVE A_3 No
mitigation Mitigation considered
No mitigation
Mitigation considered
No mitigation
Mitigation considered
Extent Local (4) N/a Local (4) N/a Local (4) N/a Duration Long term (4) N/a Long term (4) N/a Long term (4) N/a Magnitude None (0) N/a None (0) N/a V high (10) N/a Probability V impro (1) N/a V impro (1) N/a Probable (3) N/a Significance Low (8) N/a Low (8) N/a Moderate
(54) N/a
Status (positive or negative)
Negative N/a Negative N/a Negative N/a
Reversibility Recoverable (3)
N/a N/a N/a N/a N/a
Irreplaceable loss of resources?
No N/a N/a N/a N/a N/a
Can impacts be mitigated?
No N/a N/a N/a N/a N/a
Mitigation: None. Cumulative impacts: The construction of the power line will increase the cumulative visual impact of electrical type infrastructure within the region. This is specifically relevant in light of the existing transmission power lines, distribution power lines, distribution substations (5) and transmission substations (1) present in the study area. Residual impacts: None. The visual impact of the power line will be removed after decommissioning. If the lines are not decomissioned and removed, then the impact will persist.
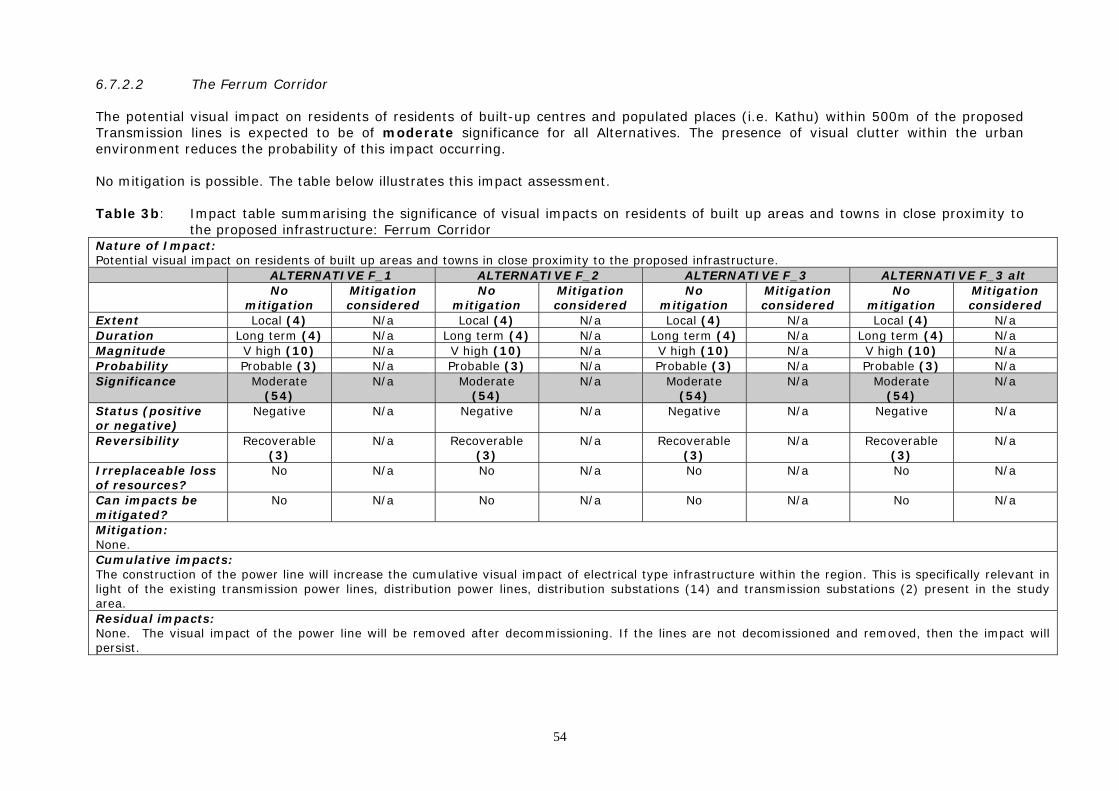
54
6.7.2.2 The Ferrum Corridor The potential visual impact on residents of residents of built-up centres and populated places (i.e. Kathu) within 500m of the proposed Transmission lines is expected to be of moderate significance for all Alternatives. The presence of visual clutter within the urban environment reduces the probability of this impact occurring. No mitigation is possible. The table below illustrates this impact assessment. Table 3b: Impact table summarising the significance of visual impacts on residents of built up areas and towns in close proximity to
the proposed infrastructure: Ferrum Corridor Nature of Impact: Potential visual impact on residents of built up areas and towns in close proximity to the proposed infrastructure.
ALTERNATIVE F_1 ALTERNATIVE F_2 ALTERNATIVE F_3 ALTERNATIVE F_3 alt No
mitigation Mitigation considered
No mitigation
Mitigation considered
No mitigation
Mitigation considered
No mitigation
Mitigation considered
Extent Local (4) N/a Local (4) N/a Local (4) N/a Local (4) N/a Duration Long term (4) N/a Long term (4) N/a Long term (4) N/a Long term (4) N/a Magnitude V high (10) N/a V high (10) N/a V high (10) N/a V high (10) N/a Probability Probable (3) N/a Probable (3) N/a Probable (3) N/a Probable (3) N/a Significance Moderate
(54) N/a Moderate
(54) N/a Moderate
(54) N/a Moderate
(54) N/a
Status (positive or negative)
Negative N/a Negative N/a Negative N/a Negative N/a
Reversibility Recoverable (3)
N/a Recoverable (3)
N/a Recoverable (3)
N/a Recoverable (3)
N/a
Irreplaceable loss of resources?
No N/a No N/a No N/a No N/a
Can impacts be mitigated?
No N/a No N/a No N/a No N/a
Mitigation: None. Cumulative impacts: The construction of the power line will increase the cumulative visual impact of electrical type infrastructure within the region. This is specifically relevant in light of the existing transmission power lines, distribution power lines, distribution substations (14) and transmission substations (2) present in the study area. Residual impacts: None. The visual impact of the power line will be removed after decommissioning. If the lines are not decomissioned and removed, then the impact will persist.

55
6.7.2.3 The Niewehoop Corridor The potential visual impact on residents of residents of built-up centres and populated places within 500m of the proposed Transmission Lines is expected to be of low significance for all Alternatives. The table below illustrates this impact assessment. Table 3c: Impact table summarising the significance of visual impacts on residents of built up areas and towns in close proximity to
the proposed infrastructure: Niewehoop Corridor Nature of Impact: Potential visual impact on residents of built up areas and towns in close proximity to the proposed infrastructure.
ALTERNATIVE N_1 ALTERNATIVE N_2 ALTERNATIVE N_3 No
mitigation Mitigation considered
No mitigation
Mitigation considered
No mitigation
Mitigation considered
Extent Local (4) N/a Local (4) N/a Local (4) N/a Duration Long term (4) N/a Long term (4) N/a Long term (4) N/a Magnitude None (0) N/a None (0) N/a None (0) N/a Probability V Improbable
(1) N/a V Improbable
(1) N/a V Improbable
(1) N/a
Significance Low (8) N/a Low (8) N/a Low (8) N/a Status (positive or negative)
Negative N/a Negative N/a Negative N/a
Reversibility Recoverable (3)
N/a Recoverable (3)
N/a Recoverable (3)
N/a
Irreplaceable loss of resources?
No N/a No N/a No N/a
Can impacts be mitigated?
No N/a No N/a No N/a
Mitigation: None. Cumulative impacts: The construction of the power line will increase the cumulative visual impact of electrical type infrastructure within the region. This is specifically relevant in light of the existing transmission power lines, distribution power lines and distribution substations (3) present in the study area. Residual impacts: None. The visual impact of the power line will be removed after decommissioning. If the lines are not decomissioned and removed, then the impact will persist.

56
6.7.3 Potential visual impact on residents of farmsteads and settlements in close proximity to the proposed infrastructure 6.7.3.1 The Aries Corridor The potential visual impact on residents of farmsteads and settlements within 500m of the proposed Transmission Lines is expected to be of high significance for Alternative A_3 and of moderate significance for all other Alternatives. No mitigation is possible. The table below illustrates this impact assessment. Note: The frequency of exposure to farmsteads and settlements (based on the frequency of occurrence within a 500m offset) influences the probability rating for each of the alternatives. Table 4a: Impact table summarising the significance of visual impacts on residents of farmsteads and settlements in close proximity
to the proposed infrastructure: Aries Corridor Nature of Impact: Potential visual impact on residents of farmsteads and settlements in close proximity to the proposed infrastructure.
ALTERNATIVE A_1 ALTERNATIVE A_2 ALTERNATIVE A_3 No
mitigation Mitigation considered
No mitigation
Mitigation considered
No mitigation
Mitigation considered
Extent Local (4) N/a Local (4) N/a Local (4) N/a Duration Long term (4) N/a Long term (4) N/a Long term (4) N/a Magnitude V high (10) N/a V high (10) N/a V high (10) N/a Probability Improbable
(2) N/a Probable (3) N/a High (4) N/a
Significance Moderate (36)
N/a Moderate (54)
N/a High (72) N/a
Status (positive or negative)
Negative N/a Negative N/a Negative N/a
Reversibility Recoverable (3)
N/a Recoverable (3)
N/a Recoverable (3)
N/a
Irreplaceable loss of resources?
No N/a No N/a No N/a
Can impacts be mitigated?
No N/a No N/a No N/a
Mitigation: None. Cumulative impacts: The construction of the power line will increase the cumulative visual impact of electrical type infrastructure within the region. This is specifically relevant in light of the existing transmission power lines, distribution power lines, distribution substations (5) and transmission substations (1) present in the study area. Residual impacts: None. The visual impact of the power line will be removed after decommissioning. If the lones are not decomissioned and removed, then the impact will persist.

57
6.7.3.2 The Ferrum Corridor The potential visual impact on residents of farmsteads and settlements within 500m of the proposed Transmission Lines is expected to be of high significance for all Alternatives. No mitigation is possible. The table below illustrates this impact assessment. Note: The frequency of exposure to farmsteads and settlements (based on the frequency of occurrence within a 500m offset) influences the probability rating for each of the alternatives. Table 4b: Impact table summarising the significance of visual impacts on residents of farmsteads and settlements in close proximity
to the proposed infrastructure: Ferrum Corridor Nature of Impact: Potential visual impact on residents of farmsteads and settlements in close proximity to the proposed infrastructure.
ALTERNATIVE F_1 ALTERNATIVE F_2 ALTERNATIVE F_3 ALTERNATIVE F_3 alt No
mitigation Mitigation considered
No mitigation
Mitigation considered
No mitigation
Mitigation considered
No mitigation
Mitigation considered
Extent Local (4) N/a Local (4) N/a Local (4) N/a Local (4) N/a Duration Long term (4) N/a Long term (4) N/a Long term (4) N/a Long term (4) N/a Magnitude V high (10) N/a V high (10) N/a V high (10) N/a V high (10) N/a Probability High (4) N/a High (4) N/a High (4) N/a High (4) N/a Significance High (72) N/a High (72) N/a High (72) N/a High (72) N/a Status (positive or negative)
Negative N/a Negative N/a Negative N/a Negative N/a
Reversibility Recoverable (3)
N/a Recoverable (3)
N/a Recoverable (3)
N/a Recoverable (3)
N/a
Irreplaceable loss of resources?
No N/a No N/a No N/a No N/a
Can impacts be mitigated?
No N/a No N/a No N/a No N/a
Mitigation: None. Cumulative impacts: The construction of the power line will increase the cumulative visual impact of electrical type infrastructure within the region. This is specifically relevant in light of the existing transmission power lines, distribution power lines, distribution substations (14) and transmission substations (2) present in the study area. Residual impacts: None. The visual impact of the power line will be removed after decommissioning. If the lines are not decomissioned and removed, then the impact will persist.

58
6.7.3.3 The Niewehoop Corridor The potential visual impact on residents of farmsteads and settlements within 500m of the proposed Transmission Lines is expected to be of high significance for all Alternatives. No mitigation is possible. The table below illustrates this impact assessment. Note: The frequency of exposure to farmsteads and settlements (based on the frequency of occurrence within a 500m offset) influences the probability rating for each of the alternatives. Table 4c: Impact table summarising the significance of visual impacts on residents of farmsteads and settlements in close proximity
to the proposed infrastructure: Niewehoop Corridor Nature of Impact: Potential visual impact on residents of farmsteads and settlements in close proximity to the proposed infrastructure.
ALTERNATIVE N_1 ALTERNATIVE N_2 ALTERNATIVE N_3 No
mitigation Mitigation considered
No mitigation
Mitigation considered
No mitigation
Mitigation considered
Extent Local (4) N/a Local (4) N/a Local (4) N/a Duration Long term (4) N/a Long term (4) N/a Long term (4) N/a Magnitude V high (10) N/a V high (10) N/a V high (10) N/a Probability Probable (3) N/a Probable (3) N/a Probable (3) N/a Significance Moderate
(54) N/a Moderate
(54) N/a Moderate
(54) N/a
Status (positive or negative)
Negative N/a Negative N/a Negative N/a
Reversibility Recoverable (3)
N/a Recoverable (3)
N/a Recoverable (3)
N/a
Irreplaceable loss of resources?
No N/a No N/a No N/a
Can impacts be mitigated?
No N/a No N/a No N/a
Mitigation: None. Cumulative impacts: The construction of the power line will increase the cumulative visual impact of electrical type infrastructure within the region. This is specifically relevant in light of the existing transmission power lines, distribution power lines and distribution substations (3) present in the study area. Residual impacts: None. The visual impact of the power line will be removed after decommissioning. If the lines are not decomissioned and removed, then the impact will persist.

59
6.7.4 Potential visual impact on sensitive visual receptors within the region. 6.7.4.1 The Aries Corridor The visual impact sensitive visual receptors (i.e users of roads and residents of homesteads and settlements) within the region (i.e. beyond the 500m offset) is expected to be of moderate significance for all Alternatives. No mitigation is possible. The table below illustrates this impact assessment. Note: The frequency of exposure to farmsteads and settlements (based on the frequency of occurrence beyond a 500m offset) influences the probability rating for each of the alternatives. Table 5a: Impact table summarising the significance of visual impacts on sensitive visual receptors within the region: Aries Corridor Nature of Impact: Potential visual impact on sensitive visual receptors within the region.
ALTERNATIVE A_1 ALTERNATIVE A_2 ALTERNATIVE A_3 No
mitigation Mitigation considered
No mitigation
Mitigation considered
No mitigation
Mitigation considered
Extent Regional (3) N/a Regional (3) N/a Regional (3) N/a Duration Long term (4) N/a Long term (4) N/a Long term (4) N/a Magnitude High (8) N/a High (8) N/a High (8) N/a Probability Improbable
(2) N/a Probable (3) N/a High (4) N/a
Significance Moderate (30)
N/a Moderate (45)
N/a Moderate (60)
N/a
Status (positive or negative)
Negative N/a Negative N/a Negative N/a
Reversibility Recoverable (3)
N/a Recoverable (3)
N/a Recoverable (3)
N/a
Irreplaceable loss of resources?
No N/a No N/a No N/a
Can impacts be mitigated?
No N/a No N/a No N/a
Mitigation: None. Cumulative impacts: The construction of the power line will increase the cumulative visual impact of electrical type infrastructure within the region. This is specifically relevant in light of the existing transmission power lines, distribution power lines, distribution substations (5) and transmission substations (1) present in the study area. Residual impacts: None. The visual impact of the power line will be removed after decommissioning. If the lines are not decomissioned and removed, then the impact will persist.

60
6.7.4.2 The Ferrum Corridor The visual impact sensitive visual receptors (i.e users of roads and residents of homesteads and settlements) within the region (i.e. beyond the 500m offset) is expected to be of moderate significance for all Alternatives. No mitigation is possible. The table below illustrates this impact assessment. Note: The frequency of exposure to farmsteads and settlements (based on the frequency of occurrence beyond a 500m offset) influences the probability rating for each of the alternatives. Table 5b: Impact table summarising the significance of visual impacts on sensitive visual receptors within the region: Ferrum Corridor Nature of Impact: Potential visual impact on sensitive visual receptors within the region.
ALTERNATIVE F_1 ALTERNATIVE F_2 ALTERNATIVE F_3 ALTERNATIVE F_3 alt No
mitigation Mitigation considered
No mitigation
Mitigation considered
No mitigation
Mitigation considered
No mitigation
Mitigation considered
Extent Regional (3) N/a Regional (3) N/a Regional (3) N/a Regional (3) N/a Duration Long term (4) N/a Long term (4) N/a Long term (4) N/a Long term (4) N/a Magnitude High (8) N/a High (8) N/a High (8) N/a High (8) N/a Probability High (4) N/a High (4) N/a High (4) N/a High (4) N/a Significance Moderate
(60) N/a Moderate
(60) N/a Moderate
(60) N/a Moderate
(60) N/a
Status (positive or negative)
Negative N/a Negative N/a Negative N/a Negative N/a
Reversibility Recoverable (3)
N/a Recoverable (3)
N/a Recoverable (3)
N/a Recoverable (3)
N/a
Irreplaceable loss of resources?
No N/a No N/a No N/a No N/a
Can impacts be mitigated?
No N/a No N/a No N/a No N/a
Mitigation: None. Cumulative impacts: The construction of the power line will increase the cumulative visual impact of electrical type infrastructure within the region. This is specifically relevant in light of the existing transmission power lines, distribution power lines, distribution substations (14) and transmission substations (2) present in the study area. Residual impacts: None. The visual impact of the power line will be removed after decommissioning. If the lines are not decomissioned and removed, then the impact will persist.

61
6.7.4.3 The Niewehoop Corridor The visual impact sensitive visual receptors (i.e users of roads and residents of homesteads and settlements) within the region (i.e. beyond the 500m offset) is expected to be of moderate significance for all Alternatives. No mitigation is possible. The table below illustrates this impact assessment. Note: The frequency of exposure to farmsteads and settlements (based on the frequency of occurrence beyond a 500m offset) influences the probability rating for each of the alternatives. Table 5c: Impact table summarising the significance of visual impacts on sensitive visual receptors within the region: Niewehoop
Corridor Nature of Impact: Potential visual impact on sensitive visual receptors within the region.
ALTERNATIVE N_1 ALTERNATIVE N_2 ALTERNATIVE N_3 No
mitigation Mitigation considered
No mitigation
Mitigation considered
No mitigation
Mitigation considered
Extent Regional (3) N/a Regional (3) N/a Regional (3) N/a Duration Long term (4) N/a Long term (4) N/a Long term (4) N/a Magnitude High (8) N/a High (8) N/a High (8) N/a Probability Probable (3) N/a Probable (3) N/a Probable (3) N/a Significance Moderate
(45) N/a Moderate
(45) N/a Moderate
(45) N/a
Status (positive or negative)
Negative N/a Negative N/a Negative N/a
Reversibility Recoverable (3)
N/a Recoverable (3)
N/a Recoverable (3)
N/a
Irreplaceable loss of resources?
No N/a No N/a No N/a
Can impacts be mitigated?
No N/a No N/a No N/a
Mitigation: None. Cumulative impacts: The construction of the power line will increase the cumulative visual impact of electrical type infrastructure within the region. This is specifically relevant in light of the existing transmission power lines, distribution power lines and distribution substations (3) present in the study area. Residual impacts: None. The visual impact of the power line will be removed after decommissioning. If the lines are not decomissioned and removed, then the impact will persist.

62
6.7.5 Potential visual impact on conservation areas within the region. 6.7.5.1 The Aries Corridor The potential visual impact on protected and conservation areas (the Augrabies National Park) is expected to be of low significance for all Alternatives. No mitigation is possible. The table below illustrates this impact assessment. Table 6a: Impact table summarising the significance of visual impacts on conservation areas within the region: Aries Corridor Nature of Impact: Potential visual impact on conservation areas within the region.
ALTERNATIVE A_1 ALTERNATIVE A_2 ALTERNATIVE A_3 No
mitigation Mitigation considered
No mitigation
Mitigation considered
No mitigation
Mitigation considered
Extent Regional (3) N/a Regional (3) N/a Regional (3) N/a Duration Long term (4) N/a Long term (4) N/a Long term (4) N/a Magnitude None (0) N/a None (0) N/a None (0) N/a Probability V Improbable
(1) N/a V Improbable
(1) N/a V Improbable
(1) N/a
Significance Low (7) N/a Low (7) N/a Low (7) N/a Status (positive or negative)
Negative N/a Negative N/a Negative N/a
Reversibility Recoverable (3)
N/a Recoverable (3)
N/a Recoverable (3)
N/a
Irreplaceable loss of resources?
No N/a No N/a No N/a
Can impacts be mitigated?
No N/a No N/a No N/a
Mitigation: None. Cumulative impacts: The construction of the power line will increase the cumulative visual impact of electrical type infrastructure within the region. This is specifically relevant in light of the existing transmission power lines, distribution power lines, distribution substations (5) and transmission substations (1) present in the study area. Residual impacts: None. The visual impact of the power line will be removed after decommissioning. If the lines are not decomissioned and removed, then the impact will persist.

63
6.7.5.2 The Ferrum Corridor The potential visual impact on protected and conservation areas (the Spitskop Nature Reserve) is expected to be of low significance for all Alternatives. No mitigation is possible. The table below illustrates this impact assessment. Table 6b: Impact table summarising the significance of visual impacts on conservation areas within the region: Furrum Corridor Nature of Impact: Potential visual impact on conservation areas within the region.
ALTERNATIVE F_1 ALTERNATIVE F_2 ALTERNATIVE F_3 ALTERNATIVE F_3 alt No
mitigation Mitigation considered
No mitigation
Mitigation considered
No mitigation
Mitigation considered
No mitigation
Mitigation considered
Extent Regional (3) N/a Regional (3) N/a Regional (3) N/a Regional (3) N/a Duration Long term (4) N/a Long term (4) N/a Long term (4) N/a Long term (4) N/a Magnitude Low (4) N/a Low (4) N/a Low (4) N/a Low (4) N/a Probability Probable (3) N/a Probable (3) N/a Probable (3) N/a Probable (3) N/a Significance Moderate
(33) N/a Moderate
(33) N/a Moderate
(33) N/a Moderate
(33) N/a
Status (positive or negative)
Negative N/a Negative N/a Negative N/a Negative N/a
Reversibility Recoverable (3)
N/a Recoverable (3)
N/a Recoverable (3)
N/a Recoverable (3)
N/a
Irreplaceable loss of resources?
No N/a No N/a No N/a No N/a
Can impacts be mitigated?
No N/a No N/a No N/a No N/a
Mitigation: None. Cumulative impacts: The construction of the power line will increase the cumulative visual impact of electrical type infrastructure within the region. This is specifically relevant in light of the existing transmission power lines, distribution power lines, distribution substations (14) and transmission substations (2) present in the study area. Residual impacts: None. The visual impact of the power line will be removed after decommissioning. If the lines are not decomissioned and removed, then the impact will persist.

64
6.7.5.3 The Niewehoop Corridor The potential visual impact on protected and conservation areas (the Augrabies National Park and the Spitskop Nature Reserve) is expected to be of low significance for all Alternatives. No mitigation is possible. The table below illustrates this impact assessment. Table 6c: Impact table summarising the significance of visual impacts on conservation areas within the region: Niewehoop Corridor Nature of Impact: Potential visual impact on conservation areas within the region.
ALTERNATIVE N_1 ALTERNATIVE N_2 ALTERNATIVE N_3 No
mitigation Mitigation considered
No mitigation
Mitigation considered
No mitigation
Mitigation considered
Extent Regional (3) N/a Regional (3) N/a Regional (3) N/a Duration Long term (4) N/a Long term (4) N/a Long term (4) N/a Magnitude None (0) N/a None (0) N/a None (0) N/a Probability V Improbable
(1) N/a V Improbable
(1) N/a V Improbable
(1) N/a
Significance Low (7) N/a Low (7) N/a Low (7) N/a Status (positive or negative)
Negative N/a Negative N/a Negative N/a
Reversibility Recoverable (3)
N/a Recoverable (3)
N/a Recoverable (3)
N/a
Irreplaceable loss of resources?
No N/a No N/a No N/a
Can impacts be mitigated?
No N/a No N/a No N/a
Mitigation: None. Cumulative impacts: The construction of the power line will increase the cumulative visual impact of electrical type infrastructure within the region. This is specifically relevant in light of the existing transmission power lines, distribution power lines and distribution substations (3) present in the study area. Residual impacts: None. The visual impact of the power line will be removed after decommissioning. If the lines are not decomissioned and removed, then the impact will persist.

65
6.7.6 Potential visual impact of associated infrastructure on sensitive visual receptors in close proximity thereto The potential visual impact of associated infrastructure (i.e. distribution lines, substations, transformers, switchgear, access roads and cleared servitudes) on sensitive visual receptors. 6.7.6.1 The Aries Corridor Access roads will be required, firstly to construct the power line, and secondly to maintain it (operational phase). These access roads have the potential of manifesting as landscape scarring, and thus a potential visual impact within the viewshed areas. This is especially relevant for steep slopes where cut and fill may be required to render access possible in high lying areas and on steep slopes. Graded slopes could be vulnerable to erosion over time. This also represents a potential visual impact. No dedicated viewshed has been generated for the access roads, nor is a proposed layout available for each corridor. However, it is assumed, but that the area of potential visual exposure will lie within that of the power line. Substation upgrades along the Transmission Line corridor alignments will take place within the existing substation HV yards. Therefore associated visual impacts are likely to be limited in extent to that of the existing substations. There will therefore be no change in the existing impact. This assessment therefore excludes the proposed substation upgrades. The table overleaf illustrates the assessment of this anticipated impact, which is likely to be of moderate significance for all Alternatives. Mitigation can reduce the significance of impacts to low. Table 7a: Impact table summarising the significance of visual impact of associated infrastructure on sensitive visual receptors in close
proximity thereto: Aries Corridor Nature of Impact: Potential visual impact of associated infrastructure on sensitive visual receptors in close proximity thereto.
ALTERNATIVE A_1 ALTERNATIVE A_2 ALTERNATIVE A_3 No
mitigation Mitigation considered
No mitigation
Mitigation considered
No mitigation
Mitigation considered
Extent Local (4) Local (4) Local (4) Local (4) Local (4) Local (4) Duration Long term (4) Long term (4) Long term (4) Long term (4) Long term (4) Long term (4) Magnitude High (8) Moderate (6) High (8) Moderate (6) High (8) Moderate (6) Probability Probable (3) Improbable
(2) Probable (3) Improbable
(2) Probable (3) Improbable
(2)
Significance Moderate (48)
Low (28) Moderate (48)
Low (28) Moderate (48)
Low (28)
Status (positive or negative)
Negative Negative Negative Negative Negative Negative
Reversibility Recoverable (3)
Recoverable (3)
Recoverable (3)
Recoverable (3)
Recoverable (3)
Recoverable (3)

66
Irreplaceable loss of resources?
No No No No No No
Can impacts be mitigated?
No No No No No No
Mitigation: Planning: Plan wih due cognisance of topography; use existing roads / disturbed areas where possible; consolidate infrastructure where possible. Construction: rehabilitation of all construction areas, including servitudes. Operation: Mainteance of access roads and servitudes, and rehabilitation where required to avoid dust and erosion. Cumulative impacts: The construction of distribution lines, substations, transformers, switchgear, access roads and cleared servitudes will increase the cumulative visual impact of built, electrical and road type infrastructure within the region. Residual impacts: None. The visual impact of the power line will be removed after decommissioning. If the lines are not decomissioned and removed, then the impact will persist. 6.7.6.2 The Ferrum Corridor Table 7b: Impact table summarising the significance of visual impact of associated infrastructure on sensitive visual receptors in close
proximity thereto: Ferrum Corridor Nature of Impact: Potential visual impact of associated infrastructure on sensitive visual receptors in close proximity thereto.
ALTERNATIVE F_1 ALTERNATIVE F_2 ALTERNATIVE F_3 ALTERNATIVE F_4 No
mitigation Mitigation considered
No mitigation
Mitigation considered
No mitigation
Mitigation considered
No mitigation
Mitigation considered
Extent Local (4) Local (4) Local (4) Local (4) Local (4) Local (4) Local (4) Local (4) Duration Long term (4) Long term (4) Long term (4) Long term (4) Long term (4) Long term (4) Long term (4) Long term (4) Magnitude High (8) Moderate (6) High (8) Moderate (6) High (8) Moderate (6) High (8) Moderate (6) Probability Probable (3) Improbable
(2) Probable (3) Improbable
(2) Probable (3) Improbable
(2) Probable (3) Improbable
(2) Significance Moderate
(48) Low (28) Moderate
(48) Low (28) Moderate
(48) Low (28) Moderate
(48) Low (28)
Status (positive or negative)
Negative Negative Negative Negative Negative Negative Negative Negative
Reversibility Recoverable (3)
Recoverable (3)
Recoverable (3)
Recoverable (3)
Recoverable (3)
Recoverable (3)
Recoverable (3)
Recoverable (3)
Irreplaceable loss of resources?
No No No No No No No No
Can impacts be mitigated?
No No No No No No No No
Mitigation: Planning: Plan wih due cognisance of topography; use existing roads / disturbed areas where possible; consolidate infrastructure where possible. Construction: rehabilitation of all construction areas, including servitudes. Operation: Mainteance of access roads and servitudes, and rehabilitation where required to avoid dust and erosion.

67
Cumulative impacts: The construction of distribution lines, substations, transformers, switchgear, access roads and cleared servitudes will increase the cumulative visual impact of built, electrical and road type infrastructure within the region. Residual impacts: None. The visual impact of the power line will be removed after decommissioning. If the lines are not decomissioned and removed, then the impact will persist. 6.7.6.3 The Niewehoop Corridor Table 7c: Impact table summarising the significance of visual impact of associated infrastructure on sensitive visual receptors in close
proximity thereto: Niewehoop Corridor Nature of Impact: Potential visual impact of associated infrastructure on sensitive visual receptors in close proximity thereto.
ALTERNATIVE N_1 ALTERNATIVE N_2 ALTERNATIVE N_3 No
mitigation Mitigation considered
No mitigation
Mitigation considered
No mitigation
Mitigation considered
Extent Local (4) Local (4) Local (4) Local (4) Local (4) Local (4) Duration Long term (4) Long term (4) Long term (4) Long term (4) Long term (4) Long term (4) Magnitude High (8) Moderate (6) High (8) Moderate (6) High (8) Moderate (6) Probability Probable (3) Improbable
(2) Probable (3) Improbable
(2) Probable (3) Improbable
(2)
Significance Moderate (48)
Low (28) Moderate (48)
Low (28) Moderate (48)
Low (28)
Status (positive or negative)
Negative Negative Negative Negative Negative Negative
Reversibility Recoverable (3)
Recoverable (3)
Recoverable (3)
Recoverable (3)
Recoverable (3)
Recoverable (3)
Irreplaceable loss of resources?
No No No No No No
Can impacts be mitigated?
No No No No No No
Mitigation: Planning: Plan wih due cognisance of topography; use existing roads / disturbed areas where possible; consolidate infrastructure where possible. Construction: rehabilitation of all construction areas, including servitudes. Operation: Mainteance of access roads and servitudes, and rehabilitation where required to avoid dust and erosion. Cumulative impacts: The construction of distribution lines, substations, transformers, switchgear, access roads and cleared servitudes will increase the cumulative visual impact of built, electrical and road type infrastructure within the region. Residual impacts: None. The visual impact of the power line will be removed after decommissioning. If the lines are not decomissioned and removed, then the impact will persist.

68
6.7.7 Potential visual impact of construction on sensitive visual receptors in close proximity to the infrastructure 6.7.7.1 The Aries Corridor During the construction period, there will be an increase in heavy vehicles utilising the roads to the construction sites that may cause, at the very least, a visual nuisance to other road users and land owners in the area. Mitigation entails proper planning, management and rehabilitation of all construction sites to forego visual impacts. The table below illustrates the assessment of this anticipated impact, which is likely to be of moderate significance for all Alternatives, and may be mitigated to low. Table 8a: Impact table summarising the significance of visual impact of construction on visual receptors in close proximity to the
proposed infrastructure: Aries Corridor Nature of Impact: Potential visual impact of construction on visual receptors in close proximity to the infrastructure.
ALTERNATIVE A_1 ALTERNATIVE A_2 ALTERNATIVE A_3 No
mitigation Mitigation considered
No mitigation
Mitigation considered
No mitigation
Mitigation considered
Extent Local (4) Local (4) Local (4) Local (4) Local (4) Local (4) Duration Very short
term (1) Very short term (1)
Very short term (1)
Very short term (1)
Very short term (1)
Very short term (1)
Magnitude Moderate (6) Low (4) Moderate (6) Low (4) Moderate (6) Low (4) Probability High (4) Improbable
(2) High (4) Improbable
(2) High (4) Improbable
(2)
Significance Moderate (44)
Low (18) Moderate (44)
Low (18) Moderate (44)
Low (18)
Status (positive or negative)
Negative Negative Negative Negative Negative Negative
Reversibility Recoverable (3)
Recoverable (3)
Recoverable (3)
Recoverable (3)
Recoverable (3)
Recoverable (3)
Irreplaceable loss of resources?
No No No No No No
Can impacts be mitigated?
Yes Yes Yes Yes Yes Yes
Mitigation: Construction: Proper planning, management and rehabilitation of the construction sites Cumulative impacts: None. Residual impacts: None. 6.7.7.2 The Ferrum Corridor

69
Table 8b: Impact table summarising the significance of visual impact of construction on visual receptors in close proximity to the proposed infrastructure: Ferrum Corridor
Nature of Impact: Potential visual impact of construction on visual receptors in close proximity to the infrastructure.
ALTERNATIVE F_1 ALTERNATIVE F_2 ALTERNATIVE F_3 ALTERNATIVE F_4 No
mitigation Mitigation considered
No mitigation
Mitigation considered
No mitigation
Mitigation considered
No mitigation
Mitigation considered
Extent Local (4) Local (4) Local (4) Local (4) Local (4) Local (4) Local (4) Local (4) Duration Very short
term (1) Very short term (1)
Very short term (1)
Very short term (1)
Very short term (1)
Very short term (1)
Very short term (1)
Very short term (1)
Magnitude Moderate (6) Low (4) Moderate (6) Low (4) Moderate (6) Low (4) Moderate (6) Low (4) Probability High (4) Improbable
(2) High (4) Improbable
(2) High (4) Improbable
(2) High (4) Improbable
(2) Significance Moderate
(44) Low (18) Moderate
(44) Low (18) Moderate
(44) Low (18) Moderate
(44) Low (18)
Status (positive or negative)
Negative Negative Negative Negative Negative Negative Negative Negative
Reversibility Recoverable (3)
Recoverable (3)
Recoverable (3)
Recoverable (3)
Recoverable (3)
Recoverable (3)
Recoverable (3)
Recoverable (3)
Irreplaceable loss of resources?
No No No No No No No No
Can impacts be mitigated?
Yes Yes Yes Yes Yes Yes Yes Yes
Mitigation: Construction: Proper planning, management and rehabilitation of the construction sites Cumulative impacts: None. Residual impacts: None. 6.7.7.3 The Niewehoop Corridor Table 8c: Impact table summarising the significance of visual impact of construction on visual receptors in close proximity to the
proposed infrastructure: Niewehoop Corridor Nature of Impact: Potential visual impact of construction on visual receptors in close proximity to the infrastructure.
ALTERNATIVE N_1 ALTERNATIVE N_2 ALTERNATIVE N_3 No
mitigation Mitigation considered
No mitigation
Mitigation considered
No mitigation
Mitigation considered
Extent Local (4) Local (4) Local (4) Local (4) Local (4) Local (4) Duration Very short
term (1) Very short term (1)
Very short term (1)
Very short term (1)
Very short term (1)
Very short term (1)
Magnitude Moderate (6) Low (4) Moderate (6) Low (4) Moderate (6) Low (4)

70
Probability High (4) Improbable (2)
High (4) Improbable (2)
High (4) Improbable (2)
Significance Moderate (44)
Low (18) Moderate (44)
Low (18) Moderate (44)
Low (18)
Status (positive or negative)
Negative Negative Negative Negative Negative Negative
Reversibility Recoverable (3)
Recoverable (3)
Recoverable (3)
Recoverable (3)
Recoverable (3)
Recoverable (3)
Irreplaceable loss of resources?
No No No No No No
Can impacts be mitigated?
Yes Yes Yes Yes Yes Yes Yes Yes
Mitigation: Construction: Proper planning, management and rehabilitation of the construction sites Cumulative impacts: None. Residual impacts: None. 6.7.8 Potential visual impact on scenic and visually sensitive topographical features within the region. The visibility of the Transmission Lines to, and potential visual impact on scenic and visually sensitive topographical features (i.e. rivers and mountains). 6.7.8.1 The Aries Corridor The nature of the mountainous terrain is such that it offers some degree of visual absorption, but it is also sensitive to visual intrusion. The mountainous part of the study are also some of the most scenic, and the construction of a power line within such areas will constitute a visual impact, rendered more significant due to the sensitive nature of the natural features. Similarly, visual impact on the rivers of the region will be significant. The anticipated visual impact of the power line on the scenic and sensitive mountains and rivers of the study area is expected to be of moderate significance for all Alternatives. There is no mitigation for this impact. The table below illustrates the assessment of this anticipated impact. Note: The length of the section traversing mountainous areas influences the probability rating for each of the alternatives. Table 9a: Impact table summarising the significance of visual impacts on scenic and visually sensitive topographic features within the
region: Aries Corridor Nature of Impact: Potential visual impact on scenic and visually sensitive topographic features within the region.

71
ALTERNATIVE A_1 ALTERNATIVE A_2 ALTERNATIVE A_3 No
mitigation Mitigation considered
No mitigation Mitigation considered
No mitigation
Mitigation considered
Extent Regional (3) N/a Regional (3) N/a Regional (3) N/a Duration Long term (4) N/a Long term (4) N/a Long term (4) N/a Magnitude V High (10) N/a V High (10) N/a V High (10) N/a Probability Probable (3) N/a Improbable (2) N/a Probable (3) N/a Significance Moderate
(51) N/a Moderate (34) N/a Moderate
(51) N/a
Status (positive or negative)
Negative N/a Negative N/a Negative N/a
Reversibility Recoverable (3)
N/a Recoverable (3)
N/a Recoverable (3)
N/a
Irreplaceable loss of resources?
No N/a No N/a No N/a
Can impacts be mitigated?
No N/a No N/a No N/a
Mitigation: None. Cumulative impacts: The construction of the power line will increase the cumulative visual impact of electrical type infrastructure within the region. This is specifically relevant in light of the existing transmission power lines, distribution power lines, distribution substations (5) and transmission substations (1) present in the study area. Residual impacts: None. The visual impact of the power line will be removed after decommissioning. If the lines are not decomissioned and removed, then the impact will persist. 6.7.8.2 The Ferrum Corridor Table 9b: Impact table summarising the significance of visual impacts on scenic and visually sensitive topographic features within the
region: Ferrum Corridor Nature of Impact: Potential visual impact on scenic and visually sensitive topographic features within the region.
ALTERNATIVE F_1 ALTERNATIVE F_2 ALTERNATIVE F_3 ALTERNATIVE F_3 alt No
mitigation Mitigation considered
No mitigation Mitigation considered
No mitigation
Mitigation considered
No mitigation Mitigation considered
Extent Regional (3) N/a Regional (3) N/a Regional (3) N/a Regional (3) N/a Duration Long term (4) N/a Long term (4) N/a Long term (4) N/a Long term (4) N/a Magnitude V High (10) N/a V High (10) N/a V High (10) N/a V High (10) N/a Probability Probable (3) N/a Improbable (2) N/a Probable (3) N/a Improbable (2) N/a Significance Moderate
(51) N/a Moderate (34) N/a Moderate
(51) N/a Moderate (34) N/a
Status (positive or negative)
Negative N/a Negative N/a Negative N/a Negative N/a
Reversibility Recoverable N/a Recoverable N/a Recoverable N/a Recoverable N/a
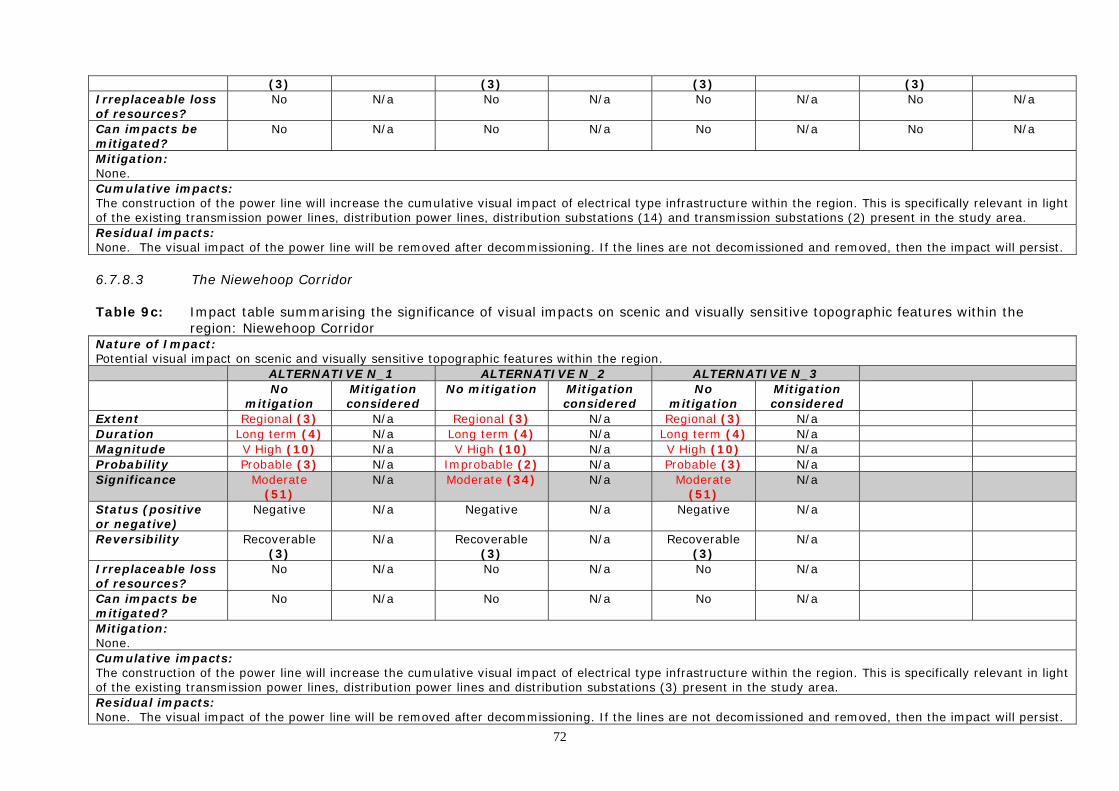
72
(3) (3) (3) (3) Irreplaceable loss of resources?
No N/a No N/a No N/a No N/a
Can impacts be mitigated?
No N/a No N/a No N/a No N/a
Mitigation: None. Cumulative impacts: The construction of the power line will increase the cumulative visual impact of electrical type infrastructure within the region. This is specifically relevant in light of the existing transmission power lines, distribution power lines, distribution substations (14) and transmission substations (2) present in the study area. Residual impacts: None. The visual impact of the power line will be removed after decommissioning. If the lines are not decomissioned and removed, then the impact will persist. 6.7.8.3 The Niewehoop Corridor Table 9c: Impact table summarising the significance of visual impacts on scenic and visually sensitive topographic features within the
region: Niewehoop Corridor Nature of Impact: Potential visual impact on scenic and visually sensitive topographic features within the region.
ALTERNATIVE N_1 ALTERNATIVE N_2 ALTERNATIVE N_3 No
mitigation Mitigation considered
No mitigation Mitigation considered
No mitigation
Mitigation considered
Extent Regional (3) N/a Regional (3) N/a Regional (3) N/a Duration Long term (4) N/a Long term (4) N/a Long term (4) N/a Magnitude V High (10) N/a V High (10) N/a V High (10) N/a Probability Probable (3) N/a Improbable (2) N/a Probable (3) N/a Significance Moderate
(51) N/a Moderate (34) N/a Moderate
(51) N/a
Status (positive or negative)
Negative N/a Negative N/a Negative N/a
Reversibility Recoverable (3)
N/a Recoverable (3)
N/a Recoverable (3)
N/a
Irreplaceable loss of resources?
No N/a No N/a No N/a
Can impacts be mitigated?
No N/a No N/a No N/a
Mitigation: None. Cumulative impacts: The construction of the power line will increase the cumulative visual impact of electrical type infrastructure within the region. This is specifically relevant in light of the existing transmission power lines, distribution power lines and distribution substations (3) present in the study area. Residual impacts: None. The visual impact of the power line will be removed after decommissioning. If the lines are not decomissioned and removed, then the impact will persist.

73
6.8 Visual impact assessment: secondary impacts 6.8.1 Potential visual impact on the visual character and sense of place of the region. Sense of place refers to a unique experience of an environment by a user, based on his or her cognitive experience of the place. Visual criteria, and specifically the visual character of an area (informed by a combination of aspects such as topography, level of development, vegetation, noteworthy features, cultural / historical features, etc) play a significant role. A visual impact on the sense of place is one that alters the visual landscape to such an extent that the user experiences the environment differently, and more specifically, in a less appealing or less positive light. Specific aspects contributing to the sense of place of this region include the rugged, undeveloped nature of the area, the wide open vistas and the scenic beauty of the landscape and the mountains. As this is a desktop study, no site visit has been undertaken. In this respect, the visual character and sense of place of the region cannot be assessed. These assessments may be undertaken at a later stage of the EIA process, following a site visit. 6.8.2 Potential visual impact on tourist access routes and tourist destinations within the region. The potential impact of the Transmission Lines on tourism, with specific reference to tourist access routes (i.e. the N14, N10, R27, R360, R325 and R359) and tourist destinations (i.e. attractions and accommodation). 6.8.2.1 The Aries Corridor The greater region is generally seen as having a high scenic value. The N14 is a primary tourist access route linking Gauteng with the Namaqualand and Springbok, while the N7 links Springbok with Cape Town. The arterial R382 and the R355 roads offer scenic drives through Namaqualand, especially where these traverse the escarpment. In this respect, the Spektakel Pass, located on the R555 some 25km west of Springbok (affected by Alternative 1) and the Nonaams and Anenous Pass, some 15km west of Steinkopf on the R382 (affected by Alternatives 2, 3 and 4) are of relevance. In addition to their scenic offering, both these routes are primary access roads linking the N7 with Kleinzee and Port Nolloth respectively, and thus carry both commuters and tourists. The Namaqualand area is already a known tourist destination, specifically in terms of eco-tourism. The annual Namaqualand flower displays are a world renowned attraction.

74
During the flower season, a number of secondary roads are favoured by tourists. These include the road to the east of the N7 running from Okiep to Steinkopf and from Okiep via Concordia to the Orange River. Other roads include those linking the R382 with Eksteenfontein and Lekkersing in the Richtersveld. The latter roads are also used by the Richtersveld Community and visitors to the Richtersveld National Park and thus represent alternative access routes for many tourists. Visual intrusion through the development of industrial type infrastructure within this environment could affect the area’s tourism value and potential. The anticipated visual impact of the power lines on existing tourist routes, as well as on the tourism value and potential of the region is expected to be of high significance for Alternative 1 and of moderate significance for Alternatives 2, 3 and 4. There is no mitigation for this impact. The table overleaf illustrates the assessment of this anticipated impact. Notes:
• The magnitude of impact on tourist access routes, scenic drives and passes influences the magnitude rating used in the assessment of this impact.
• The frequency of exposure to major and secondary roads that are recognised tourist access routes and scenic drives (based on the frequency of occurrence beyond a 500m offset) influences the probability rating for each of the alternatives.
Table 10a: Impact table summarising the significance of visual impacts on tourist access routes and tourist destinations within the
region: Aries Corridor Nature of Impact: Potential visual impact on tourist access routes and tourist destinations within the region.
ALTERNATIVE A_1 ALTERNATIVE A_2 ALTERNATIVE A_3 No
mitigation Mitigation considered
No mitigation
Mitigation considered
No mitigation
Mitigation considered
Extent Regional (3) N/a Regional (3) N/a Regional (3) N/a Duration Long term (4) N/a Long term (4) N/a Long term (4) N/a Magnitude Very High
(10) N/a Very High
(10) N/a Very High
(10) N/a
Probability High (4) N/a Probable (3) N/a Improbable (2)
N/a
Significance High (68) N/a Moderate (51)
N/a Moderate (34)
N/a
Status (positive or negative)
Negative N/a Negative N/a Negative N/a
Reversibility Recoverable (3)
N/a Recoverable (3)
N/a Recoverable (3)
N/a
Irreplaceable loss of resources?
No N/a No N/a No N/a

75
Can impacts be mitigated?
No N/a No N/a No N/a
Mitigation: None. Cumulative impacts: The construction of the power line will increase the cumulative visual impact of electrical type infrastructure within the region. This is specifically relevant in light of the existing transmission power lines, distribution power lines, distribution substations (5) and transmission substations (1) present in the study area. Residual impacts: None. The visual impact of the power line will be removed after decommissioning. If the lines are not decomissioned and removed, then the impact will persist. 6.8.2.2 The Ferrum Corridor Table 10b: Impact table summarising the significance of visual impacts on tourist access routes and tourist destinations within the
region: Ferrum Corridor Nature of Impact: Potential visual impact on tourist access routes and tourist destinations within the region.
ALTERNATIVE F_1 ALTERNATIVE F_2 ALTERNATIVE F_3 ALTERNATIVE F_3 alt No
mitigation Mitigation considered
No mitigation
Mitigation considered
No mitigation
Mitigation considered
No mitigation
Mitigation considered
Extent Regional (3) N/a Regional (3) N/a Regional (3) N/a Regional (3) N/a Duration Long term (4) N/a Long term (4) N/a Long term (4) N/a Long term (4) N/a Magnitude Very High
(10) N/a Very High
(10) N/a Very High
(10) N/a Very High
(10) N/a
Probability High (4) N/a Probable (3) N/a Improbable (2)
N/a Probable (3) N/a
Significance High (68) N/a Moderate (51)
N/a Moderate (34)
N/a Moderate (51)
N/a
Status (positive or negative)
Negative N/a Negative N/a Negative N/a Negative N/a
Reversibility Recoverable (3)
N/a Recoverable (3)
N/a Recoverable (3)
N/a Recoverable (3)
N/a
Irreplaceable loss of resources?
No N/a No N/a No N/a No N/a
Can impacts be mitigated?
No N/a No N/a No N/a No N/a
Mitigation: None. Cumulative impacts: The construction of the power line will increase the cumulative visual impact of electrical type infrastructure within the region. This is specifically relevant in light of the existing transmission power lines, distribution power lines, distribution substations (14) and transmission substations (2) present in the study area.

76
Residual impacts: None. The visual impact of the power line will be removed after decommissioning. If the lines are not decomissioned and removed, then the impact will persist. 6.8.2.3 The Niewehoop Corridor Table 10c: Impact table summarising the significance of visual impacts on tourist access routes and tourist destinations within the
region: Niewehoop Corridor Nature of Impact: Potential visual impact on tourist access routes and tourist destinations within the region.
ALTERNATIVE N_1 ALTERNATIVE N_2 ALTERNATIVE N_3 No
mitigation Mitigation considered
No mitigation
Mitigation considered
No mitigation
Mitigation considered
Extent Regional (3) N/a Regional (3) N/a Regional (3) N/a Duration Long term (4) N/a Long term (4) N/a Long term (4) N/a Magnitude Very High
(10) N/a Very High
(10) N/a Very High
(10) N/a
Probability High (4) N/a Probable (3) N/a Improbable (2)
N/a
Significance High (68) N/a Moderate (51)
N/a Moderate (34)
N/a
Status (positive or negative)
Negative N/a Negative N/a Negative N/a
Reversibility Recoverable (3)
N/a Recoverable (3)
N/a Recoverable (3)
N/a
Irreplaceable loss of resources?
No N/a No N/a No N/a
Can impacts be mitigated?
No N/a No N/a No N/a
Mitigation: None. Cumulative impacts: The construction of the power line will increase the cumulative visual impact of electrical type infrastructure within the region. This is specifically relevant in light of the existing transmission power lines, distribution power lines and distribution substations (3) present in the study area. Residual impacts: None. The visual impact of the power line will be removed after decommissioning. If the lines are not decomissioned and removed, then the impact will persist.

77
6.9. The potential to mitigate visual impacts
• The primary visual impact, namely the presence of the Transmission Lines, is not possible to mitigate.
• Mitigation of visual impacts associated with the construction of access roads is possible through the use of existing roads wherever possible. Where new roads are required to be constructed, these should be planned carefully, taking due cognisance of the local topography. Roads should be laid out along the contour wherever possible, and should never traverse slopes at 90 degrees. Construction of roads should be undertaken properly, with adequate drainage structures in place to forego potential erosion problems. Access roads which are not required post-construction should be ripped and rehabilitated.
• Consolidate infrastructure and make use of already disturbed sites rather than pristine areas wherever possible.
• Mitigation of visual impacts associated with the construction phase, albeit temporary, entails proper planning, management and rehabilitation of all construction sites. Construction should be managed according to the following principles:
o Ensure that vegetation is not unnecessarily cleared or removed during
the construction period. o Reduce the construction period through careful logistical planning and
productive implementation of resources. o Plan the placement of lay-down areas and any potential temporary
construction camps along the corridor in order to minimise vegetation clearing.
o Restrict the activities and movement of construction workers and vehicles to the immediate construction site and existing access roads.
o Ensure that rubble, litter, and disused construction materials are appropriately stored (if not removed daily) and then disposed regularly at licensed waste facilities.
o Reduce and control construction dust through the use of approved dust suppression techniques as and when required (i.e. whenever dust becomes apparent).
o Restrict construction activities to daylight hours in order to negate or reduce the visual impacts associated with lighting.
o Ensure that all infrastructure and the site and general surrounds are maintained and kept neat.
o Rehabilitate all disturbed areas, construction areas, roads, slopes etc immediately after the completion of construction works. If necessary, an ecologist should be consulted to assist or give input into rehabilitation specifications.
• Secondary impacts anticipated as a result of the proposed Transmission
Lines (i.e. impacts on tourist access routes and tourist destinations) are not possible to mitigate.
• After decommissioning, all infrastructure should be removed and all
disturbed areas appropriately rehabilitated.

78
The possible mitigation of both primary and secondary visual impacts as listed above should be implemented and maintained on an ongoing basis.

79
7. COMPARATIVE ASSESSMENT OF THE ALTERNATIVES 7.1. Approach The scope of work undertaken in Chapter 5 has revealed much in terms of the anticipated nature and significance of the visual impacts likely to result from the three proposed Transmission Lines and their alternatives. This exercise was not sufficient, however to distinguish between and compare the alternatives for each Corridor from a visual perspective. In this respect, it is necessary to undertake a comparative assessment of the alternatives for eah Corridor according to relevant visual criteria. The aim of the assessment is to identify which alternative is most and least preferable for each Corridor. The following visual criteria are applied4:
• The length of the proposed transmission line corridor. The longer the alignment, the greater the visual impact, and therefore the less desirable the alternative.
• The exposure to major roads (national and arterial), based on the
frequency of road crossings and / or the proximity of these roads within a 500m offset (i.e. along the length of the corridor). The greater the exposure, the greater the visual impact, and therefore the less desirable the alternative.
• The exposure to secondary roads, based on the frequency of road
crossings and / or the proximity of these roads within a 500m offset (i.e. along the length of the corridor). The greater the exposure, the greater the visual impact, and therefore the less desirable the alternative.
• The exposure to urban centres and built up areas (i.e. Upington,
Kakamas and Kathu) within a 2km offset. • The exposure to farmsteads and settlements based on the frequency of
occurrence within a 2km offset. The higher the number of farmsteads and settlements, the greater the number of visual receptors, and therefore the less desirable the alternative.
• The exposure to conservation and protected areas within a 2km offset. • The exposure to scenic and sensitive topographical features, specifically
hills, mountains and drainage lines. The greater the exposure to hills, maintains and drainage lines, the greater the visual impact, and therefore the less desirable the alternative.
• The proximity of existing power lines and roads along the alignment. It
may be argued that the presence of an existing visual impact will ‘absorb’ the potential visual impact of the power line to some extent. The concentration of linear infrastructure within this environment is considered preferable, as it localises the cumulative extent of potential visual impact. The shorter the section of alignment adjacent to existing power line
4 It is important to note that none of these criteria should be viewed in isolation, as all are relevant in the comparison between alternatives. It is the actual comparison of the alternatives making use of these criteria (included as the tables as follows) that is of importance.

80
infrastructure, the greater the visual impact, and therefore the less desirable the alternative.
• The significance of potential visual impacts on tourism (i.e. tourist access
routes and tourist destinations) within the region. The greater the exposure to identified tourist routes and destinations, the greater the visual impact, and therefore the less desirable the alternative.
The sections which follow address the application of the above criteria to each of the three Corridors and their alternatives. Weighted values have been used, with higher values indicating a high visual impact and low values indicating a low visual impact. The sum of accumulated values gives an indication of which Alternative is likely to have the greatest visual impact. The Alternative with the highest total is the least desirable, while that with the lowest is the preferred option from a visual perspective. 7.2. Comparative Visual Assesment: Aries Corridor Alternatives Table 11a: Comparative visual assessment of the Aries Corridor Alternatives
CRITERIA ALTERNATIVE A_1
ALTERNATIVE A_2
ALTERNATIVE A_3
Total length 3 (131km)
2 (121km)
1 (114km)
Major roads 1 (N14, R359)
1 (N14, R359)
2 (N14, R359,
R27)
Secondary roads 2 (5)
2 (5)
1 (3)
Urban centres 0 0 1 (Keimoes)
Settlements 1 (low to mod)
2 (mod)
3 (mod to high)
Protected areas 0 0 0 Mountains and drainage lines
2 (low hills, 9 streams)
3 (low hills, 10
streams)
1 (no hills, 7 streams)
Existing infrastructure
1 (short
stretches)
2 (none)
2 (none)
Tourism 1 (N14, R359)
1 (N14, R359)
2 (N14, R359,
R27)
TOTAL 11 13 13 Overall, considering all relevant criteria, Alternative A_1 is considered preferable from a visual perspective. 7.3. Comparative Visual Assesment: Ferrum Corridor Alternatives Table 11b: Comparative visual assessment of the Ferrum Corridor Alternatives
CRITERIA ALTERNATIVE F_1
ALTERNATIVE F_2
ALTERNATIVE F_3
ALTERNATIVE F_3 Alt
Total length 2 (252km)
1 (248km)
4 (282km)
3 (270km)
Major roads 1 (N10, N14,
R360, R380)
1 (N10, N14,
R360, R380)
2 (N10, N14,
R360, R380)
3 (N10, N14,
R360, R380)

81
Secondary roads 1 (13)
2 (17)
2 (19)
1 (15)
Urban centres 1 (Kathu)
1 (Kathu)
1 (Kathu)
1 (Kathu)
Settlements 1 (mod-high)
1 (mod-high)
1 (mod-high)
1 (mod-high)
Protected areas 1 (Spitskop NR)
1 (Spitskop NR)
1 (Spitskop NR)
1 (Spitskop NR)
Mountains and drainage lines
3 (Koranaberg, 4
streams)
1 (low hills, 6 streams)
2 (low hills, 6
streams, Orange)
4 (Koranaberg, 6
streams, Orange)
Existing infrastructure
3 (short stretch)
4 (none)
2 (road &
powerline)
1 (road &
powerline) Tourism 1
(N10, N14, R360, R380)
1 (N10, N14,
R360, R380)
2 (N10, N14,
R360, R380)
3 (N10, N14,
R360, R380) TOTAL 14 13 17 18 Overall, considering all relevant criteria, Alternative F_2 is considered preferable from a visual perspective. 7.4. Comparative Visual Assesment: Niewehoop Corridor Alternatives Table 11c: Comparative visual assessment of the Niewehoop Corridor
Alternatives CRITERIA ALTERNATIVE
N_1 ALTERNATIVE
N_2 ALTERNATIVE
N_3
Total length 3 (73km)
2 (63km)
2 (67km)
Major roads 2 (N14, R359)
1 (N14, R359)
1 (N14, R359)
Secondary roads 1 (3)
1 (3)
1 (3)
Urban centres 0 0 0 Settlements 1
(mod) 1
(mod) 1
(mod)
Protected areas 0 0 0 Mountains and drainage lines
3 (7 streams)
1 (5 streams)
2 (6 streams)
Existing infrastructure
2 (none)
2 (none)
1 (secondary
road)
Tourism 2 (N14, R359)
1 (N14, R359)
1 (N14, R359)
TOTAL 14 9 9 Overall, considering all relevant criteria, Alternatives N_2 and N_3 are considered preferable from a visual perspective. 8. CONCLUSION AND RECOMMENDATIONS The construction and operation of the proposed Aggeneis-Oranjemond 400kV Power Line and its associated infrastructure will have a visual impact on the scenic resources of this region. The power line infrastructure will be visible within an area that is generally seen as having a high quality natural and scenic landscape and a resultant tourism value and potential. The infrastructure would thus be visible within an area that
82
incorporates various sensitive visual receptors who would consider visual exposure to this type of infrastructure to be intrusive. The mountainous area leading up to and making up the escarpment is of particular scenic beauty, and the proposed power line is expected to transform the natural character of these ridges for the entire operational phase of the infrastructure. In addition, the tourism and heritage value of the region must not be overlooked, specifically its location within Namaqualand, the Richtersveld Cultural and Botanical Landscape World Heritage Site and the tentatively listed Namaqualand Copper Mining Landscape World Heriatage Site. There are not many options as to the mitigation of the visual impact of the power lines. The infrastructure spans hundreds of kilometres and no amount of vegetation screening or landscaping would be able to hide structures of these dimensions. In term of the Alternatives, all four alternative alignments will be visually exposed to large areas within their respective 2000m offsets. This is due to the tall (35m) transmission line infrastructure associated with 400kV power lines. In addition, all four alternatives tend to display an even potential exposure pattern where they traverse flat terrain and more scattered patterns where they encounter elevated topography. Alternatives 2, 3 and 4 cross fewer roads and mountains, and are shorter than Alternative 1. They also have a reduced number of potentially sensitive receptors. Alternative 1 is likely to have the highest visual impact on tourism routes, destinations and potential, while Alternative 3 is expected to have the lowest. Overall, considering all relevant criteria, Alternative 4 is considered the preferred alternative, and is recommended from a visual perspective. The following (as detailed in section 5.9) is also recommended:
• Mitigate secondary visual impacts associated with the construction of roads by using existing roads wherever possible. Where new roads are required, these should be planned carefully, taking due cognisance of the topography. Roads should be laid out along the contour wherever possible, and should never traverse slopes at 90 degrees. Construction of roads should be undertaken properly, with adequate drainage structures in place to forego potential erosion problems. Access roads which are not required post-construction or later, post-decommissioning should be ripped and rehabilitated.
• Mitigate visual impacts associated with the construction phase, albeit temporary, through proper planning, management and rehabilitation of all construction sites.
• After decommissioning, all infrastructure should be removed and all disturbed areas appropriately rehabilitated.
9. IMPACT STATEMENT In light of the results and findings of the Visual Impact Assessment undertaken for the proposed Aggeneis-Oranjemond 400kV Power Line, it is acknowledged

83
that the natural and relatively unspoiled wide-open views adjacent to the power line alignment will be transformed for the entire operational lifespan of the infrastructure. The following is a summary of impacts remaining, assuming Alternative 4 is selected, as mitigation as recommended is exercised:
• The potential visual impact of the infrastructure on users of national, arterial and secondary roads in close proximity to the proposed infrastructure will be of moderate significance.
• The anticipated visual impact on residents of settlements and homesteads in close proximity to the proposed infrastructure will be of high significance.
• Within the greater region, the potential visual impact on sensitive visual receptors (i.e. residents of settlements and homesteads) will be of low significance.
• In terms of access roads, the anticipated visual impact will be of low significance.
• Similarly, the visual impact of construction is also expected to be of low significance.
• In terms of secondary visual impacts, the significance of the anticipated impact on the visual character and sense of place of the region will be of low significance.
• Potential visual impacts on tourist routes, tourist destinations and tourism potential within the region will be of moderate significance.
• Potential visual impact on the declared and tentatively listed World Heritage Sites within the region will be of low significance.
• Lastly, the visual impact on sensitive topographic features within the region will be of moderate significance.
The anticipated visual impacts listed above (i.e. post mitigation impacts) are not considered to be fatal flaws from a visual perspective, especially considering the very low occurrence of visual receptors along alignment Alternative 4. Furthermore, it is the opinion of the author that the anticipated visual impact is not likely to detract from the regional tourism appeal, numbers of tourists travelling along the N7, N14 or R355, and it is unlikely that the infrastructure will be visible from many tourist and heritage destinations. It is therefore recommended that the development of the power line as proposed (i.e. Alternative 4) be supported, subject to the implementation of the recommended mitigation measures (section 5.9) and management actions (Chapter 9). 10. MANAGEMENT PROGRAMME The management programme tables aim to summarise the key findings of the visual impact report and to suggest possible management actions in order to mitigate the potential visual impacts. The tables are applicable to all three Transmission Line Corridors.
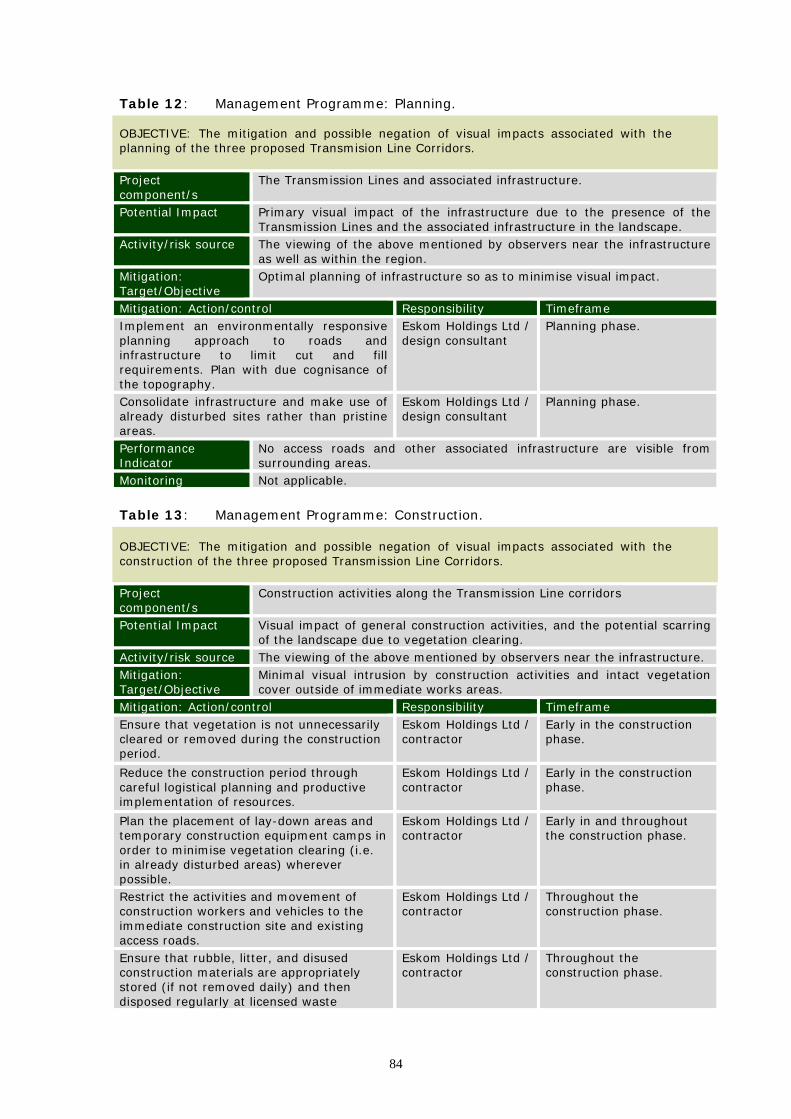
84
Table 12: Management Programme: Planning. OBJECTIVE: The mitigation and possible negation of visual impacts associated with the planning of the three proposed Transmision Line Corridors. Project component/s
The Transmission Lines and associated infrastructure.
Potential Impact Primary visual impact of the infrastructure due to the presence of the Transmission Lines and the associated infrastructure in the landscape.
Activity/risk source The viewing of the above mentioned by observers near the infrastructure as well as within the region.
Mitigation: Target/Objective
Optimal planning of infrastructure so as to minimise visual impact.
Mitigation: Action/control Responsibility Timeframe Implement an environmentally responsive planning approach to roads and infrastructure to limit cut and fill requirements. Plan with due cognisance of the topography.
Eskom Holdings Ltd / design consultant
Planning phase.
Consolidate infrastructure and make use of already disturbed sites rather than pristine areas.
Eskom Holdings Ltd / design consultant
Planning phase.
Performance Indicator
No access roads and other associated infrastructure are visible from surrounding areas.
Monitoring Not applicable.
Table 13: Management Programme: Construction. OBJECTIVE: The mitigation and possible negation of visual impacts associated with the construction of the three proposed Transmission Line Corridors. Project component/s
Construction activities along the Transmission Line corridors
Potential Impact Visual impact of general construction activities, and the potential scarring of the landscape due to vegetation clearing.
Activity/risk source The viewing of the above mentioned by observers near the infrastructure. Mitigation: Target/Objective
Minimal visual intrusion by construction activities and intact vegetation cover outside of immediate works areas.
Mitigation: Action/control Responsibility Timeframe Ensure that vegetation is not unnecessarily cleared or removed during the construction period.
Eskom Holdings Ltd / contractor
Early in the construction phase.
Reduce the construction period through careful logistical planning and productive implementation of resources.
Eskom Holdings Ltd / contractor
Early in the construction phase.
Plan the placement of lay-down areas and temporary construction equipment camps in order to minimise vegetation clearing (i.e. in already disturbed areas) wherever possible.
Eskom Holdings Ltd / contractor
Early in and throughout the construction phase.
Restrict the activities and movement of construction workers and vehicles to the immediate construction site and existing access roads.
Eskom Holdings Ltd / contractor
Throughout the construction phase.
Ensure that rubble, litter, and disused construction materials are appropriately stored (if not removed daily) and then disposed regularly at licensed waste
Eskom Holdings Ltd / contractor
Throughout the construction phase.

85
facilities. Reduce and control construction dust through the use of approved dust suppression techniques as and when required (i.e. whenever dust becomes apparent).
Eskom Holdings Ltd / contractor
Throughout the construction phase.
Restrict construction activities to daylight hours in order to negate or reduce the visual impacts associated with lighting.
Eskom Holdings Ltd / contractor
Throughout the construction phase.
Rehabilitate all disturbed areas, construction areas, servitudes etc immediately after the completion of construction works. Consult an ecologist to give input into rehabilitation specifications.
Eskom Holdings Ltd / contractor
Throughout and at the end of the construction phase.
Performance Indicator
Vegetation cover within the servitudes and in the vicinity of the infrastructure is intact with no evidence of degradation or erosion.
Monitoring Monitoring of vegetation clearing during construction. Monitoring of rehabilitated areas post construction.
Table 14: Management Programme: Operation. OBJECTIVE: The mitigation and possible negation of visual impacts associated with the operation of the three proposed Transmission Line Corridors. Project component/s
Transmission Lines and associated infrastructure.
Potential Impact Visual impact of vegetation rehabilitation failure. Activity/risk source The viewing of the above mentioned by observers near the infrastructure. Mitigation: Target/Objective
Well rehabilitated and maintained servitudes.
Mitigation: Action/control Responsibility Timeframe Maintain roads to forego erosion and to suppress dust.
Eskom Holdings Ltd / operator
Throughout the operational phase.
Monitor rehabilitated areas, and implement remedial action as and when required.
Eskom Holdings Ltd / operator
Throughout the operational phase.
Performance Indicator
Intact vegetation within servitudes and in the vicinity of the infrastructure.
Monitoring Monitoring of rehabilitated areas.
Table 15: Management Programme: Decommissioning. OBJECTIVE: The mitigation and possible negation of visual impacts associated with the decommissioning of the three proposed Transmission Line Corridors. Project component/s
Transmission Lines corridors.
Potential Impact Visual impact of residual visual scarring and vegetation rehabilitation failure.
Activity/risk source The viewing of the above mentioned by observers along or near the corridors.
Mitigation: Target/Objective
Rehabilitated vegetation in all disturbed areas.
Mitigation: Action/control Responsibility Timeframe Remove infrastructure not required for the post-decommissioning use of the sites.
Eskom Holdings Ltd / operator
During the decommissioning phase.
Rehabilitate access roads and servitudes not required for the post-decommissioning
Eskom Holdings Ltd / operator
During the decommissioning phase.

86
use of the sites. Consult an ecologist to give input into rehabilitation specifications. Monitor rehabilitated areas quarterly for at least a year following decommissioning, and implement remedial action as and when required.
Eskom Holdings Ltd / operator
Post decommissioning.
Performance Indicator
Intact vegetation along and in the vicinity of the corridors.
Monitoring Monitoring of rehabilitated areas.

87
10. REFERENCES/DATA SOURCES Aco Associates. 2011. Heritage Impact Assessment: Proposed Aggeneis-Oranjemond 400kv Line and Substations Upgrade, Northern Cape Province. Unpublished document. Chief Director of Surveys and Mapping, varying dates. 1:50 000 Topo-cadastral maps and digital data. CSIR/ARC, 2000. National Land-cover Database 2000 (NLC 2000) DEADP, Provincial Government of the Western Cape, 2011. Guideline on Generic Terms of Reference for EAPS and Project Schedules Department of Environmental Affairs and Tourism (DEA&T), 2001. Environmental Potential Atlas (ENPAT) for the Northern Cape Province National Botanical Institute (NBI), 2004. Vegetation Map of South Africa, Lesotho and Swaziland (Unpublished Beta Version 3.0) Oberholzer, B. (2005). Guideline for involving visual and aesthetic specialists in EIA processes: Edition 1. The Environmental Impact Assessment Amendment Regulations. In Government Gazette Nr 33306, 18 June 2010.