Subsidies in the Energy Sector: An Overview · fob free on board G‐20 Group of Twenty Finance...
115
Subsidies in the Energy Sector: An Overview Background Paper for the World Bank Group Energy Sector Strategy July 2010
Transcript of Subsidies in the Energy Sector: An Overview · fob free on board G‐20 Group of Twenty Finance...

Subsidies in the Energy Sector: An Overview
Background Paper for the World Bank Group Energy Sector Strategy
July 2010
2
Table of Contents
Acknowledgments ......................................................................................................................................... 5
Abbreviations ................................................................................................................................................ 6
Executive Summary ....................................................................................................................................... 7
Content of the paper ................................................................................................................................ 8
Concept of an Energy Subsidy ............................................................................................................... 8
Measurement of Subsidies ................................................................................................................... 9
Channels through Which Energy Subsidies Affect the Economy .......................................................... 9
Incidence of Consumer Subsidies and Policies to Ameliorate the Effects of Their Removal ............. 10
Objectives of Subsidy‐Related Policies ............................................................................................... 11
Strategy of Subsidy Reform ................................................................................................................. 11
Conclusions and Suggestions for Future Work ....................................................................................... 13
Background ................................................................................................................................................. 15
Concept of an Energy Subsidy ..................................................................................................................... 19
Forms of Energy Subsidies ...................................................................................................................... 19
Financing a Subsidy ................................................................................................................................. 22
Measurement of Subsidies ......................................................................................................................... 24
Traded sources of energy .................................................................................................................... 28
Non‐traded sources of energy ............................................................................................................ 32
Energy Subsidies and the Economy ............................................................................................................ 37
Macroeconomic Impacts from Subsidies: Overall Picture ...................................................................... 37
Sectors of Economic Activity ................................................................................................................... 38
Government Accounts ............................................................................................................................ 39
Balance of Payments and Trade.............................................................................................................. 39
Partial Equilibrium Analysis: Comparative Statics .................................................................................. 40
General Equilibrium Analysis .................................................................................................................. 41
Empirical Studies of the Impacts of Energy Subsidies on the Macro‐economy ..................................... 43
Empirical Studies on the Link between Energy Subsidies and Global Greenhouse Gas Emissions ........ 45
Incidence of Consumer Subsidies and Policies to Ameliorate the Effects of their Removal ...................... 47
Benefit Incidence, Beneficiary Incidence, and Materiality ..................................................................... 47
Electricity Tariffs and Incidence .......................................................................................................... 49

3
Electricity Connection Subsidies and Incidence .................................................................................. 50
Petroleum Products Prices and Incidence .......................................................................................... 50
Policy Tools to Protect the Poor ............................................................................................................. 52
Patterns of Household Expenditure on Energy ....................................................................................... 54
The Effect of Subsidy Removal on Households ....................................................................................... 59
Changing the Level of Subsidy .................................................................................................................... 63
Objectives of the Subsidy ........................................................................................................................ 63
What to Subsidize ................................................................................................................................... 69
Whom to Subsidize ................................................................................................................................. 72
What Subsidy Mechanism to Use ........................................................................................................... 75
Framework for Analyzing Whether to Introduce, Retain, Redesign, or Remove a Subsidy ................... 79
Step one .............................................................................................................................................. 80
Question 1 (impact test) ..................................................................................................................... 81
Step two .............................................................................................................................................. 81
Question 2 (cost‐effectiveness test) ................................................................................................... 81
Question 3 (global externalities test) .................................................................................................. 82
Question 4 (priority of objective test) ................................................................................................ 82
Strategy of Subsidy Reform ......................................................................................................................... 84
Some case studies of energy sector subsidy reform .......................................................................... 89
Concluding Observations ............................................................................................................................ 97
Annex A: Supplementary tables .................................................................................................................. 99
Annex B: Energy Sectors in the Economy ................................................................................................. 105
Annex C: Structure of a Social Accounting Matrix .................................................................................... 106
Annex D: IMF’s Classification of Government Expenditures .................................................................... 107
References ................................................................................................................................................ 108
Boxes
Box 1: The IMF Government Finance Statistics Definition of Subsidies ..................................................... 21
Box 2: WTO’s Definition of Subsidies .......................................................................................................... 22
Box 3: Calculating the reference price for steam coal in China as an exporter .......................................... 31
Box 4: Subsidy Reform and Civil Unrest ...................................................................................................... 85

4
Box 5: Communicating a Tariff Increase ..................................................................................................... 88
Box 6: Reducing Petroleum Product Subsidies: the Case of Jordan ........................................................... 90
Box 7: Reducing Petroleum Product Subsidies: the Case of Indonesia ...................................................... 91
Box 8: Reducing Petroleum Product Subsidies: The Case of Ghana ........................................................... 92
Box 9: Reducing Electricity Subsidies: The Case of Armenia....................................................................... 93
Box 10: Removing Power Sector Subsidies in Conjunction with Wider Sector Reform: Some Latin
American Experience ..................................................................................................................... 94
Box 11: Reducing Electricity Subsidies: The Case of Kenya ........................................................................ 95
Figures
Figure 1: Share of Targeted Funds Reaching the Lowest Quartile of the Population ................................. 53
Figure 2: Schematic Approach to Assessing Energy Subsidies .................................................................... 80
Tables
Table 1: Common Forms of Government Interventions in Energy Markets ............................................... 20
Table 2: Overview of Subsidy Measurement Approaches .......................................................................... 26
Table 3: Percentage Shares of Cost Components in Total Hidden Costs of Power for Eastern Europe and
Central Asia (2000–2003) and for Sub‐Saharan Africa (2001–2006) ............................................. 35
Table 4: Percentage Changes in Macro‐economic Variables in South Africa Resulting from an Oil Price
Shock .............................................................................................................................................. 44
Table 5: Benefit‐Targeting Performance for Electricity in Cape Verde ....................................................... 49
Table 6: Benefit‐targeting (Ω) and Exclusion (E) Indicators for Simulated Flat‐Rate Universal Subsidies
with Pan‐Territorial Pricing on Petroleum Products in Selected Countries ................................... 51
Table 7: Benefit‐targeting Performance of Utility Subsidies Relative to Other Targeting Instruments ..... 54
Table 8: Patterns of Energy Use from Selected Household Surveys (group 1) ........................................... 56
Table 9: Patterns of Energy Use from Selected Household Surveys (group 2) ........................................... 57
Table 10: Real Income Effects of Removing Energy Subsidies (percentage change in total expenditures)60
Table 11: Own Price Elasticities for Selected Countries ............................................................................. 61
Table A.1: Explicit and Implicit Petroleum Product Subsidies in Selected Countries in 2005 as a
Percentage of GDP ......................................................................................................................... 99
Table A.2: Hidden Costs in Power as a Percentage of GDP in Eastern Europe and Central Asia .............. 100
Table A.3: Hidden Costs in Natural Gas as a Percentage of GDP in Eastern Europe and Central Asia ..... 100
Table A.4: Hidden Costs in Power as a Percentage of GDP in Sub‐Saharan Africa (average 2001–2006) 101
Table A.5: Subsidy Targeting Indicators for the Electricity Sector for Various Countries ......................... 101
Table A.6: Shares of Electricity in Total Household Expenditure of Lowest and Highest Quintile Groups
..................................................................................................................................................... 102
Table A.7: Shares of Expenditure on Energy by National Quintile Groups (all households) .................... 103
Table A.8: Percentage of All Households Using Different Energy Sources (connected) ........................... 104
5
Acknowledgments
This background paper was prepared by Robert Bacon, Eduardo Ley, and Masami Kojima, with
contributions from Leonardo Garrido, all of the World Bank. It was prepared under the guidance of
Jamal Saghir, Director of the World Bank’s Energy, Transport, and Water Department. The paper drew
on background work, led by Maria Vagliasindi, for the World Bank’s contribution to the “Analysis of the
Scope of Energy Subsidies and Suggestions for the Implementation of Their Phasing Out,” a joint report
of the International Energy Agency, the Organization of Petroleum Exporting Countries, the Organisation
for Economic Co‐operation and Development, and the World Bank for the June 26–27, 2010, G‐20
Summit Meeting in Toronto.
The paper also benefitted from the comments provided by Edgardo Favaro, Marianne Fay, Mohinder
Gulati, Bjorn Hamso, Michael Levitsky, Kseniya Lvovsky, Lucio Monari, Demetrios Papathanasiou,
Michael Toman, Maria Vagliasindi, Tjaarda Storm Van Leeuwen, and Ruslan Yemstov all of the World
Bank, and Antonio Estache of Université Libre de Bruxelles.
The paper was funded in part by the Energy Sector Management Assistance Program (ESMAP).
1
1The findings, interpretations, and conclusions expressed in this paper are entirely those of the authors and should not be attributed in any manner to the World Bank or its affiliated organizations, or to members of its Board Executive Directors or the governments they represent. The World Bank does not guarantee the accuracy of the data included in this work and accepts no responsibility whatsoever for any consequence of their use.

6
Abbreviations
cif cost, insurance, and freight
CGE computable general equilibrium
CO2 carbon dioxide
ECA Europe and Central Asia
EEA European Environment Agency
fob free on board
G‐20 Group of Twenty Finance Ministers and Central Bank Governors
GDP gross domestic product
GFS Government Finance Statistics
GHG greenhouse gas
IEA International Energy Agency
IMF International Monetary Fund
ISIC international standard industrial classification
kWh kilowatt hour
LPG liquefied petroleum gas
OECD Organisation for Economic Co‐operation and Development
OPEC Organization of Petroleum Exporting Countries
PSIA poverty and social impact analysis
RMSM revised minimum standard model
RMSM‐X extended revised minimum standard model
SAM social accounting matrix
SITC standard international trade classification
SSA Sub‐Saharan Africa
UN United Nations
UNEP United Nations Environment Programme
USAID United States Agency for International Development
WTO World Trade Organisation
All dollar amounts are U.S. dollars unless otherwise stated.
7
Subsidies in the Energy Sector: An Overview
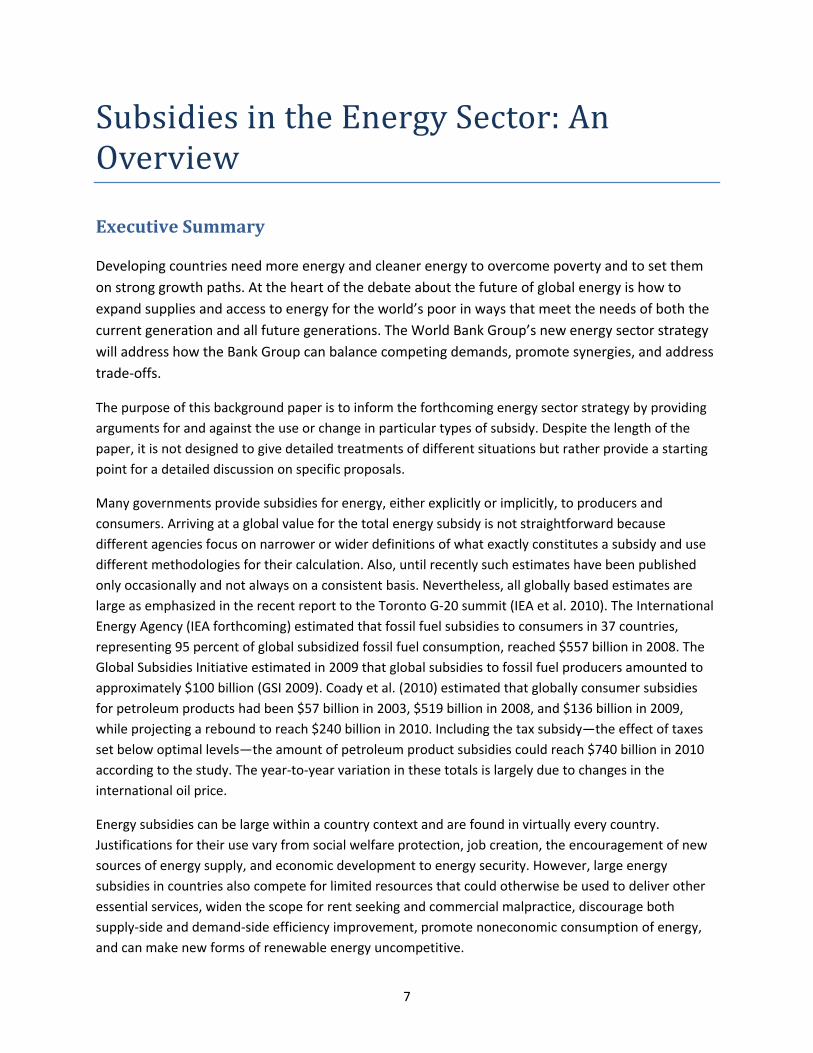
Executive Summary
Developing countries need more energy and cleaner energy to overcome poverty and to set them
on strong growth paths. At the heart of the debate about the future of global energy is how to
expand supplies and access to energy for the world’s poor in ways that meet the needs of both the
current generation and all future generations. The World Bank Group’s new energy sector strategy
will address how the Bank Group can balance competing demands, promote synergies, and address
trade‐offs.
The purpose of this background paper is to inform the forthcoming energy sector strategy by providing
arguments for and against the use or change in particular types of subsidy. Despite the length of the
paper, it is not designed to give detailed treatments of different situations but rather provide a starting
point for a detailed discussion on specific proposals.
Many governments provide subsidies for energy, either explicitly or implicitly, to producers and
consumers. Arriving at a global value for the total energy subsidy is not straightforward because
different agencies focus on narrower or wider definitions of what exactly constitutes a subsidy and use
different methodologies for their calculation. Also, until recently such estimates have been published
only occasionally and not always on a consistent basis. Nevertheless, all globally based estimates are
large as emphasized in the recent report to the Toronto G‐20 summit (IEA et al. 2010). The International
Energy Agency (IEA forthcoming) estimated that fossil fuel subsidies to consumers in 37 countries,
representing 95 percent of global subsidized fossil fuel consumption, reached $557 billion in 2008. The
Global Subsidies Initiative estimated in 2009 that global subsidies to fossil fuel producers amounted to
approximately $100 billion (GSI 2009). Coady et al. (2010) estimated that globally consumer subsidies
for petroleum products had been $57 billion in 2003, $519 billion in 2008, and $136 billion in 2009,
while projecting a rebound to reach $240 billion in 2010. Including the tax subsidy—the effect of taxes
set below optimal levels—the amount of petroleum product subsidies could reach $740 billion in 2010
according to the study. The year‐to‐year variation in these totals is largely due to changes in the
international oil price.
Energy subsidies can be large within a country context and are found in virtually every country.
Justifications for their use vary from social welfare protection, job creation, the encouragement of new
sources of energy supply, and economic development to energy security. However, large energy
subsidies in countries also compete for limited resources that could otherwise be used to deliver other
essential services, widen the scope for rent seeking and commercial malpractice, discourage both
supply‐side and demand‐side efficiency improvement, promote noneconomic consumption of energy,
and can make new forms of renewable energy uncompetitive.

8
Concerns about the effects of energy subsidies in increasing energy demand in developed and
developing countries with large energy consumption and high per capita emissions have been
heightened in recent years against the backdrop of to the debate on how to address climate change
caused by greenhouse gas (GHG) emissions, to which the combustion of fossil fuels is the largest
contributor. The communiqué following the G‐20 summit in Toronto2 recognized the complexity of
these issues, as had been explained in the joint report of the International Energy Agency (IEA), the
Organization of Petroleum Exporting Countries, OECD, and the World Bank (2010) on the scope of
energy subsidies.
Content of the paper
This paper provides an overview of issues relating to energy subsidies in developing countries arranged
into six broad topics:
1. An overview of the concept of a subsidy, where they arise, how they are financed, and whom
they affect
2. A description of a simple and practical methodology for measuring energy consumer subsidies
for a wide range of developing countries at successive time intervals, and a review of cross‐
country studies measuring energy subsidies
3. A review of the channels through which subsidy reform affects the economy
4. A review of the literature on the incidence of existing consumer subsidies and of their reduction
or removal on households, their distributional benefits, and an investigation of the effectiveness
of social safety nets and/or targeted subsidies as an alternative to universal subsidies
5. A discussion of arguments for and against creating, retaining, reducing, or removing subsidies,
and replacing universal subsidies with targeted subsidies.
6. The strategy of subsidy reform
Concept of an Energy Subsidy
A number of approaches to the definition of a subsidy are reviewed, and for the purposes of this paper a
working definition is taken to include policies that decrease energy prices or production costs through
some form of unrequited value transfer to economic agents. A number of government interventions
that have this subsidy effect are presented. The financing of subsidies can take place in a number of
ways and the paper explains the differences between explicit subsidies, implicit subsidies, cross‐
subsidies, and tax‐subsidies.
2 http://g20.gc.ca/toronto‐summit/summit‐documents/the‐g‐20‐toronto‐summit‐declaration/

9
Measurement of Subsidies
The financial cost of subsidies funded directly out of the government budget can be measured precisely.
However, even for these interventions, their economic impact needs to be estimated. An additional
problem is to agree on the list of policies that constitute subsidies, and it is noteworthy that not even
the European Union has been able to agree on a standardized list of energy subsidies.
A practical approach to the measurement of consumer subsidies that can be applied to almost any
country is the so‐called price gap approach. It identifies the gap between the actual price charged and
the reference price for that particular form of energy. The difference is the subsidy per unit sold and
may be financed either explicitly or implicitly. The reference price is calculated differently in the case of
traded and non‐traded forms of energy. In the former case the reference price is based on the
international price (adjusted for transport costs and quality differentials), applicable particularly to oil,
natural gas, and, to a lesser extent, coal. Where an energy source is not traded—most commonly with
electricity, followed by coal, and lastly by natural gas—the reference price has to be calculated from
assumptions on what would be the cost of domestic supply for an efficiently run firm. For oil exporting
countries that face production quotas, the reference price may be lower than the international price and
is the higher of the marginal cost of supply and the discounted value of an additional barrel of
unproduced oil. The hidden‐cost calculator is able to split the difference between the reference price
and the actual price into three components: underpricing (setting the price below the level that would
be charged by an efficiently run firm in a liberalized market), unaccounted losses (due to theft and
excessive technical losses), and collection failure (due to failure to send out bills or to enforce their
payment). In Sub‐Saharan Africa, one third of the losses to power utilities that have to be covered by
explicit or implicit subsidies arise from the latter two components, indicating that these need policy
attention as well as the level of power tariffs. Both the price gap and hidden‐cost method have been
applied to a number of countries and are capable of further extension to other countries and through a
wider definition of the costs of an efficient utility.
Channels through Which Energy Subsidies Affect the Economy
Energy subsidies have a variety of aggregate impacts on the economy. The macroeconomic effects
include government accounts, the balance of payments, the long‐run growth potential of the economy,
and the degree of energy intensity of capital investment. Partial equilibrium analysis of the effect of
energy subsidies emphasizes the deadweight losses that occur within the sector where the subsidies
apply, including an allowance for the presence of externalities. General equilibrium analysis goes beyond
this to evaluate the spillover effects into other markets that are themselves affected by the presence of
the energy subsidy. A number of studies using computable general equilibrium models have evaluated
the impacts of reducing or removing energy subsidies, mainly applied to single countries. These
generated estimates of the change in the level of output of the economy, and of use of different energy
sources. These studies were conducted along rather different lines and used different assumptions so
that a unified approach to modeling the global effect of reducing energy subsidies does not yet appear
to have been established. A group of such studies applied general equilibrium modeling to large energy
consumers in order to estimate how reducing energy subsidies affect energy demand and the economy.

10
A further group of studies applied global modeling to analyze the relation between global energy
subsidies and associated GHG emissions, taking into account the magnitude of energy subsidies, energy
demand, and income levels. By varying the assumptions on the policies followed by different groups of
countries, it is possible to use such models to investigate the likely impact of different international
agreements on global emissions.
Incidence of Consumer Subsidies and Policies to Ameliorate the Effects of Their Removal
The social performance of an energy subsidy scheme can be evaluated through three dimensions:
Benefit incidence (how well the subsidy targets benefits to poor households as opposed to
other households)
Beneficiary incidence (what proportion of poor households as a whole receive the subsidy)
Materiality (how significant is the amount of subsidy received by poor households).
Benefit incidence can be shown to be determined by the product of five factors, two—the share of
connected households that receive the subsidy and the average rate of subsidization for eligible
households—of which are design factors that can be varied to ensure a more pro‐poor design. A number
of studies have measured these indicators for subsidies in the power sector, and have also simulated the
effects of changing the form in which the subsidy is given. Incremental block tariffs (lifeline tariffs) tend
to be regressive because benefits are given to all groups irrespective of income. Volume differentiated
tariffs tend to be more progressive. Depending on how the roll‐out of new connections is made,
connection subsidies can be strongly progressive. In countries with low connection rates, those with
connection tend to be mainly better‐off households and mirroring existing users (largely through a
densification approach) is likely to be regressive. A roll‐out that is based on extending connections to
areas that do not already have access is likely to be more progressive. A simulation of benefit‐targeting
for petroleum products suggests that subsidies for gasoline, diesel, and liquefied petroleum gas (LPG)
are likely to be regressive, particularly in low‐income countries, because the poor do not consume these
fuels directly. Subsidies for kerosene could be equity‐neutral or even progressive if only fuel
consumption by households is considered. The case for subsidizing kerosene, however, is weakened by
the ability to use it to adulterate diesel fuel, leading to major diversion away from the poor and towards
the better‐off.
Household expenditure surveys can be used to examine the pattern of expenditure on different forms of
energy by household income level. The findings, in turn, can provide evidence on where energy
subsidies are likely to benefit the poor most, and where they will tend to provide most benefit to the
better‐off. Reviews of a number of studies confirm that certain patterns are widely found. The share of
household expenditure tends to rise with income for gasoline, diesel, and LPG, while the share of
expenditure on kerosene declines with income. The share of expenditure on electricity does not show
uniform variation with income but differs by country. A few studies have gone beyond looking at the
potential direct effects of subsidy removal on household welfare and have estimated the indirect effects
coming through the increase in prices of other goods caused by the initial increase in energy prices.

11
These studies found that the indirect effects are important and in some cases are more important than
the direct effects.
A further refinement in estimating the welfare impacts of changing energy prices on households would
need to incorporate both own‐ and cross‐price elasticities of demand. A recent study suggests that these
are low in developing countries, so that calculating changes in household welfare based on the
assumption of no change in quantity purchased will be a reasonable approximation. At the same time
low values of these price elasticities suggest that to achieve a large reduction in GHG emissions as a
result of price changes may require a large change in energy prices.
Objectives of SubsidyRelated Policies
In considering whether to create, retain, reduce, or remove an energy subsidy, governments have to
consider a number of questions:
What are the objectives of the subsidy?
What activities should be subsidized?
Who should be subsidized?
What subsidy mechanism should be used?
The objectives of the subsidy may include supporting the poor and improving equity, achieving energy
security, correcting for externalities, and supporting domestic production and the associated
employment. A major concern with all these goals is how to make the policies time‐bound. Without
some predetermined threshold for phasing out such subsidies, these goals can lead to a permanent
fiscal burden for the government that is incommensurate with the benefits from achieving the stated
purposes of the subsidies.
The government also has to consider exactly what should be subsidized. Possibilities include affordable
and reliable energy supplies, clean sources of energy, infant industry producers of energy, innovative
forms of energy supply, or investment in energy efficiency. The subsidies can range from universal
subsidies, subsidies targeted to the poor, subsidies to rural or remote communities, and subsidies to
particular industries or firms.
Having identified the objective of a change in subsidy, the possible group to be targeted, and the form of
energy to be subsidized, governments have a wide range of techniques for implementing the policy.
Each type of subsidy has advantages and disadvantages and they need to be balanced against each
other before a design choice is made.
For a proposal to introduce or change a subsidy, a framework for analyzing the proposal is sketched,
consisting of a sequence of questions and calculations.
Strategy of Subsidy Reform
There have been many attempts to reduce or remove energy subsidies. Such attempts have at times led
to extensive public protest and policy reversal in the form of cancellation or reduction of the planned

12
price increases, particularly when a strategy of communication and an associated method of protection
for key sectors of society were not put in place. A few governments have managed to implement large
price increases and reduce subsidies, even if not on a permanent basis. These cases have certain
common features that point to strategies for other governments to consider. Some key strategies that
emerge from this review include the following:
1. Subsidy reform appears to be possible in situations where the explicit or implicit fiscal
costs to the government are so large that the government feels it must act. This
strengthens the political willpower, without which little can be achieved.
2. Increasing the availability and transparency of energy subsidy data is essential in
overcoming some of the challenges related to reform. This can encourage an informed
discussion and debate regarding the subsidies and government policies toward them.
3. Efforts should be made to provide targeted assistance to vulnerable groups, such as
lower‐income households who will be adversely affected by subsidy changes.
Compensation needs to be visible and sufficiently material to offset a good part of the
adverse effect in the early years of the change. Consideration should be given to
alternative policy tools to protect the poor, such as cash and non‐cash transfers, and, for
electricity, district heating, or natural gas, lifeline rates or volume differentiated tariffs.
Subsidies for connection charges can also be targeted to the poor, but may need to be
limited in countries where the connection rate is low.
4. The credibility of the government’s plan to compensate vulnerable groups is important for
public acceptance, as is its plan to use the funds freed from subsidy reform for social and
economic benefits.
5. A well‐organized publicity campaign is essential. Governments can reduce uncertainty and
persuade the public that the effects will not be as deleterious as might otherwise be
feared by explaining, before the changes are introduced, the need for change and the
compensating measures that will be implemented.
6. Using a household expenditure survey to provide information on those benefiting from
the existing subsidy and the potential effects of subsidy removal on various groups
provides an important reference for assessing the adequacy of compensation measures
that are planned.
7. An election may provide a window of opportunity to make bold changes, because a new
government may initially enjoy a period of greater credibility and legitimacy than the old
government that failed to tackle the problem. This suggests that incoming governments
need to start preparation beforehand to be able to move early in their term in office.
8. Improving the quality of service ahead of increasing prices lends credibility and increases
the willingness to pay higher prices. This is particularly true for energy distributed through
networkselectricity, district heating, and natural gas where the quality of service may
be low, possibly because of the financing difficulties caused by subsidies. Steps such as
improving bill collection and making the metering system more effective may allow other
changes to be introduced that could be linked to the general tariff increases required to
reduce the fiscal burden further.

13
9. Use of transitional arrangements that are phased out as household energy use increases
over time can act to protect low‐income groups at the time of the policy change.
Conclusions and Suggestions for Future Work
Energy sector subsidies are large and widespread in both developed and developing countries.
Consumer subsidies are particularly prominent in many developing countries. Petroleum product
subsidies are known to be substantial in certain cases, especially in some major oil‐exporting countries.
Power sector subsidies that result from underpricing, excessive losses, and bill collection failure are
common in those developing countries for which detailed investigations have been conducted.
However, more systematic information is needed to give a comprehensive picture.
While subsidies can have benefits in terms of support for the poor, job creation, industry protection, or
energy security, they also carry costs. These can include fiscal costs and effects on the balance of
payments, growth, and global externalities. In particular, in economies with large energy consumption,
the extra demand for energy induced by the lower consumer prices can work against energy security
and have global effects by possibly raising prices on the world market by increasing demand (in the case
of widely traded fuels) and through higher GHG emissions resulting from consumption of more fossil
fuels.
In the light of these costs to their economy it is important that governments design their subsidy
scheme so as to achieve the desired benefits with the lowest overall costs. Some broad findings of this
review suggest several points for consideration:
Gasoline, diesel, and LPG subsidies are weakly targeted to the poor, particularly in low‐income
countries.
Kerosene subsidies may be targeted to the poor through their direct effects, but the leakage to
better‐off households, commercial establishments, and the transport sector arising from the
ease of adulterating diesel fuel with kerosene means that the subsidies’ pro‐poor benefits may
be limited.
Electricity subsidies resulting from excessive losses or failure to collect bills do not have
economic justification and should be actively reduced.
Electricity subsidies through generalized underpricing are likely to be regressive, and much
better targeting may be achieved through a careful design of the tariff structure. Volume
differentiated tariffs appear to perform much better in this respect than increasing block tariffs.
Subsidies to connection charges for electricity can be designed to be strongly progressive, but
their substantial cost per household requires an investigation into the lowest cost method of
supply as well as comparative assessment of other options to help the poor.
Cross‐subsidies for tariffs and for connection charges between different classes of users can be
an important instrument, but are of limited use where overall connection rates are very low.
Social safety nets can provide a more effective way of reaching the poor while controlling public
expenditure. However, they require a strong administration.
14
Because energy subsidies can result in a large fiscal burden, all subsidy schemes should consider
the inclusion of natural phaseout provisions. This can help to reduce the expectation of a
permanent subsidy that can be very difficult to combat at the time a government feels the need
to reduce the fiscal burden. However, some subsidy schemes may be designed to be permanent,
such as cross‐subsidies between different groups of consumers (such as urban households cross‐
subsidizing rural households for whom costs of electricity supply can be markedly higher).
Transparency is important. Proper accounting and public awareness of which groups benefit
from subsidies, by how much, and the cost is essential to evaluate government policies.
Subsidies to support a switch from fossil fuels to renewable energy need to be carefully planned
and to consider the inclusion of natural phase‐out provisions.
Because of the potential cost of a subsidy scheme and of the different performance of alternative
schemes, a full evaluation of costs and benefits should be made before making any changes to the
status quo. Governments that have rushed subsidy reform without preparing the population for the
changes, and without providing targeted support to particularly disadvantaged groups, have often had
to reverse the policy in the face of widespread opposition.
In compiling this overview of the role of different forms of subsidies, arguments for their retention or
removal, and the problems of removal, it has become evident that there is a need for some further work
of a more focused nature. First, a more systematic analysis of the political economy of retaining or
removing subsidies to the various forms of energy would be valuable. Second, refining the discussion of
policy options and best practices by a typology of countries (for example, energy exporting or importing,
high or low electricity access etc.) would provide a useful tool for those considering the role of energy
subsidies in a particular country. Third, some examples of applying the framework for deciding on a
particular subsidy change would provide valuable insights in how to deal with an individual case.

15
Background
Developing and developed country governments alike provide subsidies for energy, either explicitly or
implicitly, to producers, consumers, or both. Arriving at a global value for the total energy subsidy is not
straightforward because different agencies use varying definitions of what exactly constitutes a subsidy
and use different methodologies for their calculation. Nevertheless, all globally based estimates are
large, as emphasized by the recent report to the G‐20 summit in Toronto (IEA et al. 2010). The IEA
(forthcoming) estimated that fossil fuel subsidies to consumers in 37 countries, representing 95 percent
of global subsidized fossil fuel consumption, reached $557 billion in 2008.3 The Global Subsidies
Initiative estimated in 2009 that global subsidies to fossil fuel producers amounted to approximately
$100 billion (GSI 2009). Coady et al. (2010) estimated that globally consumer subsidies for petroleum
products had been $57 billion in 2003, $519 billion in 2008, and $136 billion in 2009, while projecting a
rebound to reach $240 billion in 2010.4 Including the tax subsidy—the effect of taxes set below optimal
levels—the study estimated that the amount of petroleum product subsidies could reach $740 billion in
2010. The year‐to‐year variation in these totals is largely due to changes in the international oil price
that affects the level of countries’ subsidies.
Justifications for the use of energy subsidies vary from social welfare protection, job creation, the
encouragement of new sources of energy supply, and economic development to energy security.
However, large energy subsidies in countries also compete for limited resources that could otherwise be
used to deliver other essential services, widen the scope for rent seeking and commercial malpractice,
discourage both supply‐side and demand‐side efficiency improvement, promote noneconomic
consumption of energy, and can make new forms of renewable energy uncompetitive.
Concerns about the possibly adverse effects of energy subsidies in countries with large energy
consumption and high per capita emissions have been heightened in recent years against the backdrop
of to the debate on how to address climate change caused by greenhouse gas (GHG) emissions, to which
the combustion of fossil fuels is the largest contributor. In this context Spence (2009) and the
Commission on Growth and Development (2008) have pointed to the benefits to individual economies
of reducing or eliminating energy subsidies in improving growth prospects, while also contributing to a
reduction in energy use (increased energy security) and hence a reduction in GHG emissions. The G‐20
announced at Pittsburgh in September 2009 that its member countries would work to phase out
wasteful energy subsidies in the medium term, as a contribution to reducing the growth of GHG
emissions. Globally, the IEA estimates that removing all fossil fuel subsidies would lead to a reduction in
demand for fossil fuels that would translate into a 10 percent reduction in the level of carbon dioxide
(CO2) emissions by 2050. However, untargeted energy consumer subsidies—the most common type of
subsidies in developing countries—while generally regressive, are politically difficult to phase out. The
G‐20 finance ministers subsequently called upon the IEA, the Organization of Petroleum Exporting 3 Figures for earlier years calculated on the same basis and for the same countries are not presently available but will be published in World Energy Outlook 2010 (IEA forthcoming).
4 The sample covers countries accounting for approximately 99 percent of world gross domestic product.
16
Countries (OPEC), OECD, and the World Bank to produce a joint report on energy subsidies, focusing in
particular on how to identify and phase out wasteful fossil fuel subsidies while protecting the poor (IEA
et al. 2010).
In low‐income countries, reducing the growth of GHG emissions is not seen at this time as a critical
driver for reducing subsidies on fossil fuel using activities or for providing financial incentives for
renewable energy. These policies should be undertaken for a variety of reasons, focusing particularly on
improving growth and equity. Over time, as countries’ incomes grow they may wish to shift their
priorities toward slowing down the growth of emissions, and eventually to their stabilization. At that
stage of their development the use of subsidies and of taxes on energy could increasingly reflect their
concern with these external effects.
In the context of the World Bank’s work, a recent Independent Evaluation Group report “Climate
Change and the World Bank Group. Phase 1—An Evaluation of World Bank Win‐Win Energy Policy
Reforms” (2008) recommended the following:
Systematically promote the removal of energy subsidies, easing political economy and social
concerns by providing technical assistance and policy advice to help reforming countries find
effective solutions, and analytical work demonstrating the cost and distributional impact of
removal of such subsidies and of building effective, broad‐based safety nets.
Many governments acknowledge the need to rationalize certain of their energy subsidies. The World
Bank is often asked to provide, particularly in respect of fuel prices, price structures in other countries in
the region and benchmark prices. Comparison of subsidies across countries on a common basis would
also help gain a better understanding of the impact of subsidies on consumption and on the economy.
Equally useful are lessons from subsidy removal by typology of countries.
Quantification of subsidies is difficult, because direct cash transfers to producers and consumers are but
one way of delivering subsidies. Other forms of subsidies are less transparent, including tax reductions,
exemptions, credits, rebates, and other tax benefits such as accelerated depreciation; cross‐subsidies
across different consumer categories; subsidized loans and other forms of assistance provided to
producers or the industry (including financing research and development); price caps benefitting
consumers; trade restrictions and consumption targets or mandates that benefit producers; limits on
market access; and forgone income from selling below economic opportunity costs, particularly
common in countries that are large net oil exporters. There is no widely accepted definition of, or
methodology for calculating, subsidies and no harmonized reporting mechanism exists even in such a
unified market as the European Union.
Data on energy subsidies in developing countries have not been systematically collected, but data
collection and policy analysis have been carried out as the need arises. Larsen and Shah (1992)
estimated fossil fuel subsidies for 13 developing countries, while the IEA (1999) quantified energy
subsidies in 8 large developing economies, and provided estimates for 37 non‐OECD countries in World
Energy Outlook 2009 (IEA 2009). These studies focused mainly on the global effects via induced energy
consumption and the resulting emissions from it. With a focus on the impacts on individual economies,

17
the International Monetary Fund (IMF 2008, 2010) has collected information in certain countries on
fossil fuel price subsidies and tax reductions in the last few years, but such data collection has not been
carried out on a regular basis. For many other developing countries there has been no systematic
estimation of the magnitude of energy subsidies.
An important practical issue for individual governments and policy makers is then the quantification of
the extent of energy subsidies. There is a large literature on subsidy measurement, linked to the various
approaches to identifying which policies constitute a subsidy. In an analysis of approaches to measuring
subsidies, Koplow (2009), in looking at the global impact of fossil fuel subsidies, concluded that the so‐
called price‐gap—the difference between the opportunity cost of the energy source and the domestic
market price—approach to measuring subsidies, although underestimating the total magnitude of fossil
fuel subsidies, is a basic tool for measurement, and should be collected annually for all major fossil fuel
producing and consuming countries.
Although the removal of subsidies can improve countries’ fiscal and macroeconomic performance and
lead to reduced energy consumption and hence reduced emissions, some users of energy will face
higher prices. Household will face higher energy costs for those energy sources that they purchase,
while intermediate users (factories, transport, etc.) facing higher costs on energy inputs may not be able
to pass all of these on to purchasers. Businesses in the tradable sector in particular are constrained by
international trade and may have to absorb some or all of the effects of energy subsidy removal. The
reduction in subsidies therefore can create a class of consumers who are adversely affected by the
change. There is then a balance of interest to consider between direct losers from subsidy reduction or
removal and the wider benefits accruing from an improved fiscal position. Governments have an
interest in two aspects of this issue: (1) the identification of those consumers who would be affected to
a greater or lesser extent by subsidy reduction, and (2) the development of offsetting policies to
mitigate the effects of subsidy removal on poor households or other groups of special concern.
Although subsidies for energy as a direct or indirect input can benefit all producing sectors, less
attention has been paid to this aspect. Where firms are unable to pass the cost of subsidy removal on to
consumers, then support may be given to selected producers to permit them to stay competitive. This is
generally in the form of a subsidy to the sector. In a few cases energy subsidies are actually used as a
means to support the viability of another sector. A leading example of this is where agriculture is
provided with subsidized electricity or diesel for pumping. Attempts to measure the impact of these
subsidies on the sector are complex and have rarely been undertaken. Infant industries in the energy
sector may also require initial subsidies in order to allow them to grow sufficiently to become self‐
sustaining.
The removal or reduction of large energy subsidies has not only a direct effect on households faced with
higher energy bills, but also a number of indirect effects. Higher energy prices can raise the costs of
transport that in turn increase the costs of travel (importantly the journey to work) and of the price of
retail goods. These indirect effects on the household cost of living can be as important as the direct
effects, as demonstrated in the study by Andriamihaja and Vecchi (2007) for Madagascar.

18
Beyond these cost‐of‐living effects are the macroeconomic effects caused by the shift of resources away
from households to the government, and the shift away from the demand for energy caused by the rise
in prices. The recognition of the ensuing changes in the fiscal balance, the balance of payments, terms of
trade for energy importers, and associated CO2 emissions are important for an understanding of the
implications of a policy to reduce subsidies.
There are circumstances in which it would be advantageous to reduce or remove energy subsidies, but
there are other circumstances when government policies may justify the introduction or retention of an
energy subsidy. Where a balance may be required between the macroeconomic benefits of subsidy
removal and the protection of consumers from higher prices, a limited use of targeted subsidies to
support certain groups of consumers can still reduce the fiscal costs and general negative effects of
universal subsidies. There are a number of alternative schemes for providing such assistance, ranging
from price discrimination approaches in electricity supply (either geographically, by amount of use, or
for the fixed costs of connection), to income‐based subsidies to identified groups of low‐income
households in order to mitigate the effects of the removal of subsidies to petroleum products.
An emerging area for the use and introduction of subsidies is the support of renewable energy and other
technologies that can be used to reduce local pollutant and GHG emissions by correcting for market
failure—local and global environmental externalities are at present poorly priced in virtually all
countries. Subsidies are proposed in the United States for promoting carbon capture and storage. Feed‐
in tariffs are used to encourage electricity generation from wind and solar power, and liquid biofuels
almost universally enjoy tax reductions, increasingly coupled with consumption mandates. These
measures are not always socially beneficial. The subsidies provided for liquid biofuels in the United
States and the European Union have been criticized for being misguided, as have the generous feed‐in
tariffs for solar energy in Germany. In countries with a genuine comparative advantage in alternative
energy, as in many developing countries, initial subsidies for alternative energy could be cost‐effective in
shifting the country to a more environmentally sustainable energy development path. Preliminary
estimates for 2007 (GSI 2010) indicate that global subsidies to nuclear energy were $45 billion, to
renewable energy (excluding hydro‐electricity and biomass) were $27 billion, and to biofuels were $20
billion.
The above background material indicates the complexity and importance of understanding the
justification for, and magnitude of, energy subsidies. This is true both at the level of individual countries
where the fiscal burden may be unsustainably large and the use of subsidies is deleterious to the
economy, and at the global level where the reduction of subsidies in large energy‐using economies
could make an important contribution to reducing the growth of GHG emissions. In summary, subsidies
are difficult to measure, difficult to assess, and difficult to eliminate. The paper provides an overview of
approaches that are helpful to appreciate these issues.
This paper is divided into six sections:
1. An overview of the concept of a subsidy, where they arise, how they are financed, and whom
they affect

19
2. A description of a simple and practical methodology for measuring energy consumer subsidies
for a wide range of developing countries at successive time intervals, and a review of cross‐
country studies measuring energy subsidies
3. A review of the channels through which subsidy reform affects the economy
4. A review of the literature on the incidence of existing consumer subsidies and of their reduction
or removal on households, their distributional benefits, and an investigation of the effectiveness
of social safety nets and/or targeted subsidies as an alternative to universal subsidies
5. A discussion of arguments for and against creating, retaining, reducing, or removing subsidies,
and replacing universal subsidies with targeted subsidies
6. The strategy of subsidy reform.
Concept of an Energy Subsidy
Subsidies can be considered from two different perspectives:
The determination of whether a subsidy exists
The method of financing the subsidy
The first of these is the key to measuring the magnitude of subsidies, and considerable efforts have been
made to provide a meaningful and usable definition. The second is of concern when measurement is to
be attempted.
Forms of Energy Subsidies
There have been many definitions of energy subsidies; a broad definition of subsidies encompasses all
forms of unrequited value transfer to economic agents (individuals, firms, or other institutions; public or
private), and whether in the form of cash transfer or any other form (Koplow 2004). Table 1 summarizes
the most common forms of government interventions in energy markets. “By modifying the rights and
responsibilities of various parties involved with the energy sector, these actions decrease (subsidize) or
increase (tax) either energy prices or production costs” (Koplow 2004).

20
Table 1: Common Forms of Government Interventions in Energy Markets
Intervention type Description
Natural resource access a Policies governing the terms of access to domestic onshore and offshore resources (e.g., leasing)
Cross‐subsidy a,b Policies that reduce costs to particular types of customers or regions by increasing charges to other customers or regions
Direct spending b Direct budgetary outlays for an energy‐related purpose
Government ownership b Government ownership of all or a significant part of an energy enterprise or a supporting service organization
Import/export restriction a Restrictions on the free market flow of energy products and services between countries
Information b Provision of market‐related information that would otherwise have to be purchased by private market participants
Lending b Below‐market provision of loans or loan guarantees for energy‐related activities
Price control a Direct regulation of wholesale or retail energy prices
Purchase requirements a Required purchase of particular energy commodities, such as domestic coal, regardless of whether other choices are more economically attractive
Research and development b Partial or full government funding for energy‐related research and development
Regulation a Government regulatory efforts that substantially alter the rights and responsibilities of various parties in energy markets or that exempt certain parties from those changes
Risk b Government‐provided insurance or indemnification at below‐market prices
Taxes b Special tax levies or exemptions for energy‐related activities Source: Koplow 2004.
a. Can act either as a subsidy or as a tax depending on program specifics and one's position in the market place. b. Interventions included within the realm of fiscal subsidies.
Koplow’s (2004) definition and classification appears to be useful for analyzing behavioral changes in
agents resulting from a given energy‐related policy, and how these changes transmit to macro and
distributional outcomes. On the downside, this broader definition brings along problems in measuring
and comparing subsidies across countries or sectors. As discussed below, measurement problems will
also make it difficult to identify all the sectors that benefit from energy subsidies based on such a broad
definition.
Other inter‐governmental institutions have approached the definition of subsidies in a more formal but
specialized manner, depending on their needs. The approach of the Government Finance Statistics (GFS)
manual of the International Monetary Fund (IMF) is shown in box 1, and that of the World Trade
Organization (WTO) in box 2.

21
Box 1: The IMF Government Finance Statistics Definition of Subsidies
There are many policy instruments and mechanisms that can be used to deliver a subsidy to consumers
or producers. Several publications describe such policies (see, for example, IEA 1999 and UNEP 2008). In
developed countries the bulk of subsidies are directed towards producers, with the idea of protecting
domestic production or employment, or to encourage new technologies that need to grow in the market
before they can become commercially self‐sustaining (infant industry). These goals can be encouraged
through policies such as grants and credit instruments, differential taxation, funding of research and
development, or price controls.
In developing countries subsidies in the energy sector are much more weighted towards consumers,
with the primary objective of reducing the cost of living for low‐income households. The mechanism for
delivering such help is the control of energy prices so that they are lower than would occur in the
situation in which companies (whether public or private) would have been able to charge sufficiently to
cover their costs.
The 2001 version of the IMF’s Manual on Government Finance Statistics (IMF 2001) states
Subsidies are current unrequited payments that government units make to enterprises on the basis of the
levels of their production activities or the quantities or values of the goods or services they produce, sell,
export, or import. Subsidies may be designed to influence levels of production, the prices at which outputs
are sold, or the remuneration of the enterprises.
OECD’s definition is much in line with the IMF’s: “Subsidies are current unrequited payments that government units,
including non‐resident government units, make to enterprises on the basis of the levels of their production activities
or the quantities or values of the goods or services which they produce, sell or import.” (See
http://stats.oecd.org/glossary/)
Notably, the IMF GFS classification considers that subsidies are payable only to producers, not to final consumers,
and includes only current transfers, not capital transfers:
All transfers that government units make directly to households as consumers and most transfers to
nonprofit institutions serving households are treated as either social benefits or miscellaneous other
expense depending on the reason for the payment. Most transfers made to general government units are
included in grants. Payments to enterprises to finance their capital formation, to compensate them for
damage to nonfinancial assets, or to cover large operating deficits accumulated over two or more years
are miscellaneous other capital expense.

22
Box 2: WTO’s Definition of Subsidies
A useful way of considering energy subsidies is to recognize that “energy” actually involves several
distinct goods and services: actual use of energy, connection to a source of energy, productive capacity
for supplying the energy, and underlying knowledge affecting the performance of both energy supply
and energy efficiency. Subsidy concepts can then be considered for each of these components to clarify
distinctions. Subsidizing energy use involves providing it at a price below opportunity cost. This includes
non‐collection or non‐payment, selling electricity at a cost that does not reflect the long‐run marginal
cost of supply including capital maintenance, and, for traded energy, its value in an alternative market.
The argument for subsidizing access to energy rather than energy use itself can be much stronger on
social grounds; further, energy use can still be rationed to reflect the opportunity cost of the energy flow
itself. Subsidizing energy supply would reflect subsidization of primary inputs like access to natural
resources or soft public financing of capital costs. Subsidizing research and development, in contrast,
involves provision of public goods, which is not immediately translated into subsidies of energy supply
or use (although they certainly lower cost if research and development is successful).
Financing a Subsidy
A subsidy can be financed through taxes, cross‐subsidies, cuts in other expenditure, borrowing, or tax
expenditures. Subsidies are not always clearly reported and accounted for. Explicit subsidies are
The WTO’s Agreement on Subsidies and Countervailing Measures (WTO 1994) provides a definition that is much
wider in scope than that of the IMF GFS. Under this agreement, a subsidy shall be deemed to exist if either 1 or 2 is
satisfied:
1. There is a financial contribution by a government or any public body within the territory of a Member
(referred to in this Agreement as “government”), i.e. where:
(i) A government practice involves a direct transfer of funds (e.g. grants, loans, and equity infusion),
potential direct transfers of funds or liabilities (e.g. loan guarantees);
(ii) Government revenue that is otherwise due is forgone or not collected (e.g. fiscal incentives such as
tax credits);
(iii) A government provides goods or services other than general infrastructure, or purchases goods;
(iv) A government makes payments to a funding mechanism, or entrusts or directs a private body to
carry out one or more of the type of functions illustrated in (i) to (iii) above which would normally be
vested in the government and the practice, in no real sense, differs from practices normally followed
by governments;
2. There is any form of income or price support in the sense of Article XVI of GATT 1994; and a benefit is
thereby conferred.
In order to provide a practical clarification about what should be considered a subsidy under this Agreement, the
document includes an annex that specifies a set of illustrative examples of practices that constitute, for the WTO,
export subsidies.
Source: www.wto.org/english/docs_e/legal_e/24‐scm.pdf.
23
transfers from the government budget to the producer or consumer that is receiving the subsidy, and
are transparently reflected in the budget. For example, if the utility has to set consumer prices below its
cost‐recovery level, the government can make up the difference by transferring money to the utility.
Such a subsidy is said to be on‐budget and is transparent in that details of the government budget are
made public. Explicit subsidies have a negative effect on the government’s fiscal balance. When
governments can no longer afford budgetary transfers to the utility to compensate for below‐cost tariffs
(or above norm costs), the resulting shortage of funds can lead not only to insufficient funding of system
maintenance and the resulting dilapidation of infrastructure, but also to “circular debt” and load‐
shedding.
Some off‐budget activities may involve an implicit subsidy where there is no immediate transfer from
the government to the company to cover the shortfall in revenue caused by the presence of the subsidy.
In this case a public utility may cover the shortfall by borrowing (which creates a contingent liability for
the government), or by reducing expenditure on maintenance and repair below the optimal level. In
certain cases the utilities may be making losses that are not immediately financed by a transfer from the
government. Eventually these will have to be made good and do have fiscal consequences at some later
date. As discussed by MacKenzie and Stella (1996) and Saavalainen and ten Berge (2006), these off‐
budget subsidies constitute a quasi‐fiscal activity and create a quasi‐fiscal deficit because there is a long‐
run link to the need to finance such subsidies from the budget. A similar form of implicit subsidy occurs
when there is an off‐budget transfer to a firm. For example, oil bonds issued by the government of India
to oil companies in lieu of payment for oil subsidies were for many years not on‐budget.
Cross‐subsidies involve a group of consumers paying more than the general cost of supply and the
surplus is used to subsidize the provision to the other group at a price that is lower than the cost of
supply to the subsidized group. This cross‐subsidization may be formulated with varying degrees of
transparency. A variation on this theme is where the cost of supply is higher to the targeted group
(because of distance from main supply points or low local load density), but the price to both groups is
set the same (pan‐territorial pricing). This has the result that one group pays above cost and the other
pays below cost. Such schemes transfer resources between two groups of users rather than from the
general group of taxpayers (through the government budget) to the selected group. Such schemes tend
to be administratively simple in that no additional financing mechanism needs to be set up, while the
utility can still cover its total cost. However, as pointed out by Irwin (1997), a policy of allowing a utility
to charge above full costs will not be sustainable in the presence of competition whereby new entrants
could target just the more profitable high‐tariff part of the market while undercutting the firm that is
using cross subsidies to reach lower‐income households. Cross‐subsidies can be combined with the first
or second financing mechanisms, so that, even with cross‐subsidies, all consumers combined are
collectively subsidized.
For internationally traded forms of energy (petroleum products especially) a different form of implicit
subsidy can arise when the country is a producer of the energy source. The national energy company
could be mandated to set domestic prices just above cost‐recovery levels but below the international
price they would receive if they had exported the product instead (export‐parity). There is no financial
loss to the company and no quasi‐fiscal deficit, but there is an opportunity loss through not setting the

24
domestic price at the export price level. This constitutes a quasi‐fiscal activity and is an implicit subsidy
as explained by Petri, Taube, and Tsyvinski (2002). In an extreme case where domestic prices were set
below cost‐recovery levels, there would also be a quasi‐fiscal deficit of the amount equal to the loss due
to the difference between the domestic price and the domestic cost‐recovery level. In the case of
member countries of OPEC that have production quotas, the opportunity cost of the oil is then the
larger of the marginal cost of production and the discounted value of an additional barrel of unproduced
oil. The implicit subsidy is the difference between this opportunity cost and the domestic selling price.
Estimates based on valuing opportunity cost at the international price would tend to overstate the
amount of subsidy in this case.
Faced with rising international energy prices, some governments reduced the taxation of fuels in the last
few years. This loss of revenue meant that other fiscal adjustments (present or future) were needed to
offset its effects. This effect is referred to as a tax subsidy. A tax subsidy is defined with reference to a
normative or baseline tax system, and can be considered explicit in the budget if the normative tax can
be defined. A normative tax system would take into account the optimum structure of taxes required to
achieve the government’s social objectives. The calculation of this set of optimal taxes is complex, and
calculations of tax subsidies as deviations from this normative baseline may use a simpler reference
framework in order to arrive at an operational valuation of this amount of subsidy.
Measurement of Subsidies
The definition given above for identifying the presence of a subsidy leads to a framework for measuring
the magnitude of the subsidy in cases where either the costs of production, or prices charged to
consumers, are affected by the subsidy. This leads to the price gap approach that can be applied with
varying levels of complexity, as explained below.
However, as the IEA (1999), the European Environment Agency (EEA 2004), and Koplow (2009) make
clear, there are various categories of subsidies that do not affect producer costs or prices, but that do
have costs to the government and do affect the supply and demand for energy. These include public
research and development expenditures, preferential tax treatments for sub‐groups of producers,
lending and loan guarantees, and various forms of regulation.
Where subsidies are directly funded out of the government budget, it is possible to identify the total
transfers to producers and consumers to evaluate the explicit subsidy component. The difficulty with
this approach is that of standardization. Even the European Union has not been able to agree a uniform
format for evaluating subsidies, except for on‐budget state aid to the coal industry. Earlier studies of the
European Union by Oosterhuis (2001) and the European Commission (2003) were not able to provide a
basis on which a regular evaluation of explicit subsidies could be conducted. Studies of individual
countries would need to work with whatever level of detail is available in the fiscal accounts to identify
such explicit subsidies.

25
Three methods of quantifying the magnitude of subsidies have been proposed. These are (1) the price‐
gap approach; (2) the program‐specific approach; and (3) the measure of producer or consumer subsidy
equivalent. The price gap approach constitutes a measure of the difference between observed prices
and a reference price that would prevail in a competitive (efficient) market with no price intervention or
support to producers. The program‐specific approach attempts to measure the value transferred to
stakeholders from a particular government intervention. A fuller picture is provided by the producer or
consumer subsidy equivalent. This is a mix of the first two, but is a more data‐intensive measurement
approach. An overview of these approaches, their strengths, and their weaknesses is shown in Table 2.
All of these methods are partial and provide only a limited view of the extent of subsidies.
A commonly used method of measuring consumer subsidies follows an approach that is capable of
standardization across countries and over time. The key to this measurement is the reference price of
the energy commodity. This is the efficient price that would exist in the absence of subsidies and
corresponds to the price that would prevail in a competitive market. The difference between the
reference price and the price charged to consumers is the subsidy, and it has to be financed either
explicitly or implicitly by the government. For traded goods, where there are no import or export
restrictions, the reference price corresponds to the international price adjusted for transport and
internal distribution costs (import or export‐parity). Where the energy commodity is not traded, the
reference price is given by the domestic cost of supply. For the different sources of energy, the
calculations are based on the same underlying approach but involve distinctly different calculations.
The use of the international price as a reference when energy is traded is based on arguments of
opportunity cost. For a country that can export energy the true value of production at the margin is
what it could obtain on the international market. If the country can produce at a cost that is lower than
the international price, domestic production should be valued at international prices rather than at
domestic supply costs. For an importing country the true cost of the energy is the import price.

26
Table 2: Overview of Subsidy Measurement Approaches
Approach / description Strengths Limitations
Price gap: Evaluates positive or negative gaps between the domestic price of energy and the delivered price of comparable products imported or exported, or the cost of efficient market supply
1) Can be estimated with relatively little data; useful for multi‐country studies
2) Good indicator of pricing and trade distortions
1) Sensitive to assumptions regarding efficient market and transport prices
2) Understates full value of supports because ignores transfers that do not affect prices
Program specific: Quantifies value of specific government programs to particular industries; aggregates programs into overall level of support
1) Captures transfers whether or not they affect end‐market prices
2) Can capture intermediation value (which is higher than the direct cost of government lending and insurance)
1) Does not address questions of ultimate incidence or pricing distortions
2) Sensitive to decisions on what programs to include
Producer subsidy equivalent / consumer subsidy equivalent: Systematic method to aggregate transfers plus market supports to particular industries
1) Integrates transfers with market supports into holistic measurement of support
2) Separates effects on producer and consumer markets
1) Data intensive 2) Little empirical producer subsidy equivalent / consumer subsidy equivalent: data needed primarily for fossil fuel markets
Source: Koplow 2004.
Koplow (2009) presents an assessment of the price gap approach. This approach is useful in particular
for identifying consumer‐side subsidy rates, and thus also the magnitude of any inefficiencies that may
result from such subsidies. The interpretation of the price gap is straightforward and suitable for
standard measurement across countries. It may present fewer difficulties than some other measures
(aiming in particular at identifying producer‐side subsidies) in terms of data requirements.
One disadvantage is that its simpler conceptualization leaves unaccounted many forms of non‐cash,
non‐price‐affecting subsidies. If an inefficient producer is subsidized and domestic costs are as high as or
higher than import parity levels, the price‐gap approach would not identify the existence of the subsidy,
even in cases where producers are given subsidies in cash from the government. Consequently, the IEA
considers the price gap approach as a lower bound for the impacts of subsidies on economic efficiency
and trade. As Koplow (2009) explains, the price gap measure “is often presumed to be a proxy for the
aggregate impact of the existing set of policies on market prices within the country”. He discusses the
benefits and limitations of the approach. Strengths and weaknesses relate to the use of the price‐gap
measure as opposed to other measures of subsidies, and to the problems of actually implementing the
price‐gap approach itself.
The IEA database and statistical service provide much of the needed information required for calculation
of energy subsidies based on the price gap approach. Some of the information can be freely downloaded
from the IEA website (available at www.iea.org/stats/index.asp). Restricted information can be accessed
through World Bank‐IMF database services.
27
In addition, the IEA’s “Energy Efficiency Policies and Measures Database” (available at
www.iea.org/textbase/pm/ee_background.htm) provides information on policies and measures taken
or planned to improve energy efficiency, including incentives or subsidies conferred through the
following channels:
Feed‐in tariffs
Grants
Preferential loans
Rebates
Third party financing.
It also records other policy interventions that would qualify as subsidies according to Koplow, including
financial support (by means of tax incentives),
public investment in research and development,
regulatory instruments, and
tradable permits.
The database covers measures in IEA member countries,5 Brazil, China, the European Union, India,
Mexico, the Russian Federation, and South Africa. This online service aims to complement the policy
analysis carried out by the IEA on energy efficiency improvements and climate change mitigation.
The U.S. Agency for International Development (USAID) analyzed best practices in subsidy policy and
reform and estimates the cost of energy subsidies for several categories of energy commodities in the
United States and selected countries (USAID 2004). It describes existing subsidies and provides a set of
criteria for evaluating these subsidies, thus generating a framework for a proper energy subsidy reform.
Morgan (2007) surveyed different approaches to measuring energy subsidies and quoted figures from
several different sources.
The price gap approach to subsidy measurement formed the basis of calculations made by the IEA
(1999, 2008, 2009, and forthcoming). In addressing the need to take action to mitigate global GHG
emissions, the extra energy use encouraged by the presence of subsidized prices on a large scale is a
concern. The removal or reduction of such subsidies would slow down the growth of emissions while at
the same time improving the fiscal balance and energy security in the countries following such policies.
The IEA estimated consumer energy subsidies using the price gap approach for the group of non‐OECD
countries that were the largest energy consumers (accounting for 80 percent of non‐OECD primary
energy consumption) (IEA 2008). Koplow (2009) provides numerical values derived from the IEA of
subsidies in current U.S. dollars. These figures indicate that energy consumer subsidies were substantial
relative to GDP in most of the large energy‐using non‐OECD countries. With the exception of Brazil, the
5 IEA member countries are Australia, Austria, Belgium, Canada, Czech Republic, Denmark, Finland, France, Germany, Greece, Hungary, Ireland, Italy, Japan, the Republic of Korea, Luxembourg, Netherlands, New Zealand, Norway, Poland, Portugal, Slovak Republic, Spain, Sweden, Switzerland, Turkey, United Kingdom, and the United States.

28
shares of total energy consumer subsidies to GDP, especially for oil, were very high for the oil‐producing
countries within the group.
For petroleum products Baig et al. (2007) estimated both explicit and implicit petroleum product
subsidies as a percentage of GDP for a number of developing countries. The results are shown in annex
table A.1. In some countries (notably Azerbaijan) explicit and implicit subsidies were both substantial.
Traded sources of energy
Oil and gas are widely traded on the international market. Although the vast majority of coal consumed
is not yet internationally traded, the share of coal that crosses national borders has been rising.
Subsidies on internationally traded commodities need to take the world price into account. A number of
adjustments are needed to convert the international price into a reference price for domestic
consumers. These relate to the following:
International transport and insurance costs
Internal transportation and distribution costs
Quality adjustments
Contractual basis of pricing
Internal taxes.
International transportation and insurance costs have to be paid on imported commodities and form
part of the reference price, while for exported commodities the country can receive only the price
excluding international transport and insurance. The first component of the reference price is therefore
linked to the import border price—cost insurance and freight (cif)—for imported commodities, and to
the export border price—free on board (fob)—for exported commodities. The calculation of the border
price itself (whether import or export) may require further adjustment. For example, petroleum product
prices are published with reference to a particular hub (for example Rotterdam or Singapore) and need
to take shipping costs from the hub to the specific country into account. Such costs are not always
available on a country‐ and product‐specific basis. The IMF (2010) used a factor of $0.10 per liter for all
petroleum products and all countries for the costs of international shipping between the hub and the
country. This is clearly a first‐order approximation that can benefit from refinement where country‐
specific data are available: small landlocked, remote, or island economies usually incur much higher
transportation costs than larger, more conveniently located markets. For exporters this margin is
subtracted from the hub price to give the border price, while for importers this margin is added to the
hub price.
Internal transportation and distribution costs have to be added to international prices, for both
exported and imported commodities, to allow for the difference between the price at the border and
the price to consumer. Details of breakdown of such costs are not generally available and some
simplifying assumption is usually made with respect to this item. The IMF (2010) assumed that the
internal distribution and retailing cost, based on US experience, was also $0.10 per liter for petroleum
products. For gas, where there is usually a pipeline distribution system, the costs from the border to
user may be available on a country‐specific basis. The treatment of internal transport costs can take into

29
account the difference between transporting for export and transporting to the user. For example, the
IEA’s sample calculation for China, at that time an exporter of coal, subtracted the transport cost from
mine‐mouth to export terminal from the export price to give the mine‐mouth equivalent. It then added
the internal transport cost to the user to give the delivered cost that could be compared to the actual
consumer price charged (IEA 1999). Petroleum products for exporters leave from the refinery, but these
tend to be located near the port so that internal transport costs need to take into account the transport
cost from the refinery to the user. For importers the transport cost is that from the terminal to the user.
For crude oil and coal there can be large differences in quality between the domestically produced
product and the standard international commodity for which price quotations are available. Natural gas
can also vary in its calorific content, and contracts are quoted based on the calorific value to standardize
for quality. For the oil market it is petroleum products which are sold to consumers, rather than crude
oil, and their international prices reflect the global market balance between supply and demand for
different products and their quality. For products of different specifications (particularly with respect to
sulfur content) the appropriate quality should be used to calculate the reference price. If products of the
same quality are not available on the world market, assumptions have to be made to adjust for the
quality differences. The existence of large quality differentials for coal, ranging from lignite to anthracite,
means that domestic coal cannot be directly compared with internationally traded coal unless they are
of similar quality. The IEA (1999) illustrated a calculation for Chinese export coal making an adjustment
for the different calorific values and ash content of domestic and export coals and, although they
suggested that there is a non‐linear relation between quality and price, a strict proportionatility was
used in sample calculations.
The international price data used to estimate border prices are normally taken from published sources.
These are primarily spot prices, although for certain petroleum products and U.S. natural gas, futures
price are also published. Because contract prices diverge from spot prices, there is a question of which
international price to use as a reference. For gas and coal, if countries chose to export to achieve
maximum market value, they would tend to receive the contract price, since they would not be likely to
engage in a large amount of spot trade. Similarly for import prices, the relevant reference should be the
contract price that they could have obtained through an import strategy. For crude oil or petroleum
products countries engage in spot trade, and hence spot prices are appropriate for calculating the
reference price. Studies of subsidies to petroleum products have mostly used international spot prices,
while there are few studies that have quantified subsidies to gas or coal because they are traded mainly
through contract prices, which are difficult to obtain. The IEA (1999) gives reference prices for all forms
of energy (traded and non‐traded) for four large producing countries. The source for these prices is the
IEA’s own database, which is based on spot prices or export unit values. The latter do take into account
contract prices for that amount of export which is sold on a contract basis, and also allows for quality
differences.
The treatment of taxes is important in making comparisons because actual tax rates vary considerably
among countries, and because there may be taxes at both national and sub‐national levels. The
downward adjustment of taxes on energy commodities, following recent rises in international prices,
has highlighted the possible importance of tax subsidies, in which taxes are set below the optimal level,
30
or below the level at which non‐energy commodities are taxed. The calculation of an optimal tax in
practice is complicated and requires a good deal of information. It has to take into account the whole
structure of taxation in order to match government expenditure needs, and then make adjustments for
local externalities as well as distributional effects. It is generally agreed that, for energy commodities
that are inputs into the production process, the optimal tax rate, excluding externality corrections,
should be zero. Examples of the calculation of optimal taxes for gasoline are given by Parry and Small
(2005) for the United States and the United Kingdom, and by Ley and Boccardo (2009) for the OECD
countries, Brazil, Russia, India, China, and South Africa. The latter study concluded that the latter five
countries, as well as the United States, undertax gasoline, resulting in a tax subsidy to consumers.
The IEA (1999) recommended that the level of value‐added tax be included in the reference price for
forms of energy sold to end‐users, on the grounds that this approximates the general rate of taxation
required on all consumer goods. For petroleum products this would exclude excise duties, which raise
substantial government revenue in many countries. Excise duties reflect attempts to incorporate
Ramsay pricing6 on goods for which demand is price inelastic and capture distributional concerns in that
certain petroleum products are more intensively consumed by higher‐income households. The IMF
(2010) included in the reference price for petroleum products a tax of $0.30 per liter, suggesting that the
optimal tax rates for all petroleum products would be similar to leading order. Other studies, such as
Shah and Larsen (1992), carried out subsidy calculations on a net‐of‐tax basis.
The practical difficulty of calculating any form of optimal tax for a country where information is scarce
means that the calculation of the tax subsidy element of prices would be difficult to carry out on a
comparable basis for a number of countries. The distinctions between universal price subsidies and low
petroleum product tax rates are not always clear. Some governments levy high fuel taxes and provide
subsidies; others may levy low taxes and provide no subsidies. The result may be identical: end users
pay lower prices, and government collects lower net revenue from the downstream petroleum sector,
than they would otherwise.
For individual country analysis it may be possible to construct a meaningful estimate of the tax subsidy,
so that changes over time reflecting variations in actual tax rates charged (including excise duties) are
reflected in variations in the calculated total effective subsidy. In countries where detailed information
on actual tax rates charged is difficult to obtain, the gap between the reference price and the retail price
may have to include the actual tax component in the latter price. Even when this gap indicates that the
retail price is above the reference price, suggesting that the good is not being subsidized, this need not
be the case. Where the government has controlled retail prices so that the net‐of‐tax price would be
below the reference price, there is a subsidy as well as a tax. Either the government must compensate
the companies for this margin or else their long‐term financial position will deteriorate.
In summary, to calculate the total consumer subsidy using the price gap approach on a tradable source
of energy for a particular year, the following steps need to be taken:
6 The Ramsey theory of taxation recommends higher tax rates on goods with the most inelastic demand as a means of raising a given amount of revenue in the most efficient way possible.

31
1. Establish the average retail price for the year (with and without taxes if possible).
2. Estimate the total sales to consumers during the year.
3. Identify the local product quality and the international traded commodity equivalent.
4. Identify the relevant international hub and the price at that hub for the traded commodity
averaged over the year.
5. Where the quality differences are large, adjust the international price to bring it to an equivalent
quality basis. This adjustment is likely to be needed especially for coal, where a price adjustment
related to calorific value and ash content could be made.
6. Identify the international transport and insurance costs per unit from the hub to the border
averaged over the year, and add these for an imported commodity and subtract for an exported
commodity to arrive at cif or fob prices, respectively.
7. For an export commodity, identify the transport cost from the border to the point of domestic
production (mine‐mouth) and subtract from the border fob price.
8. Identify the internal distribution costs (from mine‐mouth, terminal, or domestic refinery to the
consumer) per unit averaged over the year, and add these to the border price.
9. Depending on tax information available, add the local per‐unit tax averaged over the year to the
price calculated in step 8.
10. Calculate the price gap as the difference between the average reference price and the average
domestic retail price over the year.
11. Calculate the total subsidy as the product of the price gap and the total sales during the year.
The case of coal in China, taken from the IEA, is presented in box 3.
Box 3: Calculating the reference price for steam coal in China as an exporter
1. Export (fob) price of coal was 266 yuan per tonne.
2. Calorific quality of export coal was 0.531 , and for domestic household coal was 0.499. Hence export
price for same calorific quality as domestic household coal was 266 × 0.499 0.531 = 250 yuan/tonne. 3. Discount for other quality differentials (ash and sulfur) was 50 yuan so export price for identical coal
quality to household use was 200 yuan/tonne.
4. Transport cost from mine‐mouth to export terminal was 79 yuan/tonne, so value at mine‐mouth was
121 yuan per tonne.
5. Domestic distribution and transportation costs from mine to households were 149 yuan/tonne, so
household door equivalent was 270 yuan/tonne.
6. VAT, as was charged on coal sales, was 13 percent so that final reference price to consumers was 305
yuan/tonne.
The reference price can be compared with the actual household price paid per tonne to determine the
opportunity loss of not exporting the coal, which would be entirely an implicit subsidy in the case where the
actual price charged covered the costs of domestic production.
Source: IEA 1999.
32
Nontraded sources of energy
In most developing countries electricity is a non‐traded good, since there are rarely sufficient
interconnections to permit substantial import or export. Where substantial electricity can be traded, the
border price should be used in calculations of subsidies. Where there is little effective trade, the
reference price must be based on domestic costs of supply as the only feasible comparator. For
domestically produced gas or coal, where there is no export and import terminal, a similar consideration
applies.
For the non‐traded good there is no international transport cost adjustment to be made, because the
reference price is based on the costs of domestic supply. That is, the reference price and the actual price
relate to idealized supply and the actual product supplied at the identical location. However, the
particular nature of the power sector and its commercial arrangements leads to other adjustments to
take into account any difference between the amount of electricity produced and the amount paid for.
Since any shortfall in payments will have to be covered by the utility or the government, this also
constitutes a subsidy to users.
For the power sector the World Bank and the IMF have carried out a number of studies estimating the
price gap or quasi‐fiscal activity. The objective of these studies has not been to permit a global
aggregation that relates to GHG emissions and their potential for reduction, as was the case for some
studies relating to of petroleum products, but rather to provide insight onto the fiscal and sector
implications of the pricing policy. Petri, Taube, and Tsyvinski (2002) suggested two alternative
approaches to estimating the quasi‐fiscal activities of the power sector. The end‐product approach is a
generalization of the conventional price gap approach, but allows for failure to collect bills on the energy
sent out. The financial‐balance approach also adjusts for underinvestment, the underpricing of inputs,
and arrears on inputs and taxes. Although the financial‐balance approach would give a fuller picture of
the financial state of the utility, the data requirements are such that it was not used in the paper and
would be difficult to apply in many countries.
The end‐product approach was generalized to the so‐called hidden cost calculator by Ebinger (2006) and
by Saavalainen and ten Berge (2006) to take into account excess costs of producing electricity (or natural
gas) that are not covered by tariff revenues and that require an explicit or implicit subsidy. If the
company were run efficiently, costs would be covered by revenues, but there are a number of factors
that lead to a hidden cost of production:
Tariffs may be set below efficient cost levels.
There is a failure to actually bill some known users.
There is theft by non‐registered users, or meter tampering by registered users, resulting in use
that is not billed or is under‐billed.
Some users do not pay the bills but continue to be served.
There are excessive physical (technical) losses in transmission and distribution that would not be
included in the costs of a well‐run company.

33
All of these result in a loss of revenue relative to an efficient level of costs and have to be covered
financially either by a direct subsidy from the government or by reducing other costs (such as
maintenance and required investment). Although technical and commercial losses apply to all forms of
energy, they are relevant mostly for electricity and natural gas. The sections that follow focus primarily
on electricity. The measure of efficiency under investigation by the hidden cost calculator is productive
efficiency, but there may also be allocative inefficiency which is not considered in the hidden cost
calculation.
The issue of technical losses is known to be important in many countries. Some losses are inevitable
because energy is used in the transmission and distribution process. However, there are a large number
of design adjustments that can help to reduce these losses. Given the design characteristics of the
system, there are performance norms that are conventionally used to estimate what would be an
acceptable level of transmission and distribution technical losses, and efficient costs would be related to
this level of losses.
Commercial losses include theft, either through illegal connections or by some form of meter tampering.
For both of these categories the company is unable to bill the user and hence is supplying electricity for
free. This results in a loss that has to be financed by other means, and in effect is a subsidy to these
groups of users.
As well as theft, for which no invoice can be sent out but which can be reduced by more extensive
supervision and better metering, the company may fail to bill some known users, or not insist that other
known users pay what is due according to meter readings. In some countries non‐paying users may
include government departments for which it would be difficult to stop supply. In all these cases the loss
of revenue on electricity sent out will have to be carried by the utility or by other users through a cross‐
subsidy. The sum of technical losses, commercial losses, and non‐realization of billed demand may be
referred to as the aggregate technical and commercial loss. To allocate losses to these various
categories, data collected by utilities identifies electricity sent out and electricity billed. From the data
collected it is possible to estimate the actual loss rate (theft plus technical loss) and the bill collection
rate.
The hidden cost is the difference between the revenue that the utility would receive were it to be in
operation with cost‐recovery tariffs based on efficient operation (net of taxes), with normal losses and
with full bill collection, and the actual receipts. It is wider than a conventional price‐gap measure since it
not only includes the gap between actual costs and prices, but also the gap between costs of an efficient
firm and actual costs. The gap could be covered by some combination of an explicit subsidy, paid to the
utility, and an implicit subsidy in which the utility is left to bear the revenue shortfall. Depending on the
balance of financing used, the hidden cost calculator may include both producer and consumer
subsidies. Using these values the hidden cost calculator equation is expressed as
H = Qe (Tc – Te) + Qe Tc (λm – λn) / ( 1 – λm ) + Qe Te ( 1 – Rct) (1)
where

34
H = hidden cost
Qe = end‐user consumption volume
Tc = average cost‐recovery price at a technical loss rate of λn and full bill collection
Te = weighted average end‐use tariff
λm = total loss rate
λn = normative loss rate
Rct = bill collection rate.
The three terms of hidden costs are the sum of the underpricing effect, the unaccounted loss effect, and
the collection failure effect. To calculate the hidden cost, data from utility performance for a country are
required, and lack of such data or inaccuracies will limit the precision of the estimates of total hidden
costs. Actual end‐use tariffs, loss rates, bill collection rates, and energy sent out are usually collected
and are updated on a yearly basis. The two factors that are not readily available are the normative
losses and the cost‐recovery price. The former may be taken from international norms, making
allowance for the nature of the system. For example, data published by the World Bank (2009a)
indicates that transmission and distribution losses (including theft) in 2006 averaged 6 percent of output
in high‐income countries and 12 percent in middle‐income countries. By contrast, South Asia averaged
24 percent and Latin America and the Caribbean averaged 16 percent. Ebinger (2006), in the analysis of
20 countries in Eastern Europea and Central Asia (ECA), and Briceño‐Garmendia, Smits, and Foster
(2008) in an analysis of 21 SSA power utilities suggested that 10 percent could be taken as normative for
power (and 2 percent for gas) in the absence of other information.
The determination of the cost‐recovery tariff is based on the costs of supply, assuming normative losses,
and includes maintenance and repair costs but not costs of capacity expansion. In this respect it is not
the true long‐run marginal cost of supply, but rather the short‐run average cost. These costs were
estimated in the above two World Bank studies by country specialists with knowledge of the individual
power systems and access to utility data. The estimation of the hidden‐cost calculator for these 41
developing countries indicates that extension to other regions and countries would be feasible if
required, and already provides a base for country‐level evaluations of the magnitude of power sector
subsidies and the elements contributing to their magnitude. Where there are inaccuracies in the data
provided by the utility, such as underestimating end‐user consumption, losses may be understated.
For the above ECA study, results were derived for the power and gas sectors for the 20 countries for
each year from 2000 to 2003. Estimates for 2004 and 2005 were prepared but not published. For the
SSA study estimates were made for the power sector for the 21 countries averaged over the period 2001
to 2006. The shares of the three components in total hidden costs for the two regions on an aggregate
basis are shown in Table 3 while details of total hidden costs as a share of GDP in individual countries
are shown in annex tables A.2A.4.

35
Table 3: Percentage Shares of Cost Components in Total Hidden Costs of Power for Eastern Europe and Central Asia (2000–2003) and for Sub‐Saharan Africa (2001–2006)
Region Underpricing Unaccounted losses Collection failure
ECA (20 countries) 72 16 11
SSAa (21 countries) 62 16 17
Sources: Ebinger 2006; Briceño‐Garmendia, Smits, and Foster 2008.
a. Total for SSA does not add to 100 percent because country level data have been weighted by GDP shares.
In both regions underpricing was the dominant source of hidden costs and hence required the largest
subsidy (either implicit or explicit). However, the sum of unaccounted losses and collection failure was
responsible for at least one quarter of total losses. Even in the absence of policies to reform prices
because of concerns about the effects on consumers, utilities in these countries had the opportunity to
raise revenues or reduce costs considerably, and hence improve the viability of the sector and reduce
the need for long‐term government support.
Annex table A.2 reveals that, in many countries in the ECA region at the beginning of the period
analyzed, hidden costs in power were equivalent to a very large share of GDP. The majority of countries
experienced substantial reductions in this share by 2003, but for some the size of the subsidy was still
large even at the end of the period. The detailed tables in the report showing the breakdown between
the three cost components enabled individual countries to see where their losses were arising. For
many, underpricing was the major source of loss, but for some (such as Croatia) bill collection failures
were important, and for others (such as Georgia) unaccounted losses were the largest component. The
hidden costs in the natural gas sector in ECA shown in table A.3 were much smaller than those in the
power sector, and also tended to decrease over the period. However some countries still experienced a
total hidden cost for natural gas of more than one percent of GDP at the end of the period. The hidden
costs of power in Sub‐Saharan Africa in the period 2001–2006, shown in table A.4, were generally
smaller than those in ECA but still amounted to a substantial share of GDP in some countries—reaching
more than 4 percent of GDP in Malawi and the Democratic Republic of the Congo.
In the hidden‐cost framework, underpricing and collection failure can be seen as direct subsidies to
consumers, who are paying less than the costs of supplying them. The unaccounted losses include both
theft and technical losses in transmission and distribution. The former are clearly a subsidy to those
illegally connected or who have tampered with the meter, but the latter component is either a producer
subsidy if tariffs do not reflect this aspect of costs and the government eventually bear the cost, or a
transfer from consumers to producers if tariffs have been adjusted to reflect high losses. If the utility
collected sufficient information to separate these two components, it would be possible to identify the
effects of underpricing, collection failure, and illegal consumption.
The use of a reference price based on a cost‐recovery tariff assuming normal losses and full bill
collection raises two conceptual issues:
1. Cost recovery should ideally relate to the cost of an efficiently run company. In addition to
technical and commercial losses as defined in the hidden cost calculator, the company may also

36
suffer from inefficiencies such as over‐staffing (extra labor taken on for job creation rather than
to facilitate extra production), in which case the costs have to be carried by those paying the
tariffs, or else through the company increasing its losses. Governments may even extend
subsidies to state‐owned utilities to cover losses created by employment creation policies. The
tolerance of excessive costs leads to the need for a subsidy, whether explicit, implicit, or a cross‐
subsidy. Because excess labor appears to be common in many state‐owned utilities, the hidden‐
cost calculator could be extended to base the calculation of cost recovery on a benchmark labor
utilization figure, thus providing a fourth source of costs carried by the utility that require
subsidies. Similarly, utilities suffering from lack of investment funds will under‐invest in
maintenance, with a resulting increase in technical losses.
2. System expansion requires capital expenditure. Most calculations of normal costs have excluded
costs of new investment, partly because of the difficulty of obtaining sufficient details of utility
expansion plans, and partly because subsidies are related to benefits accruing at the present
time to current users, rather than to future users or existing users at higher usage levels.
However, because expansion of the power sector is important in all developing countries,
especially those with shortages or with low rates of access, merely covering costs in an efficient
manner would be inadequate to finance such expansion.

37
Energy Subsidies and the Economy
To obtain a full understanding of the role of subsidies, it is necessary to be able to evaluate their impact
on other sectors and on the macro‐economy. Models of the impact of subsidies look at their relation to
growth as well as their immediate effects and carry out dynamic analysis. Such models use financial
programming tools, computable general equilibrium (CGE) models, and integrative models that combine
a CGE model with modules that attempt to assess distributional effects of energy subsidies. Certain
energy subsidies may have local and global external effects on sectors and economies beyond their
immediate origin, and these externalities also need to be taken into account.
Although the comparative static, partial equilibrium approach corresponds to the realm of
microeconomic analysis, a brief description is included because it throws some light on the integrated
macro‐distributional approach and on the impact on externalities.
Macroeconomic Impacts from Subsidies: Overall Picture
Energy subsidies have a variety of different distributional and aggregate effects on the economy. Some
of the most important are the following:
1. Energy subsidies directly affect government accounts, as they lead to a worsened fiscal balance
due to larger government expenditures, smaller revenues, or net current transfers.
2. Energy subsidies are also likely to affect the balance of payments, because changes in prices of
imports or exports subject to the subsidy affect trade flows via price and real exchange rate
elasticities. Most directly, energy subsidies lead to increased domestic demand for imported, or
potentially exportable, energy products, thus worsening the trade balance. When the induced
demand changes are significant for the market as a whole, terms of trade may also change and
these effects tend to be negative (positive) for fossil fuel importers (exporters). Energy subsidies
may also divert consumption away from or toward other products, depending on their degree of
substitutability or complementarity.
For energy exporting countries, subsidies represent the opportunity cost of forgone
foreign exchange earnings, which in the case of countries with dwindling reserves or
limited export capacity can be significant.
For energy importing countries where subsidies are used to prevent retail prices from
rising as rapidly as import prices of energy, oil price hikes on the world market cause an
immediate drain in the government accounts and in international foreign exchange
reserves.
3. Subsidies also affect the long‐run growth potential of an economy. One reason is that they may
constitute an incentive or deterrent to innovation, technological development, and productivity
growth, and affect individuals’ decisions in the allocation of factors and distribution of
consumption over time. They affect relative prices and investment decisions by the firm and
may have significant adverse effects on allocation of resources across sectors and economic
agents, due to these price signals not reflecting overall social costs of energy use.

38
4. A significant distortive effect is that on investment in physical plant, which may tend to be more
energy‐intensive in the presence of energy subsidies than in their absence. This is particularly
harmful for infrastructure with very long lifetimes, which tend to entrench high energy
consumption for a long period into the future.
5. A range of adverse secondary macroeconomic effects result from the existence of a constrained
budget situation. One such problem is the reduced ability of governments to meet immediate
fiscal needs during economic downturns, if a substantial fraction of fiscal space is used up by
energy subsidies. The same applies to governments’ ability to directly support low‐income
groups during downturns—a particularly compelling argument when much or most of energy
subsidies flow to middle‐ or high‐income households.
Government interventions by means of explicit or implicit subsidies to particular products are
transmitted to other agents, markets, and to the economy in general, shifting relative prices and access
to commodities, and thus create incentives for changes in individual behavior. From this perspective
general equilibrium analysis of government interventions is generally thought to be the most
appropriate way to understand their macroeconomic implications.
On the other hand, a single‐market analysis of impacts of government interventions still has merits and
offers valuable insights to policy makers. This is because it helps to shed some initial light on the rather
complex issues pertaining to efficiency, equity, and distributional effects. Also, as explained below,
when there are few subsidy beneficiaries and they can be easily isolated, so that there are only small
spillover effects to other economic activities, a simpler model specification can be valuable.
The analysis of macroeconomic impacts begins by describing the areas within the sector classification of
economic activities, government accounts, balance of payments, and trade that are directly linked to
energy subsidies.
Sectors of Economic Activity
Using the United Nations’ (UN’s) Standard International Trade Classification, Revision 4 (SITC Rev4) or
the International Standard Industrial Classification, Revision 4 (ISIC Rev4), it is possible to identify goods
and services, or sectors of economic activity that are linked to subsidy‐related energy products (see
annex B).
However, as discussed, it is not always the case that energy subsidies accrue directly to products or
producers of these commodities. Often, energy subsidies are granted to households or to other sectors
of economic activities that use the commodities as an input in their productive processes. From this
point of view, a more appropriate first approximation to measuring macro‐economic impacts of energy
subsidies will take into account the input‐output, interlinked, multi‐sector, multi‐agent nature of
economic activity. This approximation can, in turn, be made by looking at the so‐called social accounting
matrix (SAM). In the words of Lofgren et al. (2002), a SAM is “a comprehensive, economy‐wide data
framework, typically representing the economy of a nation. More technically, a SAM is a square matrix
in which each account is represented by a row and a column. Each cell shows the payment from the

39
account of its column to the account of its row. Thus, the incomes of an account appear along its row
and its expenditures along its column. The underlying principle of double‐entry accounting requires that,
for each account in the SAM, total revenue (row total) equals total expenditure (column total).”
The general structure of the SAM is presented in annex C. Four groups of agents are aggregated in the
annex: households, enterprises, government, and the rest of the world. “Activities” and “commodities”
are normally disaggregated using a classification of economic activities, such as the UN ISIC. Highlighted
in this SAM are the “cells” or transactions where government interventions under the form of subsidies
have an impact on the flow of resources to activities, commodities, or agents of the economy. This way,
one can trace effects of subsidies regardless of whether they are granted directly to households, private
enterprises, or public enterprises; or whether they are granted via changes in prices of goods and
services of final energy products or energy commodities. However, the SAM will not be able, by itself, to
pick up the secondary effects that transmit within the system once behavioral changes occur as a result
of the government intervention. For this to be accomplished, a general equilibrium analysis, by means of
a CGE model, could be used.
For energy subsidies, the use of SAMs as a first approximation to direct effects from subsidies will
benefit from the highest possible disaggregation of energy activities (ISIC) or products (SITC) so as to be
able to pick up changes in specific government interventions that may not target all energy sources in
general, but rather particular commodities or sub‐sectors.
Government Accounts
Annex D presents IMF’s Government Finance Statistics Manual 2001 classification of government
expenditures (IMF 2001) which include monetary values of cash transfers to public and private firms
(codes 251 and 252). Again, as explained above, these include just a fraction of all possible subsidies,
namely, the cash transfers to public or private producers, and thus render an incomplete picture of the
degree of intervention on the energy sector. As observed in the GFS’s definition (box 1), one should also
account for subsidies classified as social benefits or other expenses targeting households or not‐for‐
profit institutions to have a more exact estimate of the magnitude of cash transfers. Government
Finance Statistics Manual numbers, however, may often fail to provide a good approximation of the
degree or intensity of government intervention in the energy sector, as different governments may have
different preferences or mixes of cash and non‐cash subsidies.
Nonetheless, it is common for government, in their budgetary analysis and forecast process, to produce
estimates of expected expenditures on subsidies, based on assumptions on prices and quantity
demanded of products. These constitute additional sources of information for sensitivity analysis to
changes in energy policy.
Balance of Payments and Trade
Effects of energy subsidy policies on balance of payments can take a variety of forms, but the most
important are the direct effects through changes in imports and exports of energy products. These can

40
in principle be measured by means of the analysis of trade flows of energy or energy‐related exportable
products. In addition, there may be several more indirect effects, such as those coming via changed
terms of trade and imports and exports of secondary products (as when subsidized energy is used as
inputs in production of commodities that require other imports as inputs, or are exported). As explained
by the United Nations the commodity structure of external trade flows of goods is analyzed using
various internationally adopted commodity classifications that have different levels of detail and are
based on different classification criteria. The basic reason for applying a goods nomenclature is “to be
able to identify details of the commodities in order to satisfy a variety of purposes, including customs,
statistical and analytical purposes, particularly for the presentation of external trade statistics with the
most detailed commodity specifications”(UN 1998).
Partial Equilibrium Analysis: Comparative Statics
Distortions to optimal resource allocation result from the existence of imperfectly competitive markets,
government interventions, or externalities arising from producers’ or consumers’ activities involving
goods whose price does not incorporate the environment cost. Government interventions can occur via
the application of taxes or subsidies, quantity restrictions, or any other policy that alters the outcomes
from otherwise free market interactions.
Often, government interventions via taxes and subsidies are justified by arguments regarding the
existence of market power, differences in social and private marginal valuations of products
(externalities), or by equity considerations. With respect to subsidies justified on equity grounds, it is
argued that the efficiency losses from the excess government expenditures above the sum of changes in
consumer and producer surplus are more than compensated by the equity gains. The government’s
(normative) view is that benefits to targeted subsidized groups are socially more important than the
benefits that other groups would obtain from government support. According to supporters of the
subsidy, this aspect is not picked up by market price solutions.
Government interventions, by means of selective taxes or subsidies, result in a gap or wedge between
the price consumers pay and the price producers receive for the targeted products. Welfare
consequences of these types of interventions have been traditionally assessed under a single‐market,
comparative statics analysis. The analysis measures the resulting net economic change after considering
all changes in consumers’ and producers’ surpluses, plus the changes in the government fiscal balance.
Taken together, they yield the well‐known deadweight (or efficiency) loss, which results from price
distortions—linked to the intervention—that occur in a hypothetically competitive market, where pre‐
intervention prices would have equalized social and private marginal valuations of the product.
In the case of subsidies, efficiency losses occur because, in the absence of positive externalities, the
gains in consumer and producer surplus are insufficient to compensate for the total government
expenditures associated with the subsidy.
Externalities arise when the activities of some economic agents affect another agent’s welfare or profits,
and this impact is not fully accounted for (internalized) by the first agent. For example, a coal‐fired

41
power station that emits oxides of sulfur, causing damage to building materials or human health,
imposes external costs.
Some types of energy generation and consumption produce greater external effects than others. Some
of the external effects are largely local (such as carbon monoxide pollution), others (such as GHG
emissions) are global, and some are transboundary and in between (e.g., acid rain or fine particulate
pollution).
Since energy subsidies affect the type and quantity of both production and consumption of energy, they
can play a significant role in correcting externalities (e.g., subsidies for cleaner technologies)7 or a
harmful role when they translate into incentives for less desirable sources or lead to over‐consumption
of energy when it is underpriced.
General Equilibrium Analysis
An obvious criticism of comparative‐static analysis is the lack of regard for general equilibrium
considerations. These are important for deadweight loss measures whenever a change in the price of a
subsidized product affects the supply or demand in other markets that are subject to distortions, as
discussed by Hines (1998). In what follows some of the most widely used methods for a dynamic,
general‐equilibrium analysis of changes in energy subsidy policies are described.
1. A financial programming tool: the Revised Minimum Standard Model (RMSM). RMSM is a macro
simulation tool used for the analysis of macroeconomic policies and financial flows across
developing countries. It models an economy by means of a comprehensive flow‐of‐funds
framework. This includes the core national accounts as designed by the UN system, a
representation of public sector accounts, stocks and flows from the monetary sector, and a
representation of the rest of the world via a detailed specification of trade flows and of the
balance of payments. An extended version (RMSM‐X) also includes a stock‐flow characterization
of foreign debt. The model is used for policy analysis and for producing the standard World Bank
reports such as the Country Assistance Strategies’ annexes, and the Unified Survey through a
linkage to World Bank’s Live Database.
RMSM uses a set of deterministic equations, a large number of assumptions, and the
fundamental macroeconomic identities. it uses the flow of funds approach to discern, in a
recursive manner, what values of certain endogenous variables are necessary to reach
equilibrium simultaneously in every sector. It offers the user the possibility of generating a
public, private, or a policy closure.
RMSM can help analyze the impacts of changes in subsidies on the fiscal balance, on trade flows,
on the external sector accounts, and on the real sector. The transmission mechanism of changes
7 The European Community guidelines on state aid for environmental protection explicitly foresee that EU member states may grant operating aid, calculated on the basis of the external costs avoided, to new plants producing renewable energy.

42
in subsidies to sectors of the economy, via flow of funds, will depend, of course, on the way
subsidies are introduced in the model. In the simplest specification, subsidies to local production
are introduced as a fraction of GDP, whereas those to exported or imported products can be
specified in U.S. dollars per unit. In a nutshell, changes in subsidies affect the fiscal balance via
changes in current expenditures (or in net current transfers) and on the fiscal balance, which
then may transmit to the monetary, private, and external sector via changes on public net
domestic or foreign borrowing. In turn, changes in prices of imports or exports affect local
demand or demand in the rest of the world via a specified price elasticity for the subsidized
products.
A more realistic (albeit more complex) model specification may include the following additional
transmission possibilities: changes in price indexes resulting from subsidy modifications, which
may lead to changes in real monetary flows and in private consumption when the variable is
specified in a behavioral way (this is, for the public and policy closures); changes in the real
effective exchange rate for the subsidized items, which affects external trade of these products
based on the assumed real effective exchange rate elasticity; and changes in private investment
when investment is broken down by sectors that respond to changes in relative prices. RMSM
allows for model extension and further detail complexity based on user needs.
Empirical applications of RMSM or financial programming models used for analyzing
macroeconomic impacts from changes in subsidies can be found in Kannapiran (2002) and
Serven (1990).
2. Computable general equilibrium models. Government interventions aimed at specific
commodities will induce significant changes in the flow of resources across markets, beyond
that of the targeted product. From this perspective, analyzing macroeconomic impacts and
micro‐level incidence by focusing on an isolated market (partial equilibrium analysis) may be
misleading from both the quantitative and qualitative standpoint (IMF 1995). By the same
token, an industry not directly subject to government intervention may be indirectly affected by
the imposition of taxes or concessions of subsidies in other industries that produce inputs to,
require output from, or are complementary or substitutes to the former.
Under these circumstances, it is necessary to consider market interactions, observing relative
changes in prices and resource flows, which have ultimate consequences on macroeconomic
and distributional outcomes. Ignoring general equilibrium consequences of government
interventions may be a safe, reasonable approach only if the considered sector is small in terms
of economic activity compared to the rest of the economy and there are negligible substitutions
or complementarities with other commodities. But when interactions are significant, a general
equilibrium approach is necessary.
A standard CGE model is a set of simultaneous equations that define the behavior of the
economic actors and sectors considered to be relevant for the analysis, and that explain all of
the payments across sectors recorded in an economy by means of the SAM described above.
43
The equations define the behavior of the different actors. In part, this behavior follows simple
rules captured by fixed coefficients (for example, ad valorem tax rates). For production and
consumption decisions, behavior is captured by nonlinear, first‐order optimality conditions, that
is, production and consumption decisions are driven by the maximization of profits and utility,
respectively. The equations also include a set of constraints that have to be satisfied by the
system as a whole but are not necessarily considered by any individual actor. These constraints
cover markets (for factors and commodities) and macroeconomic aggregates (balances for
savings‐investment, the government, and the current account of the rest of the world).
Integrative models combine elements from CGE models with individual or household level data
for analyzing the distributional effects of given policies.
Empirical Studies of the Impacts of Energy Subsidies on the Macroeconomy
A number of studies have constructed general equilibrium models to explore the impact of changing the
rate of energy subsidies on the macro‐economy of an individual country. A brief review of some
applications of this type of modeling in the context of developing countries is presented.
1. Kancs (2007) developed a CGE model for assessing socio‐economic effects of alternative
renewable energy policies, applied to the bio‐energy sector in Poland. The main sources of bio‐
energy considered were wood and straw for district and domestic heating and biogas. The multi‐
sector model integrated energy, the economy, and the environment in a single system, and
allowed for comparative analysis by adjusting renewable energy policies or other
macroeconomic conditions (such as world market prices). Distributional and welfare changes
were subsequently analyzed. Scenarios included a 50 percent tax reduction for bio‐energy (S1),
the abolishment of fossil energy subsidies (S2), and a world market price increase of 50 percent
for energy goods (S3). Scenario outcomes were decomposed into price, output, and welfare
effects. Compared to a baseline case, output prices decreased by 2.26 percent in the bio‐energy
sector when indirect taxes are reduced by 50 percent; increased by 1.94 percent in the coal and
peat sector when fossil energy subsidies were eliminated; and increased in the hydrocarbon
sector (oil and natural gas) and the electricity‐steam‐hot water sector by 2.1 percent and 1.8
percent, respectively, when energy world prices were increased by 50 percent. Aggregate
output in the bio‐energy sector increased 6.4 percent in S1; output of the bio‐energy and the oil
plus natural gas rose by 3 percent and 1.7 percent, respectively, in S2; and the hydrocarbon
sector, the bio‐energy sector, and the electricity‐steam‐hot water sector increased by 4.0
percent, 1.5 percent, and 1.05 percent, respectively, in S3.
2. Essama‐Nssah et al. (2007) employed an integrative approach to assess the impact of an oil
shock in South Africa. The model combined a disaggregated CGE model to assess macro and
structural implications of oil price changes. It also had a micro‐simulation component that
attempted to capture the heterogeneity of stakeholders affected by such price changes. The
latter piece of the analysis was conducted under two alternative approaches: one that followed
the envelope theorem (see Ravallion and Lokshin 2004) and another that followed a model of
earnings generation (as in Bourguignon and Ferreira 2005). The model simulated two scenarios:

44
one of a 125 percent increase in the world price of imported crude and refined oil (equal to the
price change observed between 2003 and 2006); and another equal to the first scenario plus a
30 percent increase in the world price of imported basic chemicals and a 6 percent increase in
the world price of all other imported goods. The main results are summarized in Table 4.
Bringing all these aspects together, the study also concluded that a 125 percent rise in the
international price of oil, relative to that in the baseline year of 2003, would lower the per capita
incomes of the bottom six deciles and raise those for the top four deciles. As a result the
distribution of household welfare would become more unequal.
Table 4: Percentage Changes in Macro‐economic Variables in South Africa Resulting from an Oil Price Shock
Variablesa Oil price shock Oil & general price shock
Real exchange rate 16.2 22.4
Exports 7.7 9.1
Imports ‐6.2 ‐10.3
Household consumption ‐6.5 ‐8.8
Total investment ‐7.0 ‐10.8
GDP (market prices) ‐1.8 ‐2.5
Total employment ‐2.1 ‐2.7
Consumer price index 1.9 2.7
Source: Essama‐Nssah et al. 2007. a. All monetary variables are measured in real terms.
3. ESMAP (2004) used a CGE model to simulate the effects of the removal of electricity subsidies in
Mexico over the period 2000–2015 under the assumption that the increased government
revenue from the subsidy removal would be spent on goods and transfers in the same
proportion as historically. The overall effects at the macroeconomic level were small, with GDP,
exports, imports, and employment all experiencing small declines. Welfare decreased for all
income classes, but the poor were affected most because electricity subsidies were more
important in proportionate terms for the lower‐income households. However, the terminal
capital stock increased as the fall in consumption led to more money being channeled to
investment. An alternative scenario assumed that real wages were sticky downwards, and in this
case there was a large fall in employment.
4. Clements, Jung, and Gupta (2003) constructed a CGE model to explore the impact of subsidy
removal on petroleum products in Indonesia. Two scenarios were run. The first used a
Keynesian scenario in which real output declined, leading to a fall in household incomes. The
second was a non‐Keynesian scenario that left aggregate output unchanged. In both scenarios
the prices of all goods rose as a result of the subsidy removal. Although the higher‐income
households were more affected by the subsidy removal, the overall level of poverty in the
economy increased, in part because employment fell among low‐income households. The
authors suggest that these results point to the need for targeted support to the poor if universal
subsidies were to be removed.

45
This brief review indicates that a number of different approaches have been used to model general
equilibrium effects of changes originating in the energy sector. Further development of these
approaches is needed to give experience on which is likely to prove the most useful for further policy
simulations at a country level.
Empirical Studies on the Link between Energy Subsidies and Global Greenhouse Gas Emissions
There has also been interest in analyzing the impact of reducing subsidies on the demand for fossil fuels,
and hence on the emissions of CO2, for groups of countries that would be large enough to make a
difference at a global level. CGE models provide a tool for simulating such changes. Morgan (2007) and
Ellis (2010) review selected studies of this type, and two representative studies are described below. By
including the majority of economies in the model, it is possible to simulate the impact of different
groups of countries adopting various policies to reduce global GHGs.
1. Larsen and Shah (1992) reviewed existing fossil fuel price regimes across the world and
estimated global fossil fuel subsidies and their welfare costs. They used a price gap approach
that estimated differences between domestic fuel prices and their opportunity cost referred to
as world prices. World energy subsidies were estimated at $230 billion, or 0.9 percent of 1992
global GDP. A simple framework was used to estimate the impact of subsidy removal on global
carbon emissions, based on the assumption that world prices of fossil fuels would not change in
response to demand reduction in subsidizing countries. A second exercise incorporated changes
in world prices and the resulting change in fuel consumption from a simple model for global
demand of fossil fuels. Welfare estimations are made under both scenarios. In the first scenario
the removal of all subsidies would result in a global reduction of carbon emissions by 9 percent,
while the second scenario resulted in a global reduction of 4.5 percent. A third scenario
examined a counterfactual on what OECD carbon taxes would be required to achieve world
emission reductions similar to those achieved under a hypothetical elimination of fossil fuel
subsidies. This last scenario indicated that, at the time of writing, a carbon tax in the range of
$50–90 a tonne of carbon would be required.
2. Küster, Ellersdorfer, and Fahl (2007) presented a ten‐region CGE model that included all major
developed and developing economies for the evaluation of energy policy measures, with an
emphasis on employment effects. Their model assumed an economy with a dual labor market
that did not clear (due to minimum wages constraints, given the wage demand and supply
curves) and a technologically detailed description of electricity generation. The model was
applied to assess the economic and employment impacts of energy system decisions in the
context of climate protection. The authors analyzed the effects of investment subsidy on
electricity generation technologies using renewable energy sources in combination with, and in
contrast to, emission caps as imposed by the Kyoto protocol on selected economies. Two
scenarios were examined: a business‐as‐usual case that incorporated only Kyoto protocol GHG
emission caps; and a counterfactual that had the same Kyoto protocol caps assumptions plus
subsidies to renewable energy sources. Impacts on GDP, employment, and CO2 emissions were

46
among the variables calculated. The introduction of capital subsidies for renewable sources of
energy led to an increase in the share of renewable in generation mix, but at the same time the
total amount of generation increased. The shift to renewable energy within the increased total
generation meant that CO2 from fuel combustion decreased in most countries but in some cases
only slightly. The introduction of subsidies also decreased the level of GDP relative to the
baseline case of no subsidies.

47
Incidence of Consumer Subsidies and Policies to Ameliorate the Effects of their Removal
Fuel and electricity subsidies often have as their justification the benefits of providing low‐income
households with energy at affordable prices. Suggestions that subsidies be reduced or removed are
often met with opposition on the grounds of the increased cost to the poor. In this context, the
evaluation of the extent to which energy subsidies are actually received by the poor is important.
Benefit Incidence, Beneficiary Incidence, and Materiality
The measurement of the performance of a consumer subsidy scheme has been described in detail by
Komives et al. (2005). Their work, which focuses on the electricity and water sectors, proposes three
dimensions of subsidy performance:
Benefit incidence (how well the subsidy targets benefits to poor households as opposed to
other households)
Beneficiary incidence (what proportion of poor households as a whole receive the subsidy)
Materiality (how significant is the amount of subsidy received by poor households).
It is possible to have a scheme in which the subsidies are well targeted (most of benefits go to poor
households) but beneficiary incidence is low because only a few poor households actually receive the
subsidy. Alternatively, a subsidy might reach most poor households and only poor households, but be
small in value relative to household income.
The detailed measurement framework suggested to measure these indicators has been used in the
context of electricity consumption, but if sufficient data are available, these indicators can be applied to
all fuels purchased by households. The starting point is the benefit‐targeting indicator (Ω), defined as
the ratio of share of total benefits received by poor households to the proportion of households that are
poor. If the indicator takes a value of unity, the scheme is neutral and the poor receive benefits in
proportion to their numbers. A value greater than unity is progressive and a value less than unity is
regressive, with non‐poor households receiving a larger share of the total subsidy pool than their
proportion in the population. Beneficiary incidence is measured by the exclusion rate—the percentage
of poor households that do not receive the subsidy—while materiality is defined as the average value of
the subsidy received by poor households benefitting from the subsidy as a percentage of their
household income.
The benefit‐targeting indicator can be shown to be equal to the product of five ratios:
Ω = (Ap / AH) × (Up / UH) × (Tp / TH) × (Rp / RH) × (Qp / QH) (2)
where
A = percentage of households that have potential access to the energy source
48
U = percentage of households with access that are connected to the energy source
T = share of households that are connected that are eligible for the subsidy
R = average rate of subsidization for eligible households
Q = average quantity consumed by subsidy recipients
p = group of poor households
H = group of all households.
To compute Ω from these components it is necessary to have household survey data as well as
information from the utility. From the survey, if information has been collected, it is possible to
determine whether a household lives in an area where access is available, and if so whether it is
connected (that is, uses the energy source). Without this information the factors have to be combined
to yield the proportion of households using the energy source. The quantities consumed can also be
determined from the household survey, possibly from expenditure information that can be used to
back‐calculate the quantity using information on the tariff or price charged to end‐users. For electricity
this requires knowledge of the tariff scheme in which different prices may apply to different blocks of
consumption. Knowledge of the subsidy scheme will indicate which households are eligible. A universal
subsidy would have a value of T of unity. The rate of subsidization is calculated from comparison of
household consumption valued at cost‐recovery prices and the actual payment.
To compare poor households with the population as a whole it is necessary to define the poverty level.
This can be done either by identifying a national poverty line or by reference to some internationally
agreed definition of poverty. For example, in a study by Angel‐Urdinola and Wodon (2005) for Cape
Verde, the national poverty line was set at 60 percent of median household expenditure for the year in
question. All households below this level were considered poor and those above non‐poor. Having
identified the two groups of households and their energy consumption levels as well as the nature of the
subsidy scheme, it is possible to construct the three performance measures.
The method outlined above can in principle be applied to both electricity and fuels. For petroleum
products it is unlikely that there will be separate data on access and connection—information on
whether kerosene or LPG are available at a location (allowing for normal distances travelled to purchase
such products) is rarely available. Instead the data from household expenditure surveys can be used to
determine whether a household uses a particular fuel. Petroleum products, if there is a subsidy to
consumers, nearly always attract a universal subsidy with no change in the rate for the volume
purchased. This is primarily because it is difficult to record quantities already purchased by a household
that would allow differential pricing by quantity used per period. Electricity or natural gas can more
easily discriminate between consumers and also by amount purchased. Accordingly, pricing schemes
using increasing block tariffs or volume differentiated tariffs are commonly found. The various
alternatives are discussed below. A volume differentiated tariff reaches only households whose metered
consumption is below a certain threshold, while an increasing block tariff is universal but charges

49
different amounts for successive amounts consumed. These features enter both Ω and the average rate
of subsidization indicator.
Electricity Tariffs and Incidence
The study for Cape Verde investigated the power sector in which the lifeline first block of up to 40
kilowatt hours (kWh) per month was charged at $0.15 per kWh, and all amounts above 40 kWh were
charged at $0.19 per kWh. To calculate the subsidy rate it was assumed that the second block rate
corresponded to the cost of supply per unit. The results of the study on subsidy performance are shown
in Table 5 .
Table 5: Benefit‐Targeting Performance for Electricity in Cape Verde
Variable Poor households All households Ratio
Share of HH with access (A) 0.72 0.82 0.88
Share of HH with access that are connected (U) 0.34 0.54 0.63
Share of connected HH who receive subsidy (T) 1.00 1.00 1.00
Rate of subsidization (R) 0.11 0.06 1.70
Average quantity consumed per month in kWh (Q) 56.8 111.7 0.51
Average HH expenditure per month in U.S. $ 9.6 19.7 n.a.
Source: Angel‐Urdinola and Wodon 2005 as reported in Komives et al. 2005.
Note: n.a. = not applicable.
The targeting performance indicator (Ω) was 0.48, indicating substantial regressivity of the subsidy
scheme, while the exclusion rate of the poor was 76 percent (comprising the 28 percent of poor
households without access and the 48 percent of poor households that have access but are not
connected). For poor households the materiality of the subsidy was equivalent to 0.5 percent of their
total household expenditure, and for non‐poor households it amounted to 0.2 percent of expenditure.
The poor performance of Ω in Cape Verde was due in large part to the much lower access and
connection rates of the poor than those of the better‐off. Where these are low the rate of subsidization
(R) must be much higher for the poor than for the non‐poor in order to compensate. The use of an
increasing block tariff, resulting in a value of T equal to unity (all households benefit from the cheaper
first block), also works against the subsidy being pro‐poor. In a case like this, the two subsidy design
features (R and T) would need to be substantially adjusted to offset the low rate of connection among
poor households.
Angel‐Urdinola and Wodon (2005) also simulated the effect of replacing an increasing block tariff with a
volume differentiated tariff, where the threshold was the same as the first block of the increasing block
tariff (40 kWh per month) and the price of those receiving the volume differentiated tariff was the same
as that of the first block, while all others paid the full cost, namely the price of the second block. In this
case the ratio of Tp to TH rose to 1.99 (the subsidy was confined mainly to the poor), with the result that
Ω rose to 1.06, showing slight progressivity. A similar study for Mexico by Komives et al. (2009)
simulated various alternative subsidy schemes for electricity and found that means‐tested discounts or a

50
volume differentiated tariff would increase Ω. The high rate of connections meant that exclusion rates
would be low under any scheme.
Komives et al. (2005) give the values of Ω and beneficiary incidence for electricity purchases in a number
of countries. Annex table A.5 reports a series of calculations on subsidy performance in the power sector
in various countries. These results confirm that, where there is almost universal connection (for example
Croatia and Hungary), virtually no poor households are excluded from receiving some benefit from the
subsidy program. Countries that relied on an increasing block tariff tended to have a regressive
distribution of the total subsidy pool, while those that were able to use some more precise targeting
criterion (such as a means‐tested subsidy) had better benefit targeting and in some cases had a
progressive structure of assistance to poor households. For Sub‐Saharan Africa, where connection rates
are low, a recent study by Foster and Briceño‐Garmendia (2010) reported calculations by Banerjee et al.
(2008) and Wodon (2008) indicating that Ω for electricity ranged between 2 and 80 percent for the 19
countries analyzed. That is, in all cases the subsidies were regressive, often severely so.
Electricity Connection Subsidies and Incidence
A similar approach can be used to analyze the performance of connection subsidies for electricity.
Because existing connection rates are low and are largely confined to better‐off households in low‐
income countries, a subsidy on new connections may have good benefit‐targeting performance. In the
case of Cape Verde was 1.35, indicating that such a policy would be progressive. Foster and Briceño‐
Garmendia (2010) point out that the targeting performance of connection subsidies depends strongly on
how the roll‐out of new connections is made. In countries with low existing connection rates a roll‐out
policy that mirrored the existing pattern of household connections would tend to be regressive since
these will tend to be the rich. A simulation for Sub‐Saharan Africa indicated that where new connections
mirrored the existing pattern would be only 0.37; when only households beyond the reach of the
existing network were connected Ω would rise to 0.95; and providing a connection subsidy equally likely
to reach all unconnected households would raise to 1.18 (a progressive result). This finding has to be
seen in the context of the relative costs of the subsidy programs. Grid‐based roll‐outs that concentrate
on connecting households in areas where there is already access (densification) are likely to be
considerably less expensive per connection than roll‐outs that seek to expand the area covered. In Lao
PDR, a pilot power‐to‐the‐poor program provided eligible households with a no‐cost basic 3/9 ampere
meter (low voltage) together with interest‐free credit to cover additional costs of installation and indoor
wiring. In the villages targeted this resulted in the connection rate increasing from 78 to 95 percent, and
from 63 to 90 percent among female‐headed households (Boatman and Chanthalinh 2009).
Petroleum Products Prices and Incidence
For petroleum products in virtually all cases subsidies are universal (T equals unity) and the rate of
subsidy is constant for all quantities purchased, so that the ratio of the R factors is also unity whatever
the level of subsidy. If the price paid by all users is the same, then using these two assumptions, it
follows that Ω is equal to the ratio of the average expenditure of the poor to the average expenditure of
all households on the fuel in question. This result makes it relatively simple to calculate what would be
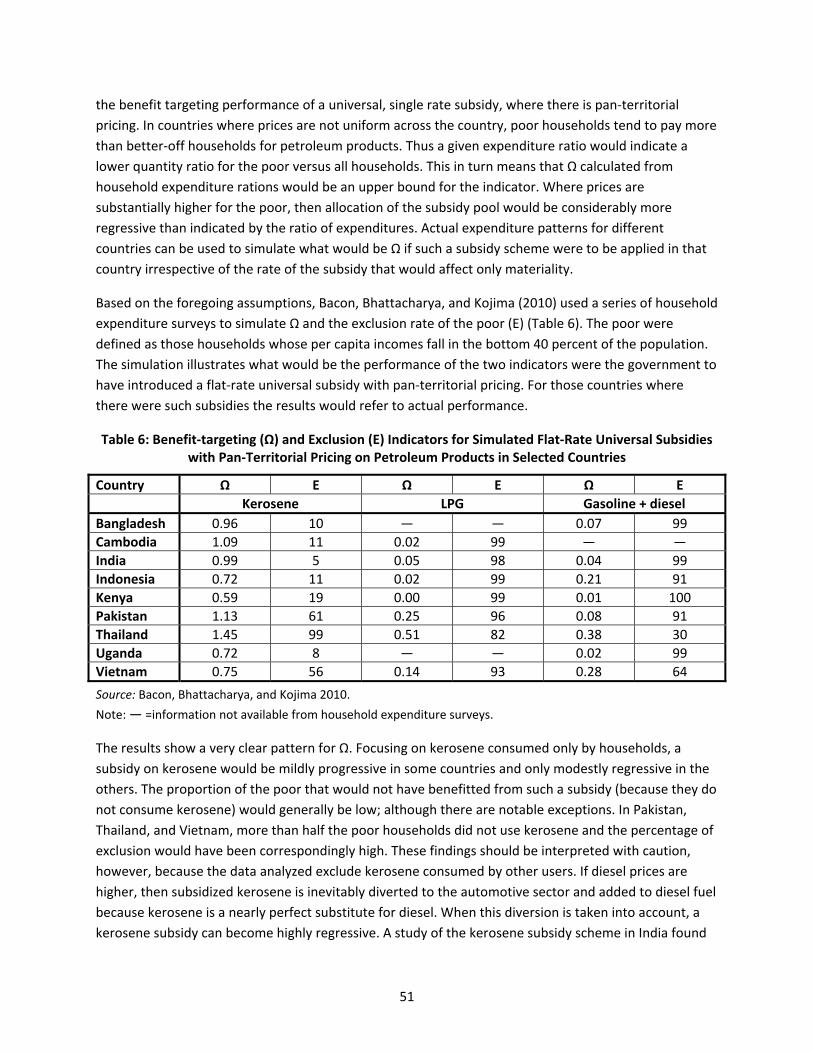
51
the benefit targeting performance of a universal, single rate subsidy, where there is pan‐territorial
pricing. In countries where prices are not uniform across the country, poor households tend to pay more
than better‐off households for petroleum products. Thus a given expenditure ratio would indicate a
lower quantity ratio for the poor versus all households. This in turn means that Ω calculated from
household expenditure rations would be an upper bound for the indicator. Where prices are
substantially higher for the poor, then allocation of the subsidy pool would be considerably more
regressive than indicated by the ratio of expenditures. Actual expenditure patterns for different
countries can be used to simulate what would be Ω if such a subsidy scheme were to be applied in that
country irrespective of the rate of the subsidy that would affect only materiality.
Based on the foregoing assumptions, Bacon, Bhattacharya, and Kojima (2010) used a series of household
expenditure surveys to simulate Ω and the exclusion rate of the poor (E) (Table 6). The poor were
defined as those households whose per capita incomes fall in the bottom 40 percent of the population.
The simulation illustrates what would be the performance of the two indicators were the government to
have introduced a flat‐rate universal subsidy with pan‐territorial pricing. For those countries where
there were such subsidies the results would refer to actual performance.
Table 6: Benefit‐targeting (Ω) and Exclusion (E) Indicators for Simulated Flat‐Rate Universal Subsidies with Pan‐Territorial Pricing on Petroleum Products in Selected Countries
Country Ω E Ω E Ω E
Kerosene LPG Gasoline + diesel
Bangladesh 0.96 10 — — 0.07 99
Cambodia 1.09 11 0.02 99 — —
India 0.99 5 0.05 98 0.04 99
Indonesia 0.72 11 0.02 99 0.21 91
Kenya 0.59 19 0.00 99 0.01 100
Pakistan 1.13 61 0.25 96 0.08 91
Thailand 1.45 99 0.51 82 0.38 30
Uganda 0.72 8 — — 0.02 99
Vietnam 0.75 56 0.14 93 0.28 64
Source: Bacon, Bhattacharya, and Kojima 2010.
Note: — =information not available from household expenditure surveys.
The results show a very clear pattern for Ω. Focusing on kerosene consumed only by households, a
subsidy on kerosene would be mildly progressive in some countries and only modestly regressive in the
others. The proportion of the poor that would not have benefitted from such a subsidy (because they do
not consume kerosene) would generally be low; although there are notable exceptions. In Pakistan,
Thailand, and Vietnam, more than half the poor households did not use kerosene and the percentage of
exclusion would have been correspondingly high. These findings should be interpreted with caution,
however, because the data analyzed exclude kerosene consumed by other users. If diesel prices are
higher, then subsidized kerosene is inevitably diverted to the automotive sector and added to diesel fuel
because kerosene is a nearly perfect substitute for diesel. When this diversion is taken into account, a
kerosene subsidy can become highly regressive. A study of the kerosene subsidy scheme in India found
52
that subsidized kerosene consumed by households was evenly shared between the rich and the poor,
but up to as much as half of subsidized kerosene might have been diverted to non‐household users
(ESMAP 2003a).
For LPG, gasoline, and diesel, Ω would be very low, indicating extreme regressivity. The main exception
to this pattern was Thailand where the much higher per capita consumption and income (twice the next
country, Indonesia, when measured at purchasing power parity) led to a wider‐scale use of these fuels
and a smaller difference in consumption between low‐income and other households. The exclusion
figures indicate that the great majority of the poor would be excluded from receiving any direct benefit
from subsidies on LPG or gasoline and diesel. These simulated results based on the expenditure patterns
of a variety of countries with different fuel use patterns and price levels suggest that subsidies on
transportation fuels and LPG are likely to be strongly regressive in countries with low to moderate
income levels.
Policy Tools to Protect the Poor8
If subsidies linked to the price of energy are to be phased out, there are a number of alternative policies
that can provide direct assistance to the poor who would be adversely affected by the subsidy removal.
These policies, known as social safety nets, can take a number of forms (Grosh et al. 2008). Direct
transfers may include targeted cash payments, or near‐cash payments (such as vouchers and food
stamps), while indirect transfers may include fee waivers for essential services such as health,
education, or transport. The advantage of these policies is their ability to be well targeted to the poor,
resulting in a lower cost to the government to deliver the same benefits to low‐income households. In
particular, in countries where several different consumer goods are subsidized, there can be an
important economy of scale and scope in using a social safety net program to protect poor households
from the removal or reduction of all these different subsidies.
The use of targeted cash or near‐cash programs has been relatively successful in ensuring that the
benefits reach the poor. Out of 24 schemes analyzed for the period 2005–2008, two thirds were
transferring more than half of the funds to the poorest quartile of the population (Figure 1).
Komives et al. (2007) compared the mean benefit‐targeting performance of utility subsidies versus other
targeting instruments. Although based on different samples of countries, the results shown in Table 7
give a clear picture. The average consumption subsidy for electricity is regressive, and only one in five of
the 37 cases studied was progressive. By contrast, cash transfers and near‐cash transfers (food stamps,
etc.) were progressive in the great majority of cases studied.
8 This section draws on the background work on social protection drafted by Bassam Ramadan and Lucian Pop for the World Bank’s contribution to the “Analysis of the Scope of Energy Subsidies and Suggestions for the Implementation of Their Phasing Out,” a joint report of the IEA, OPEC, OECD, and the World Bank for the April 23, 2010, meeting of G‐20 finance ministers.
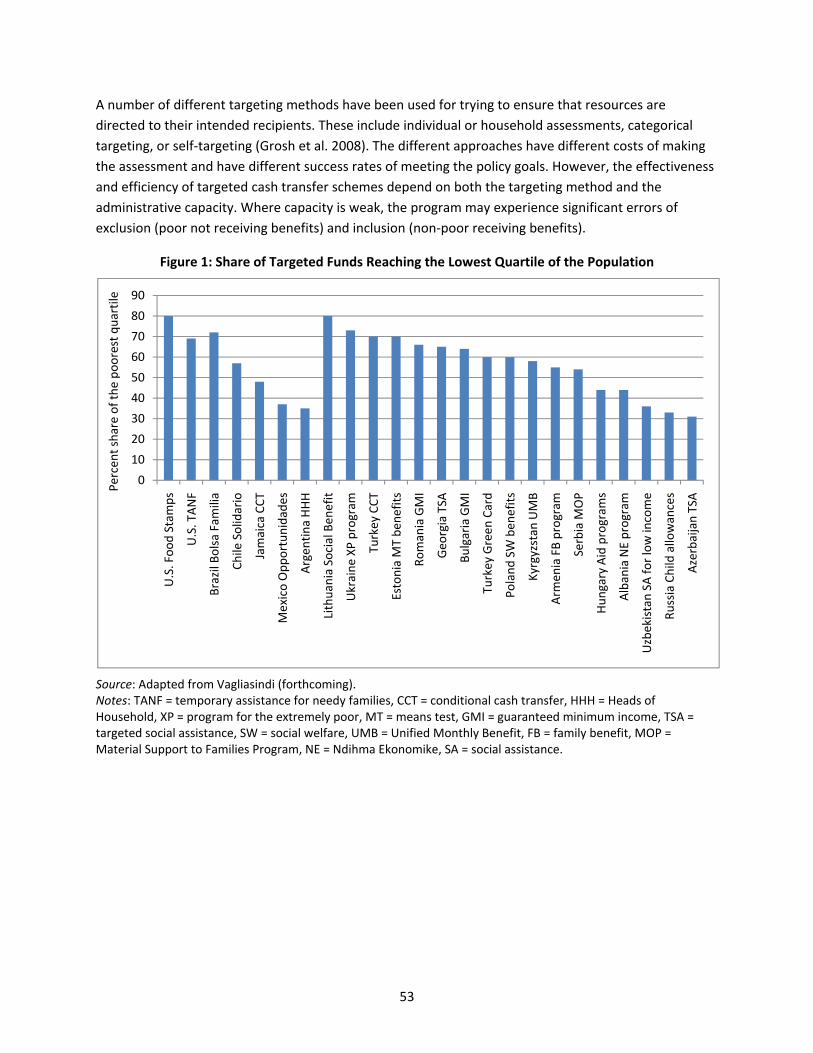
53
A number of different targeting methods have been used for trying to ensure that resources are
directed to their intended recipients. These include individual or household assessments, categorical
targeting, or self‐targeting (Grosh et al. 2008). The different approaches have different costs of making
the assessment and have different success rates of meeting the policy goals. However, the effectiveness
and efficiency of targeted cash transfer schemes depend on both the targeting method and the
administrative capacity. Where capacity is weak, the program may experience significant errors of
exclusion (poor not receiving benefits) and inclusion (non‐poor receiving benefits).
Figure 1: Share of Targeted Funds Reaching the Lowest Quartile of the Population
Source: Adapted from Vagliasindi (forthcoming). Notes: TANF = temporary assistance for needy families, CCT = conditional cash transfer, HHH = Heads of Household, XP = program for the extremely poor, MT = means test, GMI = guaranteed minimum income, TSA = targeted social assistance, SW = social welfare, UMB = Unified Monthly Benefit, FB = family benefit, MOP = Material Support to Families Program, NE = Ndihma Ekonomike, SA = social assistance.
0
10
20
30
40
50
60
70
80
90
U.S. Food Stamps
U.S. TANF
Brazil Bolsa Familia
Chile Solidario
Jamaica CCT
Mexico Opportunidades
Argen
tina HHH
Lithuania Social Ben
efit
Ukraine XP program
Turkey CCT
Estonia M
T ben
efits
Romania GMI
Geo
rgia TSA
Bulgaria GMI
Turkey Green
Card
Poland SW ben
efits
Kyrgyzstan UMB
Arm
enia FB program
Serbia M
OP
Hungary Aid program
s
Albania NE program
Uzbekistan SA for low income
Russia Child
allowances
Azerbaijan TSA
Percent share of the poorest quartile

54
Table 7: Benefit‐targeting Performance of Utility Subsidies Relative to Other Targeting Instruments
Type of transfer Number of cases
Mean Ω
Range of Ω Percentage of cases with progressive distribution
(Ω > 1)
Electricity consumption subsidy 37 0.76 0.20–1.50 22
Cash transfers 28 1.53 0.40–3.47 82
Near cash transfers 16 1.26 0.58–1.63 94
Public works 4 2.30 1.48–4.0 100
Social funds 6 1.13 0.93–1.30 83
Food subsidy 15 0.84 0.28–1.23 27
Source: Komives et al. 2007.
The use of output‐based aid can take the form of a connection subsidy. The aid is conditional on the
service first being provided to the targeted households, which has the advantage of requiring the
identification of the households that need the subsidies most. In Armenia grants were given for the
fitting of gas heaters, and in Colombia connections for 35,000 homes to natural gas were financed in this
way. A way of avoiding the long‐term commitment of a universal energy subsidy is to use a transitional
tariff subsidy that is phased out as user contributions increase over time.
The government also needs to be able to monitor and carry out the targeting scheme. The presence of
low‐level and high‐level corruption can severely limit the effectiveness of targeted subsidy schemes, and
add to the administrative cost that must be considered in deciding whether to implement a particular
approach. A further difficulty for some schemes is that they can give incentives to certain members of
the population to become eligible for receipt of the subsidy. Geographical targeting (with subsidies
based on the location of the household’s residence) may encourage households to relocate. Income‐
based schemes may create a poverty trap in which the benefits from increasing earned income are
largely offset by the loss of benefits from subsidies contingent on earned income.
Patterns of Household Expenditure on Energy
To obtain a more detailed picture on materiality, household expenditure survey data can provide the
shares of expenditure on electricity (or other forms of energy) by quintile. If this share declines at higher
expenditure quintiles, materiality is pro‐poor with a universal subsidy. The IMF and the World Bank have
published a number of studies on household energy consumption. Some of these refer only to the
expenditure on petroleum products and others just to the consumption of electricity. Komives et al.
(2005) provide information on shares of household expenditure spent on electricity by quintile group for
a number of countries. The shares for the bottom quintile and the top quintile are shown in annex table
A.6. For most countries the share of household expenditure on electricity is greater for the lowest
quintile than for the highest quintile, indicating that a universal constant subsidy would have greater
materiality for the poor. However, the majority of such cases were either countries in the ECA region
that had near universal connection because of historic policies, or high‐income countries where most
households were connected.

55
Material from a number of other studies is summarized in Bacon, Bhattacharya, and Kojima
(forthcoming). Several of these studies refer just to expenditure on individual petroleum products, and
some only to expenditure on electricity. The main patterns found for these countries (referred to as
group 1 hereafter) are summarized in Table 8. Although this table does not indicate the extent of
subsidies in the various countries it illustrates some relevant aspects of energy demand that relate to
the incidence of any subsidies in these or similar countries. In half of the countries for which information
was available the share of household expenditure on energy (excluding biomass) was greater than five
percent of total household expenditure for the lowest quintile. To the extent that these countries are
representative of a wider range of developing countries, the importance of commercial energy for low‐
income groups suggests that, where subsidies are prevalent across the energy sector, removal could
have an important adverse direct effect on the standard of living of this group. For individual fuels the
share of spending on kerosene fell across income groups in virtually all countries: kerosene is important
for the poor and removal of subsidies is likely to hit such households hardest. By contrast, the share of
expenditure on LPG and on gasoline rose with the income level—these are fuels of the better‐off and
subsidies may well not benefit the poor to a great extent. For electricity many surveys did not report
expenditures, but where this was recorded the picture was mixed. The share rose with income in some
countries, while it declined in others.
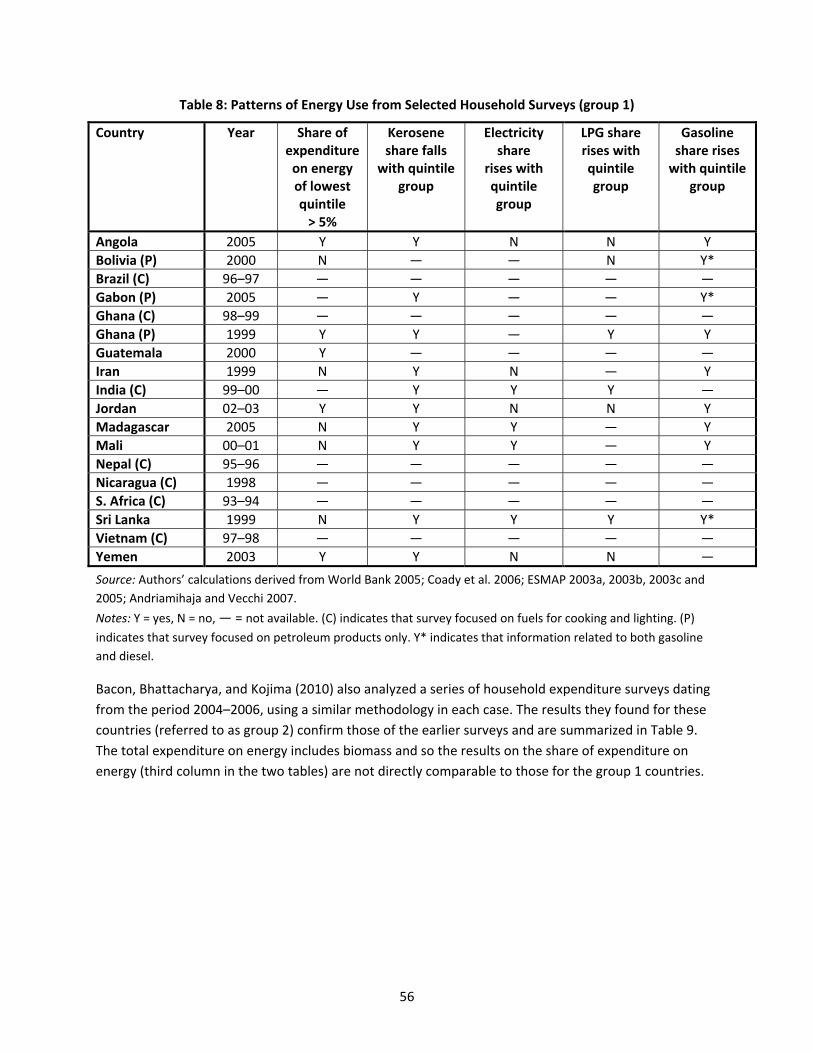
56
Table 8: Patterns of Energy Use from Selected Household Surveys (group 1)
Country Year Share of expenditure on energy of lowest quintile > 5%
Kerosene share falls
with quintile group
Electricity share
rises with quintile group
LPG share rises with quintile group
Gasoline share rises with quintile
group
Angola 2005 Y Y N N Y
Bolivia (P) 2000 N — — N Y*
Brazil (C) 96–97 — — — — —
Gabon (P) 2005 — Y — — Y*
Ghana (C) 98–99 — — — — —
Ghana (P) 1999 Y Y — Y Y
Guatemala 2000 Y — — — —
Iran 1999 N Y N — Y
India (C) 99–00 — Y Y Y —
Jordan 02–03 Y Y N N Y
Madagascar 2005 N Y Y — Y
Mali 00–01 N Y Y — Y
Nepal (C) 95–96 — — — — —
Nicaragua (C) 1998 — — — — —
S. Africa (C) 93–94 — — — — —
Sri Lanka 1999 N Y Y Y Y*
Vietnam (C) 97–98 — — — — —
Yemen 2003 Y Y N N —
Source: Authors’ calculations derived from World Bank 2005; Coady et al. 2006; ESMAP 2003a, 2003b, 2003c and
2005; Andriamihaja and Vecchi 2007.
Notes: Y = yes, N = no, — = not available. (C) indicates that survey focused on fuels for cooking and lighting. (P)
indicates that survey focused on petroleum products only. Y* indicates that information related to both gasoline
and diesel.
Bacon, Bhattacharya, and Kojima (2010) also analyzed a series of household expenditure surveys dating
from the period 2004–2006, using a similar methodology in each case. The results they found for these
countries (referred to as group 2) confirm those of the earlier surveys and are summarized in Table 9.
The total expenditure on energy includes biomass and so the results on the share of expenditure on
energy (third column in the two tables) are not directly comparable to those for the group 1 countries.
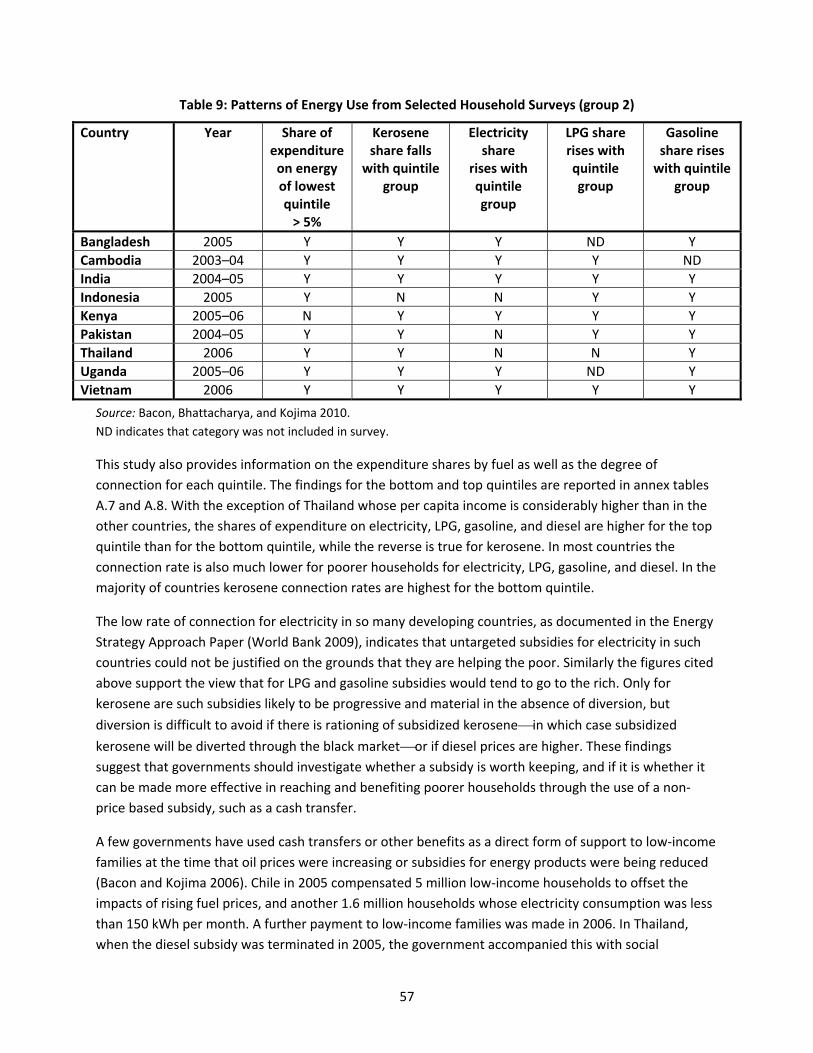
57
Table 9: Patterns of Energy Use from Selected Household Surveys (group 2)
Country Year Share of expenditure on energy of lowest quintile > 5%
Kerosene share falls
with quintile group
Electricity share
rises with quintile group
LPG share rises with quintile group
Gasoline share rises with quintile
group
Bangladesh 2005 Y Y Y ND Y
Cambodia 2003–04 Y Y Y Y ND
India 2004–05 Y Y Y Y Y
Indonesia 2005 Y N N Y Y
Kenya 2005–06 N Y Y Y Y
Pakistan 2004–05 Y Y N Y Y
Thailand 2006 Y Y N N Y
Uganda 2005–06 Y Y Y ND Y
Vietnam 2006 Y Y Y Y Y
Source: Bacon, Bhattacharya, and Kojima 2010.
ND indicates that category was not included in survey.
This study also provides information on the expenditure shares by fuel as well as the degree of
connection for each quintile. The findings for the bottom and top quintiles are reported in annex tables
A.7 and A.8. With the exception of Thailand whose per capita income is considerably higher than in the
other countries, the shares of expenditure on electricity, LPG, gasoline, and diesel are higher for the top
quintile than for the bottom quintile, while the reverse is true for kerosene. In most countries the
connection rate is also much lower for poorer households for electricity, LPG, gasoline, and diesel. In the
majority of countries kerosene connection rates are highest for the bottom quintile.
The low rate of connection for electricity in so many developing countries, as documented in the Energy
Strategy Approach Paper (World Bank 2009), indicates that untargeted subsidies for electricity in such
countries could not be justified on the grounds that they are helping the poor. Similarly the figures cited
above support the view that for LPG and gasoline subsidies would tend to go to the rich. Only for
kerosene are such subsidies likely to be progressive and material in the absence of diversion, but
diversion is difficult to avoid if there is rationing of subsidized kerosenein which case subsidized
kerosene will be diverted through the black marketor if diesel prices are higher. These findings
suggest that governments should investigate whether a subsidy is worth keeping, and if it is whether it
can be made more effective in reaching and benefiting poorer households through the use of a non‐
price based subsidy, such as a cash transfer.
A few governments have used cash transfers or other benefits as a direct form of support to low‐income
families at the time that oil prices were increasing or subsidies for energy products were being reduced
(Bacon and Kojima 2006). Chile in 2005 compensated 5 million low‐income households to offset the
impacts of rising fuel prices, and another 1.6 million households whose electricity consumption was less
than 150 kWh per month. A further payment to low‐income families was made in 2006. In Thailand,
when the diesel subsidy was terminated in 2005, the government accompanied this with social

58
measures designed particularly to help the poor and those in rural areas. These measures included a pay
rise for civil servants, higher pension payments, and a provision of a fund to support villages nationwide.
In Ghana the government accompanied the removal of petroleum product subsidies with the
elimination of fees at government‐run primary and secondary schools and a program to improve public
transport.
The case of Indonesia, as described by Widjaja (2009), Kojima (2009b), and the World Bank (2006),
illustrates how redesigning a subsidy scheme can work to ensure benefits are better targeted to the
poor. In 2005 the Government of Indonesia decided to reduce the large universal subsidies on gasoline,
kerosene, and diesel by raising their domestic prices twice, resulting in increases of by 149, 186 and 161
percent respectively. To compensate lower‐income households for this price increase, the government
distributed to each eligible household identified a sum of 100,000 rupiah per month over a six month
period in 2005–2006. In 2005 the definition of an eligible household was one where the per capita
expenditure was 175,000 rupiah (around $17.5) per month. Calculations indicated that, without the
targeted cash transfer scheme, the number of people living below the poverty line of 110,000 per
month would have increased from 17 percent to 22 percent following the petroleum product subsidy
reduction. The success of the targeting scheme in countering this effect depended on the ability of the
scheme to reach eligible households. To this end the government commissioned a new survey of
households and identified 15.5 million poor or near‐poor households that fell below the eligibility
ceiling. It was estimated that if all these households had received the full amount of the transfer the
number of people below the poverty line would have risen by about 1 percentage point. In practice,
during the first three months of the scheme, 94 percent claimed to have received 100 percent of the
transfer, and during the second three months 90 percent claimed to have received the full amount.
Based on these figures it was estimated that the percentage of people living below the poverty line as a
result actually rose by about 2 percentage points. Analysis of expenditure patterns suggested that
households in the bottom three deciles would have been fully compensated had the targeting been
perfect, while the upper deciles would not have been fully compensated. This is explained by the fact
that household expenditure increased modestly by decile for kerosene, but increased very sharply for
gasoline, with the result that the total monthly petroleum product subsidy received per person before
the price increase was just less than 10,000 rupiah for the lowest decile and was about 45,000 rupiah for
the top decile. The partial replacement of universal subsidies by targeted cash transfers was markedly
pro‐poor, and also appeared to have a low exclusion rate. Some information was collected on how
household spent the cash transfer and this revealed that virtually all household spent some on the
purchase of rice. Eighty percent spent some on purchases of kerosene, while about five percent spent
some on purchases of gasoline. Debt repayment, health, and education were mentioned by at least one
quarter of the households. These figures tend to confirm the general proposition that, where a subsidy
is replaced by extra cash income, households obtain the greatest utility not from spending only on the
formerly subsidized commodity but from a reallocation of expenditure. The low number of household
spending on gasoline also supports the view that the subsidy on this fuel was reaching only a few poor
households and was a low priority for the poor.
59
Following its experience with targeted cash transfers to support households affected by the decrease in
kerosene, gasoline, and diesel subsidies, the government of Indonesia launched a kerosene‐to‐LPG
conversion program in 2007 to reduce the overall fiscal burden on the treasury. The government
provided free LPG stoves and 3 kilogram cylinders targeted to reach some 42 million families by 2010.
Because the fuel cost of LPG was lower than that of kerosene, even when the latter was subsidized, this
program reduced fuel costs to households. At the same time the government estimated that the total
subsidy bill had been reduced considerably (LKBN Antara 2009). These measures notwithstanding, about
$7 billion (more than 1 percent of GDP) has been allocated for subsidized fuels in the 2010 budget bill
(Jakarta Post 2009).
Studies examining household energy expenditure patterns before and after subsidy removal appear not
to have been carried out in developing countries. This is in part because household expenditure surveys
are fielded infrequently and, when they are repeated, they may not use the identical questionnaire. An
example of the analysis of changing energy patterns of use during a period of changing prices, but not of
the impacts of changes in subsidy schemes, was carried out by Bacon, Bhattacharya, and Kojima (2009)
for Indonesia and Pakistan.
The Effect of Subsidy Removal on Households
The subsidy performance indicators measure the transfer of resources to households and its
progressivity for the current levels of consumption. Several other factors influence the effects of subsidy
removal on households:
The increase in the cost of living caused by knock‐on effects of higher energy prices onto other
prices
The changes in quantities purchased as a result of an increase in the energy price
The macroeconomic effects caused by the shift in resources from the energy sector and by the
impacts on the government budget.
The estimation of the effects on household expenditure and welfare caused by a change in the price of
an energy product needs to take into account both the direct effect of the increase in energy price and
the indirect effects of the increase in other prices caused by the increase in energy prices. To establish
the links between energy prices and the prices of other goods an input‐output table is required. From
this table the energy input into other goods can be calculated—for example public transport uses a
certain amount of petroleum products and its price will increase when petroleum product prices rise,
unless there is a further subsidy introduced. A more complex chain would arise in the case of (say)
foodstuffs. Higher petroleum product prices lead to higher input costs in agriculture (fertilizers, diesel
for tractors and irrigation pumps) and higher costs of transporting food to the market, resulting in
higher foodstuff prices at retail. The use of an input‐output table can capture all these links and reveal
the total effect on final prices of a change in energy prices. Where a household expenditure survey is
also available, the effects on the cost of living for different income groups can be calculated. An
important limitation of this type of analysis is that substitution is not modeled and households are

60
assumed not to change the quantities purchased of each item or to switch to new items, despite the
changes in real income and relative prices that would have occurred.
A few studies have applied such a methodology. The World Bank (2003) carried out an analysis for Iran
of the potential increases in the final prices of all goods following the removal of all energy subsidies;
Coady and Newhouse (2006) carried out a similar exercise for Ghana on the assumption that subsidies
were removed on gasoline, kerosene, and LPG; Kpodar (2006) analyzed the impacts of removing
subsidies on gasoline, diesel, and kerosene in Mali; and Andriamihaja and Vecchi (2007) considered the
impact of removing subsidies on electricity, gasoline, diesel, and kerosene in Madagascar. For Iran the
direct and indirect effects were not shown separately, but results from for the three latter studies are
shown in Table 10. All three studies indicated that the indirect effects on the cost of buying the same
bundle of goods were large, and in some cases were even greater than the direct effects.
Table 10: Real Income Effects of Removing Energy Subsidies (percentage change in total expenditures)
Country Effect Quintile 1 (poorest)
Quintile 2 Quintile 3 Quintile 4 Quintile 5 (richest)
Ghana Direct 2.9 2.0 1.7 1.3 1.4
Indirect 6.2 6.6 6.7 6.9 6.8.
Total 9.1 8.7 8.5 8.2 8.2
Mali Direct 0.9 0.8 0.7 0.8 1.0
Indirect 0.9 0.8 0.8 0.8 0.9
Total 1.8 1.6 1.5 1.6 1.9
Madagascar Direct 2.3 1.6 1.4 1.2 1.1
Indirect 0.9 0.9 0.9 1.0 1.2
Total 3.2 2.5 2.3 2.2 2.3
Sources: Coady and Newhouse 2006; Kpodar 2006; Andriamihaja and Vecchi 2007.
Note: Energy sources for which subsidies are removed are gasoline, kerosene, and LPG in Ghana; gasoline, diesel,
and kerosene in Mali; and electricity, gasoline, diesel, and kerosene in Madagascar.
The table also indicates the importance of direct energy subsidies for the sources studied. Overall the
subsidies were most important for the lowest quintile in two of the countries and were equivalent to 3
percent of total household expenditure for that group in Ghana. These results suggest that taking
indirect as well as direct price effects into account is important when considering the likely effects of
subsidy removal on household welfare. However, there are a number of practical difficulties to
implementing this approach:
Many countries do not have input‐output tables.
Even where an input‐output table exists it may relate to a time several years in the past, and the
various coefficients may have changed since then.
The categories of commodities in the household survey and input‐output table may be different,
and converting to a common set may be difficult.

61
The household survey, the input‐output table, or both may not contain sufficient detail to
separate the various energy sources. This is important where consideration is being given to
raising the prices of a subset of energy sources through subsidy reform.
One of the reasons advanced for removing subsidies is that, where their distributional benefit is low, an
increase in prices will result in a more optimal use of domestic resources by reducing demand for
energy9 and increasing expenditure on other goods. This reduction in demand for energy would in turn
result in a reduction in CO2 emissions in all sectors where the subsidized energy is used. Concern for the
effects of global warming has led to a number of calls to remove consumer (and producer) subsidies in
both developed and developing countries. The full effect of subsidy removal on energy demand is
complex, as explained in the section on macro‐economic linkages above, but a central parameter is the
price elasticity of demand for energy sources. The price elasticity is defined as the percentage change in
quantity that would result from a one percent change in prices. For developing countries there is little
information on the magnitude of energy price elasticities, and some studies have referred to work done
on developed countries to provide an estimate of their magnitude. Larsen and Shah (1992) used values
of long‐run elasticities predominantly in the range of 0.15 to 0.35 for petroleum products, while the IEA
(1999) used default values of 0.25 for transport related fuel demand, 0.5 for fuels used in stationary
uses by households and industry, and 0.5 for electricity for cases where country‐based estimates were
not available. Serletis, Timilsina, and Vasetsky (2009) provide long‐run own price elasticities for the main
sources of energy for a number of countries and these are shown in Table 11. In virtually all cases these
are small, suggesting that large price increases would be needed to reduce the demand for the various
energy sources by a significant amount. These low price elasticities would suggest that evaluating the
welfare losses to households following a reduction in an energy subsidy based on the assumption of no
change in the quantity purchased (zero price elasticity) is a reasonable first approximation.
Table 11: Own Price Elasticities for Selected Countries
Country Oil Gas Coal Electricity
Canada ‐0.04 ‐0.15 — ‐0.00
France ‐0.03 ‐0.00 ‐0.08 ‐0.01
Japan ‐0.03 ‐0.00 ‐0.19 ‐0.01
Italy ‐0.03 — ‐0.02 ‐0.07
UK ‐0.04 ‐0.13 ‐0.18 ‐0.56
USA ‐0.01 ‐0.00 ‐0.03 ‐0.40
Poland ‐0.06 ‐0.01 ‐0.24 ‐0.00
Hungary ‐0.07 ‐0.08 ‐0.21 ‐0.53
Mexico ‐0.01 ‐0.05 ‐0.09 ‐0.17
Turkey ‐0.07 — ‐0.12 ‐0.02
Venezuela ‐0.04 ‐0.06 — ‐0.03
9 Although higher prices usually depress demand, the opposite could occur where price subsidies have led to energy shortages whereby those who are willing and able to purchase more energy at higher prices have been prevented from doing so. Removing subsidies under such circumstances could lead to an increase in energy supply that in turn could increase, rather than decrease, energy consumption and CO2 emissions.
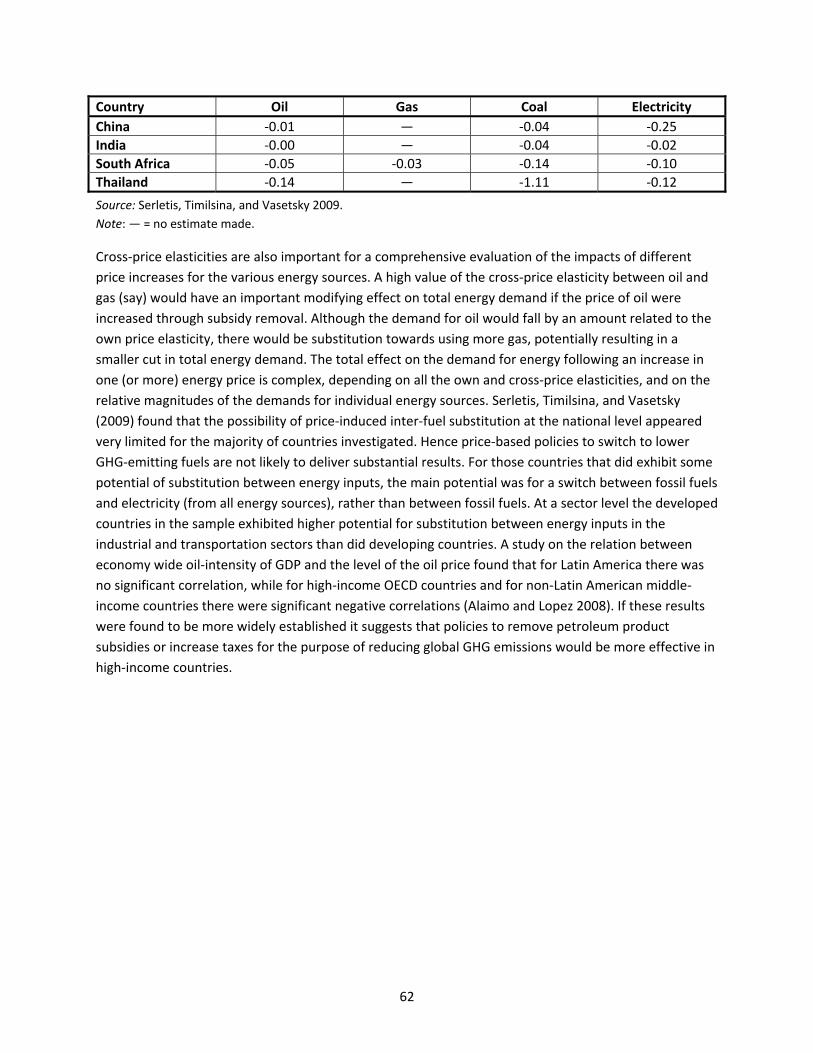
62
Country Oil Gas Coal Electricity
China ‐0.01 — ‐0.04 ‐0.25
India ‐0.00 — ‐0.04 ‐0.02
South Africa ‐0.05 ‐0.03 ‐0.14 ‐0.10
Thailand ‐0.14 — ‐1.11 ‐0.12
Source: Serletis, Timilsina, and Vasetsky 2009.
Note: — = no estimate made.
Cross‐price elasticities are also important for a comprehensive evaluation of the impacts of different
price increases for the various energy sources. A high value of the cross‐price elasticity between oil and
gas (say) would have an important modifying effect on total energy demand if the price of oil were
increased through subsidy removal. Although the demand for oil would fall by an amount related to the
own price elasticity, there would be substitution towards using more gas, potentially resulting in a
smaller cut in total energy demand. The total effect on the demand for energy following an increase in
one (or more) energy price is complex, depending on all the own and cross‐price elasticities, and on the
relative magnitudes of the demands for individual energy sources. Serletis, Timilsina, and Vasetsky
(2009) found that the possibility of price‐induced inter‐fuel substitution at the national level appeared
very limited for the majority of countries investigated. Hence price‐based policies to switch to lower
GHG‐emitting fuels are not likely to deliver substantial results. For those countries that did exhibit some
potential of substitution between energy inputs, the main potential was for a switch between fossil fuels
and electricity (from all energy sources), rather than between fossil fuels. At a sector level the developed
countries in the sample exhibited higher potential for substitution between energy inputs in the
industrial and transportation sectors than did developing countries. A study on the relation between
economy wide oil‐intensity of GDP and the level of the oil price found that for Latin America there was
no significant correlation, while for high‐income OECD countries and for non‐Latin American middle‐
income countries there were significant negative correlations (Alaimo and Lopez 2008). If these results
were found to be more widely established it suggests that policies to remove petroleum product
subsidies or increase taxes for the purpose of reducing global GHG emissions would be more effective in
high‐income countries.

63
Changing the Level of Subsidy
In considering whether to create, retain, reduce, or remove an energy subsidy, governments have to
consider several questions:
What are the objectives of the subsidy?
What activities should be subsidized?
Who should be subsidized?
What subsidy mechanism should be used?
Once these questions have been answered, advantages and disadvantages of a proposed scheme, or
change to an existing scheme, can be evaluated. A brief discussion of the above issues is provided.
Objectives of the Subsidy
The analysis of an energy subsidy and of possible changes to the subsidy scheme starts from an
articulation of the objectives of the subsidy. Goldstein and Estache (2009) provide a discussion of
possible objectives, as does the IEA (1999). Major goals include the following:
1. Supporting the poor and improving equity. In developing countries access to modern forms of
energy is important for enhancing standards of living. Households that are not connected to
electricity (either grid or off‐grid) rely on kerosene and candles for lighting and batteries to
power a radio and other small electric appliances. These sources are expensive in costs per unit
of energy and limited in their ability to allow households to move to other activities. However,
most low‐income households, particularly those that are credit constrained, cannot afford the
costs of grid connection and supply. Accordingly some governments have subsidized both the
connection charges and metering fees as well as the consumption of energy. The goal of
permitting low‐income households to consume a small amount of electricity that they would
otherwise be unable to afford can be justified on the grounds of both long‐term economic
growth for the economy and equity. The challenge for governments facing low access and use of
electricity is to find a method of subsidy that is cost‐efficient and does not spill over to other
recipients who do not need the subsidy to enjoy the benefits of electrification. One‐off subsidies
for connection charges are attractive from this standpoint since they tend to be well targeted to
the poor (higher‐income households are much more likely to be already connected) and having
a natural phaseout as the economy reaches high levels of connection.
The treatment of subsidies on petroleum products is less clear cut. Gasoline, diesel, and
kerosene have no equivalent to a connection charge, but the cost of a cylinder for LPG
constitutes an upfront charge that can act as a barrier to the use of that fuel. Gasoline, diesel,
and LPG are primarily used by high‐income households in low‐income countries and there is
little justification in directly subsidizing their use. Large petroleum exporters, benefitting from
export prices above the costs of production, may wish to share these benefits with the citizens
of the country, but the regressive subsidies on these fuels could be used in other ways that are

64
more beneficial for long‐term growth and for equity. The case of kerosene, which is used mainly
by low‐income households for lighting until they can afford electricity, is more complex. There
are grounds for subsidy in terms of direct household welfare and equity. The practical difficulty
is to find a method of subsidy that targets only poor households and avoids leakages through
diversion of kerosene to other markets. Attempts to discriminate between segments of the
market through a two‐tier pricing system require identification of poor households and a
distribution system that provides them with kerosene at the lower price. Voucher schemes have
been used, but the costs of administration are high given the large number of retail outlets
involved and vouchers suffer from leakage. The existence of the two‐tier price gives dealers an
incentive to sell quantities identified for low‐income households at black market prices for use
as an additive to the more expensive diesel fuel, as explained in Kojima and Bacon (2001). For
this reason means‐tested cash transfers present a better way of protecting the poor against high
kerosene prices.
A different approach to the use of two‐tier petroleum pricing as a means of providing support to
low‐income households is to use smart cards. Where petroleum products are sold at well
defined locations with the possibility of introducing electronic recording equipment, households
could be issued with a smart card that allows them to buy a limited amount at a subsidized
price. Outside the quota, the product could be sold at a higher price (possibly the market
clearing price). Because of the technical requirements of issuing a card to all households and
installing the necessary equipment, such schemes have rarely been tried. Smart cards have been
used to ration subsidized fuels in Iran (gasoline) and Malaysia (gasoline and diesel for fishing
boats and transport operators). Because the poor consume very little gasoline or diesel, these
examples are not informative for the purpose of protecting the poor. In 2007 Iran introduced
smart cards to ration gasoline which was sold at a heavily subsidized price. Rations were
different for private cars, passenger carriers, taxis, and government vehicles. Initially no quota
was available at higher prices, leading to gasoline solid on a black market. Later extra supplies
became legally available at higher prices. Over time the number of classes of users given larger
rations was extended, with the result that the efficacy of the scheme was considerably
weakened. Indonesia considered introducing smart cards and Malaysia considered expanding
their use, but administrative complexity has deterred their adoption (Kojima 2009b).
Where the objective is to support poor households against prices that are too high, one solution
has been to use some form of cross‐subsidy. An electricity tariff structure that charged users the
marginal costs of their supply would result in higher tariffs for rural households than for urban
households. Moreover the access rate in rural areas is much lower than in urban areas in many
low‐income developing countries. Governments wishing to support the poor rural households
often use cross subsidies as a method of reducing prices charged to rural areas. In particular,
industry and businesses generally may be asked to pay tariffs above costs in order to finance the
cross‐subsidy. The practicality of using this approach depends on the relative numbers of poor
and non‐poor users. Where there are few non‐poor users and many poor users, the risk is that
the tariff differential required to support lower prices to the poor could be so high as to have

65
serious effects on the non‐poor. For example, if the small group of non‐poor consists of business
enterprises, the associated cost increase could damage their commercial viability, with
associated negative effects on economic growth. Where there are many non‐poor and fewer
poor the use of a cross‐subsidy may be a relatively efficient method of improving equity (rather
than using general taxes to achieve the same end). Cross‐subsidies are widely used in the power
sector in developed countries to subsidize electricity provided to rural households who are more
expensive to supply.
A common way of providing direct support to low‐income households is to place a ceiling on
prices of petroleum products or of electricity tariffs. This has the effect of providing the subsidy
to all consumers and not just the poor, with consequentially greater costs of support. These
price caps should be distinguished from those used by utility regulators to determine the
maximum price or tariff that an efficient utility should be allowed to charge. The latter will
acknowledge the level of input costs charged, while the former do not permit these to be fully
transmitted.
A key issue in designing subsidy schemes to protect poor households is the breadth of coverage
to provide. This could range from providing some protection to a large percentage of the poor
households to focusing exclusively on a very narrow group of the poorest households. The wider
the range of incomes that are protected the less protection that can be given for a fixed total
fiscal cost. However, since the middle class are often better organized and more vocal, as well as
consuming more energy than the lowest‐income group, governments may be under pressure to
widen the scope of subsidies, even if this means that the benefits per household are smaller.
2. Achieving energy security. The provision of a subsidy to a particular source of supply may
improve its competitiveness and hence reduce dependence on other sources of energy, notably
imported fuels. Lack of energy security can arise from over‐dependence on a single fuel. The
recent volatility of energy prices (especially oil) highlighted the risks of over‐dependence. By
diversifying energy sources the total risks to the economy are reduced. However, substitute
fuels may be more expensive for the economy in question, so that a subsidy would be needed to
encourage the switch to a competing energy source. A subsidy related to the amount of energy
use could be very expensive and commit the government to a permanent fiscal burden. An
alternative form of subsidy to achieve the same end would be a one‐off capital subsidy to
encourage the construction of plants that would produce the alternative form of energy. The
costs of the subsidy would need to be balanced against the value of the reduced risk arising
from energy source diversification. Jensen, Beurskens, and van Tilburg (2006) illustrated the use
portfolio analysis to investigate the costs and benefits of increasing the renewable share of the
generation portfolio through the possible use of subsidies.
Another example is the import protection provided to uneconomic refineries. Governments
have cited enhanced security of supply among the justifications for subsidizing domestic
refineries whereby domestic supply was counted as more “reliable” than international supply

66
that could be disrupted. In countries with no domestic oil, however, it is not clear that importing
crude oil and refining it enhances supply security any more than importing refined products.
The increasing oil prices of the period from 2004 to mid‐2008 led to a number of governments
actively supporting the biofuels market in order to reduce consumption of conventional gasoline
and diesel. Kojima (2009b) detailed various measures, such as blending mandates and tax
reductions, which have been used in order to ensure biofuels were competitive. In 95 of the 120
months between January 2000 and December 2009 sugar prices were such that, without a
subsidy, sugarcane producers in a market facing both world sugar and world gasoline prices
would have been better off selling to sugar producers than to ethanol manufacturers, this
despite the fact that ethanol manufacture from sugarcane is by far the most efficient and has
the lowest cost. This case illustrates the need to consider the co‐movements of the fuel in
question and the planned substitute fuel before using a subsidy program to promote energy
diversification. The extent of the subsidy required may well have been much larger than
originally anticipated, when governments may have thought of the initial support as a
mechanism to kick‐start what would become an economically self‐sustaining business.
At the global level, an argument against energy price subsidies has been put forward in recent
years in the context of energy security. Starting with the proposition that an imbalance between
supply and demand is pushing up world oil prices, it is argued that petroleum product subsidies
in countries that are large consumers of oil exacerbate the supply‐demand imbalance by not
allowing higher oil prices to be transmitted to the domestic market and restrain consumption,
thereby threatening the energy security of all countries that import oil.
3. Correcting local externalities. Fossil fuel use—primarily in the power, industrial, and transport
sectors—is associated with negative local externalities, largely associated with indoor and
outdoor air pollution. The use of biomass for cooking and heating, which is widespread in many
developing countries and especially among low‐income households, results in indoor air
pollution which has been shown to be deleterious to health. In India it has been estimated that
annually approximately half a million premature deaths and nearly 500 million cases of illness
result as a result to exposure to smoke emissions from biomass use (ESMAP 2003a).
The increased awareness of the importance of reducing such emissions has led to a number of
offsetting policies. These can include (1) an increase of taxes on offending fuels, thereby
encouraging a reduction in their use and a switch to other cleaner non‐taxed fuels; (2) a subsidy
to cleaner fuels; or (3) mandates that enforce a switch to cleaner fuels. The most desirable form
of intervention is agreed generally to be one in which the polluter pays the full cost of their
actions through some form of environmental tax.
However, in the case of indoor air pollution, where the various forms of biomass (firewood,
dung, straw) are freely collected by many household, the polluting fuel cannot be taxed. Instead
the policy approach has to be to subsidize either a cleaner fuel such as LPG or kerosene (when

67
used at high pressure) or cleaner appliances (improved cook stoves, lamps) that reduce the
emissions. When governments remove kerosene or LPG subsidies, households using them as
cooking and heating fuels may revert to an increased use of biomass that could lead to land use
change, resulting in an associated increase in GHG emissions. Because unsustainable harvesting
of biomass can lead to deforestation, and even desertification, the use of subsidies to LPG or
kerosene as substitute fuels for cooking can have further external benefits.
4. Reducing emissions of greenhouse gases. With respect to global emissions, policies in the power
sector may focus on encouraging a switch from a higher to a lower emitter. This could include a
switch from coal to gas, or a switch from any fossil fuel to a renewable source of energy. The
results of Serletis, Timilsina, and Vasetsky (2009) suggest that very large price incentives may
have to be used in order to achieve substantial fuel switching. The tax on the polluting fuel, or
subsidy to the cleaner fuel, may need to do more than provide a minimal cost advantage in
order to induce a switch from one fuel to another. Moreover, policies to address one fuel may
have unintended consequences if there is more than one substitute fuel available. For example,
reducing the subsidy (increasing the tax) to natural gas could lead to an increase in the use of
coal, a more polluting fuel. The whole structure of energy taxes and subsidies has to be
reviewed together and the likely switching between fuels has to be viewed within a portfolio of
fuel choices.
In many cases there is no substitute source of energy readily available or available at a
competitive price, and policies need to be enacted to kick‐start the domestic production or use
of cleaner energy. Two factors are associated with the slow entry of new energy. Where a
technology is globally relatively new or untried, its current costs may be high but can be
expected to fall as the scale and experience of production increases. For technologies that have
already benefitted from such cost reductions but have not yet been deployed in a particular
country, there are barriers to adoption due to lack of experience in the operation of the
technology. In these cases it may be necessary to give positive inducements to the energy
source in order to compensate for these factors. In addition, governments will need to adapt
their planning and regulation to suit the needs of the new energy source.
For wind, solar, and other renewable sources of energy, a temporary subsidy can be provided by
feed‐in tariffs that provide above‐market tariffs to the suppliers for an initial period. Several
developed countries—including Australia, Canada, Germany, the Netherlands, Spain, the United
Kingdom, and the United States—have used such schemes to encourage the introduction of
renewable forms of energy. However, as governments have started to phase down subsidies (as
for solar in Spain and Germany) the market for new entry is collapsing. In these cases the
primary objective was to kick‐start the use of the renewable, with the hope that over time their
costs would fall so that further expansion would take place without subsidies. The difficulty with
such an approach is to plan a phaseout of the subsidy in a way that is consistent with the fall in
costs. In addition, early movers will not have benefitted from the later technology
improvements so that their subsidy would need to continue to make their operation viable.
68
Because of this feature capital subsidies may be more suitable because they offer a solution that
does not commit the government to a permanent fiscal contribution. Other forms of subsidy,
including tax concessions, can also be used to encourage a more rapid and greater uptake of
renewable energy technologies.
Biofuels were initially promoted to increase self‐reliance. More recently, policies supporting
biofuels have also been justified on the grounds that they could reduce CO2 emissions. The
effectiveness of these policies, consisting mainly of consumption mandates and tax reductions,
is increasingly questioned on account of limited mitigation benefits, disproportionately high
costs, and growing concerns about unintended side effects on the world food markets (FAO
2008, UNEP 2009). The more direct policy of taxing transportation fuels could be preferable
since it would promote fuel‐efficient driving.
5. Supporting domestic production and associated employment. Where a domestic energy
industry is no longer competitive with the world market and foreign energy can be imported
more cheaply, or former export markets have disappeared, then governments have resorted to
production subsidies. This has been especially true of the coal industry in Europe where the very
large employment in the sector persuaded governments to provide domestic support in order to
avoid large‐scale unemployment that would have resulted as domestic sales fell following the
arrival of lower‐cost competition from elsewhere. The use of an ongoing subsidy to avoid
unemployment has been expensive, and it might have proved cheaper to have given earlier very
large severance payments to redundant workers. A further reason to support domestic
production of energy has been to fuel economic growth and encourage export competitiveness.
A problem with these objectives is that, were the subsidy to be withdrawn, the industries that
had been encouraged to grow would no longer be sustainable and the economy would need to
face a readjustment towards sectors that could be sustainable. As is the case with most subsidy
schemes, an exit strategy is required in order to avoid the expectation of a permanent
commitment.
6. Dealing with uncertainty. A feature of the international energy market is the high degree of
uncertainty about future prices of fossil fuels. Importing countries can address this price risk by
encouraging diversification of fuel choice. This could be engineered by removing any subsidies
on extensively used fuels (for example, transportation fuels) and possibly by providing some
form of temporary subsidy for alternative sources of energy (for example, capital subsidies for
renewable energy). This strategy aims to reduce risk by diversification, and as such could even
justify some increase in the total costs of supply as the price for risk reduction.
A particular problem with energy subsidies is that, once established, they become difficult to reduce or
remove, especially when they have been given on a universal basis. Kojima (2009a) and the IMF (2008)
noted that, when faced with the large oil price increases prior to the August 2008 peak, many
developing countries preferred to stay with a subsidy scheme, or even to increase or re‐introduce
subsidies or decrease taxes, despite the enormous fiscal burden this represented. Because of potential

69
opposition from beneficiary groups, governments have to take their likely reaction into account in
determining the objective of any plan to alter the subsidy level.
What to Subsidize
Once the objectives of subsidizing an energy source have been determined, the government is faced
with a choice of what activities to subsidize. Depending on the objectives, the choices are to subsidize
consumers, existing producers, or new producers, and the possible activities include innovation, infant
industries, and clean energy, as well as traditional sources of supply. Where the objective is to
encourage the supply of a given type of energy, production subsidies may be the most effective way of
encouragement, being directly targeted to the objective. A related target for subsidies is energy
efficiency improving investment. This can help to improve energy security and reduce GHG emissions.
1. Affordable conventional energy. Where the objective is to make energy supply more affordable,
subsidies to consumers either for connection (electricity, LPG) or for consumption (all energy
sources) can most easily be given through existing suppliers. Firms already in the market have
the infrastructure for retailing, billing, and customer support that is necessary to deliver the
subsidies to users. They will also have established accounting and recording systems that make
it possible to audit the costs of the subsidy that they are incurring on behalf of the government,
and that should be recompensed from the budget. A different reason for wishing to make
energy more affordable is to provide support to key industries that have large energy inputs,
such as the metals and minerals industry, mining, or transportation. This can also serve to
protect employment in these sectors.
The major concern for governments wishing to promote affordable energy is the cost of so
doing. Many subsidy schemes have high leakage and include many high‐income households as
beneficiaries, while demand for energy will increase with rising income. The subsidy bill will be
linked to economic growth unless it is designed to have a natural phaseout mechanism. In some
countries at a low stage of development, the use of commercial energy can even grow faster
than the economy as households switch away from non‐commercial sources, thus leading to the
possibility that the subsidy bill will grow faster than the economy itself.
Where conventional energy is more GHG‐intensive, subsidies given to such conventional energy
deter penetration of cleaner energy with lower GHG emissions. New, cleaner energy is generally
more costly than conventional energy, and is certainly in no position to compete with subsidized
conventional energy in the absence of significant government support.
2. Clean Energy. Policies to encourage fuel switching away from traditional biomass have focused
on subsidies to kerosene, to a lesser extent to LPG, and even to natural gas in a few countries.
The main impediment to the use of kerosene has been the cost of the fuel itself, relative to that
of biomass that is often free although needing time and effort to collect the latter. For LPG, in
addition to the cost of the fuel, the cost of the initial cylinder purchase can be a barrier to low‐
income households and some governments have provided subsidies to cylinders as well as to
70
the cost of the fuel. Natural gas has much higher connections costs, and these may need to be
subsidized if the government wishes to achieve a high rate of connection in the main urban
centers.
An alternative is to subsidize appliances and vehicles with lower emissions of harmful pollutants.
To combat indoor air pollution in homes that continue to use biomass, governments and
development agencies have supported clean stove programs through subsidizing the
manufacture and distribution of improved stoves. These programs have had mixed results. In
recent years some governments have subsidized the infrastructure for using natural gas as an
automotive fuel, because vehicles running on natural gas have much lower emissions than
conventional diesel vehicles.
With respect to policies designed to reduce GHG emissions, governments have a range of
choices. They can choose to stimulate innovation (e.g. biofuels from algae), support new
commercial technologies (e.g. solar power), and encourage well‐known but under‐utilized
market solutions (e.g. improved building insulation). The barriers to free market introduction of
innovation and new technologies in the sphere of clean energy are discussed under infant
industries below.
3. Infant industries. Within the energy sector the emergence of new solutions to reduce energy
consumption or to supply clean energy sources is focusing attention on new technologies. These
range from cases that have already been developed but only on a small scale (such as thermal
storage using molten salt for solar power), so that costs of production are still high, to
technologies that are still at the research stage. For technologies that are ready to move to
commercial application, costs of production of the equipment itself are typically lowered as
economies of scale can be utilized and as the benefits of learning by doing are reaped. Wind
power presents an example of this experience. As turbine sizes have increased and as more
manufacturers have entered the market, the costs of wind power generation from commercial
scale plants are estimated to have fallen as much as 80 percent since the 1980s. This pattern is
seen in many technologies that have been successful. These technologies are likely to steadily
lower costs and become more widely utilized, but the time taken until there is broad acceptance
may be lengthy without government intervention. When there is a need for more rapid
penetration of the market, intervention can be justified according to the reasons for needing the
product sooner.
Where the technology has only recently been introduced and only in a few countries, low‐
income countries may prefer to wait until other countries have carried the initial costs of
production. However, developing countries with large domestic markets, an established
manufacturing sector, and low production costs (especially labor) may see an opportunity to
start production once the technology is proven and viability in the market is established. China
(wind turbines) and India (solar power) have both taken this route and are large enough to be
driving down costs by their own efforts. Subsidies given to production of equipment as well as to
sales of electricity are helping to establish these industries and both of these countries have

71
started to export these technologies, having established themselves as low‐cost producers.
Smaller countries, with less well established manufacturing sectors, will probably need to import
the technology and will have to wait for the early movers to make this attractive. Subsidies may
be needed to overcome cost differentials with traditional energy sources that still remain and to
provide incentives to firms to take up the new technology. If costs are expected to decline to the
point where the technology would be fully competitive with existing energy sources, the
justification for a subsidy would disappear. This possibility points to a preference for using
capital subsidies that are time bound—they can be more easily terminated than tariff subsidies
which may be more difficult to remove since they benefit existing players in the market.
Where the goal of a subsidy is to support an infant industry, or even a new technology, the
government has to determine how recipients are to be identified. It is unlikely that such
subsidies would be granted to all firms that could claim to be in the industry. Some form of
bidding to obtain such subsidies can be used, including research proposals for new products and
output‐based aid where clear deliverables can be determined (Global Partnership on Output‐
Based Aid 2005).
4. Innovation. Technologies that are as yet commercially unproven and that may still be at the
research stage may offer large energy savings or clean energy supply if they can be successfully
developed. The costs of moving to commercial scale for such technologies can be large and the
risks are high because of the presence of unknown difficulties. Because of these factors,
companies can find it difficult to attract finance to support the research and development
expenditures needed. This financing gap has led some governments to subsidize the basic stages
of product development. Large governments, for whom the project is very small in relation to
the government finances, can support a variety of such projects at an early stage, and by pooling
the risks can afford for some projects to fail at the various stages of development. At later
stages, as the performance and viability of certain projects becomes clearer, more funding can
be provided to a narrower group of likely winners. Governments that have attempted to
support very large‐scale innovations have found that these can be extremely costly. For these
reasons it would appear that developing countries should place little emphasis on subsidies for
innovation unless the projects are small scale, are supported by an experienced manufacturing
sector, and there is a potentially large domestic market to support the product were it to be
successful. However, subsidies to specific energy technologies can undermine the development
and commercialization of other technologies that might ultimately become more economically
(as well as environmentally) attractive. That is, subsidies can lock in certain technologies and
deter the development of alternatives that may prove to be more promising in the longer run.
5. Energy efficiency investment. The arguments for supporting demand‐side or supply‐side energy
efficiency investments are usually distinct from those involved in supporting innovation. Many
energy efficiency technologies and policies have been known for many years. Where they have
not already been adopted this is not necessarily because of high costs that could be brought
down with the advent of economies of scale, but rather because their benefits have not seemed
sufficiently attractive to users or producers. Improved building insulation, reducing technical
72
losses of power sector transmission and distribution, and running air conditioning at higher cut‐
off temperatures are examples of policies that can save energy and reduce emissions, both of
which are benefits for the society as a whole. However, without a willingness to pay for these
improvements or investments by the users, or to accept lower convenience, they will not be
voluntarily adopted. In some cases governments have a policy choice between encouraging the
take‐up of such investments by some form of subsidy, or by the use of regulation to enforce the
take‐up. The latter approach forces the polluters to pay, while in the former case the cost of the
subsidy has to be borne by the population as a whole. With established technological solutions
there is no need for the government to carry up‐front risks that may not lead to improvements,
or to buy down costs by supporting industries at small scale until their performance improves.
The improvement of supply‐side energy efficiency, for example the reduction of transmission or
distribution losses, usually requires both technical and organizational changes from the utility
supplying electricity. Policies to combat this depend on the source of the loss. Where theft and
incorrect billing is prevalent, improved metering and enforcement is required. Where there are
a large number of low‐income households, it may not be feasible to pass on the costs of
metering improvement to users in proportion to the energy savings to their supply. A household
willing to connect and to consume, say, 100 kWh per month is not likely to be able to afford the
costs of replacing a traditional meter with smart metering. In this case considerations of equity
can come into play in deciding the best approach to take. The options are either to provide a
subsidy to the utility (energy service company) based on an agreed action plan to improve the
delivery, or else to permit them to use a cross‐subsidy from large consumers through charging a
tariff that includes a component for system upgrading. Where the losses relate to the
transmission system, strengthening it may require substantial investment. However,
improvements in the transmission system are more likely to be able to pay for themselves and
may even lead to tariff reduction.
Whom to Subsidize
The choice of whom to subsidize depends on the objectives of the policy. For consumer subsidies the
choices range from universal subsidies to subsidies to poor households and remote communities. For
producers, subsidies can be industry‐wide or available on some form of competitive bidding basis.
1. Universal subsidies. Universal subsidies, whether to consumers or producers, are usually the
simplest scheme to operate since they require no mechanism for identifying and transferring
resources to selected recipients. Because of their universal coverage, these subsidies tend to be
the more expensive and difficult to phase out because they create the widest constituency to
support their introduction or retention. If the government wishes to achieve a given degree of
materiality for subsidies to low‐income households, the costs rise as the scope of the subsidy is
broadened. Universal subsidies in the energy sector have been widely used and include
increasing block tariffs in the power sector and general subsidies (or tax reductions) on
petroleum products. More recently governments have focused on moving away from such
schemes because of their expense and unnecessary support to groups not in the greatest need.

73
Improved targeting of the poor through a variety of means is seen as lower cost and more
equitable.
2. The poor. Where the objective is to support low‐income households, the government faces two
issues: it must be able to determine which households qualify as poor, and it must find a
delivery mechanism to reach these households. Poverty is defined according to country
conventions, but identifying which households are poor is difficult and may be expensive.
Household surveys, of the type used in Indonesia for the cash transfer scheme, are not widely
available and are difficult to organize if the government is in a hurry to make a change to its
subsidy policy. A number of approaches to identifying low‐income households have been
developed using means testing and proxy means testing as detailed in Grosh et al. (2008) and in
World Bank (2008b). For example, in Chile the Ficha Caracterisación Social is a two‐page form
that is used to determine the eligibility of households for a variety of government programs,
ranging from water subsidies to cash transfers and low‐income housing. The survey collects
information on housing conditions of each dwelling unit, material assets of households, and on
the occupants (occupations, education, age). From these indicators a composite score is
determined and households are considered poor if their score falls below a certain pre‐
determined value. The survey is updated every three years. This approach is particularly suitable
for determining which households should receive a cash transfer.
Where the government prefers to use a direct subsidy for electricity, then the use of volume
differentiated tariffs as opposed to increasing block tariffs is more effective in targeting low‐
income households and does not spill over to high‐income households. Where metering is
incomplete or absent, these schemes cannot be used and some form of proxy for the level of
consumption has to be used. Several governments have used geographical targeting where
households in identifiable low‐income urban areas are charged a lower tariff or a lower
connection fee.
Output‐based aid can be effective in ensuring that a connection fee or equipment costs is
subsidized once it has been delivered to a target household. If the choice of households has
been made efficiently, this approach has little leakage and can be highly cost‐effective.
Support to poor households will include a high proportion of women and children, but
governments may be concerned with certain features of energy use that have particularly
adverse effects on women and children. Access to electricity improves children’s ability to study
and obtain the long‐term benefits from education, while for women the improved lighting can
increase the productivity of commercial activities (such as sewing). In many low‐income
developing countries, poorer households (both rural and urban) cook with biomass. Only at high
income levels do households turn to LPG or kerosene. Indoor pollution from biomass is
extremely damaging to health, although many who are exposed to smoke are not fully aware of
the harm caused. Policies to improve cooking stoves (adding chimneys, increasing combustion
efficiency) have used subsidies to encourage households to purchase these improved stoves
that otherwise they would have ignored.

74
3. Rural communities. Rural communities tend to face much higher connection costs for electricity
because of their greater distances from the grid and the low number and density of households
in a particular location. Where governments are concerned to increase access, it is important to
look for low‐cost solutions, of which off‐grid electricity is an important step. Evidence from a
number of countries (World Bank 2008) suggests that the subsidy required to support off‐grid
electrification is less than that required to support grid electrification to rural communities.
However, even with the most appropriate type of supply, connection costs may be too high for
households to pay, particularly if these have to be fully paid in advance. Governments have
looked at various subsidy schemes for bridging this financing gap. Utilities can reduce rural
connection fees through cross‐subsidies from existing users, or can respond to performance
based subsidies from the government. Cross subsidies are widely used to support rural
electrification schemes but their effectiveness depends on the existence of a relatively large
number of better‐off consumers (businesses and households) that can afford to pay more than
the cost of supply. In countries where even the urban rate of access is low, as in much of Sub‐
Saharan Africa, cross‐subsidies alone could not support an extensive rural electrification
program. Where the main providers of the cross‐subsidy are businesses—being the entities
most likely to connect to the grid system in the early stages of national electrification—too great
a cross‐subsidy could interfere with the competitiveness of these entities, and could slow down
growth and development.
An alternative to a simple lowering of the connection charge is to provide the household with
the ability to repay these charges over a fixed number of months. If the total collected is equal
to what would have been the up‐front charge, the interest forgone through spreading receipts is
a subsidy to consumers. For households that are credit constrained the ability to spread over a
long period with low monthly repayments may be much more important than the reduction in
the lifetime cost of paying for the connection.
There is no connection fee for petroleum products, but the costs of rural supply are typically
higher than the costs of urban supply. Again the product has to be transported further, and the
sales at local distribution centers tend to be lower, losing possible economies of scale. In a free
market this would typically result in rural prices being higher than urban prices. Indeed, for LPG
it is often not commercially viable to supply villages because there are too few customers who
can pay the market price including the costs of distribution. Some governments have acted to
avoid this geographical price differentiation by regulating pan‐territorial pricing in which the
retail price is the same everywhere. The price is typically set so that urban users pay more than
the cost of supply in order to provide the cross‐subsidy to rural users who pay less than the
costs of supply. Pan‐territorial pricing by definition, however, means that true costs are not
reflected in market prices and may reduce incentives to lower supply costs, because offering
lower pricesthrough, for example, improving efficiencyin the hope of expanding market
share is not an option.
4. Special industries. Some governments have, for reasons of policy, decided to subsidize certain
industries. For example, the government of India has subsidized electricity and diesel (used for

75
pumping and tractors) sold to farmers for food security. The form of the electricity subsidies has
encouraged excess consumption and theft because the farmers were required to pay a flat rate
per unit of horsepower per pump, while the actual use of electricity was not metered. The cost
of the electricity subsidies to agriculture has been estimated to be equal to about 25 percent of
the country’s fiscal deficit and to be double the annual public spending on health or education
(Monari 2002). The farmers’ lobby, including many middle‐class and large‐scale producers, is
influential and has strongly opposed any suggestion of reducing subsidy support for the sector.
Transport is another sector where subsidies to diesel are frequently granted. Although general
principles of energy taxation suggest that diesel, if used as an intermediate good, should not be
levied a tax, arguments for granting a subsidy rest in part on the direct benefits to consumers of
public transport. In particular, the cost of urban public transport—providing an essential service
in allowing people to travel to work and school that would otherwise be inaccessible—can be an
important fraction of household budgets. In addition, a more intensive use of public transport
may reduce road congestion and the total amount of local air pollution from traffic if users are
encouraged to refrain or switch from other motorized forms of transport. Again, once such a
subsidy is granted it becomes very difficult to remove even when workers’ incomes rise and they
could afford to pay the true costs of travel.
These examples illustrate the danger of introducing subsidies, even for good reasons, that do
not have some natural phaseout. Groups with vested interests tend to benefit strongly from
such subsidies and oppose their subsequent removal. Unless the subsidies can be targeted to
groups that will tend to disappear over time, energy subsidies will require a great deal of effort
by the government to remove.
What Subsidy Mechanism to Use
The issues raised above indicate that there are various advantages (+) and disadvantages () to all subsidy schemes, and by extension to changes in a subsidy scheme, whether to introduce, and, having
introduced, whether to increase, reduce, or remove. Given that the costs of most subsidy programs are
large, and that it can be extremely difficult politically to reduce a subsidy scheme, governments should
be encouraged to undertake a full impact analysis before making any policy change. In comparing the
different alternative schemes available it is important to make a detailed assessment of costs and
benefits, not only in the immediate future but also over the longer run. Important considerations for
each type of subsidy discussed in this paper are summarized below.
1. Universal consumer subsidies (both electricity and petroleum products)
Easy to apply and administer
Difficult to remove because many beneficiaries
Has no natural phaseout point
Can encourages non‐essential or inefficient use of energy and associated emissions

76
Weak targeting of poor unless high degree of access by poor and similar use across
income groups
Exclusion index is high when connection rate is low
Materiality for poor is likely to be low because need to subsidize all households and all
levels of consumption
Fiscal burden tends to be large even with modest materiality for the poor
Petroleum product subsidies tend to be linked to international prices and hence
subsidy amounts can be volatile and difficult to predict
Can have adverse financial effects on energy suppliers if they are not fully reimbursed
in a timely manner
2. Increasing block tariff or two‐tier pricing
Moderately easy to apply to electricity but requires metering
Moderate targeting of benefits to poor if first block is set at a low level
General principles can be adapted to time‐of‐day and peak load pricing
Difficult to apply for petroleum products, apart from use of smart cards, and this
requires administration burden to identify households and distribute cards as well as
suitable electronic recording equipment
Difficult to remove because a benefit to all in the case of increasing block tariff
No natural phaseout point
Exclusion index is high when connection rate is low
Fiscal cost large if first block is wide or is heavily subsidized
Materiality for poor is likely to be limited by overall fiscal cost
Tends to have high leakage to non‐targeted users when applied to petroleum products
3. Price caps and price control
Effective in reducing upside risk to all households from price shock; mainly relevant to
petroleum products where international prices are highly volatile
Governments face very large upside risk and inability to insulate budget from price
shocks
Very difficult to remove when users become accustomed to a certain price especially
because of wide range of beneficiaries
Works against benefits of competition since firms will tend to charge price ceilings even
when costs do not justify it
Poor targeting because it is a universal subsidy with no special pro‐poor features
Can encourage excess consumption of energy
Difficult to calculate precisely how much suppliers should be compensated
Can have adverse financial effects on energy suppliers if they are not fully reimbursed
in a timely manner
4. Volume differentiated tariff
Good targeting of poor if volume limit is set at small size unless access is very low
Exclusion will be low if there is a high rate of connections
Fiscal cost can be contained by setting volume limit relatively small

77
Does have a natural phaseout as households gradually raise consumption above
volume limit
Volume limit relatively easy to change depending on circumstance
Natural situation for cross‐subsidy from higher‐use to low‐use customers
Moderately easy to remove because beneficiary group tends to be small and have
weak voice in national decisions
Requires metering
Political pressure to increase the volume limit
Problems for households transitioning to above volume limit consumption and facing
large jump in electricity bills, particularly when these can switch from month to month
No practical application to petroleum products because of inability to track a
household’s total monthly purchases
5. Connection charge subsidy
Tends to be well targeted to poor where access rates are low among the poor and
better‐off are connected and roll‐out is targeted to different groups from those already
connected
Better‐off tend to be excluded unless access is very low
Easy to combine with geographical targeting—for example, rural areas with higher
costs of connection can be targeted for special subsidies
Natural long‐term phaseout when majority of households become connected
Program can be slowed or stopped if fiscal situation demands less expenditure. Those
already connected would not oppose these changes
Suitable for cross‐subsidy from large users to new users
Not suitable for petroleum products except for LPG
Costs incurred in order to have an appreciable effect on access rates tend to be high
because of magnitude of subsidy needed to persuade households to connect; needs to
be combined with drive for low‐cost supply of connections
Roll‐out to groups typically not connected will require higher subsidies than to groups
typically connected, leading to higher costs to support low‐income groups
More difficult to control from central administration because costs of connection are
not standardized
6. Cash transfers to the poor
Can be well targeted to poor even when many of the poor are not connected
Excludes spill‐over to better‐off
Can be time bound through use of one‐off payments or schemes, but political
acceptance of one‐off schemes may be difficult to achieve
Because of good targeting fiscal cost may be reasonable (but where connection is very
low, targeting all poor to compensate for subsidy removal would have to incorporate
low materiality in order to keep fiscal cost at a manageable level)

78
Complex and expensive to administer unless there already is a census of low‐income
households and a delivery mechanism working through widely available outlets (such
as post‐offices)
Vulnerable to low‐level corruption of the administration
Household take‐up depends on good public information service
7. Cross‐subsidies between high‐ and low‐volume users, or between users remote from supply
and those closer to supply
Good redistribution from better‐off to less well‐off users
Relatively easy to manage when system exists for identifying different classes of users
and their bills
Can work well when sufficient high‐volume users (businesses) and not too many low‐
volume users
Distortionary in that neither group is paying the correct price for energy
Can adversely impact the competitiveness of businesses providing the cross‐subsidy
Not pro‐poor where remote users are well off
Cannot be used with petroleum products effectively because of ease of creating black
market by middlemen, without benefitting the poor
8. Performance‐based subsidies
Suitable to reach markets where cost reductions are feasible and competition could
bring these about
An effective method of choosing business to deliver the output (for example, rural
electrification) where it is difficult to monitor costs and performance of traditional
firms
Subsidy can be given in relation to plant installed, so that it can be time bound by
placing a limit on number of units to be installed
Not suitable for situations where there is adequate connectivity or plant ownership
and help is needed with operating costs
Not suitable for petroleum products
Where amount of subsidy required to reach a desired level of plant
ownership/connection is high relative to potential cost savings, fiscal burden would be
large
9. Feed‐in tariffs for new energy sources that are not cost‐competitive (electricity)
Can be effective in encouraging the take‐up of sources of energy that have the
potential to see cost reduction developing over time
By making the tariff structure time‐bound, a limit can be placed on fiscal cost
Where costs of new product do not decline as expected the subsidy would continue to
be needed to encourage continued entrance of the technology
Even when new entrants find costs of production have fallen, early movers would
require subsidy to cover their higher costs—possibly met through a capital subsidy
linked to a regulated tariff.

79
The list of possible approaches to subsidies and their reform indicates that there are many factors to be
taken into account before deciding the best approach. Some studies have suggested assigning weights
attached to advantages and disadvantages of various schemes in order to arrive at the best overall
choice. Reiche and Teplitz (2008) extend an example constructed by Lovei et al. (2000) for choosing
between 10 alternative power sector subsidy schemes.
Framework for Analyzing Whether to Introduce, Retain, Redesign, or Remove a Subsidy10
Policymakers considering whether to introduce, retain, redesign, or remove a particular energy subsidy
may find it helpful to ask a number of questions concerning the subsidy. A suggested list of questions is
given in Figure 2. If any answer is negative, the policymaker should consider either phasing out the
subsidy or redesigning the subsidy and checking on the list of questions again.
Some questions require detailed calculation, which may be difficult to carry out in some circumstances.
Nevertheless, the simple consideration of the question can be a help in the decision‐making process.
The exercise begins with a statement of the objective(s) of the subsidy and then uses a number of tests
to see whether the subsidy should be introduced (if proposed) or retained (if already in place),
redesigned, or rejected (proposed) or phased out (if in place). Although the questions are presented in a
sequence, it is not necessary to adhere strictly to this sequence and undertake all the associated
calculations, if it is fairly clear that the policy would fail one of the tests.
10 This section is based on “Phasing out energy subsidies: A decision tree and evidence from case studies” (Vagliasindi forthcoming), a background paper for the World Bank’s contribution to the “Analysis of the Scope of Energy Subsidies and Suggestions for the Implementation of Their Phasing Out,” a joint report of the IEA, OPEC, OECD, and the World Bank for the June 26‐27, 2010, G‐20 Summit Meeting in Toronto.

80
Figure 2: Schematic Approach to Assessing Energy Subsidies
Policy objectives Step 1: State the objective(s) of the subsidy policy
Impact Question 1: Does the policy substantially achieve its objectives?
No
Yes
Cost benefit analysis
Step 2: Value costs and benefits of the subsidy policy and its alternatives
Redesign or phase out Subsidy
Cost effectiveness
Question 2: Is the policy the most socially efficient instrument to achieve its objectives?
No
Yes No
Global externalities
Question 3: Does the policy avoid negative global externalities?
No Is the impact of the policy consistent with the country’s overall strategy on GHG emissions?
Yes yes
Priority of policy objectives
Question 4: Is this use of funds a budgetary priority?
Yes No
Retain (existing) or introduce (new) subsidy
Redesign or phase out Subsidy
Step one
State the objective(s) of the subsidy policy. Examples include protecting the poor against the adverse
effects of higher fuel costs on electricity prices, improving energy security, correcting externalities, or
promoting industrial growth.
Comments:
Many subsidy policies can have several objectives and all should be articulated. For example, a
subsidy for biofuels may be intended to reduce dependence on imported oil, promote rural
development, reduce subsidies to agriculture, and reduce GHG emissions.
81
The policy should be articulated in sufficient detail that the financial costs to the government
can be calculated. This would require, for example, an exact description of a lifeline rising‐block
subsidy scheme designed to help the poor with electricity costs.
Question 1 (impact test)
Assess the impact of the policy: does the policy (existing or proposed) substantially achieve its
objectives? If “yes,” proceed to step 2. If “no,” redesign and start again, or phase out/reject.
Comments:
Judging whether a policy meets its objectives requires the goals to be formulated with some
precision. For example, “helping the poor” would be too imprecise to allow a reasonable
evaluation.
Where there are multiple objectives, it would be necessary to check to what extent each goal
had been or would be achieved.
Step two
Value all benefits and costs of the subsidy policy and its alternatives. Costs should include not only
direct financial costs but also any other economic costs and relevant externalities at the national level,
such as local environmental damage, costs of resettlement, loss of jobs elsewhere in the economy (for
example, where a subsidy supports one industry at the expense of another), and so on. This provides a
social cost‐benefit valuation for the policy.
Comments:
The valuation should also be carried out for the main alternatives that would meet the objectives
of the policy.
The valuation would not include global externalities from the emission of GHGs because they are
supra‐national, and because it is not obvious how to value them at this time. GHG emissions are
dealt with separately in question 3.
Question 2 (costeffectiveness test)
Is the policy the most socially efficient instrument to achieve the objective(s)? If there are alternative
policies that could reach the same objectives, a cost‐benefit comparison should be carried out to
identify the policy that provides the highest net social benefit. If the current policy passes this cost‐
benefit test, proceed to question 3. If the answer to question 2 is “no,” redesign and start again, or
phase out/reject.
Comments:
The use of social cost benefit analysis to compare alternative policies to achieve the same
primary goal follows a well‐established procedure for checking on the efficiency of the policy.

82
Estimating and monetizing externalities—such as higher morbidity and premature mortality
from pollution—can sometimes require data that are not available. Similarly, benefits of some
stated goals—such as supporting an infant industry—may be difficult to quantify. Parameter
ranges taken from the literature could be used to estimate bounds for net benefits.
When the main difficulty lies in valuing some of the benefits (e.g., poverty reduction),
nonfinancial costs, or both, a simpler, and less data demanding, approach would be to use a
reduced or limited cost‐effectiveness criterion. This approach would compare the quantifiable
elements of the alternative policies to achieve given goals of the subsidy policy, including all
financial costs. It would over‐estimates a policy’s net benefits if some of the nonfinancial costs
are omitted, and conversely under‐estimate if some benefits are excluded.
Question 3 (global externalities test)
(A) Does the policy avoid negative global externalities? If “yes,” go to question 4. If “no,” go to
question 3B.
(B) Is the impact of the policy consistent with the country’s overall strategy on GHG emissions? If
“yes,” proceed to question 4. If “no,” redesign and reapply tests, or phase out/reject.
Comments:
The first question checks whether the subsidy policy would avoid leading to a clear increase in
GHG emissions. Hence policies to support renewable or energy efficiency would automatically
pass this test.
For policies that do increase GHG emissions, the reaction of the policymaker will depend on the
government’s overall strategy on its current level of GHG emissions. For example, countries that
may have taken a decision to reduce their overall emissions may find the subsidy policy
inconsistent with that position. However, a government’s overall strategy to reduce GHG
emissions may focus on other policies to achieve this, thus allowing subsidies for a particular
project to be implemented to achieve other goals (e.g. poverty reduction) despite their direct
encouragement of emissions.
The dynamics of climate change discussion, as well as the development of the economy, may
well change the policy of a government to its GHG emissions over time. In this case the criterion
for deciding whether or not to accept a policy that increases emissions will evolve.
Question 4 (priority of objective test)
Is this use of funds a budgetary priority? If “yes,” retain the existing subsidy or introduce the proposed
subsidy. If “no,” redesign to reduce costs, or phaseout/reject.
Comment:
The priority of the objective can be assessed once the net social benefit and effectiveness of the
scheme have been evaluated.

83
These tests may be difficult to apply in a precise form to any specific proposal for lack of data.
Nevertheless, they encapsulate a framework for thinking about the various barriers that a proposed or
existing subsidy scheme should have to pass before being accepted. Even if a scheme passes all these
tests in an informal or formal context at one point in time, it is imperative that the subsidy be checked
against the above set of questions from time to time to check that it continues to pass all the tests.

84
Strategy of Subsidy Reform
The preceding discussion has focused on the issues of why a change in energy subsidies may be
desirable, and which form of subsidy, if any, might be utilized. However, the widespread occurrence of
energy subsidies in developing countries and the large focus on removing or reducing them suggests
that there is a disconnect between advocated reforms and actual practice. Two reasons may explain
this. There may be no wish to change the level of subsidies: the government is achieving its own
objectives and sees no need for change, even though there may be external pressure for change.
Alternatively, the government may recognize that there could be an economic improvement from a
change in subsidy policy but not have the will or political capital to achieve this. Thus, the economic
cost‐benefit analysis recommends change but the political cost‐benefit analysis discourages it.
Reasons for governments to resist changes in their subsidy policy while the international community
calls for such a change may relate to a global externality, as in the case of petroleum product subsidies
by large consumers for both GHG emissions and energy security. This case requires explanation of the
costs of the subsidies to the global community and to the country itself before there is any possibility
that the government would revisit its subsidy policy. Recent discussions on climate change policies have
highlighted the possibility that governments could be compensated in some way for reducing their GHG
emissions, and this opens the possibility that such help might be tied to subsidy removal. International
assistance could, for example, help with cash transfers to the poor who would otherwise be made worse
off by the reduction in subsidies.
Where the government recognizes the need to change the level of subsidies but it is unwilling or unable
to do so effectively, a deeper analysis of the factors leading to this situation is required. Without
understanding the reasons for the circumstances that have so far stalled a change in the subsidy policy,
the subsidy reform, if initiated, may fail, and indeed the opposition created by an ill‐prepared reform
may make another attempt at reform impossible for a number of years. Gupta et al. (2000) give
examples of failed subsidy reforms that illustrate the risk of political disruption where rapid reform was
attempted without credible social protection mechanisms and governments were unpopular (box 4).
However, as pointed out by Bienen and Gersovitz (1986), protests over subsidy removal have rarely led
to political instability.

85
Box 4: Subsidy Reform and Civil Unrest
Political economy analysis has been increasingly used to identify the reasons why subsidy reform may be
difficult in a country. By identifying these factors it may be possible to find approaches that address the
concerns of the interested groups and that permit the reforms to be successfully carried out. Fritz,
Kaiser, and Levy (2009) suggest that there are three steps to problem‐driven political economy analysis:
Identifying the problem, issue, or vulnerability to be addressed, and establishing whether it
appears to have a political economy dimension
Mapping out the institutional and governance arrangements and weaknesses
Drilling down to the political economy drivers, both in identifying obstacles to progressive
change, and in understanding from where potentially a drive for positive change could emerge.
In Jordan, in April 1989, an attempt to raise fuel prices resulted in riots that brought down the
unpopular prime minister. In August 1996, Jordanians again took to the streets in response to a
200 percent increase in the price of bread and associated price increases for other items.
Observers noted that the unrest was also rooted in the absence of economic opportunities (GDP
per capita fell by 2.5 percent in 1996) and dissatisfaction with the lack of public participation in
decision making.
Indonesians took to the streets in May 1998 to protest energy price increases proposed by the
Suharto regime. In March 2000, there were renewed protests against a proposed hike in fuel prices
and the price increase was been postponed until a compensatory scheme for the poor households
can be put in place. The government, elected in 1999, has been actively campaigning to explain
why subsidy cuts are needed to support economic recovery and to finance the expansion of social
programs.
In Ecuador, in September 1998, the government increased prices of cooking gas, gasoline, and
diesel. To compensate poor households, the government introduced a cash‐transfer program
targeted to poor women with dependent children, senior citizens, and the disabled. Despite the
success in reaching 1.3 million beneficiaries (50 percent of households), the government changed
its position on the price increases after street protests in July 1999. Subsidies for fuels reemerged
in 1999 as import costs increased and the exchange rate continued to depreciate.
In Nigeria, in June 2000, the government increased the price of gasoline by 50 percent. This price
increase followed an effective doubling of civil service wages and a major adjustment of the
minimum wage in May. However, in reaction to protests by organized labor and students in the
major cities, the government agreed to a reduced price increase of 10 percent, while apologizing
for not consulting various stakeholders more widely. Observers have linked the protests to an IMF‐
supported program and the absence of social safety nets in an environment of widespread
poverty.
Source: Gupta et al. 2000.

86
The first step leads to consideration of whether there has been repeated failure to adopt or only
partially implement the reform policy and, if so, whether this failure has a political economy dimension.
The second and third steps are similar but not identical. Political economy analysis must identify both
governance weaknesses as expressed through the institutional arrangements and the reasons why such
weaknesses exist.
Victor (2009) gives an account of the reasons fossil fuel subsidies have arisen and, once having arisen,
are so difficult to remove. He points out that political economy analysis often begins with the
assumption that the government acts with the goal of staying in power. Policies that provide subsidies
channel resources to organized interest groups that can affect government survival, for example by
voting. In addition to “populist” subsidies that are aimed at voting consumers, there is also the “populist
paradox” where the largest subsidies (cheapest fuels) are often provided by governments that do not
face popular referenda. Here, he suggests that the threat of social instability induces such governments
to offer highly visible benefits in terms of subsidized fuel prices. It is particularly difficult for oil‐
producing countries to phase out petroleum product subsidies because many citizens consider cheap oil
an entitlement, and also feel that a bird in the hand (today’s subsidies) is worth two in the bush (future
better economic performance generally).
A different type of vested interest that leads to opposition to sector reform was illustrated by Lal (2006)
in a study of the Indian power sector. He pointed out that among the primary stakeholders are the staff
of the utilities themselves as well as intermediaries such as politicians and trade unions. Secondary
stakeholders include consumers, and among them important organized groups such as farmers and
transportation operators. The primary or secondary stakeholders may see jobs or livelihoods threatened
by reforms, including subsidy reform, and this can make it more difficult to implement policies aimed at
improving the efficiency of the sector.
A noteworthy feature of the power sector in many developing countries is its poor performance.
Blackouts and brownouts are common, leading to increased costs through loss of production, the need
to invest in back‐up generation, and damage to equipment (Monari 2002; Lal 2006). In this situation
consumers may not be willing to pay higher prices for a poor service. Sequencing of subsidy reform and
improved supply needs to be considered in order to make the reform both acceptable and sustainable.
Without an improved service the willingness to pay higher prices will be low, while mere promises of
improvement, once the financial situation of the utility has been restored via the higher revenue, will
not be credible, given previous poor performance. The policy strategy needs to find a way of improving
performance ahead of the tariff increases.
Programs of sector reform that have coupled the liberalization of power tariffs with corporatization or
privatization of the sector suggest that the efficiencies gained from the wider reform would pay, at least
in part, for the higher tariffs that would otherwise accompany cost‐recovery. This has been seen as a
way to break the cycle of inefficient operation requiring unnecessarily high tariffs, leading to
government subsidies to protect consumers that in turn lead to further losses for the sector and a lack
of investment in maintenance and improvements, further increasing costs.

87
Where there are large subsidies that a government wishes to substantially reduce or remove, one
important question is the dynamic adjustment path. A series of small changes in successive years
compounds to a large change after a few years and is less likely to provoke a strong reaction from those
affected. However, to carry out such a sustained policy governments need commitment to stay the
course. Where the government is politically strong enough to weather any ensuing social disruption, a
“big bang” approach with a large initial adjustment may be the approach most likely to endure. Once
the subsidy has been nearly or totally removed, it would be possible to move the pricing decision from
the government’s direct control to a regulatory agency.
Victor (2009) offers some general lessons with respect to reforming petroleum product subsidies and
that can be applied also to power sector subsidies.
1. Reform strategy must address the political logic that led to subsidy creation. The reform
strategy must either compensate the political interest that would otherwise oppose the
subsidy reduction or removal, or must find a way to insulate the reform from their opposition.
2. Ensure transparency of the costs and purpose of the subsidy. Reforming subsidy may be easier
if all members of society are fully aware of the costs they are paying, and the extent to which
they or others are benefitting.
3. For essential subsidies ensure the best design to carry out the stated purpose. Better subsidy
design can reduce the overall costs to the economy, the excess demand for energy and the
associated negative externalities. In particular, subsidy design should focus on long‐term costs,
use pre‐announced conditions for subsidy recipients, should have explicit adjustment
mechanisms, and should utilize performance targeting.
4. Governments need to develop more selective policy instruments. Broad‐spectrum subsidies are
less effective in meeting their stated purpose but are popular because they tend to spill over to
a wider group of users, making it increasingly difficult to reverse such policies later.
A number of studies have addressed in detail the wider issues involved in reforming energy subsidies.
These include UNEP/IEA (2002), USAID (2004), Reiche and Teplitz (2008), and the World Bank (2008b).
All these propose criteria for successful subsidy reform. As well as highlighting the various practical
considerations, suggestions have been made as to how subsidy reduction or removal could be made
more acceptable to the public, so as to avoid strong reaction and the need to reverse policy that has
been seen on occasion. The government needs not only to work towards equity improvement in subsidy
design, but also needs to communicate this in a transparent and verifiable way. The UNEP/IEA (2002)
suggested that reforms may need to be introduced in a gradual, programmed fashion; compensating
measures to support incomes of specific groups could be introduced; and politicians should
communicate clearly to the public the benefits of subsidy reform to the economy and steps being taken
to protect weaker members of society. USAID (2004) provided a list of pitfalls to be avoided in launching
a subsidy reform policy. Most of these relate to the public relations aspect as shown in box 5.
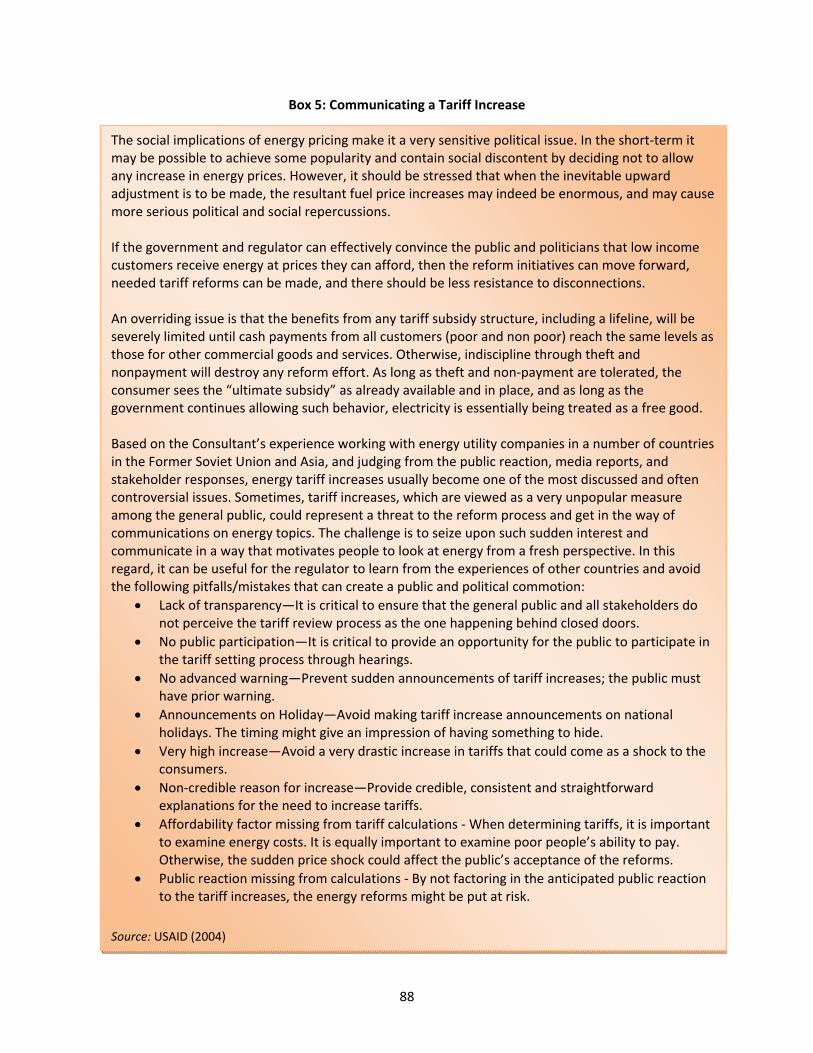
88
Box 5: Communicating a Tariff Increase
The social implications of energy pricing make it a very sensitive political issue. In the short‐term it may be possible to achieve some popularity and contain social discontent by deciding not to allow any increase in energy prices. However, it should be stressed that when the inevitable upward adjustment is to be made, the resultant fuel price increases may indeed be enormous, and may cause more serious political and social repercussions. If the government and regulator can effectively convince the public and politicians that low income customers receive energy at prices they can afford, then the reform initiatives can move forward, needed tariff reforms can be made, and there should be less resistance to disconnections. An overriding issue is that the benefits from any tariff subsidy structure, including a lifeline, will be severely limited until cash payments from all customers (poor and non poor) reach the same levels as those for other commercial goods and services. Otherwise, indiscipline through theft and nonpayment will destroy any reform effort. As long as theft and non‐payment are tolerated, the consumer sees the “ultimate subsidy” as already available and in place, and as long as the government continues allowing such behavior, electricity is essentially being treated as a free good. Based on the Consultant’s experience working with energy utility companies in a number of countries in the Former Soviet Union and Asia, and judging from the public reaction, media reports, and stakeholder responses, energy tariff increases usually become one of the most discussed and often controversial issues. Sometimes, tariff increases, which are viewed as a very unpopular measure among the general public, could represent a threat to the reform process and get in the way of communications on energy topics. The challenge is to seize upon such sudden interest and communicate in a way that motivates people to look at energy from a fresh perspective. In this regard, it can be useful for the regulator to learn from the experiences of other countries and avoid the following pitfalls/mistakes that can create a public and political commotion:
Lack of transparency—It is critical to ensure that the general public and all stakeholders do not perceive the tariff review process as the one happening behind closed doors.
No public participation—It is critical to provide an opportunity for the public to participate in the tariff setting process through hearings.
No advanced warning—Prevent sudden announcements of tariff increases; the public must have prior warning.
Announcements on Holiday—Avoid making tariff increase announcements on national holidays. The timing might give an impression of having something to hide.
Very high increase—Avoid a very drastic increase in tariffs that could come as a shock to the consumers.
Non‐credible reason for increase—Provide credible, consistent and straightforward explanations for the need to increase tariffs.
Affordability factor missing from tariff calculations ‐ When determining tariffs, it is important to examine energy costs. It is equally important to examine poor people’s ability to pay. Otherwise, the sudden price shock could affect the public’s acceptance of the reforms.
Public reaction missing from calculations ‐ By not factoring in the anticipated public reaction to the tariff increases, the energy reforms might be put at risk.
Source: USAID (2004)

89
As part of this communications strategy the quantification of subsidy costs and benefits, as well as its
targeting performance, should be undertaken. This should be done not only for the proposed subsidy
reform but also for alternatives schemes that might be proposed by potential opponents of the change,
in order that an informed discussion can take place at an early stage on the policy dialogue. Further, a
communication strategy concerning possible subsidy removal (reduction) should place this issue in the
wider context of how the government plans to address the various ailments of the sector—such as
inefficiencies, incorrect planning decisions, corruption, and tariff setting.
Some case studies of energy sector subsidy reform
A number of governments have managed to reduce energy subsidies involving a substantial increase in
prices, without incurring sufficient public opposition that the policy had to be subsequently reversed.
Brief accounts of some such cases are given in boxes 611, while a wider range of case studies is given by Vagliasindi (forthcoming).

90
Box 6: Reducing Petroleum Product Subsidies: the Case of Jordan
Jordan had been subsidizing petroleum products for many years, but the system came under pressure
beginning in 2003 when it lost preferential fuel supply from Iraq. The government then implemented a
series of price increases to limit the budgetary effect. Nevertheless, by 2008, the subsidy bill for energy
amounted to about 5 percent of GDP.
Earlier the government had considered raising prices to international levels but had backtracked on an
agreement to do so reached with the IMF, because of fears of social unrest such as had happened in
1989 and 1996. In February 2008 the government announced that the fiscal burden of the subsidies
was not longer sustainable and raised petroleum product prices to international levels by amounts
ranging from 9 percent for premium gasoline to 76 percent for diesel and kerosene. A plan to remove
the subsidy on LPG used for cooking was abandoned after intervention by King Abdullah (Kojima
2009b).
The government, conscious of the effects on the population, announced that it would adopt some
mitigating measures, including increases in the salaries of state employees, an increase in food
subsidies, the reduction of certain import duties, and the introduction of projects to combat
unemployment and poverty. The compensation package was estimated to be equivalent to 7 percent
of GDP. One aspect of this reform package was the scaling up and improved targeting of the National
Aid Fund to the poor using an existing cash transfer system. The compensation package was also
designed to direct a portion of the budgetary savings to benefit low‐ and middle‐income households.
Recent household expenditure survey data were used for in‐depth analysis of middle‐class risks in
setting the limits for support. Before the scheme became operational an extensive media campaign
was launched to prepare the public for the subsidy removal.
Despite the very large international oil price increase that followed immediately after the
government’s decision to liberalize prices, the policy has so far been successful and domestic prices
have continued to follow international levels. The subsidy phase‐out appears to have been successful
in part because it was well‐designed and the public understood that it was needed. In addition there
were a number of factors individual to the Jordanian situation: there had been earlier a successful
withdrawal of a food subsidy program; the impetus for change was provided by the external shock of
the Iraq war; and emigrant remittances were particularly high during high price period of 2008 (most
coming from the Gulf region) and increased by more than subsidies were reduced. An additional factor
is that the government increased food subsidies just as fuel subsidies were being reduced, particularly
following the food crisis of 2007–8. This helped partially offset the adverse effects of fuel subsidy
removal. As a share of GDP, fuel subsidies fell from 5.6 percent in 2005 to 1.4 percent in 2008, but food
subsidies increased from 0.6 to 1.8 percent during the same period (IMF 2007, 2009).

91
Box 7: Reducing Petroleum Product Subsidies: the Case of Indonesia
Indonesia is an oil‐producing nation that recently became a net oil‐importer. Because of its former oil status
it has had a history of subsidizing domestic prices, and attempts in 1998 and 2003 to reduce subsidies met
with such fierce public opposition that the increases had to be rolled back. The rise in international oil
prices in 2003 and 2004 led to a rapid increase in subsidies as the government sought to limit the impact on
households by introducing a price freeze. The fiscal implications of the freeze were severe with the cost of
the petroleum product subsidies reaching 5 percent of GDP (Pallone 2009).
The incoming government of President Yudhuyono was able to respond to this challenge by increasing the
prices of gasoline, kerosene, and diesel twice in 2005, by amounts totaling at least 150 percent. Although
domestic prices still did not reach international levels these were substantial increases, and it was
remarkable that they did not generate mass opposition as such moves had done in the recent past.
Several factors may have contributed to this success, as suggested by Bacon and Kojima (2006) and Grosch
et al. (2008). The success of the first increase in March 2005 may be linked to the status of the then
incoming new government, that was seen as strong and credible. By August the government had taken a
decision to link a second price increase to a targeted cash transfer scheme. The overall strategy was to
reduce fuel subsidy expenditure by about half. One quarter of the funds were to be used to fund the
targeted, unconditional transfer program, and the remainder was to be used for block grants to schools,
basic health care and health insurance for the poor, and for a village improvement program. It was decided
to target not just those who fell below the official poverty line, but the near poor as well. The magnitude of
the cash transfer was such that it was expected to more than compensate targeted households for the
increase in fuel prices. The full distributional impact of the fuel pricing reform has been analyzed by Yusuf
and Resosudarmo (2008) using a CGE model.
The government supported the subsidy reform program with public information campaigns to publicize the
scheme. Information was presented in announcements in newspapers, TV talk‐shows, notices on village
announcement boards, and through the distribution of brochures covering frequently asked questions. The
disbursements were made in two tranches and this allowed the government to rectify some problems. It
organized public hearings with program beneficiaries and worked to improve the logistics of distribution at
the post office and complaint resolution procedures.
Despite this initial success of the subsidy reform program, the government, faced with continually
increasing international oil prices, decided to freeze the price of the subsidized fuels between October 2005
and May 2008. The result was that the cost to the budget of the subsidy rose sharply. The main
beneficiaries of the subsidies had been the better‐off members of society and their opposition to subsidy
reduction at a time when oil prices were high may have prevented the government from repeating its
earlier strategy sooner. The government increased fuel prices by 25 percent or more in May 2008,
accompanied by another round of targeted cash transfers. In a reversal of policy, the government stated in
early 2010 that it would no longer consider raising fuel prices and planned for a higher fuel subsidy bill in
the 2010 budget (IIF 2010). Without an automatic price adjustment mechanism, a cycle of price freeze,
fiscal burden, and emergency policy response may have to be repeated if world oil prices were to start
rising with global economic recovery in the coming years.

92
Box 8: Reducing Petroleum Product Subsidies: The Case of Ghana
Ghana has been a small producer of oil, importing the bulk of its needs either in the form of petroleum
products or as crude oil to be processed in its domestic refinery. Prior to 2005 domestic product prices
had been subsidized by the government, sometimes by large amounts. In January 2003 the prices were
increased by 90 percent in an attempt to link the domestic prices to world prices. There was
widespread popular opposition to this move but not sufficient to cause the government to back down.
From this date on the government—facing an election in December 2004—did not maintain the link to
international prices and, as the world price of oil rose, the total cost of subsidies increased sharply.
After the election the incoming government announced in February 2005 fuel price increases of 50
percent, coupling the announcement with an extensive public information. A series of mitigation
measures were also introduced that were transparent and easily monitorable. These included the
immediate elimination of fees as government‐run primary and junior‐secondary schools, and a program
to improve public transport. As a result, although there was opposition to the increases from trade
unions, there was general acceptance of the policy and no large scale demonstrations against the
increases took place campaign (Bacon and Kojima 2006).
A key ingredient in the public relations campaign was the use of the results of a poverty and social
impact analysis (PSIA) for fuel that had been launched during 2004 when it had become evident that
action to increase prices would be needed. The PSIA was administered by a steering committee drawn
from ministries, the national oil company, and academics. The process was completed in less than one
year and by the time of the fuel price increase announcement the results were available to the
government to support its case. The potential effects of reducing petroleum product subsidies on the
public were analyzed and it was shown that the better‐off members of society benefitted most from
the presence of the subsidies (Coady and Newhouse 2006).
The public relations campaign commenced with the Minister of Finance making a radio broadcast to
explain the need for the price increases and to announce the mitigation measures. Radio interviews
with various government officials followed. The energy ministry took out advertisements in newspapers
showing that Ghana’s prices were the lowest in West Africa after Nigeria.
From February 2005 until May 2008 the government continued with its policy of liberalized prices
subject to price ceilings in line with world prices but, in the face of the surge in oil prices, froze the price
ceilings between May and November 2008. The election at the end of 2008 saw a pledge by the later
victorious opposition party to abandon serial oil price increases that had been experienced under the
then government. In fact the incoming government has resorted to an ad hoc pricing approach with
price increases coming in April, June and November 2009 (IHS Global Insight Daily Analysis 2009).
The reintroduced subsidies resulted in the net debts of the domestic oil refinery mounting to around
$600 million in 2009. As a result of this debt the refinery could not buy crude and had to shut down for
most of 2009 (International Oil Daily 2009).

93
Box 9: Reducing Electricity Subsidies: The Case of Armenia
In the first half of the 1990s, Armenia’s power system was at a state of near collapse. This followed the
disintegration of the Soviet Union and the effects of Armenia’s war over Nagorno Karabakh. The latter
led to an economic blockade cutting off the only source of gas and oil for power plants, while an
earlier earthquake had forced a shutdown of a nuclear plant supplying almost one third of total
generation. During the winters customers suffered from rationing to little more than two hours per
day. At the same time the sector was running a huge quasi‐fiscal deficit equivalent to about 11 percent
of GDP in 1995. Collections were barely above 50 percent, and commercial losses were nearly 25
percent.
The government took a number of steps to address these problems. These began with improvements
in energy supply that resulted in 24‐hour supply being restored by late 1996, while the government
emphasized the link between better supply and bill payment. The metering system was improved to
address unaccounted losses and collection failure. This was followed by a privatization program that
proceeded slowly, due in part to the turmoil in power markets caused by the failure of Enron and the
California electricity crisis.
By 2004 the sector had been transformed. Collections had reached nearly 100 percent, and
commercial losses had been reduced to 4 percent. Tariffs set by a regulator were near medium‐term
cost‐recovery levels (that is, recovering short term‐cost of service, depreciation, and some part of new
investment). The drain on the government budget ceased and the sector became a net tax‐contributor
to the budget. Between 1996 and 2004 the average tariff level doubled in real terms.
A number of factors contributed to Armenia’s ability to raise prices and eliminate subsidies.
1. The supply availability was so poor that virtually any change would be seen as an
improvement. The costs of blackouts were so high that there was an implicit willingness to pay
for better supply at reasonable tariffs.
2. The government was able to improve supply before it started on the program of raising tariffs,
improving bill collection, and reducing unaccounted losses. This gave credibility to the whole
of the subsequent reform agenda.
3. The government was able to increase social transfers during this period of reform. Between
2001 and 2004 social spending increased from 6.5 to 7.2 percent of GDP despite an overall
decrease in fiscal expenditure. Although this could not fully compensate the effect of the tariff
increases on the poor, it was certainly an important factor both materially and psychologically.
4. The new private sector company showed itself willing to disconnect non‐payers even when
they were as important as the Ministry of Internal Affairs, the mayor’s office, and the Ministry
of Energy. This provided credibility to the reform and subsidy removal process.
5. The private sector company not only was able to raise wages, but also gave a significant
variable component to its employees based on improvements in losses and collections.
Source: Sargsyan, Balabanyan, and Hankinson 2006.
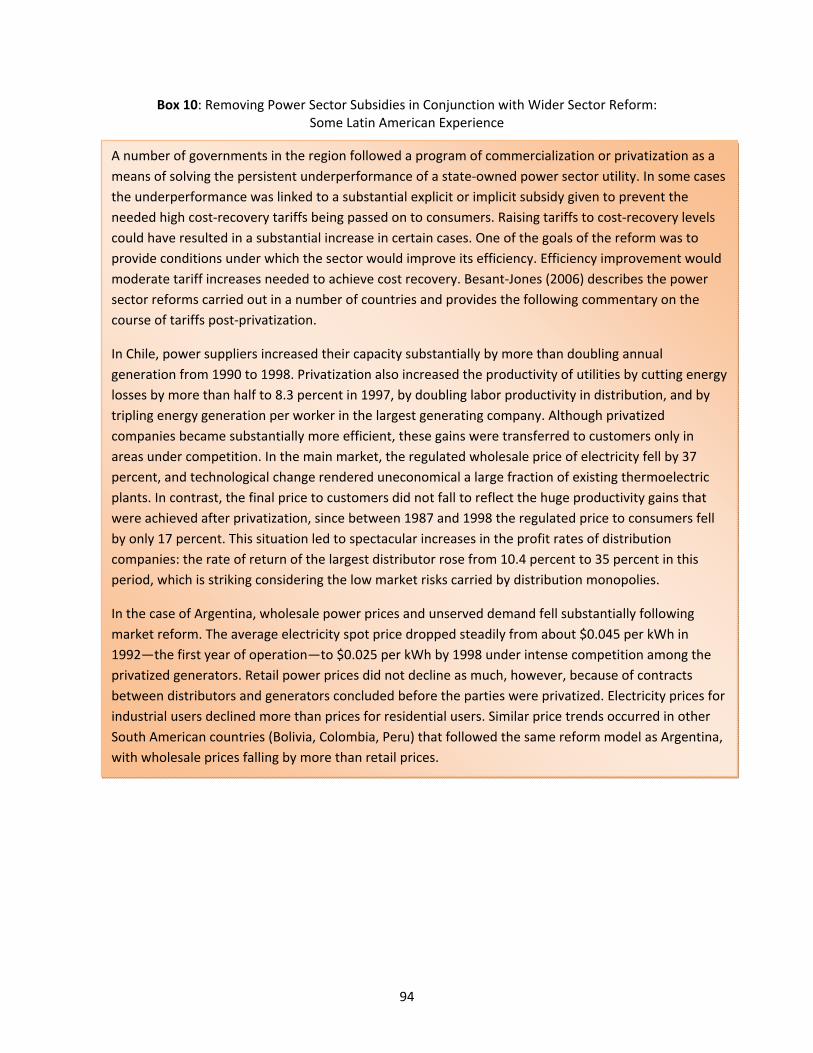
94
Box 10: Removing Power Sector Subsidies in Conjunction with Wider Sector Reform: Some Latin American Experience
A number of governments in the region followed a program of commercialization or privatization as a
means of solving the persistent underperformance of a state‐owned power sector utility. In some cases
the underperformance was linked to a substantial explicit or implicit subsidy given to prevent the
needed high cost‐recovery tariffs being passed on to consumers. Raising tariffs to cost‐recovery levels
could have resulted in a substantial increase in certain cases. One of the goals of the reform was to
provide conditions under which the sector would improve its efficiency. Efficiency improvement would
moderate tariff increases needed to achieve cost recovery. Besant‐Jones (2006) describes the power
sector reforms carried out in a number of countries and provides the following commentary on the
course of tariffs post‐privatization.
In Chile, power suppliers increased their capacity substantially by more than doubling annual
generation from 1990 to 1998. Privatization also increased the productivity of utilities by cutting energy
losses by more than half to 8.3 percent in 1997, by doubling labor productivity in distribution, and by
tripling energy generation per worker in the largest generating company. Although privatized
companies became substantially more efficient, these gains were transferred to customers only in
areas under competition. In the main market, the regulated wholesale price of electricity fell by 37
percent, and technological change rendered uneconomical a large fraction of existing thermoelectric
plants. In contrast, the final price to customers did not fall to reflect the huge productivity gains that
were achieved after privatization, since between 1987 and 1998 the regulated price to consumers fell
by only 17 percent. This situation led to spectacular increases in the profit rates of distribution
companies: the rate of return of the largest distributor rose from 10.4 percent to 35 percent in this
period, which is striking considering the low market risks carried by distribution monopolies.
In the case of Argentina, wholesale power prices and unserved demand fell substantially following
market reform. The average electricity spot price dropped steadily from about $0.045 per kWh in
1992—the first year of operation—to $0.025 per kWh by 1998 under intense competition among the
privatized generators. Retail power prices did not decline as much, however, because of contracts
between distributors and generators concluded before the parties were privatized. Electricity prices for
industrial users declined more than prices for residential users. Similar price trends occurred in other
South American countries (Bolivia, Colombia, Peru) that followed the same reform model as Argentina,
with wholesale prices falling by more than retail prices.
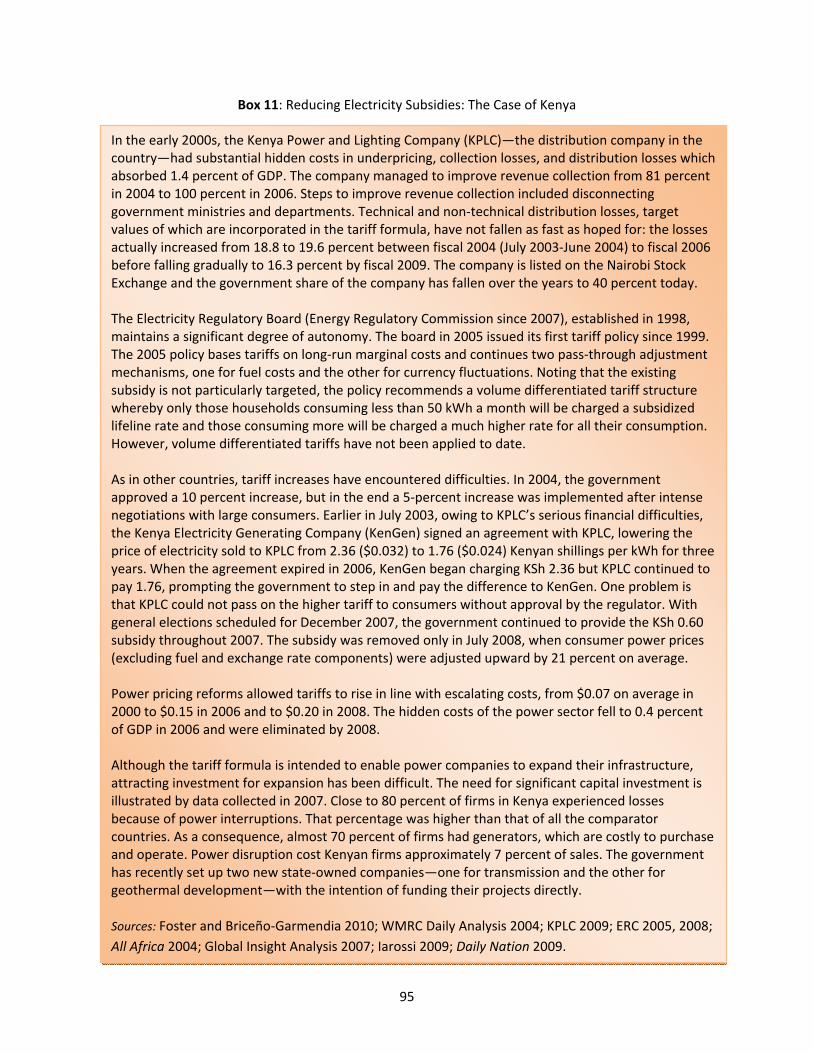
95
Box 11: Reducing Electricity Subsidies: The Case of Kenya
In the early 2000s, the Kenya Power and Lighting Company (KPLC)—the distribution company in the country—had substantial hidden costs in underpricing, collection losses, and distribution losses which absorbed 1.4 percent of GDP. The company managed to improve revenue collection from 81 percent in 2004 to 100 percent in 2006. Steps to improve revenue collection included disconnecting government ministries and departments. Technical and non‐technical distribution losses, target values of which are incorporated in the tariff formula, have not fallen as fast as hoped for: the losses actually increased from 18.8 to 19.6 percent between fiscal 2004 (July 2003‐June 2004) to fiscal 2006 before falling gradually to 16.3 percent by fiscal 2009. The company is listed on the Nairobi Stock Exchange and the government share of the company has fallen over the years to 40 percent today. The Electricity Regulatory Board (Energy Regulatory Commission since 2007), established in 1998, maintains a significant degree of autonomy. The board in 2005 issued its first tariff policy since 1999. The 2005 policy bases tariffs on long‐run marginal costs and continues two pass‐through adjustment mechanisms, one for fuel costs and the other for currency fluctuations. Noting that the existing subsidy is not particularly targeted, the policy recommends a volume differentiated tariff structure whereby only those households consuming less than 50 kWh a month will be charged a subsidized lifeline rate and those consuming more will be charged a much higher rate for all their consumption. However, volume differentiated tariffs have not been applied to date. As in other countries, tariff increases have encountered difficulties. In 2004, the government approved a 10 percent increase, but in the end a 5‐percent increase was implemented after intense negotiations with large consumers. Earlier in July 2003, owing to KPLC’s serious financial difficulties, the Kenya Electricity Generating Company (KenGen) signed an agreement with KPLC, lowering the price of electricity sold to KPLC from 2.36 ($0.032) to 1.76 ($0.024) Kenyan shillings per kWh for three years. When the agreement expired in 2006, KenGen began charging KSh 2.36 but KPLC continued to pay 1.76, prompting the government to step in and pay the difference to KenGen. One problem is that KPLC could not pass on the higher tariff to consumers without approval by the regulator. With general elections scheduled for December 2007, the government continued to provide the KSh 0.60 subsidy throughout 2007. The subsidy was removed only in July 2008, when consumer power prices (excluding fuel and exchange rate components) were adjusted upward by 21 percent on average. Power pricing reforms allowed tariffs to rise in line with escalating costs, from $0.07 on average in 2000 to $0.15 in 2006 and to $0.20 in 2008. The hidden costs of the power sector fell to 0.4 percent of GDP in 2006 and were eliminated by 2008. Although the tariff formula is intended to enable power companies to expand their infrastructure, attracting investment for expansion has been difficult. The need for significant capital investment is illustrated by data collected in 2007. Close to 80 percent of firms in Kenya experienced losses because of power interruptions. That percentage was higher than that of all the comparator countries. As a consequence, almost 70 percent of firms had generators, which are costly to purchase and operate. Power disruption cost Kenyan firms approximately 7 percent of sales. The government has recently set up two new state‐owned companies—one for transmission and the other for geothermal development—with the intention of funding their projects directly. Sources: Foster and Briceño‐Garmendia 2010; WMRC Daily Analysis 2004; KPLC 2009; ERC 2005, 2008;
All Africa 2004; Global Insight Analysis 2007; Iarossi 2009; Daily Nation 2009.
96
These case studies of governments that have managed to reduce subsidies and raise energy prices, even
if not permanently, have certain common features that point to strategies for other governments to
consider. Some key strategies that emerge from this review include the following:
1. Subsidy reform appears to be possible in situations where the explicit or implicit fiscal
costs to the government are so large that the government feels it must act. This
strengthens the political willpower, without which little can be achieved.
2. Increasing the availability and transparency of energy subsidy data is essential in
overcoming some of the challenges related to reform. This can encourage an informed
discussion and debate regarding the subsidies and government policies toward them.
3. Efforts should be made to provide targeted assistance to vulnerable groups, such as
lower‐income households who will be adversely affected by subsidy changes.
Compensation needs to be visible and sufficiently material to offset a good part of the
adverse effect in the early years of the change. Consideration should be given to
alternative policy tools to protect the poor, such as cash and non‐cash transfers, and, for
electricity, district heating, or natural gas, lifeline rates or volume differentiated tariffs.
Subsidies for connection charges can also be targeted to the poor, but may need to be
limited in countries where the connection rate is low.
4. The credibility of the government’s plan to compensate vulnerable groups is important for
public acceptance, as is its plan to use the funds freed from subsidy reform for social and
economic benefits.
5. A well‐organized publicity campaign is essential. Governments can reduce uncertainty and
persuade the public that the effects will not be as deleterious as might otherwise be
feared by explaining, before the changes are introduced, the need for change and the
compensating measures that will be implemented.
6. Using a household expenditure survey to provide information on those benefiting from
the existing subsidy and the potential effects of subsidy removal on various groups
provides an important reference for assessing the adequacy of compensation measures
that are planned.
7. An election may provide a window of opportunity to make bold changes, because a new
government may initially enjoy a period of greater credibility and legitimacy than the old
government that failed to tackle the problem. This suggests that incoming governments
need to start preparation beforehand to be able to move early in their term in office.
8. Improving the quality of service ahead of increasing prices lends credibility and increases
the willingness to pay higher prices. This is particularly true for energy distributed through
networkselectricity, district heating, and natural gas where the quality of service may
be low, possibly because of the financing difficulties caused by subsidies. Steps such as
improving bill collection and making the metering system more effective may allow other
changes to be introduced that could be linked to the general tariff increases required to
reduce the fiscal burden further.
9. Use of transitional arrangements that are phased out as household energy use increases
over time can act to protect low‐income groups at the time of the policy change.

97
However, in two of the cases reviewed governments were unable to adhere to a permanent policy
of subsidy reduction. It should be noted that the extreme high oil prices of 2008 led to such
pressure on consumers that some governments felt compelled to limit the price increases. This in
turn rapidly escalated the fiscal burden. Without a full liberalization of price setting, governments
that are involved in controlling petroleum product prices, either through a formula or on an ad hoc
basis, will always be under pressure to adapt the rules to the current circumstances. The benefit of
moving to a fully liberalized price system is that it is much more difficult for the government to
reintroduce price control since it will be faced with a demand for explicit subsidies, rather than
permitting state enterprises to increase the quasi‐fiscal deficit through cutting their operating
budget and utilizing debt finance, neither of which is sustainable.
Concluding Observations
Energy sector subsidies are large and widespread in both developed and developing countries.
Consumer subsidies are particularly important in many developing countries. Petroleum product
subsidies are known to be very large in certain cases, especially in some major oil‐exporting countries.
Power sector subsidies that result from underpricing, excessive losses, and bill collection failure are
known to be common in those developing countries for which detailed investigations have been carried
out. However, more systematic information is needed to give a fully comprehensive picture.
While subsidies can have benefits in terms of support for the poor, job creation, industry protection, or
energy security, they also carry costs. These include fiscal costs and effects on the balance of payments,
growth, and global externalities. In particular, in economies with large energy consumption, the extra
demand for energy induced by the lower consumer prices can work against energy security and have
global effects through increased GHG emissions from the combustion of fossil fuels and possibly higher
prices for widely traded forms of energy.
In the light of these costs to their economy it is important that governments design their subsidy
scheme so as to achieve the desired benefits with the lowest overall costs. Some broad findings of this
review suggest a number of points to be taken into account:
Gasoline, diesel, and LPG subsidies are weakly targeted to the poor, particularly in low‐income
countries.
Kerosene subsidies may be targeted to the poor through their direct effects, but the leakage to
better‐off households, commercial establishments, and the transport sector arising from the
ease of adulterating diesel fuel with kerosene means that their pro‐poor benefits may be
limited.
Electricity subsidies resulting from excessive losses or failure to collect bills do not have
economic justification and should be actively reduced.
Electricity subsidies through generalized underpricing are likely to be regressive, and much
better targeting may be achieved through a careful design of the tariff structure. Volume
differentiated tariffs appear to perform much better in this respect that increasing block tariffs.

98
Subsidies to connection charges for electricity can be designed to be strongly progressive, but
their substantial cost per household requires an investigation into the lowest cost method of
supply as well as comparative assessment of other options to help the poor.
Cross‐subsidies for tariffs and for connection charges between different classes of users can be
an important instrument, but are of limited use where overall connection rates are very low.
Social safety nets can provide a more effective way of reaching the poor while controlling public
expenditure. However, they require a strong administration.
Because energy subsidies can result in a large fiscal burden, all subsidy schemes should consider
the inclusion of natural phaseout provisions. This can help to reduce the expectation of a
permanent subsidy that can be very difficult to combat at the time a government feels the need
to reduce the fiscal burden. However, some subsidy schemes may be designed to be permanent,
such as cross‐subsidies between different groups of consumers (such as urban households cross‐
subsidizing rural households for whom costs of power supply can be markedly higher).
Transparency is important. Proper accounting and public awareness of which groups benefit
from subsidies, by how much, and the cost is essential to evaluate government policies.
Subsidies to support a switch from fossil fuels to renewable energy need to be carefully planned
and to consider the inclusion of natural phase‐out provisions.
Because of the potential cost of a subsidy scheme and of the different performance of
alternative schemes, a full evaluation of costs and benefits should be made before making any
changes to the status quo. Governments that have rushed subsidy reform without preparing the
population for the changes, and without providing targeted support to particularly
disadvantaged groups, have often had to reverse the policy in the face of widespread
opposition.
In compiling this overview of the role of different forms of subsidies for energy, arguments for their
retention or removal, and the problems associated with removal, it has become evident that there is a
need for further work of a more focused nature. First, a more systematic analysis of the political
economy of retaining or removing subsidies to the various forms of energy would be valuable. Second,
refining the discussion of policy options and best practices by a typology of countries (for example,
energy exporting or importing, high or low electricity access, and the state of tariff‐setting methodology
for natural gas, district heating, or electricity) would provide a useful tool for those considering the role
of energy subsidies in a particular country. Third, some examples of applying the framework for deciding
on a particular subsidy change would provide valuable insights in how to deal with an individual case.
Finally, consideration could be given to exploring whether a manual on the treatment of energy
subsidies should be produced.
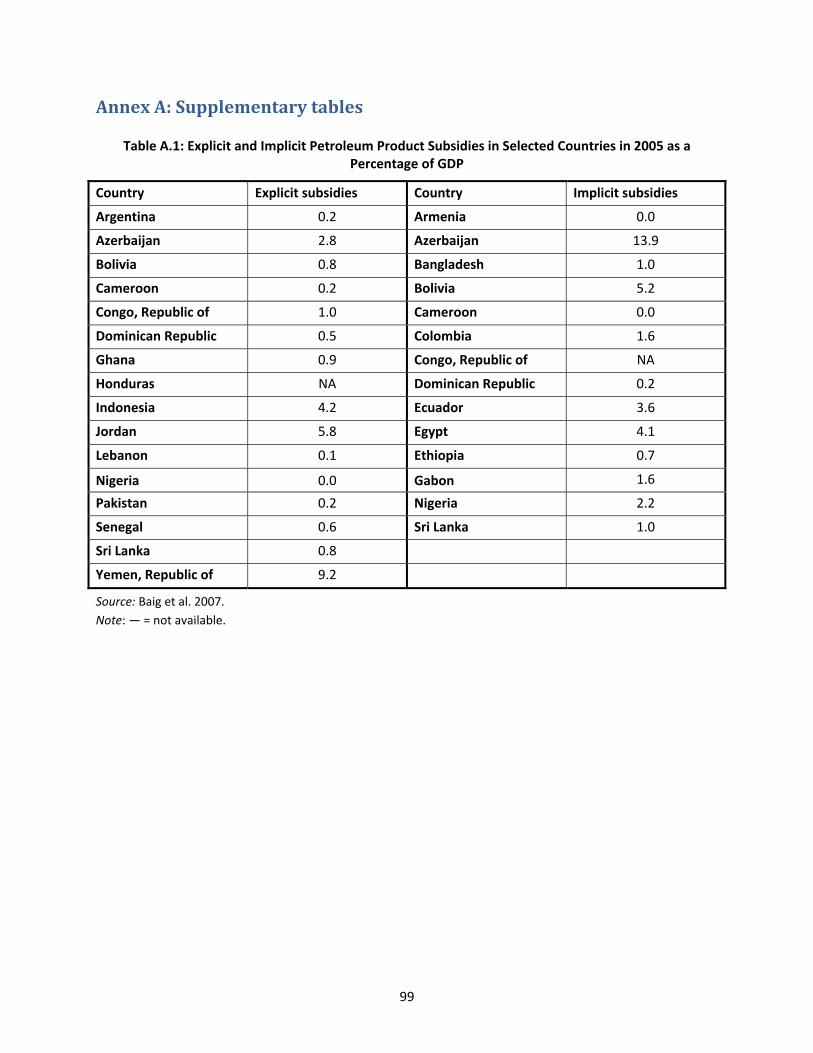
99
Annex A: Supplementary tables
Table A.1: Explicit and Implicit Petroleum Product Subsidies in Selected Countries in 2005 as a Percentage of GDP
Country Explicit subsidies Country Implicit subsidies
Argentina 0.2 Armenia 0.0
Azerbaijan 2.8 Azerbaijan 13.9
Bolivia 0.8 Bangladesh 1.0
Cameroon 0.2 Bolivia 5.2
Congo, Republic of 1.0 Cameroon 0.0
Dominican Republic 0.5 Colombia 1.6
Ghana 0.9 Congo, Republic of NA
Honduras NA Dominican Republic 0.2
Indonesia 4.2 Ecuador 3.6
Jordan 5.8 Egypt 4.1
Lebanon 0.1 Ethiopia 0.7
Nigeria 0.0 Gabon 1.6
Pakistan 0.2 Nigeria 2.2
Senegal 0.6 Sri Lanka 1.0
Sri Lanka 0.8
Yemen, Republic of 9.2
Source: Baig et al. 2007.
Note: — = not available.

100
Table A.2: Hidden Costs in Power as a Percentage of GDP in Eastern Europe and Central Asia
Country 2000 2001 2002 2003
Albania 10.5 7.4 6.1 4.1
Armenia 1.4 2.2 1.0 1.0
Azerbaijan 11.4 10.1 8.1 6.4
Belarus 2.5 2.2 0.8 0.0
Bosnia 5.4 5.1 3.9 1.4
Bulgaria 9.5 8.1 7.0 3.8
Croatia 2.1 2.1 1.8 0.9
Georgia 12.2 6.9 6.5 6.0
Kazakhstan 3.3 2.9 2.4 1.3
Kyrgyz Republic 18.6 25.2 19.0 9.2
Macedonia 5.0 3.6 3.5 5.6
Moldova 10.8 7.7 3.2 2.7
Poland 0.3 1.4 1.1 0.8
Romania 3.8 3.7 2.5 1.3
Russia 5.4 3.6 3.1 1.0
Serbia and Montenegro 22.5 16.5 8.9 8.7
Tajikistan 28.2 25.0 23.0 16.5
Turkey 1.8 2.1 1.1 0.6
Ukraine 8.6 10.2 13.1 12.1
Uzbekistan 8.6 10.2 13.1 12.1
Source: Ebinger 2006.
Table A.3: Hidden Costs in Natural Gas as a Percentage of GDP in Eastern Europe and Central Asia
Country 2000 2001 2002 2003
Armenia 0.4 0.2 0.2 0.5
Azerbaijan 1.4 1.2 1.1 0.9
Belarus 1.9 2.0 1.3 0.5
Bulgaria 1.4 1.1 0.7 1.0
Croatia 0.0 0.2 0.1 0.0
Georgia 1.0 2.0 1.2 0.0
Kazakhstan — — — 0.7
Kyrgyz Republic 0.4 0.2 0.4 0.0
Moldova 0.8 0.6 0.8 0.9
Poland 0.4 0.2 0.1 0.0
Romania 1.0 0.8 0.5 0.2
Russia 1.2 0.9 0.7 0.4
Tajikistan 2.0 1.9 1.1 0.4
Turkey 0.1 0.2 0.1 0.3
Ukraine 3.7 5.1 1.1 1.0
Uzbekistan 3.0 3.4 5.9 1.3
Source: Ebinger 2006.
Note: —= data not available.

101
Table A.4: Hidden Costs in Power as a Percentage of GDP in Sub‐Saharan Africa (average 2001–2006)
South Africa 0.0 Ethiopia 1.8
Benin 0.2 Uganda 1.9
Kenya 0.5 Cameroon 2.2
Mozambique 0.7 Zambia 2.3
Chad 1.0 Tanzania 2.4
Cape Verde 1.2 Senegal 2.5
Madagascar 1.3 Ghana 3.1
Lesotho 1.4 Niger 3.5
Nigeria 1.4 Malawi 4.4
Burkina Faso 1.5 DRC 4.7
Rwanda 1.7
Source: Briceño‐Garmendia, Smits and Foster 2008.
Table A.5: Subsidy Targeting Indicators for the Electricity Sector for Various Countries
Country Type of subsidy Benefit targeting
performance indicator
Ω
Error of Exclusion of
Poor Households
%
Columbia, urban Geographically defined with IBT 1.01 2
Guatemala VDT with 300 kWh/month threshold 0.20 55
Peru IBT 0.82 60
Mexico Geographically defined with IBT 0.60 —
Argentina Provincial means‐tested subsidy 1.50 94
Croatia Uniform volumetric tariff 0.51 1
Hungary IBT 0.98 2
Georgia Winter heating allowance 1.20 75
Rwanda, urban Uniform volumetric tariff 0.26 87
Cape Verde IBT with 40 kWh/month first block 0.48 76
Saõ Tomé and Principe IBT with 300 kWh/month first block 0.41 77
Source: Komives et al. 2005.
Notes: —indicates not reported, IBT = increasing block tariff, VDT = volume‐differentiated tariff.

102
Table A.6: Shares of Electricity in Total Household Expenditure of Lowest and Highest Quintile Groups
Country Year Q1 Q5
Columbia, urban 2003 10.2 1.6
Guatemala 2000 3.0 3.0
Peru 2003 2.3 2.6
Uruguay 2002–2003 12.3 2.0
Mexico 2002 1.9 9.9
Bolivia, urban 1999 4.0 3.2
Nicaragua 1998 0.6 2.0
Argentina 2002 6.2 3.4
Albania, urban 2002 9.9 5.0
Armenia, urban 2002 10.2 6.4
Azerbaijan, urban 2002 2.0 1.7
Belarus, urban 2002 1.9 0.8
Bulgaria, urban 2002 11.8 8.5
Croatia 1998 4.0 2.4
Georgia, urban 2002 8.2 4.0
Hungary, urban 1997 7.6 4.2
Kazakhstan, urban 2002 3.8 1.6
Kyrgyz Republic, urban 2002 3.2 1.8
Latvia, Riga 1997 3.6 2.4
Moldova, urban 2002 9.3 5.6
Poland, urban 2002 10.1 5.5
Romania, urban 2002 7.1 5.4
Russian Federation, urban 2002 2.2 0.9
Tajikistan, urban 2002 3.4 1.9
Turkey, urban 2002 9.7 6.3
Ukraine, urban 2002 2.9 1.6
Rwanda, urban 2000–2001 4.4 2.2
Cape Verde 2001–2002 4.2 2.9
Saõ Tomé and Principe 2000–2001 5.1 4.4
Yemen, Republic of 2003 1.3 1.8
Philippines 2001 2.5 3.1
Source: Komives et al. 2005.
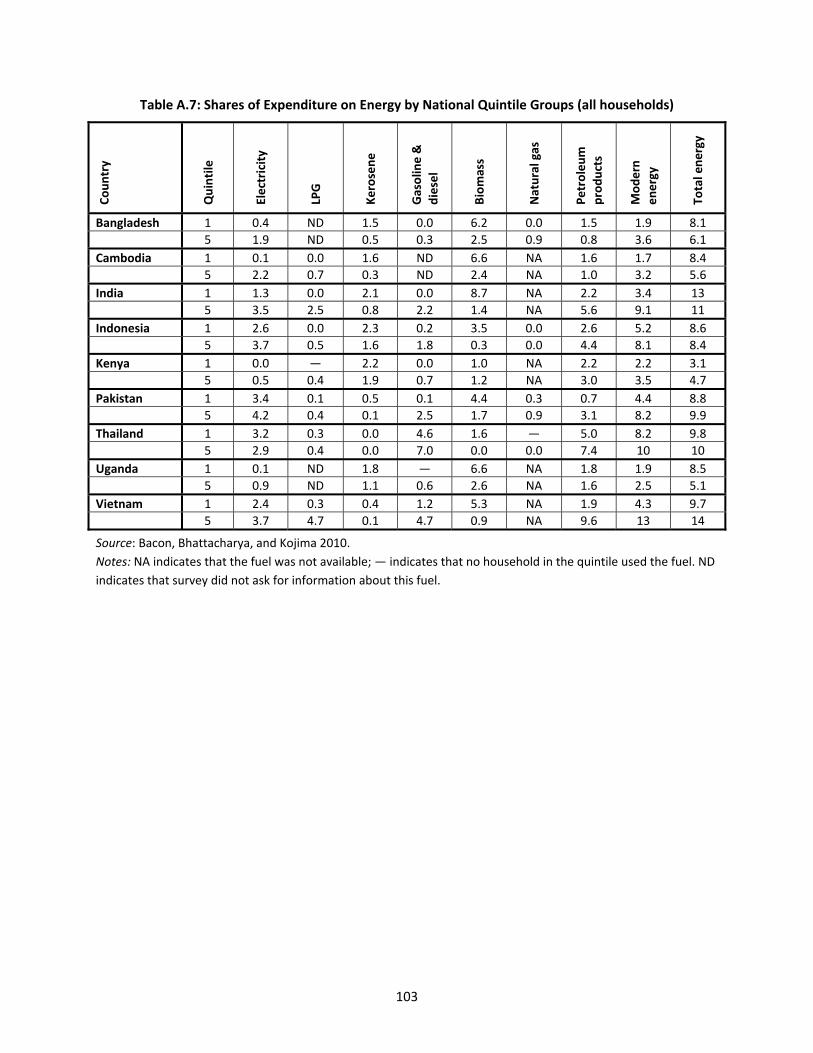
103
Table A.7: Shares of Expenditure on Energy by National Quintile Groups (all households) Country
Quintile
Electricity
LPG
Kerosene
Gasolin
e &
diesel
Biomass
Natural gas
Petroleum
products
Modern
energy
Total energy
Bangladesh 1 0.4 ND 1.5 0.0 6.2 0.0 1.5 1.9 8.1
5 1.9 ND 0.5 0.3 2.5 0.9 0.8 3.6 6.1
Cambodia 1 0.1 0.0 1.6 ND 6.6 NA 1.6 1.7 8.4
5 2.2 0.7 0.3 ND 2.4 NA 1.0 3.2 5.6
India 1 1.3 0.0 2.1 0.0 8.7 NA 2.2 3.4 13
5 3.5 2.5 0.8 2.2 1.4 NA 5.6 9.1 11
Indonesia 1 2.6 0.0 2.3 0.2 3.5 0.0 2.6 5.2 8.6
5 3.7 0.5 1.6 1.8 0.3 0.0 4.4 8.1 8.4
Kenya 1 0.0 — 2.2 0.0 1.0 NA 2.2 2.2 3.1
5 0.5 0.4 1.9 0.7 1.2 NA 3.0 3.5 4.7
Pakistan 1 3.4 0.1 0.5 0.1 4.4 0.3 0.7 4.4 8.8
5 4.2 0.4 0.1 2.5 1.7 0.9 3.1 8.2 9.9
Thailand 1 3.2 0.3 0.0 4.6 1.6 — 5.0 8.2 9.8
5 2.9 0.4 0.0 7.0 0.0 0.0 7.4 10 10
Uganda 1 0.1 ND 1.8 — 6.6 NA 1.8 1.9 8.5
5 0.9 ND 1.1 0.6 2.6 NA 1.6 2.5 5.1
Vietnam 1 2.4 0.3 0.4 1.2 5.3 NA 1.9 4.3 9.7
5 3.7 4.7 0.1 4.7 0.9 NA 9.6 13 14
Source: Bacon, Bhattacharya, and Kojima 2010.
Notes: NA indicates that the fuel was not available; ― indicates that no household in the quintile used the fuel. ND
indicates that survey did not ask for information about this fuel.

104
Table A.8: Percentage of All Households Using Different Energy Sources (connected) Country
Quintile
Electricity
LPG
Kerosene
Gasolin
e &
diesel
Biomass
Natural gas
Petroleum
products
Modern
energy
Bangladesh 1 12 ND 92 0.6 99 0.4 92 94
5 68 ND 63 5.2 98 27 66 93
Total 39 ND 81 1.6 99 8.4 82 94
Cambodia 1 1.5 0.2 90 ND 93 NA 90 91
5 53 29 45 ND 86 NA 73 92
Total 18 8.0 76 ND 92 NA 83 91
India 1 32 0.5 95 0.5 97 NA 95 98
5 92 66 46 36 38 NA 93 99
Total 64 24 79 13 78 NA 94 99
Indonesia 1 69 0.2 89 4.9 82 0.4 89 98
5 94 24 80 46 15 1.2 95 98
Total 87 7.1 89 25 47 0.5 93 99
Kenya 1 0.1 0.0 76 0.1 20 NA 76 76
5 23 14 83 7.2 54 NA 90 92
Total 8.3 4.3 85 2.5 44 NA 87 88
Pakistan 1 70 2.7 40 7.6 90 7.4 47 98
5 93 12 17 39 48 47 56 99
Total 83 8.0 30 20 74 24 50 99
Thailand 1 97 8.7 1.1 66 68 0.0 68 99
5 100 33 0.1 78 6.9 0.0 82 100
Total 99 27 0.6 77 35 0.0 81 100
Uganda 1 1.1 ND 88 0.0 96 NA 88 88
5 28 ND 82 6.3 86 NA 83 93
Total 9.7 ND 91 2.6 94 NA 91 94
Vietnam 1 88 3.4 44 27 95 NA 60 98
5 99 82 19. 84 36 NA 96 100
Total 96 38 35 60 73 NA 81 99
Source: Bacon, Bhattacharya, and Kojima 2010.
Notes: NA indicates that the fuel was not available; ― indicates that no household in the quintile used the fuel. ND
indicates that survey did not ask for information about this fuel. Modern energy includes electricity, petroleum
products and natural gas.

105
Annex B: Energy Sectors in the Economy
SITC classification revision 4; level 1: energy sector and sub‐sectors
Code Text
0 Food and live animals
1 Beverages and tobacco
2 Crude materials, inedible, except fuels
3 Mineral fuels etc
32 Coal, coke and briquettes
321 Coal, whether or not pulverized, but not agglomerated
322 Briquettes, lignite and peat
325 Coke and semi-coke (including char) of coal, of lignite or of peat, whether or not agglomerated; retort carbon
33 Petroleum and products
333 Petroleum oils and oils obtained from bituminous minerals, crude
334 Petroleum oils and oils obtained from bituminous minerals (other than crude); preparations, n.e.s., containing by weight 70% or more of petroleum oils or of oils obtained from bituminous minerals, these oils being the basic constituents of the prepar
335 Residual petroleum products, n.e.s., and related materials
34 Gas, natural and manufactured
342 Liquefied propane and butane
343 Natural gas, whether or not liquefied
344 Petroleum gases and other gaseous hydrocarbons, n.e.s.
345 Coal gas, water gas, producer gas and similar gases, other than petroleum gases and other gaseous hydrocarbons
35 Electric current
351 Electric current
4 Animal and vegetable oils and fats
5 Chemicals and related products, n.e.s.
6 Basic manufactures
7 Machinery, transport equipment
8 Miscellaneous manufactured articles
9 Goods not classified elsewhere
Source: UN 1998.

Annex C: Structure of a Social Accounting Matrix
Activities Commodities Factors
Households (HHs)
Enterprises Government (gov't)
Saving‐investment
Rest of the world (ROW)
Total
Activities
Marketed outputs
Home‐consumed output
Activity income
Commodities Intermediate inputs
Transaction costs
Private consumption
Government consumption
Investments Exports Demand
Factors Value added
Factor income from ROW
Factor income
Households
Factor income to HHs
Inter‐household transfers
Surplus to HHs
Transfers to HHs
Transfers to HHs from ROW
Household income
Enterprises
Factor income to enterprises
Transfers to enterprises
Transfers to enterprises from ROW
Expenditure income
Government
Producer taxes and subsidies; value added
Sales tax, tariffs, export taxes
Factor income to gov't, factor taxes
Transfers to gov't, direct
Surplus to gov't, direct enterprise tax
Transfers to gov't from ROW
Government income
Saving‐investment
HH savings Enterprise savings
Gov't savings
Foreign savings
Savings
Rest of the world
Imports Factor income to ROW
Surplus to ROW
Gov't transfers to ROW
Foreign exchange outflow
Total Activity Supply expenditures
Factor expenditures
Household expenditures
Enterprise expenditures
Government expenditures
Investments Foreign exchange inflow
Source: Author’s diagram based on Lofgren et al. (2002).

107
Annex D: IMF’s Classification of Government Expenditures
IMF Government Finance Statistics: Economic Classification of Expenses
2 Expense
21 Compensation of employees [GFS]
211 Wages and salaries [GFS]
212 Social contributions [GFS]
22 Use of goods and services
23 Consumption of fixed capital [GFS]
24 Interest [GFS]
241 To nonresidents
242 To residents other than general government
243 To other general government units
25 Subsidies
251 To public corporations
2511 ‐ To nonfinancial public corporations
2512 ‐ To financial public corporations
252 To private enterprises
2521 ‐ To nonfinancial private enterprises
2522 ‐ To financial private enterprises
26 Grants
261 To foreign governments
262 To international organizations
263 To other general government units
27 Social benefits [GFS]
271 Social security benefits
272 Social assistance benefits
273 Employer social benefits
28 Other expense
281 Property expense other than interest
282 Miscellaneous other expense
Source: IMF 2001.

108
References
Alaimo, Veronica and Humberto Lopez. 2008. “Oil Intensities and Oil Prices: Evidence for Latin America.”
Policy Research Working Paper 4640, World Bank, Washington, DC.
All Africa. 2004. “Kenya Power to Raise Electricity Tariff By 5pc.” September 13.
Andriamihaja, N. and G. Vecchi. 2007. “An Evaluation of the Welfare Impact of Higher Energy Prices in
Madagascar.” Africa Region Working Paper Series 106, World Bank, Washington, DC.
Angel‐Urdinola, D. and Q. Wodon. 2005. “Do Utility Subsidies Reach the Poor? Framework and Evidence
for Cape Verde.” Paper prepared for the Poverty Reduction and Economic Management
Department, Africa Region, World Bank, Washington, DC.
Bacon, Robert. 2001. “Petroleum Taxes.” Viewpoint Note 240.
http://rru.worldbank.org/Documents/PublicPolicyJournal/240Bacon‐831.pdf.
Bacon, Robert, and Masami Kojima. 2006. Coping with Higher Oil Prices. ESMAP Report 323/06.
Washington, DC: World Bank.
Bacon, Robert, Soma Bhattacharya, and Masami Kojima. 2009. The Analysis of Changing Patterns of
Household Expenditures on Petroleum Products and Energy: A Case Study of Indonesia and
Pakistan. Extractive Industries and Development Series #6. Washington, DC: World Bank.
. 2010. Expenditure of Low‐Income Households on Energy: Evidence from Africa and Asia.
Extractive Industries and Development Series # 16. Washington, DC: World Bank.
Baig, T., A. Mati, D. Coady and J. Ntamatungiro.2007. “Domestic Petroleum Product Prices and Subsidies:
Recent Developments and Reform Strategies.” Working Paper WP/07/71, International
Monetary Fund, Washington, DC.
Banerjee, Sudeshna, Quentin Wodon, Amadou Diallo, Taras Pushak, Hellal Uddin, Clarence Tsimpo, and
Vivien Foster. 2008. “Access, Affordability, and Alternatives: Modern Infrastructure in Africa.”
Background Paper 2, Africa Infrastructure Sector Diagnostic, Washington, DC: World Bank.
Besant‐Jones, John. 2006. “Reforming Power Markets in Developing Countries: What Have We
Learned?” Energy and Mining Board Discussion Paper 19, Washington, DC: World Bank.
Bienen, Henry, and Mark Gersovitz. (1986). “Consumer Subsidy Cuts, Violence, and Political Stability.”
Comparative Politics 19(1), 25‐44.
Boatman, Mette, and Vilaythong Chanthalinh. 2009. “Rapid Assessment of ‘Power to the Poor’ Pilot
Project.” Paper prepared for the World Bank.
Bourguignon, François, and F. H. G. Ferreira. 2005. “Decomposing Changes in the Distribution of
Household Incomes: Methodological Aspects.” In F. Bourguignon, F. H. G. Ferreira, and N. Lustig,
eds., The Microeconomics of Income Distribution Dynamics in East Asia and Latin America. New
York: Oxford University Press.

109
Briceño‐Garmendia, Cecilia, Karlis Smits and Vivien Foster. 2008. “Financing Public Infrastructure in Sub‐
Saharan Africa: Patterns and Emerging Issues.” Africa Infrastructure Country Diagnostic,
Background Paper 15, World Bank, Washington, DC.
Clements, Benedict, Hong‐Sang Jung and Sanjeev Gupta. 2003. “Real and Distributive Effects of
Petroleum Price Liberalization: The Case of Indonesia.” Working Paper WP/03/204, International
Monetary Fund, Washington, DC.
Coady, David and David Newhouse. 2006. “Ghana: Evaluating the Fiscal and Social Costs of Increases in
Domestic Fuel Prices”. In Aline Coudouel, Anis Dani and Stefano Paternostro, eds., Poverty and
Social Impact Analysis of Reforms. Washington, DC: World Bank.
Coady, David, Moataz El‐Said, Robert Gillingham, Kangni Kpodar, Paolo Medas and David Newhouse.
2006. “The Magnitude and Distribution of Fuel Subsidies: Evidence from Bolivia, Ghana, Jordan,
Mali, and Sri Lanka.” Working Paper WP/06/247, International Monetary Fund, Washington, DC.
Coady, David, Robert Gillingham, Rolando Ossowski, John Piotrowski, Shamsuddin Tareq, and Justin
Tyson. 2010. “Petroleum Product Subsidies: Costly, Inequitable, and Rising.” Staff Position Note,
February 25, SPN/10/05, International Monetary Fund, Washington, DC.
Commission on Growth and Development. 2008. The Growth Report. Strategies for Sustained Growth
and Inclusive Development. Washington, DC: World Bank.
Daily Nation. 2009. “State’s Big Return in Power Business.” July 27.
Ebinger, Jane. 2006. “Measuring Financial Performance in Infrastructure: An Application to Europe and
Central Asia”. Policy Research Working Paper 3992, World Bank, Washington, DC.
Ellis, J. 2010. “Untold billions: Fossil fuel Subsidies, their Impacts and the Path to Reform. The Effects of
Fossil‐Fuel Subsidy Reform: A review of modeling and empirical studies.” Global Subsidies
Initiative. www.globalsubsidies.org/files/assets/effects_ffs.pdf.
ERC (Energy Regulatory Commission). 2005. “Retail Electricity Tariffs Review Policy: 2005.”
www.erc.go.ke/retail‐tariff.pdf.
. 2008. “Approval of Schedule of Tariffs for Supply of Electricity by the Kenya Power and Lighting
Company Limited Set by the Energy Regulatory Commission under Powers Conferred Under
Section 45 of the Energy Act, 2006.” www.erc.go.ke/ctariff.pdf.
ESMAP (Energy Sector Management Assistance Program). 2003a. India: Access of the Poor to Clean Household Fuels. Report 263/03. Washington, DC: World Bank. www.esmap.org/filez/pubs/26303India.pdf.
. 2003b. Household Fuel Use and Fuel Switching in Guatemala. Technical Report. June 2003. Washington, DC: World Bank. www.esmap.org/filez/pubs/03603FueluseGuatemala.pdf.
. 2003c. Household Energy Use in Developing Countries: A Multicountry Study. Technical Report, October 2003. Washington, DC: World Bank. www.esmap.org/filez/pubs/HouseholdEnergyUseinDevelopingCountries.pdf.

110
. 2004. Energy Policies and the Mexican Economy. Technical Paper 047, January 2004. Washington, DC: World Bank.
. 2005. Household Energy Supply and Use in Yemen. Volume 1: Main Report, Volume 2, Annexes. Report 315/05. Washington, DC: World Bank. www.esmap.org/filez/pubs/31505Vol1ForWebsite.pdf.
Essama‐Nssah, B, Delfin Go, Marna Kearney, Vijdan Korman, Sherman Robinson, and Karen Thierfelder. 2007. “Economy‐wide and Distributional Impacts of an Oil Price Shock and the South African Economy.” Policy Research Working Paper 4354, World Bank, Washington, DC.
European Commission. 2003. “Inventory of public aid granted to different energy sources.” Staff
Working Paper SEC (2002) 1275, Brussels: European Commission.
European Environment Agency. 2004. “Energy subsidies in the European Union: A brief overview.”
Technical Report 1/2004, Copenhagen: European Environment Agency.
FAO (Food and Agriculture Organization). 2008. 2008 State of Food and Agriculture. Biofuels: Prospects,
Risks and Opportunities. Rome. www.fao.org/docrep/011/i0100e/i0100e00.htm.
Foster, Vivien and Cecilia Briceño‐Garmendia, ed. 2010. Africa Infrastructure: A Time for Transformation.
Washington, D.C.: World Bank. www.infrastructureafrica.org/aicd/library/doc/552/africa’s‐
infrastructure‐time‐transformation
Fritz, Verena, Kai Kaiser, and Brian Levy. 2009. Problem‐Driven Governance and Political Economy
Analysis: Good Practice Framework. Washington, DC: The World Bank.
Global Insight Analysis. 2007. “Kenyan Government Agrees to Extend Power Subsidy Deal.” December 3.
Global Partnership on Output‐Based Aid. 2005. “Supporting Infrastructure Delivery through Explicit and
Performance‐Based Subsidies.” OBA Working Paper Series #4, March, World Bank, Washington,
DC.
GSI (Global Subsidies Initiative). 2009. “Achieving the G‐20 Call to Phase Out Subsidies to Fossil Fuels”.
Policy Brief, October, International Institute for Sustainable Development, Geneva.
. 2010. “Relative subsidies to energy sources: GSI estimates.”
www.globalsubsidies.org/files/assets/relative_energy_subsidies.pdf
Goldstein, M. and A. Estache. 2009. “Subsidies.” In Stuck in the Middle: Is Fiscal Policy Failing the Middle
Class? , ed. A. Estache and D. Leipziger. Brookings Institution: Washington, DC.
Grosh, Margaret, Carlo del Nimmo, Emil Tesliuc and Azedine Ouerghi. 2008. For Protection and
Promotion. The Design and Implementation of Effective Safety Nets. Washington, DC: The World
Bank.
111
Gupta, Sanjeev, Marijn Verhoeven, Robert Gillingham, Christian Schiller, Ali Mansoor, Juan Pablo
Cordoba. 2000. Equity and Efficiency in the Reform of Price Subsidies: A Guide for Policymakers.
Washington, DC: The International Monetary Fund.
Hines, James. 1998. “Three Sides of Harberger Triangles.” Working Paper 6852, National Bureau of Economic Research. Cambridge, MA.
Iarossi, Giuseppe. 2009. An Assessment of the Investment Climate in Kenya. Washington, D.C.: World
Bank.
http://siteresources.worldbank.org/INTAFRSUMAFTPS/Resources/KENYA_ICA_2009_Book.pdf.
IEA (International Energy Agency). 1999. World Energy Outlook, Looking at Energy Subsidies: Getting the
Prices Right. Paris: International Energy Agency.
. 2008. World Energy Outlook 2008. Paris: OECD.
. 2009. World Energy Outlook 2009. Paris: OECD.
. Forthcoming. World Energy Outlook 2010. Paris: OECD.
IEA, OPEC, OECD and the World Bank. 2010. “Analysis of the Scope of Energy Subsidies and Suggestions
for the G‐20 Initiative.” Prepared for submission to the G‐20 Summit Meeting, Toronto, 26–27
June.
IHS Global Insight Daily Analysis. 2009. Government Announces Further Petroleum Product Price
Increase in Ghana. 3 November.
IIF (Institute of International Finance). 2010. “Indonesia: Fiscal Policy Shift Raises Vulnerabilities.” IIF
Research Note January 8.
Independent Evaluation Group. 2008. Climate Change and the World Bank Group. Phase 1—An
Evaluation of World Bank Win‐Win Energy Policy Reforms. Washington, DC: World Bank.
IMF (International Monetary Fund). 1995. Tax Policy Handbook. Ed. Parthasarati Shome, Chapter II. Fiscal Affairs Department Washington, DC: International Monetary Fund.
———. 2001. Government Finance Statistics Manual 2001. www.imf.org/external/pubs/ft/gfs/manual/index.htm
. 2007. “Jordan: 2006 Article IV Consultation and Fourth Post‐Program Monitoring Discussions—
Staff Report; and Public Information Notice on the Executive Board Discussion.” IMF Country
Report No. 07/128. www.imf.org/external/pubs/ft/scr/2007/cr07128.pdf.
. 2008. Food and Fuel Price Subsidies: Issues and Reform Options. A paper prepared by fiscal
affairs department. September 8. Washington, DC.
www.imf.org/external/np/pp/eng/2008/090808a.pdf

112
. 2009. “Jordan: 2009 Article IV Consultation—Staff Report; Public Information Notice on the Executive Board Discussion; and Statement by the Executive Director for Jordan.” IMF Country Report No. 09/159. www.imf.org/external/pubs/ft/scr/2009/cr09159.pdf
International Oil Daily. 2009 Ghana Refinery Gets Funding. 7 October.
Irwin, Timothy. 1997. “Price Structures, Cross‐Subsidies, and Competition in Infrastructure.” Public
Policy for the Private Sector Note 107, World Bank, Washington, DC.
Jakarta Post. 2009. “Subsidy Cut Must for Healthy Budget.” 8 December.
Jensen, J., L. Beurskens and X. van Tilburg. 2006. “Application of portfolio analysis to the Dutch
generating mix.” Report ECN‐C‐05‐100, February. Energy Research Centre of the Netherlands.
www.ecn.nl/docs/library/report/2005/c05100.pdf
Kancs, D’Artis. 2007. “Applied General Equilibrium Analysis of Renewable Energy Policies.” EERI Research Paper Series # 2, Economics and Econometrics Research Institute, Leuven.
Kannapiran, Chinna. 2002. “Macroeconomic impacts of export commodity price subsidy in Papua New Guinea”. Australian Journal of Agricultural and Resource Economics 45 (3), 437‐458.
Kojima, Masami. 2009a. “Changes in End‐User Petroleum Product Prices.” Extractive Industries for
Development Series #2, February. Washington, DC: World Bank.
. 2009b. “Government Response to Oil Price Volatility. Experience of 49 Developing Countries”
Extractive Industries for Development Series #10, July. Washington, DC: World Bank.
Kojima, Masami, and Robert Bacon. 2001. Abuses in Fuel Markets. Viewpoint 237.
http://imagebank.worldbank.org/servlet/WDSContentServer/IW3P/IB/2002/05/14/000094946_
02042504015951/Rendered/PDF/multi0page.pdf
Komives, Kristin, Vivien Foster, Jonathan Halpern, and Quentin Wodon. 2005. Water, Electricity and the
Poor. Who Benefits from Utility Subsidies? Washington, DC: The World Bank.
Komives, Kristin, Vivien Foster, Jonathan Halpern, Quentin Wodon, and Roohi Abdullah. 2007. Utility
Subsidies as Social Transfers: An Empirical Evaluation of Targeting Performance. Development
Policy Review 25 (6), 659‐679.
Komives, Kristin, Todd Johnson, Jonathen Halpern, José Luis Aburto, and John Scott. 2009. “Residential
Electricity Subsidies in Mexico. Exploring Options for Reform and Enhancing the Impact on the
Poor.” World Bank Working Paper 160, Washington, DC: The World Bank.
Koplow, Doug. 2004. “Subsidies to Energy Industries”. In Encyclopedia of Energy, Volume 5, ed. Cutler Cleveland. Amsterdam: Elsevier Inc.
. 2009. “Measuring energy subsidies using the price gap approach: what does it leave out?”
International Institute for Sustainable Development, Global Subsidies Initiative, Geneva:
www.iisd.org/pdf/2009/bali_2_copenhagen_ff_subsidies_pricegap.pdf
KPLC (Kenya Power & Lighting Company). 2009. “Annual Report & Financial Statements for the Year
Ended 30 June 2009.”

113
www.kplc.co.ke/displayPageInside.asp?level_three_title_id=35&top_level_id=4&level_two_title
_id=15.
Kpodar, Kangni. 2006. “Distributional Effects of Oil Price changes on Household Expenditures: Evidence
from Mali.” Working Paper WP/06/91, International Monetary Fund, Washington, DC.
Küster, Robert, Ingo Ellersdorfer and Ulrich Fahl. 2007. “A CGE Analysis of Energy Policies Considering Labor Market Imperfections and Technology Specifications.” Nota Di Lavoro 7.2007, The Fondazione Eni Enrico Mattei, Milan.
Lal, Sumir. 2006. “Can Good Economics Ever be Good Politics? Case Study of India’s Power Sector.”
World Bank Working Paper 83. World Bank, Washington, DC.
Larsen, Bjorn, and Anwar Shah. 1992. “World Fossil Fuel Subsidies and Global Carbon Emissions.” Policy
Research Working Papers, WPS 1002. World Bank, Washington, DC.
Ley, Eduardo and Jessica Boccardo. 2009. “The Taxation of Motor Gasoline: International Comparison.”
Preliminary version. World Bank.
LKBN Antara. “Different Data on Government Savings from Kerosene‐to‐Gas Conversion Program.” 16
December.
Lofgren, Hans, Rebecca Lee Harris and Sherman Robinson. 2002 “A Standard General Equilibrium Model in GAMS”. Microcomputers in Policy Research 5, International Food Policy Research Institute, Washington, DC.
Lovei, Laszlo, Eugene Gurenko, Michael Haney, Philip O’Keefe, and Maria Shkaratan. 2000. “Scorecard
for Subsidies: How Utility Subsidies Perform in Transition Economies.” Public Policy for the
Private Sector, Note 218, World Bank, Washington, DC.
Mackenzie, George. and Peter Stella. 1996. “Quasi‐fiscal Operations of Public Financial Institutions”.
Occasional Paper 142, International Monetary Fund, Washington, DC.
Monari, Lucio. 2002. “Power Subsidies. A Reality Check on Subsidizing Power for Irrigation in
India.”Private Sector and Infrastructure Network, Note 244, World Bank, Washington, DC.
Morgan, T. 2007. “Energy Subsidies: Their Magnitude, How they Affect Energy Investment and
Greenhouse Gas Emissions, and Prospects for Reform.” UNFCCC Secretariat: Financial and
Technical Support Programme.
http://unfccc.int/files/cooperation_and_support/financial_mechanism/application/pdf/morgan
_pdf.
Oosterhuis, F. 2001. “Energy Subsidies in the European Union.” Final Report. July. European Parliament,
Brussels.
Pallone, Shannon. 2009. “Indonesia’s Oil Crisis: How Indonesia Became a Net Oil Importer.” Journal of
International Policy Solutions, 10 (Winter), 1‐10.
114
Parry, I. and K. Small. 2005. “Does Britain or the United States Have the Right Gasoline Tax?” American
Economic Review 95 (4), 1276‐89.
Petri, Martin, Günther Taube and Aleh Tsyvinski. 2002. “Energy Sector Quasi‐Fiscal Activities in the
Countries of the Former Soviet Union.” Working Paper WP/02/60, International Monetary Fund,
Washington, DC.
Ravallion Martin ,and Michael Lokshin. 2004. “Gainers and Losers from Trade Reform in Morocco.” Policy Research Working Paper. No. 3368, World Bank, Washington, DC.
Reiche, Kilian, and Witold Teplitz. 2008. Energy Subsidies: Why, When and How? Deutsche Gesellschaft
für Technische Zusammenarbeit: Eschborn.
Saavalainen, Tapio and Joy ten Berge. 2006. “Quasi‐Fiscal Deficits and Energy Conditionality in Selected
CIS Counties”. Working Paper WP/06/43, International Monetary Fund, Washington, DC.
Sargsyan, Gevorg, Ani Balabanyan, and Denzel Hankinson. 2006. “From Crisis to Stability in the Armenian
Power Sector. Lessons Learned from Armenia’s Energy Reform Experience.” Working Paper 74,
The World Bank, Washington, DC.
Serletis, Apostolos, Govinda Timilsina and Olexandr Vasetsky. 2009. “On Interfuel Substitution: Some
International Evidence.” Policy Research Working Paper 5026, World Bank, Washington, DC.
Serven, Luis. 1990. “A RMSM‐X Model for Chile.” Policy, Research, and External Affairs, Working Papers, Macroeconomic Adjustment and Growth, WPS 508, World Bank, Washington, DC.
Spence, Michael. 2009. “Climate Change, Mitigation, and Developing Country Growth”. Commission on Growth and Development, Working Paper 64, world Bank, Washington, DC.. www.growthcommission.org/storage/cgdev/documents/gcwp064812web.pdf
UN (United Nations). 1998. International Merchandise Trade Statistics: Concepts and Definitions. United
Nations Studies in Methods. Series M. # 52. Rev. 2. Department of Economic and Social Affairs.
New York.
UNEP (United Nations Environment Programme). 2008. Reforming Energy Subsidies. Division of Technology, Industry and Economics. Paris.
. 2009. Towards Sustainable Production and Use of Resourc es: Assessing Biofuels. Paris. www.unep.fr/scp/rpanel/pdf/Assessing_Biofuels_Full_Report.pdf.
UNEP and IEA (United Nations Environment Programme and International Energy Agency). 2002. Reforming Energy Subsidies. An explanatory summary of the issues and challenges in removing or modifying subsidies on energy that undermine the pursuit of sustainable development. Paris: UNEP.
USAID (United States Agency for International Development). 2004. A Practical Guide to Energy Subsidy Reform. LAG‐I‐00‐0005‐00, Task Order 06, December 10. Washington, DC.
Vagliasindi, Maria. Forthcoming. “Phasing out energy subsidies: A decision tree and evidence from case
studies.” A background paper for the World Bank’s contribution to the “Analysis of the Scope of
Energy Subsidies and Suggestions for the Implementation of Their Phasing Out,” a joint report of
IEA, OPEC, OECD, and the World Bank for the April 23, 2010, meeting of G‐20 finance ministers.

115
van Beers, Cees, and André de Moor. 2001. Public Subsidies and Policy Failures. How Subsidies Distort
the Natural Environment, Equity and Trade, and How to Reform Them. Cheltenham, UK: Edward
Elgar.
Victor, David. 2009. Untold billions: Fossil‐Fuel subsidies, their Impacts and the Path to Reform.
International Institute for Sustainable Development, The Global Subsidies Initiative: Geneva.
http://www.globalsubsidies.org/en/research/political‐economy
Widjaja, Muliali. 2009. “An Economic and Social Review on Indonesian Direct Cash Transfer Program to
Poor Families Year 2005.” Paper presented at Association for Public Policy Analysis and
Management International Conference, “Asian Social Protection in Comparative Perspective.”
Singapore, January 79, 2009.
WMRC Daily Analysis. 2004. “Lights Go Out in Kenya’s Government Offices over Unpaid Electricity Bills.”
May 6.
Wodon, Quentin, ed. 2008. “Electricity Tariffs and the Poor: Case Studies from sub‐Saharan Africa.”
Working Paper 12, Africa Infrastructure Country Diagnostic, Washington, DC: World Bank.
World Bank. 2003. Iran: Medium Term Framework for Transition. Converting Oil Wealth to Development. Report 25848‐IRN. Washington, DC. http://go.worldbank.org/A8LQ9H2ZB0.
. 2005. Angola: Assessing the Impacts of Phasing out Fuel and Utility Price subsidies, Volume 1:
Policy Briefing. Poverty and Social Impact Analysis. December 2005. Washington, DC.
http://siteresources.worldbank.org/INTPSIA/Resources/490023‐
1120841262639/Angola_PSIA_vol1_English.pdf.
. 2006. Indonesia: Making the New Indonesia Work for the Poor. Report 37349‐ID. Washington, DC: The World Bank.
. 2008a. Designing Sustainable Off‐Grid Rural Electrification Projects: Principles and Practices. The Energy and Mining Sector Board, November. Washington, DC: The World Bank
. 2008b. Reforming Energy Prices Subsidies and Reinforcing Social Protection. Some Design Issues.
Report 43173‐MNA. Washington, DC: The World Bank.
. 2009a. World Development Indicators 2009. Washington, DC.
. 2009b. Energy Strategy Approach Paper.
http://siteresources.worldbank.org/EXTESC/Resources/Approach‐paper.pdf
WTO (World Trade Organisation). 1994 ."Final Act Embodying the Results of the Uruguay Round of
Multilateral Trade Negotiations. Summary of Agreements". Legal texts spelling out results of
GATT negotiations and Ministerial Decisions and Declarations.
http://www.wto.org/english/docs_e/legal_e/ursum_e.htm#kAgreement. 1994.
Yusuf, Arief, and Budy Resosudarmo. 2008. “Mitigating Distributional Impact of Fuel Pricing Reform. The
Indonesian Experience.” ASEAN Economic Bulletin, 25 (1), 32‐47.