Subregional Report on Animal Genetic Resources: Southeast Asia · Contents Introduction 5 Part 1...
36
Subregional Report on Animal Genetic Resources: Southeast Asia
Transcript of Subregional Report on Animal Genetic Resources: Southeast Asia · Contents Introduction 5 Part 1...
Subregional Report on Animal Genetic Resources:
Southeast Asia
AcknowledgementsThe Subregional Factsheet was prepared by Marieke Reuver.
Citation: FAO. 2007. Subregional report on animal genetic resources: Southeast Asia. Annex to The State of the World’s Animal Genetic Resources for Food and Agriculture. Rome.
The designations employed and the presentation of material in this informationproduct do not imply the expression of any opinion whatsoever on the partof the Food and Agriculture Organization of the United Nations concerning thelegal or development status of any country, territory, city or area or of its authorities,or concerning the delimitation of its frontiers or boundaries. The mention of specificcompanies or products of manufacturers, whether or not these have been patented, doesnot imply that these have been endorsed or recommended by the Food and AgricultureOrganization of the United Nations in preference to others of a similar nature that arenot mentioned.The views expressed in this publication are those of the author(s) and do not necessarilyreflect the views of the Food and Agriculture Organization of the United Nations.
All rights reserved. Reproduction and dissemination of material in this informationproduct for educational or other non-commercial purposes are authorized withoutany prior written permission from the copyright holders provided the source is fullyacknowledged. Reproduction of material in this information product for resale or othercommercial purposes is prohibited without written permission of the copyright holders.Applications for such permission should be addressed to:ChiefElectronic Publishing Policy and Support BranchCommunication DivisionFAOViale delle Terme di Caracalla, 00153 Rome, Italyor by e-mail to:[email protected]© FAO 2007
Contents
�
Introduction 5
Part 1 Subregional factsheet: Southeast Asia 7
1 Importance of livestock to subregion’s economy and food security 71.1 Production and consumption 91.2 Imports and exports 101.3 Projected demand for livestock products 121.4 Poverty 14
2 Livestock production systems 142.1 Overview 142.2 Roles and functions of livestock in Southeast Asia 172.3 Projected changes in production systems 18
3 Animal genetic resources 203.1 Status 203.2 Threats to animal genetic resources in Southeast Asia 273.3 Unique resources highlighted 28
References 29
Annex 1: Import and export figures for the subregion 31Annex 2: Classification of livestock production systems 32
Part 2 Exploration of needs, objectives, activities and organization of an Asian Regional Focal Point or Asian Network for Animal Genetic Resources 33
�
TABLES
1. Land area and population 7 2. GDP and the economic contribution of agriculture 8 3. Land use 8 4. Growth rates for livestock numbers and production 13 5. Poverty rates by country 14 6. Resource base, production and productivity figures of the different production
systems found in Southeast Asia 16 7. Roles and functions of livestock in mixed crop-livestock systems 18 8. Total population size and number of breeds of the major livestock species in
the Southeast Asian subregion and their share of the world total 20 9. Transboundary mammalian breeds in Southeast Asia 2110. Transboundary avian breeds in Southeast Asia 22A1. Export of livestock and livestock products in Southeast Asia 31A2. Import of livestock and livestock products in Southeast Asia 31
FIGURES
1. Total meat, milk and egg production (in million kg) in Southeast Asia: 1994–2004 102. Imports of live animals and animal products in Southeast Asia 113. Export of live animals and animal products in Southeast Asia 124. Total meat, milk and egg production Southeast Asia - past and projected 135. Risk status of mammalian breeds recorded in Southeast Asia up to December 2005:
absolute (table) and percentage (chart) figures 236. Risk status of avian breeds recorded in Southeast Asia up to December 2005:
absolute (table) and percentage (chart) figures 247. Population data status and index for mammalian breeds recorded by the countries
of the Southeast Asia subregion up to December 2005 258. Population data status and index for avian breeds recorded by the countries of
the Southeast Asia subregion up to December 2005 26
�
This document is one of a set of subregional and regional reports prepared as part of the Annex to The State of the World’s Animal Genetic Resources for Food and Agriculture. It consists of a compilation of background material on the significance of livestock to the subregion’s economy
and food security; the characteristics, distribution, and relative significance of the various livestock production systems; and the characteristics of animal genetic resources.
During the final quarter of 2005 a series of subregional consultations were held to review a draft report on strategic priorities for action, which had been prepared by FAO as a global-level synthesis of priorities identified in the Country Reports submitted as part of State of the World process. The consultations took the form of e-mail conferences and/or physical meetings, and provided an opportunity for country representatives, from both technical and policy backgrounds, to identify priorities and to further strategies for cooperation. No such consultation took place in the Southeast Asia subregion. However, participants from several Southeast Asian countries attended a meeting held in December 2004 in Bangkok, which explored needs, objectives, activities and organisation of an Asian regional focal point or Asian network for animal genetic resources. The outcomes of this meeting are presented in Part 2 of this subregional report.
Introduction

PART 1
�
1 Importance of livestock to subregion’s economy and food security
The countries of the Southeast Asia subregion, as defined for the purposes of this report, include Brunei Darussalam, Cambodia, Indonesia, the Lao People’s Democratic Republic, Malaysia, Myanmar, Papua New Guinea, the Philippines, Singapore, Thailand, Timor-Leste and Viet Nam. The countries of the subregion are diverse in terms of their population, land mass, GDP per capita, government systems and religion. The subregion is home to more than 500 million people, which is about 9 percent of the world’s total human population. It contains about 10 percent of the world’s agricultural population and about 4 percent of the world’s total land area. Timor-Leste is the smallest country, covering 15 000 square kilometres and Indonesia is the largest with 1.9 million square kilometres, which is almost half of the total land area of the subregion. Timor-Leste has a population of 800 000 people, while there are more than 217 million Indonesians. The Philippines is the most densely populated country, closely followed by Viet Nam. Papua New Guinea is the least densely populated country with only 13 persons per square kilometres. In 2003, the total human population of the Southeast Asia subregion was estimated to be 542 million, an increase of more than 76 million people (16 percent) since 1993. Timor-Leste is expected to have a population growth rate of almost 5 percent per annum up to 2015, which is one of the highest in the world. A summary of general information for this subregion is shown in Tables 1, 2 and 3.
TABLE 1Land area and population
Land area(× 1 000 km²)
Population2003 (million)
Population density (km-2)
Population growth rate (% per annum)
1975–2003 2003–2015
Cambodia 177 13.5 76 2.3 1.9
Indonesia 1,812 217.4 120 1.7 1.1
Lao People’s Democratic Republic
231 5.7 25 2.2 2.1
Malaysia 329 24.4 74 2.5 1.6
Myanmar 658 49.5 75 1.8 0.9
Papua New Guinea 453 5.7 13 2.4 1.8
Philippines 298 80.2 269 2.3 1.6
Thailand 511 63.1 124 1.5 0.7
Timor-Leste 15 0.8 54 0.7 4.9
Viet Nam 325 82.0 252 1.9 1.2
Data from UN and FAO statistics.
Subregional factsheet:Southeast Asia

THE STATE OF THE WORLD'S ANIMAL GENETIC RESOURCES FOR FOOD AND AGRICULTURE
�
souTheAsT AsiA
TABLE 2GDP and the economic contribution of agriculture
GDP¹2003 (US$ billions)
Value added in agriculture²2003 (% of GDP)
Agricultural population12000 (%)
Cambodia 4.2 34.5 68
Indonesia 208.3 16.6 43
Lao People’s Democratic Republic
2.1 48.6 71
Malaysia 103.7 9.7 17
Myanmar n.a. n.a. 67
Papua New Guinea 3.2 25.7 72
Philippines 80.6 14.5 37
Thailand 143.0 9.8 47
Timor-Leste 0.3 n.a. 72
Viet Nam 39.2 21.8 64
¹ Data from UN and FAO statistics.
² Data from World Bank statistics.
TABLE 3Land use
Arable (%) Permanent pasture (%) Forest/woodland (%)
1992 2002 1992 2002 1992 2002
Cambodia 21 21 8 8 69 n.a.
Indonesia 10 11 7 6 61 n.a.
Lao People’s Democratic Republic
3 4 3 4 55 n.a.
Malaysia 6 5 1 1 68 n.a.
Myanmar 14 15 1 0 49 n.a.
Papua New Guinea 0 0 0 0 93 n.a.
Philippines 18 19 4 5 46 n.a.
Thailand 34 31 2 2 29 n.a.
Timor-Leste 5 5 10 10 74 n.a.
Viet Nam 17 21 1 2 30 n.a.
Data from UN and FAO statistics.
Most of Southeast Asia, with the exception of the northwestern part of the subregion, which is generally humid subtropical, has a tropical climate. Monsoons influence the climate, which is characterized by uniform hot temperatures, high humidity and rainfall in all months.
Southeast Asia experienced rapid economic growth in the 1980s and early 1990s. ASEAN economies, particularly Indonesia, Malaysia, the Philippines, and Thailand adopted an export-oriented and foreign direct investment-led approach to economic development, coupled with a commitment to open up their markets. This approach integrated the region with the world economy. Living standards and economies in the subregion grew until financial crisis struck in mid-1997 (FPA, 2003).
Agriculture has traditionally been the dominant sector in the economy of Southeast Asia, and paddy rice production has long dominated the subregion’s agriculture (Van der Eng, 2004). However, by 2003 agriculture’s share in gross domestic product its share had fallen to 15 percent in the Philippines, 17 percent in Indonesia, and even less in Malaysia and Thailand (World Bank data). On average, 56 percent of the economically active population of the subregion pursue agricultural activities. In Malaysia the figure is only 17 percent, but in the Lao People’s Democratic Republic, Papua New Guinea and Timor-Leste it is more than 70 percent. On average, 23 percent of the land area of Southeast Asia is used
�
PART 1
SUBREGIONAL REPORT ON ANIMAL GENETIC RESOURCES– souTheAsT AsiA
for agriculture, but this varies from 2 percent for Papua New Guinea to 41 percent for the Philippines (FAOSTAT, 2002 data).
The value of livestock production amounted to only 15 percent of total agricultural output in Southeast Asia in the late 1970s and 1980s. Growth in livestock output began outpacing crops in 1990 driven largely by a rapid increase urban demand, achieving an overall 20 percent share by 1995 (USDA, 1997). Livestock production has rapidly become industrialized in Asia, based on the use of large amounts of imported cereals and soybeans (FAO, 1999a). The contribution of the livestock sector to the economy differs significantly between the countries of the subregion, and the contribution of livestock to agricultural GDP varies from around 11 percent in Indonesia to almost 40 percent in Cambodia (CR Cambodia, 2003). Livestock are a strategic part of the small-farm economy in the subregion.
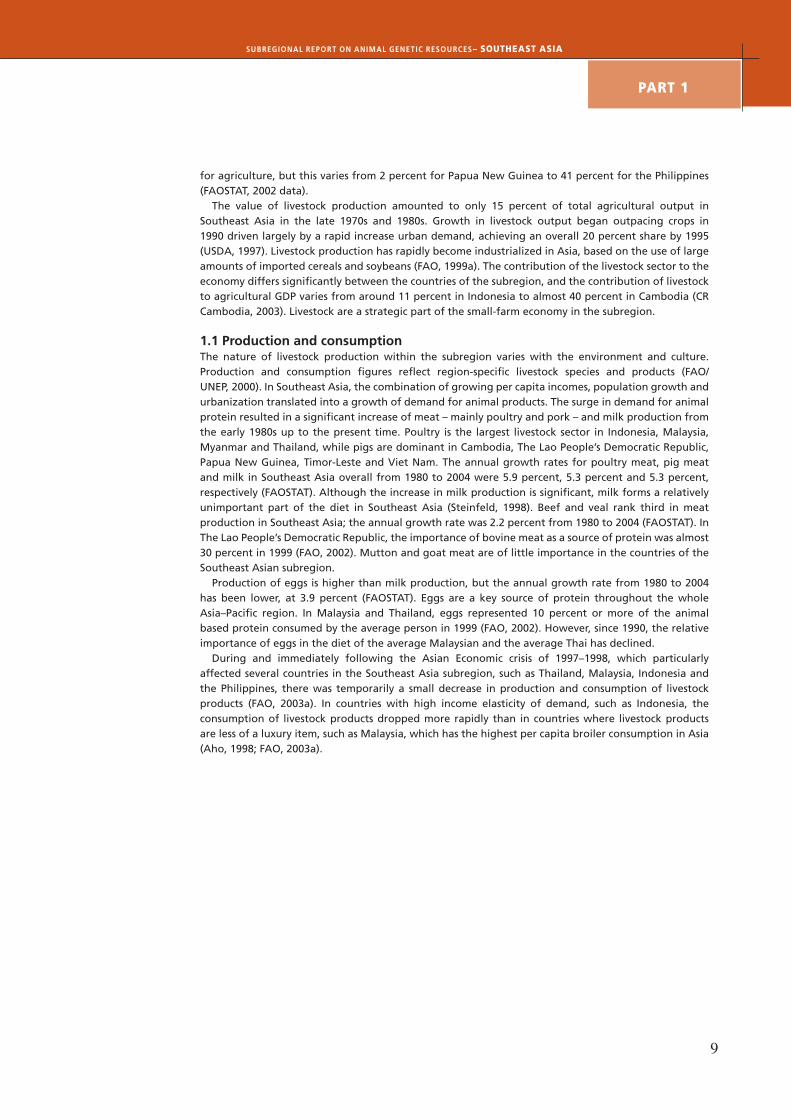
1.1 Production and consumptionThe nature of livestock production within the subregion varies with the environment and culture. Production and consumption figures reflect region-specific livestock species and products (FAO/UNEP, 2000). In Southeast Asia, the combination of growing per capita incomes, population growth and urbanization translated into a growth of demand for animal products. The surge in demand for animal protein resulted in a significant increase of meat – mainly poultry and pork – and milk production from the early 1980s up to the present time. Poultry is the largest livestock sector in Indonesia, Malaysia, Myanmar and Thailand, while pigs are dominant in Cambodia, The Lao People’s Democratic Republic, Papua New Guinea, Timor-Leste and Viet Nam. The annual growth rates for poultry meat, pig meat and milk in Southeast Asia overall from 1980 to 2004 were 5.9 percent, 5.3 percent and 5.3 percent, respectively (FAOSTAT). Although the increase in milk production is significant, milk forms a relatively unimportant part of the diet in Southeast Asia (Steinfeld, 1998). Beef and veal rank third in meat production in Southeast Asia; the annual growth rate was 2.2 percent from 1980 to 2004 (FAOSTAT). In The Lao People’s Democratic Republic, the importance of bovine meat as a source of protein was almost 30 percent in 1999 (FAO, 2002). Mutton and goat meat are of little importance in the countries of the Southeast Asian subregion.
Production of eggs is higher than milk production, but the annual growth rate from 1980 to 2004 has been lower, at 3.9 percent (FAOSTAT). Eggs are a key source of protein throughout the whole Asia–Pacific region. In Malaysia and Thailand, eggs represented 10 percent or more of the animal based protein consumed by the average person in 1999 (FAO, 2002). However, since 1990, the relative importance of eggs in the diet of the average Malaysian and the average Thai has declined.
During and immediately following the Asian Economic crisis of 1997–1998, which particularly affected several countries in the Southeast Asia subregion, such as Thailand, Malaysia, Indonesia and the Philippines, there was temporarily a small decrease in production and consumption of livestock products (FAO, 2003a). In countries with high income elasticity of demand, such as Indonesia, the consumption of livestock products dropped more rapidly than in countries where livestock products are less of a luxury item, such as Malaysia, which has the highest per capita broiler consumption in Asia (Aho, 1998; FAO, 2003a).
THE STATE OF THE WORLD'S ANIMAL GENETIC RESOURCES FOR FOOD AND AGRICULTURE
10
souTheAsT AsiA
FIGURE 1Total meat, milk and egg production in Southeast Asia: 1994–2004
Source: FAOSTAT.
1.2 Imports and exportsDriven by strong demand for beef on the one hand, and faced with limited production capacity (land in particular) on the other, Southeast Asian countries began augmenting domestic supply with imports in the early nineties. What was particular to this subregion was the growing share of the meat equivalent of its live cattle imports relative to beef imports. This has been most evident in Indonesia, where live cattle imports increased by more than 5 000 percent from 1990 to 1997, but also in the Philippines, and Malaysia, where live cattle imports increased by almost 900 percent and more than 400 percent respectively (FAOSTAT). Indonesia, the Philippines, and Malaysia have tariff structure escalation which favours the import of live cattle. The imported cattle are primarily feeder animals rather than slaughter-ready cattle. To discourage imports of slaughter-ready cattle, Indonesia requires a 70-day feeding period within the country before imported cattle can be slaughtered. In the Philippines, a 30 percent tariff is imposed on slaughter-ready cattle (FAPRI, 1998). The reason for this is that many countries in the region are developing their feedlot sector to better utilize available agricultural by-products and underemployed labour, and to disperse the economic benefits of development. Importing live cattle rather than beef also offers more control over food safety. In addition, in Indonesia and Malaysia, the strong influence of Islam favours live cattle to beef because Muslims are required to consume only “halal” certified foods. There are strict restrictions on the selection of animals and the slaughter process for “halal” certification of meats. This strongly favours domestic slaughter (ibid.). Australia dominates this live cattle market (FAPRI, 2005).
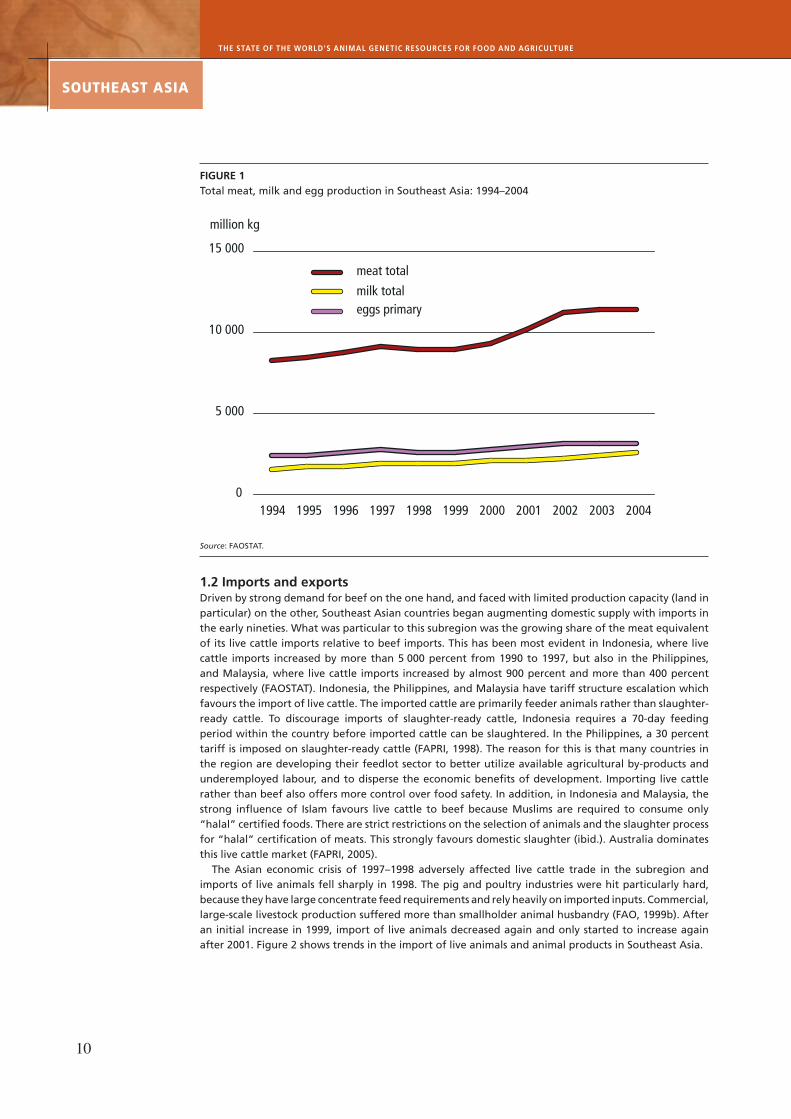
The Asian economic crisis of 1997–1998 adversely affected live cattle trade in the subregion and imports of live animals fell sharply in 1998. The pig and poultry industries were hit particularly hard, because they have large concentrate feed requirements and rely heavily on imported inputs. Commercial, large-scale livestock production suffered more than smallholder animal husbandry (FAO, 1999b). After an initial increase in 1999, import of live animals decreased again and only started to increase again after 2001. Figure 2 shows trends in the import of live animals and animal products in Southeast Asia.
meat total
milk totaleggs primary
million kg
1994 1995 1996 1997 1998 1999 2000 2001 2002 2003 2004
15 000
10 000
5 000
0
11
PART 1
SUBREGIONAL REPORT ON ANIMAL GENETIC RESOURCES– souTheAsT AsiA
FIGURE 2Imports of live animals and animal products in Southeast Asia
Source: FAOSTAT.
The import of meat has increased more slowly, but has grown steadily since the early nineties, with just a minor decrease in 1998. Up to 1998, mutton and goat meat was the most important category of meat import. After 1998 imports of poultry meat increased significantly, while at the same time imports of mutton and goat meat decreased. Economic and population growth spurred imports of poultry meat especially in Indonesia and Philippines (FAPRI, 2002). Imports of beef and buffalo meat also increased steadily and reached about the same level as poultry meat imports in 2003. Indonesia and Philippines in particular are net importers of beef and veal. The Philippines is among the top six beef importing countries in the world. The Philippines is also a net importer of pork (ibid.). Indonesia, Malaysia and the Philippines are net importers of dairy products such as butter, cheese, non-fat dried milk and whole milk powder. Cheese imports in these countries are increasing at a rate of 4.9 percent annually (FAPRI, 2005).
In the decade to 1995, imports of cattle hides increased sharply, especially in Thailand and Indonesia. As high wages in East Asia reduced the competitiveness of the local clothing and leather goods industries, these labour-intensive manufacturing operations shifted to lower wage Southeast Asia (among other locations). Domestic supplies of cattle hides in Southeast Asia were generally of low quality, coming from old draft animals whose hides had been damaged over a long life or as a result of inappropriate slaughtering practices. Hides were therefore imported, especially from the United States of America (USDA, 1997). After 1996, the import of fibres, hides and skins decreased significantly.
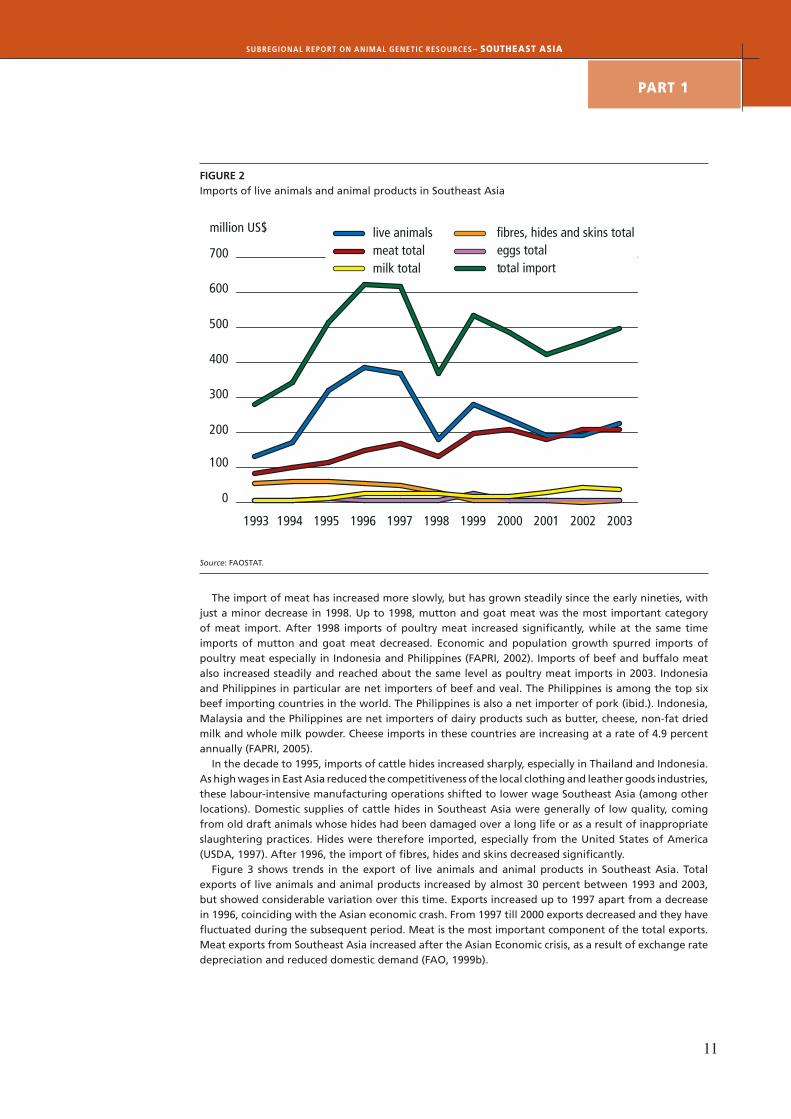
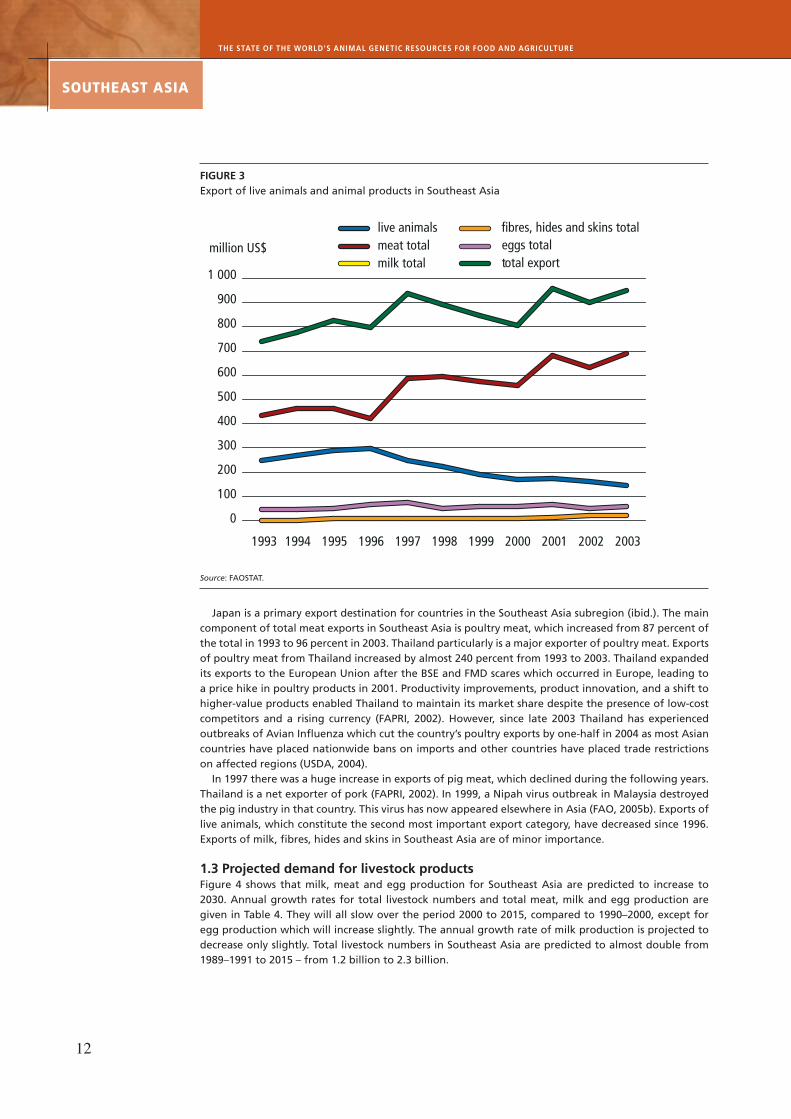
Figure 3 shows trends in the export of live animals and animal products in Southeast Asia. Total exports of live animals and animal products increased by almost 30 percent between 1993 and 2003, but showed considerable variation over this time. Exports increased up to 1997 apart from a decrease in 1996, coinciding with the Asian economic crash. From 1997 till 2000 exports decreased and they have fluctuated during the subsequent period. Meat is the most important component of the total exports. Meat exports from Southeast Asia increased after the Asian Economic crisis, as a result of exchange rate depreciation and reduced domestic demand (FAO, 1999b).
million US$ live animalsmeat totalmilk total
eggs totaltotal import
fibres, hides and skins total
1994 1995 1996 1997 1998 1999 2000 2001 2002 20031993
0
100
200
300
400
500
600
700
THE STATE OF THE WORLD'S ANIMAL GENETIC RESOURCES FOR FOOD AND AGRICULTURE
12
souTheAsT AsiA
FIGURE 3Export of live animals and animal products in Southeast Asia
Source: FAOSTAT.
Japan is a primary export destination for countries in the Southeast Asia subregion (ibid.). The main component of total meat exports in Southeast Asia is poultry meat, which increased from 87 percent of the total in 1993 to 96 percent in 2003. Thailand particularly is a major exporter of poultry meat. Exports of poultry meat from Thailand increased by almost 240 percent from 1993 to 2003. Thailand expanded its exports to the European Union after the BSE and FMD scares which occurred in Europe, leading to a price hike in poultry products in 2001. Productivity improvements, product innovation, and a shift to higher-value products enabled Thailand to maintain its market share despite the presence of low-cost competitors and a rising currency (FAPRI, 2002). However, since late 2003 Thailand has experienced outbreaks of Avian Influenza which cut the country’s poultry exports by one-half in 2004 as most Asian countries have placed nationwide bans on imports and other countries have placed trade restrictions on affected regions (USDA, 2004).
In 1997 there was a huge increase in exports of pig meat, which declined during the following years. Thailand is a net exporter of pork (FAPRI, 2002). In 1999, a Nipah virus outbreak in Malaysia destroyed the pig industry in that country. This virus has now appeared elsewhere in Asia (FAO, 2005b). Exports of live animals, which constitute the second most important export category, have decreased since 1996. Exports of milk, fibres, hides and skins in Southeast Asia are of minor importance.
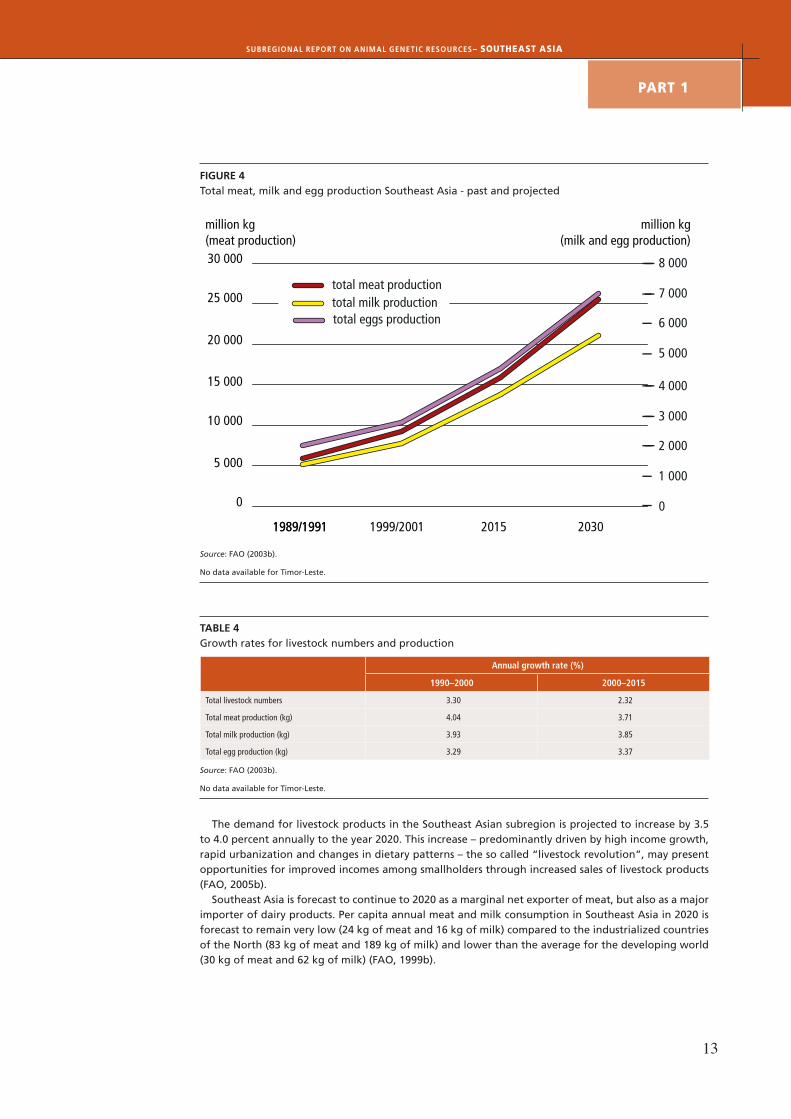
1.3 Projected demand for livestock productsFigure 4 shows that milk, meat and egg production for Southeast Asia are predicted to increase to 2030. Annual growth rates for total livestock numbers and total meat, milk and egg production are given in Table 4. They will all slow over the period 2000 to 2015, compared to 1990–2000, except for egg production which will increase slightly. The annual growth rate of milk production is projected to decrease only slightly. Total livestock numbers in Southeast Asia are predicted to almost double from 1989–1991 to 2015 – from 1.2 billion to 2.3 billion.
million US$
live animalsmeat totalmilk total
eggs totaltotal export
fibres, hides and skins total
1994 1995 1996 1997 1998 1999 2000 2001 2002 20031993
0
100
200
300
400
500
600
700
800
900
1 000
1�
PART 1
SUBREGIONAL REPORT ON ANIMAL GENETIC RESOURCES– souTheAsT AsiA
FIGURE 4Total meat, milk and egg production Southeast Asia - past and projected
Source: FAO (2003b).
No data available for Timor-Leste.
TABLE 4Growth rates for livestock numbers and production
Annual growth rate (%)
1990–2000 2000–2015
Total livestock numbers 3.30 2.32
Total meat production (kg) 4.04 3.71
Total milk production (kg) 3.93 3.85
Total egg production (kg) 3.29 3.37
Source: FAO (2003b).
No data available for Timor-Leste.
The demand for livestock products in the Southeast Asian subregion is projected to increase by 3.5 to 4.0 percent annually to the year 2020. This increase – predominantly driven by high income growth, rapid urbanization and changes in dietary patterns – the so called “livestock revolution”, may present opportunities for improved incomes among smallholders through increased sales of livestock products (FAO, 2005b).
Southeast Asia is forecast to continue to 2020 as a marginal net exporter of meat, but also as a major importer of dairy products. Per capita annual meat and milk consumption in Southeast Asia in 2020 is forecast to remain very low (24 kg of meat and 16 kg of milk) compared to the industrialized countries of the North (83 kg of meat and 189 kg of milk) and lower than the average for the developing world (30 kg of meat and 62 kg of milk) (FAO, 1999b).
1989/19911989/1991 1999/2001 2015 2030
0
5 000
10 000
15 000
20 000
25 000
30 000
0
1 000
2 000
3 000
4 000
5 000
6 000
7 000
8 000
million kg(meat production)
million kg(milk and egg production)
total meat productiontotal milk productiontotal eggs production
THE STATE OF THE WORLD'S ANIMAL GENETIC RESOURCES FOR FOOD AND AGRICULTURE
1�
souTheAsT AsiA
1.4 PovertyPoverty rates can be quantified on the basis of a poverty line, which provides a threshold in income or consumption below which a household can be classified as poor. Some poverty lines aim to be internationally comparable and, thus, are useful for producing continental and global totals. Widely cited examples are US$1 day-1 and US$2 day-1 lines published by the World Bank. Data based on an international poverty line show the number of people who cannot purchase a roughly similar basket of commodities (World Bank, 2001). National poverty lines reflect intercountry differences in economic and social status and are used to assess progress on a national scale. The figures presented in Table 5, utilize three different poverty lines: US$1 day-1, and US$2 day-1 and national poverty lines based on Technical Advisory Committee (TAC) of the Consultative Group on International Agricultural Research (CGIAR) data. The impact of the Asian Economic crisis on poverty incidence in the countries of Southeast Asia has been severe. Estimates for Indonesia, for example, indicate an increase of about 10 percent in the incidence of poverty (FAO, 1999b).
TABLE 5Poverty rates by country
Country TAC Less than US$ 1 Less than US$ 2
Cambodia * * *
Indonesia 25.0 15.2 66.1
Lao People’s Democratic Republic * * *
Malaysia 16.0 * *
Myanmar 35.0 * *
Papua New Guinea 73.0 * *
Philippines * * *
Thailand 30.0 2.0 28.2
Viet Nam 54.0 * *
Sources: FAO (1997) and World Bank (2001) as presented by Thornton et al. (2002).
*Data unavailable.
2 Livestock production systems
2.1 OverviewIn this report, the different livestock systems will be described according to the classification developed by Seré and Steinfeld (FAO, 1996) but based on updated data from 2004. A description of the production system classification can be found in the annex to this factsheet. Two major production systems are found in Southeast Asia, namely the mixed irrigated and mixed rainfed systems in the humid and subhumid tropics and subtropics. In Thailand there is also some mixed irrigated farming in arid/semi-arid zones. Forty percent of the land area in Southeast Asia is allocated to mixed farming systems (Thornton et al., 2002), of which 60 percent is rainfed and 40 percent is irrigated (FAO, 2004a). Table 6 gives general data, production of main products and productivity of the different systems occurring in Southeast Asia.
Mixed rainfed farming systems are often located in regions with especially difficult climatic conditions for livestock because of high temperatures and high humidity. Adaptation of high-output temperate breeds to these challenges has been notably poor, and, particularly in Asian smallholder systems, local breeds are still widely used (FAO, 1996). In this system, livestock often has multiple functions, with animals being used particularly for traction and manure. Animal traction is also the main contribution of animals in the mixed irrigated farming systems. In many Asian countries, small-scale mechanization is replacing animal power (ibid.). Pigs and poultry (particularly ducks and geese) in these systems play an important role in utilizing feed resources that would otherwise be lost. They provide meat for both
1�
PART 1
SUBREGIONAL REPORT ON ANIMAL GENETIC RESOURCES– souTheAsT AsiA
home consumption and for the growing urban markets. Manure is used on the fields (ibid.).In Southeast Asia mixed crop-livestock systems are particularly important in the Philippines, Thailand
and Viet Nam (Thornton et al., 2002). Examples of integrated crop/animal systems in Southeast Asia include rice/goats/ducks/fish in Indonesia; rice/buffalo/pigs/chickens/ducks/fish in the Philippines; rice/vegetables/pigs/ducks/fish in Thailand; and vegetables/goats/pigs/ducks/fish in Viet Nam (Devendra et al., 2005). In Indonesia, the three-strata forage system, which is a people-centred smallholder system which aims to enhance year-round feeding and increase productivity in integrated systems involving food cropping and ruminants, has been institutionalized and officially promoted. It is an example of how integrating crops with animals provides many benefits such as increased forage production, higher stocking rates and total annual weight gains, less soil erosion and more farm income (ibid.). Non-ruminants in crop/animal-systems mainly scavenge in villages on crop by-products and kitchen waste. In many parts of Southeast Asia (e.g. Indonesia) these village systems evolve into more intensive production systems depending on the availability of feeds, markets, and the development of cooperative movements (ibid.).
Although in the whole of Asia, production systems based on grass are the most important in terms of proportion of total land area, grassland-based systems in Southeast Asia are of minor importance. In Asia as a whole, 48 percent of the total land area is allocated to grassland-based systems (FAO, 2004a), but in Southeast Asia only 4.5 percent of the land area is allocated to grassland-based systems (Thornton et al., 2002).
The drive in Southeast Asia to satisfy the increasing demand for animal protein has resulted in many changes to agricultural practices (FAO, 1999c). Landless systems are growing, and in some countries in Southeast Asia landless production systems with monogastrics are the dominant forms of livestock production (Taneja and Birthal, 2005; Thornton et al., 2002). This system plays an important role in providing livestock products to meet the increased demand generated by higher human population density and income (FAO, 2004a). In Southeast Asia, landless systems produce almost 60 percent of the poultry meat, almost 25 percent of the pig meat, and almost 60 percent of the eggs (ibid.).
These changes are accompanied by a trend toward monogastrics, with a strong expansion of poultry meat production throughout the region (FAO, 1999b). Monogastrics are short-cycle species which offer better conversion of feed concentrates than do ruminants. With monogastrics, animal product supply can expand more flexibly and respond to growing demand. Because they thrive on feed concentrates, they require limited space. Hence, they lend themselves to industrial forms of production.
The structure of the livestock sector is also changing in terms of farm size. Small and medium-scale farms have declined in terms of their numbers and their share of total farms. In Thailand for example, during the last 10 years there has been a reduction of more than four percent per annum in the number of animals on small and medium sized farms. At the same time, while the number of large-scale pig farms has declined, the number of pigs produced per farm has increased. The same applies to the poultry sector; there are at least a dozen poultry farms in Thailand with more than one million birds per farm (FAO, 2004a). In the Philippines, small-scale egg producers have virtually disappeared (ibid.).
For Asia as a whole, the expansion of poultry and pork production is occurring within a framework of large-scale commercial farms and intensive livestock operations. Contracting between producers and private industry, particularly feed companies, is now an extremely important element of the broiler and the swine industries. Thailand and Malaysia are leaders in this area, and trends indicate increased interest in contracting in Cambodia and Indonesia (ibid.). Local feed resources can no longer sustain the increased demand and imported feeds are utilized (FAO, 1999b). Specialization has become the key to these changes. In the case of Thailand, broiler and layer farms have differentiated into breeding farms, hatcheries, broiler operations, and egg producing farms, all with specific methods of input and output management.

THE STATE OF THE WORLD'S ANIMAL GENETIC RESOURCES FOR FOOD AND AGRICULTURE
16
souTheAsT AsiA
TABLE 6Resource base, production and productivity figures of the different production systems found in Southeast Asia
Grassland-based Mixed rainfed Mixed irrigated Landless
TOTAL
Temperate/Highlands
Humid/Sub-
humid
Arid /Semi-arid
Temperate/Highlands
Humid/Sub-
humid
Arid/Semi-arid
Temperate/Highlands
Humid/Sub
humid
Arid/Semi-arid
Parameters:
Human population (millions) 315.5 213.0 4.9 533.4
a) Resource base
a1. Permanent pasture (1 million ha) 14.5 2.9 0.044 17.4
a2. Arable land (1 million ha) 37.1 27.2 0.873 65.2
a3. Irrigated land (1 million ha) 7.6 9.0 0.522 17.1
a4. Livestock numbers (million head)
cattle 27.9 11.2 0.266 39.4
dairy cows 1.9 0.284 0.013 2.2
buffalo 6.9 7.5 0.091 14.5
sheep and goats 23.1 7.1 0.012 30.3
b) Major outputs (1 million kg)
beef and veal meat 517 414 9 940
buffalo meat 101 211 2 314
sheep and goat meat 104 40 0.1 144
pig meat 736 2 800 37 1 000 4 600
poultry meat 1 100 783 22 2 600 4 500
eggs 839 517 13 1 700 3 100
dairy milk 1 100 675 33 1 800
other milk 428 31 459
milk production total 1 500 706 33 2 300
c) Productivity and density indicators
beef and buffalo meat kg/head 2 3 2 2
sheep and goat meat kg/head 0.3 0.2 0.01 0.3
rum meat kg/inhabitant 2 3 2 3
milk yield kg/cow 572 2,377 2,538 814
monogastric meat kg/inhabitant 6 17 12 17
eggs kg/inhabitant 2.7 2.4 2.6 5.8
agricultural land ha/inhabitant 0.2 0.1 0.2 0.2
Sources: FAO (1996); FAO (2004a).
1�
PART 1
SUBREGIONAL REPORT ON ANIMAL GENETIC RESOURCES– souTheAsT AsiA
Human population densities are high (Table 6). On average there are 0.2 ha of permanent pasture and arable land per inhabitant, both for the mixed rainfed and mixed irrigated systems. Mixed farming (rainfed and irrigated together) provides all milk, all ruminant meat, 60 percent of pork and poultry meat and 44 percent of the eggs in Southeast Asia (FAO, 2004a). Cattle numbers are concentrated in the mixed rainfed production system, which supports 71 percent of the total cattle in Southeast Asia. The total dairy herd is low compared to cattle numbers, less than 10 percent of all cattle are dairy cows, and they are mainly found in the mixed rainfed system. Although the dairy herd is lower in the mixed irrigated system compared to the mixed rainfed, the milk yield in terms of kg per cow is much higher, at 2 400 kg per year compared to less than 600 kg per cow in the rainfed system. Dairy development programmes have been going on in the irrigated areas of Southeast Asia for the last three decades (Groenewold, personal communication).
Buffalo meat production in terms of total output per head is about twice as high in the mixed irrigated system as in the other systems. Sheep and goat numbers are more than three times higher in the mixed rainfed system as compared to the other systems. Ruminant meat availability averages 3 kg per person per year, with the main contribution coming from large ruminant meat. The availability of pig and poultry meat is much higher, at 17 kg per person per year. Pig meat production is slightly higher than poultry meat production, especially for the countries dominated by the mixed irrigated production systems. In the case of poultry meat, the degree of intensification is higher. About 60 percent is produced in landless systems, compared to about 20 percent for the pig sector. Eggs are available on average at 6 kg per person per year, and more than half of the production derives from intensive landless operations.
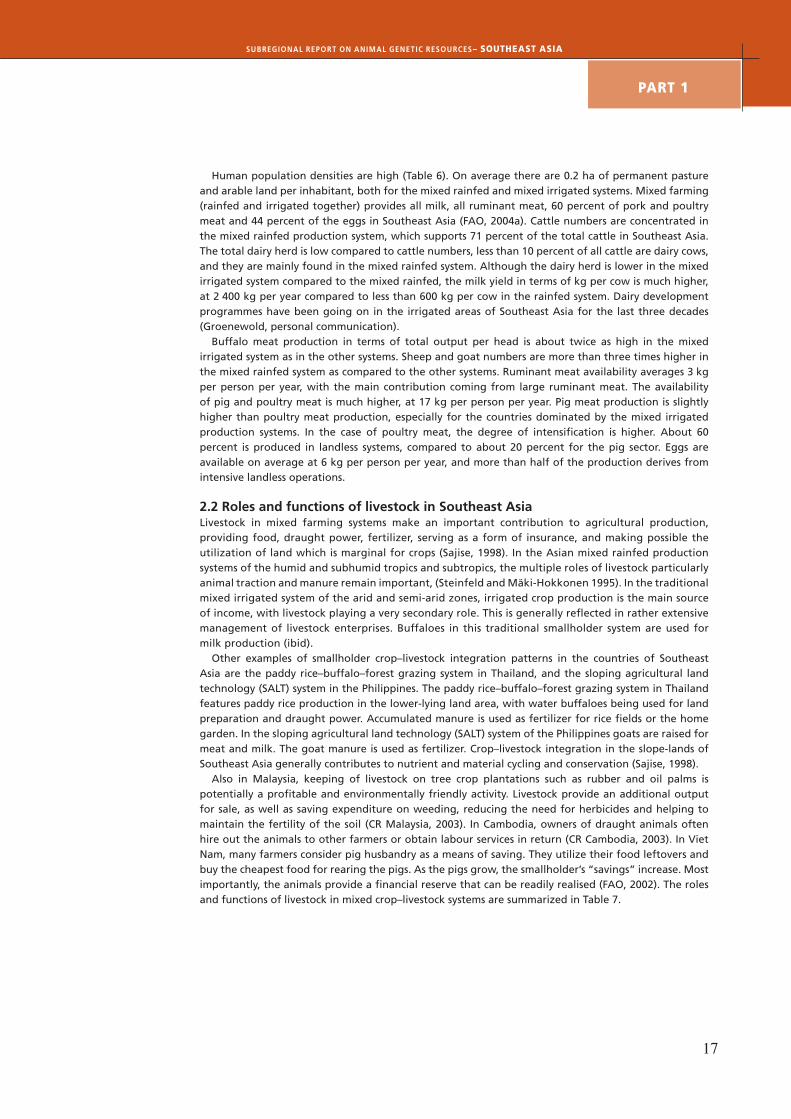
2.2 Roles and functions of livestock in Southeast AsiaLivestock in mixed farming systems make an important contribution to agricultural production, providing food, draught power, fertilizer, serving as a form of insurance, and making possible the utilization of land which is marginal for crops (Sajise, 1998). In the Asian mixed rainfed production systems of the humid and subhumid tropics and subtropics, the multiple roles of livestock particularly animal traction and manure remain important, (Steinfeld and Mäki-Hokkonen 1995). In the traditional mixed irrigated system of the arid and semi-arid zones, irrigated crop production is the main source of income, with livestock playing a very secondary role. This is generally reflected in rather extensive management of livestock enterprises. Buffaloes in this traditional smallholder system are used for milk production (ibid).
Other examples of smallholder crop–livestock integration patterns in the countries of Southeast Asia are the paddy rice–buffalo–forest grazing system in Thailand, and the sloping agricultural land technology (SALT) system in the Philippines. The paddy rice–buffalo–forest grazing system in Thailand features paddy rice production in the lower-lying land area, with water buffaloes being used for land preparation and draught power. Accumulated manure is used as fertilizer for rice fields or the home garden. In the sloping agricultural land technology (SALT) system of the Philippines goats are raised for meat and milk. The goat manure is used as fertilizer. Crop–livestock integration in the slope-lands of Southeast Asia generally contributes to nutrient and material cycling and conservation (Sajise, 1998).
Also in Malaysia, keeping of livestock on tree crop plantations such as rubber and oil palms is potentially a profitable and environmentally friendly activity. Livestock provide an additional output for sale, as well as saving expenditure on weeding, reducing the need for herbicides and helping to maintain the fertility of the soil (CR Malaysia, 2003). In Cambodia, owners of draught animals often hire out the animals to other farmers or obtain labour services in return (CR Cambodia, 2003). In Viet Nam, many farmers consider pig husbandry as a means of saving. They utilize their food leftovers and buy the cheapest food for rearing the pigs. As the pigs grow, the smallholder’s “savings” increase. Most importantly, the animals provide a financial reserve that can be readily realised (FAO, 2002). The roles and functions of livestock in mixed crop–livestock systems are summarized in Table 7.
THE STATE OF THE WORLD'S ANIMAL GENETIC RESOURCES FOR FOOD AND AGRICULTURE
1�
souTheAsT AsiA
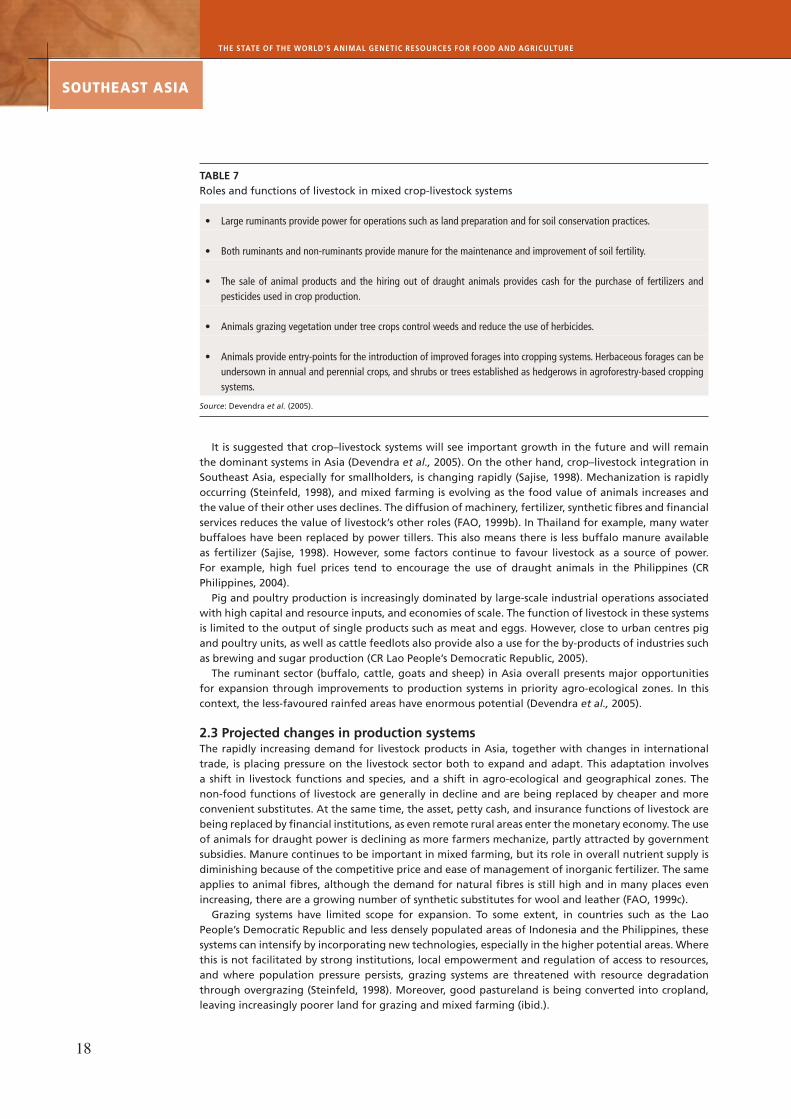
TABLE 7Roles and functions of livestock in mixed crop-livestock systems
• Large ruminants provide power for operations such as land preparation and for soil conservation practices.
• Both ruminants and non-ruminants provide manure for the maintenance and improvement of soil fertility.
• The sale of animal products and the hiring out of draught animals provides cash for the purchase of fertilizers and pesticides used in crop production.
• Animals grazing vegetation under tree crops control weeds and reduce the use of herbicides.
• Animals provide entry-points for the introduction of improved forages into cropping systems. Herbaceous forages can be undersown in annual and perennial crops, and shrubs or trees established as hedgerows in agroforestry-based cropping systems.
Source: Devendra et al. (2005).
It is suggested that crop–livestock systems will see important growth in the future and will remain the dominant systems in Asia (Devendra et al., 2005). On the other hand, crop–livestock integration in Southeast Asia, especially for smallholders, is changing rapidly (Sajise, 1998). Mechanization is rapidly occurring (Steinfeld, 1998), and mixed farming is evolving as the food value of animals increases and the value of their other uses declines. The diffusion of machinery, fertilizer, synthetic fibres and financial services reduces the value of livestock’s other roles (FAO, 1999b). In Thailand for example, many water buffaloes have been replaced by power tillers. This also means there is less buffalo manure available as fertilizer (Sajise, 1998). However, some factors continue to favour livestock as a source of power. For example, high fuel prices tend to encourage the use of draught animals in the Philippines (CR Philippines, 2004).
Pig and poultry production is increasingly dominated by large-scale industrial operations associated with high capital and resource inputs, and economies of scale. The function of livestock in these systems is limited to the output of single products such as meat and eggs. However, close to urban centres pig and poultry units, as well as cattle feedlots also provide also a use for the by-products of industries such as brewing and sugar production (CR Lao People’s Democratic Republic, 2005).
The ruminant sector (buffalo, cattle, goats and sheep) in Asia overall presents major opportunities for expansion through improvements to production systems in priority agro-ecological zones. In this context, the less-favoured rainfed areas have enormous potential (Devendra et al., 2005).
2.3 Projected changes in production systemsThe rapidly increasing demand for livestock products in Asia, together with changes in international trade, is placing pressure on the livestock sector both to expand and adapt. This adaptation involves a shift in livestock functions and species, and a shift in agro-ecological and geographical zones. The non-food functions of livestock are generally in decline and are being replaced by cheaper and more convenient substitutes. At the same time, the asset, petty cash, and insurance functions of livestock are being replaced by financial institutions, as even remote rural areas enter the monetary economy. The use of animals for draught power is declining as more farmers mechanize, partly attracted by government subsidies. Manure continues to be important in mixed farming, but its role in overall nutrient supply is diminishing because of the competitive price and ease of management of inorganic fertilizer. The same applies to animal fibres, although the demand for natural fibres is still high and in many places even increasing, there are a growing number of synthetic substitutes for wool and leather (FAO, 1999c).
Grazing systems have limited scope for expansion. To some extent, in countries such as the Lao People’s Democratic Republic and less densely populated areas of Indonesia and the Philippines, these systems can intensify by incorporating new technologies, especially in the higher potential areas. Where this is not facilitated by strong institutions, local empowerment and regulation of access to resources, and where population pressure persists, grazing systems are threatened with resource degradation through overgrazing (Steinfeld, 1998). Moreover, good pastureland is being converted into cropland, leaving increasingly poorer land for grazing and mixed farming (ibid.).
1�
PART 1
SUBREGIONAL REPORT ON ANIMAL GENETIC RESOURCES– souTheAsT AsiA
Mixed farming systems will see continued intensification and growth, with livestock production based on crop by-products and surplus. Some productivity gains can be achieved by further enhancing nutrient and energy flows between the crop and livestock component. However, involution of the system – where the stability and sometimes very existence of mixed farming is threatened by population pressure, fragmentation of arable land, poverty and lack of market access – is a threat in some locations (ibid.).
Landless systems in Asia are mainly established in the vicinity of large and medium-size cities and in the coastal developed areas, which results in excessive animal densities, nutrient surpluses and other environmental and human health problems. These systems are profitable in the short term, but their sustainability is doubtful. A potential way forward is to allow specialized commercial production to operate in an “area-wide” integration with crop production, where nutrient balances are maintained and the land’s capacity to absorb animal waste is respected (ibid.).
Two important structural changes apply across production systems – a general growth in scale and a trend towards vertical integration. Levels of livestock production and processing are increasing in response to technological development and market requirements. However, next to this modern, demand-driven and capital-intensive sector, producing poultry meat, eggs, pork and milk, the traditional, resource-driven and labour-intensive sector will continue to provide a multitude of services to subsistence-oriented farms (FAO, 1999c).
The consensus is that the rapid industrialization of livestock production in Asia overall is going to continue. In most Asian countries, under present policies, the share of production by smallholders will decrease. In the long term, production of pigs, poultry and milk is likely to be fully industrialized, while ruminant meat production will continue to be predominantly extensive (FAO, 1999b).
Thus, in Asia the major trend is from multipurpose to single-purpose animals, with the production of animal protein being the overriding objective. This is also reflected in the choice and manipulation of genotypes to favour specialization over product diversity. Another trend is the growing importance of monogastrics as economic converters of concentrate feed (FAO, 1999c).
• Grazing systems disappear because of land degradation and conversion into cropland. Breeds sustained in these systems will be threatened. However, in some areas extensive herding seems to be the only practical way of earning a living from the land.
• Mixed systems will see continued intensification and growth. As these systems adopt new technologies which allow for the intensification of production, existing genotypes are replaced with what are perceived to be improved varieties (Blackburn et al., 1998). More emphasis will be placed on monogastrics. Native breeds sustained in mixed farming systems will be threatened.
• Landless systems in Southeast Asia will further increase in importance. Large-scale and vertically integrated intensive industrial poultry and pig production systems have grown significantly in recent years and continue to do so. The introduction of high-yielding breeds and specialized modes of production in these systems will lead to losses in genetic diversity.

THE STATE OF THE WORLD'S ANIMAL GENETIC RESOURCES FOR FOOD AND AGRICULTURE
20
souTheAsT AsiA
3 Animal genetic resources
3.1 StatusTable 8 illustrates the number of animals of each major livestock species in the Southeast Asia subregion and also gives an estimate of the number of breeds. Nine percent of the world’s buffaloes are found in Southeast Asia, which is less than in East Asia, but Southeast Asia has almost a quarter of the breed populations in the world, compared to 16 percent found in East Asia. Fifteen percent of the ducks in the world are found in Southeast Asia. Table 9 and 10 show the transboundary mammalian and avian breeds found in Southeast Asia.
TABLE 8Total population size and number of breeds of the major livestock species in the Southeast Asian subregion and their share of the world total
Population size (1 000) Number of national breed populations
Share of world total
Population (%) Number of breed populations (%)
Buffalo 14 945 39 9 23
Cattle 41 193 138 1 5
Yak n/a 0 n/a 0
Goat 22 574 53 3 5
Sheep 8 797 33 1 2
Pig 65 268 84 7 7
Ass 0.028 0 0 0
Horse 977 36 2 3
Camel1 n/a 0 n/a 0
Chicken 1 991 155 126 12 5
Duck2 150 947 58 15 14
Turkey 573 5 0 3
Goose (domestic) 1 400 12 0 5
Source for population figures: FAOSTAT estimates of 2004 live animal populations.
1 Dromedary and Bactrian camel.
2 Domestic duck and Muscovy duck.

21
PART 1
SUBREGIONAL REPORT ON ANIMAL GENETIC RESOURCES– souTheAsT AsiA
TABLE 9Transboundary mammalian breeds in Southeast Asia
Buffalo Cattle (1) Cattle (2) Deer Goat
Borneo Buffalo Aberdeen-Angus Hissar Axis deer Alpine
Murrah Australian Friesian Sahiwal Holstein (black and white) Hog Deer Anglo-Nubian
Nili-Ravi Australian Milking Zebu Holstein (red and white) Muntjac deer Angora
Philippine Carabao Bali Jersey Rusa deer Australian feral
Banteng Kouprey Sambar deer Barbari
Beefalo Limousin Sika deer Beetal
Beefmaster Nelore Bengal
Belmont Red Norwegian Red Boer
Braford Ongole Cashmere
Brahman Red Brangus German Improved Fawn
Brangus Red Poll Indo-Chinese
Burmese Gaur Red Sindhi Jamnapari
Charbray Sahiwal Katjang
Charolais Santa Gertrudis La Mancha
Chianina Shorthorn Saanen
Droughtmaster Simmental Toggenburg
Galloway Thari
Gir Tsine
Guernsey Indo-Brasilian
Hariana Simbrah
Hereford Taurindicus
Horse Pig Rabbit Sheep
Arab Berkshire California Awassi
Quarter Horse Dalland New Zealand White Barbados Black Belly
Thoroughbred Duroc Rex Blackhead Persian
Dutch Landrace Border Leicester
German Landrace Corriedale
Hampshire Dorper
Iban Katahdin
Landrace Merino
Large White Morada Nova
Pietrain Poll Dorset
Poland China Priangan
Saddleback Rambouillet
Seghers Romney
Tamworth Santa Ines
St. Croix
Suffolk
Sussex
THE STATE OF THE WORLD'S ANIMAL GENETIC RESOURCES FOR FOOD AND AGRICULTURE
22
souTheAsT AsiA
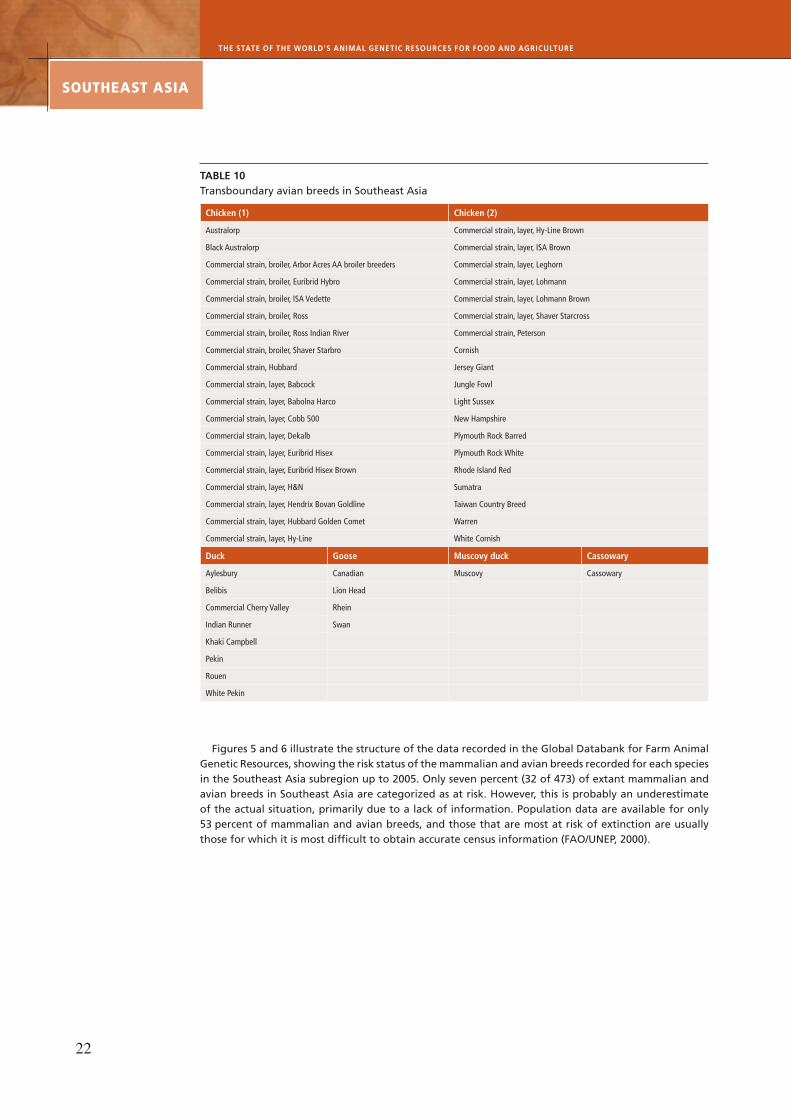
TABLE 10Transboundary avian breeds in Southeast Asia
Chicken (1) Chicken (2)
Australorp Commercial strain, layer, Hy-Line Brown
Black Australorp Commercial strain, layer, ISA Brown
Commercial strain, broiler, Arbor Acres AA broiler breeders Commercial strain, layer, Leghorn
Commercial strain, broiler, Euribrid Hybro Commercial strain, layer, Lohmann
Commercial strain, broiler, ISA Vedette Commercial strain, layer, Lohmann Brown
Commercial strain, broiler, Ross Commercial strain, layer, Shaver Starcross
Commercial strain, broiler, Ross Indian River Commercial strain, Peterson
Commercial strain, broiler, Shaver Starbro Cornish
Commercial strain, Hubbard Jersey Giant
Commercial strain, layer, Babcock Jungle Fowl
Commercial strain, layer, Babolna Harco Light Sussex
Commercial strain, layer, Cobb 500 New Hampshire
Commercial strain, layer, Dekalb Plymouth Rock Barred
Commercial strain, layer, Euribrid Hisex Plymouth Rock White
Commercial strain, layer, Euribrid Hisex Brown Rhode Island Red
Commercial strain, layer, H&N Sumatra
Commercial strain, layer, Hendrix Bovan Goldline Taiwan Country Breed
Commercial strain, layer, Hubbard Golden Comet Warren
Commercial strain, layer, Hy-Line White Cornish
Duck Goose Muscovy duck Cassowary
Aylesbury Canadian Muscovy Cassowary
Belibis Lion Head
Commercial Cherry Valley Rhein
Indian Runner Swan
Khaki Campbell
Pekin
Rouen
White Pekin
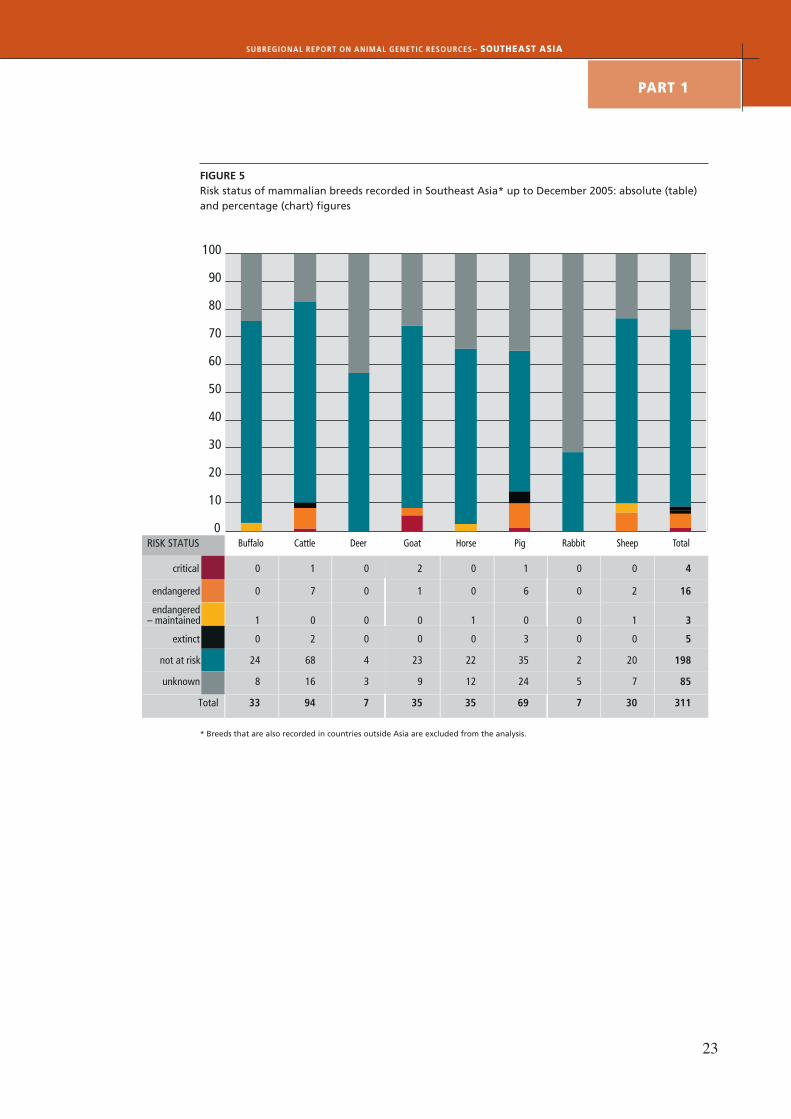
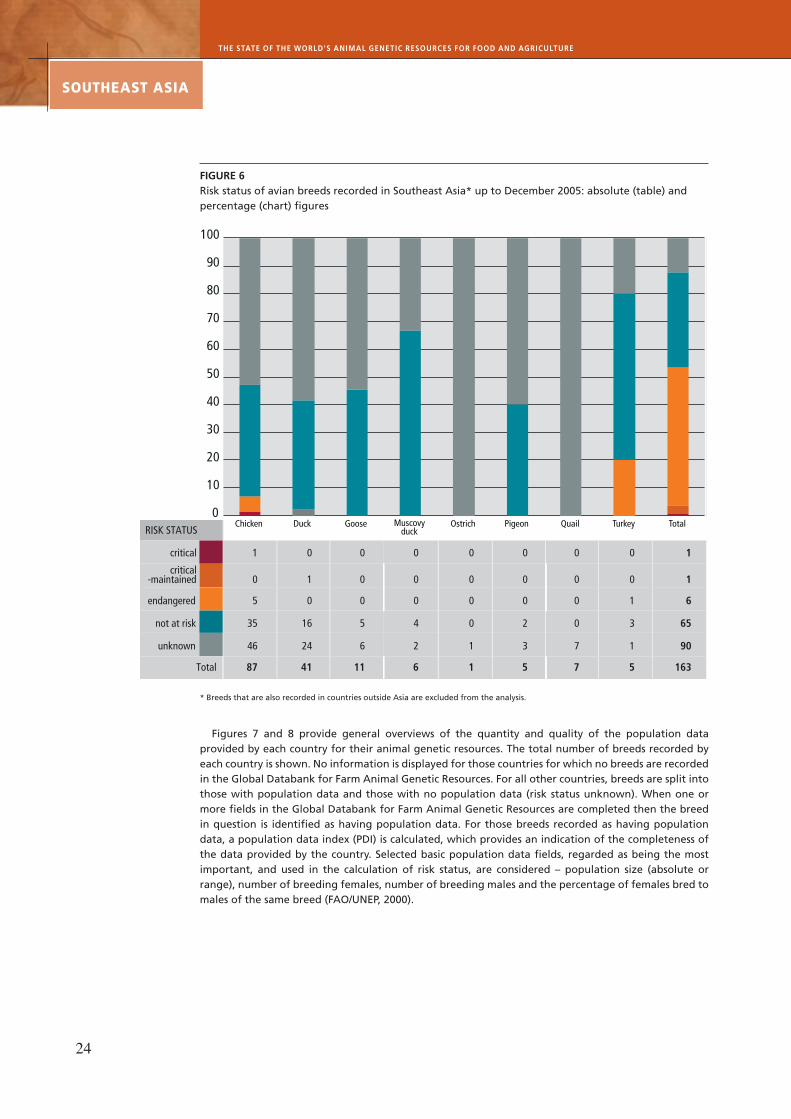
Figures 5 and 6 illustrate the structure of the data recorded in the Global Databank for Farm Animal Genetic Resources, showing the risk status of the mammalian and avian breeds recorded for each species in the Southeast Asia subregion up to 2005. Only seven percent (32 of 473) of extant mammalian and avian breeds in Southeast Asia are categorized as at risk. However, this is probably an underestimate of the actual situation, primarily due to a lack of information. Population data are available for only 53 percent of mammalian and avian breeds, and those that are most at risk of extinction are usually those for which it is most difficult to obtain accurate census information (FAO/UNEP, 2000).
2�
PART 1
SUBREGIONAL REPORT ON ANIMAL GENETIC RESOURCES– souTheAsT AsiA
FIGURE 5Risk status of mammalian breeds recorded in Southeast Asia* up to December 2005: absolute (table) and percentage (chart) figures
* Breeds that are also recorded in countries outside Asia are excluded from the analysis.
0
10
20
30
40
50
60
70
80
90
100
RISK STATUS
critical 0 1 0 2 0 1 0 0 4
endangered 0 7 0 1 0 6 0 2 16
endangered – maintained 1 0 0 0 1 0 0 1 3
extinct 0 2 0 0 0 3 0 0 5
not at risk 24 68 4 23 22 35 2 20 198
unknown 8 16 3 9 12 24 5 7 85
Total 33 94 7 35 35 69 7 30 311
Buffalo Cattle Deer Goat Horse Pig Rabbit Sheep Total
THE STATE OF THE WORLD'S ANIMAL GENETIC RESOURCES FOR FOOD AND AGRICULTURE
2�
souTheAsT AsiA
FIGURE 6Risk status of avian breeds recorded in Southeast Asia* up to December 2005: absolute (table) and percentage (chart) figures
* Breeds that are also recorded in countries outside Asia are excluded from the analysis.
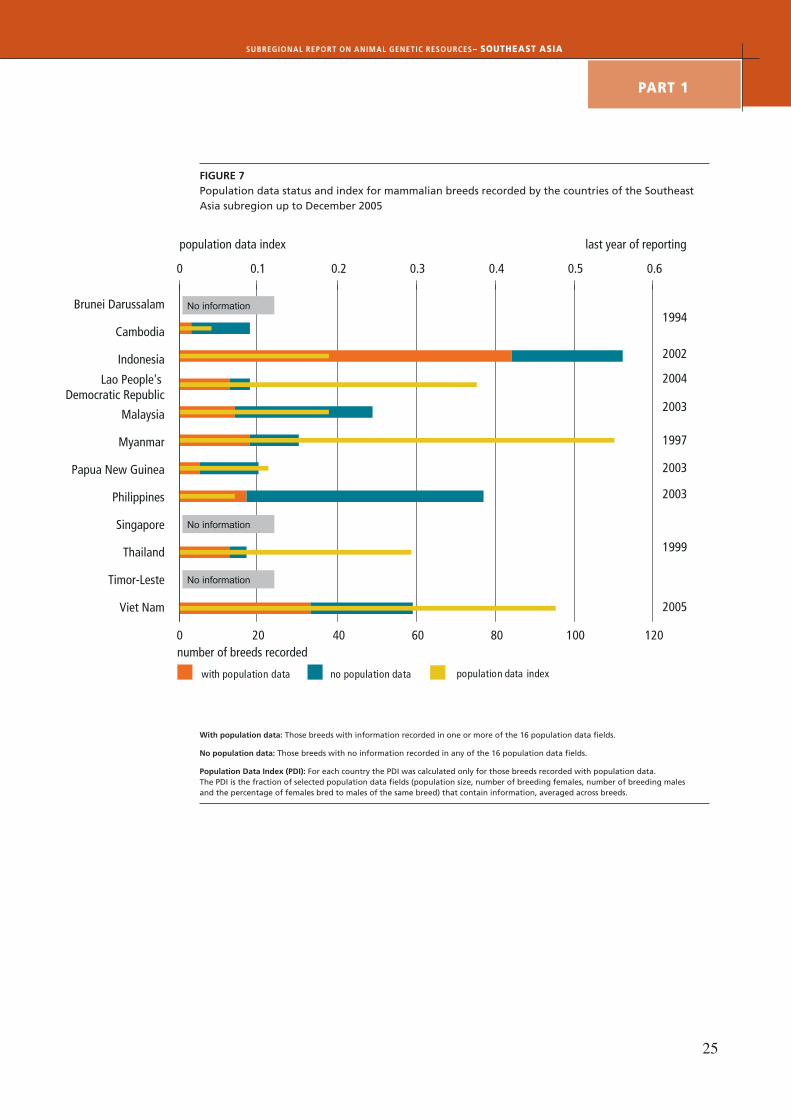
Figures 7 and 8 provide general overviews of the quantity and quality of the population data provided by each country for their animal genetic resources. The total number of breeds recorded by each country is shown. No information is displayed for those countries for which no breeds are recorded in the Global Databank for Farm Animal Genetic Resources. For all other countries, breeds are split into those with population data and those with no population data (risk status unknown). When one or more fields in the Global Databank for Farm Animal Genetic Resources are completed then the breed in question is identified as having population data. For those breeds recorded as having population data, a population data index (PDI) is calculated, which provides an indication of the completeness of the data provided by the country. Selected basic population data fields, regarded as being the most important, and used in the calculation of risk status, are considered – population size (absolute or range), number of breeding females, number of breeding males and the percentage of females bred to males of the same breed (FAO/UNEP, 2000).
0
10
20
30
40
50
60
70
80
90
100
RISK STATUS
critical 1 0 0 0 0 0 0 0 1
critical -maintained 0 1 0 0 0 0 0 0 1
endangered 5 0 0 0 0 0 0 1 6
not at risk 35 16 5 4 0 2 0 3 65
unknown 46 24 6 2 1 3 7 1 90
Total 87 41 11 6 1 5 7 5 163
Chicken Duck Goose Muscovyduck
Ostrich Pigeon Quail Turkey Total
2�
PART 1
SUBREGIONAL REPORT ON ANIMAL GENETIC RESOURCES– souTheAsT AsiA
FIGURE 7Population data status and index for mammalian breeds recorded by the countries of the Southeast Asia subregion up to December 2005
With population data: Those breeds with information recorded in one or more of the 16 population data fields.
No population data: Those breeds with no information recorded in any of the 16 population data fields.
Population Data Index (PDI): For each country the PDI was calculated only for those breeds recorded with population data. The PDI is the fraction of selected population data fields (population size, number of breeding females, number of breeding males and the percentage of females bred to males of the same breed) that contain information, averaged across breeds.
number of breeds recorded
population data index last year of reporting
with population data no population d ata population data index
0 20 40 60 80 100 120
0 0.1 0.2 0.3 0.4 0.5 0.6
Brunei Darussalam
Cambodia
Indonesia
Lao People's Democratic Republic
Malaysia
Myanmar
Papua New Guinea
Philippines
Singapore
Thailand
Timor-Leste
Viet Nam
No information
No information
No information
1994
2002
2004
2003
1997
2003
2003
1999
2005

THE STATE OF THE WORLD'S ANIMAL GENETIC RESOURCES FOR FOOD AND AGRICULTURE
26
souTheAsT AsiA
FIGURE 8Population data status and index for avian breeds recorded by the countries of the Southeast Asia subregion up to December 205
With population data: Those breeds with information recorded in one or more of the 16 population data fields.
No population data: Those breeds with no information recorded in any of the 16 population data fields.
Population Data Index (PDI): For each country the PDI was calculated only for those breeds recorded with population data. The PDI is the fraction of selected population data fields (population size, number of breeding females, number of breeding males and the percentage of females bred to males of the same breed) that contain information, averaged across breeds.
number of breeds recorded
population data index last year of reporting
with population data no population d ata population data index
0 10 20 30 40 50 60 70
Cambodia
Indonesia
Lao People'sDemocratic Republic
Malaysia
Myanmar
Papua New Guinea
Philippines
Singapore
Thailand
Timor-Leste
Viet Nam
10 0.2 0.4 0.6 0.8 1.2
1994
2002
1994
1998
1997
2000
2003
1994
2005
No information
No information
2�
PART 1
SUBREGIONAL REPORT ON ANIMAL GENETIC RESOURCES– souTheAsT AsiA
3.2 Threats to animal genetic resources in Southeast AsiaIn Southeast Asian production systems there is a need to improve the overall efficiency of resource use, to improve breeding systems and local breeds, to provide adequate feed for these breeds and to tackle the various endemic diseases that have a debilitating effect on animals. The future needs of the subregion will probably only be met by intensification, and this could result in a considerable reduction of genetic diversity. Worldwide, the greatest threat to diversity is the highly specialized nature of industrial livestock production. Economic support is often inadequate to implement active conservation programmes. Moreover, current development pressures often fail to consider efficiency in the context of available resources and tend to be guided by developed country definitions and views (ibid).
The most important threats to animal genetic resources in Southeast Asia are rapid economic change, changes in consumer demands, intensification of production systems, endemic and epidemic diseases and their control measures, a lack of appropriate livestock policies and a general undervaluing of local breeds.
Most of Southeast Asia has enjoyed rapid economic growth and development in recent years, which has led to a rise in consumer demand for animal products. In order to meet this demand animal production systems intensified and exotic, high-output breeds were introduced. The livestock industries of Southeast Asia, in particular Indonesia, the Philippines and Thailand, have become increasingly dependent upon imported breeds, often developed in countries such as the United States of America, Australia or New Zealand, or in the European Union. Their use has been associated with a displacement of native animals which are often better suited to the local environment. Indiscriminate cross-breeding can be a problem. For example the purity of the genepool of Bali Banteng cattle has been threatened by cross-breeding throughout Southeast Asia (FAO, 2006).
Other changes to animal production systems also pose a threat. In the Lao People’s Democratic Republic, for example, the irrigated rice area is expanding and more and more farmers turn to the use of hand tractors to prepare the land for cultivation. The number of buffaloes, particularly males, has therefore substantially decreased (CR Lao People’s Democratic Republic, 2005).
The Asian Economic crisis has caused some countries in Southeast Asia to reconsider the use of their traditional breeds – if not instead of, at least in conjunction with, exotic breeds (FAO/UNEP, 2000). Currency depreciations in Indonesia, the Philippines and Thailand increased the cost of rearing animals and also the purchase cost of imported animals. However, it also provided an incentive for farmers to slaughter native animals, further reducing the population of these animals (FAO, 1999c).
Threats to animal genetic resources due to endemic and epidemic diseases and their control measures are widespread. Severe animal diseases, including haemorrhagic septicaemia, foot-and-mouth disease, classical swine fever, Newcastle disease and others have caused tremendous losses in The Lao People’s Democratic Republic (CR Lao People’s Democratic Republic, 2005). In Myanmar, the most damaging disease in chickens is Newcastle Disease (CR Myanmar, 2004). Recently, avian influenza outbreaks have occurred in Cambodia, Indonesia, The Lao People’s Democratic Republic, Malaysia, Myanmar, Thailand, and Viet Nam. Besides deaths due to the disease itself, massive numbers of birds are culled in an attempt to eradicate the disease.
The undervaluing of local breeds has also been a threat to animal genetic resources in some countries in Southeast Asia. Poor appreciation of the importance of genetic resources in the Philippines, both by the government and the public, is mainly caused by a lack of appreciation and awareness of their potential economic and ecological functions (CR Philippines, 2004). Even if certain institutions are interested, resources and financial support for conservation and research are limited. In most programmes, the continuity of financial support is a major problem especially when there is a change in local or national administration (ibid.). Also in Viet Nam, many indigenous breeds are decreasing rapidly in number because their performance, food conversion efficiency or lean meat percentage are much lower than those of imported breeds (CR Viet Nam, 2003).
However, in some countries appreciation of local genetic resources has increased. In Indonesia for example, awareness of animal genetic resources is shown in the articles of the Law on Animal Husbandry and Veterinary Act No. 6/1967, which sets out guidelines for the management of the livestock breeding (CR Indonesia, 2003). Bali cattle in Bali for example are still pure-bred because of an Indonesian government regulation which states that Bali Island is only for Bali cattle. The same is true of the Madura cattle of Madura Island.
In many countries, lack of appropriate livestock policies is a threat to animal genetic resources. Conservation is, in general, weakly developed and animal genetic resources are utilized according existing demand. Policies related to conservation are in place in a number of countries, including
THE STATE OF THE WORLD'S ANIMAL GENETIC RESOURCES FOR FOOD AND AGRICULTURE
2�
souTheAsT AsiA
Myanmar, where policies focus on the conservation of native breeds of draught cattle, mythun and indigenous chickens (CR Myanmar, 2004). For other species of livestock and poultry, increased production is the priority, and upgrading with exotic breeds is allowed (ibid.). However, a lack of qualified scientists, technology, finance and research institutions hampers conservation efforts (ibid.).
In Papua New Guinea roles and values of indigenous breeds are generally recognized, but currently there are no formal conservation strategies or action plans for AnGR, mainly as the result of a lack of financial resources, technical capacity and trained human resources. However, despite the lack of formal or informal conservation strategies, geographical isolation and strict quarantine protocols which ensure that the country is free of major endemic diseases, and a relatively stable political, environmental, social and economic situation, provide considerable protection for indigenous breeds (CR Papua New Guinea, 2004). In the Philippines there are no policies prohibiting indiscriminate cross-breeding, and there are also no policies pertaining to the utilization and conservation of native horses in the country (CR Philippines, 2004).
Some countries, such as Malaysia, mention threats to animal genetic resources resulting from increased competition over natural resources. Habitat loss occurs because of increased commercialization and urbanization, and a decreasing hectarage of land used for agriculture (CR Malaysia, 2003).
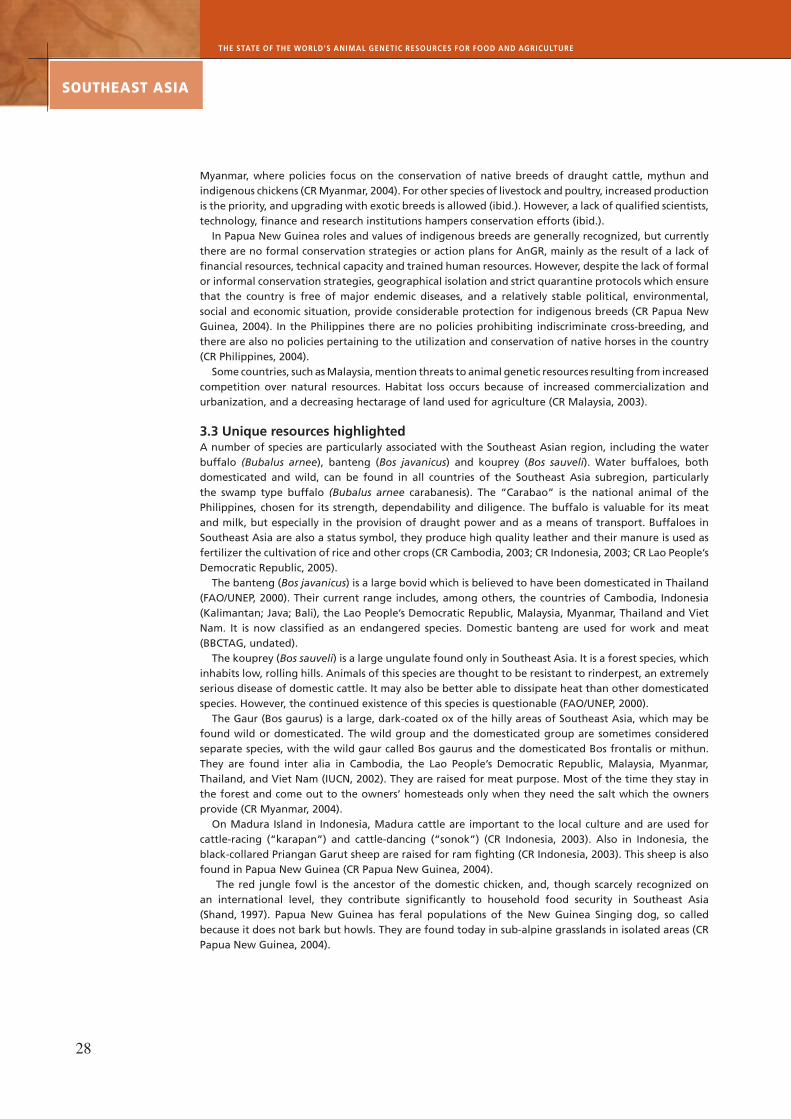
3.3 Unique resources highlighted A number of species are particularly associated with the Southeast Asian region, including the water buffalo (Bubalus arnee), banteng (Bos javanicus) and kouprey (Bos sauveli). Water buffaloes, both domesticated and wild, can be found in all countries of the Southeast Asia subregion, particularly the swamp type buffalo (Bubalus arnee carabanesis). The “Carabao” is the national animal of the Philippines, chosen for its strength, dependability and diligence. The buffalo is valuable for its meat and milk, but especially in the provision of draught power and as a means of transport. Buffaloes in Southeast Asia are also a status symbol, they produce high quality leather and their manure is used as fertilizer the cultivation of rice and other crops (CR Cambodia, 2003; CR Indonesia, 2003; CR Lao People’s Democratic Republic, 2005).
The banteng (Bos javanicus) is a large bovid which is believed to have been domesticated in Thailand (FAO/UNEP, 2000). Their current range includes, among others, the countries of Cambodia, Indonesia (Kalimantan; Java; Bali), the Lao People’s Democratic Republic, Malaysia, Myanmar, Thailand and Viet Nam. It is now classified as an endangered species. Domestic banteng are used for work and meat (BBCTAG, undated).
The kouprey (Bos sauveli) is a large ungulate found only in Southeast Asia. It is a forest species, which inhabits low, rolling hills. Animals of this species are thought to be resistant to rinderpest, an extremely serious disease of domestic cattle. It may also be better able to dissipate heat than other domesticated species. However, the continued existence of this species is questionable (FAO/UNEP, 2000).
The Gaur (Bos gaurus) is a large, dark-coated ox of the hilly areas of Southeast Asia, which may be found wild or domesticated. The wild group and the domesticated group are sometimes considered separate species, with the wild gaur called Bos gaurus and the domesticated Bos frontalis or mithun. They are found inter alia in Cambodia, the Lao People’s Democratic Republic, Malaysia, Myanmar, Thailand, and Viet Nam (IUCN, 2002). They are raised for meat purpose. Most of the time they stay in the forest and come out to the owners’ homesteads only when they need the salt which the owners provide (CR Myanmar, 2004).
On Madura Island in Indonesia, Madura cattle are important to the local culture and are used for cattle-racing (“karapan”) and cattle-dancing (“sonok”) (CR Indonesia, 2003). Also in Indonesia, the black-collared Priangan Garut sheep are raised for ram fighting (CR Indonesia, 2003). This sheep is also found in Papua New Guinea (CR Papua New Guinea, 2004).
The red jungle fowl is the ancestor of the domestic chicken, and, though scarcely recognized on an international level, they contribute significantly to household food security in Southeast Asia (Shand, 1997). Papua New Guinea has feral populations of the New Guinea Singing dog, so called because it does not bark but howls. They are found today in sub-alpine grasslands in isolated areas (CR Papua New Guinea, 2004).
2�
PART 1
SUBREGIONAL REPORT ON ANIMAL GENETIC RESOURCES– souTheAsT AsiA
References
Aho, P. 1998. Outlook for Southeast Asia’s feed, poultry and livestock industry. MITA (P) No. 096/11/97 (vol. PO38–
1998), Singapore, American Soy Bean Association. (available at http://www.asasea.com/po38_98.html).
BBCTAG. Undated. Banteng fact sheet. Bison, Buffalo and Cattle Taxon Advisory Group of the American Zoo and
Aquarium Association Wildlife Conservation and Management Committee (available at
http://www.csew.com/cattletag/Cattle%20Website/Fact_Sheets/Banteng/banteng.htm).
Blackburn, H., Lebbie, S.H.B. & van der Zijpp, A.J. 1998. Animal genetic resources and sustainable development. In
Proceedings of 6th World Congress on Genetics Applied to Livestock Production, 28: 3-10. (also available at
http://elib.tiho-hannover.de/publications/6wcgalp/papers/28003.pdf).
CR (Country name). year. Country reports on the state of animal genetic resources (available in the DAD-IS library at
http://www.fao.org/dad-is/).
Devendra, C., Morton, J., Rischkowsky, B. & Thomas, D. 2005 Livestock systems. In E. Owen, A. Kitalyi, N. Jayasuriya &
T. Smith, eds. Livestock and wealth creation: improving the husbandry of animals kept by resource- poor people in
developing countries, pp. 29–52. Nottingham, UK. Nottingham University Press.
FAO. 1996a. World livestock production systems. Current status, issues and trends, by C. Seré & H. Steinfeld with J.
Groenewold. FAO Animal Production and Health Paper No. 127. Rome.
FAO. 1997. Technical Advisory Committee database for quantitative analysis of CGIAR priorities and strategies, by G.
Gryseels, J.P. Groenewold & A. Kassam. TAC Secretariat. Rome.
FAO. 1999a. Short- and long-term effects of the Asian economic crisis on the livestock sector. by C.L. Delgado, M.W.
Rosegrant, & C.B. Courbois, In Proceedings of the workshop on the implications of the Asian economic crisis for
the livestock industry, held in Bangkok on 6–9 July 1999, Bangkok. (also available at
http://www.fao.org/DOCREP/004/AC473E/AC473E01.htm#ch1.1).
FAO. 1999b. Proceedings of the workshop on the implications of the Asian economic crisis for the livestock industry,
held in Bangkok on 6-9 July 1999. Bangkok.
(also available at http://www.fao.org/DOCREP/004/AC473E/AC473E01.htm#ch1.1).
FAO. 1999c. Asian livestock to the year 2000 and beyond, by D. Hoffman. FAO Working Paper Series. Rome. (also avail-
able at http://www.fao.org/documents/show_cdr.asp?url_file=//DOCREP/003/X6624E/x6624e00.htm).
FAO. 2002. Some issues associated with the livestock industries of the Asia-Pacific region. RAP-Publication No. 2002/06.
Bangkok. (also available at ftp://ftp.fao.org/docrep/fao/005/ac448e/ac448e00.pdf).
FAO. 2003a. World agriculture: towards 2015/2030. An FAO perspective, Rome.
FAO. 2003b. World agriculture: towards 2015/2030. An FAO perspective, AT2015/30 database, Rome.
FAO. 2004a. Classification and characterization of world livestock production systems. Update of the 1994 livestock
production systems dataset with recent data, by J. Groenewold. Unpublished report. Rome.
FAO. 2004b. Structural change in the livestock sector. Welcome remarks by the assistant Director-General H. Changchui
and Regional Representative for Asia and the Pacific. delivered at the meeting and workshop: Structural change in
the livestock sector, Amari Watergate Hotel, Bangkok, 27 January 2004 (available at
http://www.fao.org/world/regional/rap/meetings/2005/Sep21/20050921.html).
FAO. 2005. Opening address delivered by H. Changchui at the inception workshop of the FAO-ADB project: Control of
transboundary animal diseases in the Greater Mekong Subregion (GMS). (GCP/RAS/206/ASB), FAO Regional Office
for Asia and the Pacific, Bangkok, 21–23 September, 2005. Bangkok.
(available at http://www.fao.org/world/regional/rap/meetings/2005/Sep21/20050921.html).
FAO. 2006. Asian livestock benefiting from innovation. Regional perspective. In: Livestock report 2006. Rome.
FAOSTAT Agriculture. http://faostat.fao.org/faostat/collections?version=int&hasbulk=1&subset=agriculture
FAO/UNEP. 2000. World watch list for domestic animal diversity – 3rd edition, edited by B.D. Scherf. Rome.
(also available at http://dad.fao.org/en/Home.htm).
THE STATE OF THE WORLD'S ANIMAL GENETIC RESOURCES FOR FOOD AND AGRICULTURE
�0
souTheAsT AsiA
FAPRI. 1998. World agricultural outlook. Food and Agricultural Policy Research Institute Staff-report 2-98. Ames Iowa,
USA. Iowa State University, University of Missouri-Colombia.
(also available at http://www.fapri.iastate.edu/outlook98/outlook98.pdf).
FAPRI. 2002. World agricultural outlook. Food and Agricultural Policy Research Institute Staff-report 1-02. Ames, Iowa,
USA. Iowa State University, University of Missouri–Colombia.
(also available at http://www.fapri.iastate.edu/Outlook2002/PageMker/01-OutlookPubALL%20WEB.pdf).
FAPRI. 2005. World agricultural outlook, Food and Agricultural Policy Research Institute Staff-report 1-02. Ames, Iowa,
USA. Iowa State University, University of Missouri-Colombia.
(also available at http://www.fapri.org/outlook2005/text/15_WldLivestock.pdf).
FPA. 2003. Overview, the challenge facing South East Asia. Foreign Policy Association. (available at http://www.fpa.
org/newsletter_info2485/newsletter_info.htm).
IUCN. 2002. 2002 IUCN Red list of threatened species. Gland, Switzerland. International Union for Conservation of
Nature and Natural Resources. (available at www.redlist.org).
Sajise, P.E. 1998. Ecological concerns in crop-livestock integration in sloping land. Taipei, Food and Fertilizer Technology
Center. (available at http://www.fftc.agnet.org/library/article/eb461.html).
Shand, H. 1997. Human nature: agricultural biodiversity and farm-based food security. An independent study prepared
by the Rural Advancement Foundation International for the Food and Agricultural Organization of the United
Nations. Ottawa Canada, RAFI.
(also available at http://www.etcgroup.org/documents/other_human.pdf).
Steinfeld, H. 1998. Livestock production in the Asia and Pacific region – current status, issues and trends. World Animal
Review, 90.
Steinfeld, H. & Mäki-Hokkonen, J. 1995. A classification of livestock production systems. World Animal Review, 84/85.
(also available at http://www.fao.org/DOCREP/V8180T/v8180T0y.htm).
Taneja, V.K. &. Birthal, P.S. 2005. Development of animal production systems in Asia. In A. Rosati, A. Tewolde & C.
Mosconi, eds. Animal production and animal science worldwide. World Association for Animal Production Book of
the Year 2005.Wageningen the Netherlands. Wageningen Academic Publishers.
Thornton, P.K., Kruska, R.L., Henninger, N., Kristjanson, P.M., Reid, R.S., Atieno, F., Odero, A.N. & Ndegwa, T. 2002.
Mapping poverty and livestock in the developing world. Nairobi. International Livestock Research Institute.
USDA. 1997. Ag trade opportunities in SE Asia. In Agricultural Outlook, November 1997 p. 18. Washington DC.
Economic Research Service, United States Department of Agriculture.
(also available at http://www.ers.usda.gov/publications/agoutlook/nov1997/ao246e.pdf).
USDA. 2004. World broiler overview. United States Department of Agriculture Foreign Agricultural Service.. (available at
http://ffas.usda.gov/dlp2/circular/2004/04-03LP/Broileroverview.pdf).
Van der Eng, P. 2004. Productivity and comparative advantage in rice agriculture in Southeast Asia since 1870. Asian
Economic Journal, 18 (4), 345-370.
World Bank. 2001. World development report 2000/2001. Attacking poverty. New York, USA. Oxford University Press.
World Bank, Data & Statistics. (available at http://www.worldbank.org/data/countrydata/countrydata.html).
�1
PART 1
SUBREGIONAL REPORT ON ANIMAL GENETIC RESOURCES– souTheAsT AsiA
Annex 1 Import and export figures for the subregion
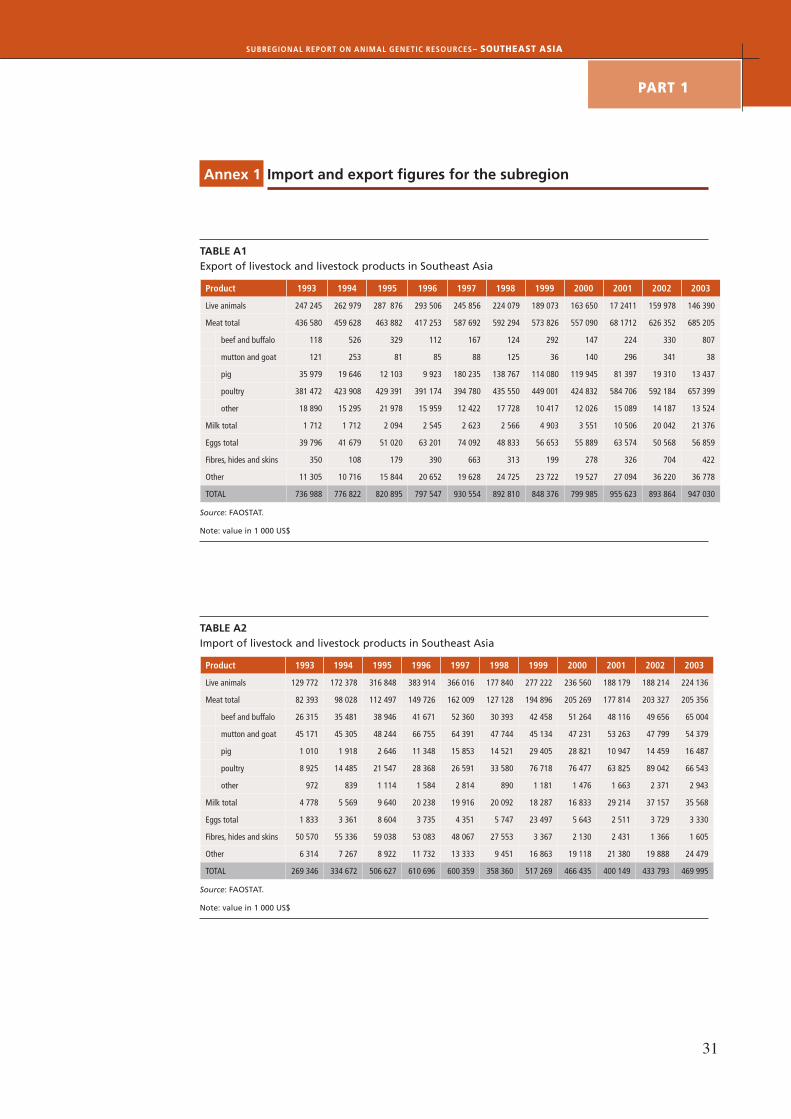
TABLE A1Export of livestock and livestock products in Southeast Asia
Product 1993 1994 1995 1996 1997 1998 1999 2000 2001 2002 2003
Live animals 247 245 262 979 287 876 293 506 245 856 224 079 189 073 163 650 17 2411 159 978 146 390
Meat total 436 580 459 628 463 882 417 253 587 692 592 294 573 826 557 090 68 1712 626 352 685 205
beef and buffalo 118 526 329 112 167 124 292 147 224 330 807
mutton and goat 121 253 81 85 88 125 36 140 296 341 38
pig 35 979 19 646 12 103 9 923 180 235 138 767 114 080 119 945 81 397 19 310 13 437
poultry 381 472 423 908 429 391 391 174 394 780 435 550 449 001 424 832 584 706 592 184 657 399
other 18 890 15 295 21 978 15 959 12 422 17 728 10 417 12 026 15 089 14 187 13 524
Milk total 1 712 1 712 2 094 2 545 2 623 2 566 4 903 3 551 10 506 20 042 21 376
Eggs total 39 796 41 679 51 020 63 201 74 092 48 833 56 653 55 889 63 574 50 568 56 859
Fibres, hides and skins 350 108 179 390 663 313 199 278 326 704 422
Other 11 305 10 716 15 844 20 652 19 628 24 725 23 722 19 527 27 094 36 220 36 778
TOTAL 736 988 776 822 820 895 797 547 930 554 892 810 848 376 799 985 955 623 893 864 947 030
Source: FAOSTAT.
Note: value in 1 000 US$
TABLE A2Import of livestock and livestock products in Southeast Asia
Product 1993 1994 1995 1996 1997 1998 1999 2000 2001 2002 2003
Live animals 129 772 172 378 316 848 383 914 366 016 177 840 277 222 236 560 188 179 188 214 224 136
Meat total 82 393 98 028 112 497 149 726 162 009 127 128 194 896 205 269 177 814 203 327 205 356
beef and buffalo 26 315 35 481 38 946 41 671 52 360 30 393 42 458 51 264 48 116 49 656 65 004
mutton and goat 45 171 45 305 48 244 66 755 64 391 47 744 45 134 47 231 53 263 47 799 54 379
pig 1 010 1 918 2 646 11 348 15 853 14 521 29 405 28 821 10 947 14 459 16 487
poultry 8 925 14 485 21 547 28 368 26 591 33 580 76 718 76 477 63 825 89 042 66 543
other 972 839 1 114 1 584 2 814 890 1 181 1 476 1 663 2 371 2 943
Milk total 4 778 5 569 9 640 20 238 19 916 20 092 18 287 16 833 29 214 37 157 35 568
Eggs total 1 833 3 361 8 604 3 735 4 351 5 747 23 497 5 643 2 511 3 729 3 330
Fibres, hides and skins 50 570 55 336 59 038 53 083 48 067 27 553 3 367 2 130 2 431 1 366 1 605
Other 6 314 7 267 8 922 11 732 13 333 9 451 16 863 19 118 21 380 19 888 24 479
TOTAL 269 346 334 672 506 627 610 696 600 359 358 360 517 269 466 435 400 149 433 793 469 995
Source: FAOSTAT.
Note: value in 1 000 US$
THE STATE OF THE WORLD'S ANIMAL GENETIC RESOURCES FOR FOOD AND AGRICULTURE
�2
souTheAsT AsiA
Annex 2 Classification of livestock production systems
FAO (1996)1 used the agro-ecological zones (AEZ) described by the Technical Advisory Committee (TAC, 1994)2 and provided a comprehensive description of global livestock production systems using quantitative statistical methods. In this system the distinction is based upon grassland-based systems (LG), mixed-rainfed systems (MR), mixed irrigated systems (MI) and landless systems (LL). The landless livestock production systems are not linked to agro-ecological zones.
Grassland-based systems (LG) are livestock systems in which more than 90 percent of dry matter fed to animals comes from rangelands, pastures, annual forages and purchased feeds and less than 10 percent of the total value of production comes from non-livestock farming activities. Annual stocking rates are less than 10 livestock units per hectare of agricultural land. A further distinction is made between Temperate Zones and Tropical Highlands (LGT), Humid and Subhumid Tropics and Subtropics (LGH) and Arid and Semi-arid Tropics and Subtropics (LGA).
Mixed-rainfed systems (MR) are defined as rainfed systems in which more than 10 percent of the dry matter fed to livestock comes from crop by-products and/or stubble or more than 10 percent of the value of production comes from non-livestock farming activities. A further distinction is made between Temperate Zones and Tropical Highlands (MRT), Humid and Subhumid Tropics and Subtropics (MRH) and Arid and Semi-arid Tropics and Subtropics (MRA).
Mixed-irrigated systems (MI) are defined as irrigated systems in which more than 10 percent of the dry matter fed to livestock comes from crop by-products and/or stubble or more than 10 percent of the value of production comes from non-livestock farming activities. A further distinction is made between Temperate Zones and Tropical Highlands (MIT), Humid and Subhumid Tropics and Subtropics (MIH) and Arid and Semi-arid Tropics and Sub-tropics (MIA).
Landless systems are defined as those where less than 10 percent of the dry matter consumed is produced on the farm where the livestock are located, and where annual average stocking rates are above 10 livestock units (1 LU = 1 cattle or buffalo or 8 sheep or goats) per hectare of agricultural land. Furthermore, landless monogastric (LLM) and landless ruminant systems (LLR) are distinguished. The former are mainly industrial, intensive and vertically-integrated pig and poultry enterprises whose economic outputs are higher than those of ruminant enterprises. In landless ruminant systems, the value of production of the ruminant enterprises is lower than that of the pig and poultry enterprises.
1 FAO. 1996. World livestock production systems. Current status, issues and trends, by C. Seré, H. Steinfeld & J. Groenewold. FAO Animal Production and Health Paper No. 127. Rome.2 TAC. 1994. Animal agriculture in developing countries: technology dimensions. Development Studies Paper Series. Morrilton, Arkan-sas. Winrock International.
��
Participants from Bangladesh, Bhutan, China, the Lao People’s Democratic Republic, Malaysia, Sri Lanka and Thailand met at FAO-Regional Office for Asia and the Pacific, Bangkok, Thailand, 16–17 December 2004 to determine the minimum requirements for a sustainable (sub)regional focal point and identify the need for a regional technical cooperation project for use and conservation of animal genetic resources (AnGR).
Requirements and design of a (sub)regional focal point for Asia The participating group of National Coordinators for the Management of Animal Genetic Resources (NCs) discussed the major requirements for a future Asian Regional Focal Point (RFP):
• objectives of an Asian RFP;• activity plan;• expected benefits;• proposed structure, institutional relationships and organization of work; and• options for a funding mechanismA first Regional Project to address the issue of genetic erosion was funded by the Government of Japan. • The project started in 1994 covering 12 Asian countries. • The objective was to evaluate thoroughly the particular characteristics of different breeds and
strains and to strengthen appropriate breeding programmes, taking into account the husbandry systems to which they are particularly adapted.
• The project was successful in providing training in the area of animal genetic resources management, in supporting countries’ activities in conserving breeds which are in danger of extinction, and particularly in raising broad awareness of the role and the importance of the value of indigenous animal genetic resources.
• All countries have developed comprehensive animal genetic resources management plans and in some countries attempts are been made to put them in practice.
There is a need to explore whether it is possible to create a second Regional Project or RFP which is more sustainable than the first.
Objectives• Strengthen the position and capacity (including training and technology transfer) of the national
focal points.• Establish a mechanism for sharing experiences and information on AnGR-related policies and
activities, to the mutual benefit of the countries in the region.• Facilitate regional consultation on AnGR and foster better working relationships among countries
within the region and between the various stakeholders, and build consensus on regional issues and policies.
• Coordinate sustainable management and use of AnGR within the region (in line with agrobiodiversity work programme of the Convention on Biological Diversity, and food security and poverty alleviation policies) and to support the development of regional strategies on this issue.
• Support awareness building on AnGR among various stakeholders.• Facilitate development of (sub)regional projects and regional funding mechanisms (follow-up
mechanism of FAO’s State of the World’s Animal Genetic Resources for Food and Agriculture process)
Exploration of
needs, objectives, activities and organization
of an Asian Regional Focal Point
or Asian Network for Animal Genetic Resources
PART 2
THE STATE OF THE WORLD'S ANIMAL GENETIC RESOURCES FOR FOOD AND AGRICULTURE
��
souTheAsT AsiA
ActivitiesThe following proposed activities are listed in order of priority:
• Development of a regional Web portal or a platform for information and knowledge exchange on AnGR issues to facilitate information sharing and to link NC activities and experiences. Information sharing includes inter alia:- sharing of regional information on AnGR management,- community-based management,- breeding programmes for low- and medium input systems, and- promotion of trade in animal products that will support conservation.
• Production of (sub)regional material and introduction of AnGR- related issues to the national and international media.
• Facilitation of the development of guidelines for AnGR management/breeding policies for individual species.
• Organization of regional consultation to provide a platform for discussion among stakeholders (physical meeting or e-conference-type activities).
• Organization of annual regional meetings for all NCs to exchange information and to follow-up and monitor activities.
• Exploration of common understanding on legal policies for AnGR (including access and benefit-sharing) and sharing of information on national regulations.
• Development of funding mechanisms for (sub)regional projects (i.e. guideline development, capacity-building, workshops, breeding programmes, surveys, economic evaluation of AnGR, etc.)
• Facilitatation of Master and PhD studies (scholarships) to develop expertise on AnGR management, specifically including on-line courses and distance learning
• Organization of specific training courses and workshops on AnGR issues to exchange methodologies (for example on application of sustainable breeding methods for low- or medium input systems or community based AnGR management) and to locate existing programmes and interest donors and organizations in providing (part of) the resources
• Facilitation of the exchange of personnel within the region – facilitated by the RFP network.• Promotion of trade in animal products, as a support to conservation.
Expected benefits• Better contribution to CBD commitments and to conservation and sustainable management in
general, and increased food security and nutrition in general.• Reduction of the costs associated with the improvement of technology, breeding methods and
breeding policy guidelines.• More efficiency and sustainability in national AnGR management programmes and national
policy development.• Increased awareness of the issues of AnGR on a regional level.• Increased visibility of the Asian (sub)region(s).
Proposed structure, institutional relationships and organization of work• Minimum architecture for an Asian RFP exists in the form of one regional secretariat and four
“anchor” subregions (Middle East/West Asia, South Asia, Southeast Asia, East Asia). One regional secretariat for the whole region is the minimum requirement to operate the necessary (Web) communication within the region. Each country should provide information to the regional secretariat and the regional secretariat will communicate to all countries through the NCs.
• Additionally, subregions could decide among themselves to have a “light” subregional coordination through one of the NCs. It should be noted that variation between countries within subregions is almost as large as within the whole Asian region.
• The RFP needs a steering committee representing at least all 4 subregions and the RFP itself. Such a steering committee would be responsible for a two-year planning cycle and monitoring of activities, and should coordinate decision-making.
• Involvement of the Bioversity secretariat for each subregion (Delhi, China, Regional Office Malaysia) is an option.
• It is necessary to organize at least one meeting for all NCs every year, where possible in combination with other related meetings in the region. Physical meetings could also be alternated by e-conferences or videoconferences, which may lower the costs of the operation of
��
SUBREGIONAL REPORT ON ANIMAL GENETIC RESOURCES– souTheAsT AsiA
the Asian Regional Focal Point, but total replacement is not advisable.• Institutional relationships with APHCA (Animal Production and Health Commission for Asia and
the Pacific), ASEAN (Association of Southeast Asian Nations, SAARC (South Asian Association for Regional Cooperation) or with the CGIAR (Consultative Group on International Agricultural Research) network (Bioversity and International Livestock Research Institute (ILRI)) should be further investigated. It is important to get sustainable management and use of AnGR onto the agenda of these organizations and link AnGR activities to mainstream livestock policies. APHCA may be interested to broaden their scope of work and adopt AnGR issues as a priority. However, but APHCA does not cover the whole region (e.g. Cambodia, China, the Democratic People’s Republic of Korea, Mongolia, the Republic of Korea and Viet Nam). ASEAN and SAARC should also be interested to include AnGR in their Biodiversity Programme. Bioversity is discussing broadening of the scope of its work to AnGR, because of its mandate to work from a systems approach. Both Bioversity and ILRI have (sub)regional offices. Co-funding or in kind contributions from these organizations may be feasible. Linkages to the (sub)regional secretariats of these institutions need to be further explored.
Options for funding mechanisms• A substantial yearly budget would be needed if all activities as listed were to be immediately
undertaken by the RFP. However, the activities are listed more or less in order of priority; the most realistic and sustainable option would be to start with the basic activities.
• A minimum budget is necessary for travel and to facilitate a minimum number of meetings. Human resources may not be the problem if a country (or several countries) offers to provide the secretariat, including a person and facilities. Furthermore, it is expected that regional collaboration will be part of the regular work of the NCs and this should be included in national programmes.
• Extending the number of activities of the Asian RFP could be done on a project basis and with project funding. The RFP (network) could initiate or assist the development of project proposals.
• Sustainable funding can not be expected from FAO, but FAO could assist in approaching donors or could offer the facilities for an externally funded RFP-coordinator. If Asian countries wish you contribute (in kind) to the establishment of an Asian RFP for AnGR, FAO-RAP (Regional Office for Asia and the Pacific) may be willing to offer facilities at the Regional Office. Furthermore, there are limited possibilities to start TCP (Technical Cooperation Programme) projects for a two-year period although it will not be easy to meet the (emergency) criteria.
• Embedding the Asian RFP AnGR under APHCA, ASEAN or SAARC would offer opportunities. Sustainable funding (“seed money”) could be requested – coming for example from a Livestock Trust Fund. APHCA has a limited budget and a broad mandate, but APHCA could take up sustainable management and use of AnGR as an additional priority if member countries so request. APHCA already played a minor role after the ending of the previous regional project for AnGR in Asia.
• Involvement of Bioversity (and ILRI) would also offer an opportunity for a (sub)regional secretariat or for cash contributions to the network. Bioversity has subregional secretariats in Delhi, China, Malaysia and the mandate of Bioversity is a systems approach, which could also include AnGR.
• If one or more developed countries from the region could be convinced to contribute financially to the RFP, the RFP would have a stronger foundation.
General conclusions and observations• Participants agree that is important to develop an Asian RFP for AnGR, but benefits should be
clearly demonstrated to governments, with support of FAO. Links between countries in Asia is very important, as they face similar trends, similar threats and similar opportunities.
• It is a global and regional problem that not many Asian countries are interested in “approaches to improve local breeds”, and donors generally give low priority to the development of long-term breeding programmes for AnGR.
• Organizing an additional network is necessary, because existing research or other networks do not deal with strategic and policy issues related to AnGR.
• At least one Asian country is, in principle, positive about hosting the Asian RFP secretariat
PART 2
THE STATE OF THE WORLD'S ANIMAL GENETIC RESOURCES FOR FOOD AND AGRICULTURE
�6
souTheAsT AsiA
or providing an in kind contribution. However, this requires an official request (to all Asian governments) through FAO, and some “seed money” would certainly help secure a positive host-country decision.
• It is expected that it will be a huge problem to find a large budget for substantial and sustainable RFP operations in Asia. However, participants agreed that it would be valuable at least to start with an in kind contributed secretariat and “seed money” through existing regional organizations such as APHCA or ASEAN.
• Besides budgetary/cash needs it is even more important to have a dedicated person in the region (or several for all subregions).
• The general feeling is that the RFP should not be hosted by FAO-RAP as the RFP should be lead by the countries themselves.
• In general it was felt that communication and awareness-building with regard to conservation and sustainable use of AnGR is very important (in the context of CBD, the work of the Commission on Genetic Resources for Food and Agriculture, the preparation of The State of the World’s Animal Genetic Resources for Food and Agriculture, and the Global Strategy for the Management of Animal Genetic Resources).