SUBCRITICAL WATER MEDIATED HYDROLYSIS …etheses.bham.ac.uk/3574/1/Bahari_12_PhD.pdfsubcritical...
235
SUBCRITICAL WATER MEDIATED HYDROLYSIS OF CIDER LEES AS A ROUTE FOR RECOVERY OF HIGH VALUE COMPOUNDS by ALIREZA BAHARI A thesis submitted to the University of Birmingham for the degree of DOCTOR OF PHILOSOPHY School of Chemical Engineering College of Engineering and Physical Sciences University of Birmingham November 2010
Transcript of SUBCRITICAL WATER MEDIATED HYDROLYSIS …etheses.bham.ac.uk/3574/1/Bahari_12_PhD.pdfsubcritical...

SUBCRITICAL WATER MEDIATED
HYDROLYSIS OF CIDER LEES AS A
ROUTE FOR RECOVERY OF HIGH
VALUE COMPOUNDS
by
ALIREZA BAHARI
A thesis submitted to the
University of Birmingham for the degree of
DOCTOR OF PHILOSOPHY
School of Chemical Engineering
College of Engineering and Physical Sciences
University of Birmingham
November 2010

University of Birmingham Research Archive
e-theses repository This unpublished thesis/dissertation is copyright of the author and/or third parties. The intellectual property rights of the author or third parties in respect of this work are as defined by The Copyright Designs and Patents Act 1988 or as modified by any successor legislation. Any use made of information contained in this thesis/dissertation must be in accordance with that legislation and must be properly acknowledged. Further distribution or reproduction in any format is prohibited without the permission of the copyright holder.

Abstract
Spent cider lees(yeast), a by-product of the cider industry, was subjected to subcritical water
in a batch process over a temperature range of 100 °C to 300 °C. The efficacy of subcritical
water to convert the waste biomass into a mixture of valuable compounds was investigated
by studying formed products in the extracts. At milder temperatures (up to 150°C), yeast
intracellular contents such as proteins were released. Also, phenolic compounds which were
previously adsorbed on cell walls during fermentation start to release, which was shown for
the first time, leading to an increase in the antioxidant activity of the extracts (maximum 80 g
ascorbic acid equivalent in 100 ml). The release of phenolics was compared to organic
solvent extraction and the same level of extraction was observed in subcritical water
treatment. At higher temperatures, polymers of the yeast cell wall started to solubilise
producing monosaccharides which later were converted to hydroxymethyl furfural (HMF).
Kinetics of HMF synthesis were determined using first order kinetics suggesting that milder
conditions are required for HMF production when compared to the same process using
cellulose as substrate. Results support the potentials of the studied feedstock as a substrate
for numerous bio-based chemicals.

To My Parents and Maryam, My Adored Wife

Acknowledgments
I would like to thank Dr. Regina Santos who gave me the opportunity of coming to the UK,
supervised me during my PhD and being my first friend in the UK. She offered her help,
advice and encouragement throughout my course and supported me by any means. Also I
would like to thank the School of Chemical Engineering in University of Birmingham and
Phytatec company for their financial support and sponsoring this project. My warm thanks
go to my co-supervisor, Dr. Gary Leeke who offered his guidance and support throughout
this study. My special thanks go to Dr. Steve Bowra for his technical advices as the industrial
supervisor and his valuable help and comments throughout the project.
Conducting experiments in supercritical systems is a tricky business and it is thanks to the
support of our group members. Thanks in particular to Dr. Teijun Lu for his technical
knowledge on any equipment in the lab, especially the high pressure systems. I also want to
thank the technicians Elaine and Hazel in Biochemical Engineering and Mr. Graham Burns
and Dr. Peter Ashton in Chromatography and Mass spectroscopy labs in Chemistry for their
assistance with analysing hundereds of samples. For having a nice time in Birmingham and
in the supercritical fluids group in University of Birmingham, my thanks go to my friends
Muhammad, Naeema, Mauricio, Pom, Raslan and Ricardo.

Table of Contents
CHAPTER 1 1
1.1 BACKGROUND AND AIMS 1
1.2 STRUCTURE OF THE THESIS 4
CHAPTER 2 6
2.1 SUPERCRITICAL FLUIDS AND THEIR APPLICATIONS 6
2.2 SUBCRITICAL AND SUPERCRITICAL WATER 8
2.2.1 INTRODUCTION 8
2.2.2 PROPERTIES OF NEAR CRITICAL WATER 9
2.2.2.1 MICROSCOPIC PROPERTIES 9
2.2.2.2 MACROSCOPIC PROPERTIES 11
2.3 SUB- AND SUPERCRITICAL WATER APPLICATIONS 14
2.3.1 EXTRACTION 14
2.3.2 REACTION MEDIUM 15
2.4 SUB- AND SUPERCRITICAL WATER AND BIOMASS TRANSFORMATION 16
2.4.1 BIOMASS AS A SOURCE OF ENERGY AND CHEMICALS 16
2.4.2 BIOMASS: CHEMISTRY AND ITS PROPERTIES 20
2.4.3 BIOMASS CONVERSION IN SUBCRITICAL WATER 25
2.4.4 DEGRADATION OF BIOMASS COMPONENTS IN SUBCRITICAL WATER 27
2.4.4.1 CELLULOSE 28
2.4.4.1.1 KINETICS OF CELLULOSE HYDROLYSIS UNDER HYDROTHERMAL CONDITIONS 28
2.4.4.1.2 GLUCOSE HYDROLYSIS IN SUBCRITICAL WATER-REACTIONS PATHWAYS AND
KINETICS 36
2.4.4.2 HEMICELLULOSE 42
2.4.4.3 LIGNIN 42
2.5 BIOREFINERIES AND BIO-BASED CHEMICALS 43
2.5.1 FURAN-RELATED DERIVATIVES 46
2.5.2 BREWER SPENT YEAST AND ITS APPLICATIONS 51
2.5.3 HYDROTHERMAL CONVERSION OF YEAST BIOMASS 54
2.5.4 YEAST AUTOLYSIS FOR THE PRODUCTION OF YEAST EXTRACT 56
2.5.4.1 AUTOLYSIS AND EXTRACTION OF VALUABLE COMPOUNDS 58
2.5.5 SPENT CIDER YEAST (LEES) 59
2.5.5.1 CIDER PROCESS AND LEES PRODUCTION 59
2.5.5.2 POTENTIAL PRODUCTS FROM CIDER LEES 62
2.5.5.2.1 PROTEINS AND AMINO ACIDS 62
2.5.5.2.2 CARBOHYDRATES (Β-GLUCAN) AND RELATED DERIVATIVES 63
2.5.5.2.3 VITAMINS AND OTHER NUTRIENTS 65
VITAMINS: AN OVERVIEW 65

TLC ANALYSIS OF VITAMINS 68
2.6 PHENOLIC COMPOUNDS 69
2.6.1 PLANT PHENOLICS: CHEMISTRY AND CHARACTERISATION 71
2.6.1.2 NON-FLAVONOIDS 74
2.6.2 BIOLOGICAL AND HEALTH EFFECTS OF POLYPHENOLS 75
2.6.3 DETERMINATION OF PHENOLICS-REVIEW OF TECHNIQUES AND SAMPLES 75
2.6.4 PHENOLICS IN THE APPLE 79
2.6.5 PHENOLICS INTERACTION WITH THE YEAST CELLS 81
CHAPTER 3 84
3.1 INTRODUCTION 84
3.2 MATERIALS AND METHODS 85
3.2.1 RAW MATERIAL (CIDER LEES) 85
3.2.2 BATCH HYDROLYSIS REACTIONS 85
3.2.3 EXPERIMENTAL METHOD 86
3.2.4 TOTAL ORGANIC CARBON (TOC) ANALYSER 89
3.2.5 TOTAL PROTEIN MEASUREMENT 90
3.2.6 DRY WEIGHT MEASUREMENTS 90
3.2.7 UV-SPECTROPHOTOMETRY 91
3.2.8 SEM AND TEM 92
3.2.9 TOTAL PHENOLIC CONTENT (TPC) 92
3.2.10 ANTIOXIDANT ACTIVITY 93
3.3 RESULTS AND DISCUSSION 94
3.3.1. GENERAL PROPERTIES OF THE CRUDE SAMPLE 94
3.3.2 GENERAL CHARACTERISTICS OF THE EXTRACTS 96
3.3.3 SOLID CONCENTRATION AND SAMPLE DRY WEIGHT 98
3.3.4 SEM AND TEM 102
3-3-5 UV-ABSORBANCE PROFILE 107
3.3.6 PROTEIN CONCENTRATION 109
3.3.7. TOTAL ORGANIC CARBON (TOC) 111
3.3.8. PHENOLIC COMPOUNDS 113
3.3.9. ANTIOXIDANT PROPERTIES OF THE EXTRACTS 115
3.4. CONCLUSION 116
CHAPTER 4 118
4.1. INTRODUCTION 118
4.2.1 DEVELOPMENT OF HPLC METHOD FOR THE ANALYSIS OF VITAMIN B3 119
4.2.2 AUTOLYSIS CONDITIONS 122
4.2.3 PROTEIN ANALYSIS 124
4.2.4 VITAMIN B3 DETERMINATION IN HYDROLYZED EXTRACTS OF YEAST USING TLC 124

4.3 RESULTS AND DISCUSSION 125
4.3.3 AUTOLYSIS OF THE YEAST BIOMASS 132
4.3.3.1 TOTAL PROTEIN CONCENTRATION 133
4.3.3.2 VITAMIN B3 DETERMINATION IN AUTOLYZED SAMPLES 134
4.4 CONCLUSION 140
CHAPTER 5 142
5.1 INTRODUCTION 142
5.2 MATERIALS AND METHODS 143
5.3 RESULTS AND DISCUSSION 148
5.3.1 DETERMINATION OF HMF PEAK WITH MASS SPECTROSCOPY 148
5.3.2. CELL WALL DECOMPOSITION IN SUBCRITICAL WATER 152
5.3.3 REACTION KINETICS 157
5.3.4 HMF SYNTHESIS FROM RELEASED MONOSACCHARIDES 161
5.4. CONCLUSION 165
CHAPTER 6 168
6.1 INTRODUCTION 168
6.2 MATERIALS AND METHODS 170
6.2.1 RAW MATERIAL 170
6.2.2 REACTIONS IN SUBCRITICAL WATER 171
6.2.3. PHENOLICS EXTRACTION WITH ORGANIC SOLUTION 172
6.2.4 TOTAL PHENOLIC CONTENT (TPC) ASSAY 173
6.2.4.1 AN INTRODUCTION TO FOLIN-CIOCALTEAU (FC) ASSAY 173
6.2.4.2 FOLIN-CIOCALTEAU ASSAY-THE METHOD 174
6.2.4.3 PROTEIN INTERFERENCE IN FOLIN-CIOCALTEAU ASSAY 176
6.2.4.4 TCA PROTEIN PRECIPITATION PROTOCOL 176
6.2.5 HPLC WITH DIODE ARRAY DETECTION (DAD) 177
6.3 RESULTS 179
6.3.1 RP-HPLC METHOD DEVELOPMENT AND DETERMINATION OF PHENOLICS 179
6.3.1 PHENOLIC DESORPTION USING SUBCRITICAL WATER 183
6.3.2 SOLVENT EXTRACTION 186
6.3.3 HPLC ANALYSIS- SINGLE WAVELENGTH (270 NM) 187
6.3.4 CHLOROGENIC ACID DESORPTION 190
6.3.5 HPLC ANALYSIS AND RESULTS FROM DAD DETECTOR 190
6.4 CONCLUSION 195
CHAPTER 7 198
7.1 OVERALL CONCLUSIONS 198
7.2 RECOMMENDATION FOR FURTHER RESEARCH 202
REFERENCES 204

List of Figures
FIGURE 2.1 THE PHASE DIAGRAM OF A SINGLE SUBSTANCE (CLIFFORD, T., 1998) ......................... 7 FIGURE 2.2. NUMBER OF HYDROGEN BONDS PER WATER MOLECULE (ADAPTED FROM (AKIYA
& SAVAGE 2002)..................................................................................................................................... 10 FIGURE 2.3. PROPERTIES OF PURE WATER AT 250 BAR AS A FUNCTION OF TEMPERATURE
(AKIYA & SAVAGE 2002)...................................................................................................................... 12 FIGURE 2.4. DIFFERENT TYPES OF BIOMASS (ADAPTED FROM (CLARK & DESWARTE 2008)...... 21 FIGURE 2.5. STEREO-CHEMICAL FORMULAS OF (A) CELLULOSE AND (B) CELLOBIOSE
(BOBLETER 1994) ................................................................................................................................... 22 FIGURE 2.6. MECHANISMS OF CELLUBIOSE HYDROLYSIS IN ACIDIC (H+), ALKALINE (OH-) AND
PURE WATER AND FORMATION OF GLUCOSE (ORTWIN BOBLETER 1994A).......................... 29 FIGURE 2.7. ARRHENIUS PLOT OF RATE CONSTANTS FOR DECOMPOSITION OF CELLULOSE
AND GLUCOSE IN SUBCRITICAL AND SUPERCRITICAL WATER (SASAKI ET AL. 1998). ...... 30 FIGURE 2.8. DIFFERENT REACTION PATHWAYS FOR THE HYDROLYSIS OF CELLULOSE IN PURE
WATER (SASAKI ET AL. 1998) ............................................................................................................. 33 FIGURE 2.9. ARRHENIUS PLOT FOR CELLULOSE DECOMPOSITION IN DIFFERENT STUDIES
(PETERSON 2009).................................................................................................................................... 34 FIGURE 2.10. ISOMERISATION OF GLUCOSE AND FRUCTOSE IN WATER AND THEIR DIFFERENT
FORMS (ADAPTED FROM (PETERSON 2009) .................................................................................... 36 FIGURE 2.11. GENERALIZED REACTION PATHWAY FOR GLUCOSE DECOMPOSITION IN
SUBCRITICAL AND SUPERCRITICAL WATER CONDITIONS (B. KABYEMELA ET AL. 1999). 37 FIGURE 2.12. KINETIC REACTION PATHWAY OF GLUCOSE DECOMPOSITION IN SUB- AND
SUPERCRITICAL WATER (B. KABYEMELA ET AL. 1999) .............................................................. 40 FIGURE 2.13 EFFECT OF HMF SELECTIVITY OF ADDING AN EXTRACTING ORGANIC SOLVENT
TO THE AQUEOUS PHASE FOR 10 WT% GLUCOSE DEHYDRATION 443 K USING HCL AS CATALYST (CHHEDA ET AL. 2007) .................................................................................................... 49
FIGURE 2.14 SCHEMATIC REPRESENTATION OF THE BREWERS YEAST BIOMASS VALORISATION AT DIFFERENT TIMES (FERREIRA ET AL. 2010) ............................................... 53
FIGURE 2.15 SEM IMAGES OF YEAST CELLS AFTER 24 H OF AUTOLYSIS IN A MODEL WINE SYSTEM. A SUPERFICIAL ULTRA-STRUCTURE OF A YEAST CELL. B IMAGE OF FRACTURED EMPTY YEAST CELLS WHICH HAVE LOST MOST OF THEIR CYTOPLASMIC CONTENT DURING THE AUTOLYSIS (MORENO-ARRIBAS ET AL) ............................................. 57
FIGURE 2.16 PROCESS DIAGRAM OF THE CIDER MANUFACTURING AND COLLECTION OF LEES AS WASTE (COURTESY OF HEINEKEN UK (BULMERS) ................................................................ 61
FIGURE 2.17 STRUCTURAL DIFFERENCE BETWEEN CELLULOSE AND STARCH AND THEIR GLYCOSIDIC BONDS............................................................................................................................. 64
FIGURE 2.18 STRUCTURES OF THE FLAVONOIDS. THE BASIC STRUCTURE CONSISTS OF THE FUSED A AND C RINGS, WITH THE PHENYL B RING ATTACHED THROUGH ITS 1' POSITION TO THE 2-POSITION OF THE C RING (NUMBERED FROM THE PYRAN OXYGEN) (RICE-EVANS ET AL. 1997)............................................................................................................................... 72
FIGURE 2.19 FLAVONOIDS AND THEIR SUBGROUPS.............................................................................. 73 FIGURE 2.20 SEPARATION OF A STANDARD MIXTURE OF PHENOLIC COMPOUNDS (AND 5-
HYDROXYMETHYL FURFURAL AND CINNAMIC ACID) BY RP-HPLC (280 NM)...................... 77 FIGURE 2.21 ANTIOXIDANT ACTIVITY OF VARIOUS FRUIT EXTRACTS (BOYER & R. LIU 2004) . 80
FIGURE 3. 1. SCHEMATIC DIAGRAM OF THE BATCH HYDROLYSIS EXPERIMENTS....................... 87 FIGURE 3. 2 COLONIES OF THE YEAST FORMED AFTER INCUBATION PDA CULTURE PLATES
WITH CRUDE SAMPLE.......................................................................................................................... 95 FIGURE 3. 3. COLOUR CHANGE IN THE SUPERNATANT OF THE SAMPLES AT DIFFERENT
TEMPERATURES. REACTION TIME WAS 30 MINUTES AND THE PRESSURE WAS 60 BAR FOR ALL THE SAMPLES ....................................................................................................................... 97
FIGURE 3. 4 TOTAL DRY WEIGHT OF THE EXTRACTS (SOLID AND LIQUID) AT DIFFFERENT TEMPERATURES AFTER 30 MINS AT 100 BAR ................................................................................ 98

FIGURE 3. 5 SOLID AND LIQUID/SUPERNATANT DRY WEIGHT AFTER SUBCRITICAL WATER HYDROLYSIS AT TEMPERATURES OF 100-300 °C. ERROR BARS REPRESENT STANDARD ERROR (N=3). ........................................................................................................................................ 100
FIGURE 3. 6. SOLID AND LIQUID/SUPERNATANT DRY WEIGHT AFTER SUBCRITICAL WATER HYDROLYSIS AT TEMPERATURES OF 100-300 °C. NORMALIZED TO T=0 AT EACH REACTION TEMPERATURE ERROR BARS REPRESENT STANDARD ERROR (N=3). .............. 101
FIGURE 3. 7 YEAST CELLS (S. BAYANOUS) IN THE SUBSTRATE SAMPLES AT TWO DIFFERENT MAGNIFICATIONS A: 2000X AND B: 10,000 X ................................................................................ 103
FIGURE 3. 8 TEM IMAGES OF THE YEAST CELLS AFTER BEING TREATED AT DIFFERENT TEMPERATURES (X=5,000 FOR ALL THE IMAGES EXCEPT THE CRUDE SAMPLE IMAGE WHICH IS AT X=20,000)....................................................................................................................... 105
FIGURE 3. 9 SEM IMAGES OF THE YEAST CELLS AFTER BEING TREATED AT DIFFERENT TEMPERATURES (X=10,000 FOR ALL THE IMAGES) .................................................................... 106
FIGURE 3. 10 UV-SPECTRUM OF THE CRUDE SAMPLE AND THE EXTRACTS AT DIFFERENT TEMPERATURES (ALL AT 10 MIN REACTION TIME). THE RATIO FOR EACH ENTRY IS THE DILUTION FACTOR PRIOR TO ANALYSIS ...................................................................................... 107
FIGURE 3. 11 UV ABSORBANCE CHANGES IN THE HYDROLYSED SAMPLES RELATIVE TO THE CRUDE SAMPLE AT 3 WAVELENGTHS ........................................................................................... 108
FIGURE 3. 12 PROTEIN CONCENTRATION IN THE CRUDE SAMPLE AND IN THE EXTRACTS AT DIFFERENT TEMPERATURES AND REACTION TIMES ................................................................ 110
FIGURE 3. 13 TOTAL ORGANIC CARBON (TOC) OF THE LIQUID EXTRACTS AT DIFFERENT TEMPERATURES AND REACTION TIME. ERROR BARS REPRESENT STANDARD ERROR (N=3)........................................................................................................................................................ 112
FIGURE 3. 14 TOTAL PHENOLIC CONTENT IN THE EXTRACTS AT DIFFERENT TEMPERATURES AND REACTION TIMES. VALUES ARE REPORTED AS GALLIC ACID EQUIVALENT (GAE). ERROR BARS REPRESENT STANDARD ERROR (N=3) .................................................................. 114
FIGURE 3. 15 ANTIOXIDANT POWER OF THE EXTRACTS AT DIFFERENT TEMPERATURES AND REACTION TIMES. ANTIOXIDANT VALUES ARE PRESENTED AS THE EQUIVALENT OF THE VITAMIN C IN 100 ML. ERROR BARS REPRESENT STANDARD ERROR (N=3) ........................ 115
FIGURE 4. 1 . HPLC CHROMATOGRAM OF HYDROLYZED SAMPLE (200 C, 20 MIN, 100 BAR)
ELUTED FROM LUNA C18 (TOP) AND SYNERGI-FUSION COLUMN (BOTTOM). UV DETECTOR (270 NM)............................................................................................................................ 120
FIGURE 4. 2 CALIBRATION CURVE FOR HPLC ANALYSIS OF NICOTINAMIDE .............................. 121 FIGURE 4. 3 CHROMATOGRAM OF THE STANDARD VITAMIN B3 (NICOTINIC ACID AND
NICOTINAMIDE)................................................................................................................................... 122 FIGURE 4. 4. ELUTION BEHAVIOUR OF THE MIXTURE OF VITAMIN B GROUP LOADED AT
DIFFERENT VOLUMES (FROM LEFT 2, 4, 6, 8 AND 10 µL OF STOCK SOLUTION CONTAINING 1 MG/ML OF EACH VITAMIN) USING THE SILICA-WATER TLC SYSTEM . THE RF VALUE OF EACH VITAMIN IS LISTED IN TABLE 4. .......................................................................................... 126
FIGURE 4. 5 ELUTION OF THE HYDROTHERMAL TREATED YEAST SAMPLES IN THE SILICA-WATER TLC SYSTEM. EACH SAMPLE AT THE INDICATED TEMPERATURE HAS BEEN REPLICATED 3 TIMES ON THE PLATE. ........................................................................................... 128
FIGURE 4. 7 CHROMATOGRAM OF THE HYDROLYSED SAMPLE AND THE SAME SAMPLE SPIKED WITH NICOTINIC ACID ....................................................................................................................... 131
FIGURE 4. 8. TOTAL PROTEIN CONCENTRATION IN DIFFERENT AUTOLYZED SAMPLES.......... 134 FIGURE 4. 9 HPLC CHROMATOGRAM OF CONTROL SAMPLE (TOP) AND AUTOLYZED SAMPLE
(BOTTOM) AFTER 22 HOUR OF STIRRING AT ROOM TEMPERATURE (CONTROL) AND 55 °C (AUTOLYZED SAMPLE-EXP2) ........................................................................................................... 136
FIGURE 4. 10 NICOTINIC ACID PEAK AT 4.95 MIN AND THE UV SPECTRUM OF THE OBSERVED PEAK (NO. 1) COMPARED TO THE ONE FOR STANDARD NICOTINIC ACID (NO.2) ON TOP RIGHT OF THE FIGURE ....................................................................................................................... 137
FIGURE 4. 11 NICOTINIC ACID PEAK FOR THE AUTOLYZED SAMPLE AT DIFFERENT TIMES DURING AUTOLYSIS REACTION...................................................................................................... 138

FIGURE 5. 1 HEATING UP PROFILE FOR THE 300 ML PARR REACTOR CONTAINING 250 ML SAMPLE AND THE TUBULAR REACTOR CONTAINING 3 ML SAMPLE. TEMPERATURE WAS SET TO 200 C IN BOTH REACTORS................................................................................................... 146
FIGURE 5. 2 CHROMATOGRAM OF HYDROLYSED SAMPLE ANALYZED WITH ANALYTICAL HPLC (TOP) AND INJECTED TO SEMI-PREP COLUMN FOR FRACTIONATION (BOTTOM). THE PEAK OF INTEREST WAS ELUTING AT 18.5 IN HPLC AND 36 IN SEMI-PREP SYSTEM......... 150
FIGURE 5. 3 MASS SPECTRUM FOR THE COLLECTED PEAK FROM HPLC IN QUADROPOLE POSITIVE ION MASS SPECTROSCOPY (A) WITH 127.3 AS HMF (AND A H) AND THE STRUCTURE AND FRAGMENTS OF THE HMF MOLECULE (B) .................................................. 151
FIGURE 5. 4 EFFECT OF TEMPERATURE AND TIME ON THE HYDROLYSIS OF Β-GLUCAN OF THE YEAST CELL WALL, EXPERIMENTAL DATA AND KINETIC MODEL (SOLID LINES)............ 153
FIGURE 5. 5. CALIBRATION CURVE FOR ETHANOL MEASUREMENT USING HPLC-RI ................. 154 FIGURE 5. 6 HPLC CHROMATOGRAMS FOR THE SLURRY AFTER BATCH HYDROTHERMAL
TREATMENT (A) 175 °C FOR 20 MINUTES (B) 225 °C FOR 6 MINUTES (C) 275 °C FOR 6 MINUTES................................................................................................................................................ 155
FIGURE 5. 7 YIELD OF MONOSACCHARIDE RELEASE AFTER THE HYDROLYSIS OF THE YEAST CELL WALL AT TEMPERATURES BETWEEN 175°C AND 250 °C. YIELD WAS CALCULATED BASED ON THE MOLE OF MONOSACCHARIDES IN THE LIQUID PHASE TO THE AMOUNT IN THE STARTING SOLIDS IN FEED ...................................................................................................... 156
FIGURE 5. 8 DETERMINATION OF THE REACTION RATE CONSTANTS FOR THE HYDROLYTIC DEGRADATION OF YEAST CELL WALL BASED ON THE DATA OBTAINED FROM CARBOHYDRATE ANALYSIS ............................................................................................................ 159
FIGURE 5. 9 (A) YIELD OF MONOSACCHARIDES DUE TO THE YEAST CELL WALL HYDROLYSIS AT TEMPERATURES BETWEEN 175°C AND 250 °C. YIELD WAS CALCULATED BASED ON THE MOLE OF MONOSACCHARIDES IN THE LIQUID PHASE TO THE AMOUNT IN THE STARTING BIOMASS (B) Β-GLUCAN CONVERSION AT DIFFERENT TEMPERATURES AND TIMES (SOLID LINE ARE CONNECTING LINES) ............................................................................ 164
FIGURE 6. 1 EXTRACTION SCHEME USING A SOLUTION OF ACETONE:WATER:HCL (70:29:1) TO
RELEASE THE DESORBED PHENOLIC COMPOUNDS FROM YEAST CELLS............................ 172 FIGURE 6. 2. THE CALIBRATION CURVE IN THE FOLIN-CIOCALTEU ASSAY (ABSORBANCE
MEASURED AT 765 NM AND 3 REPLICATES WERE PREPARED FOR EACH POINT).............. 175 FIGURE 6. 4. METHOD DEVELOPMENT AND THE CHROMATOGRAM OF PHENOLIC MIXTURES
AT DIFFERENT ORGANIC PHASE RATIO (A) AND THE OPTIMIZED FINAL METHOD WHICH USED FOR THE STUDY (B) ................................................................................................................. 179
FIGURE 6. 5. CHROMATOGRAM OF THE CRUDE SUBSTRATE (A) AND THE SUBCRITICAL WATER EXTRACT AT 225 °C AND 15 MINUTES AND BREAKDOWN OF MAJOR DETECTED PHENOLIC COMPOUNDS (PHENOLIC PEAKS WERE 1-CHLOROGENIC ACID, 2- P-COUMARIC ACID AND 3-PHLORIDZIN DIHYDRATE) ........................................................................................ 182
FIGURE. 6. 6. TOTAL PHENOLIC CONTENT (TPC) OF CIDER YEAST RELEASED THROUGH HYDROTHERMAL TREATMENT PROCESS. ERROR BARS REPRESENT STANDARD DEVIATION (N=3)................................................................................................................................. 183
FIGURE 6. 7 TOTAL PHENOLIC CONTENTS OF YEAST EXTRACTS AT DIFFERENT TIMES AFTER BEING TREATED AT 200 °C IN DIFFERENT SOLID CONCENTRATION (P=100 BAR).............. 185
FIGURE 6. 8 TOTAL PHENOLIC CONTENT (PER G OF YEAST) OF WASHED CELLS BEING EXTRACTED WITH ORGANIC SOLVENT IN A 3-STEP SOLVENT WASH PROCESS. ERROR BARS REPRESENT STANDARD DEVIATION (N=3)........................................................................ 187
FIGURE 6. 9 HPLC CHROMATOGRAM OF (A) CRUDE SAMPLE AND TREATED ONES AT DIFFERENT TEMPERATURES ((B) 100°C AFTER 30MIN, (C) 150 °C AFTER 30 MINUTES AND (D) 200°C AFTER 30 MINUTES). COMPOUNDS WERE IDENTIFIED BY COMPARING THE RETENTION TIME OF STANDARDS WITH EXISTING PEAKS IN THE SAMPLES. IDENTIFIED PHENOLICS WERE (1) CAFFEIC ACID (2) CHLOROGENIC ACID, (3) EPICATECHIN, (4) P-COUMARIC ACID AND (5) PHLORIDZIN DIHYDRATE. (WAVELENGTH= 270NM) ................ 189
FIGURE 6. 10 .CHLOROGENIC ACID DESORPTION FROM YEAST CELLS AFTER HYDROTHERMAL TREATMENT (A) AND ORGANIC SOLVENT EXTRACTION (B). ................................................. 191
FIGURE 6. 11 DAD-UV SPECTRUM OF THE CRUDE AND TREATED SAMPLES ELUTING FROM THE HPLC COLUMN. (A) CRUDE SAMPLE, (B) 150 °C AFTER 30 MINS AND (C) 225 °C AFTER 30 MINS. CHROMATOGRAMS ARE NORMALIZED TO THE IN THE LOGARITHMIC SCALE ..... 193

FIGURE 6. 12 UV-SPECTRA OF THE TWO IDENTIFIED COMPOUNDS IN THE EXTRACT OF SUBCRITICAL WATER TREATED SAMPLES .................................................................................. 194

Tables in Text TABLE 2.1. PROPERTIES OF WATER UNDER DIFFERENT CONDITIONS (ADAPTED FROM (Y. YU
ET AL. 2008)) 13 TABLE 2.2. CHEMICAL REPRESENTATIVES OF BIOMASS FEEDSTOCKS AND REACTION
INTERMEDIATES ENCOUNTERED IN HYDROTHERMAL PROCESSING (ADAPTED FROM (PETERSON 2009)) 24
TABLE 2.3. BIOMASS POTENTIAL IN THE EU (EUROPEAN COMMISSION, 2006) (CLARK & DESWARTE 2008) 25
TABLE 2.4. CHEMICAL COMPOSITION OF SELECTED PLANTS IN % OF TOTAL DRY MATTER (ADAPTED FROM (ORTWIN BOBLETER 1994A)) 25
TABLE 2. 5. ACTIVATION ENERGY FOR CELLULOSE SOLUBILISATION FROM DIFFERENT STUDIES 32
TABLE 2.6. RATE CONSTANTS FOR THE PROPOSED GLUCOSE DECOMPOSITION PATHWAY (B. KABYEMELA ET AL. 1999) 41
TABLE 2.7 NEW TOP CHEMICAL OPPORTUNITIES FROM BIOREFINERY CARBOHYDRATES, CRITERIA FOR THEIR INCLUSION AND RESULTING TECHNOLOGY (ADAPTED FROM (BOZELL & PETERSEN 2010) 45
TABLE 2. 8 YIELD OF HMF PRODUCTION FROM GLUCOSE IN DIFFERENT SYSTEMS 51 TABLE 2. 9 CHEMICAL STRUCTURE AND PROPERTIES OF NICOTINIC ACID AND NICOTINAMIDE
66 TABLE 2. 10 CONCENTRATION OF VITAMIN B’S IN YEAST (KIRK-OTHMER 2000) 67 TABLE 2. 11 STRUCTURES OF HYDROXYBENZOIC ACIDS (A) AND HYDROXYCINNAMIC ACIDS
(B) (ADAPTED (MORENO-ARRIBAS & POLO 2009) 74 TABLE 4. 1 CONDITIONS USED FOR AUTOLYSIS EXPERIMENTS ...................................................... 124 TABLE 4. 2 VALUES FOR RETENTION FACTOR (RF) OF VITAMINS ON SILICAGEL PLATES AND
WATER AS THE MOBILE PHASE....................................................................................................... 127 TABLE 4. 3 NICOTINAMIDE CONCENTRATION IN AUTOLYZED SAMPLE AT DIFFERENT TIMES
DURING THE AUTOLYSIS .................................................................................................................. 140 TABLE 5. 1 RATE CONSTANTS FOR THE DECOMPOSITION OF THE CELL WALL
POLYSACCHARIDES (MINUTES-1)................................................................................................... 160 TABLE 5. 2 RATE CONSTANTS FOR GLUCOSE (AND MANNOSE) AND HMF DECOMPOSITION
(MINUTES-1).......................................................................................................................................... 165
TABLE 6. 1 DESCRIPTION OF GRADIENT ELUTIONS USED IN METHOD DEVELOPMENT............ 180 TABLE 6. 2 RETENTION TIME(RT) OF THE PHENOLIC PEAKS IN DIFFERENT METHODS............. 181 TABLE 6. 3. DETAILS OF ONE-WAY ANOVA TO INVESTIGATE CORRELATION OF SOLID RATIO
AND SOLVENT EXTRACTION ........................................................................................................... 186

CHAPTER 1- INTRODUCTION
1
Chapter 1
1.1 Background and aims
Current trends on climate change and depletion of natural resources has accelerated the
research on possible alternatives for energy and chemicals in the recent decades. While
studies highlight the growing demand for renewable resources, the search for sustainable
sources of energy and derivatives is still evolving. The quest for alternative sources arises
mainly from the limited supplies of hydrocarbon sources, the negative impacts of their
consumption and its detrimental effect on environment and also the political instability
associated with energy supply. Even though, fossil fuels have been an efficient option for
energy and material production, which is based on petroleum chemistry and has been
developed and optimized since 19th century (Lyko et al. 2009).
In practice, our options are only restricted to resources which are cheap, abundant,
easily renewable and have the potentials of deriving other materials and products from them.
In addition, carbon-neutrality will be valued as it has been demonstrated in the praised
energy supplies such as nuclear, wind, solar and hydroelectric. All of these options come
INTRODUCTION

CHAPTER 1- INTRODUCTION
2
with some hurdles and disadvantages while they meet the required considerations for carbon-
neutrality as the net production of carbon is zero after being consumed (S. Chen 2008).
The major feasible and sustainable resource for energy and chemical derivatives with
zero or reduced carbon emission is biomass. It is an ideal renewable resource as it can be
replenished over a relatively short timescale compared to other limited resources such as
crude oil, coal, and natural gas (Clark & Deswarte 2008). Recent estimates show that nature
produces more than 170 billion metric tons of biomass per year by photosynthesis while
carbohydrates form 75% of it (Corma et al. 2007). Since biomass is also used as food, or
constitutes part of the human and animal food chain, it is imperative to employ all possible
techniques to use it in the most efficient manner possible or preferably use the non-food
biomass resources (such as wood and agricultural wastes).
Current technologies to convert biomass to fuel are mainly based on three methods:
First, fermentation wherein the sugars in biomass are converted to ethanol. Second, biodiesel
process where oil fraction of biomass is converted to alkyl esters and finally gasification
which results in the accumulation of fuel gases such as hydrogen. Most of the existing
biomass conversion plants are based on one main product, e.g. biodiesel or bioethanol. Using
the same approach which was undertaken during the development of oil refineries, more
efficient processes will be obtained where biomass is converted to a variety of potential
components other than fuels, such as chemicals or feedstocks for other syntheses steps (Lyko
et al. 2009).
In this project, subcritical water at temperatures below 300 °C was investigated as a
milder reaction medium for the conversion of cider lees waste to valuable products
(monosaccharides, phenolic and platform chemicals). The hydrolytic condition leads to the
disruption of the yeast cell walls and the release of intracellular nutrients or may be used for

CHAPTER 1- INTRODUCTION
3
the production of other intermediates (amino acids, nucleotides, lipids). The proposed
process was further studied by characterisation and measurement of the generated
compounds to measure the possibility of replacing traditional disposal techniques (i.e.
incineration or drying), while providing extra ervenues by manufacturing new products.
The crude substrate in this project was mainly comprised from yeast cells which about
20% of its dry mass is formed of cell wall. The slightly different molecular structure in the
yeast β-glucan, compared to the one in cellulose, was believed to demand milder conditions
for its breakdown and conversion to other monomers. In addition, the application of crude
biomass was used in order to enhance the current knowledge of hydroxymethyl furfural
(HMF) synthesis from different and non-treated feedstocks. This was complimentary to the
extensive researches available on applying similar processes to pure monomers for HMF
production with limited application for large scale production (Bicker et al. 2003; Asghari &
H. Yoshida 2006; Claude Moreau et al. 1996; Ishida & Seri 1996; C. V. McNeff et al. 2010;
Claude Moreau et al. 1996).
The motivation for this research has also been to asses the hydrothermal process
(referred in this work as Sub-critical water mediated hydrolysis) of cider lees, as a route to
obtain higher value chemicals and extracts and also an alternative waste treatment to the land
disposal and incineration. To investigate the possibility of reusing the extracts and feasibility
of the process for the production of valuable chemicals, it was of special interest to study the
properties of the extracts using different analytical techniques. The main analytical steps
include carbohydrate measurement and identification of their derivatives and also other
valuable compounds which have been released from biomass (such as proteins,
polyphenolics and phenolic monomers) with possible application in food and cosmetic
industries.

CHAPTER 1- INTRODUCTION
4
1.2 Structure of the thesis
Although each result chapter provides an introduction to the discussed topic, a
comprehensive review of the current knowledge and recent progresses in hydrothermal
conversion of biomass has been provided in the review of previous studies (chapter 2). This
chapter provides a detailed overview of the current biomass conversion processes used with
the focus on sub- and supercritical water.
The results of subcritical mediated hydrolysis of cider lees and the chemical
composition and physical properties of the extracts were discussed in chapter 3. This chapter
covers the results from total protein measurement, total organic carbon (TOC), total mass
balance for the liquid and solid fractions of hydrolysates, total phenolic content (TPC) at
different temperatures and times
The spent yeast cells were subjected to autolysis reaction and the results were
discussed in chapter 4. Vitamin B3 was determined in autolysed samples which was in
contrast to the subcritical water hydrolysis extracts. The main objective of this chapter was to
find out if vitamin B3 can be derived from this feedstock using subcritical water mediated
hydrolysis as yeasts are a known to be a good source of vitamin B3 and its derivatives
The prospects of using subcritical water to convert cider lees to chemicals was studied
in more detail in chapter 5. It was shown that due to the presence of a carbohydrate backbone
in the yeast cell wall and the hydrolytic nature of the reaction medium, degraded products
(monosaccharides) and other dehydrated derivatives (e.g. HMF) could be obtained. The
conversion and yield of solid solubilization were determined and used to study the kinetics of
the hydroxymethylfurfural formation. The results from this chapter were compared to other
studies where other biomass sources such as cellulose were used. It was proposed that the
milder hydrolysis conditions obtained for yeast cell hydrolysis was due to the different types

CHAPTER 1- INTRODUCTION
5
of glycosidic bonds in glucan chain, and hence more flexible structure in the yeast cell walls
when compared to cellulose.
In chapter 6 the phenolic compounds which were identified in chapter 3 were further
studied and characterised. It was shown that the phenolic compounds which had been
adsorbed by the yeast cell walls during the fermentation. These phenolic compounds can be
released in subcritical water medium and the degree of desorption can be related to the
reaction temperature. The release of these compounds were also compared to a typical
organic solvent extraction and the results were discussed.
Chapter 7 is the overall conclusion and future work chapter which considers all the
discussed chapters and propose additional or complimentary steps which can support this
work by providing more data and study the alternative applications for this type of biomass

Chapter 3- PROPERTIES OF THE SUBCRITICAL WATER TREATED EXTRACTS
6
Chapter 2
2.1 Supercritical Fluids and Their Applications
Based on the Gibbs phase rule, a pure component can be observed in three different
phases, which is determined by only two independent state variables. However, a pure
component whose temperature and pressure are above its critical temperature (Tc) and
critical pressure (Pc) is in supercritical state which is not a liquid nor a gas (Fig 2.1). The
critical temperature is the maximum temperature at which a liquid can be formed by
isothermal compression and the critical pressure is the highest vapour pressure that can be
exerted by the liquid (T. Clifford 1998).
At supercritical state, fluids (liquids or liquefied gases) attain peculiar properties which
can not be observed in other regions of their phase diagram. The physical properties of the
fluids, such as heat capacities Cp and Cv, thermal conductivity, Prandtl number, thermal
conductivity, change dramatically and become very large. However, viscosity and density of
liquids become similar to gases which make them more applicable for extraction purposes.
These properties are easily adjustable by change in the pressure or temperature of the system.
Supercritical fluid (SCF) extraction has been widely studied and applied for different
purposes in the last three decades. The main industries which have observed the application
LITERATURE REVIEW

Chapter 3- PROPERTIES OF THE SUBCRITICAL WATER TREATED EXTRACTS
7
of these technologies use SCF in the extraction of hops, decaffeination of coffee, isolation of
flavours and antioxidants from plants and natural resources (T. Clifford 1998). Carbon
dioxide (CO2) plays the main role in this technology due to its attractive properties as a non-
toxic, cheap and abundant solvent which requires lower energy and operating costs due to its
easily achievable critical point.
In addition to the extraction, other applications for SCF’s which have been extensively
investigated and developed are as below:
Figure 2.1 The phase diagram of a single substance (Clifford, T., 1998)

Chapter 3- PROPERTIES OF THE SUBCRITICAL WATER TREATED EXTRACTS
8
• Material and Polymer Production
• Food Processing
• Supercritical Fluid Chromatography
• Reactions
• Environmental Applications
Different chemicals have been investigated for their specific characteristics in their
supercritical region. Besides CO2, water is one of the most studied liquids and its application
when is hot and compressed dates back to early 70 s in the last century. Due to its important
role in this project, as the main reaction medium in the experiments, subcritical water
properties and its applications are reviewed and compared to supercritical states.
2.2 Subcritical and Supercritical Water
2.2.1 Introduction
Comparing to other supercritical fluids, supercritical water is a recent addition to the
list of intensively studied supercritical fluids (Afonso & Crespo 2005). Water has a high
critical temperature (T=647.1 K =374 °C) and pressure (p=22 MPa) where in most of
industrial applications may be regarded out of reach due to the cost of the high pressure
apparatus and the required energy. Traditionally, the main area of application for high
pressure steam has been the power plant cycles or hydrothermal reactions for water at
superheated conditions. However, its unique properties at these conditions have been
considered attractive for many applications such as alternative fuels, coal and biomass
conversion and waste disposal. These latest applications were mainly started in the late 70s
when the first oil crisis occurred and at the same time, there was increasing concerns about
the environmental impacts of traditional chemical processes and application of supercritical
fluids (G. Brunner 2009).

Chapter 3- PROPERTIES OF THE SUBCRITICAL WATER TREATED EXTRACTS
9
2.2.2 Properties of near critical water
Subcritical water (which also has been referred in literature as hot compressed water
(HCW), superheated water, high temperature water (HTW), pressurised hot water) exhibits
properties which are different from those of water at ambient temperature. Water changes
from a solvent for ionic species to a solvent for non-ionic species when it pressurized and
heated from ambient to near its critical point and beyond (G. Brunner 2009). These changes
can be divided into two categories of microscopic and macroscopic properties. When
compared this way, these changes may seem contradictory sometimes. For example, water
becomes more nonpolar at these conditions while the individual molecules are still polar.
This, however, has resulted in specific properties of water make it suitable for some reactions
(Kruse & Dinjus 2007b). These properties are discussed further in following sections.
2.2.2.1 Microscopic properties
Hydrogen bonds
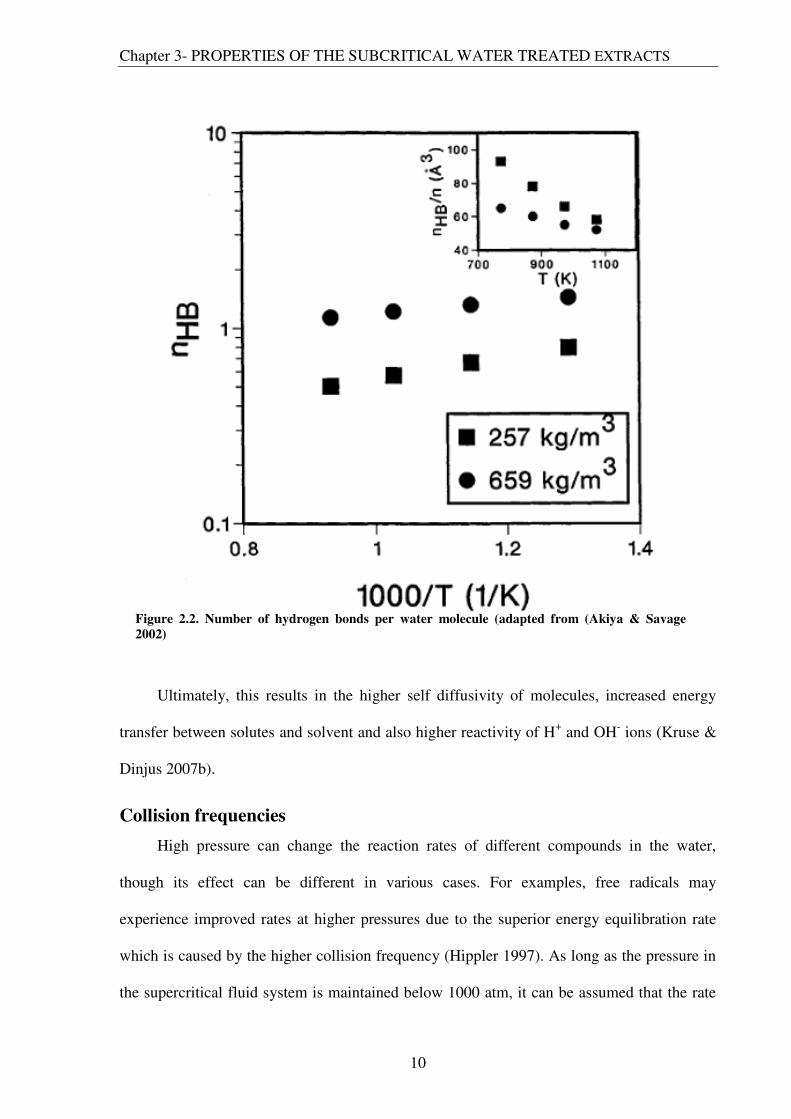
Increasing the temperature of compressed water as liquid, will result in lower hydrogen
bonds between water molecules which has been demonstrated previously by Coitisno et al.
(Coitino et al. 1994). The breakdown of hydrogen network, which is also in direct relation to
density (Fig. 2.2), increases the dynamics of water molecules, cause the formation of
“clusters” of water molecules and leads to an increased mobility of single water molecules
(Akiya & Savage 2002).
Chapter 3- PROPERTIES OF THE SUBCRITICAL WATER TREATED EXTRACTS
10
Ultimately, this results in the higher self diffusivity of molecules, increased energy
transfer between solutes and solvent and also higher reactivity of H+ and OH- ions (Kruse &
Dinjus 2007b).
Collision frequencies
High pressure can change the reaction rates of different compounds in the water,
though its effect can be different in various cases. For examples, free radicals may
experience improved rates at higher pressures due to the superior energy equilibration rate
which is caused by the higher collision frequency (Hippler 1997). As long as the pressure in
the supercritical fluid system is maintained below 1000 atm, it can be assumed that the rate
Figure 2.2. Number of hydrogen bonds per water molecule (adapted from (Akiya & Savage
2002)

Chapter 3- PROPERTIES OF THE SUBCRITICAL WATER TREATED EXTRACTS
11
of diffusion of free radicals dominates higher pressure effects and are higher than in liquids
(Subramaniam & McHugh 1986). On the other hand, reactions which occur with higher-
molecule mass compounds, e.g. reactions taking place during pyrolysis, are affected by the
cage-effect which is a result of applying high pressure to water. Due to this effect, reaction
rates are shown to be affected and decrease slightly (Ederer et al. 1999).
Dipole moment
The permanent dipole of the water molecule makes it very reactive in many reactions
such as hydrolysis. It has been shown that it can take part during the activation steps of the
reactions such as oxidation of the organic compounds (Kruse & Dinjus 2007b). After being
heated and compressed, however, water structure can be influenced by the change in the
function of pair correlation which can be due to the modification in the tetrahedral
coordination and at the same time higher numbers of water molecule clusters. In practice, the
structure of water at such conditions is an average of these two parameters.
2.2.2.2 Macroscopic properties
Similar to other fluids that approach their critical point, the properties of the vapour
phase and liquid phase become very similar and finally identical. Supercritical water,
however, shows various densities at different conditions which range from liquid-like to gas-

Chapter 3- PROPERTIES OF THE SUBCRITICAL WATER TREATED EXTRACTS
12
like values while there is no phase change throughout these conditions. Figure 2.3 indicates
how these properties change while Table 2.1 listed some exact values for subcritical and
supercritical water at selected conditions.
Figure 2.3. Properties of pure water at 250 bar as a function of temperature (Akiya & Savage 2002)

Chapter 3- PROPERTIES OF THE SUBCRITICAL WATER TREATED EXTRACTS
13
Table 2.1. Properties of water under different conditions (adapted from (Y. Yu et al. 2008))
Water Condition ordinary(STP)
water
subcritical
water
supercritical
temperature T (°C) 25 250 400 400
pressure p (MPa) 0.1 5 25 50
density ρ (g cm−3) 1 0.80 0.17 0.58
dielectric constant ε 78.5 27.1 5.9 10.5
pKw
* 14.0 11.2 19.4 11.9
* ionic product of water
Dielectric constant
Dielectric constant (or relative static permittivity) of a material is a measure of the
extent to which it concentrates electrostatic lines of flux. During a reaction, a high relative
dielectric constant reduces the activation energy of a reaction with transition state of higher
polarity compared to the initial state (Kruse & Dinjus 2007b). The change in the extent of
hydrogen bonding affects the dielectric constant of water which is demonstrated in Fig 2.3.c.
For example, the dielectric constant of water at ambient temperature (25 °C) is 81 which
drops to 21 at 300 °C and further decreased to only 4.1 at 500 °C which is very similar to
non polar organic solvents such as pyridine and methylene chloride. This means that water at
these conditions shows higher solvent strength towards organic and nonpolar compounds.
The drop in dielectric constant will affect the miscibility of water as well, which is discussed
below.

Chapter 3- PROPERTIES OF THE SUBCRITICAL WATER TREATED EXTRACTS
14
Miscibility
Water is known to be a poor miscible liquid with gases, organic solvents and
hydrocarbons while it is a good solvent for ionic salts because of its significant dielectric
constant (Kruse & Dinjus 2007a). However, this changes at near critical conditions as its
density decreases and becomes a poor solvent for salts and becomes miscible with many
organic compounds and gases. The relation between solvent properties and its temperature
and pressure can be employed to precipitate particles or progressing homogenous reactions
of organic compounds with gases such as oxidation of organic compounds with oxygen and
air (Kruse & Dinjus 2007b).
Ionic product
The ionic product of water increases with temperature up to 10-11 near its critical
temperature while it drops at temperatures more than critical temperature and increases with
pressure. In other words, subcritical or supercritical water can act as a weak acid or alkali
catalyst and promote the rates of various reactions which can be catalyzed by acid or alkali to
some extent.
2.3 Sub- and Supercritical Water Applications
2.3.1 Extraction
In addition to synthetic reactions, subcritical water has been reported as an excellent
solvent for extraction of various components from biological matrixes. This is mainly due to
the enhanced solubility of nonpolar substances at elevated temperatures which improves its
extraction power. Water at these conditions can also facilitate the extraction process by
reducing and cleavage of bonds and binding forces in the sample matrix. Subcritical water
extraction has been applied in cleaning of the soil and removing PAH (polycyclic aromatic

Chapter 3- PROPERTIES OF THE SUBCRITICAL WATER TREATED EXTRACTS
15
hydrocarbon) and metals (Hashimoto 2004; G. Brunner 2009). In biological samples, it has
been extensively studied for the extraction of different nutrients and extracts such as
lipophilic products from vegetable oils and seeds (J. W. King 2008), polyphenolics from
fruits and rice bran (Rangsriwong et al. 2009; Pourali et al. 2010), antioxidants from the
leaves of eucalyptus (Kulkarni et al. 2007) or rosemary plant (Ibañez et al. 2003), proteins
and amino acids from rice bran (Sereewatthanawut et al. 2008) and flavour compounds from
rosemary (Basile et al. 1998). In few studies, this process has been successfully coupled to
other auxiliary steps such as ultrasonic (Roldán-Gutiérrez et al. 2008) or microwave systems
(Raman & Gaikar 2002) to enhance the extraction from biological samples.
Subcritical water extraction has the main advantage as all other aqueous reactions
where water replaces organic solvents and offers environmental and cost benefits to the
process. In particular, subcritical water has unique characteristics such as high density, high
reactivity, strong solubility and supplementary catalytic activity
2.3.2 Reaction Medium
The unique properties of water at high temperature provide an excellent solvent for
many applications. It is a benign, cheap, abundant and environmental friendly solvent which
can show tendency toward becoming nonpolar at high temperatures and pressures. Two
major types of reactions which take place in super- and subcritical water are oxidisation and
hydrolysis that have been widely used in waste and biomass conversions (Lamoolphak et al.
2007). Oxidation takes place in supercritical water and is employed in a process called
supercritical water oxidation (SCWO) to destroy toxic organic compounds in industrial
wastes. Hydrolysis, on the other hand, can occur in milder conditions (subcritical water) and
is the cleavage of ether or ester bonds by addition of one water molecule which breaks down
certain polymer molecules. Due to the existing ether bonds in carbohydrates, the hydrolysis

Chapter 3- PROPERTIES OF THE SUBCRITICAL WATER TREATED EXTRACTS
16
of carbohydrate can be easily carried out in hydrothermal conditions. As a reaction medium,
subcritical water can provide an opportunity to conduct chemistry in a homogenous phase
that would occur in heterogeneous mediums under conventional conditions (Y. Yu et al.
2008). This implies that there is the chance of changing reaction dominant entities from ionic
compounds to free radicals by modifying water density.
The role of subcritical and supercritical water in organic reactions can be classified into
two main subgroups:
• Water as a reactant/product, which includes the role of the individual molecules
in the reaction as a reactant or product such as hydrolysis, hydration, hydrogen
exchange and free-radical oxidation
• Water as catalyst, which includes its application in reactions that acts as a
source of acid or alkali and modifies the transition states. Examples of this type
of application can be various organic reactions such as alcohol dehydration
process, Friedel-Crafts alkylation and aldol condensation.
In many applications, water can act as both a catalyst and reactant such as hydrothermal
treatment, which was addressed in our project and will be discussed in detail in following
sections.
2.4 Sub- and Supercritical Water and Biomass Transformation
2.4.1 Biomass as a source of energy and chemicals
While coal and crude oil resources come from carbon dioxide fixed by nature through
photosynthesis, they are considered as limited and non-renewable. On the other hand,
biomass and other resources like solar, wind and tides are renewable as they can be

Chapter 3- PROPERTIES OF THE SUBCRITICAL WATER TREATED EXTRACTS
17
replenished continuously and in a shorter time cycles while biomass provides a close-loop
for CO2 (Clark & Deswarte 2008).
The interest in alternative energy resources, especially in biomass increased during late
70’s and early 80’s due to the sudden increase in the fossil fuels price leading to more studies
on alternative resources for fuels and chemicals. The United States Department of Energy
(DOE) reported that the global bioenergy capacity is 293 x 1012 megajoules where only
2.86 x 10¹² megajoules was available in the USA, most from the pulp and paper industry
(Midgett 2008). Biomass conversion platforms are constantly increasing throughout the U.S.
and world primarily by the production of bio-ethanol, biodiesel and bio-hydrogen.
An early example of these studies was carried out by the US Bureau of Mines in 1971
in order to investigate the utility of pressurized hot water to liquefy carbohydrates in the
presence of Na2CO3 and CO (Appell et al. 1971). Applying catalysts to the reaction medium
was carried out in earlier works to increase the yield of H2 while later studies pointed out the
negative effect of the addition of these compounds on the overall yield of the hydrogen
(Molton et al. 1978). The next development was carried out in Pittsburgh Energy Research
Centre (PERC) to study the oil-based and aqueous slurry liquefaction processes in early
1980’s. Lawrence Berkeley Laboratory (LBR) process was a similar once-through process
which its focus was to minimize the cost of recycling large quantities of oil, as it used water
as the carrier in contrast to PERC which used oil. Another important development, using
higher concentration of feeds, was Sludge to Oil Reactor System (STORS) where continuous
processing of the biomass was developed in the Batelle Pacific Northwest laboratories.
However, the low price of oil in the 80’s curbed any significant technological and
commercial advanced in this area (Midgett 2008).
Chapter 3- PROPERTIES OF THE SUBCRITICAL WATER TREATED EXTRACTS
18
Later during last years of 20th century, the research on biomass processing was
emphasized again due to the further economical and environmental incentives. These studies
were in parallel to the new developments in both homogeneous and heterogeneous catalytic
processes (Baker et al. 1989; Douglas C. Elliott et al. 2006). The increasing number of
works, which proceeds until now far, highlights two main perspectives:
• The potentials of biomass as a source of different chemicals which can be use
either as the final product or intermediate molecules for other products.
• Improved reaction parameters and yield for the formation of biogas, bio-oil or
liquid biofuels
Further development of using biomass for energy purposes and increasing interest in
different derivable chemicals resulted in the formation of biorefinery concept. Applying
biorefinery concept results in the integration of different material and energy streams that
can be fractioned from the starting material, i.e. biomass feedstock. Different techniques
have been proposed for the hydrolysis and conversion of wet and dry biomass and waste
streams, mainly non-food plant materials such as straw and wood, in order to provide the
necessary substrate for the secondary steps (such as bioethanol fermentation). Biomass
hydrolysis can be carried out using chemicals such as acids or alkali, enzymes, hydrothermal
treatment or the combination of these techniques like thermo-chemical routes. During
hydrolysis in water, water can act as solvent, reactant and catalyst via self-dissociation
though often is accompanied by other acid or alkali catalysts to inhibit undesired side
reactions (Akiya & Savage 2002). In particular, the addition of CO2 to the medium, which
increases the hydronium ions, has been of interest in the application of several feedstocks
(He et al. 2008).
Chapter 3- PROPERTIES OF THE SUBCRITICAL WATER TREATED EXTRACTS
19
The high temperature of water will promote the hydrolysis reaction into greater
extents. At lower temperatures (subcritical region, 100-250 °C), the main focus is to
fractionate the waste biopolymers to prepare a mixture of monomers or intermediates for
further applications. Apart from the role of water which promotes hydrolysis, it has been
reported that there are degrees of autocatalysis due to the generated acidic products
(Knez ̌ević 2009).
At higher temperatures (250-400 °C), liquefaction is the main reaction which
transforms wood or other cellulosic biomass sources to fuel gas and oil (G. Brunner 2009).
When the medium is deprived from oxygen, the pyrolysis occurs resulting in bio-oil residues
which can be used to derive valuable chemicals or alternative fuels (Yaman 2004; Demirbas
2000). Pyrolysis is favoured over ionic reactions at lower pressures, lower densities (gases)
and higher temperatures (Knez ̌ević 2009). In the presence of nickel and alkali salts, methane
is produced under such temperatures as well (eq. 1), which is for ideal conversion of glucose
to methane:
C6H12O6 3 CH4 + 3 CO2 (1)
Ultimately, the medium will be dominated by gasification reaction (conversion of
organic compounds to hydrogen, carbon monoxide, carbon dioxide and methane) at higher
temperatures (> 400°C) where hydrogen will be the main product in the supercritical water
following equation (2) which is based on ideal conversion of glucose to hydrogen:
C6H12O6 + 6H2O 12H2 + 6CO2 (2)
The presence of alkali salts often improves the hydrogen yield. Some efforts have also
been made to carry out the hydrogen production at lower temperatures using different
catalysts such as ZrO2 (Watanabe et al. 2002) and reduced nickel (Ni) (Minowa & Ogi 1998).

Chapter 3- PROPERTIES OF THE SUBCRITICAL WATER TREATED EXTRACTS
20
Typically, one overall objective of the conversion of biomass into fuels is to remove
oxygen from the feedstock (which is about 40-60 wt % in biomass where fuels and oils have
typical values of 1% wt) (Peterson 2009). Oxygen removal under subcritical conditions can
proceed via the following reactions: dehydration, decarboxylation and decarbonylation. The
net effect of deoxygenation under these conditions is the CO2 and H2O formation (Knez ̌ević
2009). Oxygen removal occurs most readily via dehydration as oxygen can be eliminated as
water or by decarboxylation which oxygen leaves the biomass as CO2.
To provide a better understanding of the chemistry of subcritical water conversion of
biomass and its potentials as a source of chemical derivatives, biomass and its chemistry are
discussed below which concludes by an overview of the spent yeast, as the used biomass in
this project.
2.4.2 Biomass: Chemistry and its Properties
Biomass can be described as any hydrocarbon compound which consists of carbon,
hydrogen, oxygen and nitrogen and is available on a recurring basis (Fig 2.4) (Clark &
Deswarte 2008).

Chapter 3- PROPERTIES OF THE SUBCRITICAL WATER TREATED EXTRACTS
21
While inorganic compounds are seldom identified in biomass, some types of biomass
can carry significant proportions of these chemicals (up to 15% in herbaceous biomass)
which accumulate as the ash fraction after burning. Due to the growing application of
biomass in different industrial contexts, the term “industrial biomass” can be defined as “any
organic matter that is available on a renewable or recurring basis (excluding old-growth
timber), including dedicated energy crops and trees, agricultural food and feed crop residues,
aquatic plants, wood and wood residues, animal wastes, wastes and co-wastes of food and
feed processing and other waste materials usable for industrial purposes (energy fuels,
chemicals, materials) (B. Kamm et al. 2006).
Figure 2.4. Different types of biomass (adapted from (Clark & Deswarte 2008)

Chapter 3- PROPERTIES OF THE SUBCRITICAL WATER TREATED EXTRACTS
22
A large proportion of the biomass is wet biomass which can contain up to 95% water
and the direct use of this type of biomass is expected to be more feasible comparing to the
technologies used for dry biomass conversion. Also, the conversion technologies usually
benefits the wet wastes as they face a high cost of disposal via incineration, drying etc
(Kruse & Dinjus 2007a).
The two most abundant types of biomass are wood (lignocellulosic biomass) and crops
(starch based biomass such as maize, wheat and rice). The primary products which are
accumulated in vegetable biomass are C6- and C5-sugars that form cellulose (by
polymerization of glucose) and hemicellulose (a polymer of glucose and xylose). The other
main component is lignin which is a highly cross-linked polymer built from phenolic groups
and provides strength for the plant structure and decreases water permeation (Corma et al.
2007). The main components of biomass and their reaction intermediates in hydrothermal
environment are provided in Table 2.2.
Cellulose is the most abundant chemical product in the world’s continents with 50
billion tons of production/growth each year (Bobleter 1994). The repeating unit in cellulose
chains are cellobiose (Figure 2.5).
Figure 2.5. Stereo-chemical formulas of (a) cellulose and (b) cellobiose (Bobleter 1994)

Chapter 3- PROPERTIES OF THE SUBCRITICAL WATER TREATED EXTRACTS
23
In addition to these compounds, plants can make energy storage products such as
lipids, sugars, starches or terpenes (which are rich in hydrogen and carbon). These resources
are regarded as renewable due to their ability to regenerate by taking up CO2 during their
growth (photosynthesis) and then releasing it to the air after burning or decomposition (Clark
& Deswarte 2008).
The worldwide production of biomass is around 3 × 10¹¹ tons per annum where only 6
billion is currently used. From this small fraction, only 3 to 3.5% is employed in non-food
applications like fuels and chemicals (B. Kamm et al. 2006). The biomass potential forecast
in the EU countries is also demonstrated in Table 2.3 based on the type of biomass.
Potentially, it is believed that biomass can provide up to 30% of energy generation of
mankind if used in a sustainable way. Due to its short carbon cycle, biomass does not have a
net contribution to the available carbon dioxide in the atmosphere (Knez ̌ević 2009).
Traditionally, food crops were being used to produce energy (e.g. biodiesel from
vegetable oils) and chemicals (e.g. polylactic acid from corn). However, due to the
increasing concerns on the competition of these routes with food supply chains, the
economic and legislative drive has emphasized the importance of using alternative non-food
resources such as wood, straw and energy crops (B. Kamm et al. 2006). The typical
constitution of wood or grass biomass are approx. 50% cellulose, 25% hemicllulose, 20%
lignin and some other materials such as minerals and organic acids. These ratios can vary
significantly in different types of biomass resource which are summarized for some in Table
2.4.

Chapter 3- PROPERTIES OF THE SUBCRITICAL WATER TREATED EXTRACTS
24
Table 2.2. Chemical representatives of biomass feedstocks and reaction intermediates encountered in
hydrothermal processing (adapted from (Peterson 2009))
Substance
Feedstocks
Chemical formula
Structural information
cellulose [C6H10O5]n n~500-10,000; β(1-4) linkages between glucose residues
hemicellulose Typical monomers:
[C6H10O5], [C6H8O4]
Branched with variable monosaccharide residues; dp ~ 500-3,000
lignin Typical monomers Polymer of aromatic subunits in random structure; molecular weight:> 10,000
triacylglycerides
R-CH2CH (R’)CH2-R’’
R,R’,R’’ are fatty acids with ester linkages to the glycerol backbone
protein [NHCH (R) C(O)]n Monomer is amino acid residues with various side groups; n~50-2000
Intermediates
glucose C6 H12 O6 exists as 6-membered ring, 5-membered ring, and open chain
xylose C5 H10 O5 Exists as 6-membered ring, 5-membered ring , and open chain
amino acid H2NCH(R)COOH R is the side group, varies from H to heterocyclic group
fatty acid RCOO R is any alkyl group, typically of 12-20 carbons with 0-4 double bonds
5-hydroxymethylfufural

Chapter 3- PROPERTIES OF THE SUBCRITICAL WATER TREATED EXTRACTS
25
Table 2.3. Biomass potential in the EU (European Commission, 2006) (Clark & Deswarte 2008)
Biomass Potentials (MTOE)*
2010 2020 2030
Organic Wastes 100 100 102
Energy Crops 43-46 76-94 102-142
Forest Products 43 39-45 39-72
Total 186 215-239 243-316
* Million tons of oil equivalent
Table 2.4. Chemical composition of selected plants in % of total dry matter (adapted from (Ortwin
Bobleter 1994a))
Plant (scientific name) Cellulose Hemicellulose Lignin Ash
Hard woods:
White poplar (populus alba) 49 25.6 23.1 0.2
Trembling aspen 49.4 30.9 18.1 0.4
Soft woods:
White spruce (p. glauca) 44.8 30.9 27.1 0.3
Europ. spruce (p. abies Karst) 40.4 31.1 28.2 0.3
Ligno-cellulosic waste:
Wheat straw 34.0 27.6 18.0 1.3
Maize stalk 38.0 26.0 11 3.0
Bagasse * 38.0 34.0 11
Newspaper 50 20 30
* Biomass remains of sugarcane stalks after their juices have been extracted
2.4.3 Biomass conversion in subcritical water
Biomass conversion using hydrothermal treatment is a thermo-chemical process during
which water has the role of reaction medium and catalyst and can be used for different pure
and mixed feedstocks. In general, this reaction can be carried out for different purposes to

Chapter 3- PROPERTIES OF THE SUBCRITICAL WATER TREATED EXTRACTS
26
obtain different products while both scenarios of catalytic and no catalytic conversion have
been widely employed. The most commonly used process is the (acid) hydrolysis which have
been largely used in wood and lignocellulosic hydrolysis plants worldwide. A
comprehensive review by Bobleter demonstrates the hydrolysis of plant materials and the
alterations that occur to polymers and intermediates in lignocellulosic biomass such as
cellulose, hemicellulose and lignin (Bobleter 1994).
One benefit of sub-or supercritical water process for biomass conversion is that organic
compounds, which are the precursors of tar, are solubilised in the medium. In other words,
the collision frequency of the solutes with water molecules in an aqueous solution is much
higher than that with a second organic molecule. As a result, they have a lower probability of
“meeting” and forming polymerized structures like tar which leads to lower formation of
coke and enhancement of the yield of desired products (Kruse & Dinjus 2007b).
A typical conversion process using subcritical water usually consists of initial
treatment (pretreatment) of the feed before the main reaction step to convert the non-soluble
condense polysaccharide chains to smaller monomers (i.e. fermentable sugars). In addition,
the treated biomass would obtain the required properties such as flexible structure or absence
of chemical barriers (e.g. lignin in lignocellulose), humidity, degree of fragmentation or
rheological properties (Knez ̌ević 2009). The pretreatment step, however, is the biggest
challenge in lignocellulosic biomass applications due to the presence of intermeshed
cellulose and lignin polymers which are difficult to breakdown and demand high temperature
water or higher concentration of catalysts.

Chapter 3- PROPERTIES OF THE SUBCRITICAL WATER TREATED EXTRACTS
27
2.4.4 Degradation of biomass components in subcritical water
An important aspect of hydrothermal conversion is that it can handle different mixed
streams and a specific chemical feedstock is not mostly required. This is in contrast to most
biofuels processes where glucose feedstocks are required for ethanol and triacylglycerides
are required for biodiesel process (Peterson 2009). Based on the main composition of
biomass, and also the shift of feedstocks from food crops to lignocellulosic wood and wastes,
favoured the studies to model the hydrothermal conversion steps with natural biopolymers
such as cellulose, starch, xylose etc. This is because biomass is a complex mixture of
variable composition which makes the study of individual reaction path complicated. Hence,
most of the studies are investigating the various reactions that these compounds undergo in
such mediums.
Different fractions of lignocellulosic biomass (cellulose, hemicellulose and lignin)
behave differently under subcritical water conditions. As an example, Mok and Antal (Mok
& Antal 1992) showed that all the hemicellulose was extracted from woody and herbaceous
biomass in noncatalysed water at 200 to 230 °C while just 4-22% of cellulose and 35-60% of
lignin were extracted over the same time period (Peterson 2009). The conversion of
lignocellulosic biomass in aqueous reactions has long been studied which have been
perfectly reviewed in comprehensive papers by Bobleter (Bobleter 1994), Mosier (Mosier
2005) and more recently by Yu et al. (Y. Yu et al. 2008). The main objective of such
technology is to depolymerise the glucan chains in cellulose or xylan in hemicellulose in
order to produce monosaccharides for fermentative processes in cellulose-based ethanol or
other biofuels (i.e. hydrogen) and chemicals. More review on the specific reactions of each
component is provided below.

Chapter 3- PROPERTIES OF THE SUBCRITICAL WATER TREATED EXTRACTS
28
2.4.4.1 Cellulose
Cellulose is a polymer of glucoses which are linked with β-1-4 glycosidic bonds and
form different intra- and inter-molecular hydrogen bonds which results in crystalline and
water insoluble chain which is resistive to enzyme digestion. Both hydrogen and glycoside
bonds can be hydrolysed under subcritical condition resulting in glucose monomers
(Peterson 2009). Other common glycosidic bonds are β-1-3 and β-1-6 which are present in
starch and yeast glucan and were addressed in this project as the main polysaccharide
molecules (Glucan is an expression covering all glucose polymers).
2.4.4.1.1 Kinetics of cellulose hydrolysis under hydrothermal conditions
The first reaction step in cellulose conversion in sub- or supercritical water is the
hydrolysis of cellulose to glucose. The resulting monosaccharides (glucose and fructose) are
converted to different products such as furfural which goes via the formation of (5-
hydroxymethylfurfural) HMF, methylfurfural and furfural (Kruse & Dinjus 2007b). The
concentration of these compounds is significantly higher at subcritical region and in the
presence of acids.
While the complete hydrolysis of cellulose or cellobiose under acidic conditions has
been demonstrated previously (Torget et al. 2000), the question whether subcritical water
differs from acidic or alkaline conditions has been frequently discussed (Sasaki et al. 1998).
In an early work by Dunning and Lathrop in 1945, they showed that non-catalyzed
hydrothermal conditions results in much lower hydrolysis rate comparing to acid catalyzed
hydrolysis leading to lower glucose yields (<5%) (Dunning & Lathrop 1945). The
decomposition of cellulose in supercritical water, however, has been shown to follow faster
kinetics without the addition of any catalysts (Sasaki et al. 1998), but resulting in glucose
derivatives such as formic acid and levulinic acid.

Chapter 3- PROPERTIES OF THE SUBCRITICAL WATER TREATED EXTRACTS
29
Experimental results suggest that the cellulose hydrolysis (i.e. hydrolysis of glycosidic
bonds) is fastest in alkali hydrolysis while acidic and hydrothermal conditions have slower
reaction rates respectively (Bobleter 1994). These three types of hydrolysis are shown and
compared in Figure 2.6, based on most probable reaction pathways for cellobiose, which is
the repeating unit of cellulose.
Figure 2.6. Mechanisms of cellubiose hydrolysis in acidic (H+), alkaline (OH-) and pure water
and formation of glucose (Ortwin Bobleter 1994a)

Chapter 3- PROPERTIES OF THE SUBCRITICAL WATER TREATED EXTRACTS
30
A more detailed study on the hydrolysis of pure cellulose under subcritical and
supercritical water was carried out by Sasaki et al (Sasaki et al. 1998). They used a flow type
reactor to hydrolyze cellulose in very short times in water (temperature range from 290 to
400 °C at 25 MPa) and analysed the extracts for glucose, fructose and oligomers (cellobiose,
cellotriose etc.). Using a maximum 10 wt% cellulose concentration in the reactor feed, they
showed that at such conditions, around 60% of the raw material has been hydrolysed at 350
°C after less than only 2 seconds which is much faster than milder subcritical conditions. The
kinetics of the cellulose hydrolysis was determined and showed to be of first order up to the
critical point of water, where it increases by one order of magnitude (Fig 2.7).
Figure 2.7. Arrhenius plot of rate constants for decomposition of cellulose and glucose in subcritical and
supercritical water (Sasaki et al. 1998).

Chapter 3- PROPERTIES OF THE SUBCRITICAL WATER TREATED EXTRACTS
31
The reason for the jump at critical point has not been discussed in detail but only
suggested that it could be due to the solubility of cellulose in supercritical water leading to its
enhanced reactivity and conversion. In such conditions, the reaction changes from
heterogeneous to homogenous due to the formation of oligomers, and leaded to higher
reaction rates. For oligomer hydrolysis, the reaction rates have been reported as being in the
same order over the range of temperatures from 290 to 400 °C (Sasaki et al. 1998). A
detailed description of hydrolysis products was also carried out with the combination of
carbon nuclear magnetic resonance (C-NMR), high performance liuiqd chromatography
(HPLC) and fast atom bombardment mass spectrometry (FAB-MS) and demonstrated in
Figure 2.8.
While most studies suggest that first order or pseudo-first order kinetics can describe
the hydrolysis reaction of cellulose in subcritical conditions, there are some variations
between the reported activation energy of the reaction (Fig. 2.7). The source of this variation,
however, was mainly due to 1) different sources of cellulose that have been used in these
studies and 2) different reaction configuration which have been employed. In the same study
by Sasaki et al., authors estimated the activation energy in the flow system to be around 146
kJ/mol, though it increased to 548 kJ/mol at temperatures over critical point of water (Sasaki
et al. 1998).
In a non-catalyzed medium and with cotton cellulose as the raw material, Schwald and
Bobleter estimated the activation energy of 129.1 kJ/mol in the temperature range if 215 to
274 °C (Schwald & Bobleter 1989). In such conditions, authors could detect only a small
amount of monomeric sugars as they had rapidly decomposed into furfural under static

Chapter 3- PROPERTIES OF THE SUBCRITICAL WATER TREATED EXTRACTS
32
conditions. Adschiri et al, however, obtained higher activation energy of 165 KJ/mol on
powdered cellulose in a semi-batch process (T. Adschiri et al. 1993). This value was found to
be 220 KJ/mol in an experiment carried out by Mochidzuki et al. in isothermal conditions
(Mochidzuki et al. 2000). Table 2.5 lists and compares the reactor configurations, substrates
and obtained values for the activation energy.
Table 2. 5. Activation energy for cellulose solubilisation from different studies
Research study Substrate Reactor (process)
configuration
Activation
energy
(kJ/mol)
Sasaki et al (2000) powdered
microcrystalline cellulose
continuous 146
Adschiri et al (1993) powdered plant
cellulose semi-batch 165
Schwald and Bobleter (1989)
cotton cellulose batch 129.1
Mochidzuki et al(2000) powdered cellulose thermogravimetric
batch reactor 220

Chapter 3- PROPERTIES OF THE SUBCRITICAL WATER TREATED EXTRACTS
33
Figure 2.8. Different reaction pathways for the hydrolysis of cellulose in pure water (Sasaki et al. 1998)

Chapter 3- PROPERTIES OF THE SUBCRITICAL WATER TREATED EXTRACTS
34
The data of the reaction rates from different studies are overlaid and demonstrated in
Figure 2.9 which suggests that the average activation energy is around 215 KJ/mol by fitting
a straight line (Peterson 2009).
Figure 2.9. Arrhenius plot for cellulose decomposition in different studies (Peterson 2009)

Chapter 3- PROPERTIES OF THE SUBCRITICAL WATER TREATED EXTRACTS
35
In another study by Kabyemela et al., cellobiose decomposition was studied in sub-
and supercritical water at temperatures between 300 to 400 °C and pressures from 25 to 45
MPa and short residence times (0.004 – 2s). Cellobiose was found to decompose via two
pathways of hydrolysis of the glycosidic bonds and pyrolysis of the reducing end
(Kabyemela et al. 1999). Comparing the reaction rates for these two pathways, authors
suggested that the activation energy for cellobiose hydrolysis was 108.6 kJ/mol, and for the
two pyrolysis were 110.5 kJ/mol and 106.1 kJ/mol.
Monosaccharide production is mainly the ultimate goal for hydrolysis of cellulosic
biomass as the secondary processes, such as bioethanol fermentation, can use
monosaccharides as the substrate for the ethanol production. The suggested reactions that
take place at elevated temperatures (>250 °C) decompose glucose to other by-products very
quickly which may not be of interest of the overall process (Sasaki et al. 2000). In many
cases, these secondary products, such 5-HMF, can act as inhibitory factors or toxic chemicals
for yeast cells which negatively affect the fermentation process and ethanol yield (Franden et
al. 2009). Hence, the controlled hydrolysis of cellulose biomass should be considered with
employing either additives or catalysts. Because low temperature aqueous medium (<250 °C)
can only hydrolyze the cellulose in significantly low rates, it is not considered an optimum
conversion process for bioethanol production from cellulose.
Due to the importance of the secondary reactions for glucose in hydrothermal conditions and
the range of different products that can be derived from it, these reactions are also discussed
in detail in following sections.

Chapter 3- PROPERTIES OF THE SUBCRITICAL WATER TREATED EXTRACTS
36
2.4.4.1.2 Glucose hydrolysis in subcritical water-Reactions pathways and
kinetics
Glucose reactions in high temperature aqueous environment have been studied for well
over a century. An important pathway is the isomerisation of the glucose to fructose which
typically occurs under mild acidic conditions. Isomerization occurs mainly through the
Lobry de Bruyn-Alberda van Ekenstein (LBAE) transformation which is a series if enediol
transformations (Kabyemela et al. 1999). As a result, when glucose or fructose are
solubilised in water, they can change to minimum six different forms (Figure 2.10) of
monosaccharides and they follow the same general reaction pathway in hydrothermal
systems (Peterson 2009).
The isomerisation of glucose to fructose shows the importance of studying the
reactions of fructose in similar conditions. In particular, it has been reported that fructose is
more reactive compared to glucose and the rate of glucose isomerisation to fructose is higher
compared to the reverse reaction in hydrothermal reactions (Kabyemela et al. 1999). A
generalized reaction pathway for glucose has been shown in Fig 2.11 which includes the
reactions for fructose as well. However, the rate of inter-isomerisation to fructose is not as
Figure 2.10. Isomerisation of glucose and fructose in water and their different forms (adapted from
(Peterson 2009)

Chapter 3- PROPERTIES OF THE SUBCRITICAL WATER TREATED EXTRACTS
37
high as degradation of both glucose and fructose. This was demonstrated in a work by Antal
et al. where only small fructose (or glucose) was left after starting a reaction with pure
glucose (or fructose) (M J Antal et al. 1990).
The same results was also obtained in a research by Salak Asghari and Yoshida which
accompanied by kinetics data suggesting that fructose reacts much faster than glucose in the
presence of acid (at 340 °C, 52% of glucose was decomposed while the degradation was
98% for fructose) (Salak Asghari & H. Yoshida 2006).
The main products of glucose and fructose under such conditions are dehydration
products such as HMF, 1.2.4-benzenetriol (BTO) and furfural. The dehydration of
carbohydrates is promoted in subcritical water due to the high ionic product of the medium
which enhances the reaction rate of this acid-catalyzed reaction (Kruse & Dinjus 2007a).
Between these products, HMF production has been studied in more detail as it is one of the
Figure 2.11. Generalized reaction pathway for glucose decomposition in subcritical and supercritical
water conditions (B. Kabyemela et al. 1999)
Chapter 3- PROPERTIES OF THE SUBCRITICAL WATER TREATED EXTRACTS
38
major bio-based chemicals and can be employed as a precursor in the chemical and polymers
industry (More detail in section 2.5.1). Dehydration reactions of glucose and fructose to 5-
HMF and hydrolysis of 5-HMF show enhanced rated by the increase in water density at 400
°C (Aida et al. 2007).
A detailed reaction pathway of glucose and fructose in subcritical and supercritical
water was elucidated by Kabyemela et al., in temperature range of 300-400 °C and
temperature of 25-40 MPa for extremely short residence times between 0.02 and 2 s
(Kabyemela et al. 1999). For glucose, the products were identified as fructose, a product of
isomerisation, 1,6-anhydroglucose, a product of dehydration, and eruthrose and
glyceraldehyde which are the products of a carbon-carbon bond cleavage. Detailed reaction
pathways for the decomposition of glucose in sub- and supercritical water are shown in
Figure 2.12 and the calculated reaction rates of each pathway are summarised in Table 2.7.
Despite different reaction conditions, most publications agree that glucose converts
mostly to fragmentation products such as glycoladehyde, pyruvaldehyde and glyceraldehyde
while fructose degrades to dehydrated products such as
5-hydroxymethlfufural (Peterson 2009). HMF formation from glucose, however, is mostly
studied under acidic conditions as its yield significantly enhances in acidic pH’s. HMF has
been suggested as an important industrial building block and is in the list of top ten bio-
based products which are suggested by Department of Energy, USA, in 2010 (Bozell &
Petersen 2010). In addition, it has been reported that fructose can lead to 1,2,4-benzenitriol
via HMF degradation which suggest that aromatic compounds can be produced from sugars
as well as lignin (Luijkx et al. 1993). Another promising, green and biomass derived
platform chemical from sugars is levulinic acid which is formed after degradation of HMF in
acidic conditions. Direct conversion of glucose to levulinic acid has been reported by

Chapter 3- PROPERTIES OF THE SUBCRITICAL WATER TREATED EXTRACTS
39
Girisuta et al. in temperature range of 140-200 °C using 0.05-1 M sulphuric acid as catalyst
(Claude Moreau et al. 1996). The highest yield was about 60% (mol/mol) with initial
concentration of 0.1 M for glucose, 1 M sulphuric acid at 140 °C.
Temperature can have a profound impact on the reaction pathway as the main products
of glucose hydrolysis are char (carbon) and liquid organics below the critical temperature
while it is mostly converted to gases and partly liquid furans at temperatures above water’s
critical temperature (Michael Jerry Antal et al. 1991).

Chapter 3- PROPERTIES OF THE SUBCRITICAL WATER TREATED EXTRACTS
40
Figure 2.12. Kinetic reaction pathway of glucose decomposition in sub- and supercritical water (B.
Kabyemela et al. 1999)

Chapter 3- PROPERTIES OF THE SUBCRITICAL WATER TREATED EXTRACTS
41
Table 2.6. Rate constants for the proposed glucose decomposition pathway (B. Kabyemela et al. 1999)

Chapter 3- PROPERTIES OF THE SUBCRITICAL WATER TREATED EXTRACTS
42
In most studies, first order reaction model has been successfully used to describe the
kinetics of glucose decomposition in subcritical water with good fit to experimental results.
An exception is a reaction order of 0.8 which was suggested in a continuous reactor at high
temperatures (>250 °C) (Matsumura et al. 2006). Matsumura et al. also suggested that the
reaction order would change at higher temperatures as the reaction field changes from ionic
to radicalic conditions. Similar to cellulose, the activation energy has been widely measured
and has been between was 114 kJ/mol (Knez ̌ević et al. 2009).
2.4.4.2 Hemicellulose
Hemicellulose are also high polymers built from sugar units but the backbone is
mainly comprise of pentoses (e.g. xylans), or alternating units of mannose, glucose and
galactose and significant side chains such as acetic acid, pentoses, hexoses (Bobleter 1994).
The ratio of these monomers can vary in different feedstock sources. Due to the lack of an
ordered glycosidic bonds, hemicellulose does not have a crystalline structure and thus, is
more susceptible to hydrothermal extraction and hydrolysis (Peterson 2009). Hemicellulose
is water soluble when it is separated from other plant fractions and this solubility is due to
the presence of the side chains. To separate the hemicellulose, the lignin bonds should be
cleaved which can be done with alkali solutions at lower temperatures (<140 °C) or only
water at higher temperature (200 °C<) (Pedersen et al. 2010).
2.4.4.3 Lignin
Lignin, a second to cellulose as the most plentiful renewable carbon source, is a
complex high molecular-weight polymer which in contrast to cellulose and hemicellulose
has an aromatic structure. The main monomers in lignins are p-coumaryl alcohol, coniferyl
alcohol and sinapyl alcohol which are all phenyl-propane derivatives (Table 2.2). Currently,

Chapter 3- PROPERTIES OF THE SUBCRITICAL WATER TREATED EXTRACTS
43
a limited supply of lignin is available as a by-product of the pulp and paper industry but this
is subject to change due to increasing numbers of biomass-to ethanol plants which produce
lignin as their by-product (B. Zhang et al. 2007). Although it commonly have been used for
combustion to generate heat and power, its complex phenolic structure implies that it can be
used as a source of various value-added products (B. Zhang et al. 2007).
2.5 Biorefineries and Bio-based Chemicals
A biorefinery is a facility that integrates biomass conversion processes and equipment
to co-produce fuels, power, and chemicals from diverse biomass source. This definition is
very close the developed oil refineries where various products (such as fuel and
petrochemical intermediates and final products) are generated. In a bio-based economy,
industrial biorefineries are regarded as the most promising route for the production of fuels
and chemicals (B. Kamm et al. 2006). Biorefinery technology follows two main strategic
goals: moving away from imported petroleum for western countries (an energy goal) and the
establishment of robust bio-based industry (an economic goal) (Bozell & Petersen 2010).
While the energy goal has already been widely investigated with the extensive research on
bioethanol, biodiesel and hydrogen from biomass, fuels are considered as high volume-low
cost commodities and they have low return on investments as a sole process. This problem is
more pronounced in newer biofuel options such as algal oil that has not been able to present
an economically feasible route for its production unless other streams from this biomass can
be identified for additional revenues.
Bio-base chemicals, which are derived from biomass, are an attractive solution to
alleviate our dependence on petroleum-based chemicals and improve the financial attributes
of biorefinery plants by manufacturing more valuable products. In contrast to traditional
organic synthesis chemistry, which one of its main aims is to construct complex structures

Chapter 3- PROPERTIES OF THE SUBCRITICAL WATER TREATED EXTRACTS
44
from simpler molecules, biomass conversion requires efficient, inexpensive and feasible
routes to derive useful chemicals from complex structures which are present in the starting
feedstocks. In addition, the research on bio-based chemicals can be considered as divergent
as it is desirable to produce multiple outputs using numerous chemical transformations (i.e.
bond making, hydrogenation, reduction and oxidation, dehydration etc.).
Recent researches have reported the potential chemical products or intermediates
which can be derived from plant biomass (Marshall & Alaimo 2010). This has been
accompanied by the growing interest of synthetic chemists to design reactions which deliver
more complex structure from simple intermediate products. In terms of synthetic chemistry,
however, the industrial use of carbohydrates are hindered based on the over-functionality of
carbohydrates which is due to the large number of OH-groups that obtain almost the same
chemical reactivity and makes selective chemistry very difficult to perform (Bicker et al.
2003). Yet, an important step to resolve this problem is to focus on the formation of carbon-
carbon double bonds or carbonyl groups instead of hydroxyl groups in the carbon framework
of carbohydrates. This approach and such a structure are believed to play a crucial role
joining the carbohydrate resources to petrochemical industry (Bicker et al. 2003).
In a recent review by Bozell and Peterson from the US Department of Energy, an
updated evaluation of potential target structures which can be derived from biorefinery was
carried out (Bozell & Petersen 2010). A list of top 11 compounds, which follows their
previous list of top ten compounds published in 2004, were selected based on meeting 9
different criteria (Table 2.7). In summary, these criteria were based on the level of attention
of research community towards a compound, technology applicability and the possibility of
deriving different derivatives, feasibility of high volume production, potential as being a
platform and other technological chemical measures.

Chapter 3- PROPERTIES OF THE SUBCRITICAL WATER TREATED EXTRACTS
45
Table 2.7 New top chemical opportunities from biorefinery carbohydrates, criteria for their inclusion
and resulting technology (adapted from (Bozell & Petersen 2010)
Compound Illustrative general biorefinery technology needs
Ethanol Selective alcohol dehydrations; improved biochemical production of alcohols from
biomass (rate, yield, titer, product, pH, inhibitor tolerance); engineering of optimal fermentation organisms
Furans (HMF, FDCA)* Selective dehydrations of carbohydrates; new catalysts and reaction media for
dehydration; reactive separations; selective oxidations of alcohols; improved oxidation and dehydration catalysts; catalytic systems for reactions in aqueous solution
Glycerol and derivatives Reactions in aqueous solution; selective reductions and oxidations of polyols
improved biological conversions of polyols
Biohydrocarbons Improved biohydrocarbon production; engineering of organisms to convert
(Isoprene) sugars to hydrocarbons; optimizing rate, yield, titer, product tolerance
Lactic acid Optimization of bioconversion of carbohydrates; bioprocesses with high rate,
yield, titer, product, pH and inhibitor tolerance; engineering of organisms to produce single materials
Succinic acid Bioconversion of carbohydrates; optimization of yield, rate, titer, separation;
engineering of organisms for optimal production of target
Hydroxypropionic acid Optimization of bioconversion of carbohydrates; bioprocesses with high rate, yield,
titer, product and inhibitor tolerance; engineering of organisms to produce single materials; selective dehydrations of alcohols; selective reductions of carbonyl groups, new selective hydrogenation catalysts; chemical processes in aqueous solutions
Levulinic acid Selective dehydrations of carbohydrates; improved separations of products; utility of
co-product schemes by biorefinery; improved catalysts for selective carbohydrate conversion processes
Sorbitol Selective hydrogenolysis of polyols; new catalysts for reduction of carbohydrate
derivatives; selective dehydrations of polyols; comparative assessment of chemical and biochemical conversion technology; selective bond breaking/bond making technology for polyols
Xylitol Selective hydrogenolysis of polyols; new catalysts for reduction of carbohydrate
derivatives; selective dehydrations of polyols; comparative assessment of chemical and biochemical conversion technology; selective bond breaking/bond making technology for polyols
* HMF (Hydroxymethylfurfural), FDCA(furandicarboxylic acid)
While some of the introduced chemicals in Table 2.7 are based on reaction of sugar
monomers in a chemical platform (e.g. HMF, levulinic acid and Xylitol), the suggested
production route for others as ethanol, lactic acid, succinic acid and hydroxypropionic acid is
fermentation as the most efficient option. Typically, the fermentation process is always
coupled with making extensive amount of spent microorganisms (mostly yeast except in
lactic acid process) which is the major waste from fermentation step. This comes on top of
the large volumes of yeast waste which is currently produced in breweries and ethanol
fermentation plants, and all are mostly incinerated without any further exploitation. This

Chapter 3- PROPERTIES OF THE SUBCRITICAL WATER TREATED EXTRACTS
46
highlights the potentials of a conversion process to transform this microbial biomass to other
useful products, which can introduce supplementary product streams to the main process in
the fermentation.
2.5.1 Furan-related Derivatives
Sugar-derived furans have been widely studied in the research on dehydration of 5- and
6-carbon monosaccharides. This reaction has been of special interest as these sugar
molecules can be derived from cellulosic biomass which introduces a potential green and
renewable source for these compounds. The main products of these reactions are furfural and
hydroxymethylfurfural which have been labelled as platform chemicals based on their
potential to be converted to numerous chemical compounds. Traditionally, this reaction used
to suffer from lack of yield and selectivity of the final products which these have been
addressed in recent studies mainly by applying novel catalysts or solvents. Dimethyl furan
(DMF) has been suggested as an attractive biobased fuel with better qualities than ethanol, as
it have 40% higher energy density compared to ethanol, a higher boiling point (20 K) and
also is not soluble in water (Roman-Leshkov et al. 2007). DMF can be produced from
hydroxymethylfurfural (HMF) with CU-Ru/C catalyst in the presence of hydrogen (Kazi et
al. 2011). In case of HMF, numerous systems have been used to improve the yield and
feasibility of the process. The dehydration of hexoses to form HMF has been conducted in
water (Roman-Leshkov et al. 2007), aprotic organic solvents (dimethylsulfoxide (DMSO))
(Claude Moreau et al. 1996) and biphasic systems (water/methylisobutylketone (MIBK))
(Seri et al. 2000) using catalysts such as organic acids (oxalic, maleic) (Szmant & Chundury
2007), inorganic acids (sulphuric, hydrochloric) (Ishida & Seri 1996) salts (MgCl2)
(Armaroli et al. 2000), organocatalysts (such as LaCl3) (Carlini et al. 2004), solid acids (ion-
exchange resin, VPO4) (Carlini et al. 2004) and zeolites (Claude Moreau et al. 1994).

Chapter 3- PROPERTIES OF THE SUBCRITICAL WATER TREATED EXTRACTS
47
Preparation of HMF from fructose and glucose in ionic liquids have also been studied
resulting in high yields (70%) using CrCl2 catalyst in 1-ethyl-3-methylimadazolium chloride
(C Moreau et al. 2006). The separation of product from the ionic liquids, however, has
remained a challenge and may require several hours of extraction. The yield of HMF is
higher when the used substrate is fructose, but glucose is more attractive as it is cheaper and
more abundant comparing to fructose. The potentials of HMF production from biomass-
derived glucose are further discussed in chapter 5 where the results of our study on
production of HMF from spent yeast biomass have also been provided.
2.5.1.1 HMF: Chemistry and production routes
There is a growing research activity in the chemistry of furfural derived compounds
such as 5-hydroxymethylfufural (HMF), 2.5-fruandicabaldehyde and 2.5-furan-dicarboxylix
acid due to the numerous applications they can offer (Lewkowski 2003). HMF is a furan
derivative and has a high reactivity and multi-functionality. It is an important intermediate
chemical that can be employed to derive a range of chemicals which currently originate from
petroleum and its derivatives. It is a complex primary aromatic alcohol, an aldehyde, and a
furan ring system which has already been used in the production of resins (Zakrzewska et al.
0). But its greater potential is being a precursor of other 2,5-distributed furan derivatives
such as 2,5-frurandicarboxylic acid (FDCA) via selective oxidation which can be used as a
replacement for terephthalic acid in the production of polyesters (e.g. PET and PBT)
(Chheda et al. 2007). Other important applications can be for the production of fine
chemicals, pharmaceuticals, solvents or biofuels such as 2,5-dimethylfuran (DMF) (Bicker et
al. 2003). But as this chemical has not been yet a high-volume chemical (in view of the
current difficulties regarding its cost-effective production), the potential uses of HMF-

Chapter 3- PROPERTIES OF THE SUBCRITICAL WATER TREATED EXTRACTS
48
derived polymers and other low cost chemicals has not been fully addressed (Chheda et al.
2007).
The synthesis of HMF is based on the triple dehydration of hexoses using different
substrates such as Hexose themselves, oligo- and polysaccharides. (Lewkowski 2003).
Scheme 2.1 shows a general reaction pathway for the synthesis of HMF from hexose.
Despite the simple pathway, HMF formation is complex and includes a series of side-
reactions that can negatively the yield of the reaction. The decomposition to levulinic acid
and formic acid and the polymerisation to humic acid are the most important side reactions
(Lewkowski 2003).
Scheme 2.1 Synthesis of HMF from glucose and its derivative products
The HMF synthesis is more efficient and more selective when started from ketohexoses (i.e.
fructose) than from aldohexoses (i.e. glucose). The dehydration of hexoses is commonly
known as being catalyzed by protonic acids as well as by Lewis acids (Bicker et al. 2005).
The production of HMF via dehydration of hexoses has been studied in numerous
solvents such as water (pure water or acidified water and additives) (Asghari & H. Yoshida
2006), biphasic systems (Chheda et al. 2007; Bicker et al. 2003), aprotic organic solvents
such as dimethylsulfoxide (DMSO) (Musau & Munavu 1987), common organic solvents
such as acetone (Bicker et al. 2005) and ionic liquids (Zakrzewska et al. 0) Different
catalytic systems have also been employed for this reaction including inorganic and organic

Chapter 3- PROPERTIES OF THE SUBCRITICAL WATER TREATED EXTRACTS
49
acids (oxalic and maleic acid) (Salak Asghari & H. Yoshida 2006), aluminium salts (Tyrlik
et al. 1999) and organocatalysts (Lanthanide chloride (Seri et al. 2000)).
Each of these systems, however, may be limited in terms of the yield, selectivity and
formation of by-products or the cost of the process in larger scale. In aqueous systems,
selectivity of the reaction is limited which leads to other by-products such as humic,
especially at higher concentrations of fructose or glucose where the formation of
polymerized humin is more facile (Bicker et al. 2005). Although using heterogeneous
catalysts have shown to improve the selectivity for the HMF formation to more than
(>80% ), the conversion remained in the range of 25- 50% (Carlini et al. 2004). The HMF
selectivity in different medium are compared in Figure 2.13.
Figure 2.13 Effect of HMF selectivity of adding an extracting organic solvent to the aqueous
phase for 10 wt% glucose dehydration 443 K using HCl as catalyst (Chheda et al. 2007)

Chapter 3- PROPERTIES OF THE SUBCRITICAL WATER TREATED EXTRACTS
50
Biphasic systems also suffer from using a large quantity of organic solvents and also
the need to remove organic residues from the phase which is water in most cases. The high
boiling point of the HMF and organic solvents such as dimethylsulfoxide (DMSO) also
means that large mounts of energy is required to separate HMF from the organic phase after
the reaction.
Although the fructose offers higher yields in most systems, glucose is the preferred
feed as it is more abundant and readily available (Chheda et al. 2007), and hence has been
considered in most studies for HMF production. Table 2.8 compares the yield of HMF
production from glucose, cellulose and cellobiose in different solvent systems and catalysts.
In aqueous system, the maximum yield was not more than 16% in the presence of TiO2,
while in water:DMSO:DCM system, HMF can be produced from glucose with a yield of up
to 30%. An intrinsic drawback of direct conversion of glucose is the low selectivity of HMF
production which is mostly lower than 50%.
In more novel systems, higher yields of HMF can be achieved. As an example, Li et al.
obtained the yields of 60% and 90% from cellulose and glucose respectively in a microwave
heated system and in the presence of CrCl3 (C. Li et al. 2009).

Chapter 3- PROPERTIES OF THE SUBCRITICAL WATER TREATED EXTRACTS
51
Table 2. 8 Yield of HMF production from glucose in different systems
Several studies have reported different building blocks and useful intermediates that
can be derived from biomass. It is due to the presence of carbohydrates backbone which are
made of hexoses (i.e. glucose or fructose) which are shown to have different functionalities.
According to the report by the US Department of Energy, HMF is one of the top biomass
derived chemicals which can be coupled to the existing biorefinery technology (Bozell &
Petersen 2010). Due to its potential industrial application and possibility of being made from
biomass, HMF has been referred as”sleeping giant” and a “key substance between
carbohydrate chemistry and mineral oil-based industrial organic chemistry” (Zakrzewska et
al. 0). Most of the studies on carbohydrate-based HMF synthesis are performed with
modelling the real biomass with pure monomers (such as glucose and fructose) or polymers
such as cellulose.
2.5.2 Brewer Spent Yeast and Its Applications
The sample which was used in this study was a yeast containing waste slurry from
cider manufacturing process. The other waste in cider process is apple pomace, apple
Raw
material Solvent Catalyst
Yield
(%) Selectivity
(%) Temp
(oC)
time
(min) Ref
Glucose Water H2SO4 5 n.a 200 5 Watanabe et al., 2005
Glucose Water TiO2 16 n.a 200 5 Watanabe et al., 2005
Glucose Water HCl 2 11 175 45 Chheda et al., 2006
Glucose Water:DMSO HCl 11 26 200 10 Chheda et al., 2006
Glucose Water:DMSO:MIBK:
2-butanol HCl 23 47 175 17 Chheda et al., 2006
Glucose Water:DMSO:DCM n.a. 30 48 175 270 Chheda et al., 2006
Cellobiose Water:DMSO:DCM n.a. 38 45 175 570 Chheda et al., 2006
Cellulose EMIM CuCl2/CrCl2 57 n.a 120 480 Su et al., 2009

Chapter 3- PROPERTIES OF THE SUBCRITICAL WATER TREATED EXTRACTS
52
residues after juice extraction, which was not addressed in this project.. While main
constituent of the substrate was yeast cells, other constituents were apple juice, apple debris
and related plant debris, culture medium additives and fermentation aids such as B vitamins
(thiamine), sufur dioxide and sugar. Apart from the chemical composition or the strain of the
yeast, the cider spent yeast is structurally similar to the one which is produced from the beer
fermentation as the main components in both wastes are yeast. Cider spent yeast (lees) was
used to be sold as animal feed (£2-£4 per kg for dried yeast) previously but current market is
declining which resulted in the additional costs for drying and disposal of this waste.
The yeasts used in the brewery industry are from two main groups of bottom-
fermenting and top-fermenting yeast which results in Lager beer and ale respectively. The
yeast fraction is usually re-used several times (4-6 times) and can be taken from one
fermentation tank to start the next (Ferreira et al. 2010). The excess or used yeast (spent
yeast) is the second main waste from brewery industries (after apple pomace). The spent
yeast is primarily sold as inexpensive animal feed after inactivation by heat or dried and used
as a source of nitrogen (Ferreira et al. 2010). Yeast biomass is also known for its
considerable concentrations of B-complex vitamins, nucleic acids and the biologically active
form of chromium known as glucose tolerance factor. The use of yeast biomass, especially in
its dried form, has long been known in food and flavour industries. For this purpose, yeast is
usually undergoes autolysis reaction which is carried out under controlled heating in order to
kill the yeast without deactivating its enzymes. The main purpose for autolysis is to release
the intracellular content of the yeast to the medium using the self-destructing mechanism of
the cells and also convert the complex structures of proteins, RNA and DNA to simpler
amino acids and nucleotides or other useful monomers. Furthermore, recent studies report
that spent yeast biomass can be employed as a bio-adsorbent to remove chemicals such as

Chapter 3- PROPERTIES OF THE SUBCRITICAL WATER TREATED EXTRACTS
53
dyes (J.-xia Yu et al. 2009), metal ions (L. Cui et al. 2010). Figure 2.14 shows how the
valorisation of yeast biomass has changed during the time.
Figure 2.14 Schematic representation of the brewers yeast biomass valorisation at different times
(Ferreira et al. 2010)

Chapter 3- PROPERTIES OF THE SUBCRITICAL WATER TREATED EXTRACTS
54
Cider manufacturers also deal with a similar problem as the two main wastes of these
industries are apple pomace (apple residues after the extraction of apple juice) and spent
yeast. Apple pomace, which is also a waste in apple juice production, represents up to 30%
of the original fruit and consists of peel, core, seed, calyx, stem and soft tissue (Vendruscolo
et al. 2008). Traditionally, apple pomace has been used in the production of pectin but recent
studies suggest that it can also be used for other food-related products such as lactic acid and
fibre-rich concentrates (Gullon et al. 2007), or as a substrate for other biotechnological
applications to generate single cell protein, aroma compounds, ethanol, organic acid,
enzymes and polysaccharides (Vendruscolo et al. 2008). In contrast to apple pomace, cider
spent yeast has been addressed in a very limited studies for its further application. The
traditional market for this waste is animal feed industries as well where its nutritional values
captured and used in feed additive (dry brewey yeast costs £2-£4 per kg basaed on the price
quoted by www.nettex-supplies.co.uk on Nov 2010) . However, this market is diminishing as
novel formulations for animal feeds are becoming cheaper and more popular which limits the
application of spent yeast. This has made cider manufacturers to investigate possible
applications and markets for this slurry as alternative for the incineration or drying routes.
2.5.3 Hydrothermal conversion of yeast biomass
As discussed in section 2.4.3, hydrothermal treatment of biomass has been widely
employed for the conversion of waste or raw materials to valuable compounds, especially in
the past two decades. Subcritical water or hot-compressed water (HCW) may be used as both
solvent and reactant in a range of different reactions which have previously been reviewed
(Y. Yu et al. 2008). Water at elevated temperatures and pressures (but below its critical
point) exhibit exciting physical and chemical properties such as low dielectric constant and
higher diffusivity which can boost ionic reactions and is shown to be suitable for different

Chapter 3- PROPERTIES OF THE SUBCRITICAL WATER TREATED EXTRACTS
55
syntheses or degradation reactions (Y. Yu et al. 2008). This hydrolytic effect can offer an
exciting route to transform or derive various compounds from biomass (Kruse & Dinjus
2007b; G. Brunner 2009).
In this projects, the studied biomass (cider spent lees or yeast) was comprised of yeast
cells (Saccharomyces bayanus), apple juice and apple residues, plant debris, organic acids
(lactic acid) and additives which are introduced during the fermentation step. However, the
main constituent of the slurry was the yeast cells which are made of polysaccharide cell wall
(β-glucan and mannoproteins are the main constituent of the yeast cell wall). When yeast
cells start to disrupt and hydrolyse, their intracellular content will be released to the medium
followed by further degradation of biopolymers (cell wall carbohydrate and proteins) to their
monomers. The intracellular contents of the yeast cells are mainly comprised of proteins and
amino acids, carbohydrates, nucleotides (DNA and RNA), nutrients such as vitamins and a
small fraction of lipids. Due to the complex nature of the yeast extract which leads to the
further problems in purifying individual components, yeast extracts are mostly used in their
crude structure as additives in foods or for animal feed based on their nutritional properties.
The hydrolysates form the hydrothermal treatment process are also a mixture of proteins and
amino acids which have been shown to be a useful source of nutrients for culture mediums as
reported by Lamoolphak et al. (Lamoolphak et al. 2007).
Proteins and sugars have long been known to undergo the well-known Maillard
reaction in aqueous mediums at higher temperatures. This reaction has been studied
extensively in its application in food, flavour and medical fields such as the caramelisation
reaction, is known as a non-catalysed browning reactions. This reaction produces
polymerised molecules known as melanoidins. As will be shown later, the reaction mixture
of our experiments contain high concentration of proteins and monosaccharides, which is

Chapter 3- PROPERTIES OF THE SUBCRITICAL WATER TREATED EXTRACTS
56
expected to result in browning reactions (sugar oxidation and colour change) or Maillard
reaction (colour change and formation of polymeric compounds). This reaction will be
further investigated in the dry mass measurement section.
The extraction of glucan fraction present in the yeast cell wall has been of interest to
other researchers when using fresh yeast (K. S. Kim & Yun 2006a) or brewery spent yeast
(X. Y. Liu, Q. Wang, et al. 2008; Thanardkit et al. 2002) but on the other hand no work has
been reported to the author knowledge on the use of cider spent yeast for such application.
It is believed that the extracts have antioxidant properties due to the presence of
phenolic compounds in the extract. For this reason the Total Phenolic Concentration (TPC)
of the extracts was measured as preliminary results suggested that the phenolic content of the
extracts varies with the temperature and time of the reaction.
The extraction of phenolic compounds from natural sources and feedstocks have also
been reported by (Conde et al. 2009; Cruz et al. 2004; R. Bitsch et al. 2000; S. K. Lee et al.
1998) because of their beneficial health effects.
2.5.4 Yeast autolysis for the production of yeast extract
Yeasts have been widely used in human culture to produce alcoholic beverages,
leaven bread dough and at the same time for the production of yeast extract, which is widely
used in the food products as an additive to enhance taste and flavour or as a protein and
vitamin source for nutritional fortification (Tanguler & Erten 2008). Yeast extracts can be
obtained by different methods such as hydrolysis, plasmolysis and the most frequently
process which is autolysis. This maximizes the nutritional value of the yeast suspension, as
they undergo a process during which the intracellular contents of the cells are released to the
medium.
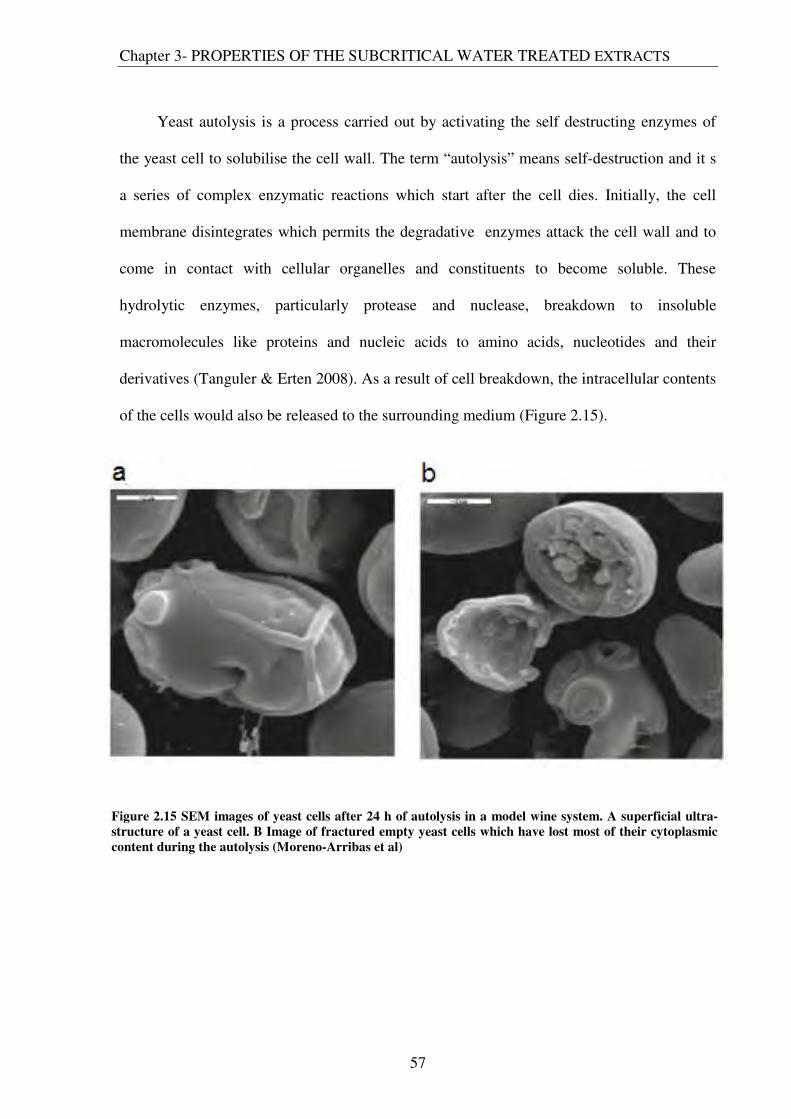
Chapter 3- PROPERTIES OF THE SUBCRITICAL WATER TREATED EXTRACTS
57
Yeast autolysis is a process carried out by activating the self destructing enzymes of
the yeast cell to solubilise the cell wall. The term “autolysis” means self-destruction and it s
a series of complex enzymatic reactions which start after the cell dies. Initially, the cell
membrane disintegrates which permits the degradative enzymes attack the cell wall and to
come in contact with cellular organelles and constituents to become soluble. These
hydrolytic enzymes, particularly protease and nuclease, breakdown to insoluble
macromolecules like proteins and nucleic acids to amino acids, nucleotides and their
derivatives (Tanguler & Erten 2008). As a result of cell breakdown, the intracellular contents
of the cells would also be released to the surrounding medium (Figure 2.15).
Figure 2.15 SEM images of yeast cells after 24 h of autolysis in a model wine system. A superficial ultra-
structure of a yeast cell. B Image of fractured empty yeast cells which have lost most of their cytoplasmic
content during the autolysis (Moreno-Arribas et al)

Chapter 3- PROPERTIES OF THE SUBCRITICAL WATER TREATED EXTRACTS
58
The autolysis is initiated by a controlled rise in temperature or osmotic shock which
results in the cells dying without destructing or inactivating their enzymes. The main factors
which influence the process and are decisive for an optimal autolysis process are
temperature, controlled pH and duration of the autolysis (Sommer 1996).
2.5.4.1 Autolysis and extraction of valuable compounds
As a proven technique to release the confined intracellular compounds, autolysis has
been specifically used to capture valuable compounds in the yeast cells. Due to the mild
condition whereby enzymatic reactions digest the cell wall barrier, most of the target
chemicals would be released with minimum modifications. In addition, these specific
reactions can also be employed to modify the compounds in order to release them from
bound structure or further modifications.
Autolysis has long been used for the extraction of cellular protein and is the basis for
commercial production of yeast extracts (Tsang et al. 1979). Examples of using autolysis for
other compounds can be as extraction of lipids which was studied by Pueyo and co-workers
(Pueyo et al. 2000). They studied the release of different classes of lipids such as mono-, di-,
and tri-acylglycerols, free fatty acids and sterol esters and their effect on the wine sensory
attributes and foam characteristics. Amino acids and protein mixtures have also been a
common product after cells being subjected to autolysis conditions (G.L. Huang 2010;
Lamoolphak et al. 2007). As in Lamoolphak et al. work, autolysis was carried out to prepare
a crude mixture of nutrients that can be used to fortify yeast medium cultures. Autolysis has
also been suggested as an effective procedure for enzyme extraction in laboratory protocols
as it was shown for the extraction of invertase by Illanes and Gorgollon (Illanes & Gorgollón
1986). The combination of autolysis and enzymatic treatment have also been shown to be an

Chapter 3- PROPERTIES OF THE SUBCRITICAL WATER TREATED EXTRACTS
59
effective method to facilitate the extraction of disodium inosine-5´-monophosphate (5´-
GMP) from yeast extract (Sombutyanuchit et al. 2001). This compound, which is one of the
main flavours and taste enhancers in the yeast extract with a large application in food
industry, was shown to be released and extracted from autolyzed yeast by means of a crude
extract from malt rootlets (which contain 5´-phosphodiesterase) (Sombutyanuchit et al.
2001).
While in most autolysis reactions, fresh baker or brewery yeast has been used for this
purpose, some authors (Sombutyanuchit et al. 2001; Saksinchai et al. 2001; Jiang et al. 2009)
have also suggested the use of spent yeast as the starting material for the autolysis which can
also be regarded as a solution for large quantities of this biomass generated after
fermentation.
2.5.5 Spent Cider Yeast (Lees)
2.5.5.1 Cider Process and Lees Production
During cider fermentation, the apple juice which is fortified by glucose syrups, is the
main substrate that yeast cells exploit for their metabolism and formation of secondary
product i.e. ethanol. The yeast is recycled and used several times during the process to start
the next fermentation cycle while the excess yeast is removed and discarded from the
process. A diagram of the cider fermentation step is demonstrated in Fig. 2.16, which shows
the sources of cider spent yeast (lees) and how it is collected in the cider process. When
collected, this excess yeast forms the second biggest by-product in brewery industries
(Ferreira et al. 2010). Around 8,000 tonnes of spent cider lees are produced annually only in
the UK by the leading cider manufacturer Scottish & Newcastle PLC. Multiples of this

Chapter 3- PROPERTIES OF THE SUBCRITICAL WATER TREATED EXTRACTS
60
volume is believed to be produced in beer manufacturing industries. The traditional market
for this yeast waste has been animal feed industries to capture its exceptional nutritional
values in animal diet. For this purpose, yeast cells which are suspended in very polluting
slurry, needs to be dried and the dried powder is added to the animal feed. Also, beer spent
yeast has been used to produce yeast extract (H. J. Chae et al. 2001; Tanguler & Erten 2008;
Saksinchai et al. 2001), a highly nutritional extract which has been a good source of B-
complex vitamins, amino acids, lipids, RNA and other minerals available in yeast cells.
While this extract has been suggested to be employed in flavour industries (In et al. 2005) or
as a microbiological culture ingredient (Saksinchai et al. 2001), no such investigation has
been carried out for cider spent yeast. The current application for this by-product is limited to
animal feed industry after being inactivated by heat. This method needs to compete with
alternative protein sources like soybeans which manufacturers are becoming more interested
(Saksinchai et al. 2001). Therefore, cider spent yeast has to be sold at a price which
manufacturer may not even find enough to cover the cost of the drying process. Other
common option is land disposal after being completely incinerated, which the remaining
nutrients were not recovered and may result in toxic emissions sometimes may necessitate
further waste/gas treatment (Lamoolphak et al. 2007). Hence, it is in the interest of
manufacturers to seek alternative options to transform and upgrade these wastes to more
valuable chemicals/mixtures or other uses.

Chapter 3- PROPERTIES OF THE SUBCRITICAL WATER TREATED EXTRACTS
61
Cider lees is mainly comprised of yeast cells, apple juice, apple and plants residues and
other additives which were added in the upstream such as organic acids and nutrients for
fermentation step.
Despite the similarity in the structure (and almost in the composition) of brewery spent
yeast and cider spent yeast, the difference in the strain of the yeast and the type of process
(which includes lactic acid fermentation in cider process) has a substantial effect on the
utility of this waste for similar applications which is common for brewery yeast. As
measured in this project, the pH of the spent yeast was in the range of 3.6 implying that it is
acidic in contrast to brewery spent yeast which is typically neutral. Based on the lactic acid
bacterial fermentation which occurs in the product, there is the possibility of the presence of
bacterial residues in the cider lees. However, there might be potential applications for this
waste in other products which requires the cells to be inactivated first with heat or other
techniques resulting in a dry or semi-dry paste. Alternatively, the deactivation can be carried
Figure 2.16 Process diagram of the cider manufacturing and collection of lees as waste (courtesy of
Heineken UK (Bulmers)
Chapter 3- PROPERTIES OF THE SUBCRITICAL WATER TREATED EXTRACTS
62
out in a pressurized system where the water remains in the medium and temperature can rise
to the sterilisation temperature (120 °C) or beyond levels.
The necessity of using heat deactivation for cider spent yeast highlights the potential of
products which can be extracted after similar hydrothermal treatment. In addition, this
emphasizes the importance of this study and introduces a new feedstock for existing
hydrothermal conversion technologies. This suggest an opportunity to research and design a
conversion platform based on subcritical water treatment and outline the possible products
which can be derived from this biomass. Such a conversion process to upgrade microbial
biomass has not been discussed in literature to the knowledge of the author. Therefore, the
potential candidates which are discussed below are based only on background information
about this biomass feedstock and include the components that are already present
(intracellular and extracellular) and may be generated in the hydrothermal reactions.
2.5.5.2 Potential Products From Cider Lees
2.5.5.2.1 Proteins and Amino acids
The main study which has used subcritical water treatment to hydrolyse brewery spent
yeast to useful products was carried out by Lamoolphak et al. (Lamoolphak et al. 2007).
They studied the decomposition of yeast cells at temperatures between 100 and 250 °C and
studied the hydrolysates in terms of protein and amino acid concentration. They showed that
such conversion technologies can potentially be used to decompose proteinaceous waste
such as spent brewer’s yeast while recovering more useful products. The same results is
believed to be valid for the cider spent yeast as it is believed that proteins and amino acids
would be released from any yeast biomass under such conditions. They reported that the

Chapter 3- PROPERTIES OF THE SUBCRITICAL WATER TREATED EXTRACTS
63
protein and amino-acid fraction can be used as a source of nitrogen for other cultures
mediums.
2.5.5.2.2 Carbohydrates (β-glucan) and related derivatives
Carbohydrates are the main component in biomass feedstock and are present in the
form of polysaccharides i.e. cellulose, hemicellulose and starch (Cherubini 2010). A
previous overview (section 2.4.3) which was provided earlier covered the recent advances in
carbohydrate conversion and its potential derivatives. The composition of the carbohydrates
in biomass, their concentration and physical properties show their feasibility for further
exploitation.
Yeast cells are enclosed by a rigid β-glucan structure which is formed of β-1-3- and β-
1-6-glycosidc bonds. Glucan is the general name for polysaccharides consisting only of D-
glucose monomers such as cellulose, dextran and starch. The glucans are further specified by
the type of the main glycosidic bonds in the polymer. Glycosidic bonds are formed when a
carbohydrate is linked to an alcohol (which can be another carbohydrate) with the formation
of one water molecule. The glycosidic bonds are distinguished into α- and β- bonds (Fig
2.17). An α-glycosidic bond for a D-glucose is situated below the plane of the sugar while
the hydroxyl (or other substituent group) on the other carbon points above the plane
(opposite configuration). A β-glycosidic bond is situated above that plane (the same
configuration). The numbers (1-3 or 1-6) indicate which carbon atoms are linked. It is known
that β-1-3-glucan is the major fraction of yeast cell wall and is therefore an interesting
components to consider for added value products derived from yeast (Tonnies 2008). β-1-3-
glucans are useful in different applications such as viscosity imparting agents, emulsifier,
binders in tablets, food thickeners and also as carriers and coating agents in the
pharmaceutical industry (Wheatcroft 1997). In a study by Thanardkit et al., β-1-3-glucan is

Chapter 3- PROPERTIES OF THE SUBCRITICAL WATER TREATED EXTRACTS
64
reported as an immuno-stimulating agent e.g. wound healing, antibacterial, anti-tumor, anti-
flammatory and anti-viral activity (Thanardkit et al. 2002; Sandula et al. 1999).
β-1-3-glucan can also be extracted from cereals like oat and barley or other plant
sources such as fungi. However, it has been suggested that the yeast sourced β-glucan is
more effective in health and cosmetic products based on its specific composition (K. S. Kim
& Yun 2006b). Most of the studies which focus on β-glucan from yeast have used freshly
prepared yeast’s biomass for their studies. Thanardkit et al., however, reported that the β-
glucan can also be extracted from spent brewer’s yeast in higher yields using less extensive
extraction procedures compared to commercial yeast-derived immune stimulants which is
produced from more expensive baker’s yeast (Thanardkit et al. 2002).
Figure 2.17 Structural difference between Cellulose and Starch and their glycosidic bonds
(Ref: http://oregonstate.edu/instruction/bb450/fall2010/lecture/carbohydratesnotes.html)
Chapter 3- PROPERTIES OF THE SUBCRITICAL WATER TREATED EXTRACTS
65
β-glucan in the yeast cell wall, however, can be considered as a source of sugar
monomers which can be converted to its glucose and mannose subunits using a hydrolysis
process such as hydrothermal treatment. Similar to other biomass feedstocks, this means a
new window opportunity to derive versatile platform chemicals from the resulting sugar
subunits. This idea was followed in this project and was discussed in detail in Chapter 5,
where the formation of HMF from produced sugar monomers were discussed.
2.5.5.2.3 Vitamins and other Nutrients
Vitamins: An overview
Vitamins are essential organic compounds which are for the most part sourced through
a balanced diet. Vitamin deficiency can lead to severe symptoms but these are often easily
remedied by administering the daily recommended dose of the vitamin (Ullmann 2007). Due
to the detrimental effects of food processing on the nutritional properties of the food, it is
often necessary to supplement food and feed products with vitamins to ensure a balance diet.
Today most vitamins are chemically synthesised at industrial scale with the exception of
vitamin B12 (cobalamin) which is produced via fermentation (Ullmann 2007). However
there is an increasing interest to obtain vitamins from natural bio-based sources as a result
vitamins A, D3, E and K are extracted from natural compounds.
Vitamin B3 (niacin, as the generic name for both nicotinic acid and its derivative
nicotinamide) is one of the vital vitamins as its deficiency can lead to Pellagra disease. The
chemical structure of nicotinic acids and nicotinamide are shown in Table 2.9. Nicotinic acid
is mainly present in plants while nicotinamide is mostly available in animal products
(Eggersdorfer et al. 2005). Nicotinic acid forms nonhygroscopic, colourless needles and is
stable in air. It melts without decomposition at 236 °C under ambient pressure and starts to

Chapter 3- PROPERTIES OF THE SUBCRITICAL WATER TREATED EXTRACTS
66
sublime at 150 °C, with increasing sublimation rates above 220 °C. Nicotinamide is also a
crystalline colourless compound that forms needles and has a melting point of
129-132 °C at ambient pressure. Niacin is needed for the synthesis of the coenzymes NAD+
and NADP+ which in turn catalyse redox reactions, e.g. in the synthesis and degradation of
amino acids , fatty acids and carbohydrates. Over 350 enzymes require NAD+ and NADP+ as
coenzyme (Shibata & Taguchi 2000).
Before the chemicals synthesis of vitamin B3 was successfully developed, there were
many attempts to extract the vitamin from natural sources, such as yeast, wheat, liver etc.
using hot water, HCl or NaOH (Teply et al. 1941). Yeast has long been known to be a good
source of B vitamins particularly vitamin B3. In yeasts, vitamin B3 is mainly present in the
form of nicotinic acid. The B vitamin contents of yeast are shown in Table 2.10.
Table 2. 9 Chemical structure and properties of nicotinic acid and nicotinamide
nicotinic acid nicotinamide
molecular weight [g/mol] 123.11 122.12
solubility in water [g/l] at:
0°C 8.6 very soluble (~ 1000)
38 °C 24.7 -
100 °C 97.6 -
melting point (°C) 236-237 129-132*
* stable modification
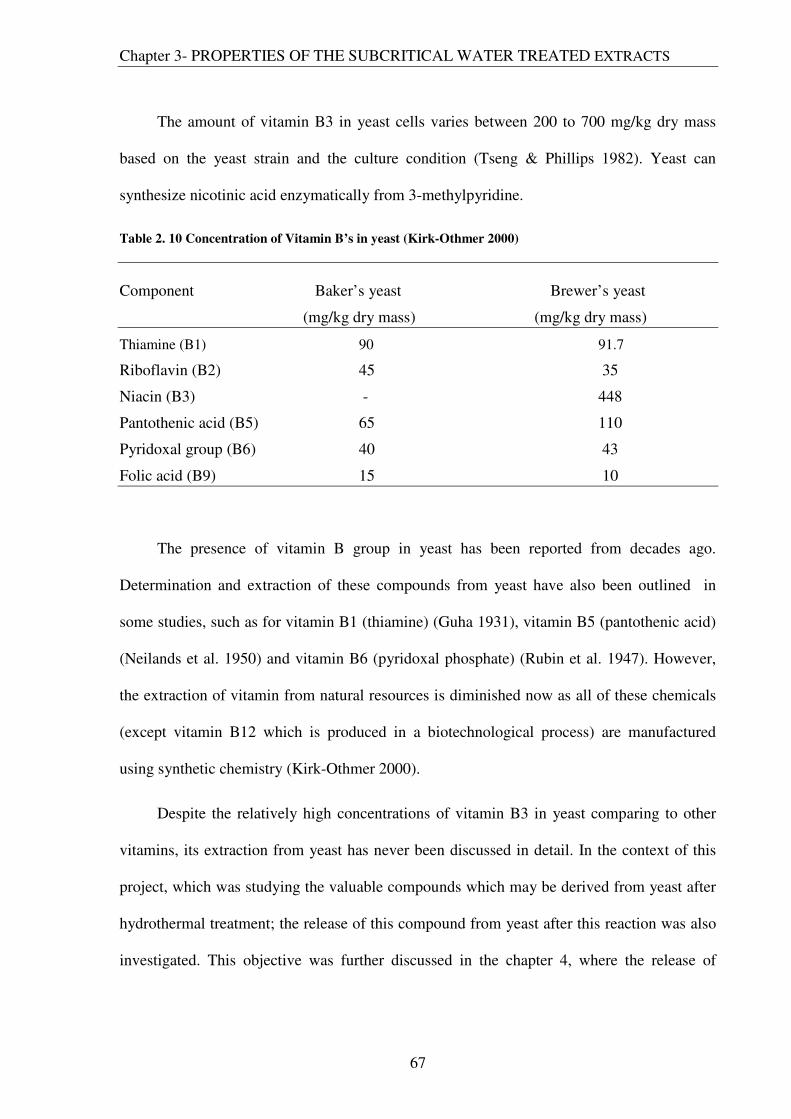
Chapter 3- PROPERTIES OF THE SUBCRITICAL WATER TREATED EXTRACTS
67
The amount of vitamin B3 in yeast cells varies between 200 to 700 mg/kg dry mass
based on the yeast strain and the culture condition (Tseng & Phillips 1982). Yeast can
synthesize nicotinic acid enzymatically from 3-methylpyridine.
Table 2. 10 Concentration of Vitamin B’s in yeast (Kirk-Othmer 2000)
Component Baker’s yeast Brewer’s yeast
(mg/kg dry mass) (mg/kg dry mass)
Thiamine (B1) 90 91.7
Riboflavin (B2) 45 35
Niacin (B3) - 448
Pantothenic acid (B5) 65 110
Pyridoxal group (B6) 40 43
Folic acid (B9) 15 10
The presence of vitamin B group in yeast has been reported from decades ago.
Determination and extraction of these compounds from yeast have also been outlined in
some studies, such as for vitamin B1 (thiamine) (Guha 1931), vitamin B5 (pantothenic acid)
(Neilands et al. 1950) and vitamin B6 (pyridoxal phosphate) (Rubin et al. 1947). However,
the extraction of vitamin from natural resources is diminished now as all of these chemicals
(except vitamin B12 which is produced in a biotechnological process) are manufactured
using synthetic chemistry (Kirk-Othmer 2000).
Despite the relatively high concentrations of vitamin B3 in yeast comparing to other
vitamins, its extraction from yeast has never been discussed in detail. In the context of this
project, which was studying the valuable compounds which may be derived from yeast after
hydrothermal treatment; the release of this compound from yeast after this reaction was also
investigated. This objective was further discussed in the chapter 4, where the release of

Chapter 3- PROPERTIES OF THE SUBCRITICAL WATER TREATED EXTRACTS
68
nicotinic acid and nicotinamide (amide of nicotinic acid which has also been classified as
vitamin B3) from the cider spent yeast is demonstrated.
In the light of having a biomass which was consisted mostly of yeast cells, a set of
experiments were designed to identify and possibly extract the vitamin B3 from the yeast
cells using the subcritical water hydrolysis step which are dicussed in detail in chapter 4.
In addition to vitamins, there are other high value compounds present in the yeast
which can be extracted such as sequalene (Bhattacharjee P & Singhal R. S 2010) and sterols
(Quail & Kelly 1996). Phenolic compounds, in particular, are other potential fractions which
can be recovered from cider lees as they are believed to being carried over from the upstream
of the process and left in this waste after the separation of cider. Phenolic compounds and the
possibility of their extraction from cider lees are discussed in chapter 6 because of their
importance as natural antioxidants, a potential ingredient in cosmetic formulations and health
supplements.
TLC analysis of Vitamins
As one of the fastest chromatography analysis techniques, TLC still plays a significant
role in determination and qualitative and quantitative analysis of different compounds in
biological and non-biological samples. The use of this technique has been well documented
for many years and has observed extensive modifications such as the development of high
performance thin layer chromatography (HPTLC) (Arup et al. 1993), two dimensional TLC
(Zakaria et al. 1983), preparative TLC techniques (Loev & Goodman 1967) and ultra-thin
layer chromatography techniques (Bezuidenhout & Brett 2008). TLC has been successfully
used for the analysis of different vitamins compounds in biological samples, especially
vitamin B group (Cimpoiu & Hosu 2007; Ponder et al. 2004).

Chapter 3- PROPERTIES OF THE SUBCRITICAL WATER TREATED EXTRACTS
69
Based on these results and the inherent properties of TLC techniques, as a fast,
convenient with minimal effect on the sample, this method was employed for the analysis of
the vitamin B3 in our extracts. The idea of using TLC technique for this purpose was based
on the previous studies which employed for similar compounds (Sherma & Fried 2005;
Cimpoiu & Hosu 2007; Ponder et al. 2004). Moreover, there were some advantages
associated with the use of TLC plates as they offered less limitation on the size of the sample
loading on the plate, offering less technical difficulty with the complexity of the sample
matrix, no the need for prior pretreatment and possible use of only aqueous solvents. These
advantages, which are not the case when an HPLC technique is used, was of great interest at
that stage due to the extensive amount of samples need to be screened accordingly. Also, the
silica which was the adsorbent on the plates was a cheap and practical material that offers
economical and technical advantages could be useful in the light of further scaling up of the
recovery process. Besides, an important aspect of this research was to use environmentally
friendly techniques throughout the reaction and succeeding recovery steps by minimizing the
use of organic solvents in the reaction (as a biphasic or neat medium) or in the extraction
steps.
2.6 Phenolic Compounds
Natural phenolics have long been studied for their beneficial effects on human health
and nutrition and their positive activity has been captured in numerous consumer products.
As one of the major phytochemicals, phenolic compounds are believed to lead the positive
health effects of vegetables and fruits mainly as an effective antioxidant. Hence, more
research groups are becoming interested studying new natural phenolics from different
substrates. These substrates can be fruits and related by-products such as apple (Escarpa &
González 1999) and apple pomace (Schieber et al. 2003), berries (Cacace 2003), red grape

Chapter 3- PROPERTIES OF THE SUBCRITICAL WATER TREATED EXTRACTS
70
marc(Bonilla et al. 1999), grape seeds (C. Xu et al. 2010), olive oils (Montedoro et al.
1992), or non-fruit sources such as olive leaves (Japón-Luján & Luque de Castro 2006) and
olive tree pruning (Conde et al. 2009).
In the natural samples, phenolics are either suspended in the liquid phase or are encompassed
in a solid matrix like the seeds and leaves. Different techniques have been used for phenolic
extraction such as polymeric adsorbents (Schieber et al. 2003), activated carbon (Q. Lu
2004), solvent extraction (R.M. Alonso-Salces et al. 2001) subcritical water (Rangsriwong et
al. 2009; Ibañez et al. 2003; Baek et al. 2008) and supercritical carbon dioxide (Vatai et al.
2009). For the extraction of phenolics from solid matrixes, solvent extraction (supercritical
fluids or organic solvents ) have been traditionally used while novel technologies, such as
microwave (Hong et al. 2001) or sonication (Kivilompolo & Hyotylainen 2009) are reported
as effective while provide a more environmentally friendly process. These techniques are
regarded as expensive approaches requiring costly equipments and are limited process scale
which may not be applicable in these processes where larger volumes of substrates are used
(Swami Handa et al. 2008). In contrast, using subcritical water extraction can potentially a
platform with use of non hazardous chemicals and less advanced equipments. However, the
capital costs for the process can still be high as the extraction must be carried out in heat
resistant vessels (stainless steel, or hastelloy if at supercritical water conditions). The full
advantages of the process should be studied after full technical and economical analysis of
the process.
As cider spent yeast originates from cider process, phenolic compounds are expected to
be present in the studied crude sample. They must have been carried over from the upstream
of the process where apple juice (or apple juice concentrate) was introduced as the main raw
material. Apple phenolics have been widely studied while is still in fruit or in related
Chapter 3- PROPERTIES OF THE SUBCRITICAL WATER TREATED EXTRACTS
71
products such as apple juice, cider and apple pomace. In case of apple pomace, which is
another waste stream of the cider manufacturing, the phenolic composition have been
studied elsewhere (Schieber et al. 2003; Vendruscolo et al. 2008; Gullon et al. 2007; Diñeiro
García et al. 2009). However, no studies have been carried out on the phenolic composition
of cider spent yeast to the knowledge of author. Studying the phenolics in this substrate is
more important as it has been showed that subcritical water have been employed previously
for their extraction from different substrates (as mentioned above). Hence, applying the high
temperature and pressure condition to the aqueous substrate can enhance phenolic extraction
or conversion form highly polymeric tannins. An overview of phenolic compounds, their
composition and their health effects are provided below.
2.6.1 Plant phenolics: Chemistry and characterisation
Phenolic compounds (or polyphenols as they are mostly contain more than one phenol
group in their structure) are secondary metabolites in plant kingdom which are present in
variety of structures, starting from quite simple skeleton of phenolic acids, flavonols and
catechin and extend to more condensed structures such as tannins with molecular weights in
excess of 500 and up to 20,000 for proanthocyandins. Currently, more than 8,000 of these
phenolic compounds have been identified and determined in plants, where they are
synthesized. The major role of these compounds in plants is to protect them from
environmental threats such as UV light, microorganisms, and chemical factors.
Phenolic compounds are divided into two major classes: Flavonoids, which are the
major ones and include a range of different compounds and non-Flavonoids within which the
phenolics acids are the most known ones.

Chapter 3- PROPERTIES OF THE SUBCRITICAL WATER TREATED EXTRACTS
72
2.6.1.1 Flavonoids
This group of phenolics are one of the most common and widely distributed types of
plant phenolics and they usually occur as glycosides. As a group, it is believed that they are
the most associated phytochemical class with antioxidant values in plants (Urquiaga &
Leighton 2000). Their common structure is that of diphenylpropanes (C6-C3-C6) and
consists of two aromatic rings linked through three carbons that usually form an oxygenated
heterocycle (Proestos et al. 2008).
Fig 2.18 shows different subgroups of flavonoids and the main skeleton of flavonoids
are listed in Fig 2.19 with an examples molecule in each group. Major difference between
these subgroups is due to structural variations within their main structure which divides the
flavonoids into several groups which are classified as below (Rice-Evans et al. 1997):
Figure 2.18 Structures of the flavonoids. The basic structure consists of the fused A and C rings, with the
phenyl B ring attached through its 1' position to the 2-position of the C ring (numbered from the pyran
oxygen) (Rice-Evans et al. 1997)

Chapter 3- PROPERTIES OF THE SUBCRITICAL WATER TREATED EXTRACTS
73
Flavonols, like quercetin and kaempferol with the 3-hydroxy pyran-4-one C ring. It is found
in all plants with bright colours, such as berries and broccoli.
Flavanols (Flavan -3-ols) lacking the 2,3-double bond and the ketone bond. Mostly found in
black and green tea, berries and dark chocolate. Single structures (monomers) are called
catechins whereas multiple-unit structure (dimers, trimers or polymers) are called
proanthocyanidins.
Isoflavones (like genistein and daidzein), in which the B ring is located in the 3 position on
the C ring. They are mostly found in soy products.
Flavanones which are the characteristic phenolic in citrus fruits (oranges, grapefruit,
lemons) examples are naringenin, silybin, and hesperidin.
Flavonals (anthocyanins) mainly in red, purple and blue fruits and vegetable
(examples are cyanidins and malvidin).
Figure 2.19 Flavonoids and their subgroups

Chapter 3- PROPERTIES OF THE SUBCRITICAL WATER TREATED EXTRACTS
74
2.6.1.2 Non-Flavonoids
Non-flavonoids are mostly consisting of phenolic acids (such as ellagic acid, tannic
acid), hydroxycinnamic acid derivatives (such as caffeic acid, chlorogenic acid, ferulic acid
coumaric acid, lignans and stilbenes such as resveratrol. Table 2.11 compares the molecular
structure of two main groups of phenolic acids.
Nonflavonoids form the major part of phenolic composition of the wine and have a
significant effect on the sensory parameters of it (Moreno-Arribas & Polo 2009).
Table 2. 11 Structures of hydroxybenzoic acids (A) and hydroxycinnamic acids (B) (adapted
(Moreno-Arribas & Polo 2009)

Chapter 3- PROPERTIES OF THE SUBCRITICAL WATER TREATED EXTRACTS
75
2.6.2 Biological and Health Effects of Polyphenols
Phenolics, in general, have been proved to lead the beneficial health effects of
vegetables and fruits and their contribution to the antioxidant capacity of the human diet is
much larger than that of vitamins. A combination of free-radical scavenging and
epidemiological studies have shown that there is an inverse relationship between the intake
of flavonoids, in particular, and the incidence of certain diseases and malignancies (Rice-
Evans et al. 1997). There are number of studies which study the effect of phenolics intake
and their role on prevention or control of various diseases including different cancers such as
breast cancer (Malin et al. 2003), skin cancer (Svobodová et al. 2003), colon cancer
(Rajamanickam & Agarwal 2008) and other diseases such as type 2 diabetes, heart diseases,
asthma (Knekt et al. 2002). A key factor in such studies, however, was to show how active
these compounds are in the body or in other terms to investigate their bioavailability. This
parameter show the ability of a certain compound to be adsorbed in the digestive tract and
exert its activity in the blood plasma. In a major review by Monarch et al. which compared
the results from 97 studies, the most well-adsorbed polyphenols were reported to be gallic
and isoflavones followed by catechins, flavanones and quercetin glucoside (Manach et al.
2005).
2.6.3 Determination of Phenolics-Review of techniques and samples
The analysis of phenolic compounds can be carried out using different techniques
which are described below. These techniques can be classified into six main groups, based
on the type of the phenolics which introduced in section 2.6.1. Following, an overview of
these methods are provided based on the related type of compound.
Total Phenolics, which is based on measuring all the available phenolic compounds.
The most common method is the Folin-Ciocalteau assay which was developed specifically
Chapter 3- PROPERTIES OF THE SUBCRITICAL WATER TREATED EXTRACTS
76
for phenolics by Singleton and Rossi (Singleton & Rossi 1965) and employs the Folin-
Ciocalteau reagent which originally was prepared for protein measurement. Other methods
worth noting is the recently developed cyclic voltammetry that measures the redox potential
of the phenolic compounds. In general, these non-specific assays suffer from the lack of
differentiation of phenolics and tend to overestimate total phenol contents due to interference
of reducing substances (Schieber et al. 2001).
Monomeric or individual phenolics: Which are measured mostly by reversed-phase
high performance liquid chromatography (RP-HPLC) that separates different phenolic
monomers and quantifies them with high accuracy. They also result in a characteristic UV
spectrum due to their aromatic structure which is simple to measure as usually no
derivatisation is required prior to UV spectroscopy.

Chapter 3- PROPERTIES OF THE SUBCRITICAL WATER TREATED EXTRACTS
77
1=Arbutin, 2=gallic acid, 3=5-hydroxymethyl furfural, 4= protocatechuic acid, 5=procyanidin B1, 6=4-hydroxybenzoic. acid, 7=catechin, 8=chlorogenic acid, 9=procyanidin B2, 10=caffeic acid, 11=syringic acid, 12=epicatechin, 13=p-coumaric acid, 14=ferulic acid, 15=sinapic acid, 16=quercetin-3-rutinoside, 17=quercetin-3-galactoside, 18=quercetin-3-glucoside, 19=quercetin-3-xyloside, 20=quercetin-3-arabinoside, 21=quercetin-3-rhamnoside, 22=isorhamnetin-3-glucoside, 23=phloridzin, 24=cinnamic acid, 25=quercetin, 26= phloretin (Schieber et al. 2001).
Figure 2.20 Separation of a standard mixture of phenolic compounds (and 5-hydroxymethyl furfural
and cinnamic acid) by RP-HPLC (280 nm).

Chapter 3- PROPERTIES OF THE SUBCRITICAL WATER TREATED EXTRACTS
78
A common HPLC setup for phenolics analysis consists of a reversed phase column
followed by a single or multi wave UV detector or diode-array detectors (DAD) which
provides more data points and generate UV spectrum for each peaks in chromatogram
(Lazarus et al. 1999; B. Suárez et al. 2005; Schieber et al. 2001; Rizzo et al. 2006; Proestos
et al. 2008; Q. Liu, Cai, et al. 2008; Mattila & Kumpulainen 2002). An optimized HPLC
method is able to separate and identify several phenolic acids in a single injection as shown
in fig 2.20 In order to have more accurate results that are accompanied by structural
information of the chemicals, coupling a MS detector to the HPLC (LC-MS) or using GC-
MS machine have been suggested in different studies (Lazarus et al. 1999; Mane et al. 2007;
Rosa M. Alonso-Salces et al. 2004). However, using Gas chromatography-Mass
Spectroscopy (GC-MS) requires the compounds to be volatile and thermo-tolerant.
Derivatisation techniques are mostly required GC analysis of phenolic compounds because
of their high boiling point (Zuo et al. 2002). Generally, LC-MS has been reported the most
useful techniques for structural elucidation and confirmation of soluble and insoluble (highly
polymeric) plant phenolics (R.M. Alonso-Salces et al. 2001).
However, the diversity and large distribution of these compounds leads to some
difficulties, in terms of determination and separation of similar compounds that can be an
analytical challenge. This is specially the case in apple phenolics while the simultaneous
determination of quercetin glycosides and benzoic and cinnamic acid derivatives and
dihydrochalcones are required which have similar structures (Schieber et al. 2001).
Flavanols, which normally involves a reaction with aldehydic reagents, followed by
spectrophotometric measurement.
Proanthocyanidins, can be measured by cleaving the bonds between these compounds
to form the subunits and then measuring the monomeric phenolics with HPLC. Alternatively,

Chapter 3- PROPERTIES OF THE SUBCRITICAL WATER TREATED EXTRACTS
79
they can be measured using techniques which separate molecules based on their size or
molecular weight, such as size-exclusion chromatography (SEC).
Tannins, which can be measured by protein precipitation (UC Davis protein
precipitation assay) which measures anthocyanins, tannins, small polymeric pigments and
large polymeric pigments (Harbertson et al. 2002).
Polymeric phenols are measured normally with normal-phase high performance liquid
chromatography (NP-HPLC) (A Yanagida et al. 2000) or SEC (Akio Yanagida et al. 2003).
2.6.4 Phenolics in the apple
Apple, as a rich source of polyphenols, has been the subject of different
epidemiological studies and in vitro experimental researches that have addressed its
contribution to human health and different diseases. They are an excellent source of
numerous phenolic which is why it shows high nutritional values and significant antioxidant
activity. The phenolic content and antioxidant activity of apple have been studied in several
studies. It is been found that apples had the highest soluble free phenolics comparing to 10
other commonly consumed fruits (J. Sun et al. 2002). In a work by Khanizadeh et al., the
antioxidant capacity of 20 fruits was measured using the oxygen radical absorbance capacity
assay (ORAC), and apple was showed to be ranked 8 out of 20 (Khanizadeh et al., 2008). In
another study by Boyer and Liu, it was reported that apples have the second highest level of
antioxidant activity compared to many other commonly consumed fruits in the United States
(Fig. 2.21) (Boyer & R. Liu 2004). Several authors measured total antioxidant capacity
(TAC) in apple using total oxyradical scavenging capacity (TOSC) assay and showed higher
TOSC in the peel of apple than in the flesh. Not only is the concentration of the total

Chapter 3- PROPERTIES OF THE SUBCRITICAL WATER TREATED EXTRACTS
80
phenolic compounds is higher in the peel than in the flesh, peel is a the only source of
quercetin glycosides (Khanizadeh et al., 2008).
In vitro studies (K. W. Lee et al. 2003; Rezk et al. 2002) have suggested that phenolic
compounds in apple show high antioxidant properties and there is a direct link between apple
juice consumption and level of antioxidant in blood plasma (R. Bitsch et al. 2000). It has also
been reported that this effect extends to the related products and by products of apple (apple
juice, cider) and its by-products such as pomace (Diñeiro García et al. 2009; Schieber et al.
2003). Polyphenols, which are the more condensed structures comprised of phenolic acids
and other small phenolic molecules, have great importance in the nutritional and commercial
properties of food products due to their sensory properties such as colour and flavour (R.M.
Figure 2.21 Antioxidant activity of various fruit extracts (Boyer & R. Liu 2004)

Chapter 3- PROPERTIES OF THE SUBCRITICAL WATER TREATED EXTRACTS
81
Alonso-Salces et al. 2001). This indicates the importance of polyphenolic composition
of the used apple varieties in the quality of the produced cider. Cider taste is affected by
procyanidins and their degree of polymerization as astringency increases by their degree of
polymerization and bitterness follows the opposite trend (Rosa M. Alonso-Salces et al. 2004)
After averaging different apple varieties, the most concentrated phenolics in apple
were indicated as quercetin-3-galactoside (13.2 mg/100g fruit, vitamin C, 12.8 mg/100 g
fruit; procyanidin B, 9.35 mg/100 g fruit; chlorogenic acid, 9.02 mg/100 g fruit; epicatechin,
8.65 mg/100 g fruit, and phloretin glycosides, 5.59 mg/100 g fruit (K. W. Lee et al. 2003).
Based on these epidemiological studies, it appears that apples may play a major role in
reducing the risk of a wide variety of chronic disease and maintaining a healthy lifestyle in
general (Boyer & R. Liu 2004).
2.6.5 Phenolics Interaction with the Yeast Cells
While yeast cells are believed to partly contribute their cellular ingredients (such as
vitamins, amino acids and other nutrients) to the final extract, they have been reported to
target suspended phenolic compounds by (mainly) physically adsorbing them on their outer
cell wall in wine process. The yeast cell wall is made of different components with
mannoproteins and oligopolysaccharides covering its outer surface. These mannoprotein are
also bound to glucanose and chitin which makes a mixture of different polymers and sites
with different levels of polarity, hydrophobicity and hydrophilicity each are potentially offer
affinity for different molecules in wine and cider such as metabolic intermediates, pigments
flavonoids (e.g. anthocyanidins) and volatile compounds (Morata et al. 2003). Another key
factor is the high porosity of the wall leading to higher surface areas which favour the
adsorption of different compounds. Studying the adsorption of procyanidins (which are more
condensed phenolic structures) on the apple cell wall, Le Bourvellec at al. reported that the

Chapter 3- PROPERTIES OF THE SUBCRITICAL WATER TREATED EXTRACTS
82
polysaccharide plays the major role on this interaction and suggested that adsorption
increases with ionic strength and decreases with increasing temperatures (Le Bourvellec et
al. 2004). Based on these results, they suggested that the bonds which govern this interaction
were weak bonds like hydrogen bonds and hydrophobic interaction.
Phenolic adsorption on yeast cells has been studied extensively in wine fermentation
and was shown to have a significant effect on wine properties such as its colour, astringency
and bitterness (J. M. Salmon 2006). In particular, anthocyanins are the main group of
phenolics which their adsorption on yeast have been extensively studied due to their role on
the wine colour (Morata et al. 2003; K. Medina et al. 2005; Morata et al. 2005). Similar to
wine process, the concentration of phenolics can be affected throughout the cider making. In
addition, it worth noting that there are other steps in this process such as enzymatic
treatment, maceration and other physical clarification steps such as filtration, centrifugation
and pressing (Nogueira et al. 2008).
Apple pulp and pomace have been shown to adsorb procyanidins due to their
interaction with the cell-wall matrix (Catherine M. G. C. Renard et al. 2001). In addition to
the discussed mechanisms, yeast cells have been reported to affect the phenolics
concentration during cider fermentation (Nogueira et al. 2008). This interaction is attributed
to the exposed oligopolysaccharides and mannoproteins which are exposed on the yeast cell
wall (Morata et al. 2003). While the focus have been on the phenolic take-up, only few
studies addressed the desorption of previously adsorbed phenolics from the spent yeast cells.
Hence, it is still not very clear how this interaction works and what are the main controlling
parameters influencing this. The release of phenolic compounds have been studied
previously from adsorbents such as activated carbon (Salvador & Merchán 1996) and wine
lees (Mazauric & J.-M. Salmon 2006), and it was of the special interest in this project to

Chapter 3- PROPERTIES OF THE SUBCRITICAL WATER TREATED EXTRACTS
83
investigate the possibility of using subcritical water to replace organic solvents. The ongoing
research on subcritical water extraction suggests its use in parallel to traditional organic
solvents for the extraction of natural compound offering a solvent-free process (Conde et al.
2009; Japón-Luján & Luque de Castro 2006). As the cider yeast cells have been in contact
with a pool of numerous phenolic compounds, they are believed to have retained and
adsorbed phenolic compounds based on the same principles as in the wine process.

Chapter 3- PROPERTIES OF THE SUBCRITICAL WATER TREATED EXTRACTS
84
Chapter 3
3.1 Introduction
Yeast cells, which form the main structure of solid residues in the studied feedstock
(cider lees) can be regarded as an alternative source of monosaccharides as well as other
high-value compounds such as yeast nutrients or compounds which originate from apple.
Cider lees was subjected to the hydrolysis experiments in a batch system and at high
temperature and pressure (100-250 °C, 100 bar) up to 30 mins. The treated samples
(hydrolysed yeast) were subjected to a series of analytical techniques in order to determine
the major physiochemical characteristics of the extracts namely Total Organic Carbon
(TOC), total protein content, total solids and total dry weight, UV-absorbance, Scanning
Electron Microscopy (SEM) and Transmission Electron Microscopy (TEM).
This chapter details the properties of the extracts in terms of protein content, total
organic carbon, total phenolics content, antioxidant activity, solid and liquid phase dry
GENERAL PROPERTIES OF SUBCRITICAL WATER TREATED CIDER SPENT YEAST

Chapter 3- PROPERTIES OF THE SUBCRITICAL WATER TREATED EXTRACTS
85
weights and overall structure of the cells using scanning electron microscopy (SEM) and
transmission electron microscopy (TEM). The effect of temperature has been examined in
order to ascertain the influence of conditions of hydrothermal process on the cider lees.
3.2 Materials and methods
3.2.1 Raw Material (Cider Lees)
20 litre of cider lees was collected from the Bulmer manufacturing plant in Hereford,
UK on May 2009, was transferred and packaged on the same day and stored in 250 ml
bottles at -20 °C freezer in the School of Chemical Engineering, University of Birmingham.
This was to minimize any possible variability in the samples that may occur (pH and solid
concentration) during the experiments. No significant change was observed in the stored
samples after being stored in -20 °C for up to 6 months. All the experiments and
measurements were carried out on the same samples during 6 months. Prior to each
experiment or assay, samples were defrosted at room temperature to restore its original form.
3.2.2 Batch hydrolysis reactions
The hydrolysis experiments in this section were carried out in a high pressure bench-
top magnetic-stirred batch reactor model 5500 from Parr Instruments Company, USA. Fig
3.1 shows the schematic diagram of the rig where the experiments were carried out. The
reactor was constructed with 316 stainless steel and it was equipped with an electric heater
and a magnetic stirrer. The temperature and the stirrer speed was set and controlled with a
separate Control unit model 4838 from Parr Instruments Company, USA.
The main reactor features and fittings are listed below:
Total reactor volume = 300 ml

Chapter 3- PROPERTIES OF THE SUBCRITICAL WATER TREATED EXTRACTS
86
Reactor internal diameter (ID) = 55mm
Reactor inside height = 135mm
K-type thermocouple, with accuracy of ± 1 °C
Aschcroft pressure gauge with accuracy of ± 0.25 MPa
Pressure bursting disk
Sampling valves: Butterfly valve (stainless steel)
Stirrer control: a 4-blade turbine impeller, speed control from 0-1500 rpm
Stirred shaft height = 90mm; Stirred shaft diameter = 5.5mm
Pressure release valve: Butterfly valve (stainless steel)
3.2.3 Experimental method
Figure 3.1 shows a schematic diagram of the experimental rig used for the hydrolysis
experiments in this chapter. Before each run, the reactor was washed and cleaned with
distilled water to make sure no residue is left from previous experiment and was loaded with
200 ml sample (cider lees)

Chapter 3- PROPERTIES OF THE SUBCRITICAL WATER TREATED EXTRACTS
87
The reactor was closed by placing its head/lid on the top of it and fixing the two bolt
clamps which were tightened with spanners allowing the reactor to be firmly closed. A PTFE
o-ring fixed between the body and the lid of the reactor guaranteed that no leaks took place.
All inlet and outlet ports in the reactor were placed on the head of the reactor. Nitrogen gas
(laboratory grade, BOC, UK) was used to pressurise the reactor by opening valve (V-1). The
pressure inside the reactor was maintained at 100 bar and recorded by using the pressure
gauge (PI-1). The pressure was controlled during reaction by opening either valve (V-1) to
increase the pressure or valve (V-2) to decrease it. Heating and stirring was then started.
Figure 3. 1. Schematic diagram of the batch hydrolysis experiments

Chapter 3- PROPERTIES OF THE SUBCRITICAL WATER TREATED EXTRACTS
88
The reactor was heated to the desired temperature (ranging from 100 – 300 °C) by an
external electric heating jacket. The temperature was measured by an iron-constantan
thermocouple (K-type) which was connected to the heating control unit. The combined
heating and stirrer speed controller was calibrated by the manufacturer to assure uniformity
throughout the experiments. A 1/4 inch stainless steel inner tube cooling line was used to
provide cooling to the reactor. This U-shaped tube was connected to two free ports on the
head/lid of the reactor. Cooling was provided by pumping cold water from a cooling bath
when required (P-1) (Peristaltic pump, Watson Marlow). The reaction time was measured
with a digital stop watch as soon as temperature reached the set value.
Stirring was provided by a magnetic stirrer which was pre-installed on the reactor head
by the manufacturer. Stirrer speed was set to 500 rpm for all the experiments. To prevent the
magnetic stirrer head from being overheated, cooling water from the water bath was
continuously circulated using a separate line connected to another peristaltic pump (P-2)
(Peristaltic pump, Watson Marlow).
7 to 10 samples (7 ml each time) were taken from the reactor at regular intervals
(varying from every 2 mins to every 5 mins depending on the operating temperature). To
achieve this, first valve (V-3) was opened for a short time while valves (V-4 and V-5) were
kept close. When the sampling line (volume 7 ml) containing the extracts was cooled down
in the ice-cooled water bath, valve (V-5) was gradually opened and the contents were
collected in a falcon tube. Samples were stored in freezer -20 °C after each sampling. To
clean the line ready for the next sampling, pressurised air (from compressed air line already
available in the pilot plant lab which was connected to the department’s air compressor,
Chemical Engineering Department, University of Birmingham) was introduced to the line by

Chapter 3- PROPERTIES OF THE SUBCRITICAL WATER TREATED EXTRACTS
89
opening the valve (V-4) in order to purge any remaining sample left in the sampling line
through valve (V-5).
At the end of the experimental run after all the samples were taken, heating was
stopped and the reactor was allowed to cool down by starting pump (P-1). Reactor was
depressurised before opening the reactor head/lid by opening valve (V-2) and the reactor was
fully washed with water. The main reactor cylinder which was removable was washed with
copious amounts of water and dried with paper tissue after each run and before start the next
experiment.
3.2.4 Total Organic Carbon (TOC) Analyser
To measure the total organic carbon dissolved in the liquid phase, samples were first
centrifuged at 16000 rcf (rotational centrifuge force) with a bench-top micro-centrifuge
(5418, eppendorf) for 10 min and the supernatant was used for TOC analysis. Three replicate
samples were diluted 1:100 with distilled water each time prior to measurement by a 5050-A
Shimadzu TOC analyser. The TOC was obtained by subtracting the IC (inorganic carbon)
from the TC (total carbon). The TC was measured by a catalytic oxidation carried out at 953
K. The reaction takes place in a quartz combustion tube packed with platinum catalyst,
which is contained in an oven that is maintained at reaction temperature. The oxidant
material for the reaction is a high purity air, which is continuously saturated with water and
introduced into the combustion tube. The air is also used as a carrier gas. When the sample is
injected into the combustion vessel the carbon in the sample is converted to CO2. The gas
then carries the oxidation products into an IC reactor vessel, after which the products are
cooled and dried. The gas sample is sent into a halogen scrubber and then to a cell where the
CO2 is quantified by a non-dispersive infrared (NDIR) gas analyzer based on the area of the
signal produced by the sample.

Chapter 3- PROPERTIES OF THE SUBCRITICAL WATER TREATED EXTRACTS
90
The measurement of IC is performed by introducing the sample into the IC reactor
vessel where the carrier gas flows as tiny bubbles through the IC reagent (phosphoric acid
solutions at 20% wt). Only IC is decomposed to CO2 which is then taken to the NDIR
detector. The concentration of the IC in the solution is calculated following the same
principle as the TC content.
3.2.5 Total Protein Measurement
To measure the concentration of suspended proteins in the solution of hydrolysed yeast
samples, Coomassie Plus (Bradford) kit (23238, Pierce, IL) was used which is based on
measuring the colour change after the reaction between the reagent and protein molecules
(Bradford 1976). When Coomassie dye binds proteins in an acidic medium, an immediate
shift in absorption maximum occurs from 465 nm to 595 nm which was measured using UV-
Spectrophotometry technique. Bovine serum albumin was used as the standard for preparing
calibration curve from a 2 mg/ml standard ampoule. Diluted albumin standard (BSA), which
was provided by the protein kit, were prepared in concentration ranging from 2 mg/ml to 25
µg/ml. Samples were first centrifuged (Model 5418, eppendorf) at 10.000 g for 10 min to
remove the solid particles and 1 ml of supernatant was collected and used for protein
measurement. Supernatants were diluted to 1:50 using distilled water and 25 µl was taken
from the diluted samples and loaded in 96-well plate. Three replicates were used at each
time. Measurement was carried out using a 600 nm plate reader.
3.2.6 Dry weight measurements
Samples’ total dry weight was measured by placing 1 ml of each sample in an aluminium
weighing dish in a drying cabinet at 105 °C for a minimum of 24 h (24 h drying time was the
minimum sufficient time to guarantee no change in the weight of the sample). Dry weight

Chapter 3- PROPERTIES OF THE SUBCRITICAL WATER TREATED EXTRACTS
91
was calculated by subtracting the weight of the dried dish from the weight of the non-dried
dish. In addition, dry weight of the liquid phase was also measured by first removing the
solid particles using a centrifuge (16000 rcf *, 10 min) and drying 500 µl of supernatant
using the same technique. Results from this section were used to evaluate the effect of the
temperature on solubilising the solid particles and its contribution to the total dry mass of
sample.
Crude samples and the extracts were in the form of slurry and dry weight measurement
includes both the dry weight of the solid particles and non-volatile compounds. To
differentiate these two factors, samples were divided into the solid fraction and liquid
fraction by centrifugation. Samples were collected at different times and a known amount
was transferred to pre-weighted 1.5 ml eppendorf tubes. After centrifugation at 16000 rcf at
10 min, 500 µl of the supernatant was transferred to another pre-weighted tube.
All the tubes were dried in a drying cabinet at 105 °C for a minimum of 48 h and the dry
weight of each fraction was calculated.
3.2.7 UV-spectrophotometry
To evaluate the UV spectrum of the extracts, a CECIL spectrophotometer (Model CE
7200) was used in the wavelength range of 200-600 nm. Samples had to be diluted from
1:10 to 1:100 in order to be in range with the calibrated measurement scale. 1 ml of final
sample was used for each cuvette and the absorbance was measured by comparing it to
distilled water used as the reference.
* Relative centrifugal force

Chapter 3- PROPERTIES OF THE SUBCRITICAL WATER TREATED EXTRACTS
92
3.2.8 SEM and TEM
To study the effect of the reaction condition on the surface of the cell walls, Scanning
Electron Microscopy was carried out using by a PHILIPS SEM (XL30 ESEM FEG).
Transmission Scanning Microscopy (TEM) was also used to study the changes in the
intracellular structure of the cells before and after the yeast cells were subjected to different
hydrolysis conditions. To prepare the samples for microscopic analysis, samples were added
to a 2.5% glutaraldehyde solution and kept in the fridge for primary fixation. The samples
were then placed on plates and they were dried with 70, 90 and 100% ethanol for 30 min
each time. Plates were immersed in liquid CO2 for 60 min at 81 bar and 31 °C for completely
removing the water. The dried sample were mounted on electron microscope stubs, coated
with 15 nm gold and examined under SEM. SEM and TEM measurement s were carried out
in metallurgy and material department, University of Birmingham.
3.2.9 Total Phenolic Content (TPC)
Phenolic content of the extracts was measured using Folin-Ciocalteau assay developed
by Singleton et al. (Singleton & Rossi 1965). This method is based on the Folin-Ciocalteau
(FC) Reagent which is a mixture of hexavalent salts of Molybdenum and Tungsten and
initially was used to measure the protein concentration due to the fact that the tyrosine which
is present in proteins, give positive response to this test (Miniati 2007). Under alkaline
conditions, phenols ionise completely and can be oxidised by the FC reagent. This causes a
colour change from yellow to blue which can be measured with a spectrophotometer. Today,
this reagent is widely used to measure the total polyphenolic content in foods, beverages and
biological samples.
The Folin-Ciocalteau micro method was developed by Waterhouse and it was used for
the samples as described below (Waterhouse, 2005).

Chapter 3- PROPERTIES OF THE SUBCRITICAL WATER TREATED EXTRACTS
93
FC reagent was purchased as 2N solution ready to use from Sigma (Sigma-Aldrich,
UK). Sodium carbonate solution was prepared by dissolving 20 g of anhydrous sodium
carbonate (99.99%, Sigma-Aldrich, UK) in 80 ml of distilled water and heated until boiling.
After cooling, few crystals of sodium carbonate were added, stored for 24 h, filtered and
water was added to complete 100 ml volume solution in a volumetric flask. Calibration
samples were prepared by using solutions of 50, 100, 150, 250 and 500 mg/L of gallic acid
(97% Sigma-Aldrich, UK). Standard curve was prepared using these samples and the results
were reported in terms of Gallic Acid Equivalent (GAE). Samples were first centrifuged to
remove the solid particles in 1.5 ml micro tubes at 16000 rcf for 10 min. In a separate cuvette
20 µl of sample was added to 1.58 ml of water and 100 µl of FC reagent totalling 1700 µl in
volume. The mixture remained at room temperature for 5 minutes, and then 300 µl of the
sodium carbonate solution was added to the mixture and shaken to mix. Samples were left at
room temperature for 2 hr before the absorbance could be measured at 765 nm against the
blank solution (20µl of distilled water). Calibration curve was prepared first which was used
to calculate the unknown concentration of the samples.
3.2.10 Antioxidant activity
DPPH assay was used to measure the scavenging activity of the samples using the
method developed by Lee et al (S. K. Lee et al. 1998) for microplate analysis. This assay is
based on the reducing power of solution against 2,2-diphenyl-1-picrylhydrazyl (DPPH) free
radical and measuring the resulting colour change with spectrophotometry. DPPH is purple
in colour which is because of an odd electron in its structure and gives a strong absorption at
517 nm. When this electron is paired with hydrogen from antioxidant compounds DPPH is
reduced, causing the colour to change from purple to yellow. The resulting change in colour
is stoichiometric with respect to number of electrons captured.

Chapter 3- PROPERTIES OF THE SUBCRITICAL WATER TREATED EXTRACTS
94
3.3 Results and Discussion
The main objective of this section was to investigate the effect of reaction parameters
(temperature, time and pressure) on the structure and composition of the cider spent yeast
sample. Initial screening tests were carried out in order to verify if the selected reaction
parameters already stated above had any affect on the selected properties of the extract such
as TOC, TPC, Dry Weight, UV to name a few. Results of all the studied parameters showed
that when different pressures of 3, 6 and 10 MPa were studied, they did not have an effect on
the selected properties of the extract as opposed to temperature and time of the reaction.
Thus, all the results are reported at different temperatures and times whilst the pressure was
kept constant at 10 MPa. This is despite the fact that water properties would change at higher
temperatures in terms of its polarity, ion product and density. These effects were believed to
have no or minor effect contribution to the outcomes of the experiments. Results from each
experiment are provided accordingly in the following sections.
3.3.1. General Properties of the crude sample
As discussed earlier, samples were mainly consisted of yeast cells which accounts for
the major contribution to dry weight (solid concentration) of the slurries. Total dry weight of
the crude samples was measured by drying 10 ml of the crude sample in an aluminium dish
in a drying cabinet at 105°C for minimum of 24 h. The total dry weight (which is a sum of
liquid known as the supernatant and solid dry weights) measured value was 14.5 ± 1 % (w/v)
was slightly different (13-15 % w/v) for different samples which were collected throughout
the year, so the same lot was used for all the experiments. This is because of the different
blends of apple juice and products that the manufacturer makes throughout the year, which
were used to make numerous brands of their cider. Also the dry weight of the supernatants
was also measured by first centrifuging the sample for 10 min at 4000 rcf to separate the

Chapter 3- PROPERTIES OF THE SUBCRITICAL WATER TREATED EXTRACTS
95
yeast cells. 10 ml of the supernatants were dried at the same conditions and the dry weight
was 3 ± 0.5 % (w/v). Based on these results, the total dry solids of the slurry were calculated
to be 11.5% (w/v). The pH of the samples was 3.6 ± 0.4 and it was measured with a pH
meter (Seveneasy®, METTLER TOLEDO). This acidic medium is a result of acidifying
agents present in the upstream of the fermentation (mainly lactic acid).
Potato dextrose agar (PDA) cell culture medium was prepared by using PDA culture
powder (Sigma Aldrich, UK) and distilled water and used to fill the dishes after sterilisation.
Figure 3. 2 Colonies of the yeast formed after incubation PDA culture plates with crude sample

Chapter 3- PROPERTIES OF THE SUBCRITICAL WATER TREATED EXTRACTS
96
Prepared agar plates were inoculated with crude samples in order to find out if the
yeasts cells were still viable. This medium is optimised for yeast growth and it was used in
the form of a premixed powder. Plates were incubated in 37 °C incubator for 48 h after being
inoculated. The growth of the yeast colonies were observed in the inoculated plates (Fig.
3.2), which also confirmed under the optical microscope.
The total number of living yeast cells was not measured and the test was carried out as
a qualitative analysis in order to determine if there is any living cell available in the samples.
This does not necessarily means that the slurry is only comprised of only living yeast cells
but it can be concluded that there is a population of yeast cells that may be in a vegetative
form which is common after fermentation. This fact was of special interest in our work and
has been fully discussed in the next chapter.
3.3.2 General characteristics of the extracts
The high pressure conditions in the rector prevented the formation of any vapour and
thus the volume of the reactant was remained almost the same. Despite this, gaseous product
formed during the reaction was due to the decomposition of the organic compounds which
occurred at high temperature. The presence of the smoke was more considerable at higher
temperatures (>175 °C) while the odour was also stronger. No gas phase analysis were
carried out in this work but other studies suggested that major gases were produced from
subcritical water treated biomass at similar process conditions were CO2, CH4, H2 and CO
(Feng et al. 2004) .
Colour and odour of the samples did not change much when treated to temperatures up
to 125 °C. At higher temperatures the colour in the liquid fraction or supernatant started to

Chapter 3- PROPERTIES OF THE SUBCRITICAL WATER TREATED EXTRACTS
97
change slightly from light-brown as in the original crude sample to brown and the extracts
started to lose the characteristic cider odour (Fig 3.3).
This colour change was observed in both the solid residue and liquid fractions after
these two were separated by centrifugation. Samples tend to became more viscous and sticky
between 150 and 200°C but this changed back to a less viscous sample at higher
temperatures (> 225 °C). At this stage, it is believed that the caramelisation of sugars
(available and/or released fraction) occurred which was indicated by the distinctive odour of
browning reaction in the extracts. When the samples were treated at 225 °C and higher
temperatures, solid residues start to turn black and burning occurred. At these conditions, the
supernatant also became dark red which is believed to be due to the considerable levels of
hydrolysis and solubilisation of the organic compounds.
The pH of the samples was also measured after reaction at different temperatures and a
slight change was observed. The pH of the crude sample was originally 3.7 and it changed to
4.2 at 250 °C after 30 mins. Although it is expected to see lower pH due to formation organic
Figure 3. 3. Colour change in the supernatant of the samples at different temperatures. Reaction time
was 30 minutes and the pressure was 60 bar for all the samples

Chapter 3- PROPERTIES OF THE SUBCRITICAL WATER TREATED EXTRACTS
98
acids in these conditions, it is believed that the degradation power of subcritical water had
the major effect on pH by removing the existing organic acids and/or the ones that may had
been generated.
Reaction temperature, however, had a remarkable effect on the dry weight and the
solid concentration of the extracts which is discussed in the next section.
3.3.3 Solid concentration and sample dry weight
Yeast solids have been previously shown to hydrolyse at the same conditions used
above due to the upgraded hydrolytic power of water in subcritical conditions (Lamoolphak
et al. 2007). The main compounds structures which are subject to the hydrolysis are the
carbohydrate backbone of the cell wall, highly polymerised proteins and other combinatorial
structures. The main outcome of this reaction is solubilisation of solids in the liquid phase,
formation of monomers (such as monosaccharides and amino acids) and also the formation
Figure 3. 4 Total dry weight of the extracts (solid and liquid) at diffferent temperatures after 30
mins at 100 bar
0
2
4
6
8
10
12
14
To
tal
dry
we
igh
t (%
wt)
100 150 200 225 250 300
Temperature (ºC)

Chapter 3- PROPERTIES OF THE SUBCRITICAL WATER TREATED EXTRACTS
99
of increased levels of gaseous products at higher temperatures (> 250 °C). The latter would
normally result in the drop of the total dry mass of the extracts at these conditions. This
weight loss was also observed in our experiments as the total dry weight start to decrease at
225 °C and higher (Fig 3.4).
At higher end of the temperature range, up to 30% (at 300°C) of the sample was turned
to gaseous products and left the reaction medium. Yeast cell solubilisation was further
investigated by separating the solid and liquid/ supernatant fractions of the extracts and
measuring the dry weight of each fraction. This indicated the degree of solid solubilisation
and also how much of the solubilised compounds may have left the liquid fraction or phase,
either due to the gas formation or dropping out of the liquid phase by centrifugation force
after forming larger/heavier structures or aggregates at these conditions.
Solids and liquids/supernatants fractions were separated and dried following the
method described in section 3.2.5 and the results are summarised in Fig 3.5. Increasing
temperature had a significant effect on the solubilisation of the solids in the medium. This
however was not observed at 100 °C and the solid and liquid fraction did not change
significantly even after 30 min. At 150 °C, solids start to solubilise at higher rates especially
at longer reaction times. Solid concentration decreased by more than 50% when the
temperature increased to 200 °C. However, the same trend was not observed when the
reaction time increased. At the start of the reaction (t=0, when the temperature reached the
set temperature in the batch reactor), solid concentration was 40 mg/ml and increased
gradually to 50 mg/ml. In addition, when the temperature increased to 225°C, solid weight
was 60 mg/ml at t=0 and did not change significantly up to 30 mins. This is in contrast to the
constant drop in total dry weight by increasing temperature which was more pronounced at
temperatures higher than 200 °C. Some weight loss initially occurred during the heating-up

Chapter 3- PROPERTIES OF THE SUBCRITICAL WATER TREATED EXTRACTS
100
stage before time measurement starts, which are represented at t=0, the initial value of dry
weight for substrate (120 mg/ml) can be used for comparison. In addition, Figure 3.6 also
shows the normalized charts representing the values of solid/liquid ratio normalized in terms
of the values at t=0 of each reaction set.
Figure 3. 5 Solid and liquid/supernatant dry weight after subcritical water hydrolysis at
temperatures of 100-300 °C. Error bars represent standard error (n=3).
Solid-supernatant dry weight (100 C)
0
20
40
60
80
100
120
140
0 5 10 15 20 25 30time (min)
mg
/ml
Supernatant
Solid
Solid-supernatant dry weight (150 C)
0
20
40
60
80
100
120
140
0 5 10 15 20 25 30
time (min)
mg
/ml
Supernatant
Solid
Solid-supernatant dry weight (200 C)
0
20
40
60
80
100
120
140
0 5 10 15 20 25 30time (min)
mg
/ml
Supernatant
Solid
Solid-supernatant dry weight (225 C)
0
20
40
60
80
100
120
140
0 2 4 6 8 10 15 20 25 30time (min)
mg
/ml
Supernatant
Solid
Solid-supernatant dry weight (300 C)
0
20
40
60
80
100
120
140
0 2 4 6 8 10 15 20 25 30
time (min)
mg
/ml
Supernatant
Solid
Solid-supernatant dry weight (250 C)
0
20
40
60
80
100
120
140
0 5 10 15 20 25 30time (min)
mg
/ml
Supernatant
Solid

Chapter 3- PROPERTIES OF THE SUBCRITICAL WATER TREATED EXTRACTS
101
Figure 3. 6. Solid and liquid/supernatant dry weight after subcritical water hydrolysis at temperatures of
100-300 °C. Normalized to t=0 at each reaction temperature Error bars represent standard error (n=3).
Solid-supernatant dry weight-Normalised (100 °C)
0
50
100
150
200
250
0 5 10 15 20 25 30
time (min)
So
lid
/Liq
uid
ch
an
ge
(%
)-N
orm
ali
se
d
Supernatant
Solid
Solid-supernatant dry weight-Normalised (150 °C)
0
50
100
150
200
250
300
0 5 10 15 20 25 30time (min)
So
lid
/Liq
uid
ch
an
ge
(%
)- N
orm
ali
se
d
Supernatant
Solid
Solid-supernatant dry weight (200 °C)
0
50
100
150
200
250
0 5 10 15 20 25 30time (min)
So
lid
/Liq
uid
ch
an
ge
(%
)-N
orm
ali
se
d
Supernatant
Solid
Solid-supernatant dry weight (225 °C)
0
50
100
150
200
250
0 2 4 6 8 10 15 20 25 30time (min)
So
lid
/Liq
uid
ch
an
ge
(%
)-N
orm
ali
se
d
Supernatant
Solid
Solid-supernatant dry weight (250 °C)
0
50
100
150
200
250
0 5 10 15 20 25 30time (min)
So
lid
/Liq
uid
ch
an
ge
(%
)-N
orm
alis
ed
Supernatant
Solid
Solid-supernatant dry weight (300 °C)
0
50
100
150
200
250
0 2 4 6 8 10 15 20 25 30
time (min)
So
lid
/Liq
uid
ch
an
ge
(%
)-N
orm
ali
se
d Supernatant
Solid
Chapter 3- PROPERTIES OF THE SUBCRITICAL WATER TREATED EXTRACTS
102
While the decrease in total dry weight can be described by the gas formation,
interesting results were observed when the dry weight of liquid phase and solid phase was
compared. The dry weight of solid phase started to increase when the temperature increased
from 200 to 225 °C. This slight increase in dry weight remained almost unchanged at 250 °C
and decreased again at 300 °C. This increase in dry weight can be attributed to the formation
of larger molecules in those conditions (225 and 250 °C) that had been formed and dropped
out of the sample by centrifugation force. In this case, these compounds can contribute to
higher levels of dry weight in these residues. A possible explanation can be the conjugation
or polymerisation reaction that occurred between various components such as carbohydrates
(sugars), proteins, and phenolics released from the cell or pre-existing in the medium.
Formation of melanoidins, which are the aggregates of sugars and amino acids, can be
attributed to this effect as described earlier in Chapter 2 and the introduction to this chapter.
While the Maillard reaction is mostly studied at conditions of interest to food processing (-20
°C to 150 °C), it can also occur at higher reaction rates at temperatures as high as 250 °C
(Peterson 2009). The darker brown colour of the extracts at higher temperatures (250 °C) can
also be an indication of the occurrence of this reaction (Fig 3.3). The presence of phenolic
compounds in the medium, and the similarity of their structure to the proteins, can influence
the reaction resulting in the formation of further complex compounds which can be a subject
for further investigation beyond this work. The dry weight of the liquid fraction/phase
decreased at temperatures above 225 °C which is manly due to the gas formation or the
already discussed polymerisation reactions.
3.3.4 SEM and TEM
Scanning Electron Microscopy (SEM) provided a better picture of the overall change
on the cells’ surface when they undergo the subcritical water treatment process. The size of

Chapter 3- PROPERTIES OF THE SUBCRITICAL WATER TREATED EXTRACTS
103
the cider yeast cells (Saccharomyces bayanus) in the crude sample was approximately 3-5
µm compared to the average size of the brewer yeast cells (Saccharomyces cerevisae) which
is reported to be 10-15 µm. Fig 3.7 shows clusters of the untreated yeast cells with a spheroid
structures and a smooth outer wall surface. Scar buds which are common in yeast cells can
be seen in few of them.
When the crude sample was subjected to the reaction, the outer surface of the cells
experienced change and disfiguration. A selection of the SEM micrographs is shown in Fig
3.8 compares the treated cells at different temperatures. At lower temperatures (<140 °C),
bubbles were formed on the cell wall which is possibly are the result of cell wall polymers
release at these conditions. Also lipid content of the cell wall may have started to be release
from the cell resulting in the bubble formations. At higher temperatures (140 - 160 °C), a
fibrilliar structure emerged which lead to their agglomeration. This web-like structure could
be either the mannoproteins or other polymers in the cell wall (i.e. β-glucan). At
temperatures above 160 °C, more cell fragments can be observed and the cells seem to
Figure 3. 7 Yeast cells (S. Bayanous) in the substrate samples at two different magnifications a: 2000X
and b: 10,000 X
a b

Chapter 3- PROPERTIES OF THE SUBCRITICAL WATER TREATED EXTRACTS
104
decrease slightly in size. The integrity of the cells remained intact up to 200 °C and above
this temperature the cells notably were destroyed and converted to irregularly shaped
particles. Fig 3.9 shows the Transmission Electron Microscopy (TEM) micrographs of the
yeast cell before and after treatment. The treated samples subject to temperatures of 160 °C
or above shows the organelles and internal content of the cells being affected. While no
visible effect was observed at temperatures up to 140 °C, it seems that the cells started to
loose their intracellular contents at 160 °C which resulted in their size reduction. A change in
the cell wall can be observed at temperature as low as 140 °C, where the cell wall line
becomes less distinct. A web-like structure was observed with SEM at this same
temperature. The cell wall started to completely disappear from the cell’s main body, either
solubilised or form individual aggregates with or without contribution of other components
such as proteins and phenolics. This can explain the origin of the smaller particles that start
to form at 180-200 °C adjacent to the cells (Figs 3.8 and 3.9).

Chapter 3- PROPERTIES OF THE SUBCRITICAL WATER TREATED EXTRACTS
105
Figure 3. 8 TEM images of the yeast cells after being treated at different temperatures (X=5,000
for all the images except the crude sample image which is at X=20,000)

Chapter 3- PROPERTIES OF THE SUBCRITICAL WATER TREATED EXTRACTS
106
Figure 3. 9 SEM images of the yeast cells after being treated at different temperatures (X=10,000 for
all the images)

Chapter 3- PROPERTIES OF THE SUBCRITICAL WATER TREATED EXTRACTS
107
3-3-5 UV-absorbance profile
Studying the UV profile of the sample and extract provided further information to
characterise the structure and composition of the extracts. Figure 3.10 shows the absorbance
of the extracts which were measured in the UV-spectrophotometry at the indicated
wavelength range (220-500 nm). Samples were first centrifuged at 16000 rcf for 10 min prior
to analysis and diluted in order to narrow the spectrum in the detection range of the
spectrophotometer.
The peaks shown at the 280 nm band range are representative of mainly amino acids,
proteins and vitamin B3 in solution which are enhanced significantly in the samples at higher
temperature. This is due to the release of yeast intracellular contents after to the cell breakage
at higher temperatures freeing the protein and amino acids to the medium (further discussion
Figure 3. 10 UV-spectrum of the crude sample and the extracts at different temperatures (all at 10 min
reaction time). The ratio for each entry is the dilution factor prior to analysis
0
0.2
0.4
0.6
0.8
1
220 270 320 370 420 470
Wavelength (nm)
Ab
sro
ban
ce (A
)
Crude sample(1:100)
75 C (1:200)
100 C (1:100)
125 C (1:100)
150 C (1:600)
175 C (1:1500)
200 C (1:1100)
225 C (1:800)

Chapter 3- PROPERTIES OF THE SUBCRITICAL WATER TREATED EXTRACTS
108
in protein measurement section). The concentration of the protein dropped at higher
temperatures which are due to their decomposition at these conditions (> 200 °C). The peaks
shown at the second band at higher wavelengths of 330 nm is believed to be represent the
phenolic fraction in the extracts (such as chlorogenic acid and other hydroxycinnamic acid
derivatives) originated from the apple. These compounds are the residues of the apple
phenolics which had been introduced in the upstream of the cider process and have been
carried out through fermentation by-product. The concentration of these compounds also
increased at higher temperatures which is depicted in the same figure and are also discussed
in detail in chapter 6. Fig 3.11 shows the comparison between the absorbance ratio of
different samples at different temperatures and wavelengths after standardising dilution
factors.
Figure 3. 11 UV absorbance changes in the hydrolysed samples relative to the crude sample at 3
wavelengths
0
3
6
9
12
15
18
UV
ab
so
rba
nc
e r
ati
o
220 nm
280 nm
320 nm
Temperature ( C)
100 125 150 175 200 225 75

Chapter 3- PROPERTIES OF THE SUBCRITICAL WATER TREATED EXTRACTS
109
3.3.6 Protein Concentration
Due to stronger hydrolytic conditions, yeast cells undergo the lysis and degrade as a
result of the membrane and cell wall disruption. Cell wall hydrolysis will be further
discussed in Chapter 5 where a description of cell wall structure, kinetics of its hydrolysis at
the studied conditions and the intermediates produced will be discussed. Moreover, the
destruction of the cell wall will further release the cellular contents to the medium. This will
form a partly soluble hydrophilic fraction in the aqueous medium plus a small fraction of
non-soluble lipids and hydrophobic compounds. The main fraction of the hydrophilic
compounds is solubilised proteins and amino acids which normally represent the degree of
cell disruption in biological application.
During autolysis or induced lysis processes, yeast cells are left at temperatures between
60-80 °C when cell lysis occurs which can take several days (Saksinchai et al. 2001). Fig
3.12 illustrates the protein concentration in the crude sample and in the extracts at different
temperatures and reaction times. When hydrolysis experiments were carried at 100 °C lower
concentration of proteins was observed in shorter reaction times (<20 mins) when compared
to the crude sample.

Chapter 3- PROPERTIES OF THE SUBCRITICAL WATER TREATED EXTRACTS
110
This can be attributed to unknown reactions at these conditions which may result in
formation of larger protein structure due to polymerisation or aggregation of protein-
carbohydrate structures and subsequent precipitation (drop-out) of proteins in the
centrifugation step prior to protein assay. When hydrolysis experiments were carried at 100
°C and longer reaction times, an increase of protein concentration was observed which is
believed to be due to higher degrees of cell lysis and protein release. Increasing the reaction
temperature to 150 °C resulted in a dramatic increase in the concentration of proteins which
can be explained by the higher degree of cell disruption. This is in agreement with structural
change of yeast cells (high cell disruption) at this range of temperatures as illustrated in Fig
3.8. The concentration of protein reached its maximum of 1.6 mg/ml at 150 °C and 20 mins
reaction time. Also, the same trend was observed on the UV-absorbance of the extracts at
Figure 3. 12 Protein concentration in the crude sample and in the extracts at different temperatures and
reaction times
0
400
800
1200
1600
2000
ug
/ml
Raw sample
100 C
150 C
200 C
225 C
250 C
300 C
0 10 20 30Min

Chapter 3- PROPERTIES OF THE SUBCRITICAL WATER TREATED EXTRACTS
111
280 nm (Section 3.3.5), which represents the increasing concentration of protein molecules
in the extract. Protein concentration dropped at higher temperatures (≥200 °C), which could
be due to the high temperature condition and the resulting decomposition to smaller peptides
with sizes below the detection limit of the assay. The detection level in Bradford assay was
quoted by the manufacturer to be for proteins with MW > 3000 Da (Bradford Protein assay
product description leaflet, Pierce ,UK)
3.3.7. Total Organic Carbon (TOC)
As temperature increases, more solid residues solubilises in liquid phase due to an
increase hydrolytic power of subcritical water. This liquefaction mainly occurs in the yeast
cell wall and in other solid residues (plant residues) originated from apple juice or other plant
sources. This degree of liquefaction was measured and reported using TOC value of the
samples and correlated with different reaction conditions as shown in Fig 3.13. As the final
volume measurement of the samples after the reaction was not possible due to the limitation
of the batch reaction and volume loss during depressurisation of the reactor, the values are
reported as concentration rather than total value of TOC.

Chapter 3- PROPERTIES OF THE SUBCRITICAL WATER TREATED EXTRACTS
112
As the graph shows, the highest concentration of solubilised organic compounds was
observed at 150 °C at 30 mins and not at the higher temperatures when a high degree of
solubilisation is expected. This could be explained by the following:
1) At higher temperatures, solids solubilise faster but at the same time solubilised
compounds start to form gaseous products which leave the liquid phase. This was observed
at these conditions when the reactor depressurising valve was opened and a smoke was
noticeable.
2) At higher temperature, a parallel polymerisation reaction occurs which is
responsible for the formation of significantly larger molecules and their precipitation during
Figure 3. 13 Total Organic Carbon (TOC) of the liquid extracts at different temperatures and reaction
time. Error bars represent standard error (n=3)
0
20
40
60
80
mg
/ml
Crude sample
100 C
150 C
200 C
225 C
250 C
300 C
0 10 20 30Min

Chapter 3- PROPERTIES OF THE SUBCRITICAL WATER TREATED EXTRACTS
113
the centrifugation step. This was earlier discussed in section 3.3.3 in which the dry weight of
solid and liquid fractions/phase were compared concluding that the dry weight of the solid
phase (solid precipitate after centrifugation) increased at higher temperatures
3.3.8. Phenolic compounds
The presence of the significant band at the 330nm UV wavelengths corresponds to
phenolic compounds therefore further work was carried out to investigate these findings. The
Folin-Ciocalteau assay was able to identify and quantify the phenolic compounds in the
extracts and the results are shown in Figure 3.14. Compared with the crude sample (Total
Phenolic Content(TPC)=680-730 mg/ml), treated extracts showed much higher concentration
of phenolic compounds. This value increased gradually from 100 °C (TPC = 1400 mg/ml)
and reached its maximum at 200 °C (TPC = 3441 mg/ml) at 10 min reaction time. At the
highest temperature of 250 °C the concentration decreased to as low as TPC = 2600 mg/ml at
30 mins reaction time but it was still significantly higher in than the crude sample.

Chapter 3- PROPERTIES OF THE SUBCRITICAL WATER TREATED EXTRACTS
114
While a significant fraction of phenolic compound was expected to be present in the
crude extract, the increase in its concentration during hydrolysis at high temperature has not
been reported so far. Therefore, this observation was further investigated and it was
concluded that this increase was due to the desorption of phenolic compounds which were
adsorbed on the yeast cell wall during the fermentation step. This observation was further
assessed in a separate chapter (chapter 6) which supports the suggested hypothesis.
Figure 3. 14 Total phenolic content in the extracts at different temperatures and reaction times.
Values are reported as Gallic Acid Equivalent (GAE). Error bars represent standard error (n=3)
0
1000
2000
3000
4000
time (min)
T P
C (
mg
/ml G
AE
)
100 C 150 C
200 C 225 C
250 C
10 20 300

Chapter 3- PROPERTIES OF THE SUBCRITICAL WATER TREATED EXTRACTS
115
3.3.9. Antioxidant properties of the extracts
Phenolic compounds which are available in the extracts are believed to influence the
radical scavenging and antioxidant activity of the extracts which are directly associated with
their presence (K. W. Lee et al. 2003). Figure 3.15 shows the results from DPPH assay
which confirms that antioxidant activity was increased with reaction temperature. The results
are reported as the equivalent antioxidant strength of ascorbic acid (AAE) in 100 ml and vary
between 16 mg of AAE in the crude sample to 80 mg of AAE in the 225 °C samples.
Figure 3. 15 Antioxidant power of the extracts at different temperatures and reaction times. Antioxidant
values are presented as the equivalent of the vitamin C in 100 ml. Error bars represent standard error
(n=3)

Chapter 3- PROPERTIES OF THE SUBCRITICAL WATER TREATED EXTRACTS
116
The significant increase occurred when the temperature changed from 150 °C to 200
°C resulting in AAE values of 75 mg after 30 min reaction time. At higher temperature,
AAE remained almost constant and slightly decreased at 250 °C after more than 10 mins.
Comparing the antioxidant activity of the extracts with the phenolics concentration
shows that both increase at higher reaction temperature. In particular, the extracts at 225 °C
and 10 min reaction and the extracts at 200 °C and 10 min reaction time show the highest
antioxidant activity and phenolic concentration respectively with both values decreasing as
temperature increases.
3.4. Conclusion
The main objective of this chapter was to provide fundamental insights about the main
substrate and how it was affected by being subjected to the subcritical water mediated
hydrolysis in a stirred batch system. Significant colour, odour and structural change were
observed in the sample after the reactions which correspond to the different chemical and
physical change occurring under these conditions. When cells undergo such conditions, they
start to lyse and gradually release their intracellular contents, such as proteins. This was
followed by the change in their overall structure as it was shown by the SEM and TEM
micrographs. At milder conditions, cells maintained their rigid structure while the cell wall
started being fractionated and separated from the cell structure. At such conditions,
intracellular contents of the cell were believed to remain encapsulated while modifications to
the outer cell medium were expected. Consecutively, this resulted in higher degrees of cell
solubilisation which was measured using dry weight and TOC analysis.
Further analysis of the heat treated extracts showed that proteins are released in the
medium. By measuring protein concentration in different extracts showed that higher

Chapter 3- PROPERTIES OF THE SUBCRITICAL WATER TREATED EXTRACTS
117
concentration of protein had been released at 150 °C which corresponds to the higher degree
of cell solubilisation. At higher temperatures and longer reaction times, protein molecules
started to decompose which leads to the drop in protein concentration in the extracts. At the
same time, phenolic content in the medium were enhanced which is expected to directly
affect the antioxidant strength of the extracts. The idea of phenolics and where they originate
were further developed and investigated in chapter 6 which discusses that these compounds
originate from the yeast cell wall and they are release from the cell wall during hydrolytic
conditions.
Using TOC analysis of the extracts and comparing its values with the solid and liquid
dry weight of each extract lead to more support evidence that polymerisation reactions may
occur at higher temperatures, which resulted in lower TOC values and higher solid weight at
higher temperature samples.
Considering the overall properties of the extracts at different temperatures, samples
tend to change dramatically into a mixture of proteins and phenolic compounds at
temperatures below 200 °C. This rich slurry can present a potential product for different
applications such as highly nutrient culture mediums or in products where specific activity of
phenolic compounds is required such as their unique UV-absorbance or antioxidant activity.

Chapter 4- EVALUATION OF SUBCRITICAL WATER EXTRACTION OF VITAMIN B3
118
Chapter 4
4.1. Introduction
This chapter details the results from the experiments which were carried out to
determine vitamin B3 in subcritical water treated extracts and the ones generated after the
crude yeast cells were being subjected to autolysis reactions. Yeast is known as a source of
vitamin B group in different concentrations. Hence, vitamin B3 was considered as a
candidate chemical to investigate the efficacy of subcritical water extraction from yeast-
based biomass. Thin layer chromatography (TLC) and HPLC analysis were used in
combination for vitamin B3 determination in the samples.
4.2. Materials and Method
Silicagel glass plates where purchased from Whatman, UK (Partisil®), and HPLC
grade water was from Sigma-Aldrich, UK. The vitamin standards (Thiamin-HCl (≥99%,
TLC), Riboflavin (≥98%), Nicotinic acid (99.5%≥, HPLC), Nicotinamide (99.5%, HPLC),
D-Pantothenic acid hemicalcium salt (98%≥, TLC), Pyridoxine (98%≥, HPLC), Folic acid
(97%≥)) were also purchased from Sigma (Sigma-Aldrich, UK). Standard samples were
prepared by dissolving 100 mg of each in 100 ml of Water:Methanol (1:1) in a volumetric
Evaluation of subcritical water mediated hydrolysis for
extraction of Vitamin B3 from spent cider lees

Chapter 4- EVALUATION OF SUBCRITICAL WATER EXTRACTION OF VITAMIN B3
119
flask (100 ml). 1 ml of each standard was used for HPLC and 10 µl was used TLC analysis
to determine the retention time.
4.2.1 Development of HPLC method for the analysis of Vitamin B3
Initially, HPLC analysis of nicotinic acid and nicotinamide was performed using a
typical C-18 column (Luna C18, 250 × 4.6 mm, 5 µ, Phenomenex,USA) as recommended by
the HPLC column manufacturer (Phenomenex Product Catalogue, 2007, UK). However, it
did not show the required consistency and efficiency for the separation of polar compounds
(nicotinic acid and all the compounds eluting early from the column), resulting in
overlapping of peaks. This was mainly due to the nature of solubilised vitamin B3, especially
nicotinic acid, which is a highly polar compound and were not retained in the column and
elutes with other impurities and unretained compounds. The retention of highly polar
compounds solubilised in an aqueous matrix with a reversed phase system, wherein a highly
polar mobile phase is in contact with nonpolar stationary phase, can be challenging with
normal reversed phased HPLC column. Vitamin B3 (nicotinic acid and nicotinamide) elute
very quickly with C18 columns, overlapped by other non resolved peaks at the early time of
elution. In order to obtain improved resolution for vitamin B3, a modified reversed phase
column (Synergi-Fusion, 250 × 4.6 mm, 5 µ, Phenomenex, USA) was used after consulting
with the manufacturer (Phenomenex, UK) to enhance the retention of polar compounds in
the aqueous matrix. Results showed improved retention for nicotinic acid peak and
resolution of early eluting peaks in Synergi-Fusion column comparing to Luna C18 column
following the suggested HPLC method which was recommended by the manufacturer
(Phenomenex Product Catalogue, 2007, UK) (Fig 4.1). The HPLC system was comprised of
the high pressure quaternary HPLC pump, injector, online degasser, HPLC column equipped
with a column guard (4 × 2.0 mm), column oven and a DAD detector. All the modules were

Chapter 4- EVALUATION OF SUBCRITICAL WATER EXTRACTION OF VITAMIN B3
120
Agilent model 1100 except the DAD detector which was model 1200. Mobile phase was
HPLC water (CHROMASOLV, Sigma Aldrich, UK) acidified with 0.1 % formic acid
(HPLC grade, Sigma Aldrich, UK).
Figure 4. 1 . HPLC chromatogram of hydrolyzed sample (200 C, 20 min, 100 bar) eluted from Luna C18
(top) and Synergi-Fusion column (bottom). UV detector (270 nm)

Chapter 4- EVALUATION OF SUBCRITICAL WATER EXTRACTION OF VITAMIN B3
121
HPLC flow rate was set to 1 ml/min and injection volume was 5 µl. The UV-
wavelength of the detector was set to 270 nm and the spectrum was recorded for the
wavelengths between 200-600 nm and used for further structural confirmation of the peaks
in the chromatogram. To quantify the vitamin B3 with HPLC, external calibration technique
was used and Figure 4.2 shows the calibration curves for the nicotinamide and Figure 4.3
shows the chromatogram of the standard vitamin B3 peaks.
Figure 4. 2 Calibration curve for HPLC analysis of Nicotinamide
y = 0.1497x
R2 = 0.9995
0
5
10
15
20
25
30
0 20 40 60 80 100 120 140 160 180
Area
Co
ncen
trati
on
(u
g/m
l)

Chapter 4- EVALUATION OF SUBCRITICAL WATER EXTRACTION OF VITAMIN B3
122
4.2.2 Autolysis conditions
To minimise any uncontrolled and possible biological effects of storage on the yeast
cells (change of cell viability, cell metabolism etc) and consequently variation to the
autolysis reactions, all the autolysis experiments were carried out using fresh spent yeast
which was collected from the Bulmer brewery site. Storing the samples (by freezing) was
believed to have minimum effect on the chemical composition of the samples for the purpose
of hydrolysis reactions. To remove the residues of the cider fermentation step and other
unwanted soluble components, yeast cells were washed and debittered following the method
which has been described by Tanguler et al. (Tanguler & Erten 2008). Briefly, cells were
harvested from the original slurry by centrifugation at 4000 rpm and re-suspended in distilled
water. The pH of the slurry was then adjusted to 9.0 by adding NaOH to the medium and
constantly stirring for 30 min using a magnet bar. Yeast cells (suspended in cider lees) were
Figure 4. 3 Chromatogram of the standard vitamin B3 (Nicotinic acid and Nicotinamide)

Chapter 4- EVALUATION OF SUBCRITICAL WATER EXTRACTION OF VITAMIN B3
123
washed 3 times with distilled water using repetitive centrifugation and suspension in distilled
water until the supernatant was clear. The solid concentration of the suspension was adjusted
to the one for original sample 11 % (w/v). The extra suspensions which were needed for
later experiments were stored at 4°C fridge. 200 ml of 3-times washed cells was used for
each autolysis experiment. The pH of the slurry was adjusted to 5.5 with the addition of 1 ml
of NaOH solution (2 M) as suggested by the above method. 3% salt (NaCl) was also added
to the suspension to facilitate the autolysis through the osmosis difference of extra- and
intracellular contents of the cell (hypertonic solution).
The autolysis experiment was carried out at a controlled temperature (45-55 °C) in the
300 ml stainless steel stirred reactor from Parr (Parr Instruments, USA). The specification of
the vessel have been discussed and outlined previously in chapter 3. Stirring speed was set to
500 rpm and 200 ml of the prepared yeast suspension was placed in the reactor and reaction
started after the vessel reached the set temperature.
To perform the autolysis with the spent cider lees, the same conventional method,
which has been offered for yeast cells, was followed as no specific method was available for
cider yeast to the knowledge of the author. Different conditions were applied to the starting
slurry and the results were studied and compared to find out the optimum conditions which
can be obtained with this type of the sample (Table 4.1). Screening tests showed that no
autolysis occurs when the pH of the slurry remained unchanged at (3.6-4.0). Hence, the pH
of the medium was increased to 5.5 by the addition of NaOH as described earlier. The
parameter which used to measure the autolysis progress was the total protein concentration
of the reactor content that were collected at different times of the reaction.

Chapter 4- EVALUATION OF SUBCRITICAL WATER EXTRACTION OF VITAMIN B3
124
Table 4. 1 Conditions used for autolysis experiments
Temp (°C) pH Salt Conc.
(% w/v)
Cells
pretreatment
Exp. 1 55 Original
(4.1) 0 Washed 3 times
Exp. 2 55 5.5 3 Washed 3 times
Exp. 3 45 5.5 3 Washed 3 times
Sampling was done by taking 1.5 ml of sample by lifting the reactor head, heating up
at 80 °C for 10 min in a bench-top oven to deactivate the enzymes and stop the reaction,
stored at -20 °C freezer until before being analyzed for protein and vitamin concentration.
4.2.3 Protein analysis
As discussed previously, the amount of protein was used as an indication of the
autolysis progress. Coomassie Plus (Bradford) kit (23238, Pierce, IL, US) (which was
described in section 3.2.5) was used to quantify the amount of soluble protein in the medium.
4.2.4 Vitamin B3 determination in hydrolyzed extracts of yeast using TLC
As discussed earlier in 2.5.5.2.3, a TLC technique was developed based on the method
used by Ponder et al ((Ponder et al. 2004) using silica plates and pure water as the mobile
phase.
In addition to water based system, few experiments were carried out as trials to find
out the elution behaviour of the sample when the mobile phase was changed to organic
solvent. n-propanol was used as a candidate solvent and was used in similar conditions to
water system. However, solvent front was completely unbalanced and irregular on the TLC

Chapter 4- EVALUATION OF SUBCRITICAL WATER EXTRACTION OF VITAMIN B3
125
plate making the vitamin separation and Rf calculation impractical. As a result, experiments
were followed in water system throughout the project.
All the experiments were carried out at room temperature in a glass TLC chamber. For
the detection, plates were placed under the UV light at 250 nm. All the vitamins, except the
vitamin B5 (Pantothenic acid) was detected without any derivatisation. To investigate the
presence of vitamin B3 (which was expected to be the most concentrated vitamin in the
extracts), the retention factor (Rf) of each standard was compared with the one for any
corresponding spot on the plate loaded with real samples. Figure 4.3 shows the elution
behaviour of vitamin B groups in the discussed system.
4.3 Results and Discussion
4.3.1 TLC analysis
Initially, the TLC method was checked by loading different volumes (2, 4, 6, 8 and 10
µl) of pure standards of the vitamins (5 mg/ml concentration prepared in HPLC grade water)
on the silica plates. Plates were placed in the water for 60 minutes and detection was carried
out under the UV light after the plates being dried at 50 °C drying cabinet for 1 hour (Fig
4.4).

Chapter 4- EVALUATION OF SUBCRITICAL WATER EXTRACTION OF VITAMIN B3
126
As Figure 4.4 shows, the vitamins separated at different rates which correspond to their
Retention factor (Rf) in the system. Vitamin B1 and B9 stayed at the origin and did not move
upward with water. Vitamin B5 (pantothenic acid) was later visualized by spraying the plate
with ninhydrin reagent (Sigma-Aldrich, UK) and heating at 160 °C for 15 min. Nicotinic
acid, on the other hand, moves very quickly with water front and obtained the Rf value of
0.89 in the system. The Rf values of each vitamin were measured and are shown in Table
4.2.
Figure 4. 4. Elution behaviour of the mixture of vitamin B group loaded at different volumes (from left 2,
4, 6, 8 and 10 µl of stock solution containing 1 mg/ml of each vitamin) using the silica-water TLC system .
The Rf value of each vitamin is listed in table 4.

Chapter 4- EVALUATION OF SUBCRITICAL WATER EXTRACTION OF VITAMIN B3
127
Table 4. 2 Values for retention factor (Rf) of vitamins on Silicagel plates and water as the mobile phase
Component Rf
Thiamine-HCl (B1) 0.05
Riboflavin (B2) 0.4
Nicotinic acid (B3) 0.89
Pantothenic acid (B5) 0.49
Pyridoxine-HCl (B6) 0.52
Folic Acid (B9) 0
Cyanocobalamin (B12) 0.22
To investigate the presence of vitamins of B group, especially the vitamin B3
(nicotinic acid) in the hydrotreated yeast extracts, samples which were prepared at different
temperature and different times (as discussed in chapter 3) were loaded on the same type
plate and the results were compared with the plate for the vitamin standards. A selection of
the resulting plates, which are based on loading 5 µl of extracts and running in water for 60
minutes, are shown in Figure 4.5. The extracts were the yeast slurry which were treated at
different temperatures (140, 170, 200 and 230 °C) for 30 min and at 100 bar. Prior to the
TLC analysis, extracts were centrifuged at 16000 rcf for 10 min to separate the solid particles
and the loaded fraction is from the supernatants. In order to obtain higher amount of vitamin
B3 on the plate, extracts were concentrated 5 times before loading on the TLC plate. To do
this, 10 ml of each supernatant was placed in the rotary vapour (Rotavopr RE-111, Buchi,
UK) and concentrated until 2 ml was left.

Chapter 4- EVALUATION OF SUBCRITICAL WATER EXTRACTION OF VITAMIN B3
128
The elution behaviour of the extracts in the silica-water system was very irregular and
resulted in lanes covered with spots at different Rf’s which is common in all the aqueous
based silicagel TLC plates. Undoubtedly, the complexity of the samples, especially at higher
temperatures, plays a significant role on such behaviour as the diffusion path for the mobile
phase via the porous structure of the adsorbent is believed to be largely affected by the
presence and blockage of hydrophobic and sticky components in the sample. Loading lower
volumes of sample or using samples prepared at lower reaction residence time did not
improve the resolution and elution of the sample, so made it impossible to identify the
vitamin B3 spot on the plate.
Figure 4. 5 Elution of the hydrothermal treated yeast samples in the silica-water TLC system.
Each sample at the indicated temperature has been replicated 3 times on the plate.

Chapter 4- EVALUATION OF SUBCRITICAL WATER EXTRACTION OF VITAMIN B3
129
Due to the complexity and irregularity of the sample elution on the plates and the
difficulty of the identification of vitamin B3, optimization of the analysis was followed by
first trying to resolve the issue with elution on TLC plates. To address this, other solvents
such as n-propanol, ethyl acetate and ethanol were used but none of them could provide a
clean separation between different spots, resulting in significant streaking of the sample
throughout the plate.
4.3.2 HPLC analysis of Vitamin B3
To investigate the accuracy and functionality of the TLC system for separating the
vitamin B3 from the extracts, HPLC was used along the TLC to analyze the spots on the
plate. This was carried out by running HPLC on the separated spots from the TLC plate,
which was believed to be associated with the Rf of nicotinic acid (Rf= 0.82). First, the
corresponding spot/area of silica was scrapped from the glass plate with a spatula and
separated silica was washed in a microfuge tube with 0.5-1 ml HPLC water to elute any
components that had been adsorbed on the silica. After shaking for 1 min, solid silica
particles were separated from the liquid with centrifugation at 16000 rcf for 5 mins and the
supernatant was used for the RP-HPLC analysis. The accuracy of this method was first
determined by following the same procedure with a spot which was corresponding to a plate
loaded with pure nicotinic acid. 5 replicates were prepared and it was shown that 95% ±2 of
the nicotinic acid can be quantified with the HPLC using this technique (Fig 4.6).
To develop the HPLC method for the nicotinic acid and nicotinamide, standards of
each chemical were injected to the HPLC column to find out its retention in the Luna-C18
column (Rt=4.1 min). This retention time was compared later with the any corresponding

Chapter 4- EVALUATION OF SUBCRITICAL WATER EXTRACTION OF VITAMIN B3
130
peaks from the hydrolysed samples prepared following the procedure explained above (Fig
4.7) shows a typical chromatogram of the extract prepared following the procedure explained
above. The sample for this analysis was treated at 200 °C after 30 minutes at 100 bar and ran
on TLC plate for 1 hours before being scrapped of the plate. Despite initial results, which
made us believe that the remarkable peak at 4.2 minutes corresponds to nicotinic acid (Fig
4.7), further investigation of the extracts with a modified HPLC method (a new HPLC
column Synergi-Fusion, 250 × 4.6 mm, 5 µ, Phenomenex, USA) showed zero concentration
of this compound in these samples. The new method (described in 4.2.1) was carried with a
spiking experiment which samples were spiked with nicotinic acid standard (1 µg). The
developed HPLC method suggested that the vitamin B3 did not exist in the extracts under
the studied conditions. Unless otherwise stated, all the other samples were directly injected
to the HPLC system without being pre-loaded on the TLC.
Figure 4. 6. Comparison between peaks of Nicotinic acid in Lunca C18 column before and after loading
on the TLC plate showing 95 % recovery (Red line is standard nicotinic acid solution and blue line is
nicotinic acid efter elution and recovery from TLC plate), Rt for nicotinic acid is 4.1 min

Chapter 4- EVALUATION OF SUBCRITICAL WATER EXTRACTION OF VITAMIN B3
131
Although yeasts are believed to have a very low levels of nicotinamide, TLC plates
were examined for this compounds using the HPLC and no peak was detected for
nicotinamide as well.
Following the negative results from vitamin B3 analysis, the project was carried out at
a faster pace towards finding out a replacement component and also considering the
possibility of alternative reactions and components. On this part, the focus was to first
identify the other major peaks which were eluting in our HPLC system and were showing
change at different process conditions. During the process of peak identification, which was
the combination of taking fraction of HPLC or semi-preparative chromatography, GC-MS or
direct injection to Electrospray Mass Spectroscopy, identification of other major peaks in the
Figure 4. 7 Chromatogram of the hydrolysed sample and the same sample spiked with nicotinic
acid

Chapter 4- EVALUATION OF SUBCRITICAL WATER EXTRACTION OF VITAMIN B3
132
chromatogram, which was achieved with extensive analytical work with Mass Spectroscopy
showed the presence of 5-hydroxymethylfufural in the extracts which was discussed in detail
in chapter 5 of this thesis. At the same time, it was of our special interest to find out an
explanation for the absence of vitamin B3 in our extracts. This lead to a complimentary study
that autolysis experiment was carried out and was shown to be able to generate the vitamin
B3 compounds. The autolysis experiments are discussed in detail in the following section.
Based on the results on this section, TLC analysis was not able to show the nicotinic
acid in the generated extracts. Though it was later showed that vitamin B3 was not available
in the extracts in its pure form, still there was some problems using this technique for the
purpose that was followed in the project. This was mainly due to the nature of the extracts,
which were a very complex mixture of different chemicals that may not separate efficiently
on the TLC plate. It can also be attributed to the combination of silica-water in the TLC
system, as this system may not work properly in perfect TLC operation as was hoped
initially. An explanation for this could be the polarity of both mobile phase and the stationary
phase which does not provide a selective adsorption for different compounds in the mobile
phase.
4.3.3 Autolysis of the yeast biomass
In the present work, cider spent yeast was subjected to autolysis conditions and total
amount of released protein was monitored constantly. The extracts were analyzed to
investigate the release of vitamin B3 (nicotinic acid and nicotinamide) which was shown to
be released following the autolysis. This, ultimately, would explain the absence of these
compounds in the hydrothermal treated samples as they are believed to be in a more complex
or bound form. Autolyzed samples did not show significant change in their structure and
colour except some degrees of foaming which was observed in the reactor after 12 hours

Chapter 4- EVALUATION OF SUBCRITICAL WATER EXTRACTION OF VITAMIN B3
133
which can be due to the release of foaming agents from yeast. As discussed earlier, the
outcome of autolysis reaction was known by measuring the released protein in the medium.
Consequently, the samples with highest concentration of released protein were expected to
show highest concentration of released of vitamin B3.
4.3.3.1 Total Protein Concentration
Figure 4.8 shows the total protein concentration at different time intervals measured
with Coomassie (Plus) Bradford assay. The initial concentration of protein in the washed
samples was around 11 µg/ml which increased to 140 µg/ml after 16 hours in the Experiment
No. 2. The difference between the concentration of protein for different experiments shows
the effect of temperature and the salt addition. The concentration of the protein almost
remained constant after 12 hours and dropped after 18 hours which can be due to further
hydrolysis of the released proteins.
The level of protein concentration (~0.14 mg/ml or 1 µg/mg of dry yeast) was
significantly lower from ones which were observed in other studies (20-40 mg/ml (Illanes &
Gorgollón 1986) or 95 µg/mg of dry yeast (Lamoolphak et al. 2007)). This can be due to the
unfavourable autolysis conditions which did not promote higher degrees of autolysis in the
studied suspension. This is expectable as the spent yeast in this study is originated from a
different fermentation and yeast strain to these studies. Furthermore, different storage
periods and condition for the spent yeast in the manufacturer site may change the yeast cells
ability to undergo autolytic conditions later and lead to different behaviours and outcomes
during and after autolysis.

Chapter 4- EVALUATION OF SUBCRITICAL WATER EXTRACTION OF VITAMIN B3
134
4.3.3.2 Vitamin B3 determination in autolyzed samples
The optimized HPLC method (4.3.2) was used to identify and measure the release of
nicotinic acid and nicotinamide in the autolyzed extracts. HPLC chromatogram for one of the
autolyzed samples (Exp2, t=22 h) is shown in Fig 4.9 and has been compared to the
chromatogram of a control sample (untreated crude sample stirred at room temperature for
22 h). The appearance of multiple peaks at different retention times is an indication that
several compounds are available in the autolyzed sample which is believed to be due to
autolytic conditions and some of them may also originated from the can be released from the
yeast cells in such conditions. Considering the retention times of nicotinic acid (Rt= 4.9 min)
and nicotinamide (Rt= 5.7 min), earlier elution times in the chromatogram was of special
interest in this assay.
Figure 4. 8. Total protein concentration in different autolyzed samples
0
20
40
60
80
100
120
140
160
10 12 14 16 18 20 22 24
Time (hr)
Pro
tein
Co
ncen
tratio
n (u
g/m
l)
Exp1
Exp2
Exp3

Chapter 4- EVALUATION OF SUBCRITICAL WATER EXTRACTION OF VITAMIN B3
135
In order to provide a better picture of the HPLC peaks which correspond to the vitamin
B3 retention times, the associated parts are magnified and are shown in Figures 4.10, 4.11
and 4.12. These graphs would also facilitate the identification of these compounds in the
extracts. Figure 4.10 shows the part of the chromatograms which corresponds to the nicotinic
acid peak in the autolyzed sample. A little shoulder in this sample was observed at time 4.10
min which is believed to correspond to nicotinic acid. For further confirmation, Diode Array
Detector (DAD) generated the UV-spectrum of the peak which was compared to the one for
nicotinic acid standard (The reference spectrum for nicotinic acid was prepared earlier by
running the nicotinic acid standard and storing its spectrum in the library of DAD). As can
be seen in Fig 4,10, there is almost 87% degree of correspondence (calculated based on the
purity analysis software in the HPLC software, ChemStation, Agilent, UK) between the
observed peak and nicotinic acid which is presented in the small scaling table in the
chromatogram in the same figure.

Chapter 4- EVALUATION OF SUBCRITICAL WATER EXTRACTION OF VITAMIN B3
136
Figure 4. 9 HPLC chromatogram of control sample (top) and autolyzed sample (bottom) after 22 hour
of stirring at room temperature (control) and 55 °C (autolyzed sample-Exp2)

Chapter 4- EVALUATION OF SUBCRITICAL WATER EXTRACTION OF VITAMIN B3
137
This peak was not detected in the original sample, control sample or other samples autolyzed
at different conditions when the same analytical technique was used for all of them.
An overlay of separate chromatograms at different autolysis times is shown in Figure
4.11. The size of this shoulder peak, which is directly related to the concentration of nicotinic
acid, did not change significantly but only a slight increase at longer times which may
correspond to an increase in its availability at longer autolysis time. There is a slight change
in retention time of the peak which can be attributed to the slight variation of HPLC
condition between each analysis. The peak UV spectrum was confirmed for each individual
sample and same confirmation was observed. Due to the small size of the peak and its
overlap with neighbouring peaks, it was impossible to measure its area accurately and report
its concentration in the sample.
Figure 4. 10 Nicotinic acid peak at 4.95 min and the UV spectrum of the observed peak (No. 1)
compared to the one for standard nicotinic acid (No.2) on top right of the figure

Chapter 4- EVALUATION OF SUBCRITICAL WATER EXTRACTION OF VITAMIN B3
138
Nicotinamide elutes one minute after the nicotinic acid in the used HPLC system
(Rt=5.8 min) and its UV spectrum is very similar to the one for nicotinic acid due to their
similar chemical structure. While checking the autolyzed samples, a new peak was detected
at nicotinamide retention time and further examination of the UV spectrum showed an
acceptable match with the one for nicotinamide. Similarly, the magnified chromatogram of
the autolyzed sample (at 22 h) is shown in Figure 4.12 accompanied by its UV spectrum
which presents the availability of the nicotinamide in the autolyzed sample.
Figure 4. 11 Nicotinic acid peak for the autolyzed sample at different times during autolysis reaction

Chapter 4- EVALUATION OF SUBCRITICAL WATER EXTRACTION OF VITAMIN B3
139
Based on the external calibration curve which was prepared previously for
nicotinamide, nicotinamide was quantified in the samples and its concentration was
4.89µg/ml in the extracts (Exp No.2, t=22 h). This concentration was almost constant in all
the samples at 14 hours and more of autolysis (Table 4.3). Considering that there is about
110 mg/ml of dry cell in the samples, the vitamin B3 concentration (based on only
nicotinamide concentration) was about 41 µg/g of dry yeast.
Figure 4. 12 Nicotinamide peak at 5.8 min and the UV spectrum of the observed peak (No. 1)
compared to the one for standard nicotinic acid (No.2) on the inlayed window

Chapter 4- EVALUATION OF SUBCRITICAL WATER EXTRACTION OF VITAMIN B3
140
Table 4. 3 Nicotinamide concentration in autolyzed sample at different times during the autolysis
Time after start of autolysis (hr) Concentration (µg/ml)
13 4.2
17 4.5
20 4.9
22 4.8
The total concentration of vitamin B3 Saccharomyces bayanus (the yeast strain
available in the samples) has not been reported anywhere to the knowledge of the author, but
it is suggested that its concentration is between 300-1000 µg/g of dry yeast in brewer’s yeast
(Halsz & Lsztity 1991). This value is much higher than the levels that were obtained in this
study which can be due to several reasons such as different condition of the starting cells,
different yeast strains or employing other autolysis procedures.
4.4 Conclusion
The main objective of this chapter was to show the results of the study to investigate
the possibility of using hydrothermal reactions for the extractions of vitamin B3 from the
cider lees. However, the developed HPLC analysis confirmed that no vitamin B3 is present
in the hydrothermal extracts, at least in its free form. However, it was possible to show small
levels of this compound being produced from the cider spent yeast after subjecting the cells
to autolysis. This suggests that vitamin B3 is available in these yeasts but not in high levels
or in their free form to be extracted.
The complimentary autolysis study helped to find an explanation why no vitamin B3
was detected in the hydrothermal treated samples and second, suggests that the presence of
vitamin B3 depends on the involving cellular enzymatic reactions. These reactions can be

Chapter 4- EVALUATION OF SUBCRITICAL WATER EXTRACTION OF VITAMIN B3
141
promoted to the release of vitamin B3 during autolysis similar to what happens in the
production of yeast extract in industry. It is believed that these specific reactions would be
triggered during autolysis while they would be stopped or hindered at high temperature and
pressure conditions during the hydrothermal treatment. Ceasing the activity of these enzymes
would result in the loss of vitamin B3 in the hydrothermal extracts as observed in our study.
Nicotinic acid can also be available in a modified form of its derivatives such as
Nicotinamide or bound (active) form such as Nicotinamide adenine dinucleotide (NAD+) or
its reduced form (NADH). Hence, as a recommendation for further studies, other techniques
such as microbiological assay can be used for the determination of vitamin B3 as they can
estimate the presence of nicotinic acid (or its derivatives) regardless of their form
(microbiological assays were not used due to the limited time and resources available for this
purpose). In contrast, HPLC techniques (with no mass spectroscopy detector) are mostly
limited to analysis of standard and known forms of vitamin B3.

Chapter 5- HMF SYNTHEIS IN THE SUBCRITICAL WATER TREATED SAMPLES
142
Chapter 5
5.1 Introduction
Using food crops for biorefinery plants can negatively affect the food supply chain and
increase the price and depletion of such raw materials resources. This highlights the
importance of using any other feedstock or waste that can be employed for such applications
which offer similar milder structures. The matter of using alternative feedstock or stick to
abundant feedstock with higher processing costs can only be discussed if all the potentials of
new process is known. Hence, it is important to check the viability of the new feedstocks as
it can offer similar productivity and feasibility compared to the typical resources. Moreover,
the chemistry of the feedstocks should be thoroughly studied to identify all the possible
streams and products that can be used to offer more revenues.
In this chapter, the hydrolysis of cider spent yeast (lees) was carried out in subcritical
water in the conditions which were discussed in previous chapters. The main objectives of
this chapter was to show first) how an alternative β-glucan source undergoes under a non-
catalytic, complex and non-purified medium; second) to determine the kinetics and progress
HMF synthesis through subcritical water treatment of cider spent biomass

Chapter 5- HMF SYNTHEIS IN THE SUBCRITICAL WATER TREATED SAMPLES
143
of a selected reaction pathway (HMF synthesis) and compare the results with other
feedstocks. Cider spent yeast slurry was showed to demand milder hydrothermal conditions
during its structural depolymerisation and its hydrolysis to monosaccharides. The
applicability of subcritical water was further examined by addressing the HMF formation, as
one of the top-based candidate compounds originating from the released glucose.
In addition, background analytical information, which discussed earlier proved the
formation of significant amount of HMF in the extracts. Complimentary analysis of both
liquid and solid fraction also highlighted the concentration of monosaccharides in the
hydrothermal treated extracts and the solid residues. The results from these assays offered
the chance to better study the hydrolysis of β-glucan in the cell wall to monosaccharides
(glucose and mannose) and secondary reaction of glucose to the HMF.
Kinetics of the reaction were studied and modelled to evaluate the effect of
temperature on different reaction steps. No additive, catalyst or pretreatment steps were
employed throughout these experiments. The exploitation of unpurified biomass instead of
pure model monomers or polymers will also assist in filling the gap in the literature on the
HMF obtained from different feedstocks. The outcome of this work can be of special interest
for biofuel industries (ethanol or any related process which comprised of a fermentation step)
as they need to handle increasing amounts of this by-product as a direct outcome of growing
interest in alternative fuels.
5.2 Materials and Methods
5.2.1. Raw material
Samples were collected form the cider manufacturer site (Bulmer, Herefordshire, UK)
from a collection vessel which stores the lees after alcohol removal using a combination of

Chapter 5- HMF SYNTHEIS IN THE SUBCRITICAL WATER TREATED SAMPLES
144
filtration and distillation. The impact of alcohol removal was not determined as it was part of
the process which was carried out in the upstream of the process. It is mainly comprised of
excess and unwanted spent yeast generated during and after the fermentation. Samples were
transferred to the laboratory and were packaged in 250 ml bottles and were stored in -20 °C
freezer. For each single experiment, a bottle of frozen sample was removed from the freezer,
the contents were thawed at room temperature and then used for the experiments. Yeast cells,
which ere the main solid fraction in the sample, are enclosed by a rigid structure of mainly
helical beta-glucan chains which form its surrounding cell wall and may account for up to
30% of cell dry mass (F. M. Klis 1994). The main constituents of the cell wall are β-1-3-
glucan, β-1-6-glucan, mannoproteins, chitins and a small part of lipids (Kollár et al. 1997). In
contrast to cellulose, β-glucan chains in yeast, are formed of β-1-3 glycosidic bonds (that are
branched by β-1-6 bonds) which make them more flexible and susceptible to hydrolyze due
to the lower amount of inter-chain bonds when compared with cellulose (Stephen 1995). In
addition to the glucan chains, a smaller fraction of mannose is present in mannoprotein
structure which can be released in hydrolytic conditions. Mannose has also been shown to
convert to 5-HMF via a similar pathway as glucose (Binder et al. 2010). The raw material
was considered as a mixture of glucose and mannose polysaccharides and the concentration
of each monomer was determined accurately at each step for estimating conversion, yield
and kinetics of the reaction.
Total solid concentration in the slurry was 12% (w/v) in which the yeast cell
concentration was about 10% (w/v)in the slurry. Yeast cell concentration was measured after
filtering the slurry with filter paper (Whatman® grade No.1) and subsequent washing of the
retentate with distilled water and drying the filter paper with retentate. The pH of the sample

Chapter 5- HMF SYNTHEIS IN THE SUBCRITICAL WATER TREATED SAMPLES
145
was 3.8 (±0.2) and no significant change in this value was observed after hydrothermal
treatment over different conditions.
5.2.2. Hydrolysis Experiments
Batch hydrolysis reactions were carried out in a stainless steel tube reactor (L=215
mm, id = 4.6 ± 0.1 mm) placed in a fan assisted oven. The reactor was equipped with a K-
type thermocouple only to monitor the tube internal temperature. The temperature of the
oven was set and measured with oven controller. This configuration was different from the
one in the stirred high pressure vessel which was used in the other parts of this research to
prepare the extracts. The main reason was the special importance of heating up throughout
the kinetics study. As there was long delay during the initial heating-up stage (induction
time) in the 300 ml Parr reactor (Fig 5.1) which restricts the accurate measurements of
reactants conversion and the effect of time and temperature. For reactions such as biomass
hydrolysis or hexose sugar dehydration, reactions may start well ahead reaching the set
temperature when the set temperature is above 225 °C. The range of studied temperature was
between 175°C and 275 °C. For each experiment, 3 ml of sample was injected into the
reactor (50% of reactor volume left empty) and the tube was placed in the oven. The reaction
time started (t0) when the temperature in the tube reached the set temperature. Heating up
time was measured and was between 300 and 360 sec for all the experiments. The tube was
cooled with immersing in cold water to quench the reaction and the sample was removed
from the tube for analysis. Separate experiments were carried out for each individual time-
temperature point.

Chapter 5- HMF SYNTHEIS IN THE SUBCRITICAL WATER TREATED SAMPLES
146
To determine the conversion of glucose and HMF, 20 mM solution of each compound
was prepared by adding the pure component to the supernatant of the slurry (after the solids
had been previously removed by centrifuged) instead of distilled water in order to include
any effect that the crude mixture may have on each compound. For mannose, the same
conversion rates as glucose was used based on their very similar molecular structure and
reaction scheme sulphur (Binder et al. 2010)
Figure 5. 1 Heating up profile for the 300 ml Parr reactor containing 250 ml sample and the tubular
reactor containing 3 ml sample. Temperature was set to 200 C in both reactors

Chapter 5- HMF SYNTHEIS IN THE SUBCRITICAL WATER TREATED SAMPLES
147
5.2.3. Carbohydrate analysis of the yeast cell
To measure the concentration of the monosaccharides in the yeast cells, the method
developed by Dallies et al. was used with some modifications (Dallies et al. 1998). It is
consisted of a hydrolysis step using a combination of sulphuric acid and high temperature to
completely hydrolyse the polysaccharide chain followed by HPLC analysis of released
monosaccharides (discussed in detail below). This method was used to measure the amount
of cell wall polysaccharides (based on the moles of glucose) at time t=0 (CCW, 0 as used in
reaction kinetics in section 5.3.3) and throughout the reaction at different times (CCW) to
determine the polysaccharide hydrolysis.
5.2.3.1 Preparing solid samples for carbohydrate analysis
Solid residues were collected after each experiment by centrifuging the extract at 3500
g for 10 minutes (Beckman Centrifuge). Supernatants were used for the liquid fraction
analysis by HPLC. The pellets were re-suspended in distilled water and washed three times
until the supernatant became clear and dried in a drying cabinet for minimum 24 hrs at 105
°C. Dry solids were ground with pestle and mortar, meshed and monosaccharides were
quantified by carbohydrate assay.
5.2.3.2 Hydrolysis with concentrated Sulphuric acid
At the first step, 175 µl of 72% sulphuric acid (Sigma Aldrich, UK) was added to the
dried cell residue and the mixture was left at room temperature for 3 h. The slurry was
diluted to 2 ml with distilled water and heated to 100 °C for 4 h. After cooling, samples were
neutralized with concentrated Ba(OH)2 solution. The supernatant was analyzed for

Chapter 5- HMF SYNTHEIS IN THE SUBCRITICAL WATER TREATED SAMPLES
148
monosaccharides after overnight refrigeration at 4°C and centrifugation to remove the
precipitate.
5.2.4 HPLC analysis
To quantify the amount of studied chemicals, an Agilent 1100 HPLC system (Agilent,
USA) was used which was comprised of an auto-sampler, high pressure quaternary pump,
online degasser, column oven and RI detector (1200, Agilent, USA). A 5 micron REZEX-
ROA (300 × 4.6 mm) column (Phenomenex®, USA) equipped with a column guard with
the same stationary phase (4×2.0 mm, Phenomenex, UK). The mobile phase was 0.5%
formic acid solution prepared of HPLC water (Sigma Aldrich, UK) which introduced to the
column at 0.5 ml/minutes flow rate. A separate REZEX-RCA column (Phenomenex®, USA)
with similar specification and in the same conditions was used to quantify mannose. The
method was based on the recommendation of the column manufacturer (Phenomenex, UK).
For quantification, calibration curves were prepared by injecting pure standards of each
compound as described in 4.2.1.
5.3 Results and Discussion
5.3.1 Determination of HMF peak with Mass Spectroscopy
The main objective of studying HMF reaction was because of its potential wide
application as a bio-based chemical to replace petroleum derived chemicals. However,
learning about the origin of this compounds in the hydrolysates of this study, which was
initially an unknown peak which was observed in the HPLC chromatograms, was only
possible by carrying out additional analytical techniques and dedicating significant time of
this project. A brief overview is provided below which discusses different steps taken to
identify HMF.

Chapter 5- HMF SYNTHEIS IN THE SUBCRITICAL WATER TREATED SAMPLES
149
Fig 5.2 shows the HPLC chromatogram of a sample prepared at 200 °C and 100 bar
after 30 minutes at the early stages of the project before finding out about the presence (and
synthesis) of HMF in the hydrolysates. The chromatograms (prepared using the method
described in 4.2.1) at these temperatures (200 °C and higher) were dominated by two major
peaks at 5.6 and 18.5 minutes. These two peaks showed a changing profile, which indicated
their accumulation at certain temperatures of the subcritical water hydrolysis reaction. A
combination of HPLC and Mass Spectroscopy techniques were used to identify these peaks,
but it was only possible to determine the second peak which was the more significant one. In
order to identify the unknown peaks in the absence of an HPLC-MS system in the lab (no
other LC-MS system was located off site during the limited time available for this part of
project), the method which was initially developed for the HPLC was transferred to the semi-
prep HPLC unit (Summit HPLC systems, Dionex). Higher volume of sample was injected
(100 µl comparing to 5 µl in analytical HPLC) with higher flow rates (10 ml/minutes
comparing to 1 ml/min) of the same mobile phase in order to maximize the concentration of
compound and obtain sufficient material for further analysis.

Chapter 5- HMF SYNTHEIS IN THE SUBCRITICAL WATER TREATED SAMPLES
150
Figure 5. 2 Chromatogram of hydrolysed sample analyzed with analytical HPLC (top) and
injected to semi-prep column for fractionation (bottom). The peak of interest was eluting at 18.5
in HPLC and 36 in semi-prep system

Chapter 5- HMF SYNTHEIS IN THE SUBCRITICAL WATER TREATED SAMPLES
151
The collected fraction (peak at 36 minutes in bottom chromatogram in figure 5.2) was
concentrated with rotary vapour 5 times, confirmed with HPLC and was directly injected to
Electrospray ionization mass spectrometry (ESI-MS) (Micromass, Manchester, UK) and
MassLynx data acquisition (Fig 5.3). The HMF structure was confirmed in the resulting
spectrum (Fig 5.3.b, the peak at 126.2).
Figure 5. 3 Mass spectrum for the collected peak from HPLC in quadropole positive ion mass
spectroscopy (a) with 127.3 as HMF (and a H) and the structure and fragments of the HMF
molecule (b)

Chapter 5- HMF SYNTHEIS IN THE SUBCRITICAL WATER TREATED SAMPLES
152
5.3.2. Cell wall decomposition in subcritical water
The cider yeast cell wall is composed of β-glucan (60%), mannoproteins (37-40 %) and
small fraction of chitin (<3%). Our objective was to investigate the efficacy of subcritical
water mediated hydrolysis of the yeast cell wall in order to provide a substrate for HMF
production downstream. Most previous works have concentrated on model systems for
example fructose, glucose or cellulose but our complex system which is acidic offers the
opportunity to evaluate the potential of one step conversion of β-glucan to HMF. This aligns
with previous works (Chheda et al. 2007; Claude Moreau et al. 1996) which highlighted the
effect of acidic catalysis for the synthesis of HMF.
The concentration of polysaccharides and peptidoglycan were determined indirectly by
measuring the amount of glucose and mannose. Kinetic model was developed assuming both
the glucose and mannose were the only substrates for HMF production. The potential
substrate availability was derived from measuring the amount of glucose and mannose in the
soluble fraction from the supernatant and the solid residue.
The subcritical water mediated hydrolysis of the yeast biomass was studied at
temperatures between 175 °C and 250 °C at 10 MPa and the conversion of biomass under
these conditions is shown in Fig 5.4. Biomass (β-glucan) conversion was measured by
comparing the amount of glucose (as a measure of β-glucan) left in the solid residue and
what was available in the untreated yeast biomass (substrate). The decomposition of the cell
wall appears to start at 175 °C (based on the solid analysis) and under these conditions more
than 50% of the solid biomass was hydrolysed after 30 minutes.
The hydrolysis of biomass continued to increase with temperature up to 250 °C, where
full hydrolysis of the cell wall was achieved after 5 minutes as no further glucose or mannose
was detected in the solid residues. Our findings can be compared to other works in which

Chapter 5- HMF SYNTHEIS IN THE SUBCRITICAL WATER TREATED SAMPLES
153
cellulose reached to complete conversion at temperatures equal or higher than 250°C in non-
catalyzed conditions (Jing & X. Lu 2008; Sasaki et al. 1998). At higher temperatures (≥225
°C), the reaction is very fast and may have not been represented very well with the used
reactor because of the initial heating up stage resulting in some discrepancy between
experimental points and fitted lines.
The extracts from the experiments were analyzed using HPLC to resolve both
carbohydrates and organic acids known to be generated under the subcritical conditions
(Bicker et al 2005) (Fig. 5.5.). For monosaccharide analysis, the glucose peak was identified
at 175 °C and reached its peak at 225°C and thereafter it decreased from 250 °C. The loss of
Figure 5. 4 Effect of temperature and time on the hydrolysis of β-glucan of the yeast cell wall,
experimental data and kinetic model (solid lines)

Chapter 5- HMF SYNTHEIS IN THE SUBCRITICAL WATER TREATED SAMPLES
154
the sugar peaks at 250 °C and 275 °C would appear to be related to all the nonspecific
reactions generating secondary products (such as HMF, levulinic acid which is indicated in
the Fig. 5.5.c). Higher reaction temperature (275 °C) was used in Fig 5.5.c as the peak for
levulinic acid was more pronounced at this temperature. The chromatogram which was
recorded at 175 °C shows a higher reaction time (20 min) as the conversion was lower that
can be shown at shorter times.
Monosaccharide analysis of the extracts clearly showed that release of glucose and
mannose starts at temperatures as low as 175 °C and the change in their concentration was
showed in Fig.5.6. Both compounds reached their maximum yield after 4 minutes at 225 °C
and they are further dehydrated to organic acids, as the temperatures increases.
Monosaccharide yield was based on the released monosaccharide (soluble in liquid phase)
compared to the total amount of monosaccharide available in the substrate (untreated yeast
cells) measured by carbohydrate assay described in 5.2.3.
Ethanol residues are still available in the samples even after alcohol removal step in the
cider manufacturing process. The concentration of ethanol in the crude sample was measured
with HPLC-RI (using the same method described in 5.2.4 and 4.2.1) and was estimated to be
25 mmole/lit (Fig 5.6)
Figure 5. 5. Calibration curve for ethanol measurement using HPLC-RI
y = 0.00012466x
R2 = 0.99998081
0
10
20
30
40
50
60
0 50000 100000 150000 200000 250000 300000 350000 400000 450000
Area
[mM
]

Chapter 5- HMF SYNTHEIS IN THE SUBCRITICAL WATER TREATED SAMPLES
155
Figure 5. 6 HPLC chromatograms for the slurry after batch hydrothermal treatment (a) 175 °C
for 20 minutes (b) 225 °C for 6 minutes (c) 275 °C for 6 minutes

Chapter 5- HMF SYNTHEIS IN THE SUBCRITICAL WATER TREATED SAMPLES
156
The conversion of glucose to HMF was also measured using the same HPLC method.
The maximum concentration of HMF was observed after 10 minutes at 225 °C and was 21
mmole/litre. At higher temperatures (>225 °C), HMF appears to be decomposed to other
compounds as previously reported by Girisuta et al. (Claude Moreau et al. 1996).
Figure 5. 7 Yield of monosaccharide release after the hydrolysis of the yeast cell wall at temperatures
between 175°C and 250 °C. Yield was calculated based on the mole of monosaccharides in the liquid
phase to the amount in the starting solids in feed

Chapter 5- HMF SYNTHEIS IN THE SUBCRITICAL WATER TREATED SAMPLES
157
5.3.3 Reaction kinetics
In order to establish a clear understanding of the conversion rates of yeast cell wall
polysaccharides to HMF and also to draw a comparison between yeast biomass and
cellulose, reaction kinetics were studied and calculated.
Simple consecutive reactions have been widely employed to determine the rate
constants for cellulose decomposition and product formation (Rogalinski, Ingram, et al.
2008; Rogalinski, K. Liu, et al. 2008; Jing & X. Lu 2008). Because of the similar molecular
structure of the raw sample (β-glucan in yeast and cellulose), similar kinetics were also used
to study the biomass decomposition in this work. 1-3-β-glucan and mannoproteins were
considered to be the main substrates in the cell wall and their decomposition to glucose and
mannose and further to HMF were the focus of this work.
All the reactions were assumed to be of first order and irreversible as the only reactant
is biomass (and high concentration of water with constant concentration) (Rogalinski et al.
2008). The polysaccharides (β-glucan and mannoprotein) and monosaccharides (glucose and
mannose) can also be converted to other by-products (humic, organic acids such as acetic
acid, insoluble compounds) during the reaction. The reactions was assumed to follow the
scheme 5.1.

Chapter 5- HMF SYNTHEIS IN THE SUBCRITICAL WATER TREATED SAMPLES
158
Scheme 5.1. Yeast beta-glucan decomposition to the glucose and subsequent conversion
To solve the kinetic models and calculate the rate constants, a model was first proposed
and unknown parameters were estimated based on the conversion data for each compound
(glucose and HMF) as carried out by Jing et al. (Jing & X. Lu 2008). If kd,CW (k1+k2) is the
rate constant for the decomposition of the cell wall polysaccharides and kd,MS (k3+k4) is for
the decomposition of monosaccharides (glucose and mannose), equation (1), (2) and (3)
denotes the kinetic equations for the decomposition of cell wall polysaccharides,
monosaccharides and HMF respectively:
Solutions of pure HMF and glucose were prepared separately and processed under the
same conditions for hydrolysis experiments to measure the amount of conversion with time
CW,CW Ck
dt
dCCWd=
MS,,1MS CkCk
dt
dCMSdCWd −=
(1)
(2)
HMFHMF Ck
dt
dC5= (3)
products
ionDecomposit→ 5k
Humin and other products
→1k
2k↓
Cell wall polysaccharides
4k↓
→ 3kGlucose and
Mannose

Chapter 5- HMF SYNTHEIS IN THE SUBCRITICAL WATER TREATED SAMPLES
159
for each compound. Using the conversion-time data and also calculating the analytical
solution for equations (1) to (3), reaction rates were estimated and compared with the
experimental data.
The rate constants were estimated using the data derived from a -ln (1-X) vs. time plot
by calculating the slopes of straight lines (Fig. 5.7) and the values were summarized in Table
5.1. The fitted lines had all linear correlation of ≥ 0.93, except for data points at 250 °C
where resulted in R-squared value of % 81. As temperature rises, the slope increases which
is typical in the temperature related reactions. However, the slight disagreement between the
lines and the experimental points at higher temperatures can be contributed to the technical
limitation in temperature measurement and initial heating-up stage.
Figure 5. 8 Determination of the reaction rate constants for the hydrolytic degradation of yeast cell wall
based on the data obtained from carbohydrate analysis

Chapter 5- HMF SYNTHEIS IN THE SUBCRITICAL WATER TREATED SAMPLES
160
The measured values listed in table 5.1 were also used in the Fig 5.7 to obtain the solid
line representing the kinetic model which is in good agreement with experimental values.
Data obtained for cellulose and starch decomposition by Rogalinski and co-workers
(Rogalinski, K. Liu, et al. 2008) in similar temperature range are provided to give a
comparison of the rate constants for the hydrolysis of β-glucan, cellulose and starch.
Table 5. 1 Rate constants for the decomposition of the cell wall polysaccharides (minutes-1)
T (°C) k1 k2 kd, cell wall kd, cellulose* kd, Starch
*
175 0.0047 0.0342 0.0389 n.d. n.d.
200 0.0133 0.077 0.0903 n.d. 0.036
225 0.0629 0.2261 0.289 n.d. 0.114
250 0.0326 0.6652 0.698 0.15 0.606
275 n.d. n.d. n.d. 1.284 1.902
n.d.: not determined *: The nearest temperature has been used if the data were not available for the indicated temperature
(rates at 230 °C instead of 250 °C, 280°C instead of 275 °C)(Rogalinski, K. Liu, et al. 2008)
The values obtained for the cell wall reaction rate constants show higher values when
compared to pure cellulose and starch, which is composed of the same glucose subunits. A
plausible explanation is that the glycosidic bonds of the β-glucan, β-1-3 and β-1-6 linkages,
which are abundant in the yeast cell wall and are easier to hydrolyze when compared to
cellulose with β-1-4 linkages or starch with β-1-6-linkages. Milder hydrolysis condition for

Chapter 5- HMF SYNTHEIS IN THE SUBCRITICAL WATER TREATED SAMPLES
161
β-1-3 glucan feedstocks was also observed in a study by Nagamori et al. where starch, with
similar polysaccharide structure to the yeast cell wall, was hydrolysed in pure water
(Nagamori & Funazukuri 2004). However, starch based feedstocks (mainly crops) are related
to food chain supplies which limits their application for the production of bio-based
chemicals.
In addition, it has been shown that the lower pH of the medium also promote the
hydrolysis of the glucan polymers (Sasaki et al. 1998). Therefore, the presence of organic
acids in the raw material and/or the organic acids produced during the reactions
(autocatalysis) may also contribute to the higher rates of hydrolysis.
5.3.4 HMF synthesis from released monosaccharides
The conversion rates and the kinetics of HMF formation was also investigated which
occur after the cell wall breakdown. In addition to the HMF pathway, there are a number of
other reactions that originate from glucose and lead to other products ranging from different
isomers of glucose and mannose, organic acids such as acetic acid, formic acid and etc)
which have been discussed previously (Kabyemela et al. 1999; Knez ̌ević et al. 2009). When
hexose molecule loses 2 molecules of H2O, HMF would be formed, which can be converted
further to other derivatives such as levulinic acid or formic acid at higher temperatures (Fig
5.5.c). In this study, however, the focus was on the synthesis and accumulation of HMF itself
but other by products were detected at higher temperatures.
Fig. 5.8.a shows the yield of HMF at different reaction temperatures based on the
moles of HMF produced and the glucose and mannose in the dried yeast at the start of the
experiment. HMF started to accumulate at 175 °C and reached a maximum yield of 2% after
30 minutes. Yield increased at higher temperatures and reached more than 12 % at 250 °C.

Chapter 5- HMF SYNTHEIS IN THE SUBCRITICAL WATER TREATED SAMPLES
162
At higher temperatures, the HMF yield decreases due to the decomposition to other organic
acids. Due to the batch configuration it was not technically possible to measure the yield
accurately at higher reaction rates at higher temperatures, because under these conditions the
hydrolysis, dehydration and subsequent decomposition occurred during the initial heating-up
stage.
Reaction rates for glucose conversion to HMF (HMF formation, k3) and other soluble
and insoluble products (k4) and HMF decomposition (k5) were calculated by using the same
method (section 5.3.3) and compared with in Table 5.2. Comparing kd,MS and k5 (rate
constants for monosaccharides and HMF degradation respectively), the dehydration of
sugars starts at low levels at 175 °C where HMF decomposition was negligible. At higher
temperatures, the rate constant for HMF formation (k3) increased while at the same time, it
degrades at higher rates (k5). However, the optimal temperature appears to be at 225 °C at
which the HMF formation rate constant is higher than its decomposition reaction by 130%,
resulting in the accumulation of HMF in the medium under these conditions. At higher
temperatures, kd,MS and k5 increased resulting in lower concentrations of HMF which were
observed during very short reaction times (< 5 minutes). Based on the obtained data, the
estimated rates for the synthesis of HMF are comparable to those experiments where
cellulose was the substrate. However, it should be noted that the hydrolysis of cellulose
requires higher temperatures (>250 °C) and this could lead to higher decomposition rates for
HMF at such conditions (Jing & X. Lu 2008).
As described in previous section, the yeast cell wall was hydrolysed at higher rates
when compared to cellulose-based biomass at the same temperature. For example, 90% of
the yeast cell wall polysaccharides were solubilised after 15 minutes at 225°C. The same
value was obtained after only 5 minutes at 250 °C which is comparable to lower rates for

Chapter 5- HMF SYNTHEIS IN THE SUBCRITICAL WATER TREATED SAMPLES
163
cellulose (e.g. only 20% liquefaction of cellulose after 3 minutes at 240 °C (Rogalinski, K.
Liu, et al. 2008)).
Initial heating up stage (induction time) is common to all batch reaction studies and its
impact can be minimized by improving the heat transfer rate in the reactor. In batch
configurations, one option could be the use of more novel heating techniques such as
induction heating (Tsai et al. 2006). Due to the technical limitation in this research,
minimising the volume of the reactor to 4 ml tube reactor was the only option to reduce the
heating up time.

Chapter 5- HMF SYNTHEIS IN THE SUBCRITICAL WATER TREATED SAMPLES
164
Figure 5. 9 (a) Yield of monosaccharides due to the yeast cell wall hydrolysis at temperatures
between 175°C and 250 °C. Yield was calculated based on the mole of monosaccharides in the
liquid phase to the amount in the starting biomass (b) β-glucan conversion at different
temperatures and times (solid line are connecting lines)

Chapter 5- HMF SYNTHEIS IN THE SUBCRITICAL WATER TREATED SAMPLES
165
In summary, it is possible to explain the observed difference between yeast cell wall
and cellulose due to the more flexible structure of β-glucan and mannoprotein found in the
yeast, the lack of lignin and the possible contribution of the unrefined medium on the
hydrolysis/catalytic reaction.
Table 5. 2 Rate constants for glucose (and mannose) and HMF decomposition (minutes-1)
T (°C) k3 k4 kd,glucose k5(HMF, d)
175 0.0002 0.0076 0.0078 n.d.
200 0.0028 0.0391 0.0419 0.0037
225 0.0196 0.0994 0.119 0.0083
250 0.0033 0.2927 0.296 0.0202
275 n.d. n.d. n.d. 0.05
n.d.: not determined
5.4. Conclusion
The aim of this chapter was to demonstrate the potentials of using alternative sources
of biomass to generate sugars and sugar hydrolysis products, such as HMF. Yeast biomass
was composed of two polymers which were converted to monosaccharides when were
subjected to hydrolysis process. It was also shown that sub-critical water can be used to
hydrolyse the glucan and mannoproteins structure of the yeast cell wall into its monomers
under comparatively milder operating conditions when compared to conditions used to
hydrolyse lignocellulosic biomass. 90% conversion of cell wall biomass was achieved only
after 15 minutes at 225 °C and less than 5 minutes at 250 °C. This is a result of more flexible
structure of β-glucan in yeast, presence of no lignin and the possible contribution of the

Chapter 5- HMF SYNTHEIS IN THE SUBCRITICAL WATER TREATED SAMPLES
166
unrefined medium to the hydrolysis reaction. The lower temperature for the production of
sugars from biomass offer better conditions to target sugars as well as HMF before they are
being degraded to secondary or tertiary by-products at higher temperatures. Higher reaction
temperatures leaded to the increased levels of HMF and yields of more than 20% were
achieved at 225 °C. This is comparable to the higher temperatures in cellulosic biomass
pretreatment which is required to access to the monomers of cellulosic biomass; thus
suggesting a lower temperature process that can be employed in biomass conversion to
renewable chemicals. The higher reaction temperatures for lignocellulosic biomass would
lead to the increased formation of secondary and tertiary reactions and lower yields of
intermediate products such as HMF.
While the yields of HMF obtained with cider yeast (12%) are lower compared to the
40-60% obtained with pure substrate and catalysts (Qi et al 2008), an important aim of this
study was to include any positive catalytic effects that may exist in this crude extract,
alleviating the use of additional catalysts. However, it is believed that slight decrease of the
medium pH by adding some acid can improve the yields for the HMF synthesis. Eliminating
the use of any auxiliary organic solvent during the reaction was also a target that was tried to
address, which may have resulted in lower yields in our single phase (aqueous) medium.
Considering other potential products that may be present in such feedstocks (yeast
components such as amino acids or vitamins, or compounds that originate from apple), this
processes can establish a platform for both extraction and synthesize of valuable compounds
by integrating sequential batches operating at optimum conditions that is designed for each
product/fraction. Therefore, in summary our results indicate the feasibility of using benign
solvents to add value to organic waste by generating multiple revenues for the cider, brewing
and ethanol industries that produce large volumes of spent yeast waste annually.
Chapter 5- HMF SYNTHEIS IN THE SUBCRITICAL WATER TREATED SAMPLES
167
In terms of waste treatment and disposal issues, the studied process can be a step
forward for the brewery industries to introduce an alternative approach for the large volumes
of waste they produce annually Biomass transformation can be a solution to these concerns
as it has been suggested for similar feeds previously (Lamoolphak et al. 2007; Ferreira et al.
2010). Authors were not able to identify any similar work which had suggested an
alternative approach for cider lees waste. This can be due to its different composition such as
the acidic medium, different species of yeast (in this case, S. bayanous in cider fermentation
instead of S. ceravisiae in beer fermentation) or the existence of other microorganisms or
undesired compounds.
Furthermore, the obtained yields should be viewed within a potential integrated
biorefinery context where an organic waste material is cascaded into multiple products of
which HMF is but one. In particular, similar waste is generated in bioethanol fermentation
waste (the energy section of most biorefineries) which this study can propose a solution for
their application. This approach can lead to further improvements in bioeconomy merits of
current biorefinery technology by fully capturing the chemical and energy of potentials of
biomass and secondary yeast wastes. However, more concentrated feed (in terms of yeast
concentration) is necessary in order to find out how this process operates in order to perform
the economic analysis. In a techno-economic study by Kazi et al (Kazi et al. 2011), HMF
production from pure fructose was studied in a catalytic reaction and it was showed that
feedstock price accounts for 48% of the final cost of the HMF ($1.33/lit). In comparison, the
suggested process in this study have access to a very low cost feedstock which can improve
the feasibility of the process.

Chapter 6- DESORPTION OF PHENOLICS FROM CIDER SPENT LEES
168
Chapter 6
6.1 Introduction
Apple cider is known to contain significant amounts of phenolics which are originated
from apple fruits and these phenolics largely contribute to its final nutritional values. The
major part of these soluble materials, except sugar which has been consumed during the
fermentation, are still present in the cider lees. Preliminary results, which were presented in
chapter 3 showed that the crude sample contains some phenolics which its concentration
increases significantly after running the subcritical water hydrolysis. These compounds are
believed to be the main cause of antioxidant activity in the extracts highlighting their role in
the final properties of extracts. The phenolic concentration profile against temperature
showed an increasing trend to temperatures up to 225 °C while it decreased at higher
temperatures. This pattern proposes that these compounds are either had been produced or
most probably had been released from yeast cells as will be discussed in this chapter.
Cider Spent Yeast and the Phenolics: The Release of Phenolics Using Subcritical Water

Chapter 6- DESORPTION OF PHENOLICS FROM CIDER SPENT LEES
169
As discussed earlier in chapter 2, yeast cells have been shown to interact and adsorb
the available phenolics in wine process during the fermentation step by adsorbing them on
their outer surface. This interaction has been studied specially in the wine making process as
it can change the final properties of wine by removing certain phenolics from the product
(e.g. anthocyanidins) and change the properties of the final product (such as colour). While
the same interaction should occur in the cider process, this have not been addressed before
which could be due to the its negligible effect on the final properties of cider.
This chapter discusses more detailed experiments which carried out to investigate the
nature of phenolic fraction in the hydrothermal treated extracts and their adsorption and
comparing their release from the yeast cells using both organic solvent extractions and
subcritical water treatment. In these experiments, the same batch stirred reactor (which was
described in Chapter 3) was used at temperatures between 100°C and 250 °C and 10 MPa
pressure. In order to measure only the phenolics which have been released during the
desorption process, yeast cells were separated from the original slurry after centrifugation,
washed and re-suspended in distilled water. HPLC analysis of the extracts was also carried
out and the chlorogenic acid level was shown to increase following the same trend which
confirms its prior adsorption on the yeast cell wall and its release due to being subjected to
subcritical water. UV-spectrum of the HPLC column eluent (which recorded by Diode Array
Detector) also indicated a significant change in the composition of the extracts at higher
temperatures.

Chapter 6- DESORPTION OF PHENOLICS FROM CIDER SPENT LEES
170
6.2 Materials and Methods
6.2.1 Raw Material
Spent cider lees was collected from cider manufacturer site (Bulmer, Herefordshire,
UK), stored in -20 °C freezer and used as described before in section 3.2.1. Total solid
concentration in the slurry was 12% (w/v) and the total concentration of the yeast cells were
determined by filter paper (Whatman, grade No. 1) and was 10% (w/v). To prepare washed
yeast cells, crude sample was first centrifuged at 5000 g for 10 minutes to separate the yeast
cells from the liquid fraction. Yeast cells were washed three times by repetitive re-
suspension in distilled water and centrifugation using the same speed. In the final step, yeast
residues were suspended in distilled water at a concentration of 10 % (w/v) and used for the
experiments. Folin-Ciocalteau reagent (2 N solution), sodium bicarbonate (≥ 98.0%) and
gallic acid (97.5-102.5%) which were used for total phenolic measurements were all
purchased from Sigma-Aldrich, United Kingdom. Standard phenolics were including (with
purity grade): chlorogenic acid (≥ 95%), epicatechin (≥ 98%), p-coumaric acid (≥ 98.0%),
phloridzin dehydrate (≥ 99%), quercetin glucoside (≥ 90%) and caffeic acid (≥98.0%) were
also purchased from Sigma-Aldrich, United Kingdom.
In order to eliminate the interference of the suspended phenolics in the substrate, 3
times washed cells were used in subcritical water reactions instead of original substrate. The
washed cells were prepared by consecutive centrifugation and re-suspension of the cells in
distilled water until the supernatant became clear. In the final step, cells were suspended in
distilled water in the same weight ratio as original sample.

Chapter 6- DESORPTION OF PHENOLICS FROM CIDER SPENT LEES
171
6.2.2 Reactions in Subcritical water
For subcritical water reactions, the same setup and process which described earlier in
Chapter 3 was used. Briefly, 200 ml of washed cider spent yeast was used for each
experiment in the 300 ml high pressure stirred reactor where it was heated using an electrical
heater at temperatures between 100 and 250 °C. Stirrer speed was set to 500 rpm and the
reactor was pressurized with Nitrogen gas at 10 MPa to maintain the contents in the liquid
phase. Cooling water was circulated through a pre-installed coil to lower the reactor
temperature at the end of each run and before opening the reactor. To remove the effect of
heating-up stage (which described in chapter 5), a sample was taken when the reactor
reached the set temperature (t= 0 minutes). Samples were collected from the reactor using a
cooled sampling valve at different times and centrifuged at 3500 g (Beckman,US) for 10
minutes after quenched in a mixture of ice and water. The supernatants were stored at-20°C
freezer and defrosted before being analysed. Supernatants were directly subjected to total
phenolics assays (Folin-Ciocalteu assay) and HPLC analysis without any pretreatment.

Chapter 6- DESORPTION OF PHENOLICS FROM CIDER SPENT LEES
172
6.2.3. Phenolics extraction with organic solution
The cells which were washed three times with distilled water were submitted to
repetitive extraction using a solution of Acetone:Water:HCl (70:29:1) (Fig 6.1). This
solution was selected as it had been used previously to remove the phenolics from wine lees
(Mazauric & J.-M. Salmon 2006). Using this method, the phenolic compounds that had been
adsorbed on the cider yeast during the fermentation were expected to be extracted.
Measuring the TPC in these extracts shows the total content of phenolics that can be released
and facilitates the comparison between organic solvent extraction and subcritical water
treatment.
Figure 6. 1 Extraction scheme using a solution of Acetone:Water:HCl (70:29:1) to release the
desorbed phenolic compounds from yeast cells
Supernatant
Solid residue
Centrifuge at 5000 g for 10 minutes
3 times water washed cells
Re-suspension in Acetone:Water:HCl and shaking for 10
minutes
Repeat for 3 times
HPLC and TPC analysis

Chapter 6- DESORPTION OF PHENOLICS FROM CIDER SPENT LEES
173
To achieve this, washed cells were first centrifuged at 5000g for 10 minutes to harvest
the cells from the suspension and the precipitated cells were re-suspended in the solvent
mixture. After 10 minutes of mixing in a shaker at room temperature, the slurries were
centrifuged and the cells were re-suspended in fresh solvent again. This was repeated for
three times until the supernatant became clear. Extractions were carried out in four solid
ratios (10%, 7.5 %, 5% and 2.5 % w/v) to measure the extraction power at different solid
concentrations.
6.2.4 Total phenolic content (TPC) assay
6.2.4.1 An Introduction to Folin-Ciocalteau (FC) Assay
This method is a well-known assay which introduced in chapter 3 in detail. It has been
widely reported as the method of choice in analysis of numerous biological and non-
biological samples. However, the main drawback of this assay is the potential interference of
non-phenolic materials such as proteins, reducing sugars, ascorbic acid, SO2 and sorbic acid
which are largely distributed in wine (Wrolstad et al. 2001). The main reason is shown to be
the high reactivity of Folin-Ciocalteu reagent that oxidizes other compounds. This may lead
to overestimation of phenolics in the studied extracts and hence, suitable removal procedures
must be applied in order to consider any error. This problem can be partially avoided by
adding acetaldehyde (to bind the bisulphate) or apply the correction factors (Waterhouse,
2005). As an example, Escarpa and Gonzalez addressed the interference problem in green
bean samples and suggested the use of HPLC as a tool to measure the total phenolics in
addition to Folin-Ciocalteau assay (Escarpa & González 2001).

Chapter 6- DESORPTION OF PHENOLICS FROM CIDER SPENT LEES
174
6.2.4.2 Folin-Ciocalteau Assay-The method
To measure the total phenolic content of the crude sample and the obtained extracts,
the Folin-Ciocalteau assay was used following a modified version of the original method
(Singleton & Rossi 1965) and results were reported as grams of gallic acid equivalent
(GAE). The actual method used for the assay was earlier discussed in section 3.2.8 based on
the micro method which was developed by University of Davis, California, US (Waterhouse,
2005) and is described below:
Gallic Acid Stock Solution: In a 100-mL volumetric flask, 0.500 g of dry gallic acid
was dissolved in 10 ml of ethanol and was diluted to volume with distilled water. The flask
was kept closed in a refrigerator and fresh solution was prepared every two weeks.
Sodium Carbonate Solution: 20 g of anhydrous sodium carbonate was dissolved in
80 ml of distilled water and heated until boiling. After cooling, a few crystals of sodium
carbonate was added and left at room temperature for 24 hr. The solution was filtered with
filter paper (Grade 1, Whatman, UK) and diluted to the volume of 100 ml with distilled
water.
Calibration curve: To prepare a calibration curve, 0, 1, 2, 3, 5, and 10 ml of the
prepared phenol stock solution was added into a 100 ml volumetric flasks, and then was
diluted to volume with distilled water. These solutions had the phenol concentrations of 0,
50, 100, 150, 250, and 500 mg/L gallic acid, the effective range of the assay and used to
prepare the calibration curve (Fig 6.2).
Measurement: From each calibration solution, sample, or blank, 20 µl was added into
separate cuvettes and diluted with 1.58 ml water. 100 µl of the Folin-Ciocalteu reagent was
also added and the solution was mixed well. After 2 minutes, 300 µl of the sodium carbonate

Chapter 6- DESORPTION OF PHENOLICS FROM CIDER SPENT LEES
175
solution was added and mixed. Solutions were left at room temperature for 2 hr and the
absorbance of each solution was determined at 765 nm against the blank (the "0 ml"
solution). The absorbance vs. concentration plot was prepared (calibration curve) and used
to calculate the unknown amount of phenolics in the extracts for each new set of
measurement.
Figure 6. 2. The calibration curve in the Folin-Ciocalteu assay (absorbance measured at 765 nm and
3 replicates were prepared for each point)

Chapter 6- DESORPTION OF PHENOLICS FROM CIDER SPENT LEES
176
Samples were collected from the reactor and the solids were separated by
centrifugation at 3500 g for 10 minutes and the supernatants were used for the analysis.
6.2.4.3 Protein interference in Folin-Ciocalteau assay
As described in result section 3.3.6, the hydrolysed samples were showed to contain
soluble proteins which may interfere in the FC assay (Escarpa & González 2001). This may
apply to samples which were prepared at temperatures between 150 and 200 °C as the
protein quantity was higher compared to other temperatures. To study the possible
interference of proteins, a protein precipitation technique was used to remove the proteins
from the samples and the resulting supernatant was checked with FC-assay again to find out
if there is any variation in the reported values of phenolics in samples containing proteins
and the ones which proteins were removed.
6.2.4.4 TCA protein precipitation protocol
Protein precipitation using mineral acids is based on changing the medium pH to get
closer to the pI (isoelectric point) of the proteins which is the pH at which the net protein
charge becomes zero. Protein aggregation occurs in these conditions which facilitates their
removal using centrifuge. In TCA protocol, 1 volume of Trichloroacetic acid solution (100%
w/v) is added to 4 volumes of the sample and the mixture is incubated at 4°C for 10 minutes
followed by centrifugation at 14,000 rpm for 5 minutes (Sanchez 2001). The protein pellet
was formed as the precipitate leaving behind the non-protein components in the solution.
After removing the proteins from all the hydrolysed extracts that prepared at different
temperatures, no change in phenolic concentration was observed before and after the protein
removal step suggesting that there is no protein interference in the FC assay.
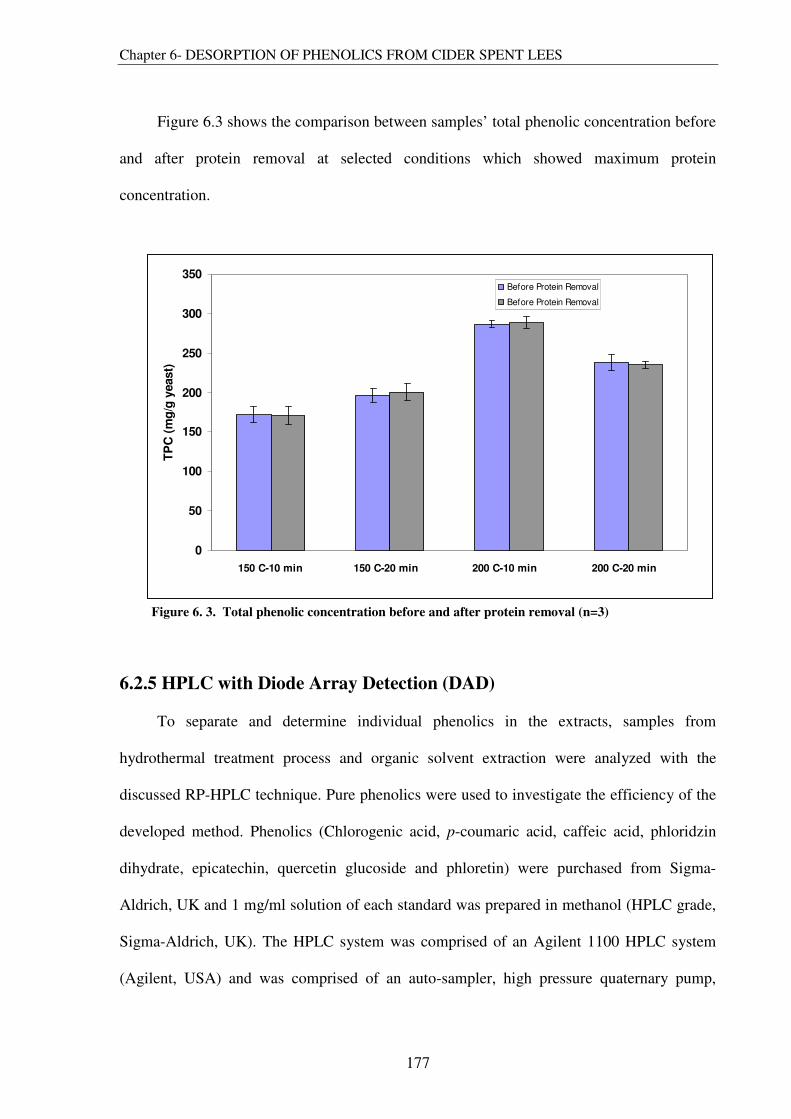
Chapter 6- DESORPTION OF PHENOLICS FROM CIDER SPENT LEES
177
Figure 6.3 shows the comparison between samples’ total phenolic concentration before
and after protein removal at selected conditions which showed maximum protein
concentration.
6.2.5 HPLC with Diode Array Detection (DAD)
To separate and determine individual phenolics in the extracts, samples from
hydrothermal treatment process and organic solvent extraction were analyzed with the
discussed RP-HPLC technique. Pure phenolics were used to investigate the efficiency of the
developed method. Phenolics (Chlorogenic acid, p-coumaric acid, caffeic acid, phloridzin
dihydrate, epicatechin, quercetin glucoside and phloretin) were purchased from Sigma-
Aldrich, UK and 1 mg/ml solution of each standard was prepared in methanol (HPLC grade,
Sigma-Aldrich, UK). The HPLC system was comprised of an Agilent 1100 HPLC system
(Agilent, USA) and was comprised of an auto-sampler, high pressure quaternary pump,
0
50
100
150
200
250
300
350
TP
C (
mg
/g y
east)
Before Protein Removal
Before Protein Removal
150 C-10 min 150 C-20 min 200 C-10 min 200 C-20 min
Figure 6. 3. Total phenolic concentration before and after protein removal (n=3)

Chapter 6- DESORPTION OF PHENOLICS FROM CIDER SPENT LEES
178
online degasser, column oven and diode-array detector (Agilent, USA). The chromatograms
and spectrum data was collected with ChemStation® software (Version B.01.02) which was
provided from Agilent to control and carry on the measurements on their LC system.
The HPLC column was a 4 micron Synergi-Fusion (250 × 4.6 mm) column
(Phenomenex®, USA) which was equipped with a column guard with the same stationary
phase (4 × 2.0 mm). To provide a better separation (resolution) of the studied phenolics, a
new method was developed in our laboratory based on using varying ratios of aqueous and
organic solvents in mobile phase throughout each analysis (more discussion in section 6.3.1).
Two mobile phase were prepared for the method: First, the aqueous phase (solvent A) which
was HPLC-grade water (Sigma Aldrich, UK) with 0.1% formic acid (pH=3.6) and second,
the organic phase (solvent B) which was HPLC- grade methanol (Sigma Aldrich, UK) with
0.1% formic acid (HPLC grade-Sigma Aldrich) (pH=4.2) and were used as follows (flow
rate was constant at 1 ml/minutes): Pure A for the first 5 minutes, 0-20% B linear from 5 to
15 minutes, 20-45% B from 15 to 35 minutes, 45-60% from 35 to 45 minutes and back to
0% B from 50 to 52 minutes. The method was validated by running a mixture of
6 phenolics which were expected to be present in our substrate and checking the separation
of peaks. Diode-array detector provided the spectrum of the column eluent at wavelengths of
200-600 nm between 0-54 minutes of elution from the HPLC column. Based on the previous
studies about phenolics in cider apples (B. Suárez et al. 2005), phenolic standards were
purchased and used to prepare standard solution of each compound. By injecting the
standards and comparing their retention time with the peaks at same retention time in the
crude sample and extracts, available phenolics were identified.

Chapter 6- DESORPTION OF PHENOLICS FROM CIDER SPENT LEES
179
6.3 Results
6.3.1 RP-HPLC Method Development and Determination of Phenolics
In order to identify and quantify the individual phenolic acids, a new HPLC technique
was developed based on the elution profile of different compounds in the reversed phase
HPLC. A mixture of phenolic compounds where prepared as standard sample to evaluate the
elution of different phenolic compounds. The major phenolic compounds which are expected
to be present in apple were identified and were purchased (Sigma-Aldrich, UK).
Figure 6. 4. Method development and the chromatogram of phenolic mixtures at different organic
phase ratio (a) and the optimized final method which used for the study (b)

Chapter 6- DESORPTION OF PHENOLICS FROM CIDER SPENT LEES
180
The final standard mixture was a solution of 1 mg/ml of following phenolics in HPLC
water (Chlorogenic acid, p-coumaric acid, caffeic acid, phloridzin dihydrate, epicatechin and
quercetin glucoside). For the mobile phase, two main solvents were used including acidified
HPLC water (0.1 % formic acid) and acidified HPLC methanol (0.1% formic acid) and were
used in different ratios to obtain the best separation of resulting peaks. Typically, analysis
started with highest ratios of aqueous phase. In this work, the HPLC method was started with
100% water as a Synergi-Fusion column was used which is a modified reversed phase
column with enhanced separation for very polar compounds that elute very fast in a reversed
phase column. After 5 minutes of running the column with pure water after injection, a
gradient of organic solvent introduced which its ratios changed during the run. Three
different ratios of 20 %, 40% and 60% was used. For the detection, a DAD detector was
used at 270 nm and flow rate was set to 1 ml/min. Table 6.1 listed the condition used in 3
separate methods developed during this step and Table 6.2 shows the retention time of each
phenolic standard in each method. Method 3 was selected as the running method as it
provided better separation for all the phenolic in shorter time.
Table 6. 1 Description of gradient elutions used in method development
Method 1 Method 2 Method 3
Time
(min)
Organic phase
(B) ratio (%) Time (min)
Organic phase
(B) ratio (%) Time (min)
Organic phase
(B) ratio (%)
0-5 0 0-5 0 0-5 0
5-30 45 5-30 40 5-15 20
30-45 60 30-40 45 15-35 45
45-50 60 40-50 60 35-45 60
50-51 0 55-60 0 50-52 0

Chapter 6- DESORPTION OF PHENOLICS FROM CIDER SPENT LEES
181
Table 6. 2 Retention time(Rt) of the phenolic peaks in different methods
Phenolic compound
Rt(min)
Method 1
Rt(min)
Method 2
Rt(min)
Method 3
Caffeic acid 26.5 28.6 25.1
Chlorogenic acid 27.2 29.3 26
Epicatechin 28 30 26.5
p-Coumaric acid 31.9 34 31
Phloridzin dihydrate 38.9 42 38.1
Quercetin glucoside 39.1 42.8 39.3
Phloretin 45.6 50.7 46
Figure 6.4(a) shows an overlay of phenolic chromatograms in different gradient
systems (straight lines with the indicated ratios of methanol). As the chromatogram suggests,
the ratios of organic phase and its duration has a significant effect on the separation of
phenolic compounds. The optimized method (method 3) was selected and used throughout
the phenolic study to determine and measure the individual phenolics (Figure 6.4(b)). To
provide some comparison, figure 6.4 shows the chromatograms of the crude substrate (a) and
the extract at 225 °C, 15 min and 100 bar (b). Only 5 of the 7 standard phenolic were
detected in the studied lees samples (section 6.3.3). As can be seen from fig 6.5 , the major
phenolic also break down at 200 °C

Chapter 6- DESORPTION OF PHENOLICS FROM CIDER SPENT LEES
182
Figure 6. 5. Chromatogram of the crude substrate (a) and the subcritical water extract at 225 °C and 15
minutes and breakdown of major detected phenolic compounds (phenolic peaks were 1-Chlorogenic acid,
2- p-Coumaric acid and 3-Phloridzin dihydrate)

Chapter 6- DESORPTION OF PHENOLICS FROM CIDER SPENT LEES
183
6.3.1 Phenolic desorption using subcritical water
Figure 6.6 shows the concentration of total phenolics (in terms of mg of equivalent
gallic acid per g of yeast) in the washed cells after being subjected to subcritical water.
Concentrations were divided by the dry weight of yeast cells in the starting substrate to better
represent the relation between phenolic content and the yeast cells concentration. In addition,
this makes the comparison between subcritical water and organic solvent extraction more
convenient. The suspended (or measurable) total phenolic content of the washed cells was
also measured and was zero which confirms that no phenolic is present in the liquid phase
before the reaction. Time zero is for the samples which were taken from the reactor after it
reached to the set temperature.
Figure. 6. 6. Total phenolic content (TPC) of cider yeast released through hydrothermal treatment
process. Error bars represent standard deviation (n=3).

Chapter 6- DESORPTION OF PHENOLICS FROM CIDER SPENT LEES
184
Comparing the TPC content of the extract to the reaction temperature suggest that
increasing the temperature has improved the yield of extraction. Residence time, however, is
only important at temperatures below 200 °C as TPC increased at longer residence times. At
higher temperatures (225 and 250 °C), it seems that phenolic desorption had long been begun
during the heating up stage suggesting the high rate of desorption and consecutive
degradation at these temperatures while the effect of time becomes minimum at these
conditions.
The value of TPC in the starting sample (the original substrate before any treatment)
was 58 mg/g of dry yeast. Higher concentrations of phenolics in the extracts suggest that
most of the phenolics were previously adsorbed (more than 3 times) comparing to original
substrate (cider lees), and shows the strong adsorption of phenolic compounds with the yeast
cells.
The results from these experiments clearly show the accumulation of phenolic
compounds in the liquid phase. The desorption could be due to the cleavage of the bonds
which had been formed between the phenolic compounds and the polysaccharide or proteins
in the cell wall of yeast.
Results also suggest that the total phenolic concentration increases significantly with
increasing temperature. TPC was negatively affected at temperatures higher than
200 °C due to higher rates of phenolic decomposition. The total phenolic concentration was
reached to a maximum of 280 mg/g of dry yeast (3441 mg of gallic acid/ml) after 10 minutes
at 200 °C.

Chapter 6- DESORPTION OF PHENOLICS FROM CIDER SPENT LEES
185
The hydrolysis experiments were also carried out using different concentrations of
washed cells in the medium, in order to identify any possible correlation between the solid
and solvent ratios and the amount of released phenolics from the cells (Fig 6.7). These
experiments were only performed in 200 °C. As indicated in Fig. 6.7, the concentration of
released phenolics changed in almost the same order as the solid concentration in the liquid
phase. In other terms, the desorption rate was not effected in the maximum studied solid
concentration.
Figure 6. 7 Total phenolic contents of yeast extracts at different times after being treated at 200 °C in
different solid concentration (P=100 bar)

Chapter 6- DESORPTION OF PHENOLICS FROM CIDER SPENT LEES
186
6.3.2 Solvent extraction
Subjecting the washed cells to the organic solution showed a similar effect on releasing
the phenolics from biomass. Extracts became yellow-brown which is believed to be due to
the presence of chromatic phenolic compounds. Extracts also became clearer after repeating
the extraction. Extraction step was repeated for 3 times and as Figure 6.8 suggests, more than
30% of the phenolics were extracted in the 2nd and 3rd step together. The effect of solid
ratio and organic solvent was studied using one-way ANOVA (p>0.05) (Microsoft Excel
2003, statistical analysis functions) which suggested that it was negligible (Table 6.3)
Table 6. 3. Details of one-way ANOVA to investigate correlation of solid ratio and solvent extraction
Anova: Single Factor -Solvent Extraction
SUMMARY
Groups Count Sum Average Variance
2.5 3 722.3466 240.7821973 623.8366
5 3 597.9275 199.3091573 5.431791
7.5 3 664.8718 221.6239467 327.3151
10 3 706.9535 235.65116 121.0859
ANOVA
Source of Variation SS df MS F P-value F crit
Between Groups 3096.625 3 1032.208214 3.831261 0.04714 4.066181
Within Groups 2155.339 8 269.4173489
Total 5251.963 11

Chapter 6- DESORPTION OF PHENOLICS FROM CIDER SPENT LEES
187
Using organic solution, the total amount of released phenolics was between 200-240
mg/g of dry yeast and was lower to what was observed in hydrothermal treatment
experiments at higher temperatures (270 mg/g of yeast at 200 °C). The higher phenolic
concentration in the hydrolysed samples could be caused by the parallel or secondary
reactions that have resulted in further amounts of phenolic compounds. As discussed in
Chapter 3, the hydrolysed samples contain proteins which have been released to the medium
after yeast cell breakage.
6.3.3 HPLC analysis- Single wavelength (270 nm)
Figure 6.8 compares the chromatograms of the yeast samples before and after being
treated with subcritical water at 100 °C, 150°C and 200°C for 30 minutes. Five phenolic
compounds were identified in the original substrate as chlorogenic acid, p-coumaric acid,
phloridzin dihydrate, caffeic acid and epicatechin (in order of the peak area respectively).
These phenolics were detected by injecting the solution of standard phenolics and comparing
the obtained retention times of the standard peaks with the peaks which were detected in
Figure 6. 8 Total phenolic content (per g of yeast) of washed cells being extracted with organic
solvent in a 3-step solvent wash process. Error bars represent standard deviation (n=3).

Chapter 6- DESORPTION OF PHENOLICS FROM CIDER SPENT LEES
188
extracts at the same retention time. In addition, DAD analysis provided a complimentary
UV-spectrum of peaks, helping to confirm their specific structure.
The detected phenolic compounds were eluted at longer elution time and start to appear
after introducing the organic mobile phase solvent (Methanol) to the system (Fig 6.9). UV-
detector recording at 270 nm of the raw sample indicates the main phenolic compounds
(chlorogenic acid, caffeic acid, epicatechin, p-coumaric acid and phloridzin dihydrate) which
were identified. Chlorogenic acid was the most concentrated compound (Rt=24 min) with
the concentration of 146 µg/ml in the substrate. It was selected as the individual phenolic
acid to study its release from yeast cells after hydrothermal treatment and solvent extraction
(discussed in next section).

Chapter 6- DESORPTION OF PHENOLICS FROM CIDER SPENT LEES
189
Figure 6. 9 HPLC chromatogram of (a) crude sample and treated ones at different temperatures
((b) 100°C after 30min, (c) 150 °C after 30 minutes and (d) 200°C after 30 minutes). Compounds
were identified by comparing the retention time of standards with existing peaks in the samples.
Identified phenolics were (1) Caffeic acid (2) Chlorogenic acid, (3) Epicatechin, (4) p-coumaric acid
and (5) phloridzin dihydrate. (wavelength= 270nm)

Chapter 6- DESORPTION OF PHENOLICS FROM CIDER SPENT LEES
190
The high concentration of chlorogenic acid enabled its convenient detection and
accurate quantification in the crude biomass and hydrolysed extracts. Hence it was selected
as a marker for phenolic acids to further study their release and concentration in the
experiments.
6.3.4 Chlorogenic acid desorption
Chlorogenic acid was selected also as a marker to provide further understanding on the
release of phenolic acids in the extracts. The high concentration of chlorogenic acid is due to
the significant concentration of this compound in apple and cider (Schieber et al. 2001). The
concentration of chlorogenic acid was 146 µg/ml in the starting sample (crude slurry) and
increased to 196 µg/ml after being heated to 100 °C for 20 minutes (Fig. 6.10). The 30 %
increase in the concentration is believed to be due to the release from the yeast cell wall. To
confirm this, chlorogenic acid concentration was also measured in the organic solution
extracts which were prepared previously. Results suggest that the amount of released
chlorogenic acid due to subcritical water is almost the same as the organic solution extracts
suggesting that this compound had been adsorbed on the yeast cell wall released during these
experiments
6.3.5 HPLC analysis and results from DAD detector
Using diode array detector, it was possible to determine the UV absorbance of eluent at
different times and at different wavelengths (Fig 6.11). This provided a better picture of the
compositional change in the samples using its UV spectrum for different peaks helping to
identify and determine the structures. UV absorbance data were normalized to the maximum
value of absorbance to facilitate analysing the effect of temperature on the sample.
Comparing the spectrum of these samples suggest that at later elution times (which

Chapter 6- DESORPTION OF PHENOLICS FROM CIDER SPENT LEES
191
corresponds to more nonpolar components based on the used reversed-phase mode in the
chromatography), UV absorption increased at higher wavelengths (phenolic structures). The
increased phenolic content was due to either their formation synthetically, being desorbed
from the yeast cell wall or have been released due to the cleavage of bonds in highly
polymerized polyphenolics.
Figure 6. 10 .Chlorogenic acid desorption from yeast cells after hydrothermal treatment (a) and
organic solvent extraction (b).

Chapter 6- DESORPTION OF PHENOLICS FROM CIDER SPENT LEES
192
As Fig 6.11.a shows, the individual phenolic peaks which were discussed in section
6.3.3 can be observed at the same retention time mostly by their higher wavelength UV
absorbance (> 280 nm) compared to the other components in the spectrum. In addition, there
are other unidentified peaks, with absorbance above 300 nm, which represent other soluble
phenolic compounds. Most of the phenolic compounds start to elute and emerge after the
introduction of the organic mobile phase, as they tend to adsorb to the reversed phase
stationary phase in a highly aqueous mobile phase. Comparing the Fig 6.11.b with the crude
sample, two new compounds can be observed in the 150 °C sample with retention times of
29 and 31 minutes. The retention times of these new compounds and their significance
absorbance at wavelengths more than 300 nm suggest that they are phenolic compounds
formed or released under such conditions.
To confirm their phenolic structure, their UV spectrum were obtained using the DAD
detector and are shown in Fig 6.12. Considering these spectrums, there are two peaks at 280
nm and 360 nm which are indications of their flavonol-like structure that corroborates their
phenolic origin. As discussed in chapter 2, apple has been reported as a good source for
flavonols as well as other discussed phenolic compounds. These two peaks were not detected
in the samples at other temperatures. As these two compounds were not detected in extracts
prepared at lower temperatures, there is the possibility that they may have been released
from the yeast or being synthesized or derived from other condensed polyphenolics in
reactive subcritical water. They could have also been released by the breakdown of other
phenolic acids to their monomers. In the absence of a HPLC-MS system, no more
information could be obtained about their characteristics or what compounds they could be.
Comparing the release profile of these compounds with the one for chlorogenic acid, the new
compounds follow a different release profile to chlorogenic acid as their maximum
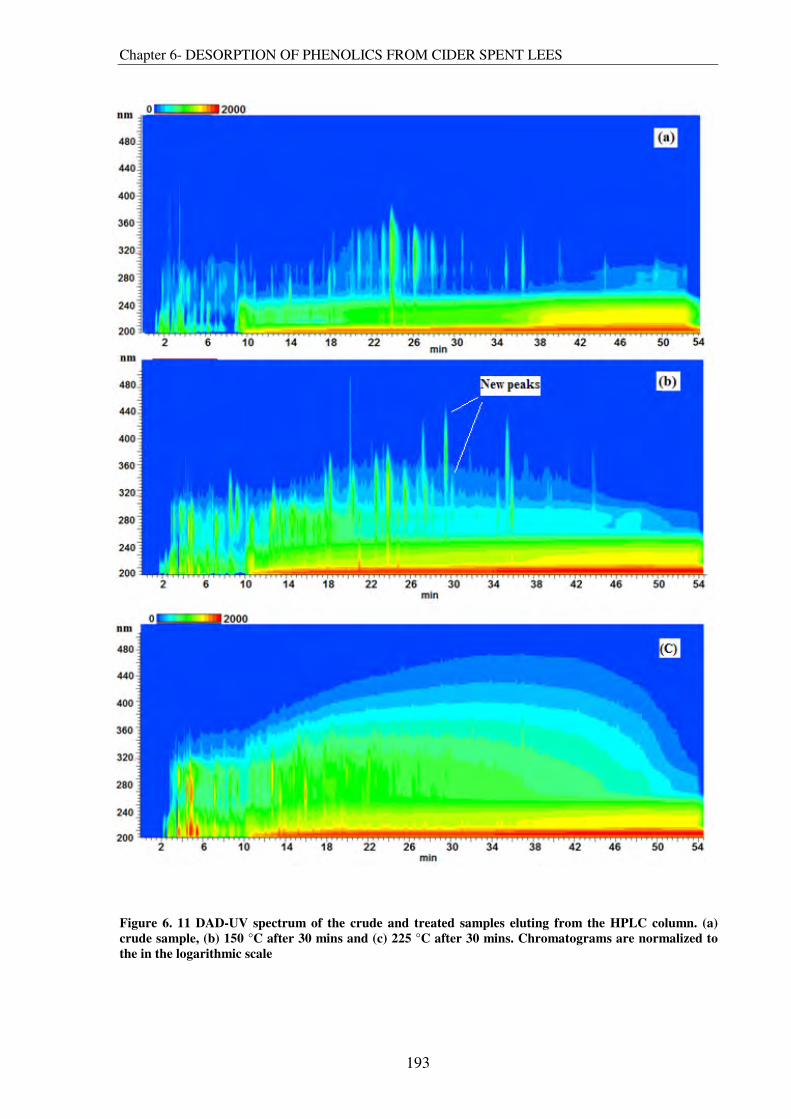
Chapter 6- DESORPTION OF PHENOLICS FROM CIDER SPENT LEES
193
Figure 6. 11 DAD-UV spectrum of the crude and treated samples eluting from the HPLC column. (a)
crude sample, (b) 150 °C after 30 mins and (c) 225 °C after 30 mins. Chromatograms are normalized to
the in the logarithmic scale
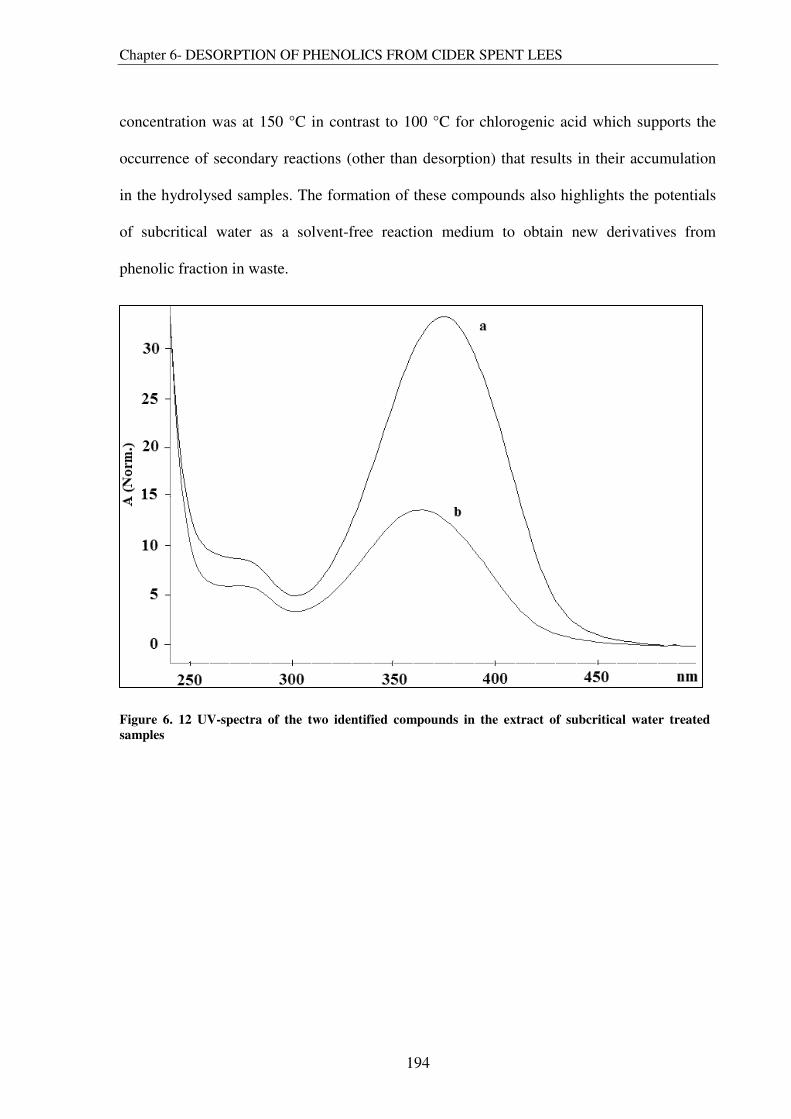
Chapter 6- DESORPTION OF PHENOLICS FROM CIDER SPENT LEES
194
concentration was at 150 °C in contrast to 100 °C for chlorogenic acid which supports the
occurrence of secondary reactions (other than desorption) that results in their accumulation
in the hydrolysed samples. The formation of these compounds also highlights the potentials
of subcritical water as a solvent-free reaction medium to obtain new derivatives from
phenolic fraction in waste.
Figure 6. 12 UV-spectra of the two identified compounds in the extract of subcritical water treated
samples

Chapter 6- DESORPTION OF PHENOLICS FROM CIDER SPENT LEES
195
6.4 Conclusion
A combination of HPLC analysis coupled with DAD detector (for individual
phenolics) and the Folin-Ciocalteau assay (for total phenolics) provided extensive data on the
chemical composition of the samples in terms of phenolic content and a profile of individual
phenolics. Using these assays, it was showed that the main cause for the increase of phenolic
concentration was the desorption from the yeast cells.
HPLC analysis was employed to identify the major phenolic compounds in the cider
spent yeast and how their concentration was changed during the hydrothermal reactions.
Chlorogenic acid was detected as the most concentrated phenolic in the crude biomass and
results suggested that 50% of its available content was already adsorbed on the yeast cell
wall. The release profile of individual phenolics suggest that at 100 °C, the maximum
concentration of chlorogenic acid can be obtained from the yeast. The same profile may be
present in higher temperatures but the reactor configuration and the heating up stage
prohibited accurate measurements of its release at earlier times. More structural information
was obtained using DAD detector based on its superiority or the identification and
characterisation of phenolic compounds which facilitate the determination of two new
compounds in the extracts.
The release of chlorogenic acid and other phenolics was studied at different ratios of
solids, different temperatures and residence time showing that 1) subcritical water is able to
release the phenolics from the yeast cells in a process that is not fully elucidated yet and 2)
their release is mainly the function of temperature while the release started during initial
heating up stage at higher temperatures or maximized at certain temperatures (225 °C).
Data from total phenolic assay showed that the concentration of released phenolic
compounds increased with temperature from 58 (mg/g of dry yeast) in crude extract to 280

Chapter 6- DESORPTION OF PHENOLICS FROM CIDER SPENT LEES
196
(mg/g of dry yeast) after 30 minutes in 200°C. Almost similar concentration was observed
when the cells were subjected to repetitive organic solvent extraction (250 mg/g of yeast).
This proved that subcritical water treatment could effectively be used for the release of
phenolics from yeast cells using a solvent free reaction. However, during the hydrothermal
treatment step, there might be secondary reactions which lead to degradation of highly
polymeric tannins to phenolic monomers which is expected to occur more significantly at
higher temperatures. These secondary reactions may lead to partly overestimated results in
the total phenolic content of the extracts. Furthermore, it can modify the structure of both the
suspended phenolics in the crude biomass and the ones which had been desorbed later.
Therefore, to study and determine the original composition of released phenolics (which can
take place in smaller scales experiments), organic solvent extraction leads to less
modification in their structure. In addition, subcritical water may also promote the formation
of complex polymerized molecules between different compounds (polysaccharides, proteins
and phenolics) leading to more condensed structures as it was suggested in section 3.3.3.
Yet, the role of phenolic compounds in these reactions and other chemical routes has not yet
been determined which offers an opportunity for further studies.
The release of phenolic compounds in the subcritical water treated resulted a mixture
of phenolics which show significant antioxidant properties (Section 3.3.9) as well as unique
UV spectrum were make them useful in certain products. More biological and toxicological
studies is needed to better understand the possibility of using these extracts in consumer
products (e.g. supplements and cosmetic products).
The results from this chapter, which introduces a solvent-free and simple process to
prepare an extract enriched with apple phenolic, must be seen as a supplementary product
stream to the other discussed compounds which reported in previous chapters. By identifying

Chapter 6- DESORPTION OF PHENOLICS FROM CIDER SPENT LEES
197
the main products of interest, it is possible to adjust process parameters (i.e. temperature and
residence time) in order to obtain fractions with a noticeable concentration of each class of
compounds which already have been discussed. As an example, temperatures up to 150 °C
are optimum for release of monomeric phenolics from yeast, while higher temperatures (200
°C) can result in higher content of phenolics in the samples. Further increase in the
temperature will result in the formation of sugar monomers and their dehydrated derivatives.

198
Chapter 7
7.1 Overall conclusions
i) A multidisciplinary approach was used to study the utility of subcritical water to convert
the cider spent yeast (lees) into a mixture of valuable compounds and address how the
biomass changes under such conditions. Two experimental setups, 5 ml (for kinetic study)
and 300 ml (for all other measurements) were prepared to carry out batch hydrolysis
reactions of cider spent yeast (lees) under subcritical water conditions. At the same time,
various analytical assays were developed and used to evaluate the chemical and physical
properties of the extracts. The results showed that various reactions took place in subcritical
water and cider lees samples including hydrolysis and bond cleavage (i.e. cell wall
solubilisation), dehydration (i.e. conversion of sugars to HMF), caramelisation (based on the
colour and odour of the extracts) and as a result of dry weight measurement, it was reported
that the condensation of heavier molecules have also occurred.
ii) Yeast cells were the major carbohydrate fraction in the studied feedstocks and no
significant change was observed in their overall structure at temperatures up to
CONCLUSION AND RECOMMENDATION FOR FURTHER RESEARCH

199
150 °C. The concentration profile for proteins, however, suggested that they have been
released from the cells under such conditions which is believed to have been accompanied
with other soluble intracellular compounds. Phenolic compounds, especially the identified
individual phenolics, showed their highest concentration at 100 °C while the total phenolic
content increased with temperature. At higher temperatures (up to 225 °C), cells started to
lose their oval shape as an indication of cell wall solubilisation which was further confirmed
by the accumulation of monosaccharides in the extracts. Protein concentration also dropped
at these conditions, which could be due to their decomposition to smaller peptides with sizes
below the detection limit of the assay. In addition to proteins, other heat stable intracellular
compounds will be released at these conditions including nucleotides, amino acids and other
minerals and nutrients. Despite all the attempts to identify vitamin B3 in subcritical water
treated extracts, this compound was not detected which later was shown that it has not been
available in its free form in the substrate and enzymatic reaction may be needed for its
transformation. At elevated temperatures (250 °C and 300 °C) the solid residues had turned
into char and the formation of gaseous products was more noticeable. The extracts had more
characteristics of crude oil in terms of colour and oily structure.
iii) Subcritical water was shown to completely hydrolyse the yeast cells after 30 minutes at
200 °C. As a result, β-glucan and mannoprotein in the cell wall were converted to glucose
and mannose (monosaccharides) respectively and their concentration was measured in both
liquid and solid phase at different times and temperatures. Based on these data,
monosaccharides’ mass balance was calculated which provided reliable and accurate data
about the kinetics of yeast cell wall solubilisation. A simple first order reaction was used to
model the glucan and mannoprotein hydrolysis and other consecutive steps, which were
fitted perfectly with experimental data. Since milder conditions are needed for glucan

200
conversion to sugars, this feedstock (or any other yeast biomass) can be used for the
production of intermediate bio-based chemicals (e.g. HMF) using subcritical water.
Subjecting the reaction medium to higher temperatures can lead the reaction to final
derivatives such as organic acids. Comparing the kinetics of glucan conversion in subcritical
water with cellulose conversion showed faster conversion in a less energy-intensive reaction
and the feasibility of the production of bio-based chemicals. It worth noting that the reported
yields were from a non-optimized reaction as no added catalyst was used. However, the
acidic pH of the substrate may catalyse the hydrolysis reaction to some extents. Comparing
the reaction rates constant for different compounds in the polysaccharide and mannoprotein
conversion can provide useful details about how to perform the reaction in order to increase
the selectivity of a specific fraction.
iv) Apple phenolics were identified in the original substrate and in the extracts suggesting
that they have been carried over by the yeast cells after being adsorbed during the
fermentation. Subcritical water was able to release these phenolics from yeast cells in levels
comparable to organic solvent extraction. At the same time newly formed phenolic
compounds were identified which may have been formed or released from more condensed
polymeric phenolics. The release of phenolic compounds resulted in the significant change
of the antioxidant activity of the extracts at 225 °C which showed their potentials as a source
of highly active natural phenolics. HPLC-DAD method was proved to be an effective way to
study the soluble phenolics and identifying the unknown structures using the UV spectrum.
v) In most studies, biomass conversion have been modelled with pure polysaccharides (such
as cellulose or starch) making the study of kinetics more convenient but introduces some
degrees of inaccuracy in the results. Our carbohydrate feedstock in particular (yeast cells)
consists of a mixture of different polysaccharides that may behave differently in their natural

201
form compared to their purified individual structure. In addition, there is the possibility of
synergistic effect of different compounds in the substrate (such as organic acids) which may
act as catalysts reducing the need of using additives. Using crude and un-purified biomass in
our study can also be useful towards filling the existing gap between model studies and
larger industrial exploitation of real biomass. However, studying crude mixtures usually
necessitates the use of sample pretreatment steps or more tedious procedures for method
development as there are numerous impurities in the extracts that may interfere in the
selected assays.
vi) Since the major goal of biomass processing with subcritical water is to employ a
sustainable route for the production of bio-based chemicals, extracts were analysed to
identify potential valuable fractions. Multiple product streams were identified in the extracts
due to the different reactions that occur in subcritical water. Comparing the yields of
different compounds at different temperatures, it may be possible to design a sequential
hydrolysis process where different products are produced and separated from the reaction
medium using selective separation techniques while the remaining reactants can proceed to
the next steps for other derivatives. Offering different products can provide higher revenues
for a single process and make the industrial applications of biomass conversion more
appealing. In particular, this process could be modified in order to be carried out in parallel
to the biofuel production (ethanol fermentation) and use the large amount of yeast waste
produced after the fermentation similar to the proposed research. This parallel approach can
further improve the economical viability of biorefinery platforms by reusing their main
waste.

202
7.2 RECOMMENDATION FOR FURTHER RESEARCH
The outcomes of this research which were discussed in the thesis are currently under
further investigation in few projects in the School of Chemical Engineering, University of
Birmingham. They include the process-ability and scale-up of the reaction, application of the
generated extracts for health and cosmetic products, furthering the HMF process to other
derivatives applications and the possibility of using supercritical carbon dioxide to extract
phenolics from the aqueous medium.
The idea of further reforming the generated chemical intermediate to produce other
chemical feedstocks was considered a promising area for further research. However, higher
yields of products are required for such applications as there should be enough
concentrations of material for the analysis of secondary derivatives. A solution could be the
use of more concentrated yeast slurries as the reaction substrate. Using higher concentration
of yeast or fabricating a setup for continuous hydrolysis of cider lees will enable to better
evaluate the economical feasibility of the process where higher amount of product will be
formed per volume of the reactor.
While the interaction of wine phenolics with the yeast cells and its effect on the final
product is previously discussed, not much data is available for cider. Detailed compositional
studies of the adsorbed phenolics, which are released in our extracts, may lead to better
understanding of the reaction and also the potentials of yeast cells for extracting specific
phenolics (such as procyanidins) during the fermentation of cider or other alcoholic
beverages. This improves the economic feasibility of this reaction and proves the advantages
of subcritical water hydrolysis of such wastes.
While much food chemistry has focused on the Maillard reaction and interaction of
sugars and proteins to give melanoidins, with proved antioxidant activity in food products,

203
not much research is available on the role of phenolic compounds in Maillard reaction.
Further investigation of biopolymers in the extracts using size-exclusion chromatography
and studying the separated fractions in terms of their possible beneficial effects can be
suggested as a new topic for further research. Parenthetically, these reactions can be of
special interest of cosmetic companies as phenolics offer strong UV adsorbing properties
while self-tanning creams promote the Maillard reaction in the skin of consumer.
Melanoidins have already been addressed for their role in flavour and colour of heated food
products.
Major breakthroughs were achieved in the project after the identification of individual
compounds via rigorous analysis using HPLC and Mass Spectroscopy. It is believed that
using a dedicated LC-MS machine can facilitate the product characterisation, studying the
involved reactions and carrying out the process optimisation steps. More novel analytical
techniques could be specially valuable for studies involving the phenolics, especially to
study the phenolics which have interacted with the yeast cells or other intracellular
compounds during the subcritical water hydrolysis.

204
References
Adschiri, T. et al., 1993. Noncatalytic Conversion of Cellulose in Supercritical and Subcritical Water. JOURNAL OF CHEMICAL ENGINEERING OF JAPAN, 26(6), pp.676-680.
Afonso, C.A.M. & Crespo, J.G., 2005. Green separation processes: fundamentals and
applications, Wiley-VCH.
Aida, T.M. et al., 2007. Dehydration of d-glucose in high temperature water at pressures up to 80 MPa. The Journal of Supercritical Fluids, 40(3), pp.381-388.
Akiya, N. & Savage, P.E., 2002. Roles of Water for Chemical Reactions in High-Temperature Water. Chemical Reviews, 102(8), pp.2725-2750.
Alonso-Salces, R. et al., 2001. Determination of Polyphenolic Profiles of Basque Cider Apple Varieties Using Accelerated Solvent Extraction. J.Agric.Food Chem, 49(8), pp.3761-3767.
Alonso-Salces, Rosa M. et al., 2004. Technological Classification of Basque Cider Apple Cultivars According to Their Polyphenolic Profiles by Pattern Recognition Analysis. Journal of Agricultural and Food Chemistry, 52(26), pp.8006-8016.
Antal, M.J., Mok, W.S. & Richards, G.N., 1990. Mechanism of formation of 5-(hydroxymethyl)-2-furaldehyde from D-fructose an sucrose. Carbohydrate Research, 199(1), pp.91-109.
Antal, Michael Jerry et al., 1991. Mechanism of formation of 2-furaldehyde from -xylose. Carbohydrate Research, 217, pp.71-85.
Appell, H. et al., 1971. Converting organic wastes to oil:A Replenishable Energy Source, Bureau of Mines Report of Investigation.
Armaroli, T. et al., 2000. Acid sites characterization of niobium phosphate catalysts and their activity in fructose dehydration to 5-hydroxymethyl-2-furaldehyde. Journal of
Molecular Catalysis A: Chemical, 151(1-2), pp.233-243.
Arup, U. et al., 1993. High-performance thin-layer chromatography (HPTLC), an improved technique for screening lichen substances. Lichenologist, 25, pp.61-71.
Asghari, F.S. & Yoshida, H., 2006. Dehydration of fructose to 5-hydroxymethylfurfural in sub-critical water over heterogeneous zirconium phosphate catalysts. Carbohydrate
Research, 341(14), pp.2379-2387.
Baek, J.Y., Lee, J.M. & Lee, S.C., 2008. Extraction of nutraceutical compounds from licorice roots with subcritical water. Separation and Purification Technology, 63(3), pp.661-664.

205
Baker, E. et al., 1989. Catalytic Destruction of Hazardous Organics in Aqueous Wastes: Continuous Reactor System Experiments. Hazardous Waste and Hazardous
Materials, 6(1), pp.87-94.
Basile, A., Jimenez-Carmona, M.M. & Clifford, A.A., 1998. Extraction of Rosemary by Superheated Water. Journal of Agricultural and Food Chemistry, 46(12), pp.5205-5209.
Bezuidenhout, L. & Brett, M., 2008. Ultrathin layer chromatography on nanostructured thin films. Journal of Chromatography A, 1183, pp.179-185.
Bhattacharjee P & Singhal R. S, Extraction of squalene from yeast by supercritical carbon dioxide. Available at: http://www.ingentaconnect.com/content/klu/wibi/2003/00000019/00000006/05127077 [Accessed November 4, 2010].
Bicker, M., Hirth, J. & Vogel, H., 2003. Dehydration of fructose to 5-hydroxymethylfurfural in sub- and supercritical acetone. Green Chemistry, 5, pp.280-284.
Bicker, M. et al., 2005. Dehydration of d-fructose to hydroxymethylfurfural in sub- and supercritical fluids. The Journal of Supercritical Fluids, 36(2), pp.118-126.
Binder, J.B. et al., 2010. Mechanistic insights on the conversion of sugars into 5-hydroxymethylfurfural. Energy & Environmental Science, 3(6), pp.765-771.
Bitsch, R. et al., 2000. Bioavailability of antioxidative compounds from Brettacher apple juice in humans. Innovative Food Science & Emerging Technologies, 1(4), pp.245-249.
Bobleter, O., 1994. Hydrothermal degradation of polymers derived from plants. Progress in
Polymer Science, 19(5), pp.797-841.
Bonilla, F. et al., 1999. Extraction of phenolic compounds from red grape marc for use as food lipid antioxidants. Food Chemistry, 66(2), pp.209-215.
Le Bourvellec, C., Guyot, S. & Renard, C.M.G.C., 2004. Non-covalent interaction between procyanidins and apple cell wall material. Part I: Effect of some environmental parameters. Biochimica et Biophysica Acta (BBA) - General Subjects, 1672(3), pp.192-202.
Boyer, J. & Liu, R., 2004. Apple phytochemicals and their health benefits. Nutrition Journal, 3(1), p.5.
Bozell, J.J. & Petersen, G.R., 2010. Technology development for the production of biobased products from biorefinery carbohydrates-the US Department of Energy's "Top 10" revisited. Green Chemistry, 12(4), pp.539-554.
Bradford, M.M., 1976. A rapid and sensitive method for the quantitation of microgram quantities of protein utilizing the principle of protein-dye binding. Analytical
Biochemistry, 72, pp.248-254.

206
Brunner, G., 2009. Near critical and supercritical water. Part I. Hydrolytic and hydrothermal processes. The Journal of Supercritical Fluids, 47(3), pp.373-381.
Cacace, J., 2003. Mass transfer process during extraction of phenolic compounds from milled berries. Journal of Food Engineering, 59(4), pp.379-389.
Carlini, C. et al., 2004. Heterogeneous catalysts based on vanadyl phosphate for fructose dehydration to 5-hydroxymethyl-2-furaldehyde. Applied Catalysis A: General, 275(1-2), pp.111-118.
Chae, H.J., Joo, H. & In, M., 2001. Utilization of brewer's yeast cells for the production of food-grade yeast extract. Part 1: effects of different enzymatic treatments on solid and protein recovery and flavor characteristics. Bioresource Technology, 76(3), pp.253-258.
Chen, S., 2008. Industrial Biosystems Engineering and Biorefinery Systems. Chinese
Journal of Biotechnology, 24(6), pp.940-945.
Cherubini, F., 2010. The biorefinery concept: Using biomass instead of oil for producing energy and chemicals. Energy Conversion and Management, 51(7), pp.1412-1421.
Chheda, J.N., Roman-Leshkov, Y. & Dumesic, J.A., 2007. Production of 5-hydroxymethylfurfural and furfural by dehydration of biomass-derived mono- and poly-saccharides. Green Chemistry, 9(4), pp.342-350.
Cimpoiu, C. & Hosu, A., 2007. Thin Layer Chromatography for the Analysis of Vitamins and Their Derivatives. Journal of Liquid Chromatography & Related Technologies, 30(5), p.701.
Clark, J.H. & Deswarte, F.E.I., 2008. Introduction to chemicals from biomass, Wiley.
Clifford, T., 1998. Fundamentals of supercritical fluids, Oxford University Press, New York.
Coitino, E.L., Tomasi, J. & Ventura, O.N., 1994. Importance of water in aldol condensation reactions of acetaldehyde. Journal of the Chemical Society, Faraday Transactions, 90(12), p.1745.
Conde, E. et al., 2009. Antioxidant activity of the phenolic compounds released by hydrothermal treatments of olive tree pruning. Food Chemistry, 114(3), pp.806-812.
Corma, A., Iborra, S. & Velty, A., 2007. Chemical Routes for the Transformation of Biomass into Chemicals. Chemical Reviews, 107(6), pp.2411-2502.
Cruz, J.M., Dominguez, H. & Parajo, J.C., 2004. Assessment of the Production of Antioxidants from Winemaking Waste Solids. Journal of Agricultural and Food
Chemistry, 52(18), pp.5612-5620.
Cui, L., Wu, G. & Jeong, T., 2010. Adsorption performance of nickel and cadmium ions onto brewer's yeast. The Canadian Journal of Chemical Engineering, 88(1), pp.109-115.

207
Dallies, N., François, J. & Paquet, V., 1998. A new method for quantitative determination of polysaccharides in the yeast cell wall. Application to the cell wall defective mutants of Saccharomyces cerevisiae. Yeast, 14(14), pp.1297-1306.
Demirbas, A., 2000. Mechanisms of liquefaction and pyrolysis reactions of biomass. Energy
Conversion and Management, 41(6), pp.633-646.
Diñeiro García, Y., Valles, B.S. & Picinelli Lobo, A., 2009. Phenolic and antioxidant composition of by-products from the cider industry: Apple pomace. Food Chemistry, 117(4), pp.731-738.
Dunning, J.W. & Lathrop, E.C., 1945. Saccharification of Agricultural Residues. Industrial
& Engineering Chemistry, 37(1), pp.24-29.
Ederer, H.J. et al., 1999. Modelling of the pyrolysis of tert-butylbenzene in supercritical water. The Journal of Supercritical Fluids, 15(3), pp.191-204.
Eggersdorfer, M. et al., 2005. Vitamins in Ullmann's Encyclopeida of Industrial Chemistry
(online), Weinham: Wiley-VCH Verlag GmbH & Co. KGaA.
Elliott, D.C., Hart, T.R. & Neuenschwander, G.G., 2006. Chemical Processing in High-Pressure Aqueous Environments. 8. Improved Catalysts for Hydrothermal Gasification. Industrial & Engineering Chemistry Research, 45(11), pp.3776-3781.
Escarpa, A. & González, M., 2001. Approach to the content of total extractable phenolic compounds from different food samples by comparison of chromatographic and spectrophotometric methods. Analytica Chimica Acta, 427(1), pp.119-127.
Escarpa, A. & González, M., 1999. Fast separation of (poly)phenolic compounds from apples and pears by high-performance liquid chromatography with diode-array detection. Journal of Chromatography A, 830(2), pp.301-309.
Feng, W., van der Kooi, H.J. & de Swaan Arons, J., 2004. Biomass conversions in subcritical and supercritical water: driving force, phase equilibria, and thermodynamic analysis. Chemical Engineering and Processing, 43(12), pp.1459-1467.
Ferreira, I. et al., 2010. Brewer's Saccharomyces yeast biomass: characteristics and potential applications. Trends in Food Science & Technology, 21(2), pp.77-84.
Franden, M.A., Pienkos, P.T. & Zhang, M., 2009. Development of a high-throughput method to evaluate the impact of inhibitory compounds from lignocellulosic hydrolysates on the growth of Zymomonas mobilis. Journal of Biotechnology, 144(4), pp.259-267.
G.L. Huang, 2010. Extraction of proteins from yeast cell wall. African Journal of
Biotechnology, 9(21), pp.3207-3209.
Guha, B., 1931. Investigations on the preparation and behaviour of vitamin B1 concentrates from yeast. Biochem J,, 25(3), pp.931-944.

208
Gullon, B. et al., 2007. Evaluation of apple pomace alternative applications as a raw material for in food industries. Food Technology and Biotechnology, 45(4), pp.426-433.
Halsz, A. & Lsztity, A., 1991. Use of Yeast Biomass in Food Production, CRC Press.
Harbertson, J.F., Kennedy, J.A. & Adams, D.O., 2002. Tannin in Skins and Seeds of Cabernet Sauvignon, Syrah, and Pinot noir Berries during Ripening. Am. J. Enol.
Vitic., 53(1), pp.54-59.
Hashimoto, S., 2004. Remediation of soil contaminated with dioxins by subcritical water extraction. Chemosphere, 54(1), pp.89-96.
He, W. et al., 2008. Application of hydrothermal reaction in resource recovery of organic wastes. Resources, Conservation and Recycling, 52(5), pp.691-699.
Hippler, H., 1997. Elementary reactions in supercritical fluids. In Proceedings of the Fourth
Italian Conference on Supercritical Fluids and their Applications. p. 279.
Hong, N. et al., 2001. Microwave-assisted extraction of phenolic compounds from grape seed. Natural Product Letters, 15(3), pp.197-204.
Ibañez, E. et al., 2003. Subcritical Water Extraction of Antioxidant Compounds from Rosemary Plants. Journal of Agricultural and Food Chemistry, 51(2), pp.375-382.
Illanes, A. & Gorgollón, Y., 1986. Kinetics of extraction of invertase from autolysed bakers' yeast cells. Enzyme and Microbial Technology, 8(2), pp.81-84.
In, M., Kim, D. & Chae, H., 2005. Downstream process for the production of yeast extract using brewer's yeast cells. Biotechnology and Bioprocess Engineering, 10(1), pp.85-90.
Ishida, H. & Seri, K., 1996. Catalytic activity of lanthanoide(III) ions for dehydration of -glucose to 5-(hydroxymethyl) furfural. Journal of Molecular Catalysis A: Chemical, 112(2), pp.L163-L165.
Japón-Luján, R. & Luque de Castro, M., 2006. Superheated liquid extraction of oleuropein and related biophenols from olive leaves. Journal of Chromatography A, 1136(2), pp.185-191.
Jiang, M. et al., 2009. Succinic Acid Production by Actinobacillus succinogenes Using Spent Brewer's Yeast Hydrolysate as a Nitrogen Source. Applied Biochemistry and
Biotechnology, 160(1), pp.244-254.
Jing, Q. & Lu, X., 2008. Kinetics of Non-catalyzed Decomposition of Glucose in High-temperature Liquid Water. Chinese Journal of Chemical Engineering, 16(6), pp.890-894.
Kabyemela, B. et al., 1999. Glucose and Fructose Decomposition in Subcritical and Supercritical Water: Detailed Reaction Pathway, Mechanisms, and Kinetics. Industrial & Engineering Chemistry Research, 38(8), pp.2888-2895.

209
Kamm, B., Gruber, P.R. & Kamm, M., 2006. Biorefineries - Industrial Processes and
Products: Status Quo and Future Directions (2 Volume Set), Wiley-VCH.
Kazi, F.K. et al., 2011. Techno-economic analysis of dimethylfuran (DMF) and hydroxymethylfurfural (HMF) production from pure fructose in catalytic processes. Chemical Engineering Journal, 169(1-3), pp.329-338.
Kim, K.S. & Yun, H.S., 2006. Production of soluble [beta]-glucan from the cell wall of Saccharomyces cerevisiae. Enzyme and Microbial Technology, 39(3), pp.496-500.
Kim, K.S. & Yun, H.S., 2006. Production of soluble [beta]-glucan from the cell wall of Saccharomyces cerevisiae. Enzyme and Microbial Technology, 39(3), pp.496-500.
King, J.W., 2008. Critical fluid technology for the processing of lipid-related natural products. Comptes Rendus Chimie, 7(6-7), pp.647-659.
Kirk-Othmer ed., 2000. Kirk-Othmer Encyclopedia of Chemical Technology, Hoboken, NJ, USA: John Wiley & Sons, Inc. Available at: http://onlinelibrary.wiley.com/book/10.1002/0471238961.
Kivilompolo, M. & Hyotylainen, T., 2009. On-line coupled dynamic sonication-assisted extraction–liquid chromatography for the determination of phenolic acids in Lamiaceae herbs. Journal of Chromatography A, 1216(6), pp.892-896.
Klis, F. M., 1994. Review: cell wall assembly in yeast. Yeast (Chichester, England), 10(7), pp.851-869.
Knekt, P. et al., 2002. Flavonoid intake and risk of chronic diseases. The American Journal
of Clinical Nutrition, 76(3), pp.560-568.
Knez ̌ević, D., 2009. Hydrothermal Conversion of Biomass. PhD thesis. University of Twente.
Knez ̌ević, D., van Swaaij, W.P.M. & Kersten, S.R.A., 2009. Hydrothermal Conversion of Biomass: I, Glucose Conversion in Hot Compressed Water. Industrial & Engineering
Chemistry Research, 48(10), pp.4731-4743.
Kollár, R. et al., 1997. Architecture of the Yeast Cell Wall. Journal of Biological Chemistry, 272(28), pp.17762-17775.
Kruse, A. & Dinjus, E., 2007a. Hot compressed water as reaction medium and reactant: 2. Degradation reactions. The Journal of Supercritical Fluids, 41(3), pp.361-379.
Kruse, A. & Dinjus, E., 2007b. Hot compressed water as reaction medium and reactant: Properties and synthesis reactions. The Journal of Supercritical Fluids, 39(3), pp.362-380.
Kulkarni, A., Suzuki, S. & Etoh, H., 2007. Antioxidant compounds from Eucalyptus grandis biomass by subcritical liquid water extraction. Journal of Wood Science, 54(2), pp.153-157.

210
Lamoolphak, W., Goto, M. & Sasaki, M., 2007. Hydrothermal decomposition of yeast cells for production of proteins and amino acids. Journal of Hazardous Materials, B137, pp.1643-1648.
Lazarus, S.A. et al., 1999. High-Performance Liquid Chromatography/Mass Spectrometry Analysis of Proanthocyanidins in Foods and Beverages. Journal of Agricultural and
Food Chemistry, 47(9), pp.3693-3701.
Lee, K.W. et al., 2003. Major Phenolics in Apple and Their Contribution to the Total Antioxidant Capacity. Journal of Agricultural and Food Chemistry, 51(22), pp.6516-6520.
Lee, S.K. et al., 1998. Evaluation of the antioxidant potential of natural products. Combinatorial Chemistry & High Throughput Screening, 1(1), pp.35-46.
Lewkowski, J., 2003. Synthesis, Chemistry and Applications of 5-Hydroxymethyl-furfural and Its Derivatives. ChemInform, 34(2).
Li, C., Zhang, Z. & Zhao, Z.K., 2009. Direct conversion of glucose and cellulose to 5-hydroxymethylfurfural in ionic liquid under microwave irradiation. Tetrahedron
Letters, 50(38), pp.5403-5405.
Liu, Q., Cai, W. & Shao, X., 2008. Determination of seven polyphenols in water by high performance liquid chromatography combined with preconcentration. Talanta, 77(2), pp.679-683.
Liu, X.Y., Wang, Q., et al., 2008. A new isolation method of [beta]-d-glucans from spent yeast Saccharomyces cerevisiae. Food Hydrocolloids, 22(2), pp.239-247.
Loev, B. & Goodman, M.M., 1967. Dry-Column Chromatogaphy- A preparative chromatographic technique with resolution of thin-layer chromatography. Chemistry
and Industry, (48), p.2026.
Lu, Q., 2004. Adsorption of phenolics on activated carbon––impact of pore size and molecular oxygen. Chemosphere, 55(5), pp.671-679.
Luijkx, G.C.A., van Rantwijk, F. & van Bekkum, H., 1993. Hydrothermal formation of 1,2,4-benzenetriol from 5-hydroxymethyl-2-furaldehyde and -fructose. Carbohydrate
Research, 242, pp.131-139.
Lyko, H., Deerberg, G. & Weidner, E., 2009. Coupled production in biorefineries--combined use of biomass as a source of energy, fuels and materials. Journal of Biotechnology, 142(1), pp.78-86.
Malin, A.S. et al., 2003. Intake of fruits, vegetables and selected micronutrients in relation to the risk of breast cancer. International Journal of Cancer. Journal International Du
Cancer, 105(3), pp.413-418.

211
Manach, C. et al., 2005. Bioavailability and bioefficacy of polyphenols in humans. I. Review of 97 bioavailability studies. American Journal of Clinical Nutrition, 81(1), p.230S-242.
Mane, C. et al., 2007. Assessment of the Molecular Weight Distribution of Tannin Fractions through MALDI-TOF MS Analysis of Protein-Tannin Complexes. Analytical
Chemistry, 79(6), pp.2239-2248.
Marshall, A.-L. & Alaimo, P.J., 2010. Useful Products from Complex Starting Materials: Common Chemicals from Biomass Feedstocks. Chemistry - A European Journal, 16(17), pp.4970-4980.
Matsumura, Y., Yanachi, S. & Yoshida, T., 2006. Glucose Decomposition Kinetics in Water at 25 MPa in the Temperature Range of 448−673 K. Industrial & Engineering
Chemistry Research, 45(6), pp.1875-1879.
Mattila, P. & Kumpulainen, J., 2002. Determination of Free and Total Phenolic Acids in Plant-Derived Foods by HPLC with Diode-Array Detection. Journal of Agricultural
and Food Chemistry, 50(13), pp.3660-3667.
Mazauric, J.-P. & Salmon, J.-M., 2006. Interactions between yeast lees and wine polyphenols during simulation of wine aging. II. Analysis of desorbed polyphenol compounds from yeast lees. Journal of Agricultural and Food Chemistry, 54(11), pp.3876-3881.
McNeff, C.V. et al., 2010. Continuous production of 5-hydroxymethylfurfural from simple and complex carbohydrates. Applied Catalysis A: General, 384(1-2), pp.65-69.
Medina, K. et al., 2005. Yeast Interactions with Anthocyanins during Red Wine Fermentation. Am. J. Enol. Vitic., 56(2), pp.104-109.
Jason S. Midgett, 2008. Assessing a Hydrothermal Liquefaction Process Using Biomass Feedstocks. Available at: http://etd.lsu.edu/docs/available/etd-01162008-150910/ [Accessed October 23, 2010].
Miniati, E., 2007. Assessment of phenolic compounds in biological samples. Ann Ist Super
Sanita, 43(4), pp.362-368.
Minowa, T. & Ogi, T., 1998. Hydrogen production from cellulose using a reduced nickel catalyst. Catalysis Today, 45(1-4), pp.411-416.
Mochidzuki, K., Sakoda, A. & Suzuki, M., 2000. Measurement of the hydrothermal reaction rate of cellulose using novel liquid-phase thermogravimetry. Thermochimica Acta, 348(1-2), pp.69-76.
Mok & Antal, 1992. Uncatalyzed solvolysis of whole biomass hemicellulose by hot compressed liquid water. Industrial & Engineering Chemistry Research, 31(4), pp.1157-1161.

212
Molton, P.M. et al., 1978. Mechanism of conversion of cellulosic wastes to liquid fuels in alkaline solution. In Symposium on energy from biomass and wastes, Washington, DC, USA.
Montedoro, G. et al., 1992. Simple and hydrolyzable phenolic compounds in virgin olive oil. 2. Initial characterization of the hydrolyzable fraction. Journal of Agricultural and
Food Chemistry, 40(9), pp.1577-1580.
Morata, A. et al., 2003. Adsorption of Anthocyanins by Yeast Cell Walls during the Fermentation of Red Wines. Journal of Agricultural and Food Chemistry, 51(14), pp.4084-4088.
Morata, A. et al., 2005. Cell wall anthocyanin adsorption by different Saccharomyces strains during the fermentation of Vitis vinifera L. cv Graciano grapes. European Food
Research and Technology, 220(3), pp.341-346.
Moreau, C, Finiels, A. & Vanoye, L., 2006. Dehydration of fructose and sucrose into 5-hydroxymethylfurfural in the presence of 1-H-3-methyl imidazolium chloride acting both as solvent and catalyst. Journal of Molecular Catalysis A: Chemical, 253(1-2), pp.165-169.
Moreau, Claude et al., 1994. Preparation of 5-hydroxymethylfurfural from fructose and precursors over H-form zeolites. Industrial Crops and Products, 3(1-2), pp.85-90.
Moreau, Claude et al., 1996. Dehydration of fructose to 5-hydroxymethylfurfural over H-mordenites. Applied Catalysis A: General, 145(1-2), pp.211-224.
Moreno-Arribas, M.V. & Polo, M.C. eds., 2009. Wine Chemistry and Biochemistry, New York, NY: Springer New York. Available at: http://www.springerlink.com/content/w704520506336128/export-citation/ [Accessed November 14, 2010].
Mosier, N., 2005. Features of promising technologies for pretreatment of lignocellulosic biomass. Bioresource Technology, 96(6), pp.673-686.
Musau, R.M. & Munavu, R.M., 1987. The preparation of 5-hydroxymethyl-2-furaldehyde (HMF) from d-fructose in the presence of DMSO. Biomass, 13(1), pp.67-74.
Nagamori, M. & Funazukuri, T., 2004. Glucose production by hydrolysis of starch under hydrothermal conditions. Journal of Chemical Technology & Biotechnology, 79(3), pp.229-233.
Neilands, J.B. et al., 1950. Concentration of bound pantothenic acid. The journal of
Biological Chemistry, 185, pp.335-346.
Nogueira, A. et al., 2008. Effect of alcoholic fermentation in the content of phenolic compounds in cider processing. Brazilian Archives of Biology and Technology, 51(5).

213
Pedersen, M., Viksø-Nielsen, A. & Meyer, A.S., 2010. Monosaccharide yields and lignin removal from wheat straw in response to catalyst type and pH during mild thermal pretreatment. Process Biochemistry, 45(7), pp.1181-1186.
Peterson, A., 2009. Biomass Reforming Processes in Hydrothermal Media. PhD thesis. Massachusetts Institute of Technology.
Ponder, E.L., Fried, B. & Sherma, J., 2004. Thin-layer chromatographic analysis of hydrophilic vitamins in standards and from Helisoma trivolvis snails. ACTA
CHROMATOGRAPHICA, 14, pp.70-81.
Pourali, O., Asghari, F.S. & Yoshida, H., 2010. Production of phenolic compounds from rice bran biomass under subcritical water conditions. Chemical Engineering Journal, 160(1), pp.259-266.
Proestos, C., Kapsokefalou, M. & Komaitis, M., 2008. Analysis of Naturally occuring phenolics compounds in aromatic plants by RP-HPLC and GC-MS after silylation. Journal of Food Quality, 31(3), pp.402-414.
Pueyo, E. et al., 2000. Release of Lipids during Yeast Autolysis in a Model Wine System. Journal of Agricultural and Food Chemistry, 48(1), pp.116-122.
Quail, M.A. & Kelly, S.L., 1996. The extraction and analysis of sterols from yeast. Methods
in Molecular Biology (Clifton, N.J.), 53, pp.123-131.
Rajamanickam, S. & Agarwal, R., 2008. Natural products and colon cancer: current status and future prospects. Drug Development Research, 69(7), pp.460-471.
Raman, G. & Gaikar, V.G., 2002. Microwave-Assisted Extraction of Piperine from Piper nigrum. Industrial & Engineering Chemistry Research, 41(10), pp.2521-2528.
Rangsriwong, P. et al., 2009. Subcritical water extraction of polyphenolic compounds from Terminalia chebula Retz. fruits. Separation and Purification Technology, 66(1), pp.51-56.
Renard, Catherine M. G. C. et al., 2001. Interactions between apple cell walls and native apple polyphenols: quantification and some consequences. International Journal of
Biological Macromolecules, 29(2), pp.115-125.
Rezk, B.M. et al., 2002. The antioxidant activity of phloretin: the disclosure of a new antioxidant pharmacophore in flavonoids. Biochemical and Biophysical Research
Communications, 295(1), pp.9-13.
Rice-Evans, C., Miller, N. & Paganga, G., 1997. Antioxidant properties of phenolic compounds. Trends in Plant Science, 2(4), pp.152-159.
Rizzo, M. et al., 2006. HPLC determination of phenolics adsorbed on yeasts. Journal of
Pharmaceutical and Biomedical Analysis, 42(1), pp.46-55.

214
Rogalinski, T., Ingram, T. & Brunner, G, 2008. Hydrolysis of lignocellulosic biomass in water under elevated temperatures and pressures. The Journal of Supercritical Fluids, 47(1), pp.54-63.
Rogalinski, T., Liu, K., et al., 2008. Hydrolysis kinetics of biopolymers in subcritical water. The Journal of Supercritical Fluids, 46(3), pp.335-341.
Roldán-Gutiérrez, J.M., Ruiz-Jiménez, J. & Luque de Castro, M.D., 2008. Ultrasound-assisted dynamic extraction of valuable compounds from aromatic plants and flowers as compared with steam distillation and superheated liquid extraction. Talanta, 75(5), pp.1369-1375.
Roman-Leshkov, Y. et al., 2007. Production of dimethylfuran for liquid fuels from biomass-derived carbohydrates. Nature, 447(7147), pp.982-985.
Rubin, S.H., Scheiner, J. & Hirschberg, E., 1947. The availability of vitamin B6 in yeast and liver for growth of saccharomyces carlsbergenesis. The Journal of Biological
Chemistry, 167, pp.599-611.
Saksinchai, S., Suphantharika, M. & Verduyn, C., 2001. Application of a simple yeast extract from spent brewer’s yeast for growth and sporulation of Bacillus thuringiensis subsp. kurstaki: a Physiological Study. World Journal of Microbiology and
Biotechnology, 17(3), pp.307-316.
Salak Asghari, F. & Yoshida, H., 2006. Acid-Catalyzed Production of 5-Hydroxymethyl Furfural from d-Fructose in Subcritical Water. Industrial & Engineering Chemistry
Research, 45(7), pp.2163-2173.
Salmon, J.M., 2006. Interactions between yeast, oxygen and polyphenols during alcoholic fermentations: Practical implications. LWT - Food Science and Technology, 39(9), pp.959-965.
Salvador, F. & Merchán, M.D., 1996. Study of the desorption of phenol and phenolic compounds from activated carbon by liquid-phase temperature-programmed desorption. Carbon, 34(12), pp.1543-1551.
Sanchez, L., 2001. TCA protein precipitation protocol. Available at: www.its.caltech.edu/~bjorker/Protocols/TCA_ppt_protocol.pdf.
Sandula, J. et al., 1999. Microbial (1-->3)-[beta]--glucans, their preparation, physico-chemical characterization and immunomodulatory activity. Carbohydrate Polymers, 38(3), pp.247-253.
Sasaki, M. et al., 2000. Dissolution and Hydrolysis of Cellulose in Subcritical and Supercritical Water. Industrial & Engineering Chemistry Research, 39(8), pp.2883-2890.
Sasaki, M., Kabyemela, B. & Malaluan, R., 1998. Cellulose hydrolysis in subcritical and supercritical water. Journal of Supercritical Fluids, 13, pp.261-268.

215
Schieber, A. et al., 2003. A new process for the combined recovery of pectin and phenolic compounds from apple pomace. Innovative Food Science & Emerging Technologies, 4(1), pp.99-107.
Schieber, A., Keller, P. & Carle, R., 2001. Determination of phenolic acids and flavonoids of apple and pear by high-performance liquid chromatography. Journal of
Chromatography A, 910(2), pp.265-273.
Schwald, W. & Bobleter, O., 1989. Hydrothermolysis of Cellulose Under Static and Dynamic Conditions at High Temperatures. Journal of Carbohydrate Chemistry, 8(4), p.565.
Sereewatthanawut, I. et al., 2008. Extraction of protein and amino acids from deoiled rice bran by subcritical water hydrolysis. Bioresource Technology, 99(3), pp.555-561.
Seri, K.-ichi, Inoue, Y. & Ishida, H., 2000. Highly Efficient Catalytic Activity of Lanthanide(III) Ions for Conversion of Saccharides to 5-Hydroxymethyl-2-furfural in Organic Solvents. Chemistry Letters, 29(1), p.22.
Sherma, J. & Fried, B., 2005. Thin Layer Chromatographic Analysis of Biological Samples. A Review. Journal of Liquid Chromatography & Related Technologies, 28(15), p.2297.
Shibata, K. & Taguchi, H., 2000. Nicotinic Acid and Nicotinamide. In W. Lambert, A. De Leenheer, & J. Van Bocxlaer, eds. Modern Chromatographic Analysis Of Vitamins. CRC Press.
Singleton, V.L. & Rossi, J.A., 1965. Colorimetry of Total Phenolics with Phosphomolybdic-Phosphotungstic Acid Reagents. Am. J. Enol. Vitic., 16(3), pp.144-158.
Sombutyanuchit, P., Suphantharika, M. & Verduyn, C., 2001. Preparation of 5-GMP-rich yeast extract from spent brewer’s yeast. World Journal of Microbiology and
Biotechnology, 17(2), pp.163-168.
Sommer, R., 1996. Yeast Extracts: Production, Properties and Components. In 9th International Symposium on Yeasts. Sydney.
Stephen, A.M., 1995. Food polysaccharides and their applications, Marcel Dekker.
Subramaniam, B. & McHugh, M.A., 1986. Reactions in supercritical fluids - a review. Industrial & Engineering Chemistry Process Design and Development, 25(1), pp.1-12.
Sun, J. et al., 2002. Antioxidant and Antiproliferative Activities of Common Fruits. Journal
of Agricultural and Food Chemistry, 50(25), pp.7449-7454.
Suárez, B. et al., 2005. Liquid chromatographic method for quantifying polyphenols in ciders by direct injection. Journal of Chromatography A, 1066(1-2), pp.105-110.

216
Svobodová, A., Psotová, J. & Walterová, D., 2003. Natural phenolics in the prevention of UV-induced skin damage. A review. Biomedical Papers of the Medical Faculty of the
University Palacký, Olomouc, Czechoslovakia, 147(2), pp.137-145.
Swami Handa, S. et al., 2008. Extraction Technologies for Medicinal and Aromatic Plants- International Centre For Science and High Technology (UNIDO).
Szmant, H.H. & Chundury, D.D., 2007. The preparation of 5-hydroxymethylfurfuraldehyde from high fructose corn syrup and other carbohydrates. Journal of Chemical
Technology and Biotechnology, 31(1), pp.135-145.
Tanguler, H. & Erten, H., 2008. Utilisation of spent brewer’s yeast for yeast extract production by autolysis: The effect of temperature. Food and Bioproducts
Processing, 86(4), pp.317-321.
Teply, L.J., Strong, F.M. & Elvehjem, C.A., 1941. The distribution of nicotinic acid in foods. The Journal of Nutrition, p.14.
Thanardkit, P. et al., 2002. Glucan from spent brewer’s yeast: preparation, analysis and use as a potential immunostimulant in shrimp feed. World Journal of Microbiology and
Biotechnology, 18(6), pp.527-539.
Tonnies, I., 2008. Subcritical water hydrolysis of spent yeast for the recovery of high value
compounds. UK: Hamburg University of Technology, University of Birmingham.
Torget, R.W., Kim, J.S. & Lee, Y.Y., 2000. Fundamental Aspects of Dilute Acid Hydrolysis/Fractionation Kinetics of Hardwood Carbohydrates. 1. Cellulose Hydrolysis. Industrial & Engineering Chemistry Research, 39(8), pp.2817-2825.
Tsai, W.T., Lee, M.K. & Chang, Y.M., 2006. Fast pyrolysis of rice straw, sugarcane bagasse and coconut shell in an induction-heating reactor. Journal of Analytical and Applied
Pyrolysis, 76(1-2), pp.230-237.
Tsang, S., Lee, C.H. & Rha, K., 1979. Disintegration of cell wall and extraction of protein from Candida Lipolytica. Journal of Food Science, 44(1), pp.97-99.
Tseng, M.M.-C. & Phillips, C.R., 1982. The kinetics of yeast growth and nicotinic acid production. Biotechnology and Bioengineering, 24(6), pp.1319-1325.
Tyrlik, S.K. et al., 1999. Selective dehydration of glucose to hydroxymethylfurfural and a one-pot synthesis of a 4-acetylbutyrolactone from glucose and trioxane in solutions of aluminium salts. Carbohydrate Research, 315(3-4), pp.268-272.
Ullmann, F., 2007. Ullmann’s Encyclopedia of Industrial Chemistry, John Wiley & Sons, Inc.
Urquiaga, I. & Leighton, F., 2000. Plant Polyphenol Antioxidants and Oxidative Stress. Biological Research, 33(2).

217
Vatai, T., Skerget, M. & Knez, Z., 2009. Extraction of phenolic compounds from elder berry and different grape marc varieties using organic solvents and/or supercritical carbon dioxide. Journal of Food Engineering, 90(2), pp.246-254.
Vendruscolo, F. et al., 2008. Apple pomace: a versatile substrate for biotechnological applications. Critical Reviews in Biotechnology, 28(1), pp.1-12.
Watanabe, M., Inomata, H. & Arai, K., 2002. Catalytic hydrogen generation from biomass (glucose and cellulose) with ZrO2 in supercritical water. Biomass and Bioenergy, 22(5), pp.405-410.
Waterhouse, A., 2005. Folin-Ciocalteau Micro Method for Total Phenol in Wine. University
of California, Davis. Available at: http://waterhouse.ucdavis.edu/phenol/folinmicro [Accessed March 1, 2010].
Wheatcroft, R., 1997. Production of beta-glucan-mannan preparations by autolysis ofcells under certain pH, temperature and time conditions. , pp.15, 20,21, 22.
Wrolstad, R.E. et al. eds., 2001. Current Protocols in Food Analytical Chemistry, Hoboken, NJ, USA: John Wiley & Sons, Inc. Available at: http://onlinelibrary.wiley.com/book/10.1002/0471142913/toc.
Xu, C. et al., 2010. Extraction, distribution and characterisation of phenolic compounds and oil in grapeseeds. Food Chemistry, 122(3), pp.688-694.
Yaman, S., 2004. Pyrolysis of biomass to produce fuels and chemical feedstocks. Energy
Conversion and Management, 45(5), pp.651-671.
Yanagida, A et al., 2000. Fractionation of apple procyanidins according to their degree of polymerization by normal-phase high-performance liquid chromatography. Journal
of Chromatography. A, 890(2), pp.251-259.
Yanagida, Akio, Shoji, T. & Shibusawa, Y., 2003. Separation of proanthocyanidins by degree of polymerization by means of size-exclusion chromatography and related techniques. Journal of Biochemical and Biophysical Methods, 56(1-3), pp.311-322.
Yu, J.-xia et al., 2009. Poly(Amic Acid)-Modified Biomass of Baker’s Yeast for Enhancement Adsorption of Methylene Blue and Basic Magenta. Applied
Biochemistry and Biotechnology, 160(5), pp.1394-1406.
Yu, Y., Lou, X. & Wu, H., 2008. Some Recent Advances in Hydrolysis of Biomass in Hot-Compressed Water and Its Comparisons with Other Hydrolysis Methods†. Energy &
Fuels, 22(1), pp.46-60.
Zakaria, M., Gonnord, M.F. & Guiochon, G., 1983. Application of two-dimensional thin-layer chromatography. Journal of Chromatography, 271(2), pp.127-192.
Zakrzewska, M.E., Bogel-Łukasik, E. & Bogel-Łukasik, R., 0. Ionic Liquid-Mediated Formation of 5-Hydroxymethylfurfural—A Promising Biomass-Derived Building Block. Chemical Reviews, 0(0).

218
Zhang, B., Huang, H.-J. & Ramaswamy, S., 2007. Reaction Kinetics of the Hydrothermal Treatment of Lignin. Applied Biochemistry and Biotechnology, 147(1-3), pp.119-131.
Zuo, Y., Wang, C. & Zhan, J., 2002. Separation, Characterization, and Quantitation of Benzoic and Phenolic Antioxidants in American Cranberry Fruit by GC−MS. Journal
of Agricultural and Food Chemistry, 50(13), pp.3789-3794.
Proceedings of the 8th World Congress of Chemical Engineering, Canada, 2009
DETERMINATION OF HYDROXYMETHYLFURFURAL
IN CIDER SPENT YEAST TREATED WITH
SUBCRITICAL WATER
A. Bahari1, R.C.D. Santos
1 and S. Bowra
2
1. School of Chemical Engineering, University of Birmingham,
Edgbaston, Birmingham, B15 2TT, UK,
2. Department of Research and Development, Phytatec (UK) Ltd, Plas Gogerddan,
Aberystwyth SY23 3EB, UK
Abstract: In this work, subcritical water treatment was used as an environmentally friendly technique to release available nutraceuticals or convert other potential components in the biomass to active and more useful products. The resulting extracts of the subcritical water batch treatment were analyzed with liquid chromatography and hydroxymethylfurfural was identified as the major component in the aqueous fraction. This may suggest that the available or decomposed monosaccharides may provide the necessary raw material required for dehydration process to manufacture HMF. The concentration profile was also investigated at different reaction temperatures to find out the effect of heating on the reaction output. The results could be more advantageous when the process include other prospective products in the medium to increase the productivity.
Keywords: Cider spent yeast, subcritical water, HMF
1. INTRODUCTION
Within the European food and drink industry over 200 million tonnes of organic waste are produced each year. The brewing and cider making industry produces for example spent grain and yeast, both are wastes. On a European scale spent yeast amounts to 700,000 tonnes per annum. Traditional markets for spent yeast are as dried whole extracts serving the nutraceutical markets and as a slurry, with 24% solid content, for animal feed. Available markets which used to employ the available nutrients in the biomass for the feed industry products are also declining. Therefore, alternative applications are being sought by the brewery industries to find sustainable routes to convert or capture the existing valuable fractions. It has been the focus of a large number of research groups to investigate the possible alternatives instead of traditionally land filling or disposal. Green processing and new manufacturing routes have been recommended worldwide by governmental and legislation bodies to decrease the reliance on petroleum based chemicals. Subcritical water, because of its benign nature and adjustable solvent power, dielectric constant and ion product has been largely studied as a green extraction solvent (Herrero et al., 2006). With its unique chemical and physical conditions that it provides, it is possible to employ it as a reaction medium for different purposes simultaneously (Smith, 2002).

219
In this work, subcritical water ( pressurised hot or superheated water as been addressed in some studies (Smith, 2002)) was used to hydrolyze suspended yeast cells in a slurry, and release other biomolecules which required further extraction procedures. Initially the hydrophilic fraction was investigated and the focus was on identification and characterisation of the main components which were available in this fraction. It is believed that there are many other valuable compounds which are present in the medium, but have not been included in this study (like the ones in lipophilic fraction or solid particles) and are currently being investigated in this project.
2. MATERIALS AND METHODS
2.1 Subcritical Water Hydrolysis
200 ml of spent cider yeast slurry was supplied by Bulmers® with a solid content of 13% (w/v) was subject to batch hydrolysis using a 300 ml stainless steel vessel (Parr Instrument Company ® 5500 mini bench top reactor). The vessel was heated electrically and cooled through the installation of additional cooling loop. The pressure was provided by a nitrogen gas cylinder at the indicated pressure.
2.2 Sample preparation
After subcritical water hydrolysis the samples were cooled and divided into 50 ml tubes and centrifuged at 17000 g for 10 mins (Beckman) and stored in -20 °C freezer for analysis. Samples were filtered prior to HPLC using 0.2 µm syringe driven filters (Millex- Millipore®).
2.3 High Performance Liquid Chromatography
An Agilent1100 coupled with a UV detector/analyzer (270 nm) fitted with a Phenomenex Synergi, RP-18, 250 × 4.6 mm column. The column was coupled with a guard cartridge packed with the same stationary phase (Phenomenex, UK) to capture all the compounds in the injected sample which may interact with or be retained by the column stationary phase. The column temperature was set to 30 °C with a flow rate of 1.0 ml/min. Gradient mobile phase condition was started from 99:1 water:acetonitrile and changed to steep gradient of 20% acetonitrile to remove insoluble compounds after the peak elution. All the solvents were purchased from Fisher Scientific®. The hydroxymethylfurfural standard was bought from Sigma-Aldrich to prepare the standard solution for the calibration and also validation.
2.4 EI-Mass spectroscopy
To identify the major peak in the chromatograms, samples were analyzed by taking fractions from HPLC column and analyzing them with a EI-MS (VG-ZabSpec). This was made possible by adjusting the HPLC method in terms of considering the compatibility of the chemicals in the analysis and also prohibiting the use of any buffer to prevent any negative effect on the analysis.
3. RESULTS
As discussed earlier, the applied analytical techniques were developed to include only the compounds available in the aqueous phase and categorized as hydrophilic compounds. All the samples were stored in -20 °C freezer prior to analysis.
3.1 HPLC analysis of the extract
Figure 1 shows the resulting chromatogram of the prepared sample which was recorded at 270 nm. Other wavelengths were also investigated but the most significant peak was present in this wavelength.

220
Fig.1- Chromatogram resulted from the analysis of the heat treated cider spent yeast with modified C18 Chromatography running at high ratio of water. Peak No. 1(Rt =18.2 min) was collected for further analysis
3.2 Mass Spectroscopy
The eluent peak was collected from the column and checked separately with the mass spectroscopy and because
of its unidentified structure, the fragments were prepared and compared with the existing library of
spectrums (Fig. 2).
Fig. 2- The spectrum of the eluting compound (on the top) and the suggested library entry which indicates that the it corresponds to 5-Hydroxymethylfurfural To validate this conclusion, a standard solution of HMF was prepared and checked with the same HPLC method and showed the exact retention time and absorption for the eluting peak.

221
3.3 Effect of temperature on the concentration
Keeping other subcritical water reaction parameters (pressure and time) constant, concentration profile of the HMF was studied at different temperatures and the results are shown in Figure 3. The pressure and residence time were set to 30 bar and 15 min respectively.
Fig. 3- Concentration of HMF vs. different reaction temperatures
As the figure suggests, the concentration continue to rise until 200 °C and falls sharply at higher temperatures. As suggested earlier, this can be due to the dehydration of the available monosaccharides in the medium or degradation of the yeast cells’ wall to simple sugars then followed by dehydration in the subcritical water reaction. The HMF loss at higher temperatures could be due to its decomposition to other components, such as levulinic acid which was detected at very high temperature range as well.
4. CONCLUSION
This work is a part of a larger study whose philosophy is based on the design of a platform which uses environmentally friendly techniques to extract valuable products from biomass wastes. Considering different analytical techniques, we were able to prepare an easy and robust way to determine and quantify a major compound in the hydrophilic fraction of the extract. While studies suggest lower yields of HMF in aqueous solutions (due to degradation to other chemicals) compared to organic mediums (Bicker et al., 2003; Lewkowski, 2003), there is the need of removing this organic solvents in the following steps. A lower concentration of this compound may not seem competitive with other manufacturing routes but it may be advantageous by offering it as an alternative technique to exploit valuable compounds in waste which may have been produced due to thermal reaction or released from the yeast cells during their decomposition of the cells. Using straight forward extraction techniques based on subcritical fluid technology and chromatography separation concepts we are attempting to isolate compounds in other fractions using several fractionation stages.
References
Bicker,M., Hirth,J., and Vogel,H. (2003). Dehydration of fructose to 5-hydroxymethylfurfural in sub- and supercritical acetone. Green Chemistry 5, 280-284.
0
500
1000
1500
2000
2500
3000
125 150 175 200 225
Temp(C)
mg/litre

222
Herrero,M., Cifuentes,A., and Ibanez,E. (2006). Sub- and supercritical fluid extraction of functional ingredients from different natural sources: Plants, food-by-product, algae and microalgae: A review. Food Chemistry 98, 136-148.
Lewkowski,J. (2003). Synthesis, Chemistry and Applications of 5-Hydroxymethyl-furfural and Its Derivatives. ChemInform 34.
Smith,R.M. (2002). Extractions with superheated water. Journal of Chromatography A 975, 31-46.