Subaru Observations of Galaxy Clusters at z
29
Subaru Observations of Galaxy Clusters at z<1.3 Masayuki Tanaka (University of Tokyo) Tadayuki Kodama (NAOJ) + the PISCES team
-
date post
20-Dec-2015 -
Category
Documents
-
view
220 -
download
5
Transcript of Subaru Observations of Galaxy Clusters at z

Subaru Observations of Galaxy Clusters at z<1.3
Masayuki Tanaka (University of Tokyo)Tadayuki Kodama (NAOJ) + the PISCES team

Outline
1 – Observations
2 – Large-Scale Structures
3 – Color-Magnitude Diagrams
4 – Spectral Diagnostics
5 – Summary

1 – Observations
Mauna Kea Observatories

redshift
z=0
z=0.55(5.4Gyr)
z=0.83(7.0Gyr)
Object Photometry Spectroscopy
Sloan Digital Sky Survey u g r i z ~260,000 objects(DR2)
Suprime-Cam (Subaru) B V R i z FOCAS (Subaru) ~200 objects
Suprime-Cam (Subaru) V R i z FOCAS (Subaru) ~300 objects
CL0016
RXJ0152

CL0016 at z=0.55
ACS/HST
Color composition by Ichi Tanaka

Large-Scale Structures
CL0016 at z=0.55

Large-Scale Structures
CL0016 at z=0.55
spec. objects at0.54<z<0.56
spec. objects outside of 0.54<z<0.56
z=0.549
z=0.547
z=0.548
z=0.547
z=0.542
Someone et al in prep.

RXJ0152 at z=0.83Color composition by Ichi Tanaka

RXJ0152 at z=0.83
Large-Scale Structures
Tanaka et al. 2006 MNRAS 365, 1392

RXJ0152 at z=0.83
Large-Scale Structures
z=0.844
z=0.842
z=0.745
z=0.782
z=0.835
z=0.837
z=0.839
z=0.844
spec. objects at0.82<z<0.85
spec. objects outside of 0.82<z<0.85
Tanaka et al. 2006 MNRAS 365, 1392

RXJ1716 at z=0.81 MS1054 at z=0.83
RDCSJ0910 at z=1.1 RDCSJ1252 at z=1.24
Koyama et al. in prep.
Tanaka et al. MNRAS submitted
Structures around other high-z clusters
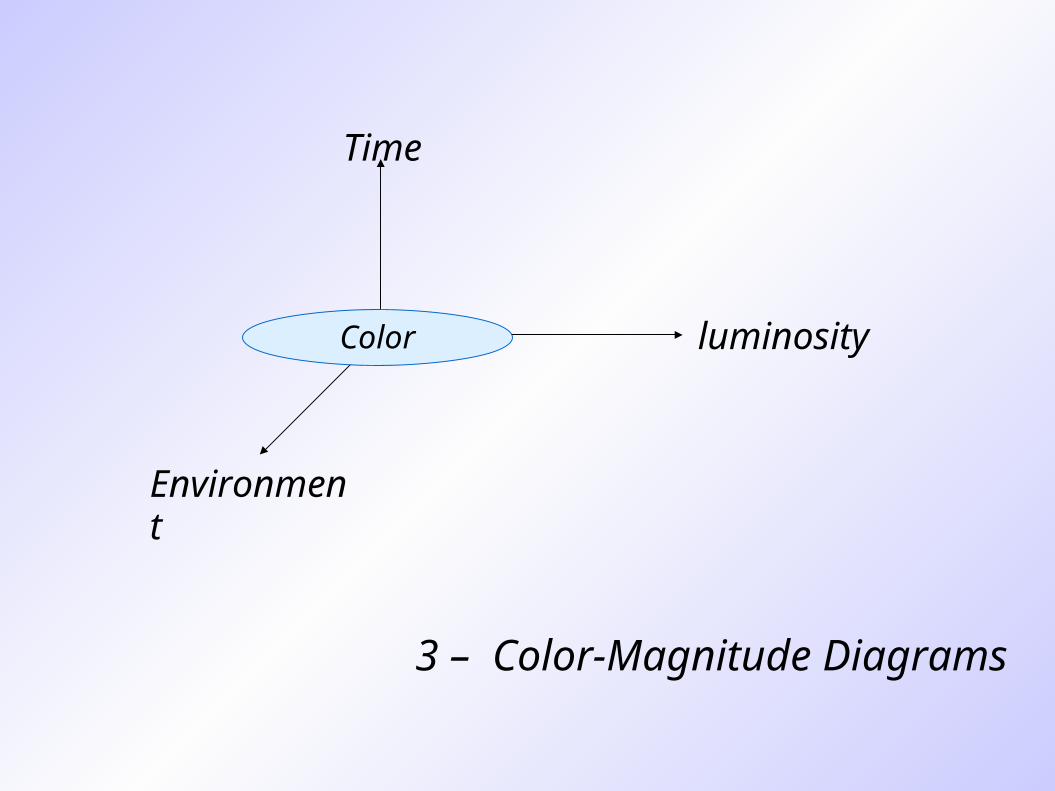
3 – Color-Magnitude Diagrams
Time
Color
Environment
luminosity

Cluster / Group / Field Environments
redshift
z=0 z=0.55 z=0.83
Tanaka et al. 2005 MNRAS 362, 268

Colour-Magnitude Diagrams
red
blue
z=0 z=0.55 z=0.83
redshift
massive less massive
Tanaka et al. 2005 MNRAS 362, 268

Giant-to-Dwarf ratio of red galaxies
z=0.8
z=0.5z=0
Tanaka et al. 2005 MNRAS 362, 268
Giant : 10.6<log (Msteller/Msolar)
Dwarf: 9.7 < log (Msteller/Msolar) < 10.6

Giant : 10.6<log (Msteller/Msolar)
Dwarf: 9.7 < log (Msteller/Msolar) < 10.6 Tanaka et al. 2005 MNRAS 362, 268
Giant-to-Dwarf ratio
z=0.8
z=0.5z=0
1) Galaxies follow the 'down-sizing' evolution.
2) The 'down-sizing' is delayed in low-density environments.

4 – Spectral Diagnostics

Composite Spectra of Red Galaxies at z~0.8
Tanaka et al. 2006 MNRAS 365, 1392

Model Star Formation Histories
time
star
form
atio
n ra
te
SSP modeltau model burst model
Bruzual & Charlot 2003 Model : Chabrier IMF between 0.1-100Msolar Solar Metallicity, No dust extinction

Spectral Diagnostics – SSP
model grids: Bruzual & Charlot 2003contours : galaxies at z=0
preliminary

Spectral Diagnostics – tau model
model grids: Bruzual & Charlot 2003contours : galaxies at z=0
preliminary

Spectral Diagnostics – burst model
model grids: Bruzual & Charlot 2003contours : galaxies at z=0
preliminary

5 – Summary

Schematic View of Galaxy Evolution
Env
iron
men
t
MassTime

Env
iron
men
t
MassTime
Schematic View of Galaxy Evolution

Env
iron
men
t
MassTime
Schematic View of Galaxy Evolution

Env
iron
men
t
MassTime
Schematic View of Galaxy Evolution

Env
iron
men
t
MassTime
Schematic View of Galaxy Evolution

Env
iron
men
t
MassTime
Schematic View of Galaxy Evolution