Sub-hydrostatic pore pressure in coalbed and sand aquifers of … · Rocky Mountain Geology, v. 43,...
15
Rocky Mountain Geology, v. 43, no. 2, p. 155–169, 13 figs., 1 table, November, 2008 155 Sub-hydrostatic pore pressure in coalbed and sand aquifers of the Powder River Basin, Wyoming and Montana, and implications for disposal of coalbed-methane-produced water through injection Hannah E. Ross* and Mark D. Zoback Department of Geophysics, Stanford University, Stanford, CA 94305-2215, U.S.A. *Correspondence should be addressed to: [email protected] ABSTRACT Coalbed methane (CBM) production in the Powder River Basin (PRB), Wyoming, is associated with the production of large volumes of water. Locally, water in coalbeds from the PRB has high saline and sodium contents, making it unsuitable for agricultural use and potentially environmentally damaging if discharged at the surface. One option for the disposal of CBM-produced water is injection into aquifers. For injection to be feasible, however, the porosity and permeability of the sands need to be high, the pore pressure ideally needs to be sub-hydrostatic, and the aquifer cannot be in hydraulic communication with coalbeds or aquifers used for irrigation use. In order to determine if pore pressures in the aquifers are low enough to allow for significant water injection (and to determine whether the coals and nearby sands are in hydraulic communication), we have compiled pore pressures in 250 wells that monitor water levels in coalbeds and adjacent sands within the PRB. All 250 wells have pore pressures below hydrostatic pressure, suggesting that injection of produced water should be feasible. Through the analysis of pore pressure changes with time for both the coals and their overlying/underlying sands, we find after 8 to 13 years of water-level monitoring that none of the sands more than 200 ft (61 m) vertically from producing coals appear to be in hydraulic communication with the coalbeds. Therefore, injection of CBM-produced water should be carried out in sands at least 200 ft (61 m) from adjacent coalbeds to be sure that the disposed water does not rapidly migrate back into the coalbeds. In addition, we constructed two 3D stochastic reservoir models of conceptualized sand units to determine the rates at which water can be injected into shallow (~300 ft (91 m)) and deep (~1000 ft (305 m)) sub-hydro- static aquifers. We find that for shallow sands we can inject water at a rate of ~160 bbl/day, whereas for deeper sands, whose pore pressures are lower than the shallower sands, the rate is ~435 bbl/day. Both of these rates are higher than the average water production rate from CBM wells in the PRB of ~100 bbl/day. This implies that for deep aquifer injection sites, it would take only one injection well to dispose of the water production from approximately four CBM wells. KEYWORDS: Powder River Basin, coalbed methane, coalbed methane-produced water, pore pressure, sub- hydrostatic, hydraulic communication, coalbed methane-produced water disposal, injection. INTRODUCTION Coalbed methane (CBM) production in the Powder River Basin (PRB) began in the early 1980s and by 1989 there were only 22 CBM wells (De Bruin et al., 2004; Wyoming Oil and Gas Conservation Commission (WOGCC), 2007). Production expanded rapidly, however, and today there are ~17,000 wells (WOGCC, 2007), with another 34,000 expected to be drilled over the next five to ten years (Environmental News Network, 2001)(Fig. 1). CBM from the PRB accounts for ~17 percent of the total gas produced in Wyoming (WOGCC, 2007). CBM production in the PRB is associated with the production of large volumes of water. In 2006, ~590 million barrels (bbl) of water were produced,
Transcript of Sub-hydrostatic pore pressure in coalbed and sand aquifers of … · Rocky Mountain Geology, v. 43,...

Rocky Mountain Geology, v. 43, no. 2, p. 155–169, 13 figs., 1 table, November, 2008 155
Sub-hydrostatic pore pressure in coalbed and sand aquifers of the Powder River Basin, Wyoming and Montana, and implications for disposal of coalbed-methane-produced water through injection
Hannah E. Ross* and Mark D. ZobackDepartment of Geophysics, Stanford University, Stanford, CA 94305-2215, U.S.A.
*Correspondence should be addressed to: [email protected]
ABSTRACT
Coalbed methane (CBM) production in the Powder River Basin (PRB), Wyoming, is associated with the production of large volumes of water. Locally, water in coalbeds from the PRB has high saline and sodium contents, making it unsuitable for agricultural use and potentially environmentally damaging if discharged at the surface. One option for the disposal of CBM-produced water is injection into aquifers. For injection to be feasible, however, the porosity and permeability of the sands need to be high, the pore pressure ideally needs to be sub-hydrostatic, and the aquifer cannot be in hydraulic communication with coalbeds or aquifers used for irrigation use. In order to determine if pore pressures in the aquifers are low enough to allow for significant water injection (and to determine whether the coals and nearby sands are in hydraulic communication), we have compiled pore pressures in 250 wells that monitor water levels in coalbeds and adjacent sands within the PRB.
All 250 wells have pore pressures below hydrostatic pressure, suggesting that injection of produced water should be feasible. Through the analysis of pore pressure changes with time for both the coals and their overlying/underlying sands, we find after 8 to 13 years of water-level monitoring that none of the sands more than 200 ft (61 m) vertically from producing coals appear to be in hydraulic communication with the coalbeds. Therefore, injection of CBM-produced water should be carried out in sands at least 200 ft (61 m) from adjacent coalbeds to be sure that the disposed water does not rapidly migrate back into the coalbeds.
In addition, we constructed two 3D stochastic reservoir models of conceptualized sand units to determine the rates at which water can be injected into shallow (~300 ft (91 m)) and deep (~1000 ft (305 m)) sub-hydro-static aquifers. We find that for shallow sands we can inject water at a rate of ~160 bbl/day, whereas for deeper sands, whose pore pressures are lower than the shallower sands, the rate is ~435 bbl/day. Both of these rates are higher than the average water production rate from CBM wells in the PRB of ~100 bbl/day. This implies that for deep aquifer injection sites, it would take only one injection well to dispose of the water production from approximately four CBM wells.
KEYWORDS: Powder River Basin, coalbed methane, coalbed methane-produced water, pore pressure, sub-hydrostatic, hydraulic communication, coalbed methane-produced water disposal, injection.
INTRODUCTION
Coalbed methane (CBM) production in the Powder River Basin (PRB) began in the early 1980s and by 1989 there were only 22 CBM wells (De Bruin et al., 2004; Wyoming Oil and Gas Conservation Commission (WOGCC), 2007). Production expanded rapidly, however, and today there are
~17,000 wells (WOGCC, 2007), with another 34,000 expected to be drilled over the next five to ten years (Environmental News Network, 2001)(Fig. 1). CBM from the PRB accounts for ~17 percent of the total gas produced in Wyoming (WOGCC, 2007).
CBM production in the PRB is associated with the production of large volumes of water. In 2006, ~590 million barrels (bbl) of water were produced,

156 Rocky Mountain Geology, v. 43, no. 2, p. 155–169, 13 figs., 1 table, November, 2008
at an average rate of ~100 bbl/well/day (WOGCC, 2006). Even though the quality of CBM-produced water is generally sufficient for drinking water and livestock use, in many places the saline and sodium contents of the water are too high for agricultural use (Bartos and Ogle, 2002; Wheaton and Donato, 2004; The Ruckelshaus Institute of Environment and Natural Resources, 2005). To produce CBM, water is pumped out of coalbeds to reduce reservoir pressure, causing methane (CH4) to desorb and flow to pro-duction wells. Even where the quality of the CBM-produced water is good, its volume is too large for immediate human and livestock consumption and most of it is discharged into evaporation/infiltration ponds or streams (Advanced Resources International, 2002; The Ruckelshaus Institute of Environment and Natural Resources, 2005). In areas with high saline and sodium contents, when the CBM-produced water comes into contact with soil, the ions precipi-tate out of solution and lower the permeability of the soil, which reduces the productivity of the soil and increases soil erosion and damage to wildlife habitats (Wheaton and Donato, 2004).
One option for the disposal of CBM-produced water that is unusable for irrigation is injection into aquifers. For injection to be feasible, however, both the porosity and permeability of the aquifer need to be high (for capacity and injectivity), the pore pressure needs to be low (for capacity and injectiv-ity), and the aquifer cannot be in hydraulic com-munication with coalbeds or other aquifers (for containment). High porosity and permeability and low pore pressures in an aquifer would result in a large capacity for water and adequate injectivity. In addition, the water quality should be roughly comparable to that of the aquifer water, so that the CBM-produced water does not degrade the aquifer (Chapter 4, Section 5 of the Rules and Statures of the WOGCC, 2007). In order to determine if pore pressures in the aquifers are low enough to allow for significant water injection and whether the coals and sands are in hydraulic communication with each other, we have determined pore pressures as a func-tion of time in ~250 wells that monitor water levels in coalbeds and adjacent sands within the PRB. In this study we considered aquifers with pore pres-sures below hydrostatic and carried out f luid f low simulations to determine the feasibility of injecting CBM-produced water into those aquifers.
POWDER RIVER BASIN HYDROGEOLOGY
A number of studies have been carried out on the hydrogeology of the PRB, many of which are summarized in Lindner-Lunsford and Wilson (1992). More recent studies have focused on water drawdown from CBM production (Wheaton and Metesh, 2002; Bartos and Ogle, 2002; Applied Hydrology Associates and Greystone Environmental Consultants, 2002), water quality (Bartos and Ogle, 2002; The Ruckelshaus Institute of Environment and Natural Resources, 2005) and ground water sys-tems in the basin (Bartos and Ogle, 2002; Applied Hydrology Associates and Greystone Environmental Consultants, 2002). Bartos and Ogle (2002) used 23 water-level monitoring wells in the Wyoming part of the PRB to look at the hydraulic potential for verti-cal water flow and the ground-water quality at each of the well sites. They found that there was a strong drive for vertical water flow in all but one well site. In addition, they used water chemistry to distin-guish isolated ground-water systems present in the PRB. The water chemistry revealed the potential for two different aquifer systems in the PRB: a shallow system dominated by a mixed cation composition, with either sulfate or bicarbonate as the dominant anion, and a deeper system composed of sodium-bicarbonate waters. They proposed that either there are two ground-water systems within the PRB, one shallow and the other deeper (with no vertical flow between them), or that there is one system, where water migrates downward from shallow levels and its composition is changed through chemical inter-
Figure 1, facing page. A, Location map of the Powder River Basin, Wyoming and Montana, and of the water-monitor-ing wells used in this study (modified from Colmenares and Zoback (2007)). Orange dots correspond to CBM wells. Red squares correspond to the township and range locations of water-monitoring wells maintained by the Montana Bureau of Mines and Geology (MBMG), a department of Montana Tech of the University of Montana. Blue squares correspond to the township and range locations of water monitoring wells main-tained by the Wyoming Bureau of Land Management (BLM). White squares correspond to the township and range loca-tions of historic water monitoring wells from Daddow (1986). Dotted ovals surrounding the water monitoring wells corre-spond to groups 1, 2, and 3 mentioned in the text. B, Location map of individual water monitoring wells mentioned in the text. The black box in Figure 1A outlines the area encompassed by this map.
H. E. ROSS AND M. D. ZOBACK

Rocky Mountain Geology, v. 43, no. 2, p. 155–169, 13 figs., 1 table, November, 2008 157
Buffalo
Gillette
MP2
MP22
PERSSON457301
447214447131
SASQ
NAPIER
REDS
109oW
109oW
108oW
108oW
107oW
107oW
106oW
106oW
105oW
105oW
104oW
104oW
103oW
103oW
42oN 42oN
43oN 43oN
44oN 44oN
45oN 45oN
46oN 46oN
47oN 47oN
0 50 100
km
Big
Horn
Mountain
s
Buffalo
Montana
Wyoming
Wyom
ing
North Dakota
South
Dakota
Black
Hills
DouglasCasper
Bel
le F
ourc
he R
iver
Pow
der R
iver
Tong
ue R
iver
Sheridan
N
Locations of
water monitoring
wells
BLM,
Wyoming
Daddow,
1986
MBMG
Group 2
Gillette
A
B
Group 1
Group 3
COALBED METHANE WATER DISPOSAL, IN POWDER RIVER BASIN
158 Rocky Mountain Geology, v. 43, no. 2, p. 155–169, 13 figs., 1 table, November, 2008
actions and mixing to become sodium-bicarbonate rich.
Applied Hydrology Associates and Greystone Environmental Consultants (2002) also used water-level monitoring data in the Wyoming part of the PRB to look at the effect of CBM production on sand and coal aquifers in the basin. They were interested in the volume of recoverable ground water from these aquifers and the rate of recharge to the aquifers based on various water management strategies. They pro-posed that water production from CBM production could induce water “leakage” into the coalbeds from overlying and underlying sand units that occur within 100 ft (31 m) of the coal, but that leakage would be minimized because most of the coals are isolated from these sand units by fine grained silts/shales that vary in thickness from 11 ft (3 m) to 363 ft (111 m). To test this, they analyzed hydraulic heads in two sets of paired Bureau of Land Management (BLM) monitoring wells (where one well in the pair is per-forated in coal and the other in overlying sandstone) and observed a water level decline over time of ~250 ft (76 m) in the coals and a ~20 ft (6 m) decline in the overlying sands. The coals are ~40 ft (12 m) below the sands, so they concluded that the water from the sand had migrated into the underlying coal, but that the confining unit between the sand and coal limited their hydraulic communication. We have carried out a similar study, but have used data from many more well sets and evaluated changes in pore pressure with time to infer hydraulic communication between the sands and underlying/overlying coals.
POWDER RIVER BASIN GEOLOGY
Coals in the Tongue River Member of the Paleocene Fort Union Formation are the targets for CBM production in the PRB. The Fort Union Formation is overlain by the Eocene Wasatch Formation, which is exposed at the surface over much of the Wyoming part of the basin (Bartos and Ogle, 2002). Both the Fort Union Formation and the Wasatch Formation were deposited in f luvial, lacustrine and swamp environments. The Wasatch Formation is composed of lenticular, discontinuous, fine- to medium-grained sandstones that are inter-bedded with siltstones, shales, and coals (Applied Hydrology Associates and Greystone Environmental Consultants, 2002; Bartos and Ogle, 2002). The
formation varies in thickness from 0 ft (0 m) at out-crop to ~3000 ft (914 m) in the central part of the basin (Applied Hydrology Associates and Greystone Environmental Consultants, 2002).
The Fort Union Formation is also composed of interbedded sandstones, siltstones, shales, and coals. The Wyodak-Anderson coal zone, part of the Tongue River Member, is the coal zone of interest for CBM production. The coal zone ranges in thickness from less than an inch (< 2 cm) to 200 ft (61 m), and the coals merge and split into as many as 11 beds (Flores and Bader, 1999; Flores, 2004). This coal zone is an aquifer and represents the most continuous hydrologic unit in the lower Tertiary part of the PRB (Bartos and Ogle, 2002). The Tongue River Member comprises the upper part of the Fort Union Formation, and the Wyodak-Anderson coal zone is separated from over-lying sands in the Wasatch Formation by low-perme-ability siltstones and shales which act as a confining unit (Applied Hydrology Associates and Greystone Environmental Consultants, 2002; Bartos and Ogle, 2002). Applied Hydrology Associates and Greystone Environmental Consultants (2002) report that the permeability of the confining unit ranges from 0.009 mD to 2 mD in the horizontal directions and 0.002 mD to 0.02 mD in the vertical direction. It is thought that this confining unit ranges in thickness from 11 ft (3 m) to 363 ft (111 m), but averages ~30 ft (9 m) across the basin (Applied Hydrology Associates and Greystone Environmental Consultants, 2002).
WATER-LEVEL DATA
We obtained water-level data from active and historic water-monitoring wells across the PRB that monitor water levels in both sand and coalbed units of the Wasatch and Fort Union Formations respec-tively. In the Montana part of the basin, the Montana Bureau of Mines and Geology (MBMG), a depart-ment of Montana Tech of the University of Montana, operates 219 water-monitoring wells. In the Wyoming part of the basin, the Wyoming BLM operates 134 water-monitoring wells. We also obtained water-level data from 62 historic water monitoring wells in Wyoming that were in operation before CBM pro-duction began in the PRB (Daddow, 1986).
The water-monitoring databases contain infor-mation about the location, ground elevation, well completion, depth, geologic unit and water level for
H. E. ROSS AND M. D. ZOBACK
Rocky Mountain Geology, v. 43, no. 2, p. 155–169, 13 figs., 1 table, November, 2008 159
the wells. However, because information for some of the monitoring wells is incomplete, our analysis includes 144 wells from Montana, 69 wells from the Wyoming BLM database, and 40 of the Wyoming historic wells. The locations of all the monitoring wells used in this study are shown in Figure 1.
Records for the Montana water-monitoring wells go as far back as 1974 and monitoring has been con-tinuous from 1974 to the present. In contrast, BLM monitoring began only in 1993, after CBM produc-tion had begun in the basin. Hence, the historic wells (Daddow, 1986) were used to establish water levels before CBM production began in the Wyoming part of the basin. For all other pore pressure analyses in Wyoming we have used the BLM monitoring data.
Both the Montana and BLM monitoring data-bases contain paired wells/well clusters, which are a series of wells located close to one another, where each well is completed at successively shallower depths. Paired wells can be used to determine the potential for vertical fluid flow and whether geologic units are in hydraulic communication with one another. In the Wyoming part of the PRB there are 23 well pairs, while in Montana there are 11.
CALCULATING PORE PRESSURE
We used water-level data from monitoring wells to calculate pore pressures for coals and sands in the PRB. The pore pressure (Pp) (fluid pressure) at a posi-tion P in the monitoring well is found as follows:
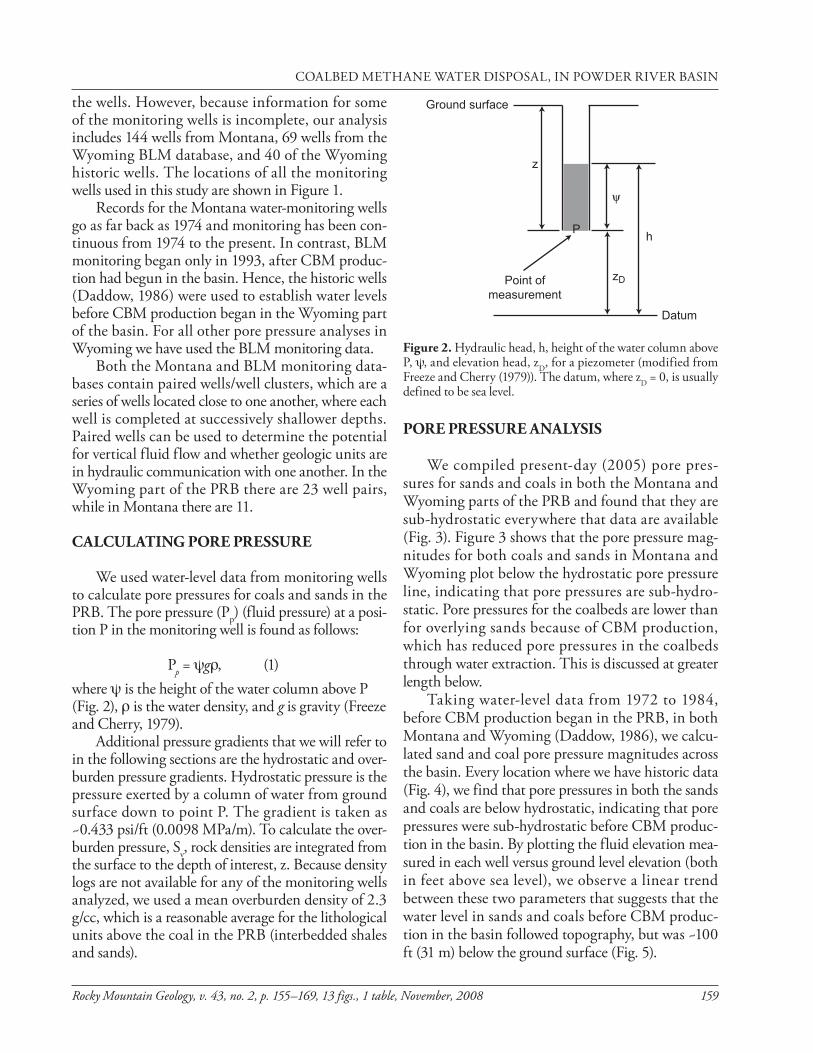
Pp = g , (1)where is the height of the water column above P (Fig. 2), is the water density, and g is gravity (Freeze and Cherry, 1979).
Additional pressure gradients that we will refer to in the following sections are the hydrostatic and over-burden pressure gradients. Hydrostatic pressure is the pressure exerted by a column of water from ground surface down to point P. The gradient is taken as ~0.433 psi/ft (0.0098 MPa/m). To calculate the over-burden pressure, Sv, rock densities are integrated from the surface to the depth of interest, z. Because density logs are not available for any of the monitoring wells analyzed, we used a mean overburden density of 2.3 g/cc, which is a reasonable average for the lithological units above the coal in the PRB (interbedded shales and sands).
PORE PRESSURE ANALYSIS
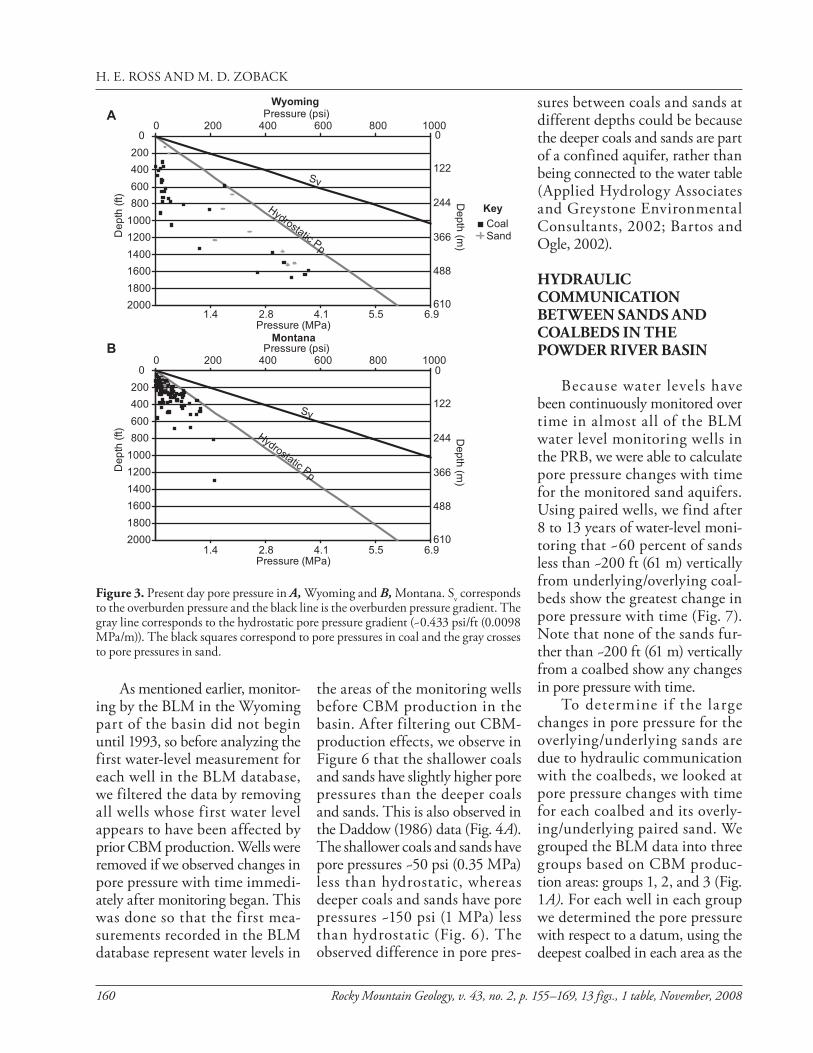
We compiled present-day (2005) pore pres-sures for sands and coals in both the Montana and Wyoming parts of the PRB and found that they are sub-hydrostatic everywhere that data are available (Fig. 3). Figure 3 shows that the pore pressure mag-nitudes for both coals and sands in Montana and Wyoming plot below the hydrostatic pore pressure line, indicating that pore pressures are sub-hydro-static. Pore pressures for the coalbeds are lower than for overlying sands because of CBM production, which has reduced pore pressures in the coalbeds through water extraction. This is discussed at greater length below.
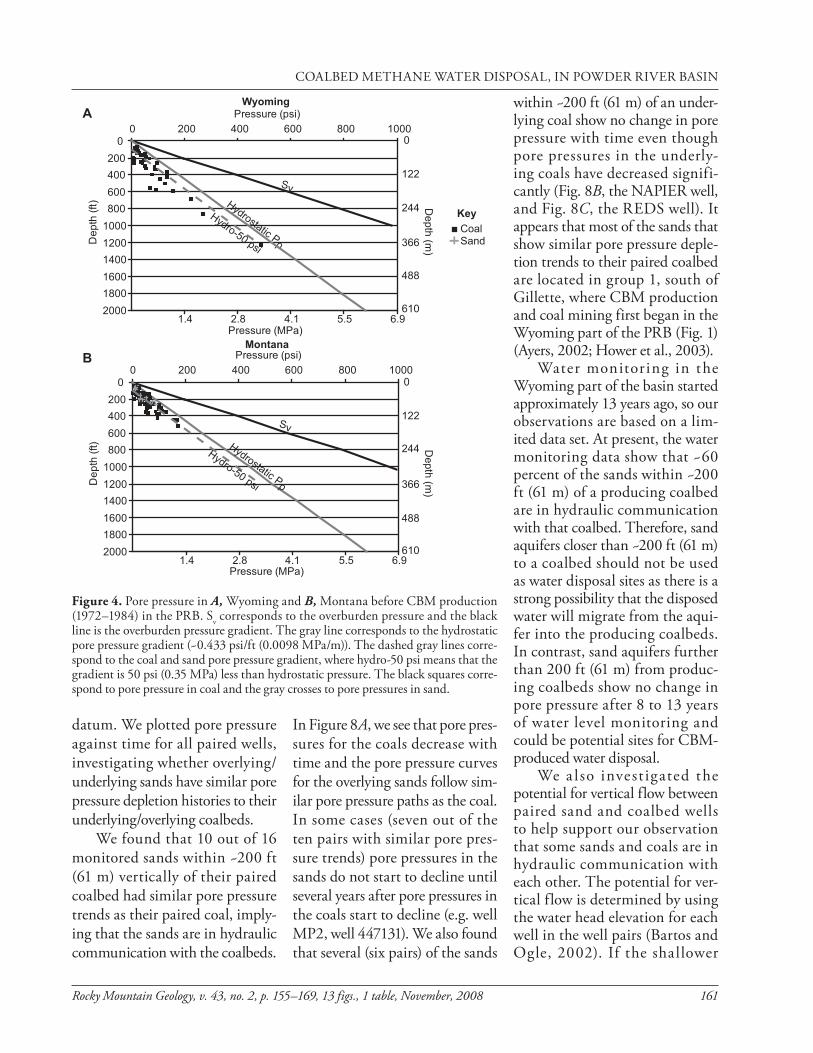
Taking water-level data from 1972 to 1984, before CBM production began in the PRB, in both Montana and Wyoming (Daddow, 1986), we calcu-lated sand and coal pore pressure magnitudes across the basin. Every location where we have historic data (Fig. 4), we find that pore pressures in both the sands and coals are below hydrostatic, indicating that pore pressures were sub-hydrostatic before CBM produc-tion in the basin. By plotting the fluid elevation mea-sured in each well versus ground level elevation (both in feet above sea level), we observe a linear trend between these two parameters that suggests that the water level in sands and coals before CBM produc-tion in the basin followed topography, but was ~100 ft (31 m) below the ground surface (Fig. 5).
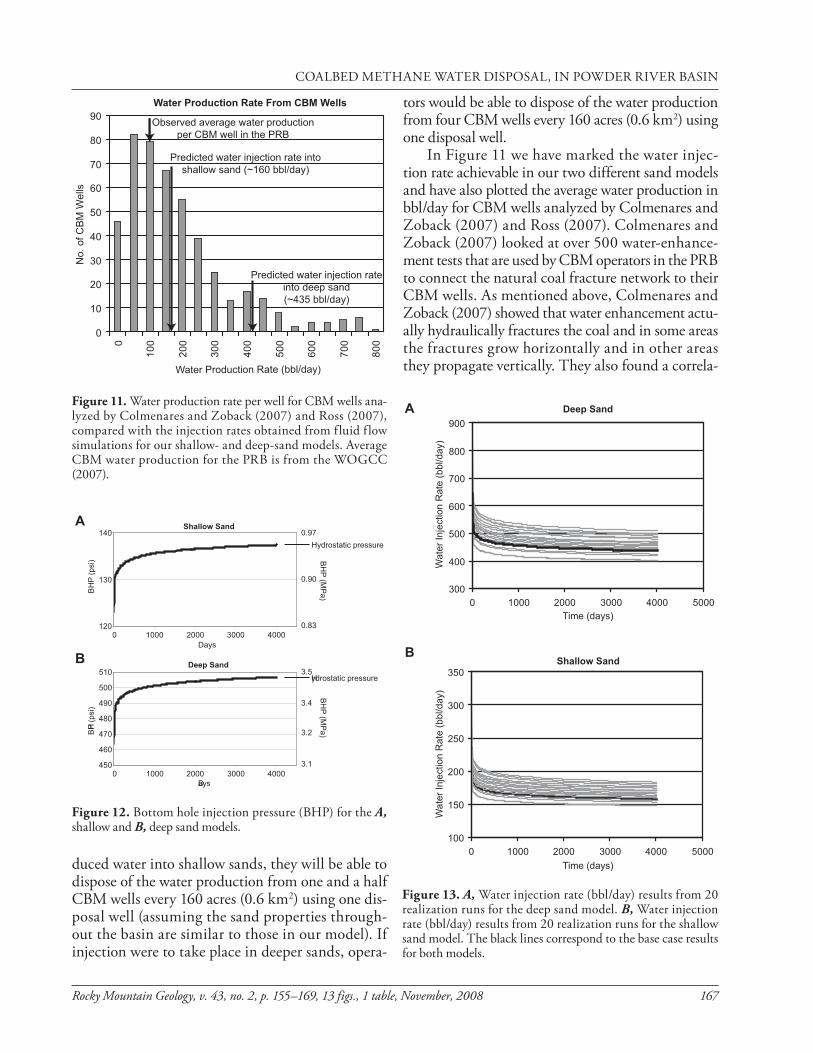
Figure 2. Hydraulic head, h, height of the water column above P, , and elevation head, zD, for a piezometer (modified from Freeze and Cherry (1979)). The datum, where zD = 0, is usually defined to be sea level.
COALBED METHANE WATER DISPOSAL, IN POWDER RIVER BASIN
160 Rocky Mountain Geology, v. 43, no. 2, p. 155–169, 13 figs., 1 table, November, 2008
As mentioned earlier, monitor-ing by the BLM in the Wyoming part of the basin did not begin until 1993, so before analyzing the first water-level measurement for each well in the BLM database, we filtered the data by removing all wells whose first water level appears to have been affected by prior CBM production. Wells were removed if we observed changes in pore pressure with time immedi-ately after monitoring began. This was done so that the first mea-surements recorded in the BLM database represent water levels in
the areas of the monitoring wells before CBM production in the basin. After filtering out CBM-production effects, we observe in Figure 6 that the shallower coals and sands have slightly higher pore pressures than the deeper coals and sands. This is also observed in the Daddow (1986) data (Fig. 4A). The shallower coals and sands have pore pressures ~50 psi (0.35 MPa) less than hydrostatic, whereas deeper coals and sands have pore pressures ~150 psi (1 MPa) less than hydrostatic (Fig. 6). The observed difference in pore pres-
sures between coals and sands at different depths could be because the deeper coals and sands are part of a confined aquifer, rather than being connected to the water table (Applied Hydrology Associates and Greystone Environmental Consultants, 2002; Bartos and Ogle, 2002).
HYDRAULIC COMMUNICATION BETWEEN SANDS AND COALBEDS IN THE POWDER RIVER BASIN
Because water levels have been continuously monitored over time in almost all of the BLM water level monitoring wells in the PRB, we were able to calculate pore pressure changes with time for the monitored sand aquifers. Using paired wells, we find after 8 to 13 years of water-level moni-toring that ~60 percent of sands less than ~200 ft (61 m) vertically from underlying/overlying coal-beds show the greatest change in pore pressure with time (Fig. 7). Note that none of the sands fur-ther than ~200 ft (61 m) vertically from a coalbed show any changes in pore pressure with time.
To determine if the large changes in pore pressure for the overlying/underlying sands are due to hydraulic communication with the coalbeds, we looked at pore pressure changes with time for each coalbed and its overly-ing/underlying paired sand. We grouped the BLM data into three groups based on CBM produc-tion areas: groups 1, 2, and 3 (Fig. 1A). For each well in each group we determined the pore pressure with respect to a datum, using the deepest coalbed in each area as the
0
200
400
600
800
1000
1200
1400
1600
1800
2000
0 200 400 600 800 1000Pressure (psi)
De
pth
(ft)
Sv
Hydrostatic Pp
0
200
400
600
800
1000
1200
1400
1600
1800
2000
0 200 400 600 800 1000Pressure (psi)
De
pth
(ft)
Sv
Hydrostatic Pp
A
B
Wyoming
Montana
610
488
366
244
122
0
Depth
(m)
610
488
366
244
122
0
Depth
(m)
1.4 2.8 4.1 5.5 6.9Pressure (MPa)
1.4 2.8 4.1 5.5 6.9Pressure (MPa)
CoalSand
Key
Figure 3. Present day pore pressure in A, Wyoming and B, Montana. Sv corresponds to the overburden pressure and the black line is the overburden pressure gradient. The gray line corresponds to the hydrostatic pore pressure gradient (~0.433 psi/ft (0.0098 MPa/m)). The black squares correspond to pore pressures in coal and the gray crosses to pore pressures in sand.
H. E. ROSS AND M. D. ZOBACK
Rocky Mountain Geology, v. 43, no. 2, p. 155–169, 13 figs., 1 table, November, 2008 161
datum. We plotted pore pressure against time for all paired wells, investigating whether overlying/underlying sands have similar pore pressure depletion histories to their underlying/overlying coalbeds.
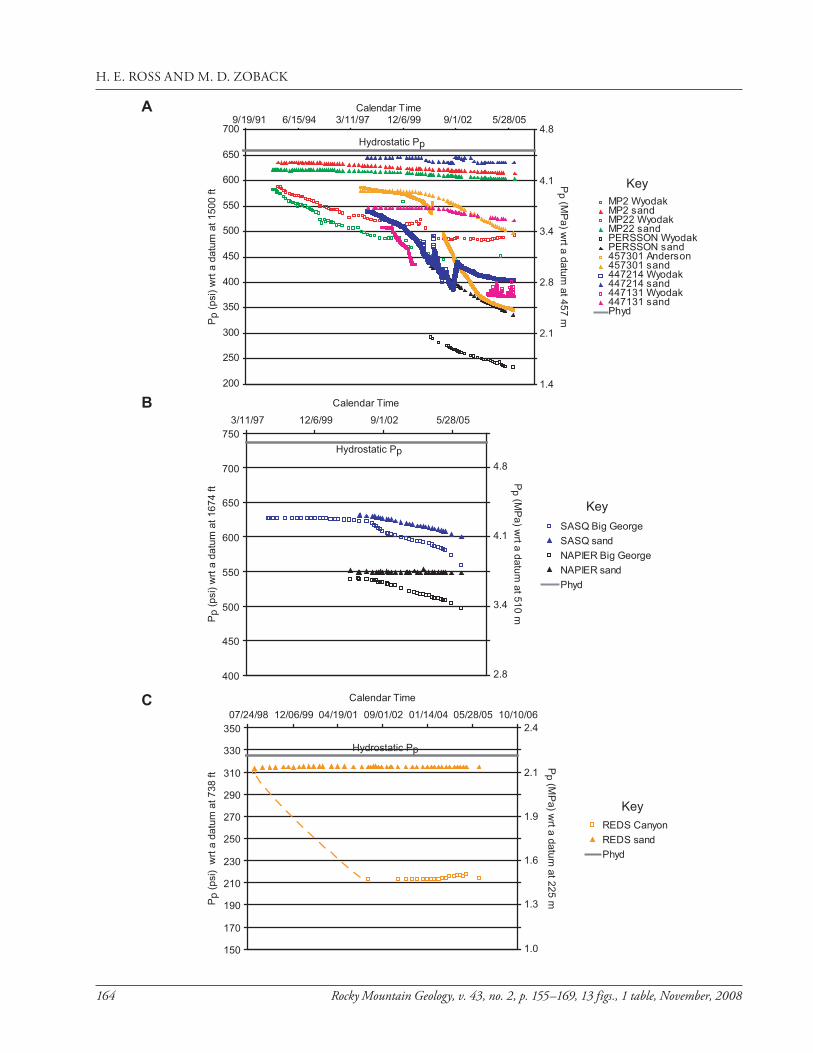
We found that 10 out of 16 monitored sands within ~200 ft (61 m) vertically of their paired coalbed had similar pore pressure trends as their paired coal, imply-ing that the sands are in hydraulic communication with the coalbeds.
In Figure 8A, we see that pore pres-sures for the coals decrease with time and the pore pressure curves for the overlying sands follow sim-ilar pore pressure paths as the coal. In some cases (seven out of the ten pairs with similar pore pres-sure trends) pore pressures in the sands do not start to decline until several years after pore pressures in the coals start to decline (e.g. well MP2, well 447131). We also found that several (six pairs) of the sands
within ~200 ft (61 m) of an under-lying coal show no change in pore pressure with time even though pore pressures in the underly-ing coals have decreased signifi-cantly (Fig. 8B, the NAPIER well, and Fig. 8C, the REDS well). It appears that most of the sands that show similar pore pressure deple-tion trends to their paired coalbed are located in group 1, south of Gillette, where CBM production and coal mining first began in the Wyoming part of the PRB (Fig. 1)(Ayers, 2002; Hower et al., 2003).
Water monitoring in the Wyoming part of the basin started approximately 13 years ago, so our observations are based on a lim-ited data set. At present, the water monitoring data show that ~60 percent of the sands within ~200 ft (61 m) of a producing coalbed are in hydraulic communication with that coalbed. Therefore, sand aquifers closer than ~200 ft (61 m) to a coalbed should not be used as water disposal sites as there is a strong possibility that the disposed water will migrate from the aqui-fer into the producing coalbeds. In contrast, sand aquifers further than 200 ft (61 m) from produc-ing coalbeds show no change in pore pressure after 8 to 13 years of water level monitoring and could be potential sites for CBM-produced water disposal.
We a lso invest igated the potential for vertical flow between paired sand and coalbed wells to help support our observation that some sands and coals are in hydraulic communication with each other. The potential for ver-tical f low is determined by using the water head elevation for each well in the well pairs (Bartos and Ogle, 2002). If the shallower
Sv
Hydrostatic Pp
0
200
400
600
800
1000
1200
1400
1600
1800
2000
0 200 400 600 800 1000
Pressure (psi)
De
pth
(ft
)
0
200
400
600
800
1000
1200
1400
1600
1800
2000
0 200 400 600 800 1000
Pressure (psi)
De
pth
(ft)
Sv
Hydrostatic Pp
A
B
Hydro-50 psi
Hydro-50 psi
Wyoming
Montana
610
488
366
244
122
0
Depth
(m)
610
488
366
244
122
0D
epth
(m)
1.4 2.8 4.1 5.5 6.9Pressure (MPa)
1.4 2.8 4.1 5.5 6.9Pressure (MPa)
CoalSand
Key
Figure 4. Pore pressure in A, Wyoming and B, Montana before CBM production (1972–1984) in the PRB. Sv corresponds to the overburden pressure and the black line is the overburden pressure gradient. The gray line corresponds to the hydrostatic pore pressure gradient (~0.433 psi/ft (0.0098 MPa/m)). The dashed gray lines corre-spond to the coal and sand pore pressure gradient, where hydro-50 psi means that the gradient is 50 psi (0.35 MPa) less than hydrostatic pressure. The black squares corre-spond to pore pressure in coal and the gray crosses to pore pressures in sand.
COALBED METHANE WATER DISPOSAL, IN POWDER RIVER BASIN

162 Rocky Mountain Geology, v. 43, no. 2, p. 155–169, 13 figs., 1 table, November, 2008
unit has a higher head than the underlying unit, the potential for vertical flow is downward. We find that the vertical flow potential is in the downward direc-tion in all but one of the well pairs. In addition, one of the monitoring wells monitors water levels in sand that is below its paired coalbed and we find that the potential for vertical flow is upward from the sand to the overlying coalbed. The direction for vertical flow is consistent with the large decrease in pore pressure observed over time for the underlying sand, imply-ing that CBM production is removing water from the underlying sand aquifer.
It is possible that vertical hydraulic fractures, created during hydraulic fracturing in CBM wells, could be the cause for the observed hydraulic com-munication between some of the coal and sand pairs. CBM operators in the PRB routinely carry out water enhancement on their wells in which water is pumped down the CBM wells at a rate of ~60 bpm for ~15 min to connect the coal cleats to the wellbore to increase gas production. Using the flow rate and wellhead pressure recorded during water enhance-ment, Colmenares and Zoback (2007) found that water enhancement hydraulically fractures the coal. They were able to calculate the magnitude of the least principal stress (S3) in 372 CBM wells and deter-mine the orientation of hydraulic fracture propaga-tion. It was found that in some areas the hydraulic fractures propagated horizontally because S3 corre-sponded to the overburden stress, whereas in other
areas the fractures propagated vertically because S3corresponded to the least horizontal stress. In addi-tion, they observed that many of the wells with ver-tical fractures produced excessive volumes of CBM water (≥230 bbl/day) and little to no methane. For the wells analyzed in the Big George coal, ~70 per-cent of all the water produced was from only one third of the total number of Big George wells, all of which were characterized by vertical hydraulic frac-tures. Colmenares and Zoback (2007) hypothesized that the vertical fractures associated with the produc-tion of large volumes of water actually penetrate over-lying sand aquifers. Hence, the operators are draining the aquifers rather than the coals and are unable to efficiently depressurize the coal for methane produc-tion.
CBM production in Montana is on a much smaller scale than in the Wyoming part of the PRB. In 1990 there were 3 drilling permits issued in Montana and as of the end of 2006 there have been only ~1500 issued (Montana Board of Oil and Gas Conservation, 2007). Because of the limited CBM activities in the Montana part of the basin we have observed much smaller ground water drawdown than in the Wyoming part of the basin. Hence, when analyzing pore pressure changes with time for the 11 paired wells in Montana, only 5 of the 11 coals had significant decreases in pore pressure with time (between 50 (0.35 MPa) and 90 psi (0.61 MPa)) (Fig. 9). From our limited dataset it appears that at pres-
3200
3400
3600
3800
4000
4200
4400
4600
4800
5000
3200 3400 3600 3800 4000 4200 4400 4600 4800 5000
Hydro
static
Wate
r Table
Gro
und E
levation (
ft a
sl)
Fluid Elevation (ft asl)
A
Wyoming
3000
3200
3400
3600
3800
4000
4200
4400
4600
3000 3200 3400 3600 3800 4000 4200 4400 4600
Hydro
static
Wate
r Table
Gro
und E
levation (
ft a
sl)
Fluid Elevation (ft asl)
B
Montana
1402
914
1402914
1158
1158
Fluid Elevation (m asl)
Gro
und E
levatio
n (m
asl)
15241524
975
975
1250
1250
Fluid Elevation (m asl)
Gro
und E
levatio
n (m
asl)
Figure 5. Ground elevation versus fluid elevation in feet above sea level for A, Wyoming and B, Montana.
H. E. ROSS AND M. D. ZOBACK

Rocky Mountain Geology, v. 43, no. 2, p. 155–169, 13 figs., 1 table, November, 2008 163
ent overlying sand aquifers are not being drained through CBM pro-
duction. The greatest pore pres-sure decrease observed in overly-
ing sands is ~5 psi (0.035 MPa), compared with over 100 psi (0.69 MPa) observed in the Wyoming part of the basin (Figs. 7 and 9).
MODELING CBM WATER INJECTION INTO SAND AQUIFERS
From our pore pressure analy-sis it appears that most sand and coal units in the PRB have sub-hydrostatic pore pressures, which means that injection of CBM pro-duced water into sand aquifers should be feasible without pump-ing, as there should be no initial pressure resistance to injection.
With this in mind, we have constructed two 3D stochastic res-ervoir models of conceptualized sand units in the PRB (using geo-statistics to populate our models with sand permeability and poros-ity values) and have run fluid flow simulations to determine the rate at which water can be injected into the aquifers. The first model is of a shallow sand unit with depth to the top ranging 166–316 ft (51–96 m), and the second model is of a deeper sand body, with depth to the top ranging 1034–1184 ft (315–361 m). We modeled water injection into both shallow and deep sands because our pore pres-sure analysis showed that deeper sands and coals have lower initial pore pressures than the shallower sands and coals (Fig. 6), suggest-ing that we should be able to inject a larger volume of water into the deeper sands. In order to compare our results between the two sand units we kept the thickness the same for both, ~40 ft (12 m) (aver-age thickness of sands being moni-tored by the BLM monitoring wells), and populated the models
0
200
400
600
800
1000
1200
1400
1600
1800
2000
0 200 400 600 800 1000
Pressure (psi)
De
pth
(ft)
SvHydrostatic Pp
Hydro-50 psi
Hydro-150 psi
610
488
366
244
122
0
Depth
(m)
1.4 2.8 4.1 5.5 6.9
Pressure (MPa)
Coal
Sand
Key
Figure 6. Pore pressures for sands and coals monitored by the BLM after removing those wells in the databases whose initial water levels appear to have been affected by CBM production. Note that the pore pressures for the deeper coals and sands are much lower than hydrostatic compared to the shallower sands and coals. Sv corre-sponds to the overburden pressure and the black line is the overburden pressure gra-dient. The gray line corresponds to the hydrostatic pore pressure gradient (~0.433 psi/ft (0.0098 MPa/m)). The dashed gray lines correspond to the coal and sand pore pressure gradients, where hydro-50 psi means that the gradient is 50 psi (0.35 MPa) less than hydrostatic pressure, and hydro-150 psi means that the gradient is 150 psi (1 MPa) less than hydrostatic pressure. The black squares correspond to pore pressures in coal and the gray crosses to pore pressures in sand.
0
200
400
600
800
1000
1200
1400
1600
-20 -10 0 10 20 30 40 50 60 70 80 90 100 110 120
Change in sand Pp (psi)
Dis
tance fro
m c
oal (f
t)
Change in Sand Pore Pressure
427
305
183
61
0.13 0.28 0.41 0.55 0.69 0.83
Change in sand Pp (MPa)
Dis
tance fro
m c
oal (m
)
Figure 7. Separation between sand and coal pairs (in feet) vertically versus change in pore pressure (Pp) with time for monitored sands in Wyoming. The black dashed box highlights the sands with the greatest change in pore pressures, which are all within 200 ft (61 m) of a producing coalbed. Pint stands for initial pressure and Pfinal stands for final pressure. A positive change in pore pressure corresponds to a decrease in pore pressure with time.
COALBED METHANE WATER DISPOSAL, IN POWDER RIVER BASIN
164 Rocky Mountain Geology, v. 43, no. 2, p. 155–169, 13 figs., 1 table, November, 2008
200
250
300
350
400
450
500
550
600
650
7009/19/91 6/15/94 3/11/97 12/6/99 9/1/02 5/28/05
Calendar Time
MP2 WyodakMP2 sandMP22 WyodakMP22 sandPERSSON WyodakPERSSON sand457301 Anderson457301 sand447214 Wyodak447214 sand447131 Wyodak447131 sandPhyd
Hydrostatic Pp
Pp
(psi) w
rt a
datu
m a
t 1500 ft
400
450
500
550
600
650
700
750
3/11/97 12/6/99 9/1/02 5/28/05
Calendar Time
SASQ Big George
SASQ sand
NAPIER Big George
NAPIER sand
Phyd
Pp (
psi) w
rt a
datu
m a
t 1674 ft
Hydrostatic Pp
150
170
190
210
230
250
270
290
310
330
350
07/24/98 12/06/99 04/19/01 09/01/02 01/14/04 05/28/05 10/10/06
Calendar Time
REDS Canyon
REDS sand
Phyd
Hydrostatic Pp
Pp (
psi) w
rt a
datu
m a
t 738 ft
A
B
C
1.4
2.1
2.8
3.4
4.1
4.8
2.8
3.4
4.1
4.8
1.0
1.3
1.6
1.9
2.1
2.4
Pp
(MP
a) w
rt a d
atu
m a
t 457 m
Pp (M
Pa) w
rt a d
atu
m a
t 510 m
Pp
(MP
a) w
rt a d
atu
m a
t 225 m
Key
Key
Key
H. E. ROSS AND M. D. ZOBACK
Rocky Mountain Geology, v. 43, no. 2, p. 155–169, 13 figs., 1 table, November, 2008 165
with the same permeability and porosity values, which were distributed exactly the same throughout both models.
Each 3D model grid contains 16830 grid cells: 55 in the x direction, 51 in the y direction, and 6 in the z direction. Each grid cell is 67 ft (20 m) by 67 ft (20 m) by 7 ft (2m) and the total area of the model is ~160 acres (0.6 km2).
Applied Hydrology Associates and Greystone Environmental Consultants (2002) report mea-sured hydraulic conductivity values representative of fine- to medium-grained sand, which is the grain size given by Flores (2004) for sandstone reservoirs in the Wasatch and Fort Union Formations. Applied
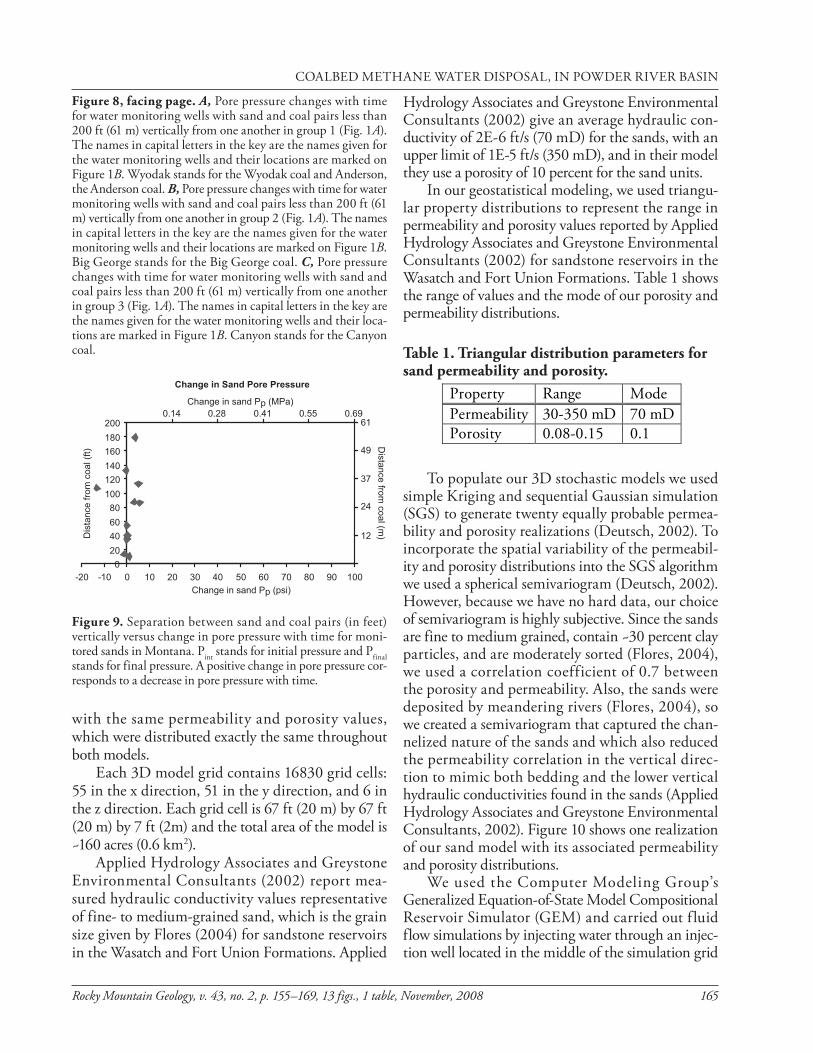
Hydrology Associates and Greystone Environmental Consultants (2002) give an average hydraulic con-ductivity of 2E-6 ft/s (70 mD) for the sands, with an upper limit of 1E-5 ft/s (350 mD), and in their model they use a porosity of 10 percent for the sand units.
In our geostatistical modeling, we used triangu-lar property distributions to represent the range in permeability and porosity values reported by Applied Hydrology Associates and Greystone Environmental Consultants (2002) for sandstone reservoirs in the Wasatch and Fort Union Formations. Table 1 shows the range of values and the mode of our porosity and permeability distributions.
Table 1. Triangular distribution parameters for sand permeability and porosity.
To populate our 3D stochastic models we used simple Kriging and sequential Gaussian simulation (SGS) to generate twenty equally probable permea-bility and porosity realizations (Deutsch, 2002). To incorporate the spatial variability of the permeabil-ity and porosity distributions into the SGS algorithm we used a spherical semivariogram (Deutsch, 2002). However, because we have no hard data, our choice of semivariogram is highly subjective. Since the sands are fine to medium grained, contain ~30 percent clay particles, and are moderately sorted (Flores, 2004), we used a correlation coefficient of 0.7 between the porosity and permeability. Also, the sands were deposited by meandering rivers (Flores, 2004), so we created a semivariogram that captured the chan-nelized nature of the sands and which also reduced the permeability correlation in the vertical direc-tion to mimic both bedding and the lower vertical hydraulic conductivities found in the sands (Applied Hydrology Associates and Greystone Environmental Consultants, 2002). Figure 10 shows one realization of our sand model with its associated permeability and porosity distributions.
We used the Computer Modeling Group’s Generalized Equation-of-State Model Compositional Reservoir Simulator (GEM) and carried out f luid flow simulations by injecting water through an injec-tion well located in the middle of the simulation grid
Figure 8, facing page. A, Pore pressure changes with time for water monitoring wells with sand and coal pairs less than 200 ft (61 m) vertically from one another in group 1 (Fig. 1A). The names in capital letters in the key are the names given for the water monitoring wells and their locations are marked on Figure 1B. Wyodak stands for the Wyodak coal and Anderson, the Anderson coal. B, Pore pressure changes with time for water monitoring wells with sand and coal pairs less than 200 ft (61 m) vertically from one another in group 2 (Fig. 1A). The names in capital letters in the key are the names given for the water monitoring wells and their locations are marked on Figure 1B.Big George stands for the Big George coal. C, Pore pressure changes with time for water monitoring wells with sand and coal pairs less than 200 ft (61 m) vertically from one another in group 3 (Fig. 1A). The names in capital letters in the key are the names given for the water monitoring wells and their loca-tions are marked in Figure 1B. Canyon stands for the Canyon coal.
0
20
40
60
80
100
120
140
160
180
200
-20 -10 0 10 20 30 40 50 60 70 80 90 100
Change in Sand Pore Pressure
Dis
tan
ce
fro
m c
oa
l (f
t)
Change in sand Pp (psi)
12
37
24
61
49
0.14 0.28 0.41 0.55 0.69
Change in sand Pp (MPa)
Dis
tan
ce
from
co
al (m
)
Figure 9. Separation between sand and coal pairs (in feet) vertically versus change in pore pressure with time for moni-tored sands in Montana. Pint stands for initial pressure and Pfinalstands for final pressure. A positive change in pore pressure cor-responds to a decrease in pore pressure with time.
Property Range ModePermeability 30-350 mD 70 mDPorosity 0.08-0.15 0.1
COALBED METHANE WATER DISPOSAL, IN POWDER RIVER BASIN

166 Rocky Mountain Geology, v. 43, no. 2, p. 155–169, 13 figs., 1 table, November, 2008
(the well is perforated for the entire thickness of the sand). In the shallower sand we assumed the reser-voir pressure was 60 psi (0.41.MPa) less than hydro-static, and in the deeper sand, 150 psi (1 MPa) less than hydrostatic (Fig. 6). All other parameters were assumed to be the same. The sands were modeled as semi-infinite in the horizontal direction with con-stant-pressure boundaries, but confined vertically.
We injected water at zero surface pressure (in other words, the water was allowed to flow into the sand under its own weight) only until the injection-well bottom hole pressure (BHP) reached hydrostatic pressure, where flow would no longer occur without pressurization. At this point, rather than the water flowing under gravity into the aquifer when reservoir pressures are below hydrostatic, the operators would need to pump the water down the injection well at a higher pressure than hydrostatic for it to flow into the aquifer and away from the well. Water could be injected into the sand aquifer until the reservoir pressure reaches the fracture pressure of the aquifer, and for the sands in the Wasatch and Fort Union Formations the fracture pressure should be higher
than hydrostatic for moderate levels of sub-hydro-static pore pressures (Zoback, 2007). Therefore, the hydrostatic BHP is a good point to stop injection, since injection costs would increase with the need to actually start pumping water into the aquifer when the hydrostatic pressure is exceeded to reach the frac-ture pressure.
Our simulations show that for the shallower sand, water can be injected at a rate of ~160 bbl/day for ~4000 days before the BHP reaches hydrostatic (Figs. 11 and 12A). In contrast, for the deeper sand, water can be injected at a rate of ~435 bbl/day for ~4000 days (Figs. 11 and 12B). These injection rates agree with the work of Lopez and Heath (2007), who identified potential channel sandstone units for water injection in the Montana part of the basin and cal-culated potential water injection rates for those sands using an analytical solution.
At present, the average water production rate per CBM well in the PRB is ~100 bbl/day (WOGCC, 2007) and the average lifetime of a CBM well is ~7 to 15 years (2555 to 5500 days) (Ayers, 2002; De Bruin et al., 2004). Therefore, if operators inject CBM pro-
Porosity Permeability (mD)
N
3417 ft
(1042 m)
3685 ft
(1123 m)
A B
Figure 10. A, Porosity and B, permeability distributions for one realization of our general sand model.
H. E. ROSS AND M. D. ZOBACK
Rocky Mountain Geology, v. 43, no. 2, p. 155–169, 13 figs., 1 table, November, 2008 167
duced water into shallow sands, they will be able to dispose of the water production from one and a half CBM wells every 160 acres (0.6 km2) using one dis-posal well (assuming the sand properties through-out the basin are similar to those in our model). If injection were to take place in deeper sands, opera-
tors would be able to dispose of the water production from four CBM wells every 160 acres (0.6 km2) using one disposal well.
In Figure 11 we have marked the water injec-tion rate achievable in our two different sand models and have also plotted the average water production in bbl/day for CBM wells analyzed by Colmenares and Zoback (2007) and Ross (2007). Colmenares and Zoback (2007) looked at over 500 water-enhance-ment tests that are used by CBM operators in the PRB to connect the natural coal fracture network to their CBM wells. As mentioned above, Colmenares and Zoback (2007) showed that water enhancement actu-ally hydraulically fractures the coal and in some areas the fractures grow horizontally and in other areas they propagate vertically. They also found a correla-
0
10
20
30
40
50
60
70
80
900
10
0
20
0
30
0
40
0
50
0
60
0
70
0
80
0Water Production Rate (bbl/day)
Water Production Rate From CBM Wells
Observed average water production
per CBM well in the PRB
Predicted water injection rate into
shallow sand (~160 bbl/day)
Predicted water injection rate
into deep sand
(~435 bbl/day)
No. of C
BM
Wells
Figure 11. Water production rate per well for CBM wells ana-lyzed by Colmenares and Zoback (2007) and Ross (2007), compared with the injection rates obtained from fluid f low simulations for our shallow- and deep-sand models. Average CBM water production for the PRB is from the WOGCC (2007).
450
460
470
480
490
500
510
0 1000 2000 3000 4000
Hydrostatic pressure
BHP
(psi)
Days
Deep Sand
120
130
140
0 1000 2000 3000 4000
Days
BH
P (
psi)
Hydrostatic pressure
Shallow SandA
B
0.97
0.90
0.83
3.5
3.4
3.2
3.1
BH
P (M
Pa)
BH
P (M
Pa)
Figure 12. Bottom hole injection pressure (BHP) for the A,shallow and B, deep sand models.
300
400
500
600
700
800
900
0 1000 2000 3000 4000 5000
Time (days)
Time (days)
Wate
r In
jection R
ate
(bbl/day)
Wate
r In
jection R
ate
(bbl/day)
Deep Sand
Shallow Sand
A
B
100
150
200
250
300
350
0 1000 2000 3000 4000 5000
Figure 13. A, Water injection rate (bbl/day) results from 20 realization runs for the deep sand model. B, Water injection rate (bbl/day) results from 20 realization runs for the shallow sand model. The black lines correspond to the base case results for both models.
COALBED METHANE WATER DISPOSAL, IN POWDER RIVER BASIN
168 Rocky Mountain Geology, v. 43, no. 2, p. 155–169, 13 figs., 1 table, November, 2008
tion between fracture orientation and water and gas production from CBM wells. Wells with horizontal hydraulic fractures typically produce small volumes of both gas and water, whereas some wells with verti-cal hydraulic fractures produce manageable volumes of water (and are good gas producers). However, ~30 percent of wells with vertical hydraulic fractures pro-duce excessive volumes of water and little to no gas, apparently because the vertical fractures propagated out of the coal and into adjacent sands. Colmenares and Zoback (2007) define excessive water production as ≥ 230 bbl/day. From Figure 11 we see that deeper sand aquifers will need to be used as water disposal sites for CBM wells with excessive water production, as the shallower sands do not have adequate capacity.
As mentioned earlier, we generated twenty sand porosity and permeability realizations to capture the uncertainty in our knowledge of the sand geol-ogy in the PRB. The results from our twenty realiza-tion runs are shown in Figure 13. The range in water injection rate due to uncertainty in the permeability and porosity distributions for the deep sand model is ~400 to ~510 bbl/day and the range in injection rate for the shallow sand model is ~150 to ~190 bbl/day. The black lines correspond to the base case results reported in Figure 11, which are towards the lower end of each range. We note that the spread in injec-tion rates from our uncertainty in the sand geology is not great, although additional constraints on res-ervoir properties would help limit the uncertainty in predicted injection rates.
CONCLUSIONS
Through the analysis of water-level data from water-monitoring wells located in both Montana and Wyoming, we have determined that sands and coals in the PRB have sub-hydrostatic pore pressures. In addition, pore pressure changes with time reveal that at present ~60 percent of sands less than 200 ft (61 m) vertically from underlying/overlying coals appear to be in hydraulic communication with the coalbeds. In contrast, sand aquifers that are separated by more than 200 ft (61 m) from producing coalbeds show no change in pore pressure after 8 to 13 years of water level monitoring. These findings have important implications for the disposal of CBM water through injection into sand aquifers. The occurrence of sub-hydrostatic pore pressures means that the sands have
the capacity to store water, but to insure that the dis-posed water does not reach producing coalbeds in the future, we recommend that sands closer than ~200 ft (61 m) to producing coals should not be used as dis-posal sites because they may be in hydraulic commu-nication with the coalbeds.
Furthermore, we ran fluid flow simulations to determine the rates at which water could be injected into shallow (~300 ft (91 m)) and deep (~1000 ft (305 m)) aquifers. Our simulations offer a hypothesis of what might be achieved by water injection. Actual injection rates on average may be lower or higher depending on any bias in our geostatistical model assumptions. Also, operational limitations and formation plugging could limit injection rates below the modeled rates. We found that for the shallow sand model an injection water rate of ~160 bbl/day could be achieved, whereas for the deeper sand, whose pore pressures are lower than the shallow sand, the rate was ~435 bbl/day. Both these rates are higher than the average water production rate from CBM wells in the PRB, which is ~100 bbl/day. This implies that for deep aquifer injection sites, only one injection well would be required to dispose of the water produced from four CBM wells, reducing the cost of water disposal.
ACKNOWLEDGMENTS
Funding for this study came from the Produced Water Management and Beneficial Use project, DE-FC26-05NT15549, directed by Dag Nummedal. We thank Nummedal and the other researchers on this project for their helpful discussions and insights during this study. We are also grateful for com-ments and suggestions from David Lopez and Arthur O’Hayre that greatly improved this manuscript. We thank John Wheaton, from the Montana Bureau of Mines and Geology, and Mike McKinley, from the Bureau of Land Management, Buffalo, Wyoming, for providing the water-level monitoring data used in our analysis.
REFERENCES CITED
Advanced Resources International, Inc., 2002, Powder River Basin coalbed methane development and produced water management: DOE/NETL-2003/1184, 213 p.
Appl ied Hydrolog y A ssociate s , Inc . and Greystone Environmental Consultants, Inc., 2002, Ground water
H. E. ROSS AND M. D. ZOBACK

Rocky Mountain Geology, v. 43, no. 2, p. 155–169, 13 figs., 1 table, November, 2008 169
modeling of impacts associated with mining coal bed methane development in the Powder River Basin: Technical Report Powder River Basin Oil and Gas Environmental Impact Statement, U.S. Bureau of Land Management, Buffalo Field Office, 288 p.
Ayers, W., 2002, Coalbed gas systems, resources, and pro-duction and a review of contrasting cases from the San Juan and Powder River basins: American Association of Petroleum Geologists Bulletin, v. 86, p. 1853–1890.
Bartos, T. T., and Ogle, K. M., 2002, Water quality and envi-ronmental isotopic analyses of ground-water samples col-lected from the Wasatch and Fort Union Formations in areas of coalbed methane development—Implications to recharge and ground-water f low, Eastern Powder River Basin, Wyoming: U.S. Geological Survey Water-Resources Investigations Report 02-4045, 88 p.
Colmenares, L. B., and Zoback, M. D., 2007, Hydraulic fractur-ing and wellbore completion of coalbed methane (CBM) wells in the Powder River Basin, Wyoming: Implications for Water and Gas Production: American Association of Petroleum Geologists Bulletin, v. 91, p. 51–67.
Daddow, P. B., 1986, Potentiometric-surface map of the Wyodak-Anderson coal bed, Powder River structural basin, Wyoming, 1973-84: U.S. Geological Survey Water-Resources Investigations Report 85-4305, scale 1:250,000, 1 sheet.
De Bruin, R. H., Lyman R. M., Jones, R. W., and Cook, L. W., 2004, Coalbed methane in Wyoming: State of Wyoming Geological Survey Information Pamphlet 7, 23 p.
Deutsch, C. V., 2002, Geostatistical reservoir modeling: New York, Oxford University Press, Inc., 386 p.
Environmental News Network, 2001, Coalbed methane boom in Wyoming’s Powder River Basin, <http://www.enn.com/archive.html?id=25012&cat=archives>, accessed April 2007.
Flores, R. M., 2004, Coalbed methane in the Powder River Basin, Wyoming and Montana: An assessment of the Tertiary-Upper Cretaceous coalbed methane total petro-leum system: U.S. Geological Survey Digital Data Series DDS-69-C, chapter 2, 56 p.
Flores, R. M., and Bader, L. R., 1999, Fort Union coal in the Powder River Basin, Wyoming and Montana: A synthe-sis: U.S. Geological Survey Professional Paper 1625-A, p. PS8–PS29.
Freeze, R. A., and Cherry, J. A., 1979, Ground Water: Upper Saddle River, New Jersey, Prentice-Hall, Inc., 604 p.
Hower, T. L, Jones, J. E., Goldstein, D. M., and Harbridge, W., 2003, Development of the Wyodak coalbed methane resource in the Powder River Basin: Society of Petroleum Engineers (SPE) 84428, presented at the SPE Annual Technical Conference and Exhibition, Denver, Colorado, October 5–8.
Linder-Lunsford, J. B., and Wilson, J. F., 1992, Shallow ground water in the Powder River Basin, northeastern Wyoming—Description of selected publications, 1950–91, and indi-cations for further study: U.S. Geological Survey Water-Resources Investigations Report 91-4067, 71 p.
Lopez, D. A., and Heath, L. A., 2007, CBM-produced water disposal by injection, Powder River Basin, Montana: Montana Bureau of Mines and Geology Report of Investigation 17, 30 p.
Montana Board of Oil and Gas Conservation (MBOGC), 2007, <http://bogc.dnrc.state.mt.us/>, accessed March 2007.
Ross, H. E., 2007, CO2 sequestration and enhanced coal-bed methane recovery in unmineable coalbeds of the Powder River Basin, Wyoming [Ph.D. dissert.]: Stanford, California, Stanford University, 202 p.
The Ruckelshaus Institute of Environment and Natural Resources, 2005, Water production from coalbed methane development in Wyoming: A summary of quantity, qual-ity and management options: Final report prepared for the Office of the Governor, State of Wyoming, <http://www.uwyo.edu/enr/ienr/cbm.asp>, accessed February 2007.
Wheaton, J., and Metesh, J. J., 2002, Potential ground-water drawdown and recovery from coalbed meth-ane development in the Powder River Basin, Montana: Project Completion Report to the U.S. Bureau of Land Management, Montana Bureau of Mines and Geology Open File Report 458, 59 p.
Wheaton, J., and Donato, T., 2004, Coalbed-methane basics: Powder River Basin, Montana: Montana Bureau of Mines and Geology Information Pamphlet 5, 25 p.
Wyoming Oil and Gas Conservation Commission (WOGCC), <http://wogcc.state.wy.us/>, accessed between 2004 and 2007.
Zoback, M. D., 2007, Reservoir geomechanics: Cambridge, UK, Cambridge Press, 449 p.
M S A 31, 2007
R M S J 22, 2008
M A A 4, 2008
COALBED METHANE WATER DISPOSAL, IN POWDER RIVER BASIN