
Su stainability and company performance: Evidence from the ... dissertation.pdf · Linköping...
191
Linköping Studies in Science and Technology Dissertations No. 1698 Sustainability and company performance: Evidence from the manufacturing industry Lujie Chen 2015 Division of Production Economics Department of Management and Engineering Linköping University, SE-581 83 Linköping, Sweden
Transcript of Su stainability and company performance: Evidence from the ... dissertation.pdf · Linköping...

Linköping Studies in Science and Technology
Dissertations No. 1698
Sustainability and company performance:
Evidence from the manufacturing industry
Lujie Chen
2015
Division of Production Economics
Department of Management and Engineering
Linköping University, SE-581 83 Linköping, Sweden

© Lujie Chen
Sustainability and company performance: Evidence from the manufacturing industry Linköping Studies in Science and Technology, Dissertations, No. 1698 ISBN: 978-91-7685-967-4 ISSN: 0345-7524 Printed by: LiU-Tryck, Linköping Distributed by: Linköping University Department of Management and Engineering SE-581 83 Linköping, Sweden Tel: +46 13 2810

i
Abstract This dissertation approaches the question of sustainability and its influence on company
performance, with special focus on the manufacturing industry. In the contemporary production
environment, manufacturing operations must take into account not only profit, but also
environmental and social performance, in order to ensure the long-term development of the
company. Companies have to decide whether they should allocate resources to environmental and
social practices in order to improve their competitive advantage. Consequently, in decision-making
processes concerning operations, it is important for companies to understand how to coordinate
profit, people, and planet.
The objective of this dissertation was to investigate the current situation regarding manufacturers’
sustainable initiatives, and to explore the relationship between these sustainable practices and
companies’ performance, including financial performance, operational performance, innovation
performance, environmental performance, and social performance. First of all, a structured
literature review was conducted to identify sustainable factors considered to be important in the
decision making of manufacturing operations. The findings were synthesized into a conceptual
model, which was then adopted as the basis for designing the survey instrument used in this
dissertation. Drawing on Global Reporting Initiative (GRI) reports, empirical research was
performed to explore the relationship between environmental management practices and company
performance. Interestingly, the findings showed that many environmental management practices
had a strong positive impact on innovation performance. Sustainability disclosures and financial
performance were further analyzed using extended data from the GRI reports. The results also
showed that several social sustainability indicators, such as product responsibility, human rights,
and society, displayed a significant and positive correlation with return on equity in the sample
companies.
In order to further explore the research area and to verify these findings, a triangulation approach
was adopted and new data were collected via a survey conducted among middle and large sample
companies in the Swedish manufacturing industry. The results indicated that the sustainable
improvement practices had a positive impact on company performance. Some environmental and
social improvement practices had a direct and positive correlation with product and process
innovation. Furthermore, findings suggested that better cooperation with suppliers on environmental
work could help to strengthen the organizational green capabilities of the focal companies.
When considering the company’s general approach to implementing sustainable practices, some
interesting findings emerged. There were limited significant differences in sustainable practices
when comparing different manufacturing sectors, and different countries and regions. However, the
results showed that Swedish manufacturing companies often place higher priority on implementing
economic and environmental sustainability practices than on social ones.

ii
This dissertation contributes to the literature on manufacturing sustainability. The study expands the
understanding of how environmental, social, or economic perspectives as a triple bottom line can
influence company performance and to a certain extent the supply chain. Identifying and
understanding such relationships gives companies the opportunity to integrate sustainability into
their manufacturing operations strategy in order to sustain their manufacturing operations over the
long term.
Keywords: empirical research, sustainable practices, company performance
iii
Svensk sammanfattning Denna avhandling tar sig an frågan om hållbarhet och dess påverkan på hur företag presterar, med
ett särskilt fokus på tillverkningsindustri. I dagsläget har produktionen inte bara kravet att skapa
vinster utan också att prestera väl med liten miljöpåverkan samt under goda sociala omständigheter,
för att säkerställa företagets långsiktigt hållbara utveckling. Företag måste besluta sig för i vilken
omfattning miljömässiga och sociala satsningar ska ske för att öka sin konkurrenskraft i olika
avseenden. I beslutsprocessen för hur ett företag ska bedriva sin verksamhet måste företaget i fråga
därför förstå hur balansen mellan vinst, människa och planet, bör hanteras.
Syftet med denna avhandling är att undersöka den nuvarande situationen för den
tillverkningsindustrin med avseende på dess åtaganden för hållbar utveckling. Därtill har
avhandlingen för avsikt att utforska förhållanden mellan hur företag praktiskt arbetar med
hållbarhetsfrågor och hur det hänger samman med företagets prestation i olika avseenden såsom:
finansiellt, operationellt, innovationsmässigt, miljömässigt och socialt. Till att börja med genomförs
en strukturerad litteraturgranskning för att identifiera de nyckelfaktorer som anses vara viktiga för
beslutsfattare i producerande verksamhet. Resultatet från litteraturgranskningen används sedan för
att utforma en konceptuell modell som sedermera används som utgångspunkt i utformningen av en
enkätstudie som genomförs i denna avhandling. Dessutom genomförs en empirisk studie baserat på
företagens hållbarhetsredovisningar (på engelska: Global Reporting Initiative, GRI) för att utforska
förhållanden mellan hur företagen arbetar med miljöledning och hur detta påverkar företagens
prestation. Intressant nog visas att det finns en positiv korrelation mellan många delar av
miljöledningsarbetet och en förbättrad innovationsförmåga. Hållbarhetsfrågorna och finansiell
prestation analyseras också djupare genom att nyttja utökad data från hållbarhetsredovisningarna.
Detta visar att många hållbarhetsfrågor såsom: produktansvar, mänskliga rättigheter, och samhälle
signifikant korrelerar med avkastningen på eget kapital bland de företag som studerats.
För att vidare utforska forskningsområdet och verifiera avhandlingens resultat, genomförs med ett
metodmässigt triangulärt förhållningssätt ytterligare en enkätstudie bland stora och medelstora
tillverkande svenska företag. Resultaten indikerar att förbättringar i hållbarhetsavseenden kan ge
positiva resultat för företagens prestationer. Vissa förbättringsåtgärder i socialt och miljömässigt
avseende har en direkt positiv korrelation med produkt- och processinnovation. Vidare kan
miljömässigt samarbete med leverantörer stärka gröna organisatoriska förmågor hos företaget i
fråga.
Intressanta slutsatser kan också dras utifrån hur företagens generella angreppssätt i arbetet med
hållbarhetsfrågor. Det är begränsade signifikanta skillnader i arbetet med hållbarhetsfrågor vid
jämförelse mellanolika sektorer inom återanvändning, olika länder och regioner. Däremot
prioriterar ofta svenska tillverkande företag implementering av rutiner för ekonomisk och
miljömässig hållbarhet i högre utsträckning än motsvarande inom socialhållbarhet.
Denna avhandling bidrar till litteraturen inom hållbar produktion. Studien ger en förståelse för hur
miljömässiga, sociala och ekonomiska perspektiv, kan påverka företagens prestation och i viss mån
även dess försörjningskedja. Att identifiera och förstå dessa förhållanden ger företagen bättre

iv
möjligheter att integrera hållbarhetsfrågor med utvecklingen av sina produktions- och
verksamhetsstrategier, vilket i sin tur kan göra företagens tillverkande verksamhet hållbar i det
långa loppet.
Nyckelord: empirisk forskning, arbete med hållbarhetsfrågor, företags prestation

v
Acknowledgments First and foremost, I would like to thank my main supervisor Professor Ou Tang, who has helped
me a lot throughout my academic training with his motivation, guidance, knowledge, and patience.
He is such a good supervisor who always provides me with wise suggestions. His enthusiasm for
research and life has also inspired me how to contribute productively to family and society.
I also want to thank my co-supervisor Dr. Andreas Feldmann at KTH (Royal Institute of
Technology). It is my honor to be his first PhD student. Dr. Andreas Feldmann helped me
especially with the survey component of this dissertation. I would not have been able to complete
such a large-scale survey in Sweden without his help.
I sincerely thank Professor Jan Olhager at Lund University for giving me the precious opportunity
to be involved in the Vinnova project and to be a PhD student at Linköping University. Professor
Jan Olhager was my main supervisor for my first year of PhD study, and he also taught me how to
write a good research paper. Thanks to him, I have developed a great interest in research in the
Operations Strategy field.
Besides my supervisors, I would like to thank Professor Xiande Zhao at China Europe International
Business School for sharing a lot of interesting research information with me at academic
conferences. He has shown me how to be a pioneer and active researcher in the empirical research
field.
My sincere thanks also go to Mr. Jan Johansson at Partner Tech and Ms. Agneta Ring at Toyota
Material Handling for supporting my research and helping me to do something interesting in the
industry.
Thanks to my colleagues at Production Economics. You have shown me a good time and an
enjoyable work life.
Thanks to my Chinese friends in Sweden for making every day in Sweden interesting and lovely.
Lastly, I would like to give the biggest thanks to my dear mother, Linling Li, for all her love and
encouragement in my life. I would not have been able to accomplish anything without her support.
She is the best mother in the world.
To my husband, Yixuan: thank you from the bottom of my heart for accompanying me all the way.
Without your encouragement and support, I would probably have given up on my PhD study.
Thanks for your daily care and love, which I shall appreciate for my whole life.
To my father, Yuxiang Chen, who is already in Heaven: I will always remember you. I hope that
each of my little achievements can make you happy.

vi

vii
List of Publications Dissertation outline
The dissertation entitled Sustainability and company performance: Evidence from the
manufacturing industry is a summary of the author’s studies in the doctoral research program in the
Division of Production Economics, Department of Management and Engineering at Linköping
University.
This dissertation includes two parts, the introductory part as well a selection of five papers. The
current statues of appended papers are displayed in the following list.
Paper 1:
Chen, L., Olhager, J., & Tang, O. (2014). Manufacturing facility location and sustainability: A
literature review and research agenda. International Journal of Production Economics, 149, 154-163.
An early version of this paper was presented at 17th International Working Seminar on Production
Economics, February 20-24, 2012, Innsbruck, Austria
Paper 2:
Chen, L., Tang, O., & Feldmann, A. (2014). Applying GRI reports for the investigation of
environmental management practices and company performance in Sweden, China and India.
Journal of Cleaner Production, 98, 36-46.
An early version of the paper was presented at 18th Greening of Industry Network Conference,
Linköping, Sweden
Paper 3:
Chen, L., Feldmann, A., & Tang, O. (2015).The relationship between disclosures of corporate social
performance and financial performance: Evidences from GRI reports in manufacturing industry.
International Journal of Production Economics, accepted, DOI: 10.1016/j.ijpe.2015.04.004
An early version of this paper was presented at 18th International Working Seminar on Production
Economics, February 20-24, 2014, Innsbruck, Austria
Paper 4:
Chen, L., Feldmann, A., & Tang, O. (2014). An empirical evaluation of sustainable operations
practices and performance in Swedish manufacturing industry. Submitted to Journal of Cleaner
Production
An early version of the paper was presented at the 21th
International Annual EurOMA Conference,
20-25 June, 2014, Palermo, Italy.
Paper 5:
Chen, L., & Tang, O. (2015). Does the supplier involvement affect manufactures’ sustainability?
Submitted to Journal of Business Ethics
Received Purchasing & Supply Management Best Paper Award at 6th
European Decision Sciences
Institute Conference, 31 May to 3 June 2015, Taormina, Italy.

viii

ix
Table of Contents 1. Introduction ................................................................................................................................... 1
1.1 Sustainability and company performance ................................................................................... 1
1.2 Research objectives ..................................................................................................................... 5
1.3 Research design and limitations .................................................................................................. 6
2. Research Methodology .............................................................................................................. 10
2.1 Literature review ....................................................................................................................... 10
2.2 Secondary data analysis ............................................................................................................ 12
2.3 Survey ....................................................................................................................................... 13
2.4 Data analysis method ................................................................................................................ 15
2.5 Research quality ........................................................................................................................ 16
2.5.1 Validity ............................................................................................................................... 16
2.5.2 Reliability ........................................................................................................................... 17
3. Theoretical Framework ............................................................................................................ 19
3.1 Sustainability at company level ................................................................................................. 19
3.2 The relationship between sustainbility and company performance .......................................... 20
3.3 Related organizational theory .................................................................................................... 25
3.3.1 Institutional theory ............................................................................................................. 26
3.3.2 Stakeholder theory .............................................................................................................. 27
3.3.3 Resource dependence theory .............................................................................................. 28
3.3.4 Ecological modernization theory (“win-win” principle) .................................................... 29
4. Overview and Summary of Papers ........................................................................................ 31
4.1 Paper 1 – Manufacturing facility location and sustainability–a literature review and
research agenda ............................................................................................................................... 31
4.2 Paper 2 –Applying GRI reports for the investigation of environmental management
practices and company performance in Sweden, China and India .................................................. 32
4.3 Paper 3 – The relationship between disclosures of corporate social performance and
financial performance: Evidences from GRI reports in manufacturing industry ............................ 33
4.4 Paper 4 –An empirical evaluation of sustainable operations practices and performance
in the Swedish manufacturing industry ........................................................................................... 35
4.5 Paper 5 – Does supplier involvement affect Swedish manufacturers’ sustainability? .............. 36

x
5. Discussions and Conclusions ................................................................................................... 38
5.1 Discussions ................................................................................................................................ 38
5.2 Conclusions ............................................................................................................................... 40
5.3 Future research .......................................................................................................................... 43
References ........................................................................................................................................ 45
Appendix A-English translation of questionnaire .................................................................. 57
Appendix B-The author’s contributions to the appended papers ....................................... 67

1
1. Introduction
In the manufacturing industry, the concern over sustainability is greater than ever. In
addition to facing high-pressure competition, manufacturers must increasingly pay attention
to resource usage, waste treatment, air emissions, water pollution, employee welfare, and so
on. Failing to manage these sustainability issues can substantially damage the image of the
company and thus affect its performance. For instance, Apple Inc. has been blamed for
using child labor in producing its iPhones and Macintosh computers; the Coca-Cola
Company has been defamed for damaging local water resources in India; Dell Inc. has been
criticized for disposing of electronic waste in an environmentally unfriendly way
(Parmigiani et al., 2011); Chinese dairy manufacturers have suffered from environmental
and safety crises (Chen et al., 2014). These companies’ misbehaviors in their environmental
and social management have affected their company performance and destroyed their
reputation in some cases. These examples indicate the importance of understanding
sustainability management and its relationship to the company’s reputation and
performance.
1.1 Sustainability and company performance
In 1987, the Brundtland Report first provided the concept of sustainability development,
describing it as “a development that meets the needs of the present without compromising
the ability of future generations to meet their own needs” (WCED, 1987, p. 45).
Kleindorfer et al. (2005, p. 485) developed the concept of sustainable operations
management, which is defined as integrating “the profit and efficiency orientation of
traditional operations management with broader considerations of the company’s internal
and external stakeholders and its environmental impact.” There has been a lack of
consensus regarding the definition of sustainable supply chain management (SSCM; see
Krause et al., 2009). The literature has emphasized the complex nature of supply chains and
the difficulty in providing cross-industry framework due to the wide spectrum of issues
affecting different sectors (Pullman et al., 2009).
Furthermore, there are different ways to measure company performance. A common
categorization has been to divide performance into financial and non-financial performance
(Ittner, 2008). Traditional accounting measurements of financial performance have

2
included sales growth, return on equity (ROE), earnings before interest and taxes (EBIT),
and return on investment (ROI), among others (Eldenburg at al., 2010; Orlitzky, 2011;
Zahra, 1995). Such financial measurements often measure an organization’s profitability.
On the other hand, innovation performance, market share, and other operational key
performance indicators (KPIs) are usually applied to measure non-financial performance
(Hyvönen, 2007). Moreover, in the sustainability research literature, scholars have argued
that company performance should have a broad scope that includes a triple bottom line,
instead of only focusing on a single aspect of company performance, such as financial
performance. More specifically, company performance refers to environmental
performance, social performance, economic performance, operational performance, and
innovation performance.
In light of these developments, the perspectives on manufacturing companies’ operations
have expanded from economic to environmental and social aspects in current trends.
Manufacturing companies are not only aiming to improve operations in terms of flexibility,
delivery, quality, and cost, but also attempting to be competitive in terms of environmental
and social issues (Caniëls et al., 2013; Vachon and Klassen, 2008). For companies
operating in a competitive global environment, studying sustainability issues is necessary
and should be prioritized in the decision-making processes by company management.
Otherwise, companies will not be able to maintain their competitive advantage in the long
run (López et al., 2007). However, there is still a question as to whether investments in
environmental management practices and other corporate social responsibility (CSR)
initiatives offer direct returns in terms of improvements to a company’s performance.
Several studies have supported the notion that there is a positive relationship between
sustainable practices and better company performance. Initial research by Spicer (1978)
indicated that there was a medium to strong association between financial indicators, such
as profitability, and some environmental indicators, such as pollution control, especially for
the pulp and paper industry. Further research by Zhu et al. (2012), among others (e.g., Hart,
2005; Shrivastava, 1995), has supported this conclusion, suggesting that improved
environmental and social practices can help companies to gain competitive advantage and
subsequently improve their performance. Hart (1995) used a natural-resource-based view to

3
explain the above link. The central idea of the natural-resource-based view is that
companies that foster and maintain good relationships with the ecosystem can achieve
sustainable competitive advantage from their efficient usage of natural resources.
Shrivastava (1995) further argued that such a positive relationship can be facilitated
through technology transfer, total quality environmental management, and so on. Zhu and
Sarkis (2004) conducted empirical research on the Chinese manufacturing industry,
concluding that significant relationships exist between overall green supply chain
management practices and environmental and economic performance. Montabon et al.
(2007), Russo and Fouts (1997), Wu and Pagell (2011), and Hofer et al. (2012) have all
supported the premise that environmental management practices can lead to innovation.
Innovation, in turn, can help companies to increase their market share and to reduce their
costs, resulting in greater financial gains.
At the same time, some studies have supported the opposite claim that there is a negative
relationship between sustainable initiatives and company performance. The main argument
here is that sustainable initiatives often increase operational costs and boost product prices,
thus having a negative impact on financial performance and market share (Brammer and
Millington, 2008; Cornell and Shapiro, 1987; Friedman, 2007; Tang et al., 2012; Walley
and Whitehead, 1994; Williams et al., 1993).
However, only a few studies have focused on the manufacturing industry, despite the fact
that the manufacturing industry contributes significantly to the world’s economy. Moreover,
the manufacturing industry plays a crucial role in global sustainability, contributing
substantially to labor employment, resource consumption, and energy usage. Meanwhile,
manufacturers are facing more regulatory restrictions and greater pressures in terms of raw
material consumption, energy usage, and employee welfare. Manufacturers must deal with
pollution risks during production processes, and various demands from investors, NGOs,
governments, customers, and other stakeholders. Therefore, it is necessary to conduct in-
depth investigations into the relationship between sustainability and company performance
in the manufacturing industry. According to the APICS (2005, p. 65) dictionary, the
manufacturing industry is defined as “a series of interrelated activities and operations

4
involving the design, material selection, planning, production, quality assurance,
management, and marketing of discrete consumer and durable goods.”
In addition to examining the manufacturing industry, the scope of this study is extended
from a company level to a supply chain level, considering the impact of suppliers and other
members of the supply chain. Understanding the link between sustainability and
performance in this case is important in industrial practices. According to Carter and
Rogers (2008, p. 368), sustainable supply chain is defined as “the strategic, transparent
integration and achievement of an organization’s social, environmental, and economic
goals in the systemic coordination of key interorganizational business processes for
improving the long-term economic performance of the individual company and its supply
chains.” Given the complexity of the current global operations environment, focal
companies in supply chains should integrate suppliers into their consideration of strategy
development. Otherwise, focal companies may face a variety of risks, such as
environmental, economic, and social risks (Tang and Musa, 2011). For instance, the focal
companies in developed countries such as Sweden are now outsourcing their production
overseas. However, are their suppliers adhering to proper environmental and social
standards? Do suppliers cooperate efficiently with the focal companies in terms of their
environmental and other CSR practices? These questions are critical; if there is
mismanagement of sustainable work on the part of the supplier, the focal company can face
serious punishment. For example, IKEA suffered from the scandal of horse meat being
found in its “Köttbullar” line of meatballs (Stanciu et al., 2013); Samsung was blamed for
their Chinese suppliers using child labor (Zutshi et al., 2009); Nike had to face the issue of
local pollution caused by its suppliers (Parmigiani et al., 2011).
Questions remain, which have not been clearly answered by previous empirical studies.
Specifically, it is important to investigate the different patterns of environmental
management practices in developing and developed countries; the relationship between
sustainability performance and a company’s innovation capabilities; the relationship
between a company’s strategy and its sustainable practices and performance; the impact of
a company’s mapping methods on its sustainability strategy and targets; the companies’
status with respect to sustainability and their general approaches toward implementing

5
sustainable practices, including the economic, environmental, and social ones. In effect,
what are the specific environmental practices and other social responsibility practices that
lead clearly to greater returns in terms of financial performance? The dissertation thus
adopts an empirical research methodology and attempts to answer the above questions by
investigating companies in the manufacturing industry.
1.2 Research objectives
This dissertation aims at investigating the relationship between sustainability and company
performance in the manufacturing industry from an operations management perspective.
Operations management can be defined as “the activities that transform inputs into finished
goods and services” (APICS, 2005, p. 76). The overall research objective is to examine the
relationships between sustainability improvement practices and a company’s performance
in terms of the triple bottom line of economic, environmental, and social performance, as
well as operational performance and innovation performance. These relationships are
investigated both for a single company and at the supply chain level. In order to achieve
this objective, sustainability factors and general approaches in implementing sustainable
practices need to be identified and comprehended. Moreover, the difference between
developed and developing countries and regions, different sectors of the manuacturing
industry, and the involvement of suppliers should also be investigated.
More specifically, to fulfil the study’s objective, the following research questions are
explored.
Research question 1: What sustainability issues and factors are considered to be important
for supply chain and operations management?
Research question 2: What is the status of sustainable practices in the manufacturing
industry, and what general approaches are being used for implementing such practices,
including economic, environmental, and social ones?
Research question 3: What is the relationship between sustainable practices and company
performance, with the latter including environmental performance, social performance,
economic performance, operational performance, and innovation performance?
Research question 4: What are the current sustainable operations practices and
performance in the Swedish manufacturing industry? In particular, how are Swedish

6
manufacturers configuring their sustainability strategies, and does supplier involvement
affect Swedish manufacturers’ sustainability?
1.3 Research design and limitations
In order to provide an overview of the papers appended to this dissertation, Table 1 presents
the study objective, general ideas, research methods, and data sources of each paper. The
relationship among these papers is briefly described below.
Paper 1 presents a comprehensive literature review of related studies on sustainability and
facility location. Drawing on the knowledge gathered from literature, this paper investigates
how sustainability aspects are included in the decision making concerning manufacturing
facility locations and the role of location in evaluating manufacturing sustainability. This
literature review provides a synthesized framework for examining sustainability, along with
some basic theoretical knowledge and a research agenda. Even though manufacturing
location is not the focus of this dissertation, it is a typical problem for operations
management. Thus, the framework presented should still be valid for companies with
manufacturing operations as their business focus. Furthermore, this framework serves as
the theoretical background for the survey design and data collection in Paper 4 and Paper 5.
Although laws and regulation can be the main drivers for companies to adopt sustainability
practices, we still need to understand which environmental management practices (EMPs)
have positive correlations with company performance. The result will affect the company’s
operations strategy and determine how to best allocate resources in green initiatives.
Another question is whether these EMPs differ across countries, which is especially useful
knowledge for multinational companies operating in a global environment. In Paper 2, the
relationship between EMPs and company performance is mapped and analyzed. The data
are collected from a content analysis of standard environmental data from Global Reporting
Initiative (GRI) reports and financial reports of the sample companies. The analysis and
comparison study are conducted in different sub-sectors of the manufacturing industry, as
well as in developed and developing countries.

7
Table 1. A brief presentation of the appended five papers
Paper
Number
Main topic Research
methods
Statistical analysis
method
Data source
Paper 1 Manufacturing facility
location and
sustainability
Literature
review
None 81 related articles
Paper 2 Environmental
management practices
and company
performance
Secondary
data
analysis
Non-parametrical
Kruskal–Wallis one-way
ANOVA test, Spearman’s
rho test for correlation
37 manufacturing
companies in Sweden,
China, and India
Paper 3 Disclosure of
corporate social
performance and
financial performance
Secondary
data
analysis
Descriptive analysis,
cluster analysis, non-
parametrical Kruskal–
Wallis one-way ANOVA
test, Spearman’s rho test
for correlation
75 manufacturing
companies in automotive,
metal products, forest and
paper, chemical, and
health care products
Paper 4 Sustainable operations
practices and
performance in the
Swedish
manufacturing
industry
Survey
Factor analysis, cluster
analysis, Pearson test for
correlation
101 Swedish
manufacturing companies
Paper 5 Moderating role of
supplier involvement
in the focal
companies’ initiatives
Survey
Partial least squares
structural equation
modeling, t-test
101 Swedish
manufacturing companies
Paper 3 is in line with the thoughts and methods of Paper 2, but extends the usage of GRI
reports to investigate whether corporate social performance affects financial performance in
the manufacturing industry. This third paper focuses on the social aspects of CSR
indicators, rather than on environmental ones, and studies the relationship between the
disclosures of a company’s social performance and its financial performance. Moreover,
the social practices across different manufacturing sectors are examined. In this way, Paper
3 provides insights into the inherent interrelationships among the different categories of
CSR analyzed.
8
Paper 4 and Paper 5 are based on the data collected from a survey of the Swedish
manufacturing industry, using a questionnaire designed based on the results of Paper 1.
Paper 4 aims at investigating the links between the three bottom lines, namely the
environmental, social, and economic aspects of sustainability and company performance.
The paper analyzes the implementation of sustainability improvement practices in different
companies, and the correlation between the company’s strategy and its sustainable practices
and performance. There is a particular emphasis on technology innovation and technology
strategy due to the results of Papers 2 and 3. Paper 4 can be viewed as a triangulation study,
since it attempts to further verify some of the results generated by Papers 2 and 3. However,
Paper 4 draws on the empirical data from the Swedish manufacturing industry, instead of
secondary data (GRI reports) as in the two previous studies.
Paper 5 tests the indirect impact of supplier involvement on the focal company’s
sustainable initiatives. Partial least squares structural equation modeling is used to confirm
the causal relationship between sustainability drivers, sustainable practices, and
performance. Meanwhile, the indirect effects of suppliers are investigated in this paper.
This study attempts to test and further develop the existing research on sustainability and
company performance, especially with respect to supplier involvement. Paper 5 further
verifies the previous research results found in Papers 2, 3, and 4, confirming the causal
relationship between sustainability drivers, sustainability improvement practices, and
overall sustainable performance.
Despite its in-depth investigation, this dissertation still has some limitations. First, this
study has a static viewpoint of the research questions; a longitudinal analysis is missing
from both the content analysis of the GRI reports (Papers 2 and 3) and the data collection in
the survey (Papers 4 and 5). This gap is mainly due to the limited time resources in the
doctoral study program. In other words, the research is based on a snapshot investigation.
Further in-depth analysis is needed in order to fully examine the topics. More supporting
data should be gathered, for instance, through a longitudinal survey investigation.
Second, the sample selection could be another research limitation of this dissertation. The
survey data (Papers 4 and 5) include only middle and big companies, whereas small

9
manufacturers are excluded. In addition, the survey data are based on the Swedish
manufacturing industry. Thus, conclusions and interpretations drawn from the study results
should be considered carefully. It is as yet unknown whether the research conclusions can
be generalized to other industries and other countries. Nevertheless, these results provide
the direction for future investigation.
Third, although some statistical tests were performed to check for data bias, reliability, and
validity, some data errors, such as self-report response bias, may still exist. In both the
survey study and GRI reports, there may have been a tendency for respondents to present a
better image of their company’s sustainability than the reality.
Finally, the measurement of sustainability practice and performance is still a controversial
topic in the literature. The measurements for Paper 4 and Paper 5 were selected using the
results from the literature review in Paper 1. A potential limitation could be related to the
measurement scales in this newly designed questionnaire. In order to overcome this
limitation, the questionnaire was pilot tested among academic experts and industry
practitioners. In addition, rigorous statistical methods were used to examine the reliability
and validity of the questionnaire.

10
2. Research Methodology
In order to achieve the research objectives introduced in Section 1.2, different research
approaches have been applied to deal with various problems concerning sustainability and
company performance. The applied research methodology and general research process are
presented in this section. In addition, the validity and reliability of this study are also
discussed. In the following subsections, brief overviews of the literature review, secondary
data, and survey instrument are presented. Meanwhile, the respective advantages and
disadvantages of each research method are discussed.
2.1 Literature review
Fink (2005, p. 3) defined a literature review as “a process of reading, analyzing, evaluating,
and summarizing scholarly materials about a specific topic.” It is important to conduct a
literature review as part of a research project, as it can help authors to authenticate the
authority and legitimacy of their research, to define the potential contributions of their
project, and to limit their research to a reasonable scope (Croom, 2009).
According to Seuring and Müller (2008), Croom (2009), and Machi and McEvoy (2012),
the typical steps for conducting a systematic literature review can be summarized as
follows:
o Decide on a topic to be investigated, as well as the component issues related to the
review topic;
o Set the research boundaries;
o Search for existing literature in order to find information relevant to the topic under
investigation;
o Evaluate and manage the collected literature in order to file and classify relevant
materials. This step includes the denotation of relevant findings, as well as the editing
and extraction of the findings;
o Analyze, synthesize, and interpret the findings. The intention is to identify the
potential gaps in the research, as well as future research opportunities;
o Write the review report.

11
There are a variety of different methods that can be used to analyze and interpret the
findings, for example, a qualitative approach, often conducted through content analysis.
Seuring and Müller (2008) conducted their literature review by analyzing the content in
order to make structural and descriptive analyses according to the defined content criteria.
The typical steps for structuring a content analysis can be generalized as: Collect the
relevant material, and select the structural dimensions and analytic categories in the
research field. Carefully determine the definition and coding of each category. Evaluate the
material, including the denotation, editing, and extraction of the related findings. Finally,
report the results (Seuring and Müller, 2008).
A quantitative approach, in this case citation/co-citation analysis, is represented by Tang
and Musa (2011). The objective of citation/co-citation analysis is to review the current
status and development of a particular area of research. Once the citation/co-citation
analysis has been conducted, statistical data can be obtained from the gathered materials.
Citation/co-citation is a useful tool for determining the academic structures affecting a
particular field (Tang and Musa, 2011).
At the beginning of this doctoral study project, a literature review was conducted with the
aim of better understanding the existing knowledge concerning the environmental and
social issues related to manufacturing location problems, and the relationship between them.
The main reason for considering the location problem was due to the research funding
received from VINNOVA (Swedish Govermental Agency for Innovation Systems) for a
research project entitled “Manufacturing Location and Facility Roles.” Although the
research included in the dissertation is not focused on manufacturing location, the literature
review still helped to clarify the academic and industrial perspectives on sustainability in
relation to operations management, especially since manfacturing location is an important
part of operations management. This systematic literature review futher helped to
categorize and identify the questions and directions of future research on sustainability
issues with respect to supply chain and operations management.
In Paper 1, the literature search included peer-reviewed journal articles published between
1990 and 2011. First of all, a descriptive analysis of the reviewed literature was developed
12
along with a categorization of the journal articles into two dimensions: research
methodology and topic area. Following a content analysis, the environmental and social
factors, and perspectives affecting location decision making were identified. The findings
were then synthesized into a sustainability manufacturing facility location framework, and a
future research agenda for sustainable locations was produced.
2.2 Secondary data analysis
According to the definition by Vartanian (2010, p. 3), “secondary data can include any data
that are examined to answer a research question other than the question(s) for which the
data were initially collected.”
Secondary data analysis is widely used in exploratory research, as well as in business
research. For example, Venkatraman and Ramanujam (1986) applied secondary data to
measure business performance in strategy research. Bottomley and Holden (2001) used
secondary data to analyze how consumers evaluate brand extensions. Secondary data are
also a trusted and popular source in CSR investigations (Luo and Bhattacharya, 2006).
Taneja et al. (2011) conducted a literature review of CSR-related studies over 38 years
starting in 1970. They found that 60% of published CSR studies applied secondary data
analysis (Baumann et al., 2013).
There are multiple sources of secondary data. For example, Luo and Bhattacharya (2009)
collected company social performance data from the list of Fortune’s most admired
companies. Baumann et al. (2013) obtained CSR and financial indicators from
BrandFinance and CSRHub. Karake (1998) measured CSR performance using a company’s
reputation index. Other possible data sources for CSR indicators include FTSE4Good, the
Dow Jones Sustainability Index, and the Domini Social 400 Index (Brown et al., 2009).
There are some benefits to using secondary data analysis (Cowton, 1998). These include:
o Reducing the investment in time and money;
o Enabling researchers to carry out cross-country and longitudinal analyses;
o Allowing most of the secondary data to be treated systematically (Kamins and Stewart,
1993);
o Achieving greater external validity.

13
Meanwhile, there are also some disadvantages to using secondary data (Cowton, 1998),
including:
o Difficulty accessing the collection of primary data, especially in business ethics
research (Liedtka, 1992);
o The potential for social desirability response bias (Randall and Fernandes, 1991). For
example, self-report data may cause companies to hide ethically undesirable
characteristics and inflate ethically desirable characteristics;
o Loss of depth despite providing comparatively larger samples.
In this dissertation, secondary data were obtained from Global Reporting Initiative (GRI)
reports. Usually, the GRI reports have been used for measuring sustainability indicators.
There are several advantages to using the GRI reports as a secondary data source. First,
GRI reports are globally accepted sustainability disclosures (Chen et al., 2015). Second,
unlike other CSR reports, GRI reports have a sufficient component related to environmental
issues (Marimon et al., 2012). Third, GRI reports are advantageous in terms of their
comprehensiveness, visibility, rate of uptake, and perceived prestige. Therefore, they can be
viewed as a reliable and efficient source of secondary data.
2.3 Survey
Surveys can help researchers to gather information from individuals about themselves or
concerning the organizations to which they belong (Forza, 2002; Rossi et al., 2013). The
survey is a very important method in the operations management field, especially in the
case of theory development and theory testing (Forza, 2002). Since the 1980s, there has
been a growing trend toward designing and executing surveys in operations management
research (Rungtusanatham et al., 2003). Operations strategy, quality management, and
supply chain management are among the top three subfields of operations management, in
which the survey method has been widely applied (Karlsson, 2009).
Surveys can be categorized into different types according to their contribution to the
knowledge (Forza, 2002; Fowler Jr, 2008; Singleton Jr et al., 1993):

14
o Descriptive survey: Descriptive surveys are not concerned with how/when/why
questions; they are designed to focus primarily on the “what” questions. Such an
approach can also be used to uncover the distribution of an event in a population (Forza,
2002). It can be used in situations where limited knowledge is available on research
issues (Karlsson, 2009).
o Exploratory survey: The aim of conducting an exploratory survey is to gain first insight
into a research topic for which there is limited knowledge. Exploratory surveys always
form the research basis for future in-depth surveys (Forza, 2002). Moreover,
exploratory surveys can determine whether what is being observed can be explained by
existing theories.
o Confirmatory/Explanatory/Theory-testing survey: This type of survey is derived from
theory-based expectations and tries to answer the research questions of how and why
variables relate. The research hypothesis is often developed based on the research
needs and can be further tested to indicate the existence of the predicted relationships,
pointing out the negative or positive direction of the relationships (Malhotra and
Grover, 1998).
The shortcoming of both descriptive surveys and exploratory surveys is that they cannot
effectively confirm the results of complex or subtle relationships or new perspectives
(Karlsson, 2009). Exploratory surveys help us to explore something new, to establish the
groundwork. Then, descriptive surveys can be conducted to increase the knowledge
initiated in the exploratory surveys. Finally, explanatory surveys can help to explain the
knowledge developed.
The survey process can be described in the following steps (Flynn et al., 1990; Forza, 2002):
o Link to the theoretical level by defining the construct, developing hypotheses, and
setting research boundaries;
o Design the research by considering macro-constraints, defining information needs,
establishing a target sample, specifying the data collection method, and selecting the
measurement instruments;

15
o Pilot-test the survey, including survey control testing, developing procedures for
handling missing data, and evaluating measurement quality in an exploratory way;
o Collect data for theory testing and dvelopment. This implementation stage includes
data gathering, cleaning, and input, as well as quality measurement.
o Analyze the collected data, including preparatory data analysis and research hypothesis
testing.
o Generate reports to discuss theoretical and managerial implications, and replicability,
and to present future research possibilities.
This dissertation examines the relationships between sustainability improvement practices
and a company’s triple bottom line performance, as well as the moderating role of supplier
involvement in the manufacturing industry. In order to further understand and verify the
findings of Papers 2 and 3 derived from the GRI reports, a theory-testing survey was
employed as the principal research method in Papers 4 and 5.
2.4 Data analysis method
Methods of data analysis can differ according to the research objectives. Methods can take
either a qualitative or a quantitative approach. In this dissertation, a quantitative approach
was used as the main method for quantifying and analyzing the data.
As listed in Table 1, different statistical methods were applied to analyze the data. Cluster
analysis, non-parametrical Kruskal–Wallis one-way ANOVA test, and Spearman’s rho test
for correlation were applied to the non-parametric data, whereas cluster analysis, factor
analysis, t-test, and Pearson test for correlation were used with continuous data.
Structural equation modeling (SEM) was also used in this dissertation. SEM is widely used
in theory testing and theory development surveys, contributing greatly to the validation of
instruments and the testing of linkages between constructs (Gefen et al., 2000). Compared
to the first-generation multiple regression method, SEM has the advantage of being able to
work with multiple equations simultaneously and construct latent (unobservable) variables.
Two SEM methods are widely used in the field of operations management: the covariance-
based method and the variance-based method. The covariance-based method is the more
traditional method. There are several types of software that can be used, such as LISREL

16
(Jöreskog and Sörbom, 1982), Analysis of Moment Structures (AMOS), EQS, and MPLUS.
Covariance-based SEM can be used in both theory testing and confirmation, but it is unable
to explain variances and make predictions. The variance-based method, on the other hand,
is represented by partial least squares (PLS) path modeling. Related software includes
Smart PLS, PLS-Graph, and SPAD PLS. PLS SEM has the advantage over traditional
covariance SEM with respect to theory development, prediction, formative measurement,
and complex modeling (such as second-order models).
2.5 Research quality
This section discusses the quality of research in terms of validity and reliability. Validity
and reliability are the critical foundations of scientific work and integral to both
quantitative and qualitative methodologies.
There are four characteristics necessary for rigorous research to be described as reliable and
valid: dependability, confirmability, transferability, and credibility (Guba and Lincoln,
1981; U.S. Government Accountability, 1990). According to Kidder and Judd (1986) and
Yin (2013), there are four common tests of validity and reliability that can be applied to all
research in the field of social science:
o Construct validity: defining accurate measures at the operational level for the concepts
under investigation;
o Internal validity: building causal connections and investigating whether certain
conditions lead to other conditions.
o External validity: determining whether the research results can be generalized.
o Reliability: proving that the research can be repeated, i.e., the same results can be
achieved by applying the same methodology.
2.5.1 Validity
The meaningfulness of a research concept and its various elements can be defined as
validity. In other words, validity is concerned with whether the research is well-founded
and resembles the real-world (Drost, 2011). In order to achieve validity, a research project
should be designed structurally and logically. The key issue for validity is that the research
17
should measure what it purports to measure and measure it correctly (Thomas and Nelson,
1996).
Validity can be categorized as external validity and internal validity. External validity is the
extent to which specific research findings can be generalized to a larger population,
different settings, and so on. Internal validity is the extent to which the principles of causal
connection have been followed in the research design.
In this dissertation, different validation methods were applied depending on the
characteristics of the research. For the content analyisis of the GRI reports, the validity was
ensured by using a consistent, valid coding scheme. The coders follow the GRI report
indicators, which itself is considered to be a valid measurement system (Chen et al., 2014).
For the survey part, the convergent and discriminant validity of the reflective measurement
models were tested using average variance extracted (AVE) and heterotrait-monotrait ratio
(HTMT). The validity of the formative measurement models was tested using a variance
inflation factor (VIF) and indicator weights.
2.5.2 Reliability
Reliability is defined by Joppe (2000, p. 1) as “the extent to which results are consistent
over time and an accurate representation of the total population under study.” One
important criterion for relablity is that the study can be repeated using a similar
methodology. Generally speaking, reliability can be achieved by measuring the same object
with multiple times or in different ways. Therefore, to produce a reliable scientific work, a
consistent measurement instrument is essential. A reliable measurement tool should be
characterized by minimal error.
Internal consistency is one dimension of reliability. It verifies whether several related
items/observations that are designed to measure the same general construct will lead to
similar results with the same dimensions. In statistical analysis, Cronbach’s alpha is the
approach applied most often for testing internal consistency (Fowler Jr, 2008; Zhu and
Sarkis, 2004).
Inter-rater reliability is another kind of reliability, which is an important criterion for
content analysis. For instance, when different individuals conduct obervations on the same
18
subject, they will have different judgments. In this case, the degree of agreement among
raters is a kind of inter-rater reliability. To confirm inter-rater reliability, correlation
coefficients such as the Pearson correlation test or Spearman correlation test can be applied.
For the content analysis in Papers 1, 2, and 3, research objectivity was ensured by using a
systematic approach and a structured process (see Seuring and Müller, 2008). The goals
were to identify the objectives of the research, to design a standard coding process, and to
ensure the consistent usage of the code sheet.
In the above three papers, multiple independent researchers followed the same structured
guidelines for conducting the content analysis, which improved the reliability. Differing
analyses were addressed and resolved through meetings.
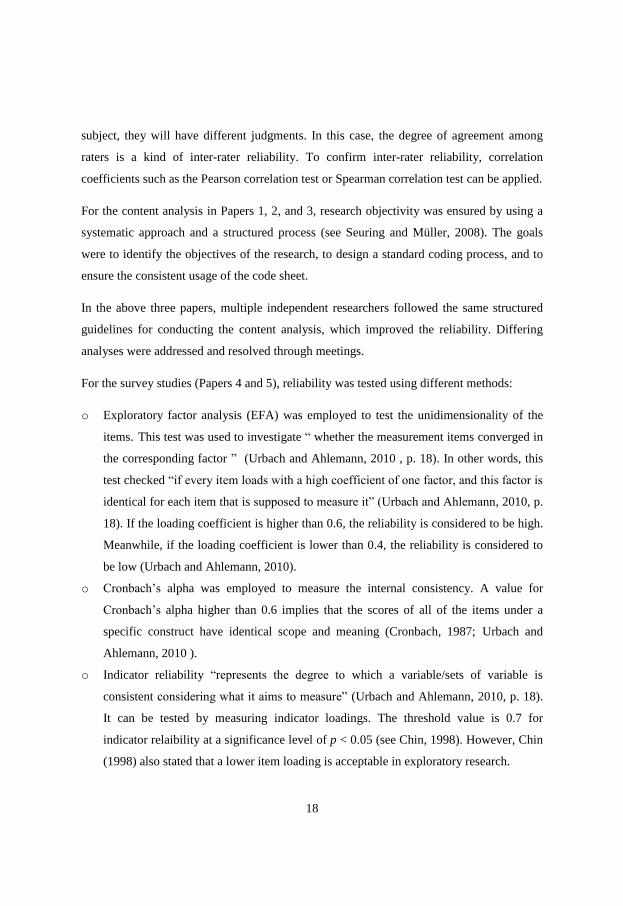
For the survey studies (Papers 4 and 5), reliability was tested using different methods:
o Exploratory factor analysis (EFA) was employed to test the unidimensionality of the
items. This test was used to investigate “ whether the measurement items converged in
the corresponding factor ” (Urbach and Ahlemann, 2010 , p. 18). In other words, this
test checked “if every item loads with a high coefficient of one factor, and this factor is
identical for each item that is supposed to measure it” (Urbach and Ahlemann, 2010, p.
18). If the loading coefficient is higher than 0.6, the reliability is considered to be high.
Meanwhile, if the loading coefficient is lower than 0.4, the reliability is considered to
be low (Urbach and Ahlemann, 2010).
o Cronbach’s alpha was employed to measure the internal consistency. A value for
Cronbach’s alpha higher than 0.6 implies that the scores of all of the items under a
specific construct have identical scope and meaning (Cronbach, 1987; Urbach and
Ahlemann, 2010 ).
o Indicator reliability “represents the degree to which a variable/sets of variable is
consistent considering what it aims to measure” (Urbach and Ahlemann, 2010, p. 18).
It can be tested by measuring indicator loadings. The threshold value is 0.7 for
indicator relaibility at a significance level of p < 0.05 (see Chin, 1998). However, Chin
(1998) also stated that a lower item loading is acceptable in exploratory research.

19
3. Theoretical Framework
The purpose of this section is to present the literature most relevant to the studies carried
out for this dissertation. There are three main areas of interests: i) sustainability at the
company level; ii) sustainability and company performance; and iii) related organizational
theory. The first two are directly related to the topic of this dissertation, whereas the last
one provided the theoretical basis for hypothesis development.
3.1 Sustainability at company level
Sustainability is a broad topic that can be viewed from many different perspectives, such as
sustainable city, sustainable society, and so on. In this dissertation, the concept of
sustainability has been narrowed to the company level and seen as strongly connected to the
concept of corporate social responsibility (CSR) and the triple bottom line, namely
economic sustainability, environmental sustainability, and social sustainability.
There is a long history of scholarship in this area. Barnard (1968) discussed corporate
social responsiblity at the organizational and executive levels. Carroll (1979) framed
corporate social performance as economic, legal, ethical, or discretionary obligations to
society. Clarkson (1995) established a framework for CSR based on the company’s
relationship with its stakeholders. He stated that stakeholder engagement was very
important for achieving overall company sustainability. Elkington (1997) developed the
idea that a company’s economic sustainability, environmental sustainability, and social
sustainability are inter-related. These three bottom lines of a company’s sustainability can
influence each other. Dyllick and Hockerts (2002) expanded Clarkson’s idea, not only
recognizing the importance of stakeholder engagement, but also providing a conceptual
model and related criteria for narrowing down sustainability at the company level.
Furthermore, they tried to integrate economic, ecological, and social aspects over both the
short and long term.
At the industry level, there are more regulations that drive companies to become more
sustainable. ISO 26000, for example, was launched by the International Organization for
Standardization (ISO) in 2010 to provide new guidelines for companies and organizations
on how to operate effectively in an environmental and humane manner (Lu et al., 2013).

20
For EU countries, there are special strategies in place for promoting environmental and
social responsibility, such as the Renewed 2011–14 European Union Strategy for CSR.
This particular strategy attempts to integrate environmental and social considerations into
the comapany’s core business strategy and daily operations (Crane et al., 2013; Lu et al.,
2013). In a global context, there are several popular guidelines for shaping companies’
sustainable operations, including the United Nations Guiding Principles on Business and
Human Rights, the United Nations Global Compact, the International Labour
Organization’s Declaration of Principles Concerning Multinational Enterprises on Social
Policy, and the Organisation for Economic Co-operation and Development (OECD)
Guidelines for Multinational Enterprises.
In this dissertation, the investigation of sustainability is largely focused within the
company’s organizational boundaries. When a supply chain is investigated, the influence of
suppliers on the focal company is investigated, while highlighting the perspectives of the
focal company.
3.2 The relationship between sustainbility and company performance
As mentioned in the introduction, debates over the relationship between CSR and financial
performance have existed for decades. Some important empirical studies are presented in
Table 2. There are also several meta-reviews of the literature in the field, conducted by
Griffin and Mahon (1997), Roman et al. (1999), Orlitzky et al. (2003), and Lu et al. (2014).
The existing empirical studies on sustainability and company performance have been
divided into two streams according to their research methodologies: secondary data analyis
and survey. Secondary data analysis represents the majority of the contributions in this field.
One possible reason for this dominance might be the ability of secondary data to eliminate
certain biases, such as common methods bias and principal informant bias (Gattiker and
Parente, 2007; Hofer et al., 2012). Another possible reason for many researchers to adopt
secondary data is that it reduces the amount of time and financial resources necessary to
conduct the study.

21
Examining the studies in Table 2, it is evident that most research has focused exclusively
on the relationship between CSR and financial performance, neglecting other aspects of
company performance, such as operational performance and innovation performance.
These collected studies reveal diverse results with respect to the relationship between
sustainability and company performance. One possible reason for these discrepant results is
that corporate social performance can be measured in different ways. When the
measurement indicators and scales are different, the measurement results of corporate
social performance can vary. Thus, a summary of the literature from the 1970s up until now
is presented below, showing the four main streams investigated. These results are consistent
with the previous findings of Orlitzky et al. (2003) and Chen et al. (2015).
i) Reputation ratings. Reputation ratings are based on a collection of opinions that some
entities hold about the corporate social performance of specific companies, most of
them calculated by indexing techniques. Several cases in point are the annual social
responsibility ratings contained in the Kinder, Lydenberg, and Domini (KLD) database
(Lu. et al., 2014). This stream is represented by Vance (1975), Alexander and
Buchholz (1978), Cochran and Wood (1984), Spencer and Taylor (1987), McGuire et
al. (1988), Herremans et al. (1993), Preston and O’Bannon (1997), Brammer et al.
(2006), Luo and Bhattacharya (2006), Surroca and Tribó (2008), Lee and Park, (2009),
McPeak et al., (2010), Lamond et al., (2010), Salama et al., (2011), Wang et al. (2011),
and Ortas and Moneva (2011);
ii) Social audits and observations. According to Orlitzky et al. (2003, p. 408), social audits
“consist of systematic third-party effort to assess a firm’s ‘objective’ CSP behaviours,
such as community service, environmental programmes, and corporate philanthropy.”
This stream is represented by Belkaoui (1976), Chen and Metcalf (1980), Fombrun and
Shanley (1990), Russo and Fouts (1997), Goll and Rasheed (2004), Luken and Stares
(2005), Brammer and Millington (2005), Peinado-Vara (2006), Wen and Yuan (2008),
and Okamoto (2009);
iii) Managerial principles and values. Managerial principles and values are how managers
evaluate social information. This stream is represented by Reimann (1975), Ingram and

22
Frazier (1980), Aupperle et al. (1985), Dooley and Lerner (1994), Agle et al. (1999),
and Godfrey et al. (2009);
iv) Disclosures. An organization evaluates the CSP information and the associated reports
can be seen as sustainability disclosures. This stream is represented by Abbott and
Monsen (1979), Anderson and Frankle (1980), Patten (1990), Wolfe (1991), Seifert et
al. (2003, 2004), Fauzi et al. (2007), Kobeissi and Damanpour (2007), Brammer and
Millington (2008), Aras et al. (2010), and Siregar and Bachtiar (2010).
Using the above categories to compare the empirical results in Table 2, one can see that
these various methods of measurement can yield very different results with respect to the
relationship between company sustainability performance and company performance.
Furthermore, it should be noted that even though the Global Reporting Initiative is an
internationally accepted format for corporate social performance disclosure, it has still not
been widely used in research in this field. Several studies, e.g., Brown et al. (2009), Chen
and Bouvain (2009), and Tate et al. (2010), have used GRI reports as the data source.
However, these studies have not focused on the relationship between sustainability and
company performance.

23
Table 2. Selected empirical research in the field of sustainability and company
performance Authors Focus Methods Findings
Ullmann (1985) Corporate social performance and
financial performance
Secondary data Positive relationship
between CSP and CFP
McGuire et al.
(1988)
Social responsibility reputation
and a company’s total assets
Secondary data Positive relationship
between social
responsibility reputation
and a company’s total
assets
Waddock and
Graves (1997)
Corporate social performance and
financial performance
Secondary data Positive relationship
between CSP and CFP over
the long term
Preston and
O’Bannon
(1997)
Company social performance and
financial performance
Longitudinal
investigation in
large U.S.
companies in 1982–
1992
Positive relationship
between CSP and CFP
Karake (1998) Corporate
social performance (measured by
reputation index) and financial
performance (measured by return
on equity)
Secondary data Positive relationship
between the company’s
reputation
index and its return on
equity
Agle et al.
(1999)
Relationship among stakeholder
attributes,
CEO values, and corporate
performance
Survey of 80 large
U.S. companies
Strong and positive
relationship between
stakeholder salience,
CEO values,
and CSP
McWilliams
and Siegel
(2001)
Corporate social responsiblity and
financial performance
Secondary data Neutral relationship
between CSP and CFP
Seifert et al.
(2003, 2004)
Corporate philanthropy and
financial performance
Secondary data No significant relationship
between corporate
philanthropy and CFP
Luo and
Bhattacharya
(2006)
CSR and market value Secondary data Negative relationship
between CSR and market
value

24
Table 2. Selected empirical research in the field of sustainability and company
performance (Continued) Authors Focus Methods Findings
Brammer et al.
(2006)
CSP reputation ratings and
financial performance
Secondary data Negative relationship
between CSP and CFP
Marom (2006)
Theory building for corporate
social performance
and corporate financial
performance
Conceptual
modeling
A conceptual model on the
relationship between CSP
and CFP
Surroca and
Tribó (2008)
CSP reputation ratings and
financial performance
Secondary data Negative relationship
between CSP and CFP
Luo and
Bhattacharya
(2009)
Company social performance and
risks
Secondary data The relationship between
CSP and company risks can
be moderated by advertising
and R&D
Brown et al.
(2009)
The degree of embedding
GRI within the company
Secondary data and
interviews
For sustainability,
reputation, and brand
management by companies,
GRI reports can be regarded
as a fundamental tool
Chen and
Bouvain (2009)
Impact of membership in the
Global Compact on CSR
reporting
Secondary data Global Compact
membership influences
several fields of CSR
reporting
Aras et al.
(2010)
CSP disclosures and CFP Secondary data Negative relationship
between CSP disclosures
and CFP
McPeak et al.
(2010)
CSP reputation ratings and CFP Secondary data Negative relationship
between CSP reputation
ratings and CFP

25
Table 2. Selected empirical research in the field of sustainability and company
performance (Continued) Authors Focus Methods Findings
Lamond et al.
(2010)
The impact of CSR on company
identity, image, and performance
Survey CSP has a strong positive
relationship with a
company’s identity-building
and positive impact on
company success
Tate et al.
(2010)
Supply chain strategies factor in
environmental, economic, and
social responsibility
Secondary data Supply chain management
activities are an important
part of company
sustainability
Siregar and
Bachtiar (2010)
CSP and stock value Secondary data Negative relationship
between CSP and CFP
Lu et al. (2013) CSR and semiconductor
companies’ performance
Secondary data Positive relationship
between social
responsibility investment
and company performance
Lee et al. (2013) CSR and company performance
in the airline industry
Secondary data Positive relationship
between operations-related
CSR and company
performance
3.3 Related organizational theory
Organizational theory plays a crucial role in the research on sustainability and company
performance. Sarkis et al. (2011) conducted a comprehensive review of organizational
theory, identifying the most relevant organizational theories in the green supply chain
management field as complexity theory, ecological modernization theory, information
theory, institutional theory, resource-based view, resource dependence theory, social
network theory, stakeholder theory, and transaction cost economics. Considering the
background and research methods of this dissertation, several most related organizational
theories are described in the following subsections. The presented theory has played an
important role in the hypothesis development and explanation of the results of this
dissertation.

26
3.3.1 Institutional theory
Institutional theory was first suggested by Selznick (1948), who argued that the behavior of
a company can be influenced by its institutional environment. The central idea of this
theory states that “organizations must conform to the established rules and norms of
dominant institutions in order to gain support and be perceived as legitimate” (John et al.,
2001, p. 151).
If we further categorize the institutional context into either formal or informal, institutional
context can be generalized as:
i) Formal institutional context includes regulations, laws, and industry self-regulations (La
Porta et al., 2008)
ii) Informal institutional context includes religious beliefs, cultures, ethics, norms,
traditions, and values (DiMaggio and Powell, 1983; Meyer and Rowan, 1977).
Institutional theory has also been widely applied in sustainability research when
considering cross-industry and cross-country comparisons. In various countries and
industries, divergent cultural and industrial values lead to differences in organizational
behavior. Consequently, these institutional variances yield different standards and
expectations with respect to sustainability. Therefore, the expansion of the notion of
sustainability necessarily takes different paths in different industries and countries (Visser
and Tolhurst, 2010). In other words, specific institutional settings within a particular
country/industry can influence how the organization engages in sustainability activities and
the level of engagement, as well as performance.
Campbell (2007) argued that, in different socio-cultural environments, the engagement of
companies in sustainability issues depends on the existence of isomorphic drivers,
including coercive, normative, and mimetic ones. Based on research by Sarkis et al. (2011),
such isomorphic pressures can explain why organizations need to adopt sustainable
practices, i.e., why the company should behave in socially responsible ways. Companies
are expected to act rationally, according to early institutional studies (Greenwood et al.,
2008), while commonly accepted social understandings determine what it means to be
rational.

27
The following are different kinds of isomorphic drivers in institutional theory:
i) Coercive pressure. This pressure is mainly from governments, and it is a key factor in
companies adopting environmental management practices (Kilbourne et al., 2002;
Sarkis et al., 2011). For instance, in Sweden, manufacturers have to adhere to a series of
environmental and social regulations and laws, such as the restriction of hazardous
substances (RoHS), waste electrical and electronic equipment (WEEE) regulations, and
the Social Accountability 8000 International Standard (SA 8000).
ii) Normative pressure. This pressure is driven by consumers (Ball and Craig, 2010; Sarkis
et al., 2011). For example, for Swedish manufacturers, consumer demand for green
products is one of the main drivers to adopt more sustainable strategy and practice in
operations.
iii) Mimetic pressure. Imitation also plays an important role in EU companies participating
in more sustainable friendly initiatives (Aerts et al., 2006; Sarkis et al., 2011).
Companies choose to imitate other companies’ behaviors in order to avoid the risks
associated with complex environments (DiMaggio and Powell, 1983). In the
manufacturing industry itself, there is a trend of companies moving toward standardized
processes and products as a kind of mimetic isomorphism (John et al., 2001).
3.3.2 Stakeholder theory
Ansoff (1965) first introduced stakeholder theory to explain the importance of identifying
crucial stakeholders of an organization. As Ansoff stated, the company’s primary strategic
objective is to achieve the capability to balance the different needs of diverse stakeholders
in the company. This notion was further developed by Freeman (1983), who integrated
stakeholder theory into the corporate social responsibility model and business policy model.
Stakeholder theory indicates that groups of stakeholders can develop and approve the
company’s strategic decisions concerning business policies. Furthermore, stakeholder
behavior can constrain the company’s strategy, which is developed by managers to match
appropriate resources with its surroundings. Freeman (1984, p. 46) defined the stakeholder
as “any group or individual who can affect or is affected by the achievement of the firm’s
28
objectives.” According to this definition, stakeholders can be owners, customers, suppliers,
and public groups.
Stakeholder theory can also be applied to describe and explain how managers plan and
make strategy (Brenner and Molander, 1977; Donaldson and Preston, 1995) and how
companies are actually managed (Clarkson, 1995; Donaldson and Preston, 1995; Kreiner
and Bhambri, 1988). As such, stakeholder theory is often applied when discussing a
company’s sustainable strategy, since a company’s sustainable strategy and related
practices are influenced by different kinds of stakeholders, such as customers, suppliers,
line leaders, government, regulators, advisory boards, and NGOs (Donaldson and Preston,
1995).
3.3.3 Resource dependence theory
Resource dependence theory was first proposed by Emerson (1962) based on social
exchange theory, and further developed by Pfeffer and Salancik (1978, p. 26-27 ) to suggest
that “organizations depend on others in their environment for resources to ensure their long
run viability.” Within the field of strategic management and organizational theory, resource
dependence theory is considered to be one of the most prominent theories (Singh et al.,
2011).
Resource dependence theory assumes that organizations must depend on other
organizations to secure strategically significant resources (Heide, 1994; Singh et al., 2011).
Consequently, organizations structure their relationships with other organizations, either
formally or semiformally, so as to reduce uncertanity/risks and dependency on other
organizations, such as suppliers (Ulrich and Barney, 1984; Singh et al., 2011).
Consequently, a rational organization seeks to secure significant and limited resources,
particularly in competitive environments (Banaszak-Holl et al., 1996; Hollos et al., 2012).
Since closer relations with suppliers establishes greater interdependence (Aiken and Hage,
1968; Hollos et al., 2012; Pfeffer and Salancik, 1978), resource dependence theory suggests
that resource exchange between partners should be used as a mechanism to control
environmental risk.

29
Resource dependence theory has also been used to explain the role of manufacturing in
creating and sustaining ongoing competitive advantage (John et al., 2001). According to
resource dependence theory, partner companies across the supply chain, such as suppliers
and focal companies, should not only depend on but also cooperate with each other. Such
cooperation can lead to better performance in the long run, and is preferable to pursuing
short-term profits at the expense of others (Sarkis et al., 2011).
Thus, supplier involvement can impact the sustainable work of focal companies. Moreover,
organizational capabilities can be enhanced through green cooperation between focal
companies and suppliers.
3.3.4 Ecological modernization theory (“win-win” principle)
Ecological modernization theory was first suggested by Joseph Huber (2000). Since then,
environmental sociologists have widely adopted or adapted this theory to explain green
economics and green growth initiatives. Generally speaking, ecological modernization
theory can be seen as a systematic eco-innovation theory that can be applied at the micro
level, such as at the organizational or supply chain level. This theory supports the idea that
companies can invest in process/product innovation to decrease environmental degradation
and thus help with economic gains. Ideally, ecological modernization theory describes a
“win-win” scenario whereby technological development and innovation can help industries
and countries to achieve both economic and environmental benefits (Murphy and Gouldson,
2000; Sarkis et al., 2011). In effect, ecological modernization theory supports the idea that
there is a positive relationship between environmentalism and economic benefits.
A review of the related literature reveals additional research supporting and enriching the
ecological modernization theory. Zhu et al. (2012) applied ecological modernization theory
to the Chinese manufacturing industry, stating that manufacturers can implement
environmental and technological innovations, such as new, cleaner production equipment
and eco-design, in order to obtain economic benefits. More empirical evidence has come
from Demark, where Søndergård et al. (2004) investigated the Danish textile industry. They
concluded that environmental innovations can help companies to build innovative
competencies within the organization. Such competencies can even extend to the

30
companies’ supply chains. Another empircal study by Huber (2008) tested technological,
environmental innovations from a chain-analytical and life-cycle-analytical perspective.
Huber concluded that such innovations usually occur upstream of the supply chain, i.e.,
with suppliers, instead of downstream, i.e., with customers.
Ecological modernization theory explains companies’ motivations for improving
environmental practices, suggesting that green practices can help organizations to achieve
better performance in both environmental and economic outcomes.
Ecological modernization theory remains useful for future research. For example, one could
investigate how ecological modernization theory impacts the sustainable supply chain, or
whether there is a mechanism helping focal companies to have better green cooperation
with their suppliers, thereby transferring eco-innovation more efficiently.
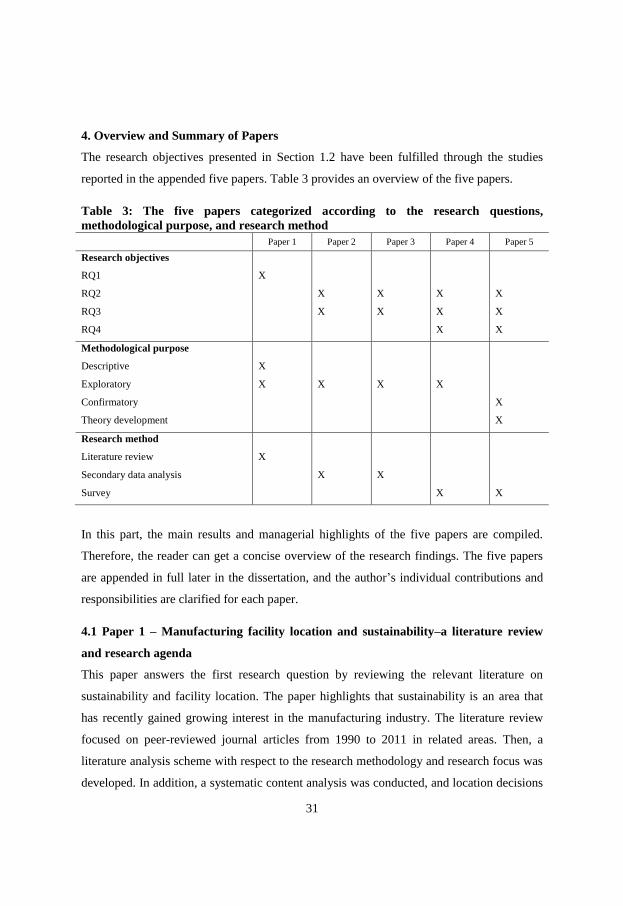
31
4. Overview and Summary of Papers
The research objectives presented in Section 1.2 have been fulfilled through the studies
reported in the appended five papers. Table 3 provides an overview of the five papers.
Table 3: The five papers categorized according to the research questions,
methodological purpose, and research method Paper 1 Paper 2 Paper 3 Paper 4 Paper 5
Research objectives
RQ1
RQ2
RQ3
RQ4
X
X
X
X
X
X
X
X
X
X
X
Methodological purpose
Descriptive
Exploratory
Confirmatory
Theory development
X
X
X
X
X
X
X
Research method
Literature review
Secondary data analysis
Survey
X
X
X
X
X
In this part, the main results and managerial highlights of the five papers are compiled.
Therefore, the reader can get a concise overview of the research findings. The five papers
are appended in full later in the dissertation, and the author’s individual contributions and
responsibilities are clarified for each paper.
4.1 Paper 1 – Manufacturing facility location and sustainability–a literature review
and research agenda
This paper answers the first research question by reviewing the relevant literature on
sustainability and facility location. The paper highlights that sustainability is an area that
has recently gained growing interest in the manufacturing industry. The literature review
focused on peer-reviewed journal articles from 1990 to 2011 in related areas. Then, a
literature analysis scheme with respect to the research methodology and research focus was
developed. In addition, a systematic content analysis was conducted, and location decisions

32
related to economic, environmental, and social dimensions were classified. The findings
were used to develop a conceptual model to guide manufacturing facility location decision
making, especially over the long run. The accompanying research agenda was designed to
address gaps in the research and verify the conceptual model. In order to build a feasible
and comprehensive research agenda, strategic dimensions, practical perspectives, and social
concerns were discussed.
Several research gaps were identified in the course of this literature review. First, there
have been very few investigations taking the triple bottom line into consideration when
making facility location decisions. Second, the manufacturing strategy aspects of industrial
firms have remained absent from the current research on sustainable facility locations and
global operations footprints.
The main results of Paper 1 were:
o There has been an increasing interest in sustainable concerns related to manufacturing
locations, especially since 2005.
o Most current research has focused on sustainability in specific regions and in supply
chain settings.
o There has been a lack of research with an explicit focus on the sustainable location
problem.
o The majority of research has been about environmental and economic issues, while
social dimensions have often been missing.
o The paper developed a conceptual model for synthesizing different perspectives on
sustainability in the manufacturing industry.
4.2 Paper 2 –Applying GRI reports for the investigation of environmental
management practices and company performance in Sweden, China and India
The objective of this paper is to investigate the correlation between environmental
management practices (EMPs) and company performance in different manufacturing
industries in developed and developing countries. The research objective is achieved by
employing a combination of diverse methods, including literature review, content analysis,
and statistical assessment.

33
The first step was to conduct a literature review in order to establish the theoretical
background and research framework. Research hypotheses were developed based on
relevant organizational theories. Then, content analysis was applied to standard
environmental data from GRI (Global Reporting Imitative) reports. The levels of EMPs in
manufacturing firms were coded according to the content analysis. Financial performance
figures were obtained from the published annual reports of the sample companies. Finally,
statistical analysis was performed to test the hypotheses. The results were also compared
against those reported by Montabon et al. (2007). The results of Paper 2 indicate that
innovation performance strongly correlates to several EMPs in various companies.
Managers must be aware of several green environmental practices, such as eco-design, at
early stages of the production process in order to achieve innovation performance and
further improve financial performance. The results of paper 2 are also consistent with
ecological modernization theory, which states that sustainability practices can enhance
innovation opportunities, including product and process innovation in organizations, and
thus achieve economic profitability.
This research found that:
o Most EMPs did not correlate significantly with financial performance.
o Plenty of EMPs had positive, strong correlations with innovation performance for the
companies.
o Innovation should gain substantial attention when employing EMPs to improve long-
term financial performance.
o There were no significant differences between the process industry and other
manufacturing industries with respect to the EMPs employed.
o There were seven EMPs employed significantly differently among the manufacturing
industries in Sweden, China, and India.
4.3 Paper 3 – The relationship between disclosures of corporate social performance
and financial performance: Evidences from GRI reports in manufacturing industry
The aim of this paper was to investigate whether the disclosures of corporate social
performance affect financial performance, especially in the manufacturing industry.

34
The theoretical background was based on institutional theory, exploring the inherent
interrelationships among various aspects of CSR. Standard disclosures of corporate social
performance needed to be applied to measure all the sample companies’ CSR indicators in
a standard and consistent way. Since the GRI reports are considered to be the standard
format of CSR measurement, it was used as the principal data source for this research.
Structured content analysis was used as the primary method in making cross-company
comparisons of CSR. The coding process was undertaken by different researchers in order
to obtain data from the annual GRI sustainability reports of the case companies.
Seventy-five case companies met the research requirements across the following industries:
automotive industry (14 companies); metals products (24 companies); forest and paper (13
companies); chemical (10 companies); and health care products (14 companies).
Statistical analysis was conducted to analyze the correlations between the disclosure of
corporate social performance and financial performance. It was observed that several
specific social sustainability indicators that were easily quantifiable or measurable, such as
injury rates, had higher scores than others. The indicators that tend to receive high media
attention had higher mean values. The indicator protocols set for product responsibility got
more attention from companies since it is strongly correlated to the product’s reputation.
However, this research presented scant evidence of a relationship between different
categories of corporate social performance disclosures and financial performance.
Moreover, causality could not be shown in this paper.
The main results of Paper 3 were:
o Labor practices and work standards have received the most attention from the
manufacturing industry among the different categories of corporate social
responsibility.
o The CSR indicators that are most easily measured/quantified received more attention
than others from the manufacturing industry.
o There has been a parallel adoption of four categories of CSR indicators, instead of a
sequential progress
o Many CSR indicators had significant and positive correlations with return on equity.
35
o There was no significant difference in CSR practices across different manufacturing
sectors.
4.4 Paper 4 –An empirical evaluation of sustainable operations practices and
performance in the Swedish manufacturing industry
This paper investigated the relationships between sustainability improvement practices and
companies’ triple bottom line performance. The research constructs were derived from the
literature review and framework developed in Paper 1. Sustainable theory and a dynamic
resource-based view comprised the theoretical background. This research was mainly based
on a survey conducted in Swedish manufacturing companies during the first half of 2014.
Factor and cluster analyses were employed to investigate when companies implement
different sustainability improvement practices and to evaluate their performances.
Correlation analysis was employed to explore the relationship between the sustainability
improvement practices and company performance. The results of the survey and their
managerial implications indicated that economic, social, and environmental practices had
strong positive correlations with economic, social, and environmental performance,
individually. Nevertheless, companies’ economic performance was not improved by the
direct input of most social and environmental practices. Still, investments in environmental
health improvement, individual development, and education showed the possibility of
return, especially in the realm of product and process innovation. Thus, the company’s
economic performance can be improved in the long run.
The main results of Paper 4 were:
o Overall sustainability improvement practices are correlated positively with operational
performance, innovation performance, economic performance, environmental
performance, and social performance.
o Sustainable operations practices, including environmental health improvement,
individual development, and education, should receive special attention since they
positively correlate to innovation performance, thus contributing to a company’s
economic performance.

36
o In terms of the companies’ sustainability improvement practices, the economic
practices received the highest attention, followed by environmental practices and then
social ones.
o In terms of the companies’ sustainability performance, environmental and social
sustainability could be combined into one category.
4.5 Paper 5 – Does supplier involvement affect Swedish manufacturers’
sustainability?
Sustainable responsibility and initiatives do not only exist in focal companies, but extend to
the supply chain. Sustainability is a problem particularly for manufacturers in developed
countries that outsource their products overseas to low-cost regions. If their suppliers have
a poor record on sustainability issues, the focal companies’ reputation and related market
shares will be damaged. Therefore, it is important to analyze the indirect effects of
suppliers on the manufacturers’ sustainability.
In Paper 5, the samples were collected the same way as in Paper 4. Common method bias
was evaluated with Harman’s single factor test. Average variance extracted, composite
reliability, and Cronbach’s alpha were also employed to evaluate the reflective constructs’
convergent validity and internal consistency reliability. Furthermore, the discriminant
validity was tested using the heterotrait-monotrait ratio (HTMT). Indicator loadings were
tested to ensure indicator reliability. For the formative measurement model, indicator
weights and variance inflation factor were evaluated to confirm the validity and reliability
of the model.
For the data analysis, a second-generation multivariate analysis tool (Partial Least Squares
(PLS) structural equation modeling) was applied to test the moderating effect of supplier
involvement on the focal company’s sustainable work. The results showed a causal relation
between sustainability drivers, sustainability improvement practices, and overall sustainable
performance. Meanwhile, only supplier involvement in the focal company’s environmental
work moderated the focal company’s sustainable practices and performance. A further t-test
was performed in order to explore how supplier involvement affected the focal companies’
environmental focus. The main differences between the higher supplier involvement group

37
and lower supplier involvement group were due to environmental practices related to
ecosystem vitality and environmental health. The evidence from the Swedish
manufacturing industry showed that better sustainable practices can offer gains in overall
sustainable performance. Moreover, good cooperation with suppliers, especially with
respect to the environmental practices, can strengthen the organization’s green capabilities
through organizational learning. Thus, it is important to make sustainability an important
strategy that is integral to the whole supply chain, instead of simply an add-on.
The main results of Paper 5 were:
o A causal relationship between sustainability drivers and sustainable improvement
practices was found.
o A causal relationship between sustainable improvement practices and company
performance was found.
o Moderating effects were only found with respect to supplier involvement in the focal
companies’ environmental work.
o Considering environmental work involvement, the main differences between the higher
supplier involvement group and the lower supplier involvement group were in their
environmental practices with respect to ecosystem vitality and environmental health.

38
5. Discussions and Conclusions
This section offers a discussion of the research findings, drawing conclusions from the
study and presenting the direction for future studies.
5.1 Discussions
This dissertation’s overall objective was to explore the relationships between sustainability
practices and company performance with a special focus on the manufacturing industry,
using a triangulation method.
Developing a comprehensive view of sustainability in the manufacturing industry is an
important task. Such a view should consider economic, environmental, and social
dimensions. However, the empirical results from the Swedish manufacturing industry
showed that the consideration of social sustainability still lags behind economic
sustainability and environmental sustainability. This result indicates that the manufacturing
industry needs to place more emphasis on this area and should develop appropriate policies
so that social sustainability can be properly incorporated into the triple bottom line.
Achieving a better balance between environmental, social, and economic sustainability
requires a lot of work. Companies should incorporate the operations strategy perspective
into their sustainability aspects, employ the GRI reporting system, and develop better
collaboration with suppliers.
There is also a contextual dimension that is important from an institutional theory
perspective. Formal and informal institutional contexts may affect companies’ operational
choices. Although the results of this research do not suggest significant differences between
subsectors of the manufacturing industry, nor different countries such as Sweden, China,
and India, differences may exist between economic, environmental, and social dimensions
under other circumstances. One example is that the manufacturing industry and service
industry may have different focuses with regard to sustainability issues. For example, the
service industry may not focus on CO2 emissions in the production process as much as the
manufacturing industry. With the rapid development of the service industry, understanding
such differences has become even more important. Therefore, future research should look
at the different sustainability focuses and related strategies in the service industry.

39
According to stakeholder theory, stakeholders influence companies’ sustainability choices.
Considering that different industries have different stakeholders (Sweeney and Coughlan,
2008), sustainability focuses may vary as a result. Based on the empirical investigation of
this study, the main drivers for the Swedish manufacturing industry adopting sustainability
practices were found to be government and regulators, customers, advocacy organizations,
NGOs, and advisory boards. This situation can shift in other countries and other industries.
For example, Zhu and Sarkis (2007) found that the main drivers for Chinese manufacturers
were from governmental, market, and competitive sources.
This dissertation also supports some of the notions of the “win-win” discussion concerning
the relationship between sustainability and company performance. This result is in line with
ecological modernization theory. More specifically, there is a positive link between
sustainability practices and company performance in the manufacturing industry.
According to the findings of this study, employing environmental management practices
properly can help companies to achieve better innovation performance. In turn, the level of
process and product technology is often positively correlated to environmental performance
and innovation performance. As such, the suppliers’ involvement in the focal companies’
environmental work can strengthen the focal companies’ green capabilities. Therefore,
companies should allocate resources to improving their environmental management
practices, technology level, and cooperation with their suppliers.
The manufacturing strategy perspective is also useful for investigating sustainability issues
in the manufacturing industry. In exploring the configuration of sustainability strategy in
the Swedish manufacturing industry, this study showed that sustainability is indeed on the
Swedish manufacturer’s strategic agenda, particularly in manufacturing networks with
multiple locations. The level of centralization of the sustainability strategy decreases from
economic sustainability, to environmental sustainability, and to social sustainability. In the
literature, the centralized/decentralized orientation of an organization’s sustainability
strategy has not been explored in-depth empirically. This topic is definitely worth studying
in different contexts.

40
The moderating role of supplier involvement in the focal company’s sustainable initiatives
was confirmed in the Swedish manufacturing industry. More specifically, the suppliers’
involvement had the greatest effect on the focal company’s environmental sustainability.
This finding is in line with resource dependence theory (Emerson, 1962; Pfeffer and
Salancik, 1978), in that, focal companies and suppliers depend on each other to ensure their
long term competitive advantage. The empirical investigation of the Swedish
manufacturing industry indicates that focal companies should have better collaborative
relationships with their suppliers in order to both reduce risk and strengthen green
capabilities.
5.2 Conclusions
The following conclusions have been drawn in response to the research questions.
RQ1: What are the sustainability issues and factors considered to be important for
supply chain and operations management?
This study investigated sustainability concerns in the manufacturing industry, resulting in a
framework summarizing the perspectives, approaches, and factors related to different
aspects of sustainability (i.e., strategic, environmental, social, and economic) and decision
making processes in manufacturing operations. The main results are shown in Table 5 and
Figure 3 of Paper 1. These findings were subsequently used to design the survey
questionnaire, offering clear guidelines for understanding research in sustainable operations
management, especially in the manufacturing industry.
RQ2: What is the status of sustainable practices in the manufacturing industry, and
what general approaches are being used for implementing such practices, including
economic, environmental, and social ones?
This dissertation explored the approaches to implementing sustainable practices
considering different manufacturing environments, such as industrial sectors and
manufacturing locations. The results showed no significant difference in the
implementation of environmental management practices or social management practices in
different industrial sectors, such as the process industry and other manufacturing industries.
Moreover, environmental management practices differed (with limited significance, p <

41
0.05) among countries such as Sweden, China, and India. This result was less expected.
Among 33 environmental management practices, only seven were implemented differently
across these countries. These practices were particularly related to innovation and suppliers,
including waste reduction (reactive), product development and innovation, supply chain
management, environmental standards for suppliers, environmental participation, specific
design targets, and corporate policies and procedures.
Nevertheless, a general pattern for sustainable practices implemented in the manufacturing
industry across different sectors could be seen. When implementing sustainable
improvement practices, companies often place different levels of emphasis on these
practices. The first priority is often given to economic sustainability practices, followed by
environmental ones, and finally social ones. In addition, when suppliers are involved in
sustainable initiatives, they mostly affect the focal company’s environmental practices,
often in a positive manner.
RQ3: What is the relationship between sustainable practices and company
performance, with the latter including environmental performance, social
performance, economic performance, operational performance, and innovation
performance?
This dissertation used different data sources and applied different methods of analysis, yet
with a holistic view of sustainability. The results supported the claim that investments in
sustainable practices can lead to improvements in company performance. Positive causal
relationships were found between overall sustainable improvement practices and overall
company performance. Several environmental management practices had strong
correlations with innovation performance, which can further improve financial performance.
Meanwhile, those manufacturing companies with good GRI indicators were also more
likely to perform well financially, particularly in terms of ROE. A moderating effect was
found for supplier involvement in focal companies’ sustainable initiatives. In other words,
supplier involvement can enhance the relationship between sustainable practices (especially
environmental practices) and company performance.

42
RQ4: What are the current sustainable operations practices and performance in the
Swedish manufacturing industry? In particular, how are Swedish manufacturers
configuring their sustainability strategy, and does supplier involvement affect Swedish
manufacturers’ sustainability?
Examining the Swedish manufacturing industry showed that the triple bottom line
represents a valid outline for interpreting a company’s sustainability practices in this
context. Nevertheless, when implementing environmental sustainability and social
sustainability improvement practices, companies often adopt relatively weak practices with
respect to social sustainability. Meanwhile, the sustainability performance in the Swedish
manufacturing industry is less diversified than the sustainability improvement practices.
There are different levels in the configuration of sustainability strategy in a manufacturing
network with multiple manufacturing locations. Economic sustainability is often considered
in a centralized manner by the focal company, whereas social sustainability is more
localized. In addition, environmental sustainability is often managed in a mixed pattern,
with a combination of centralized and localized strategies. Moreover, Swedish
manufacturers often employ a relatively high level of technology in developing their
products and processes. This study found a strong positive correlation between a
company’s process and product strategy and its sustainable practice and performance. More
specifically, if companies had a higher level of product and process technology, they had
better environmental practices and performance. Furthermore, better social practices and
performance were also detected in these companies.
To conclude, this dissertation contributes to the literature on sustainability operations
management in the manufacturing industry by offering empirical evidence and theory
development. Compared to previous studies conducted in this field, this dissertation
contributes to the development of an empirical foundation in the Swedish context, which
has been dominated by case studies. Furthermore, this dissertation synthesizes the strategic
and sustainability perspectives by investigating the configuration of sustainability
strategy—a topic that has not been examined in prior literature. This dissertation shows that
there is a “win-win” opportunity for the manufacturing industry in terms of sustainable
43
practice and company performance. A company’s sustainability is becoming even more
critical to remaining competitive in the market. To remain competitive, manufacturing
companies should transform their products, process, technology, business strategies, and
models to meet this sustainability challenge. Innovation is crucial for this transformation,
just as green cooperation with suppliers can enhance sustainability opportunities. Thus,
manufacturing companies should extend their sustainability efforts from a single plant to
the whole supply chain.
5.3 Future research
Companies now face not only economic competition in the market, but also environmental
and social pressures (Wu and Pagell, 2011). The tradeoffs between economic interests,
environmental impact, and social influence represent a topic that has been investigated by
academics and practitioners for many decades, and remains critical in the contemporary
climate. Based on the results of this dissertation, the following issues are proposed for
further investigation.
Since this study was conducted over a limited period of time, a longitudinal study of the
research topic has not been carried out. In a manufacturing company, manufacturing
strategy affects operations, but may do so with a time lag. Therefore, the results of this
study may differ from a long-term perspective. Thus, a longitudinal study should be
conducted to further verify the results. Furthermore, as the results showed, the
implementation of sustainable practices often occurs sequentially—from economic
practices, to environmental practices, to social ones. Therefore, manufacturing strategy,
sustainability practices, and performance could dynamically influence one another. In light
of these observations, a longitudinal study using the same survey instrument would be of
great interest.
Moreover, due to limited accessible data, the survey only targeted the Swedish
manufacturing industry. With the development of global supply chains, sustainable
manufacturing should also be considered within the context of the global operations of
multinational companies. In this case, the operations strategies and sustainability concerns
may differ between countries and regions. Therefore, additional effort should be given to

44
expanding and developing a solid database with which to further explore sustainable
manufacturing issues from a global perspective. This task will not be easy, but the outcome
will be extremely useful for defining a sustainable operations strategy in multinational
companies.
The third possible avenue for future research is to examine the interrelationship between
sustainability strategy and operations strategy. Such an inquiry is necessary for
investigating whether sustainability factors can be integrated into a company’s overall
operations strategy. Often, a manufacturing company defines its operations strategy with a
main focus on economic performance. As environmental and social aspects are becoming
more important in manufacturing, these factors should be integrated into operations strategy
in order for companies to sustain their development. In future research, multi-case studies
could be conducted to examine the effects of such an integration.
Multi-tier sustainable supply chains could be another topic for future studies. Companies
have increasing interest in developing sustainability across the whole supply chain.
Nevertheless, most studies on sustainable supply chains have only focused on extending
sustainability beyond the focal company to its first-tier suppliers. As such, there is a need to
increase the supply chain scope to include sub-suppliers. A large-scale survey is needed to
identify the contingencies in this field, such as the difference between managing
environmental sustainability, which is easily measured, and managing other social
sustainability issues, which are largely intangible. The sample companies should contain
multi-tier suppliers, and if possible, should represent different industries in different
countries and regions. In doing so, the sustainability management capabilities of suppliers
can be explored. Another study could examine the critical contingencies that define how
customers impose their sustainability concerns on the focal companies.

45
References
Abbott, W.F. & Monsen, R.J. 1979, "On the measurement of corporate social responsibility:
Self-reported disclosures as a method of measuring corporate social involvement",
Academy of Management Journal, vol. 22, no. 3, pp. 501-515.
Aerts, W., Cormier, D. & Magnan, M. 2006, "Intra-industry imitation in corporate
environmental reporting: An international perspective", Journal of Accounting and
Public Policy, vol. 25, no. 3, pp. 299-331.
Agle, B.R., Mitchell, R.K. & Sonnenfeld, J.A. 1999, "Who matters to CEOs? An
investigation of stakeholder attributes and salience, corporate performance, and CEO
values", Academy of Management Journal, vol. 42, no. 5, pp. 507-525.
Aiken, M. & Hage, J. 1968, "Organizational interdependence and intra-organizational
structure", American Sociological Review, pp. 912-930.
Alexander, G.J. & Buchholz, R.A. 1978, "Corporate social responsibility and stock market
performance", Academy of Management Journal, vol. 21, no. 3, pp. 479-486.
Anderson, J.C. & Frankle, A.W. 1980, "Voluntary social reporting: An iso-beta portfolio
analysis", Accounting Review, vol. 55, no. 3, pp. 467-479.
Ansoff, H.I. 1965, Corporate strategy: An analytic approach to business policy for growth
and expansion, Penguin Books, London.
APICS. 2005, APICS dictionary, no. 01102. APICS, Alexandria, VA.
Aras, G., Aybars, A. & Kutlu, O. 2010, "Managing corporate performance: Investigating
the relationship between corporate social responsibility and financial performance in
emerging markets", International Journal of Productivity and Performance
Management, vol. 59, no. 3, pp. 229-254.
Aupperle, K.E. 1984, "An empirical measure of corporate social orientation", Research in
Corporate Social Performance and Policy, vol. 6, pp. 27-54.
Ball, A. & Craig, R. 2010, "Using neo-institutionalism to advance social and environmental
accounting", Critical Perspectives on Accounting, vol. 21, no. 4, pp. 283-293.
Banaszak-Holl, J., Zinn, J.S. & Mor, V. 1996, "The impact of market and organizational
characteristics on nursing care facility service innovation: A resource dependency
perspective", Health Services Research, vol. 31, no. 1, pp. 97-117.
Barnard, C.I. 1968, The functions of the executive, Harvard University Press, Cambridge,
MA.

46
Baumann, C., Hamin, H., Bouvain, P., Baumann, C. & Lundmark, E. 2013, "Corporate
social responsibility in financial services: A comparison of Chinese and East Asian
banks vis-à-vis American banks", International Journal of Bank Marketing, vol. 31, no.
6, pp. 420-439.
Belkaoui, A. 1976, "The impact of the disclosure of the environmental effects of
organizational behavior on the market", Financial Management, vol. 5, no. 4, pp. 26-
31.
Bottomley, P.A. & Holden, S.J. 2001, "Do we really know how consumers evaluate brand
extensions? Empirical generalizations based on secondary analysis of eight studies",
Journal of Marketing Research, vol. 38, no. 4, pp. 494-500.
Brammer, S. & Millington, A. 2005, "Profit maximisation vs. agency: An analysis of
charitable giving by UK firms", Cambridge Journal of Economics, vol. 29, no. 4, pp.
517-534.
Brammer, S. & Millington, A. 2008, "Does it pay to be different? An analysis of the
relationship between corporate social and financial performance", Strategic
Management Journal, vol. 29, no. 12, pp. 1325-1343.
Brammer, S.J. & Pavelin, S. 2006, "Corporate reputation and social performance: The
importance of fit", Journal of Management Studies, vol. 43, no. 3, pp. 435-455.
Brenner, S.N. & Molander, E.A. 1977, "Is ethics of business changing", Harvard Business
Review, vol. 55, no. 1, pp. 57-71.
Brown, H.S., de Jong, M. & Levy, D.L. 2009, "Building institutions based on information
disclosure: Lessons from GRI's sustainability reporting", Journal of Cleaner
Production, vol. 17, no. 6, pp. 571-580.
Caniëls, M.C.J., Gehrsitz, M.H. & Semeijn, J. 2013, "Participation of suppliers in greening
supply chains: An empirical analysis of German automotive suppliers", Journal of
Purchasing and Supply Management, vol. 19, no. 3, pp. 134-143.
Carroll, A.B. 1979, "A three-dimensional conceptual model of corporate performance",
Academy of Management Review, vol. 4, no. 4, pp. 497-505.
Carter, C.R. & Rogers, D.S. 2008, "A framework of sustainable supply chain management:
Moving toward new theory", International Journal of Physical Distribution &
Logistics Management, vol. 38, no. 5, pp. 360-387.
Chen, C., Zhang, J. & Delaurentis, T. 2014, "Quality control in food supply chain
management: An analytical model and case study of the adulterated milk incident in
China", International Journal of Production Economics, vol. 152, pp. 188-199.
47
Chen, K.H. & Metcalf, R.W. 1980, "The relationship between pollution control record and
financial indicators revisited", Accounting Review, vol. 55, no.1, pp. 168-177.
Chen, L., Feldmann, A. & Tang, O. 2015, "The relationship between disclosures of
corporate social performance and financial performance: Evidences from GRI reports
in manufacturing industry", International Journal of Production Economics, Advance
online publication. doi:10.1016/j.ijpe.2015.04.004
Chen, S. & Bouvain, P. 2009, "Is corporate responsibility converging? A comparison of
corporate responsibility reporting in the USA, UK, Australia, and Germany", Journal
of Business Ethics, vol. 87, no. 1, pp. 299-317.
Chin, W.W. 1998, "The partial least squares approach to structural equation modeling",
Modern Methods for Business Research, vol. 295, no. 2, pp. 295-336.
Clarkson, M.E. 1995, "A stakeholder framework for analyzing and evaluating corporate
social performance", Academy of Management Review, vol. 20, no. 1, pp. 92-117.
Cochran, P.L. & Wood, R.A. 1984, "Corporate social responsibility and financial
performance", Academy of Management Journal, vol. 27, no. 1, pp. 42-56.
Cornell, B. & Shapiro, A.C. 1987, "Corporate stakeholders and corporate finance",
Financial Management, vol. 16, pp. 5-14.
Cowton, C.J. 1998, "The use of secondary data in business ethics research", Journal of
Business Ethics, vol. 17, no. 4, pp. 423-434.
Crane, A., Matten, D. & Spence, L.J. 2013, "Corporate social responsibility in a global
context", In: Crane, A., Matten, D., and Spence, L.J., eds. Corporate social
responsibility: Readings and cases in a global context, vol. 2, pp. 3-26, Routledge,
London.
Cronbach, L.J. 1987, "Statistical tests for moderator variables: Flaws in analyses recently
proposed", Psychological Bulletin, vol. 102, pp. 414-417.
Croom, S. 2009, "Introduction to research methodology in operations management", In: C.
Karlsson, ed. Researching operations management, pp. 43-83, Routledge, New York.
Donaldson, T. & Preston, L.E. 1995, "The stakeholder theory of the corporation: Concepts,
evidence, and implications", Academy of Management Review, vol. 20, no. 1, pp. 65-
91.
Dooley, R.S. & Lerner, L.D. 1994, "Pollution, profits, and stakeholders: The constraining
effect of economic performance on CEO concern with stakeholder expectations",
Journal of Business Ethics, vol. 13, no. 9, pp. 701-711.

48
Dyllick, T. & Hockerts, K. 2002, "Beyond the business case for corporate sustainability",
Business Strategy and the Environment, vol. 11, no. 2, pp. 130-141.
Eldenburg, L., Soderstrom, N., Willis, V. & Wu, A. 2010, "Behavioral changes following
the collaborative development of an accounting information system", Accounting,
Organizations and Society, vol. 35, no. 2, pp. 222-237.
Elkington J. 1997, Cannibals with Forks: The Triple Bottom Line of 21st Century Business,
Capstone, Oxford.
Emerson, R.M. 1962, "Power-dependence relations", American Sociological Review, vol.
27, no. 1, pp. 31-41.
Fauzi, H., Mahoney, L.S. & Abdul Rahman, A. 2007, "The link between corporate social
performance and financial performance: Evidence from Indonesian companies", Issues
in Social and Environmental Accounting, vol. 1, no. 1, pp. 149-159.
Fink, A. 2013, Conducting research literature reviews: From the Internet to paper, Sage,
Thousand Oaks, CA.
Flynn, B.B., Sakakibara, S., Schroeder, R.G., Bates, K.A. & Flynn, E.J. 1990, "Empirical
research methods in operations management", Journal of Operations Management, vol.
9, no. 2, pp. 250-284.
Fombrun, C. & Shanley, M. 1990, "What's in a name? Reputation building and corporate
strategy", Academy of Management Journal, vol. 33, no. 2, pp. 233-258.
Forza, C. 2002, "Survey research in operations management: A process-based perspective",
International Journal of Operations & Production Management, vol. 22, no. 2, pp.
152-194.
Fowler Jr, F.J. 2008, Survey research methods, Sage, Thousand Oaks, CA.
Friedman, M. 2007, The social responsibility of business is to increase its profits, Springer,
New York.
Gattiker, T.F. & Parente, D.H. 2007, "Introduction to the special issue on innovative data
sources for empirically building and validating theories in operations management",
Journal of Operations Management, vol. 25, no. 5, pp. 957-961.
Gefen, D., Straub, D. & Boudreau, M. 2000, "Structural equation modeling and regression:
Guidelines for research practice", Communications of the Association for Information
Systems, vol. 4, no. 1, pp. 7.

49
Godfrey, P.C., Merrill, C.B. & Hansen, J.M. 2009, "The relationship between corporate
social responsibility and shareholder value: An empirical test of the risk management
hypothesis", Strategic Management Journal, vol. 30, no. 4, pp. 425-445.
Goll, I. & Rasheed, A.A. 2004, "The moderating effect of environmental munificence and
dynamism on the relationship between discretionary social responsibility and firm
performance", Journal of Business Ethics, vol. 49, no. 1, pp. 41-54.
Griffin, J.J. & Mahon, J.F. 1997, "The corporate social performance and corporate financial
performance debate twenty-five years of incomparable research", Business & Society,
vol. 36, no. 1, pp. 5-31.
Hart, S.L. 1995, "A natural-resource-based view of the firm", Academy of Management
Review, vol. 20, no. 4, pp. 986-1014.
Heide, J.B. 1994, "Interorganizational governance in marketing channels", Journal of
Marketing, vol. 58, no. 1, pp. 71-85.
Herremans, I.M., Akathaporn, P. & McInnes, M. 1993, "An investigation of corporate
social responsibility reputation and economic performance", Accounting,
Organizations and Society, vol. 18, no. 7, pp. 587-604.
Hofer, C., Cantor, D.E. & Dai, J. 2012, "The competitive determinants of a firm's
environmental management activities: Evidence from US manufacturing industries",
Journal of Operations Management, vol. 30, no. 1, pp. 69-84.
Hollos, D., Blome, C. & Foerstl, K. 2012, "Does sustainable supplier co-operation affect
performance? Examining implications for the triple bottom line", International
Journal of Production Research, vol. 50, no. 11, pp. 2968-2986.
Huber, J. 2000, "Towards industrial ecology: sustainable development as a concept of
ecological modernization", Journal of environmental policy and planning, vol. 2, no. 4,
pp. 269-285.
Huber, J. 2008, "Technological environmental innovations (TEIs) in a chain-analytical and
life-cycle-analytical perspective", Journal of Cleaner Production, vol. 16, no. 18, pp.
1980-1986.
Hyvönen, J. 2007, "Strategy, performance measurement techniques and information
technology of the firm and their links to organizational performance", Management
Accounting Research, vol. 18, no. 3, pp. 343-366.
Ingram, R.W. & Frazier, K.B. 1980, "Environmental performance and corporate
disclosure", Journal of Accounting Research, vol. 18, no. 2, pp. 614-622.
50
Ittner, C.D. 2008, "Does measuring intangibles for management purposes improve
performance? A review of the evidence", Accounting and Business Research, vol. 38,
no. 3, pp. 261-272.
John, C.H.S., Cannon, A.R. & Pouder, R.W. 2001, "Change drivers in the new millennium:
Implications for manufacturing strategy research", Journal of Operations Management,
vol. 19, no. 2, pp. 143-160.
Joppe, M. 2000, The research process, Retrieved July 20, 2015, from
https://www.uoguelph.ca/hftm/glossary
Jöreskog, K.G. & Sörbom, D. 1982, "Recent developments in structural equation
modeling", Journal of Marketing Research, vol. 19, no. 4, pp. 404-416.
Kamins, M.A. Kamins & Stewart, D.W. 1993, Secondary research: Information sources
and methods, Sage, Thousand Oaks, CA.
Karake, Z.A. 1998, "An examination of the impact of organizational downsizing and
discrimination activities on corporate social responsibility as measured by a company's
reputation index", Management Decision, vol. 36, no. 3, pp. 206-216.
Karlsson, C. 2009, Researching operations management, Routledge, New York.
Kilbourne, W.E., Beckmann, S.C. & Thelen, E. 2002, "The role of the dominant social
paradigm in environmental attitudes: A multinational examination", Journal of
Business Research, vol. 55, no. 3, pp. 193-204.
Kleindorfer, P.R., Singhal, K. & Wassenhove, L.N. 2005, "Sustainable operations
management", Production and Operations Management, vol. 14, no. 4, pp. 482-492.
Kobeissi, N. & Damanpour, F. 2009, "Corporate responsiveness to community stakeholders
effects of contextual and organizational characteristics", Business & Society, vol. 48,
no. 3, pp. 326-359.
Kreiner, P. & Bhambri, A. 1988, "Influence and information in organization-stakeholder
relationships", Academy of Management Best Papers Proceedings, p. 319.
Lamond, D., Dwyer, R., Arendt, S. & Brettel, M. 2010, "Understanding the influence of
corporate social responsibility on corporate identity, image, and firm performance",
Management Decision, vol. 48, no. 10, pp. 1469-1492.
Lamond, D., Dwyer, R., Gallego-Álvarez, I., Prado-Lorenzo, J., Rodríguez-Domínguez, L.
& García-Sánchez, I. 2010, "Are social and environmental practices a marketing tool?
Empirical evidence for the biggest European companies", Management Decision, vol.
48, no. 10, pp. 1440-1455.
51
Lee, D.D., Faff, R.W. & Langfield-Smith, K. 2009, "Revisiting the vexing question: Does
superior corporate social performance lead to improved financial performance?",
Australian Journal of Management, vol. 34, no. 1, pp. 21-49.
Lee, S., Seo, K. & Sharma, A. 2013, "Corporate social responsibility and firm performance
in the airline industry: The moderating role of oil prices", Tourism Management, vol.
38, no. 0, pp. 20-30.
Liedtka, J.M. 1992, "Exploring ethical issues using personal interviews", Business Ethics
Quarterly, , pp. 161-181.
López, M.V., Garcia, A. & Rodriguez, L. 2007, "Sustainable development and corporate
performance: A study based on the Dow Jones sustainability index", Journal of
Business Ethics, vol. 75, no. 3, pp. 285-300.
Lu, W., Chau, K., Wang, H. & Pan, W. 2014, "A decade's debate on the nexus between
corporate social and corporate financial performance: A critical review of empirical
studies 2002–2011", Journal of Cleaner Production, vol. 79, pp. 195-206.
Lu, W., Wang, W. & Lee, H. 2013, "The relationship between corporate social
responsibility and corporate performance: Evidence from the US semiconductor
industry", International Journal of Production Research, vol. 51, no. 19, pp. 5683-
5695.
Luken, R. & Stares, R. 2005, "Small business responsibility in developing countries: A
threat or an opportunity?", Business Strategy and the Environment, vol. 14, no. 1, pp.
38-53.
Luo, X. & Bhattacharya, C.B. 2006, "Corporate social responsibility, customer satisfaction,
and market value", Journal of Marketing, vol. 70, no. 4, pp. 1-18.
Luo, X. & Bhattacharya, C.B. 2009, "The debate over doing good: Corporate social
performance, strategic marketing levers, and firm-idiosyncratic risk", Journal of
Marketing, vol. 73, no. 6, pp. 198-213.
Machi, L.A. & McEvoy, B.T. 2012, The literature review: Six steps to success, Corwin
Press, Newbury Park, CA.
Malhotra, M.K. & Grover, V. 1998, "An assessment of survey research in POM: From
constructs to theory", Journal of Operations Management, vol. 16, no. 4, pp. 407-425.
Marimon, F., Alonso-Almeida, M.d.M., Rodríguez, M.d.P. & Cortez Alejandro, K.A. 2012,
"The worldwide diffusion of the global reporting initiative: What is the point?",
Journal of Cleaner Production, vol. 33, no. 0, pp. 132-144.

52
Marom, I.Y. 2006, "Toward a unified theory of the CSP–CFP link", Journal of Business
Ethics, vol. 67, no. 2, pp. 191-200.
McGuire, J.B., Sundgren, A. & Schneeweis, T. 1988, "Corporate social responsibility and
firm financial performance", Academy of Management Journal, vol. 31, no. 4, pp. 854-
872.
McPeak, C., Devirian, J. & Seaman, S. 2010, "Do environmentally friendly companies
outperform the market?", Journal of Global Business Issues, vol. 4, no. 1.
McWilliams, A. & Siegel, D. 2001, "Corporate social responsibility: A theory of the firm
perspective", Academy of Management Review, vol. 26, no. 1, pp. 117-127.
Montabon, F., Sroufe, R. & Narasimhan, R. 2007, "An examination of corporate reporting,
environmental management practices and firm performance", Journal of Operations
Management, vol. 25, no. 5, pp. 998-1014.
Murphy, J. & Gouldson, A. 2000, "Environmental policy and industrial innovation:
Integrating environment and economy through ecological modernisation", Geoforum,
vol. 31, no. 1, pp. 33-44.
Orlitzky, M. 2011, "Institutional logics in the study of organizations", Business Ethics
Quarterly, vol. 21, no. 3, pp. 409-444.
Ortas, E. & Moneva, J.M. 2011, "Sustainability stock exchange indexes and investor
expectations: Multivariate evidence from DJSI-Stoxx", Spanish Journal of Finance
and Accounting/Revista Española de Financiación y Contabilidad, vol. 40, no. 151, pp.
395-416.
Parmigiani, A., Klassen, R.D. & Russo, M.V. 2011, "Efficiency meets accountability:
Performance implications of supply chain configuration, control, and capabilities",
Journal of Operations Management, vol. 29, no. 3, pp. 212-223.
Patten, D.M. 1990, "The market reaction to social responsibility disclosures: The case of
the Sullivan principles signings", Accounting, Organizations and Society, vol. 15, no. 6,
pp. 575-587.
Peinado-Vara, E. 2006, "Corporate social responsibility in Latin America", Journal of
Corporate Citizenship, vol. 2006, no. 21, pp. 61-69.
Pfeffer, J. & Salancik, G.R. 1978, The External Control of Organizations: A Resource
Dependence Perspective, Harper & Row, New York.
Powell, W.W. & DiMaggio, P.J. 2012, The new institutionalism in organizational analysis,
University of Chicago Press, Chicago.

53
Preston, L.E. & O’Bannon, D.P. 1997, "The corporate social-financial performance
relationship", Business & Society, vol. 36, no. 4, pp. 419-429.
Randall, D.M. & Fernandes, M.F. 1991, "The social desirability response bias in ethics
research", Journal of Business Ethics, vol. 10, no. 11, pp. 805-817.
Re, F.R.R. & Reed, D. 1983, "Stockholders and stakeholders: A new perspective in
corporate governance", California Management Review, vol. 25, pp. 88-106.
Reimann, B.C. 1975, "Organizational effectiveness and management's public values: A
canonical analysis", Academy of Management Journal, vol. 18, no. 2, pp. 224-241.
Roman, R.M., Hayibor, S. & Agle, B.R. 1999, "The relationship between social and
financial performance repainting a portrait", Business & Society, vol. 38, no. 1, pp.
109-125.
Rossi, P.H., Wright, J.D. & Anderson, A.B. 2013, Handbook of survey research, Academic
Press, San Diego, CA.
Rungtusanatham, M.J., Choi, T.Y., Hollingworth, D.G., Wu, Z. & Forza, C. 2003, "Survey
research in operations management: historical analyses", Journal of Operations
Management, vol. 21, no. 4, pp. 475-488.
Russo, M.V. & Fouts, P.A. 1997, "A resource-based perspective on corporate
environmental performance and profitability", Academy of Management Journal, vol.
40, no. 3, pp. 534-559.
Salama, A., Anderson, K. & Toms, J. 2011, "Does community and environmental
responsibility affect firm risk? Evidence from UK panel data 1994–2006", Business
Ethics: A European Review, vol. 20, no. 2, pp. 192-204.
Sarkis, J., Zhu, Q. & Lai, K. 2011, "An organizational theoretic review of green supply
chain management literature", International Journal of Production Economics, vol.
130, no. 1, pp. 1-15.
Scott, W.R. 1987, "The adolescence of institutional theory", Administrative Science
Quarterly, vol. 32, no. 4, pp. 493-511.
Seifert, B., Morris, S.A. & Bartkus, B.R. 2003, "Comparing big givers and small givers:
Financial correlates of corporate philanthropy", Journal of Business Ethics, vol. 45, no.
3, pp. 195-211.
Seifert, B., Morris, S.A. & Bartkus, B.R. 2004, "Having, giving, and getting: Slack
resources, corporate philanthropy, and firm financial performance", Business &
Society, vol. 43, no. 2, pp. 135-161.

54
Selznick, P. 1948, "Foundations of the theory of organization", American Sociological
Review, vol. 13, no. 1, pp. 25-35.
Seuring, S. & Müller, M. 2008, "From a literature review to a conceptual framework for
sustainable supply chain management", Journal of Cleaner Production, vol. 16, no. 15,
pp. 1699-1710.
Shrivastava, P. 1995, "The role of corporations in achieving ecological sustainability",
Academy of Management Review, vol. 20, no. 4, pp. 936-960.
Singh, P.J., Power, D. & Chuong, S.C. 2011, "A resource dependence theory perspective of
ISO 9000 in managing organizational environment", Journal of Operations
Management, vol. 29, no. 1, pp. 49-64.
Singleton Jr, R.A., Straits, B.C. & Straits, M.M. 1993, Approaches to social research .
Oxford University Press, Oxford.
Søndergård, B., Hansen, O.E. & Holm, J. 2004, "Ecological modernisation and institutional
transformations in the Danish textile industry", Journal of Cleaner Production, vol. 12,
no. 4, pp. 337-352.
Spencer, B.A. & Taylor, G.S. 1987, "A within and between analysis of the relationship
between corporate social-responsibility and financial performance", Akron Business
and Economic Review, vol. 18, no. 3, pp. 7-18.
Spicer, B.H. 1978, "Investors, corporate social performance and information disclosure: An
empirical study", Accounting Review, vol. 53, no. 1, pp. 94-111.
Stanciu, S., Dumitrascu, L., Ion, R.M., Nistor, C. & Stanciuc, N. 2013, "The effects of
horse meat scandal on Romanian meat market", SEA–Practical Application of Science,
vol. 3, no. 01, pp. 174-181.
Statistics Sweden "Swedish Standard Industrial Classification (SNI)." Available online at
http://www.scb.se/en_/Documentation/Classifications-and-standards/Swedish-
Standard-Industrial-Classification-SNI/ (2015-06-10).
Surroca, J. & Tribó, J.A. 2008, "Managerial entrenchment and corporate social
performance", Journal of Business Finance & Accounting, vol. 35, no. 56, pp. 748-789.
Sweeney, L. & Coughlan, J. 2008, "Do different industries report corporate social
responsibility differently? An investigation through the lens of stakeholder theory",
Journal of Marketing Communications, vol. 14, no. 2, pp. 113-124.
Taneja, S.S., Taneja, P.K. & Gupta, R.K. 2011, "Researches in corporate social
responsibility: A review of shifting focus, paradigms, and methodologies", Journal of
Business Ethics, vol. 101, no. 3, pp. 343-364.

55
Tang, O. & Musa, S.N. 2011, "Identifying risk issues and research advancements in supply
chain risk management", International Journal of Production Economics, vol. 133, no.
1, pp. 25-34.
Tang, Z., Hull, C.E. & Rothenberg, S. 2012, "How corporate social responsibility
engagement strategy moderates the CSR–financial performance relationship", Journal
of Management Studies, vol. 49, no. 7, pp. 1274-1303.
Tate, W.L., Ellram, L.M. & Kirchoff, J.F. 2010, "Corporate social responsibility reports: a
thematic analysis related to supply chain management", Journal of Supply Chain
Management, vol. 46, no. 1, pp. 19-44.
Ullmann, A.A. 1985, "Data in search of a theory: A critical examination of the relationships
among social performance, social disclosure, and economic performance of US firms",
Academy of Management Review, vol. 10, no. 3, pp. 540-557.
Ulrich, D. & Barney, J.B. 1984, "Perspectives in organizations: Resource dependence,
efficiency, and population", Academy of Management Review, vol. 9, no. 3, pp. 471-
481.
Urbach, N. & Ahlemann, F. 2010, "Structural equation modeling in information systems
research using partial least squares", Journal of Information Technology Theory and
Application, vol. 11, no. 2, pp. 5-40.
Vachon, S. & Klassen, R.D. 2008, "Environmental management and manufacturing
performance: The role of collaboration in the supply chain", International Journal of
Production Economics, vol. 111, no. 2, pp. 299-315.
Vance, S.C. 1975, "Are socially responsible corporations good investment risks",
Management Review, vol. 64, no. 8, pp. 19-24.
Vartanian, T.P. 2010, Secondary data analysis, Oxford University Press, Oxford.
Venkatraman, N. & Ramanujam, V. 1986, "Measurement of business performance in
strategy research: A comparison of approaches", Academy of Management Review, vol.
11, no. 4, pp. 801-814.
Veronica Siregar, S. & Bachtiar, Y. 2010, "Corporate social reporting: Empirical evidence
from Indonesia Stock Exchange", International Journal of Islamic and Middle Eastern
Finance and Management, vol. 3, no. 3, pp. 241-252.
Waddock, S.A. & Graves, S.B. 1997, "The corporate social performance-financial
performance link", Strategic Management Journal, vol. 18, no. 4, pp. 303-319.
Walley, N. & Whitehead, B. 1994, "It's not easy being green", Reader in Business and the
Environment, vol. 36, pp. 81.

56
Wang, M., Qiu, C. & Kong, D. 2011, "Corporate social responsibility, investor behaviors,
and stock market returns: evidence from a natural experiment in China", Journal of
Business Ethics, vol. 101, no. 1, pp. 127-141.
Williams, H.E., Medhurst, J. & Drew, K. 1993, "Corporate strategies for a sustainable
future", In: K. Fischer & J. Schot, eds. Environmental strategies for industry:
International perspectives on research needs and policy implications, pp. 117-146,
Island Press, Washington, DC.
Wolfe, R. 1991, "The use of content analysis to assess corporate social responsibility",
Research in Corporate Social Performance and Policy, vol. 12, pp. 281-307.
Wu, Z. & Pagell, M. 2011, "Balancing priorities: Decision-making in sustainable supply
chain management", Journal of Operations Management, vol. 29, no. 6, pp. 577-590.
Zahra, S.A. 1995, "Corporate entrepreneurship and financial performance: The case of
management leveraged buyouts", Journal of Business Venturing, vol. 10, no. 3, pp.
225-247.
Zhu, Q. & Sarkis, J. 2004, "Relationships between operational practices and performance
among early adopters of green supply chain management practices in Chinese
manufacturing enterprises", Journal of Operations Management, vol. 22, no. 3, pp.
265-289.
Zhu, Q. & Sarkis, J. 2007, "The moderating effects of institutional pressures on emergent
green supply chain practices and performance", International Journal of Production
Research, vol. 45, no. 18-19, pp. 4333-4355.
Zhu, Q., Sarkis, J. & Lai, K. 2012, "Green supply chain management innovation diffusion
and its relationship to organizational improvement: An ecological modernization
perspective", Journal of Engineering and Technology Management, vol. 29, no. 1, pp.
168-185.
Zutshi, A., Creed, A. & Sohal, A. 2009, "Child labour and supply chain: Profitability or
(mis) management", European Business Review, vol. 21, no. 1, pp. 42-63.

57
Appendix A-English translation of questionnaire
Dear Sir/Madam:
The purpose of this survey is to investigate issues related to sustainability in Swedish
manufacturing industry. This questionnaire is conducted by researchers from Linköping
University and Kungliga Tekniska Högskolan (KTH). The survey will only take you 10-15
minutes to fulfill, but will provide valuable input for research. The questionnaire is
voluntary and the data collected is strictly confidential. Answers from individual
participants will NOT be identified and you have the option not to answer a particular
question. The data collected will not be used for anything other than research. If you have
any questions for the survey please contact Lujie Chen with [email protected] or by phone
with 0765680008.
Your contribution is important for our research and the development of Swedish
manufacturing industry. We really appreciate your help!
Thank you!
Lujie Chen
Division of Production Economics, Department of Management and Engineering,
Linköping University, Sweden
Dr. Andreas Feldmann
Division of Industrial Management, Department of Industrial Economics and Management,
Royal Institute of Technology, Sweden
Prof. Ou Tang
Division of Production Economics, Department of Management and Engineering,
Linköping University, Sweden

58
A01 Which position do you hold at the company?_______________________
A02 For how many years have you been working in manufacturing industry?
☐Less than 2 years
☐3 to 5 years
☐6 to 8 years
☐More than 8 years
A03 Would you be interested in participating in future research in the area?
☐Yes
☐No
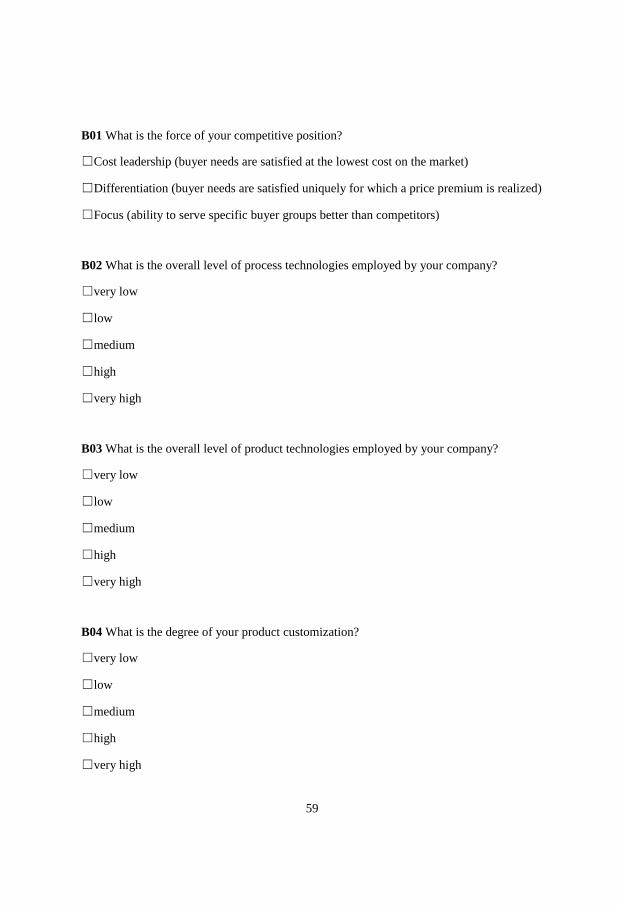
59
B01 What is the force of your competitive position?
☐Cost leadership (buyer needs are satisfied at the lowest cost on the market)
☐Differentiation (buyer needs are satisfied uniquely for which a price premium is realized)
☐Focus (ability to serve specific buyer groups better than competitors)
B02 What is the overall level of process technologies employed by your company?
☐very low
☐low
☐medium
☐high
☐very high
B03 What is the overall level of product technologies employed by your company?
☐very low
☐low
☐medium
☐high
☐very high
B04 What is the degree of your product customization?
☐very low
☐low
☐medium
☐high
☐very high

60
Describe your global footprint in term of share of employees per region? (The sum should
be 100 %)
B05_1 Europe_______
B06_1 America______
B07_1 Asia______
B08_1 Oceania______
B09_1 Africa______
B10_1 Others______
VAR07C Comment on global footprint______________________
How influential is each of the following in driving your company’s attention to
sustainability?
very
low
low medium high very
high
B11 Government and regulator ☐ ☐ ☐ ☐ ☐
B12 Advisory board ☐ ☐ ☐ ☐ ☐
B13 Line leaders ☐ ☐ ☐ ☐ ☐
B14 Advocacy organizations and NGOs (Non
Governmental Organizations) ☐ ☐ ☐ ☐ ☐
B15 Customers ☐ ☐ ☐ ☐ ☐

61
Do you have goals for the following areas?
No
goals
Goals Goals with
numerical targets
C01 Cost e.g: labor cost, energy cost, material
cost, facility cost, logistic cost ☐ ☐ ☐
C02 Economic stability e.g: favorable tax,
exchange rate fluctuations ☐ ☐ ☐
C03 Market
e.g: international markets and potential
demand
☐ ☐ ☐
C04 Growth
e.g: sales growth and growth in market share ☐ ☐ ☐
Where are these goals set? (Skip this question if you are in an organization with only one
site)
Locally Mostly locally Mixed Mostly centrally Centrally
C05 Cost ☐ ☐ ☐ ☐ ☐
C06 Market ☐ ☐ ☐ ☐ ☐
C07 Economic stability ☐ ☐ ☐ ☐ ☐
C08 Growth ☐ ☐ ☐ ☐ ☐
C09 To what degree are suppliers involved in the work related to the economic perspective
(cost, market, economic stability, growth)?
☐very low
☐low
☐medium
☐high
☐very high
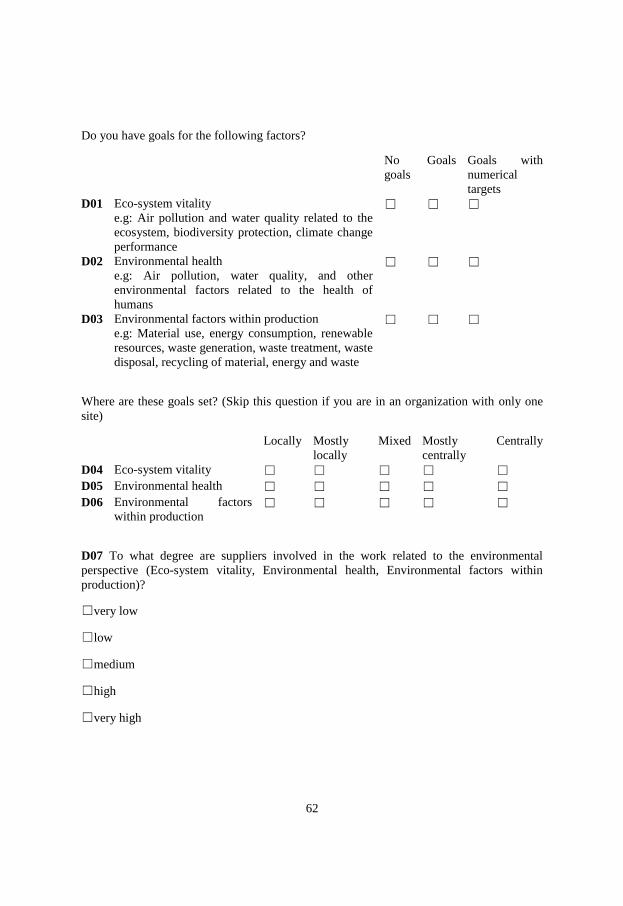
62
Do you have goals for the following factors?
No
goals
Goals Goals with
numerical
targets
D01 Eco-system vitality
e.g: Air pollution and water quality related to the
ecosystem, biodiversity protection, climate change
performance
☐ ☐ ☐
D02 Environmental health
e.g: Air pollution, water quality, and other
environmental factors related to the health of
humans
☐ ☐ ☐
D03 Environmental factors within production
e.g: Material use, energy consumption, renewable
resources, waste generation, waste treatment, waste
disposal, recycling of material, energy and waste
☐ ☐ ☐
Where are these goals set? (Skip this question if you are in an organization with only one
site)
Locally Mostly
locally
Mixed Mostly
centrally
Centrally
D04 Eco-system vitality ☐ ☐ ☐ ☐ ☐
D05 Environmental health ☐ ☐ ☐ ☐ ☐
D06 Environmental factors
within production ☐ ☐ ☐ ☐ ☐
D07 To what degree are suppliers involved in the work related to the environmental
perspective (Eco-system vitality, Environmental health, Environmental factors within
production)?
☐very low
☐low
☐medium
☐high
☐very high
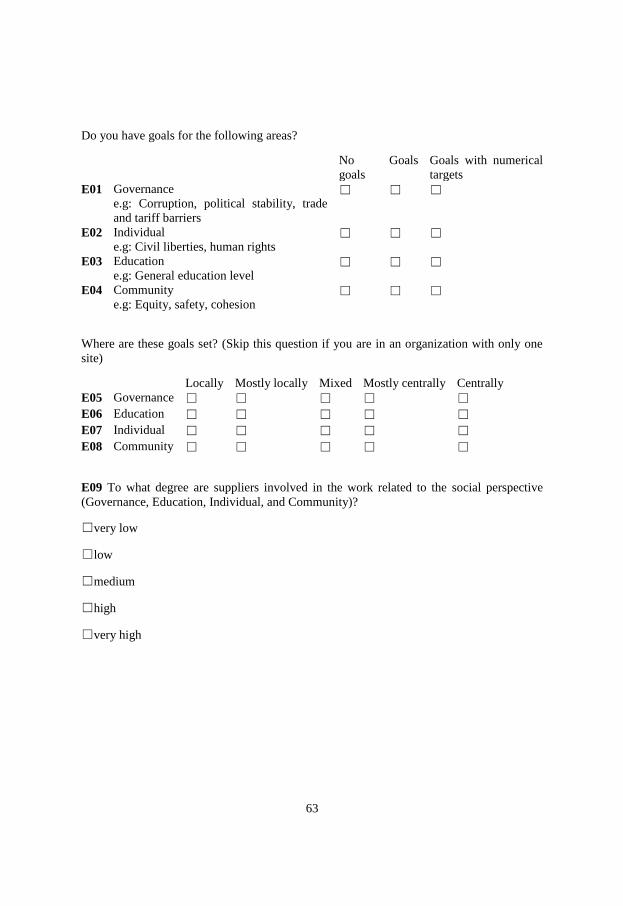
63
Do you have goals for the following areas?
No
goals
Goals Goals with numerical
targets
E01 Governance
e.g: Corruption, political stability, trade
and tariff barriers
☐ ☐ ☐
E02 Individual
e.g: Civil liberties, human rights ☐ ☐ ☐
E03 Education
e.g: General education level ☐ ☐ ☐
E04 Community
e.g: Equity, safety, cohesion ☐ ☐ ☐
Where are these goals set? (Skip this question if you are in an organization with only one
site)
Locally Mostly locally Mixed Mostly centrally Centrally
E05 Governance ☐ ☐ ☐ ☐ ☐
E06 Education ☐ ☐ ☐ ☐ ☐
E07 Individual ☐ ☐ ☐ ☐ ☐
E08 Community ☐ ☐ ☐ ☐ ☐
E09 To what degree are suppliers involved in the work related to the social perspective
(Governance, Education, Individual, and Community)?
☐very low
☐low
☐medium
☐high
☐very high

64
Rate the following areas based on the amount of effort put into improving them?
very
low
low medium high very
high
F01 Cost
e.g: labor cost, energy cost, material cost,
facility cost, logistic cost
☐ ☐ ☐ ☐ ☐
F02 Economic stability
e.g: favorable tax, exchange rate fluctuations ☐ ☐ ☐ ☐ ☐
F03 Market
e.g: international markets and potential
demand
☐ ☐ ☐ ☐ ☐
F04 Growth
e.g: sales growth and growth in market share ☐ ☐ ☐ ☐ ☐
F05 Eco-system vitality
e.g: Air pollution and water quality related to
the ecosystem, biodiversity protection, climate
change performance
☐ ☐ ☐ ☐ ☐
F06 Environmental health
e.g: Air pollution, water quality, and other
environmental factors related to the health of
humans
☐ ☐ ☐ ☐ ☐
F07 Environmental factors within production
e.g: Material use, energy consumption,
renewable resources, waste generation, waste
treatment, waste disposal, recycling of
material, energy and waste
☐ ☐ ☐ ☐ ☐
F08 Governance
e.g: Corruption, political stability, trade and
tariff barriers
☐ ☐ ☐ ☐ ☐
F09 Education
e.g: General education level ☐ ☐ ☐ ☐ ☐
F10 Individual
e.g: Civil liberties, human rights ☐ ☐ ☐ ☐ ☐
F11 Community
e.g: Equity, safety, cohesion ☐ ☐ ☐ ☐ ☐
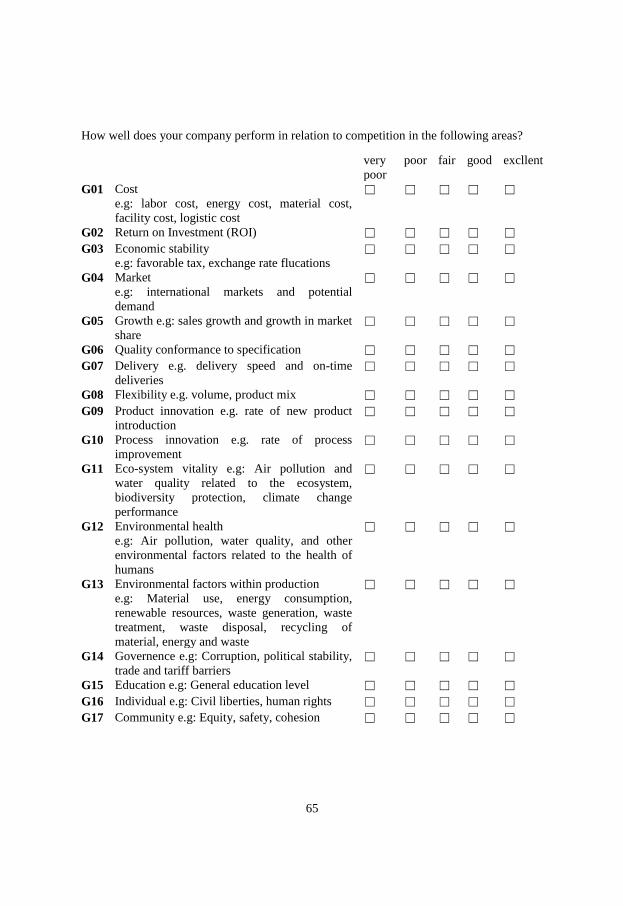
65
How well does your company perform in relation to competition in the following areas?
very
poor
poor fair good excllent
G01 Cost
e.g: labor cost, energy cost, material cost,
facility cost, logistic cost
☐ ☐ ☐ ☐ ☐
G02 Return on Investment (ROI) ☐ ☐ ☐ ☐ ☐
G03 Economic stability
e.g: favorable tax, exchange rate flucations ☐ ☐ ☐ ☐ ☐
G04 Market
e.g: international markets and potential
demand
☐ ☐ ☐ ☐ ☐
G05 Growth e.g: sales growth and growth in market
share ☐ ☐ ☐ ☐ ☐
G06 Quality conformance to specification ☐ ☐ ☐ ☐ ☐
G07 Delivery e.g. delivery speed and on-time
deliveries ☐ ☐ ☐ ☐ ☐
G08 Flexibility e.g. volume, product mix ☐ ☐ ☐ ☐ ☐
G09 Product innovation e.g. rate of new product
introduction ☐ ☐ ☐ ☐ ☐
G10 Process innovation e.g. rate of process
improvement ☐ ☐ ☐ ☐ ☐
G11 Eco-system vitality e.g: Air pollution and
water quality related to the ecosystem,
biodiversity protection, climate change
performance
☐ ☐ ☐ ☐ ☐
G12 Environmental health
e.g: Air pollution, water quality, and other
environmental factors related to the health of
humans
☐ ☐ ☐ ☐ ☐
G13 Environmental factors within production
e.g: Material use, energy consumption,
renewable resources, waste generation, waste
treatment, waste disposal, recycling of
material, energy and waste
☐ ☐ ☐ ☐ ☐
G14 Governence e.g: Corruption, political stability,
trade and tariff barriers ☐ ☐ ☐ ☐ ☐
G15 Education e.g: General education level ☐ ☐ ☐ ☐ ☐
G16 Individual e.g: Civil liberties, human rights ☐ ☐ ☐ ☐ ☐
G17 Community e.g: Equity, safety, cohesion ☐ ☐ ☐ ☐ ☐

66

67
Appendix B-The author’s contributions to the appended papers
For this doctoral dissertation “Sustainability and company performance: Evidence from the
manufacturing industry,” the author Lujie Chen’s contribution to each appended paper is
summarized below.
Paper 1
Chen, L., Olhager, J. & Tang, O. 2014, “Manufacturing facility location and sustainability:
A literature review and research agenda”, International Journal of Production Economics,
vol. 149, pp. 154-163.
Paper 1 was co-authored with Prof. Jan Olhager and Prof. Ou Tang. Lujie Chen took
the leading role in initiating the research idea. The authors jointly contributed to the data
collection, data analysis, and writing process.
Paper 2
Chen, L., Tang, O. & Feldmann, A. 2015, “Applying GRI reports for the investigation of
environmental management practices and company performance in Sweden, China and
India”, Journal of Cleaner Production, vol. 98, pp. 36-46.
Paper 2 was co-authored with Prof. Ou Tang and Dr. Andreas Feldmann. Lujie Chen
took the leading role in initiating the research idea and was largely responsible for the
whole research process, analysis of the final results, and writing.
Paper 3
Chen, L., Feldmann, A. & Tang, O. 2015, “The relationship between disclosures of
corporate social performance and financial performance: Evidences from GRI reports in
manufacturing industry”, International Journal of Production Economics, Advance online
publication, doi:10.1016/j.ijpe.2015.04.004
Paper 3 was co-authored with Dr. Andreas Feldmann and Prof. Ou Tang. Lujie Chen
took the leading role in initiating the research idea and was largely responsible for the
whole research process, analysis of the final results, and writing.
Paper 4
Chen, L., Feldmann, A. & Tang, O. 2014, “An empirical evaluation of sustainable
operations practices and performance in the Swedish manufacturing industry”
Paper 4 was co-authored with Dr. Andreas Feldmann and Prof. Ou Tang. Lujie Chen
took the leading role in initiating the research idea and was largely responsible for the
whole research process, analysis of the final results, and writing.
Paper 5
Chen, L. & Tang, O. 2015, “Does supplier involvement affect manufacturers’
sustainability?”
Paper 5 was co-authored with Prof. Ou Tang. Lujie Chen took the leading role in
initiating the research idea and was largely responsible for the whole research process,
analysis of the final results, and writing.

68

IPAPER


Manufacturing facility location and sustainability: A literature reviewand research agenda
Lujie Chen a,n, Jan Olhager b, Ou Tang a
a Department of Management and Engineering, Linköping University, SE-581 83 Linköping, Swedenb Department of Industrial Management and Logistics, Lund University, SE-221 00 Lund, Sweden
a r t i c l e i n f o
Article history:Received 13 April 2012Accepted 6 May 2013Available online 22 May 2013
Keywords:Corporate social responsibility (CSR)EnvironmentFacility locationManufacturingSustainability
a b s t r a c t
The perspectives on the manufacturing footprint of global firms are widening from the economic aspectsto also include the environmental and social aspects. Thus, sustainability is becoming an important issuefor the location of manufacturing facilities. It is therefore timely to review the relevant aspects anddimensions in the extant literature to investigate the relationship between sustainability and facilitylocation. In this paper, we aim to understand how sustainability aspects are included in decision-makingconcerning manufacturing facility locations and the role of location in evaluating manufacturingsustainability. We examine the literature streams on sustainability and facility location. A comprehensivesearch includes peer-reviewed literature from 1990 to 2011. We propose a literature classification schemewith respect to focal area and research methodology. The content analysis identifies the environmental,social and economic perspectives and factors affecting location decisions. We synthesize the findings intoa framework for taking sustainability aspects into account in manufacturing facility location decision-making. We also propose a research agenda for further research on sustainable locations.
& 2013 Elsevier B.V. All rights reserved.
1. Introduction
The facility location problem has been around for a long time.In general, it concerns the geographical positioning of facilities fora specific organizational entity, such as a company. As such, it is astrategic decision related to the configuration of the manufacturingnetwork. As competition becomes global and the complexity of theenvironment in which companies operate is increasing, managingan integrated international network has become an increasinglyimportant task for managers (Ferdows, 1997, 2009). Traditionally,the objective has been to derive a cost-optimal distribution offacilities with respect to the location of markets (customers) andraw materials (suppliers). More recently, access to skills and knowl-edge has been added as a major strategic factor that affects locationdecisions (Ferdows, 1997; Vereecke et al., 2006; Feldmann andOlhager, in press). Manufacturing companies that have more thanone plant can gain insights on markets, products, and processes bymanaging a group of plants as a manufacturing network. In practice,this can lead to a complete reconfiguration of the manufacturingnetwork such as in the cases of Digital (Arntzen et al., 1995) andProcter & Gamble (Camm et al., 1997). In other cases, the changes tothe manufacturing network may be more incremental such as
opening up of a new facility or closing down an existing one. Theremay be different strategic reasons for the location decisions fordifferent manufacturing facilities, such as access to low-cost man-ufacturing, proximity to market, and access to skills and knowledge(Ferdows, 1997). Thus, deciding on the “optimal” set and location ofmanufacturing facilities is becoming increasingly difficult.
The literature on facility location can be broadly classified intotwo areas: factor assessment and mathematical approaches. Thefactor assessment approach often has a focus on strategic issues indecision making and it can be generalized into four steps:(i) establish the critical success factors of the business, (ii) assessoptions for regional manufacturing configurations, (iii) define anumber of potential sites, and (iv) rank the most suitable solutions(Reid and Sanders, 2010). Implicitly, economic performance hasbeen the driver for selecting critical success factors. Also, themathematical approaches are typically formulated as cost mini-mization and profit maximization problems; cf. e.g. Melo et al.(2009), Drezner and Hamacher (2004). Thus, the economic dimen-sion of sustainability has historically dominated the locationproblem.
However, environmental and social issues have gained impor-tance in recent years as organizations seek competitive advantage(Dou and Sarkis, 2010; Kleindorfer et al., 2005; Seuring and Müller,2008). Technology and geopolitics enable and accelerate thecompanies to extend their manufacturing network globally. Also,the customer and supply bases are increasingly global. With widermanufacturing footprint, global markets, and global supply base,
Contents lists available at ScienceDirect
journal homepage: www.elsevier.com/locate/ijpe
Int. J. Production Economics
0925-5273/$ - see front matter & 2013 Elsevier B.V. All rights reserved.http://dx.doi.org/10.1016/j.ijpe.2013.05.013
n Corresponding author. Tel.: +46 13 281770; fax: +46 13 281101.E-mail addresses: [email protected] (L. Chen), [email protected] (J. Olhager),
[email protected] (O. Tang).
Int. J. Production Economics 149 (2014) 154–163

the question of location is becoming increasingly important,particularly for the facilities that are owned by the manufacturingcompany. The economic, environmental, and social dimensionsmake up the so-called triple bottom line (3BL) accounting reportconcerning the relationship of profit, people, and the planet (the3P's); cf. Kleindorfer et al. (2005). Many authors refer to the UNBrundtland Commission (WCED, 1987) concerning the overarchingobjective of sustainable development; i.e. “meeting the needs ofthe present without comprising the ability of future generations tomeet their own needs”.
Consequently, it is becoming increasingly necessary for manu-facturing firms to include all aspects and dimensions of sustain-ability in their manufacturing facility location decisions. Evenwhen a facility is selected locally, there is need to integratesustainability factors to reach economic, social, and environmentalbenefits from local innovation and collaboration with local custo-mers and suppliers (Theyel, 2012). The right location choice canhelp the company gain competitive advantages and improveoperational performance; not only in the short term but also inthe long term. For example, environmental degradation is becom-ing an important concern in manufacturing industry. Whenmanufacturers outsource to a low-cost countries, operations maybe halted for months due to water scarcity, earthquakes, andthunderstorms (Economy and Lieberthal, 2007). Economy andLieberthal (2007) propose that multinational companies shouldproactively implement environmental protection efforts, forinstance by introducing programs to build facilities and developtechnologies that are required for environmental protection. Also,corporate social responsibility (CSR) aspects concerning culturaldifference and ethical values should also be taking into considera-tion when a manufacturing network is extending into multiplecountries. Underage labor may be considered a normal means forsurvival in some countries, but is not ethically acceptable in manydeveloped countries.
The research literature on the combination of manufacturingfacility location and sustainability is still at an early stage butgrowing. Terouhid et al. (2012) found 38 papers in their review,focusing on location and siting models. Therefore, it is timely toconduct a broad analysis of the state of the art on sustainabilityaspects related to manufacturing facility location, by providing asystematic literature review, synthesize the findings into a frame-work and identifying areas for future research. In this review, weperform an independent and structured search strategy with abroader focus than Terouhid et al. (2012) and identify 81 papers(with only one common paper; Dou and Sarkis, 2010). We includeboth quantitative and qualitative research. An important feature inthis review is that sustainability is explicitly included, such thateconomic aspects as well as environmental and social factors aretaken into account in the decision-making process. Issues likereverse logistics and waste management are related to the facilitylocation problem, but these areas are adequately discussed andreviewed in the existing literature; cf. e.g. Pokharel and Mutha(2009), Chan et al. (2010), Dekker et al. (2012), Van der Wiel et al.(2012). Therefore, they are outside the scope of this paper.
We first present an overview of the literature review metho-dology. We then present the search strategy and the classificationscheme, based on a content analysis. Then, the results of theliterature review are presented. Finally, we present a conceptualframework and a research agenda.
2. Methodology
The core idea with a literature review is to summarize the stateof the art in the subject field, as a basis for identifying areas inwhich further research would be beneficial (Rowley and Slack,
2004). They state that literature reviews are important in:(i) supporting the identification of a research topic, question orhypothesis; (ii) identifying the literature to which the research willmake a contribution, and contextualizing the research within thatliterature; (iii) building an understanding of theoretical conceptsand terminology; (iv) facilitating the building of a bibliography orlist of the sources that have been consulted; (v) suggestingresearch methods that might be useful; and (vi) analyzing andinterpreting results. In conducting this literature review, we followthe general guidelines from Rowley and Slack (2004): (i) materialcollection, including (i) scanning documents, (ii) making notes,(iii) structuring the literature review, (iv) building the bibliogra-phy, and (v) writing the literature review. The research team,consisting of three researchers (two senior researchers and onedoctoral student) have collaborated and interacted on all aspectsof this literature review.
Below we discuss the key steps in conducting the literaturereview, in terms of (i) the search strategy, and the content analysisin terms of (ii) literature over time, (iii) literature across journals,and (iv) categorization with respect to topical areas as well asresearch methodologies; cf. Seuring and Müller (2008), Gold et al.(2010), Seuring and Gold (2012).
2.1. Search strategy
A comprehensive search of related research from 1990 to 2011was applied to produce a synthesis of peer-reviewed literature.The start of the time period was chosen such that the report of theUN Brundtland Commission (WCED, 1987) served as a startingpoint, similar to Seuring and Müller (2008). The search strategy isbased on selected databases (Business source premier, Scopus, andWeb of Science), selected keywords (“sustainability” in combina-tion with “facility location”, “supply chain”, or a combination of thefollowing: “global”, “international” or “network” in combinationwith “manufacturing”, “operations”, or “production”). For example,one such combination was “sustainability”+“global”+“production”.We also use back-tracking to find earlier relevant sources, andforward-tracking in Web of Science to find literature that arereferring to the central sources. Based on this, 140 papers wereidentified. Based on this list, all members of the research teammade individual content analyses and evaluations. The full inter-rater agreement among all three researchers was 75.0% (105papers). Consequently, 35 papers were subject to further analysisby all three researchers jointly. In the elimination process, weexcluded papers that focused on only one dimension of sustain-ability or did not relate to facility location at all. Finally, 81 paperswere identified. As a comparison, using only “sustainability” or“facility location” yields approximately 5.700 and 1.200 hits,respectively, in Business Source Premier. However, the 81 papersselected for this study have relevance for the relationship betweensustainability and manufacturing facility location.
2.2. Literature across journals
The 81 articles we finally reviewed are distributed among 46different international scientific journals. 10 journals account for45 articles (see Table 1), while the other 36 articles are from 36different journals. The highest numbers of articles are found inJournal of Cleaner Production, Ecological Economics, InternationalJournal of Physical Distribution & Logistics Management, andInternational Journal of Production Research. Thus, this researcharea is treated in specialized sustainability journals as well as ingeneral operations management journals.
L. Chen et al. / Int. J. Production Economics 149 (2014) 154–163 155

2.3. Literature over time
The literature on manufacturing facility location and sustain-ability started to appear in 1997. The first 8 years (1997–2004)exhibit an unstable pattern with low numbers and a few yearswith no articles. The average number of publications is 1.2 per yearduring this period. From 2005 and onwards the number ofpublications shows a positive trend, reaching 19 articles in 2011(Fig. 1).
2.4. Categorization of topic area and research methodology
When analyzing the content of the 81 articles, we couldidentify two dimensions for the fundamental categorization: focalarea and research methodology. These are two entirely separatedimensions, since all papers can be classified in both aspects. Thecontent analysis with respect to focal area leads us to identify fourcategories:
1. Papers that explicitly treat manufacturing facility locationissues taking sustainability aspects into account; typicallydiscussing and comparing alternative locations.
2. Papers that treat sustainability for a specific country or aspecific geographic region.
3. Papers that discuss sustainability from a supply chain perspec-tive; acknowledging multiple locations along a supply chain.
4. Papers discussing factors to consider for sustainable location;typically general discussions without specifically addressing aparticular location.
We find five groups for the classification with respect toresearch methodology:
1. Conceptual modeling (potentially including simple numericalexamples).
2. Case studies, including multiple case studies.3. Surveys, based on questionnaires.4. Mathematical modeling (or simulation).5. Country-level data (or regional data).
The result of the two-dimensional classification of the 81articles in this literature review is presented in Table 2. Thereare relatively few studies that explicitly study the relationshipbetween manufacturing facility location and sustainability.Instead, the majority of the papers are concerned with sustain-ability in specific regions and for supply chain settings. Sincesustainability is often related to governmental, regional, or indus-trial policy making, it is expected to find many papers in thiscategory. Also, supply chains are often global and can therefore beexposed to different aspects of sustainability in different stagesalong the supply chain. The final category on factors to considermay appear to be small, but it should be noted that all studies onsustainability in certain regions and in supply chains all deal withfactors to consider, wherefore this category only contains thosestudies that do not explicitly deal with specific regions or supplychains. Some papers cover supply chain issues in a specific region;these are classified here as papers concerned with sustainability ina specific region.
Each research methodology is primarily used for a particulartopical area. When using surveys and statistics the topical area istypically sustainability in a certain geographical region, while articlesthat use conceptual modeling, case research and mathematicalmodeling/simulation primarily focus on sustainability in supply chains.
3. Results
In this section we provide an overview of the literature in termsof coverage by journals, over time, and categorization.
Table 1Distribution of articles in journals.
Journal Number of papers Percentage (%)
Journal of Cleaner Production 18 22.2Ecological Economics 5 6.2International Journal of Physical Distribution & Logistics Management 5 6.2International Journal of Production Research 5 6.2International Journal of Production Economics 2 2.5Business Strategy and the Environment 2 2.5Corporate Governance 2 2.5International Journal of Operations & Production Management 2 2.5Journal of Business Ethics 2 2.5Journal of Supply Chain Management 2 2.5Others 36 44.4
Fig. 1. Distribution of articles over time.
Table 2Two-dimensional categorization of the relevant literature, with respect to contentanalysis and research methodology.
Topic area Research methodology Total
Concept Case Survey Math Country-level data
Sustainable locations 1 3 – 1 1 6Sustainability inspecific regions
5 7 7 1 11 31
Sustainability insupply chains
13 14 2 9 – 38
Factors to consider 2 3 – – 1 6Total 21 27 9 11 13 81
L. Chen et al. / Int. J. Production Economics 149 (2014) 154–163156

3.1. Sustainable locations
As mentioned previously, there are few studies with an explicitfocus on issues concerning sustainable location. In an early studyby Eagan and Joeres (1997), they present an assessment tool forevaluating the sustainability at a company level, which can beapplied to facility location problems. One important breakthrough,as the authors claimed, is due to its attempt to transfer the fuzzyconcept of sustainability by adopting and quantifying the 16principles for sustainable development defined by InternationalChamber of Commerce. Nevertheless such principles are stillmainly considering the environmental aspect of sustainability.
Even though sustainability has been raised as a strategic issuein many manufacturing companies, it is seldom built into thedecision model. In one recent work, Dou and Sarkis (2010) studiedthe location and sustainability problem with respect of offshoreoutsourcing. A decision process, based on analytical networkprocess framework was developed. More important, the authorspresented the location, environmental and social factors whichshould be considered in dealing with the problem. The latter ones,environmental and social factors have never been an emphasis infacility location literature. This study also illustrated the interde-pendence of the above mentioned factors. Such inter-dependencemay also reduce the transparency of the model and increase thedifficulties in understanding the decisions. Therefore, even thoughcreating a comprehensive list for all related factors is important, it isalso critical to filter the most important factors in order to reducethe complexity of the model.
Several case studies have been reported for investigating thesustainable location issues. These studies often limited to certainindustrial sectors, such as retailing industry (Bayat et al., 2011),biofuel production (Corbiere-Nicollier et al., 2011) and aerospacemanufacturing (Varga et al., 2009). In all these recent studies, onecommon concern is to develop comprehensive performance mea-sures which indicate the economic, environmental and socialaspects of sustainability. A system approach can simultaneouslyimprove the sustainability and other traditional key performanceindicators of a facility such as cost. We have to note that thepresented comprehensive performance measures in the abovestudies are very industrial-oriented. Developing a general frame-work for performance matrix and applying it to various industriesseem a challenge task but nevertheless important for locatingfacilities. Also according to the above studies, the economic andenvironmental aspects of sustainability are relatively easy to beinvestigated due the existence of related regulations and data.However, the social aspect of sustainability is more difficult to bedefined in different locations due to soft (intangible) measuressuch as culture difference.
In Reich-Weiser and Dornfeld (2009), the manufacturer loca-tion problem has been studied with the consideration of limitedaspects of sustainability, namely greenhouse gas emission and
consumption of water resources. Combining a quantitative model(input and output analyses) and life cycle analysis, the authorsexamined the tradeoffs between costs, flexibility and environmentimpacts. Such a model enhances the understanding of direct andindirect effects when selecting transportation modes and facilitylocation. This study also indicates the importance of includingresource availability (emission and water) in location decisionmaking.
3.2. Sustainability in specific regions
31 articles discuss sustainability aspects for specific regions.A region is typically a country, but may include a larger region ortwo specific countries that are compared. For example, Boons andMendoza (2010) discuss the definition of sustainability concerningpalm oil production in Colombia and the Netherlands. Somestudies use country-level statistical data to compare sustainabilityaspects between countries; see e.g. Andersson and Lindroth(2001), Bello et al. (1999), Gaughran et al. (2007) on ecologicalfootprint, and Proops et al. (1999) on degrees of sustainability.
Many articles that address sustainability in specific regions areconcerned with a specific industry or a few specific industries.Table 3 displays the articles that study explicit combinations ofindustry and region. The vast majority of these articles are quiterecent; all except two are from 2008 and later. This indicates thatindustry/country analyses are a recent phenomenon; no less thansix studies are from 2011. Therefore, this may be a stream ofliterature that will continue to expand. There are six studies on theoil, gas and bio-fuel industries in seven different countries orregions. However, the aspects that are highlighted in each studydiffer between the studies. This reduces the possibility to comparecountries. Three more industries have more than one countrystudy on that specific industry; these are automobile, food andtextile. Still, in general there are few specific studies on specificindustries in specific regions. However, the studies reported hereform a baseline for further comparative studies.
3.3. Sustainability in supply chains
There are numerous papers that address sustainability insupply chain settings. These papers do not explicitly discussalternative facility locations, but acknowledge that there arefacilities in different locations and that the supply chain needs totake various aspects of sustainability into account for long-termsuccess. Table 4 presents an overview of the aspects and specificissues that are treated in this literature. The analytic categorieswere derived in an inductive way based on the content analysis ofthe papers in this review, as suggested by e.g. Rowley and Slack(2004), Seuring and Müller (2008), Seuring and Gold (2012).
These papers discuss a variety of supply chain aspects forupstream as well as downstream operations. Life cycle assessment
Table 3Coverage of industries and countries (or regions) and reference to the literature.
Industry Country or region (source)
Oil/ Gas/ Bio-fuel Brazil (Hall and Matos, 2010), Brazil and Switzerland (Corbiere-Nicollier et al., 2011), Columbia and the Netherlands(Boons and Mendoza, 2010), Italy (Valente et al., 2011), UK (Stephenson et al., 2008), US (Kaffka, 2009)
Automobile Mexico (Vurro et al., 2009), North America (Xia and Tang, 2011), South Africa (Barnes and Morris, 2008)Food New Zealand (Flint and Golicic, 2009), Switzerland (Hamprecht et al., 2005)Textile Brazil (Abreu, 2011), Italy (Albino and Kuhtz, 2004)Agricultural USA (Kaffka, 2009)Consumer goods Indonesia (Hidayati, 2011)Remanufacturing India (Rathore et al., 2011)Mobile phones India (Rathore et al., 2011)Steel Brazil (Abreu, 2011)
L. Chen et al. / Int. J. Production Economics 149 (2014) 154–163 157

for supply chain design is treated in five papers, of which three arebased on case research. Three other papers present frameworks forsustainability in supply chains. All other perspectives on sustain-ability in supply chain are treated in individual papers. Thus, theliterature on sustainability in supply chains so far provides ascattered perspective, wherefore more research is needed.
3.4. Factors to consider
Even though only 6 articles were classified as discussing factorsto consider when dealing with manufacturing facility location andsustainability, all articles in this literature review do bring upissues to that the respective authors feel should be considered inthis context. One specific aspect is the dimensions of the conceptof sustainability, i.e. economic, environmental, and social sustain-ability. Fig. 2 captures the number of articles that consider two ofthese dimensions or all three. It is clear that the environmentaland economic issues dominate, and that the research on the socialaspects of sustainability with relevance for manufacturing facilitylocation is lagging. In the 48 papers covering all dimensions thesocial dimension is typically underrepresented.
The aspects that have some relevance for sustainability andmanufacturing facility location are many. In Table 5 we structureand summarize the factors as well as provide reference to theliterature sources. The structure is based on the Environmental
Performance Index (EPI, 2010), the Sustainability Reporting Guide-lines by the Global Reporting Initiative (GRI, 2012), and locationfactors by Dou and Sarkis (2010), Ramstetter (2011), Somlev andHoshino (2005). The table provides a three-level structure of the
Table 4Literature on sustainability aspects in supply chains.
Aspect Specific issue Source(s)
Purchasing/Sourcing Dynamic capabilities in supply management Reuter et al. (2010)—caseFuzzy multi-criteria evaluation framework Büyüközkan and Cifci (2011)—mathGray system and rough sets Bai and Sarkis (2010)—mathISO 14000 Chen (2005)—conceptualMulti-objective assessment based on AHPand fuzzy sets
Lu et al. (2007)—conceptual
Risk management for global sourcing Christopher et al. (2011)—conceptualSC design Closed-loop supply chain Kleindorfer et al. (2005)—conceptual
ISO 14001 Curkovic and Sroufe (2011)—caseLife cycle assessment Donnelly et al. (2006)—case; Facanha and Horvath (2005)—math; Hutchins and Sutherland
(2008)—case; Linton et al. (2007)—conceptual; White (2009)—caseMultistage optimization Huang et al. (2010)—math; Corsano et al. (2011)—mathQuality and safety aspects on network design andplanning
Akkerman et al. (2010)—conceptual
Reverse logistics El Korchi and Millet (2011)—mathSystem dynamics modeling Purnomo et al. (2009)—math
SC integration Collaborative governance Vurro et al. (2009)—conceptualImpact of collaborative green practices on productand process performance
Vachon and Klassen (2008)—survey
Impact of sustainability strategy on sustainabilityperformance
Wolf (2011)—case
Pollution control and prevention Vachon and Klassen (2007)—surveyResource efficiency, recycling and processoptimization
Schliephake et al. (2009)—case
Self-regulation through cooperation in the supplychain
De Man and Burns (2006)—case
SC management Adoption of sustainability initiatives inmultinational companies
Colicchia et al. (2011)—case
Analysis based on complex systems modeling Higgins et al. (2010)—conceptualBatch traceability and collaboration Hamprecht et al. (2005)—caseEco-efficiency and eco-intensity Schmidt and Schwegler (2008)—mathEnergy efficiency Van Hoek and Johnson (2010)—caseFramework Carter and Rogers (2008)—conceptual; Melnyk et al. (2010)—conceptual;
Seuring and Müller (2008)—conceptualNatural resource based view of the firm Markley and Davis (2007)—conceptualProductivity and quality and the effect onshareholder value
Mefford (2011)—conceptual
Relationship between multinational companiesand non-governmental organizations
Perez-Aleman and Sandilands (2008)—case
Relationship between innovation powerand sustainability strategies
Van Bommel (2011)—conceptual
Role of SMEs in global supply chain Moore and Manring (2009)—conceptual
29
Environmentalissues
Economic issues
Socialissues
2
48
2
Fig. 2. Distribution of articles with respect to coverage of the 3 sustainabilitydimensions.
L. Chen et al. / Int. J. Production Economics 149 (2014) 154–163158
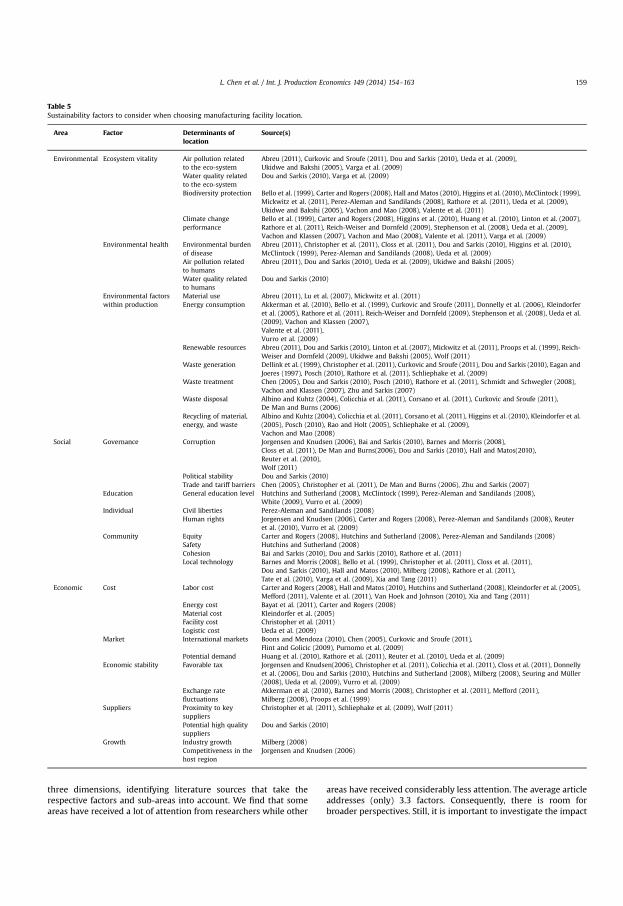
three dimensions, identifying literature sources that take therespective factors and sub-areas into account. We find that someareas have received a lot of attention from researchers while other
areas have received considerably less attention. The average articleaddresses (only) 3.3 factors. Consequently, there is room forbroader perspectives. Still, it is important to investigate the impact
Table 5Sustainability factors to consider when choosing manufacturing facility location.
Area Factor Determinants oflocation
Source(s)
Environmental Ecosystem vitality Air pollution relatedto the eco-system
Abreu (2011), Curkovic and Sroufe (2011), Dou and Sarkis (2010), Ueda et al. (2009),Ukidwe and Bakshi (2005), Varga et al. (2009)
Water quality relatedto the eco-system
Dou and Sarkis (2010), Varga et al. (2009)
Biodiversity protection Bello et al. (1999), Carter and Rogers (2008), Hall and Matos (2010), Higgins et al. (2010), McClintock (1999),Mickwitz et al. (2011), Perez-Aleman and Sandilands (2008), Rathore et al. (2011), Ueda et al. (2009),Ukidwe and Bakshi (2005), Vachon and Mao (2008), Valente et al. (2011)
Climate changeperformance
Bello et al. (1999), Carter and Rogers (2008), Higgins et al. (2010), Huang et al. (2010), Linton et al. (2007),Rathore et al. (2011), Reich-Weiser and Dornfeld (2009), Stephenson et al. (2008), Ueda et al. (2009),Vachon and Klassen (2007), Vachon and Mao (2008), Valente et al. (2011), Varga et al. (2009)
Environmental health Environmental burdenof disease
Abreu (2011), Christopher et al. (2011), Closs et al. (2011), Dou and Sarkis (2010), Higgins et al. (2010),McClintock (1999), Perez-Aleman and Sandilands (2008), Ueda et al. (2009)
Air pollution relatedto humans
Abreu (2011), Dou and Sarkis (2010), Ueda et al. (2009), Ukidwe and Bakshi (2005)
Water quality relatedto humans
Dou and Sarkis (2010)
Environmental factorswithin production
Material use Abreu (2011), Lu et al. (2007), Mickwitz et al. (2011)Energy consumption Akkerman et al. (2010), Bello et al. (1999), Curkovic and Sroufe (2011), Donnelly et al. (2006), Kleindorfer
et al. (2005), Rathore et al. (2011), Reich-Weiser and Dornfeld (2009), Stephenson et al. (2008), Ueda et al.(2009), Vachon and Klassen (2007),Valente et al. (2011),Vurro et al. (2009)
Renewable resources Abreu (2011), Dou and Sarkis (2010), Linton et al. (2007), Mickwitz et al. (2011), Proops et al. (1999), Reich-Weiser and Dornfeld (2009), Ukidwe and Bakshi (2005), Wolf (2011)
Waste generation Dellink et al. (1999), Christopher et al. (2011), Curkovic and Sroufe (2011), Dou and Sarkis (2010), Eagan andJoeres (1997), Posch (2010), Rathore et al. (2011), Schliephake et al. (2009)
Waste treatment Chen (2005), Dou and Sarkis (2010), Posch (2010), Rathore et al. (2011), Schmidt and Schwegler (2008),Vachon and Klassen (2007), Zhu and Sarkis (2007)
Waste disposal Albino and Kuhtz (2004), Colicchia et al. (2011), Corsano et al. (2011), Curkovic and Sroufe (2011),De Man and Burns (2006)
Recycling of material,energy, and waste
Albino and Kuhtz (2004), Colicchia et al. (2011), Corsano et al. (2011), Higgins et al. (2010), Kleindorfer et al.(2005), Posch (2010), Rao and Holt (2005), Schliephake et al. (2009),Vachon and Mao (2008)
Social Governance Corruption Jorgensen and Knudsen (2006), Bai and Sarkis (2010), Barnes and Morris (2008),Closs et al. (2011), De Man and Burns(2006), Dou and Sarkis (2010), Hall and Matos(2010),Reuter et al. (2010),Wolf (2011)
Political stability Dou and Sarkis (2010)Trade and tariff barriers Chen (2005), Christopher et al. (2011), De Man and Burns (2006), Zhu and Sarkis (2007)
Education General education level Hutchins and Sutherland (2008), McClintock (1999), Perez-Aleman and Sandilands (2008),White (2009), Vurro et al. (2009)
Individual Civil liberties Perez-Aleman and Sandilands (2008)Human rights Jorgensen and Knudsen (2006), Carter and Rogers (2008), Perez-Aleman and Sandilands (2008), Reuter
et al. (2010), Vurro et al. (2009)Community Equity Carter and Rogers (2008), Hutchins and Sutherland (2008), Perez-Aleman and Sandilands (2008)
Safety Hutchins and Sutherland (2008)Cohesion Bai and Sarkis (2010), Dou and Sarkis (2010), Rathore et al. (2011)Local technology Barnes and Morris (2008), Bello et al. (1999), Christopher et al. (2011), Closs et al. (2011),
Dou and Sarkis (2010), Hall and Matos (2010), Milberg (2008), Rathore et al. (2011),Tate et al. (2010), Varga et al. (2009), Xia and Tang (2011)
Economic Cost Labor cost Carter and Rogers (2008), Hall and Matos (2010), Hutchins and Sutherland (2008), Kleindorfer et al. (2005),Mefford (2011), Valente et al. (2011), Van Hoek and Johnson (2010), Xia and Tang (2011)
Energy cost Bayat et al. (2011), Carter and Rogers (2008)Material cost Kleindorfer et al. (2005)Facility cost Christopher et al. (2011)Logistic cost Ueda et al. (2009)
Market International markets Boons and Mendoza (2010), Chen (2005), Curkovic and Sroufe (2011),Flint and Golicic (2009), Purnomo et al. (2009)
Potential demand Huang et al. (2010), Rathore et al. (2011), Reuter et al. (2010), Ueda et al. (2009)Economic stability Favorable tax Jorgensen and Knudsen(2006), Christopher et al. (2011), Colicchia et al. (2011), Closs et al. (2011), Donnelly
et al. (2006), Dou and Sarkis (2010), Hutchins and Sutherland (2008), Milberg (2008), Seuring and Müller(2008), Ueda et al. (2009), Vurro et al. (2009)
Exchange ratefluctuations
Akkerman et al. (2010), Barnes and Morris (2008), Christopher et al. (2011), Mefford (2011),Milberg (2008), Proops et al. (1999)
Suppliers Proximity to keysuppliers
Christopher et al. (2011), Schliephake et al. (2009), Wolf (2011)
Potential high qualitysuppliers
Dou and Sarkis (2010)
Growth Industry growth Milberg (2008)Competitiveness in thehost region
Jorgensen and Knudsen (2006)
L. Chen et al. / Int. J. Production Economics 149 (2014) 154–163 159

on particular factors thoroughly in order to fully understand thefactor and its role for sustainability in manufacturing facilitylocation decision-making.
4. Framework for sustainability in manufacturing facilitylocation decision-making
We propose a conceptual framework for synthesizing differentperspectives on sustainability and manufacturing facility locationfor industrial firms that combines two key elements. First, firmsshould evaluate sustainability on an integrated viewpoint on theeconomic, environmental and social perspectives and aspects; forexample the “triple-bottom-line”. However, only selected aspectsof sustainability have been highlighted in literature. Second, weadd the manufacturing strategy dimension of the industrial firm,that is largely absent in the current literature on sustainabilitywith relevance to facility location. Even though strategies for howto deal with sustainability per se or for separate dimensions suchas an environmental strategy (Yang and Sheu, 2007) are discussedin the literature, the corporate and business strategy perspective ismissing. Fine et al. (2002) present a framework for value chaindecision-making that synthesizes strategic value added based onqualitative models and economic value added based on quantita-tive models. Similarly, we believe that the strategic perspectiveconcerning e.g. competitive position, markets, and technologyshould be added to the sustainability aspects. To some extent inliterature, strategic issues may have been incorporated in theeconomic dimension of sustainability. However, as described byFine et al. (2002), the economic dimension is fundamentallyconcerned only with cost-related issues and lacks the long-termstrategic perspective. In particular, decisions on the global manu-facturing footprint of the industrial firm must include both thestrategy and sustainability perspectives. Also, the global footprintshould not be restricted to the manufacturing network of the firm,but should also incorporate the entire supply network. We use thebasic structure and idea of synthesis in Fine et al. (2002) fordeveloping our framework, and add the environmental and socialaspects; as illustrated in Fig. 3.
The framework in Fig. 3 includes two levels of synthesis. First, theeconomic, environmental, and social perspectives are synthesized tothe sustainability perspective. This is represented in Fig. 3 by arrows(a)–(c). As mentioned before, the aim of this synthesis is to providean integrated viewpoint on the sustainability perspectives. Based onthe important factors identified in previous research, Table 5 presentsa list of major factors to be considered during this synthesis process.
Even though many studies have integrated the three aspects ofsustainability, there are very few studies that have treated sustain-ability with facility location as a focus. In this literature review, weonly identified six papers (cf. Section 3.1). Eagan and Joeres (1997)provided a sustainability assessment tool at the company level.Dou and Sarkis (2009) researched sustainability and location pro-blems with an offshore outsourcing focus. Reich-Weiser and Dornfeld(2009) analyzed the environment impacts on emission and water inlocation decision-making. Other researchers have considered specificindustries, such as retailing (Bayat et al., 2011), biofuel production(Corbiere-Nicollier et al., 2011) and aerospace manufacturing (Vargaet al., 2009). This synthesis process—with facility location as a focus—apparently needs further development.
Second, the sustainability and manufacturing strategy perspec-tives are synthesized (arrow d) for making informed decisions onthe global manufacturing footprint. The aim of this synthesis is toestablish the strategic position so that manufacturing capability ofthe company fits the need from the market (or customer) side.This synthesis process could be even more of a challenge for theaverage manufacturing company, since the manufacturing strategyand sustainability perspectives should be carefully combined tobring added values to the market. This type of research withrelevance for facility location is largely missing.
The framework also suggests that there are multiple effects onthe performance of the firm, as well as multiple dimensions offirm performance. Arrows (e)–(h) represent the direct effects fromthe economic, environmental, social, and strategic perspectives,while arrow (i) represents the effect from the sustainabilitysynthesis and arrow (j) the effect from the second level ofsynthesis between strategy and sustainability. Firm performancecan be differentiated between business performance (e.g. marketshare, profitability, and growth), operational performance (notonly cost, but also including e.g. quality, delivery, and flexibility,i.e. the main competitive priorities), environmental performance,and social performance.
Both decision-making and performance measures need to bebalanced. It is important that all perspectives in Fig. 3 are takeninto account when making decisions that affect the global foot-print and it is important to have a balanced view on theperformance of the firm. The fundamental idea of the balancedscorecard (Kaplan and Norton, 1992) can be applied here, in that abalanced view is needed between all perspectives. Figge et al.(2002) extended the work of Kaplan and Norton (1992) byproposing a sustainability balanced scorecard, which can serveas a starting point for developing balanced views on strategy andsustainability.
CostMarketEconomic stabilitySuppliersGrowth
Eco-system vitalityEnvironmental healthEnvironmental factorswithin production
GovernanceEducationIndividual Community
Economicperspective
Environmentalperspective
Socialperspective
Sustainabilityperspective
Synthesis 1
Manufacturingstrategy
perspective
Competitive positionMarket positionTechnologyCustomersGlobal footprint
Performance BusinessOperationalEnvironmentalSocial
Synthesis 2
(a)
(e)
(b)
(c)
(f)
(d)
(g)
(j)
(i)
(h)
Manufacturing FacilityLocation Recommendations
Investments Supply chains
Fig. 3. Conceptual framework for sustainability in manufacturing facility location decision-making.
L. Chen et al. / Int. J. Production Economics 149 (2014) 154–163160

5. Research agenda
We have identified some areas which deserve further researchattention. In summary, these make up a research agenda forsustainability in manufacturing facility location decision-making.There are many answers yet to be found—and maybe evenquestions yet to be raised—concerning how to locate manufactur-ing facilities in a sustainable way, i.e. economically, environmen-tally, as well as socially in the long term.
5.1. The practical dimension
We encourage more case research to provide better under-standing of the enablers and barriers for sustainable global locationexperienced by industrial firms. Would this differ between differentgeographical regions? Would this differ depending on the origin ofthe company? Even though there are some studies that comparecountries at the country-level, there are very few studies that dothis for specific industries. Such studies are important to be ableto account for industry as a control variable, particularly if the setof industries varies considerably between the countries that arecompared. The benefits, limitations and challenges may well differin different regions of the world. An identification and analysis ofsuch factors would be beneficial for manufacturing firms in theirdecision-making processes for facility locations.
5.2. Social aspects relevant to manufacturing facility location
So far, the social perspective has been largely absent in frame-works with relevance to decision-making concerning manufactur-ing location. The other two dimensions of sustainability havereceived much more attention, while research on the socialaspects has been lagging, at least when it comes to includingthese in sustainability frameworks. Recently, Klassen and Vereecke(2012) discussed the social dimension for supply chain manage-ment in general, including the relationship with environmentalperformance, with some reference to geographical location.However, further studies on social factors and how these relateto location issues are needed. How should social factors bemeasured? Do companies and the society have the same viewon social factors, or is there a need for a distinction between theseentities?
5.3. Synthesizing the economic, environmental,and social perspectives
If a full sustainability perspective is to be developed formanufacturing facility location, all three dimensions need to besynthesized. There are three dimensions to this synthesis: content,process and context. Models that provide balanced approacheswith respect to content should be developed in order to properlyorganize the economic, environmental, and social perspectives,and indicate the interaction of these perspectives. The processdimension, i.e. how companies create the synthesis, is largelymissing. This indicates that research on organization aspects andimplementation models are needed. The context dimension isconcerned with external contingency factors, such as country andindustry (see also Section 5.1 and Table 3), that may affectoperational choices. There is a need for the identification ofcontingency factors that can explain why different circumstancesmay imply different balances between the three dimensions.
5.4. Adding the strategic perspective
The manufacturing strategy perspective is not included in thesustainability aspects. For example, what should be basis for the
competitive position of the firm, which markets or customersshould be targeted, which technologies should be mastered andpursued, etc. The strategy approach per se may be proactive,reactive or value-seeking, which may or may not influence theapproach to sustainability. Even though the literature on sustain-ability advocates a proactive or value-seeking approach (see e.g.Yang and Sheu, 2007), the reality may well be different. Studies onthe relationship between strategy and sustainability are of theutmost interest; see e.g. Carraher et al. (2008) and Baumgartnerand Korhonen (2010) for discussions on general strategic manage-ment perspective on sustainability. If sustainability is truly on thestrategic agenda, integrated approaches that aim at synthesizingcorporate and business strategy with sustainability should bepresent. In manufacturing networks with multiple locations, thedistribution of sustainability management is a concern. For exam-ple, should centrally-driven global approaches be used or shouldeach plant be allowed to build its own sustainability strategy? Andhow does this relate to the strategy formation of the companyconcerning decision-making on newmanufacturing locations? Thefundamental research question relates to the synthesis of thestrategic and sustainability perspectives. This area offers widepossibilities for new and important research.
5.5. Testing and expansion of the framework
The framework in Fig. 3 lends itself to empirical testing usingsurveys. The four perspectives (strategic, economic, environmen-tal, and social) and sub-areas can be converted to constructs. First,measurement models need to be developed and validated for eachconstruct. Then, practice-performance relationships can bestudied. The framework suggests that there are both direct andindirect effects on performance, which can be tested usingstructural equations modeling techniques. Empirical testing ofthe framework can also include elements that potentially canenrich the framework and provide a richer understanding of therelationships among sustainability, strategy, and performance.
6. Concluding remarks
The literature of relevance for manufacturing facility locationhas been classified and reviewed. We can conclude that sustain-ability is an area that is gaining interest. Still, more research isneeded, since there are very few studies that explicitly treatsustainability when making decisions on facility location. Thispaper contributes with a summary of perspectives, factors, andapproaches on all aspects on sustainability. We hope that thisreview can be a useful and inspirational source for further researchon sustainability, manufacturing facility location and global opera-tions footprints.
References
Abreu, M.C.D., 2011. Effects of environmental pressures on company sustainabilitystrategies: an interview study among Brazilian manufacturing firms. Interna-tional Journal of Management 28 (3), 909–925.
Akkerman, R., Farahani, P., Grunow, M., 2010. Quality, safety and sustainability infood distribution: a review of quantitative operations management approachesand challenges. OR Spectrum 32 (4), 863–904.
Albino, V., Kuhtz, S., 2004. Enterprise input–output model for local sustainabledevelopment—the case of a tiles manufacturer in Italy. Resources Conservationand Recycling 41 (3), 165–176.
Andersson, J.O., Lindroth, M., 2001. Ecologically unsustainable trade. EcologicalEconomics 37 (1), 113–122.
Arntzen, B.C., Brown, G., Harrison, T.P., Trafton, L.L., 1995. Global supply chainmanagement at digital equipment corporation. Interfaces 25 (1), 69–93.
Bai, C., Sarkis, J., 2010. Integrating sustainability into supplier selection with greysystem and rough set methodologies. International Journal of ProductionEconomics 124 (1), 252–264.
L. Chen et al. / Int. J. Production Economics 149 (2014) 154–163 161

Barnes, J., Morris, M., 2008. Staying alive in the global automotive industry: whatcan developing economies learn from South Africa about linking into globalautomotive value chains? European Journal of Development Research 20 (1),31–55.
Baumgartner, R.J., Korhonen, J., 2010. Strategic thinking for sustainable develop-ment. Sustainable Development 18 (2), 71–75.
Bayat, A., Sundararajan, S., Gustafson, H.R., Zimmers, E.W., 2011. Sustainably drivensupply chains. Industrial Engineer 43 (8), 26–31.
Bello, P., Wackernagel, M., Suarez Guerrero, A.I., Mendez Garcia, J., Linares, A.C.,Guadalupe Suarez Guerrero, M., Onisto, L., Falfan, I.S.L., 1999. National naturalcapital accounting with the ecological footprint concept. Ecological Economics29 (3), 375–390.
Boons, F., Mendoza, A., 2010. Constructing sustainable palm oil: how actors definesustainability. Journal of Cleaner Production 18 (16/17), 1686–1695.
Büyüközkan, G., Cifci, G., 2011. A novel fuzzy multi-criteria decision framework forsustainable supplier selection with incomplete information. Computers inIndustry 62 (2), 164–174.
Carter, C.R., Rogers, D.S., 2008. A framework of sustainable supply chain manage-ment: moving toward new theory. International Journal of Physical Distribution& Logistics Management 38 (5), 360–387.
Camm, J.D., Chormann, T.E., Dill, F.A., Evans, J.R., Sweeney, D.J., Wegryn, G.W., 1997.Blending OR/MS, judgment, and GIS: restructuring P&G's supply chain. Inter-faces 27 (1), 128–142.
Carraher, S.M., Buckley, M.R., Carraher, C.E., 2008. Research challenges in sustain-able strategic management: change and sustainability. International Journal ofSustainable Strategic Management 1 (1), 2–15.
Chan, H.K., Yin, S., Chan, F.T.S., 2010. Implementing just-in-time philosophy toreverse logistics systems: a review. International Journal of ProductionResearch 48 (21), 6293–6313.
Chen, C.-C., 2005. Incorporating green purchasing into the frame of ISO 14000.Journal of Cleaner Production 13 (9), 927–933.
Christopher, M., Mena, C., Khan, O., Yurt, O., 2011. Approaches to managing globalsourcing risk. Supply Chain Management 16 (2), 67–81.
Closs, D., Speier, C., Meacham, N., 2011. Sustainability to support end-to-end valuechains: the role of supply chain management. Journal of the Academy ofMarketing Science 39 (1), 101–116.
Colicchia, C., Melacini, M., Perotti, S., 2011. Benchmarking supply chain sustain-ability: insights from a field study. Benchmarking: An International Journal 18(5), 705–732.
Corbiere-Nicollier, T., Blanc, I., Erkman, S., 2011. Towards a global criteria basedframework for the sustainability assessment of bioethanol supply chains—application to the Swiss dilemma: is local produced bioethanol more sustain-able than bioethanol imported from Brazil? Ecological Indicators 11 (5),1447–1458.
Corsano, G., Vecchietti, A.R., Montagna, J.M., 2011. Optimal design for sustainablebioethanol supply chain considering detailed plant performance model.Computers & Chemical Engineering 35 (8), 1384–1398.
Curkovic, S., Sroufe, R., 2011. Using ISO 14001 to promote a sustainable supply chainstrategy. Business Strategy and the Environment 20 (2), 71–93.
Dekker, R., Bloemhof, J., Mallidis, I., 2012. Operations research for green logistics—an overview of aspects, issues, contributions and challenges. European Journalof Operational Research 219 (3), 671–679.
De Man, R., Burns, T.R., 2006. Sustainability: supply chains, partner linkages, andnew forms of self-regulation. Human Systems Management 25 (1), 1–12.
Dellink, R., Bennis, M., Verbruggen, H., 1999. Sustainable economic structures.Ecological Economics 29 (1), 141.
Donnelly, K., Beckett-Furnell, Z., Traeger, S., Okrasinski, T., Holman, S., 2006.Eco-design implemented through a product-based environmental manage-ment system. Journal of Cleaner Production 14 (15–16), 1357–1367.
Dou, Y., Sarkis, J., 2010. A joint location and outsourcing sustainability analysis fora strategic offshoring decision. International Journal of Production Research48 (2), 567–592.
Drezner, Z., Hamacher, H.W. (Eds.), 2004. Facility Location: Applications andTheory. Springer, New York.
Eagan, P.D., Joeres, E., 1997. Development of a facility-based environmentalperformance indicator related to sustainable development. Journal of CleanerProduction 5 (4), 269–278.
Economy, E., Lieberthal, K., 2007. Scorched earth. Harvard Business Review 85 (6),88–96.
El Korchi, A., Millet, D., 2011. Designing a sustainable reverse logistics channel:the 18 generic structures framework. Journal of Cleaner Production 19 (6–7),588–597.
EPI, 2010. 2010 Environmental performance index summary for policy makers. YaleCentre for Environmental Law and Policy, Yale University and Center forInternational Earth Science Information Network, Columbia University.
Facanha, C., Horvath, A., 2005. Environmental assessment of logistics outsourcing.Journal of Management in Engineering 21 (1), 27–37.
Feldmann, A., Olhager, J., 2013. Plant roles: site competence bundles and theirrelationships with site location factors and performance. International Journalof Operations and Production Management 33 (6). (in press).
Ferdows, K., 2009. Shaping global operations. Journal of Globalization, Competi-tiveness, & Governability 3 (1), 136–148.
Ferdows, K., 1997. Making the most of foreign factories. Harvard Business Review75 (2), 73–88.
Fine, C.H., Vardan, R., Pethick, R., El-Hout, J., 2002. Rapid-response capability invalue-chain design. MIT Sloan Management Review 43 (2), 69–75.
Figge, F., Hahn, T., Schaltegger, S., Wagner, M., 2002. The sustainability balancedscorecard-linking sustainability management to business strategy. BusinessStrategy and the Environment 11 (5), 269–284.
Flint, D.J., Golicic, S.L., 2009. Searching for competitive advantage through sustain-ability: a qualitative study in the New Zealand wine industry. InternationalJournal of Physical Distribution & Logistics Management 39 (10), 841–860.
Gaughran, W.F., Burke, S., Phelan, P., 2007. Intelligent manufacturing and environ-mental sustainability. Robotics & Computer-Integrated Manufacturing 23 (6),704–711.
Gold, S., Seuring, S., Beske, P., 2010. Sustainable supply chain management andinter-organizational resources: a literature review. Corporate Social Responsi-bility and Environmental Management 17, 230–245.
GRI, 2012. Global reporting initiative—sustainability reporting guidelines (version 3.1).⟨http://www.globalreporting.org⟩ (accessed 30.03.12.).
Hall, J., Matos, S., 2010. Incorporating impoverished communities in sustainablesupply chains. International Journal of Physical Distribution & LogisticsManagement 40 (1/2), 124–147.
Hamprecht, J., Corsten, D., Noll, M., Meier, E., 2005. Controlling the sustainability offood supply chains. Supply Chain Management 10 (1), 7–10.
Hidayati, N.D., 2011. Pattern of corporate social responsibility programs: a casestudy. Social Responsibility Journal 7 (1), 104–117.
Higgins, A.J., Miller, C.J., Archer, A.A., Ton, T., Fletcher, C.S., McAllister, R.R.J., 2010.Challenges of operations research practice in agricultural value chains. Journalof the Operational Research Society 61 (6), 964–973.
Huang, Y., Chen, C.-W., Fan, Y., 2010. Multistage optimization of the supply chains ofbiofuels. Transportation Research Part E—Logistics and Transportation Review46 (6), 820–830.
Hutchins, M.J., Sutherland, J.W., 2008. An exploration of measures of socialsustainability and their application to supply chain decisions. Journal of CleanerProduction 16 (15), 1688–1698.
Jorgensen, A.L., Knudsen, J.S., 2006. Sustainable competitiveness in global value chains:how do small Danish firms behave? Corporate Governance 6 (4), 449–462.
Kaffka, S.R., 2009. Can feedstock production for biofuels be sustainable in Califor-nia? California Agriculture 63 (4), 202–207.
Kaplan, R.S., Norton, D.P., 1992. The balanced scorecard-measures that driveperformance. Harvard Business Review 70 (1), 71–79.
Klassen, R.D., Vereecke, A., 2012. Social issues in supply chains: capabilities linkresponsibility, risk (opportunity), and performance. International Journal ofProduction Economics 140, 103–115.
Kleindorfer, P.R., Singhal, K., Van Wassenhove, L.N., 2005. Sustainable operationsmanagement. Production & Operations Management 14 (4), 482–492.
Linton, J.D., Klassen, R., Jayaraman, V., 2007. Sustainable supply chains: anintroduction. Journal of Operations Management 25 (6), 1075–1082.
Lu, L.Y.Y., Wu, C.H., Kuo, T.C., 2007. Environmental principles applicable to greensupplier evaluation by using multi-objective decision analysis. InternationalJournal of Production Research 45 (18–19), 4317–4331.
Markley, M.J., Davis, L., 2007. Exploring future competitive advantage throughsustainable supply chains. International Journal of Physical Distribution &Logistics Management 37 (9), 763–774.
McClintock, B., 1999. The multinational corporation and social justice: experimentsin supranational governance. Review of Social Economy 57 (4), 507–522.
Mefford, R.N., 2011. The economic value of a sustainable supply chain. Business &Society Review 116 (1), 109–143.
Melnyk, S.A., Davis, E.W., Spekman, R.E., Sandor, J., 2010. Outcome-driven supplychains. MIT Sloan Management Review 51 (2), 33–38.
Melo, M.T., Nickel, S., Saldanha-da-Gama, F., 2009. Facility location and supply chainmanagement—a review. European Journal of Operational Research 196 (2),401–412.
Mickwitz, P., Hildén, M., Seppälä, J., Melanen, M., 2011. Sustainability throughsystem transformation: lessons from Finnish efforts. Journal of Cleaner Produc-tion 19 (16), 1779–1787.
Milberg, W., 2008. Shifting sources and uses of profits: sustaining US financializa-tion with global value chains. Economy and Society 37 (3), 420–451.
Moore, S.B., Manring, S.L., 2009. Strategy development in small and medium sizedenterprises for sustainability and increased value creation. Journal of CleanerProduction 17 (2), 276–282.
Perez-Aleman, P., Sandilands, M., 2008. Building value at the top and the bottom ofthe global supply chain: MNC–NGO partnerships. California ManagementReview 51 (1), 24–49.
Pokharel, P., Mutha, A., 2009. Perspectives in reverse logistics: a review. Resources,Conservation and Recycling 53 (4), 175–182.
Posch, A., 2010. Industrial recycling networks as starting points for broadersustainability-oriented cooperation? Journal of Industrial Ecology 14 (2),242–257.
Proops, J.L.R., Atkinson, G., von Schlotheim, B.F., Simon, S., 1999. International tradeand the sustainability footprint: a practical criterion for its assessment.Ecological Economics 28 (1), 75–97.
Purnomo, H., Guizol, P., Muhtaman, D.R., 2009. Governing the teak furniturebusiness: a global value chain system dynamic modelling approach. Environ-mental Modelling & Software 24 (12), 1391–1401.
Ramstetter, E.D., 2011. Ranking locations for Japan's manufacturing multinationalsin Asia: a literature survey illustrated with indexes. Asian Economic Journal 25(2), 197–226.
Rao, P., Holt, D., 2005. Do green supply chains lead to competitiveness andeconomic performance? International Journal of Operations & ProductionManagement 25 (9), 898–916.
L. Chen et al. / Int. J. Production Economics 149 (2014) 154–163162

Rathore, P., Kota, S., Chakrabarti, A., 2011. Sustainability through remanufacturing inIndia: a case study on mobile handsets. Journal of Cleaner Production 19 (15),1709–1722.
Reich-Weiser, C., Dornfeld, D.A., 2009. A discussion of greenhouse gas emissiontradeoffs and water scarcity within the supply chain. Journal of ManufacturingSystems 28 (1), 23–27.
Reid, R.D., Sanders, N.R., 2010. Operations Management: An Integrated Approach.Wiley, New York.
Reuter, C., Foerstl, K.A.I., Hartmann, E.V.I., Blome, C., 2010. Sustainable globalsupplier management: the role of dynamic capabilities in achieving competi-tive advantage. Journal of Supply Chain Management 46 (2), 45–63.
Rowley, J., Slack, F., 2004. Conducting a literature review. Management ResearchNews 27 (6), 31–39.
Schliephake, K., Stevens, G., Clay, S., 2009. Making resources work more efficiently—the importance of supply chain partnerships. Journal of Cleaner Production17 (14), 1257–1263.
Schmidt, M., Schwegler, R., 2008. A recursive ecological indicator system for thesupply chain of a company. Journal of Cleaner Production 16 (15), 1658–1664.
Seuring, S., Müller, M., 2008. From a literature review to a conceptual frameworkfor sustainable supply chain management. Journal of Cleaner Production 16(15), 1699–1710.
Seuring, S., Gold, S., 2012. Conducting content-analysis based literature reviews insupply chain management. Supply Chain Management: An InternationalJournal 17 (5), 544–555.
Somlev, I.P., Hoshino, Y., 2005. Influence of location factors on establishment andownership of foreign investments: the case of the Japanese manufacturingfirms in Europe. International Business Review 14 (15), 577–598.
Stephenson, A.L., Dennis, J.S., Scott, S.A., 2008. Improving the sustainability of theproduction of biodiesel from oilseed rape in the UK. Process Safety andEnvironmental Protection 86 (B6), 427–440.
Tate, W.L., Ellram, L.M., Kirchoff, J.F., 2010. Corporate social responsibility reports: athematic analysis related to supply chain management. Journal of Supply ChainManagement 46 (1), 19–44.
Terouhid, S., Rie, R., Fard, M., 2012. Towards sustainable facility location—aliterature review. Journal of Sustainable Development 5 (7), 18–34.
Theyel, G., 2012. Production location and sustainability. International Journal ofAgile Systems and Management 5 (3), 267–275.
Ueda, K., Takenaka, T., Váncza, J., Monostori, L., 2009. Value creation and decision-making in sustainable society. CIRP Annals—Manufacturing Technology 58 (2),681–700.
Ukidwe, N.U., Bakshi, B.R., 2005. Flow of natural versus economic capital inindustrial supply networks and its implications to sustainability. Environmen-tal Science & Technology 39 (24), 9759–9769.
Vachon, S., Klassen, R.D., 2007. Supply chain management and environmentaltechnologies: the role of integration. International Journal of ProductionResearch 45 (2), 401–423.
Vachon, S., Klassen, R.D., 2008. Environmental management and manufacturingperformance: the role of collaboration in the supply chain. International Journalof Production Economics 111 (2), 299–315.
Vachon, S., Mao, Z., 2008. Linking supply chain strength to sustainable develop-ment: a country-level analysis. Journal of Cleaner Production 16 (15),1552–1560.
Valente, C., Spinelli, R., Hillring, B.G., 2011. LCA of environmental and socio-economic impacts related to wood energy production in alpine conditions:Valle di Fiemme (Italy). Journal of Cleaner Production 19 (17/18), 1931–1938.
Van Bommel, H.W.M., 2011. A conceptual framework for analyzing sustainabilitystrategies in industrial supply networks from an innovation perspective.Journal of Cleaner Production 19 (8), 895–904.
Van der Wiel, A., Bossink, B., Masurel, E., 2012. Reverse logistics for waste reductionin cradle-to-cradle-oriented firms: waste management strategies in the Dutch
metal industry. International Journal of Technology Management 60 (1/2),96–113.
Van Hoek, R., Johnson, M., 2010. Sustainability and energy efficiency: researchimplications from an academic roundtable and two case examples. Interna-tional Journal of Physical Distribution & Logistics Management 40 (1/2),148–158.
Varga, L., Allen, P.M., Strathern, M., Rose-Anderssen, C., Baldwin, J.S., Ridgway, K.,2009. Sustainable supply networks: a complex systems perspective. Emer-gence: Complexity & Organization 11 (3), 16–36.
Vereecke, A., Van Dierdonck, R., De Meyer, A., 2006. A typology of plants in globalmanufacturing networks. Management Science 52 (11), 1737–1750.
Vurro, C., Russo, A., Perrini, F., 2009. Shaping sustainable value chains: networkdeterminants of supply chain governance models. Journal of Business Ethics 90,607–621.
WCED, 1987. Our Common Future (World Commission on Environment andDevelopment, Bruntland Commission). Oxford University Press, Oxford.
White, P., 2009. Building a sustainability strategy into the business. CorporateGovernance 9 (4), 386–394.
Wolf, J., 2011. Sustainable supply chain management integration: a qualitativeanalysis of the German manufacturing industry. Journal of Business Ethics 102(2), 221–235.
Xia, Y., Tang, T.L.-P., 2011. Sustainability in supply chain management: suggestionsfor the auto industry. Management Decision 49 (4), 495–512.
Yang, C.-L., Sheu, C., 2007. Achieving supply chain environment management: anexploratory study. International Journal of Technology Management 40 (1/2/3),131–156.
Zhu, Q., Sarkis, J., 2007. The moderating effects of institutional pressures onemergent green supply chain practices and performance. International Journalof Production Research 45 (18–19), 4333–4355.
Further reading
Gonzalez-Benito, J., Gonzalez-Benito, O., 2010. A study of determinant factors ofstakeholder environmental pressure perceived by industrial companies. Busi-ness Strategy and the Environment 19 (3), 164–181.
Hill, M.R., 2001. Sustainability, greenhouse gas emissions and international opera-tions management. International Journal of Operations & Production Manage-ment 21 (12), 1503–1520.
Jabbour, C.J.C., Santos, F.C.A., Nagano, M.S., 2008. Environmental managementsystem and human resource practices: is there a link between them in fourBrazilian companies? Journal of Cleaner Production 16 (17), 1922–1925.
Koplin, J., Seuring, S., Mesterharm, M., 2007. Incorporating sustainability intosupply management in the automotive industry—the case of the VolkswagenAG. Journal of Cleaner Production 15 (11/12), 1053–1062.
Lenzen, M., Murray, J., 2010. Conceptualising environmental responsibility. Ecolo-gical Economics 70 (2), 261–270.
O'Brien, C., 2002. Global manufacturing and the sustainable economy. InternationalJournal of Production Research 40 (15), 3867–3877.
Santolaria, M., Oliver-Solà, J., Gasol, C.M., Morales-Pinzón, T., Rieradevall, J., 2011.Eco-design in innovation driven companies: perception, predictions and themain drivers of integration. The Spanish example. Journal of Cleaner Production19 (12), 1315–1323.
Sutherland, J., Gunter, K., Allen, D., Bauer, D., Bras, B., Gutowski, T., Murphy, C.,Piwonka, T., Sheng, P., Thurston, D., Wolff, E., 2004. A global perspective on theenvironmental challenges facing the automotive industry: state-of-the-art anddirections for the future. International Journal of Vehicle Design 35 (1/2),86–110.
L. Chen et al. / Int. J. Production Economics 149 (2014) 154–163 163

IIPAPER


Applying GRI reports for the investigation of environmentalmanagement practices and company performance in Sweden, Chinaand India
Lujie Chen*, Ou Tang, Andreas FeldmannDivision of Production Economics, Department of Management and Engineering, Linköping University, SE 58183 Linköping, Sweden
a r t i c l e i n f o
Article history:Received 15 January 2013Received in revised form29 January 2014Accepted 1 February 2014Available online 8 February 2014
Keywords:Environmental management practicesCompany performanceGlobal reporting initiativeManufacturing industryEmpirical research
a b s t r a c t
The relationship between environmental management practices (EMPs) and company performance hasrecently been debated in literature and is of interest for both industrial managers and political decision-makers. This paper investigates the relationship between EMPs and firm performance in manufacturingcompanies in Sweden, China and India. With the content analysis of Global Reporting Initiative (GRI)reports and financial reports of sample companies, the levels of EMPs and the companies’ financialperformances were coded. Further statistical assessment was conducted in order to identify patterns andcorrelations. The results indicate that only selected EMPs have been employed differently in threedifferent countries. Most EMPs clearly do not have a positive correlation with the financial performance;i.e. employing EMPs does not necessarily improve the economic consequence of companies. Neverthe-less, a number of EMPs do have a strong correlation with improving innovation performance in variouscompanies. It is also interesting to note that a negative correlation exists between the Environmentalstandard for suppliers and Sales growth. This is possibly due to increasing operational costs and a delay inmarket acceptance. This research illustrates the possibility of using standard environmental data fromGRI reports as a resource for future studies of EMPs. In order to improve long-term financial perfor-mance, this study also suggests that innovation should gain a substantial amount of attention when EMPsare employed.
� 2014 Elsevier Ltd. All rights reserved.
1. Introduction
Literature shows that operations management are increasinglyinterested in a relationship between environmental managementpractices (EMPs) and company performance (Donnelly et al., 2006;Jabbour et al., 2008 and Walls et al., 2012). In practice, manycompanies attempt to include an environmental issues strategy andagenda in order to address stakeholders’ needs and competitivepressures (Hofer et al., 2012). One case in point is that moremanufacturing facilities introduce an Environmental ManagementSystem (EMS) with the aim of improving their performance(Johnstone and Labonne, 2009). On the other hand, companies arefacing the common perception that green management will in-crease costs and reduce profits, which discourage green manage-ment efforts. Empirical research is relatively limited when it comes
to an investigation of the economic consequences of green man-agement at the company level.
One recent interesting study concerning this was conducted byMontabon et al. (2007). By analyzing the reports from US and non-US corporates, they investigated a link between EMPs and companyperformance. They concluded that a positive and significant rela-tionship exists between them. Also, by analyzing a sample of Stan-dard & Poor’s 500 companies, Khanna and Anton (2002) exploreddifferent motivations that drive corporate environmentalism. Theyfound that specific factors such as proxies for incentives, a desire fora competitive advantage and regulatory pressures will determinethe type of EMPs to be chosen by the companies. Moreover, somerecent research indicates that EMPs can lead to innovations withincompanies, which should have a potential to further reduce costs orincrease demands (Russo and Fouts, 1997; Montabon et al., 2007;Hall and Matos, 2010; Wolf, 2011; Wu and Pagell, 2011; Hoferet al., 2012). In other words, EMPs can first improve the innova-tion performance and then seek to enhance the financial perfor-mance. However, the interaction between innovation performanceand financial performance has not been fully investigated.
* Corresponding author.E-mail address: [email protected] (L. Chen).
Contents lists available at ScienceDirect
Journal of Cleaner Production
journal homepage: www.elsevier .com/locate/ jc lepro
http://dx.doi.org/10.1016/j.jclepro.2014.02.0010959-6526/� 2014 Elsevier Ltd. All rights reserved.
Journal of Cleaner Production 98 (2015) 36e46

Despite the above positive results, there are also studiesshowing opposite outcomes. For example, Yang et al. (2011) testedrelationships between lean manufacturing practices, environ-mental management entities and business performances by usingthe existing data from the International Manufacturing StrategySurvey, collected in 2005. They find that EMPs alone are negativelyrelated to market and financial performances. However, improvedenvironmental performance substantially reduces the negativeimpact of EMPs on market and financial performance.
According to the discussion above, there is still a limited amountof research that explores the relationship between EMPs andcompany performance. Furthermore, the study results are contro-versial. Additionally, the aforementioned studies do not distinguishbetween sample companies with external factors. Nevertheless,nowadays there are several emerging and continuing trendsincluding green management efforts and globalization that lead toa variety of fundamental changes in the manufacturing environ-ment. In order to conform to these trends, the academic area andmanagement fields need to develop a better understanding of therelationship between EMPs and company performance. This shouldnot only be the case for their countries, but also for other parts ofthe world. A comparison of various industrial sectors could also beof great interest.
Motivated by this background, the current study aims to explorethe link between EMPs and its company’s performance. One dif-ference compared to previous studies is that the current researchattempts to investigate this link within different contexts, i.e.different industries as well as different countries. An evaluation oftheir performance includes financial, innovative, and environ-mental considerations. Additional efforts will also be given to theinteraction between innovation and financial performance in orderto better understand EMPs and their impact. Previous studies suchas Montabon et al. (2007) indicate correlations between a com-pany’s performance and some specific EMPs and will serve as theprimary focus of this investigation. In short, this research seeks to:
➢ Explore the relationship between environmental managementpractices and a firm’s financial performance. More specifically, itwill compare any results found against those reported inMontabon et al. (2007);
➢ Compare if selected industries (for example, the process in-dustry) are employing different environmental managementpractices than the rest of the manufacturing industry;
➢ Compare the companies’ environmental management practicesand environmental performance in developed and developingcountries.
In order to achieve the above study objectives, several hypoth-eses were developed using organizational theory with details thatare presented and explained in Section 2. In this study, data iscollected from the published annual reports of the sample com-panies, i.e. Global Reporting Initiative (GRI) and financial reports.The levels of EMPs and their performance are coded using contentanalysis.
This paper will also contribute to the development of knowledgein several ways. It adds to the current literature by introducing acoherent theory building approach to investigate any link betweenEMPs and a company’s performance. Institutional theory, winewinprinciple, complexity theory and diffusion theory of innovation areapplied to develop hypotheses that will explore the links. More-over, it examines the different EMPs that are employed and re-ported by manufacturing companies in developed and indeveloping countries. In this way, it enriches a discussion aboutenvironmental management and company performance whileconsidering a facility’s location. From a practitioner’s point of view,
this research helps managers predict any possible interactionsamong EMPs and the financial performance. It will also explorehow they can integrate environmental management into theirstrategy development process.
2. Theoretical background and research framework
A recent literature review by Sarkis et al. (2011) illustratesorganizational theory and its potential for advancing emergentenvironmental management or anything regarding the green sup-ply chain management field. Based on the viewpoints of theseauthors, organizational theory provides a solid background fordeveloping a research hypothesis. In the following, the researchhypotheses in the current study and for relevant theories will bepresented.
2.1. Institutional theory
Institutional theory is used to justify the sample selection in thisresearch. Institutional theory explains how external pressures in-fluence organizational actions (Hirsch, 1975; Sarkis et al., 2011).According to institutional theory, normative, coercive and mimeticdrivers act as different isomorphic forms (DiMaggio and Powell,1983; Sarkis et al., 2011). This means that governmental agencies,laws, regulations and requirements from society (those from cus-tomers and markets) will drive manufacturers to implementenvironmental management practices.
In European countries, manufactures have to be environmentalfriendly where this concept has lasted a long time. They havenormative, coercive and mimetic pressures from governments,local communities, customers and other external stakeholders.Sustainable development was introduced as a specific goal of theEuropean Community in the Single European Act of 1987. Further-more, the integration of environmental requirements into fullcommunity policies was further included in theMaastricht Treaty of1992 (Montgomery and Sanches, 2002). Moreover, a range ofenvironmental policies have been established by the EuropeanUnion, such as the restriction of hazardous substances (RoHS). Thisapplies to product design and a waste electrical and electronicequipment (WEEE) directive, which is directed at product life cycles(Tseng, 2013). These regulations have an impact on some specificEMPs like environmental risk analysis, the use of life cycle analysisand an environmental design. For instance, the Swedish centralgovernment has a specific environmental requirement systemwhere local communities also have programs that focus on envi-ronmental issues. Customers, including those in business, are oftengreen-awarded. Therefore, Swedish companies and companiesoriginating from Sweden are often considered to have well-developed environmental programs, including well-documentedreports for their programs. Thus in this study, some Swedishcompanies were sampled to represent the developed countries.
Conversely, the need to export to foreign countries provides acertain amount of pressure for manufactures in developing coun-tries, such as China and India, to improve their environmentalperformances. In these developing countries, economic perfor-mance is typically the most influential driver for companies toimplement environmental management practices (Zhu and Sarkis,2004). It is also particularly important to understand the relation-ship between environmental practices and a firm’s economic per-formance in these rapidly developing countries. China and India aregood examples. Their manufacturing industries make up largeportions of their economies. Thus, sample companies from Indiaand China were selected and compared for this study.
The study also found that differences in other distinguishedindustries are also interesting. In Sweden, Indian and China,
L. Chen et al. / Journal of Cleaner Production 98 (2015) 36e46 37

process industry and the mechanical/machinery industrycontribute significant economic outputs. Most of the process ori-ented manufacturing industries consume more energy and areresource intensive. They include the pulp and paper industry,chemical industry, food process industry and mining companies.Compared with other industries, they face relatively high regula-tory pressures from an internal and external stakeholders’perspective. According to the institutional theory (Zhu and Sarkis,2007; Sarkis et al., 2010, 2011; Tate et al., 2010; Sarkis et al., 2011;Walls et al., 2012), regulatory pressures should also motivatecompanies to apply specific EMPs. Therefore, a comparison be-tween a process industry and a non-process manufacturing in-dustry was another focus of this study. Based on the abovediscussion, the following hypotheses were developed.
Hypothesis 1. There are significant differences in environmentalpractices employed amongmanufacturing companies in Sweden, Indiaand China.
Hypothesis 2. There are significant differences in environmentalpractices employed between the process industry and othermanufacturing industries.
2.2. Winewin principle
The winewin principle is developed from an ecologicalmodernization theory with the aim to explain the relationshipbetween environmental performance and other performances in afirm. Researchers that support the winewin hypothesis have thefollowing arguments: i) Environmental regulations and standardscan help companies achieve innovations, which can offset regula-tory costs (Montabon et al., 2007; Sarkis et al., 2011). In this way,environmental practices adopted due to regulations can have apositive impact on a company’s performance. ii) Environmentallyproactive manufacturers put more efforts on technological inno-vation, which helps them to not only decrease their operationalcosts (for example by recycling wastes), but also to increase a de-mand for eco-friendly products. In this way, manufactures can gainmore opportunities in their operations and improve their com-pany’s performance (Montabon et al., 2007; Sarkis et al., 2011).
Based on the abovewinewin principle, the following hypothesisis developed in order to contribute to the previous debate on EMPs,a company’s performance and its sustainability strategy.
Hypothesis 3. There are correlations between environmental prac-tices and innovation/ financial performance in the manufacturingindustry.
2.3. Complexity theory
In an organizational context, complexity theory can be explainedthrough environmental factors such as customers, suppliers,governmental regulations, and technological advancements(Chakravarthy, 1997). Practices and performance in a firm are influ-enced by both internal and external factors. Some early studiesindicate the importance of a supply chain environment in imple-menting EMPs. The implications for complexity theory in these kindsof studies state that some activities like an early supplier’s involve-ment in neweco-product designs can influence afirm’s performance.Additionally, standardizing and auditing a suppliers’ environmentalmanagement system, communications with customers for eco-design, and the handling of product returns from customers canalso influenceafirm’s performance (Koufteros et al., 2007, Sarkis et al.,2011; Vachon and Klassen, 2006). Moreover, according to Tseng(2011a, b), productivity and competitive advantage can be
enhanced throughaproposed framework for theassessmentofGreenSupply Chain Management (GSCM), since GSCM criteria can helpreviewand improvedevelopmentplansandperformanceevaluationsstrategically. Hence the following hypothesis was developed.
Hypothesis 4. Early supplier involvement, environmental standardsand audits for suppliers correlate well with a firm’s performance.
2.4. Diffusion theory of innovation
The diffusion theory of innovation claims that innovation can becommunicated by social members. Early adopters of it can alsooften have more benefits (Sarkis et al., 2011). The diffusion ofenvironmental friendly operations can be seen as an innovationprocess. According to an eco-innovation and global diffusion modelby Huber (2008), a pioneering country and its rooted industriesoften develop regulatory and innovation technologies in a globalinnovative competition. Subsequently, other countries will eitheradopt these regulations or have the intention to do so. The pioneeradopters often gain more of an improvement in performance thanlater ones, namely imitative adopters. Sweden has long beencredited with employing good environmental practices, whereasother countries like China and India are often considered by the restof the world as just starting to develop environmentally friendlymanufacturing practices. Thus, the last hypothesis is introduced.
Hypothesis 5. Sweden’s environmental performances inmanufacturing are different compared to the similar industry in Indiaand China.
3. Research methodology
3.1. Sample companies
This study has a focus on the manufacturing industry withselected samples from Sweden, China and India. For each samplecompany, the selection criteria include:
➢ The company should belong to a manufacturing industry;➢ The company should originate from Sweden, China or India;➢ The company should have a GRI report in 2010.
First, a potential list that includes 109 manufacturing plants inSweden was obtained. This is the same list that was presented in aprevious study (but with different study objectives) conducted in2006 by one of the authors (Feldmann, 2011). However, while thatstudy focused on manufacturing plants, this one concentrates onmanufacturing companies and was difficult to collect a large size ofsamples from. In fact, in many cases, several manufacturing plantsbelong to the same company. Thus, more potential sample com-panies from Sweden are drawn from the following sources: TheDow Jones Sustainability World Index 2010 and the sustainableoperations ranking list for companies by the global investmentbanking and securities company Goldman Sachs as well as thefinancial services company UBS in 2010.
Using the selecting criteria of a manufacturing company originalfrom Sweden, these sources provide a list of Atlas Copco, Electrolux,Sandvik, SKF, SCA, Volvo Group, Assa Abloy and ABB. Combinedwith a list from a previous survey study (Feldmann, 2011) anddeleting duplications, finally 16 manufacturing companies thatserve as research samples for Sweden were obtained. Additionally,data was collected from published sustainable reports (GRI) on theofficial website of the sample companies.
As stated before, the original Swedish samples can be obtainedfrom the above lists while the Indian and Chinese ones are notlisted in the Dow Jones Sustainability World Index 2010 or in the
L. Chen et al. / Journal of Cleaner Production 98 (2015) 36e4638

sustainable rankings from Goldman Sachs or UBS. Thus, concerningthe Chinese and Indian samples, only the manufacturing com-panies who are registered to the Sustainability Disclosure Database(Global Reporting Imitative, 2012) have been selected. In order toavoid non-standard environmental reporting data, only thosecompanies that have introduced a GRI reporting system are chosen.If the GRI report in 2010 cannot be found on the official website ofthe company, the Sustainability Disclosure Database (GlobalReporting Imitative, 2012) is used for a double check. As the result,9 Chinese and 12 Indian companies meet the criteria.
Finally, 37 companies satisfy the selection criteria and areincluded as examples in this study. Recall that one research purposeis to investigate the existence of mechanisms behind the relation-ships between EMPs and a company’s performance, especially in themanufacturing industry. As stated before, most process orientedmanufacturing companies consumemore energy and resources andfeel more regulatory pressure. One hypothesis indicates that thereare significant differences in environmental practices employedbetween a process industry and another manufacturing industry.Thus, the 37 selected companies are divided into two groupsdepending on their manufacturing branches, i.e. Process IndustryandNon-Process Industry. The latter includes automotive, electronicsand capital goods, etc. The samples are summarized in Table 1.
In order to evaluate the impact of EMPs on financial measures, itis also necessary to define some financial variables. According to aliterature review and annual financial reports by sample companiesin Sweden, China and India, a Return on capital employed by (ROCE)and Sales growth are used as financial measurements. These are the
same that were used inMontabon et al. (2007) except that they alsouse operating earnings as a financial indicator. Since most Chineseand Indian companies do not publish operating earnings in theirannual financial reports, this study’s operating earnings areexcluded from financial performance indicators. The informationfor ROCE and Sales growth can often be obtained in the annualreport of the sample companies. Additionally, these measuresefficiently reflect the aggregate financial performance at the com-pany level. Details of the definition are presented below.
3.1.1. Return on capital employed (ROCE)This is an objective financial measure, which reflects the success
of a business in realizing its goal. It is often applied to indicate theoverall efficiency and profitability of the business (Devinney et al.,2010).
Return on Capital Employed ¼Net Operating Profit After Tax=Capital Employed
3.1.2. Sales growthThis states an increase in sales over a specific period of time. In
this research, we only calculated the sales growth for the 2010 fiscalyear.
The financial data is collected from published 2010 annual re-ports of sample companies. The data for Swedish companies wasalso taken from Affärsdata (Business data) a database for a doublecheck.
3.2. Content analysis
Instead of using an existing database, the data is collected fromthe published reports of sample companies in this study. The mainmethodology applied in this research is content analysis based.Content analysis has been recognized as a systematic, structural,replicable methodology for compressing long texts into fewercontent categories based on an explicit coding process(Krippendorff, 2012; Shorideh et al., 2012). It is also a literaturereview method of a systematic, quantitative and qualitativedescription of a manifest content of literature in our specific area(Marasco, 2008). Moreover, research in accounting has shown theopportunity to classify disclosures as favorable or unfavorable, withquantitative measures that reflect the intensity or degree offavorableness, especially based on the published annual reports ofcompanies (Moneva et al., 2006).
According to Krippendorff (2012), six questions have beenaddressed for content analysis:
➢ Which data are analyzed?➢ How are they defined?➢ What is the population from which they are drawn?➢ What is the setting relative to which the data are analyzed?➢ What are the boundaries of the analysis?➢ What is the essence of the inferences?
The analysis is restricted in the following four-step framework(Gold et al., 2010):
➢ Material collection➢ Descriptive analysis➢ Category selection➢ Material evaluation
In this study, the relationship between one set of independentvariables and dependent variables corresponding to a company’s
Table 1Summary of the samples.
Company name Country Industry
BTa Sweden AutomobileScania Sweden AutomobileVolvo Cars Sweden AutomobileABB Sweden Capital goodsSKF Sweden Capital goodsAlfa Laval Sweden Capital goodsAssa Abloy Sweden Capital goodsElektrolux Sweden Capital goodsEricsson Sweden ElectronicsAAK Sweden ProcessBillerud Sweden ProcessHolmen Sweden ProcessStora Enso Sweden ProcessSCA Sweden ProcessSandvik Sweden ProcessSSAB Sweden ProcessBYD China AutomobileDongfeng Peugeot China AutomobileWeichai Power China AutomobileChina National Machinery
Industry CorporationChina Capital goods
China National Erzhong Group China Capital goodsHuawei China ElectronicsFoxconn China ElectronicsAlumium Corporation China China ProcessBao Steel group China ProcessTata motors India AutomobileMahindra India Capital goodsReliance Industries India Capital goodsITC Ltd. India Capital goodsJSW steel India ProcessACC(cement and Contrete) India ProcessAmbuja Cements India ProcessTata Metaliks India ProcessSail Mental India ProcessShree cements India ProcessChambal Fertilizers and Chemicals Limited India Process (chemicals)Jubilant Life Sciences Ltd India Process (chemicals)
a Swedish origins, but currently owned by foreign company.
L. Chen et al. / Journal of Cleaner Production 98 (2015) 36e46 39
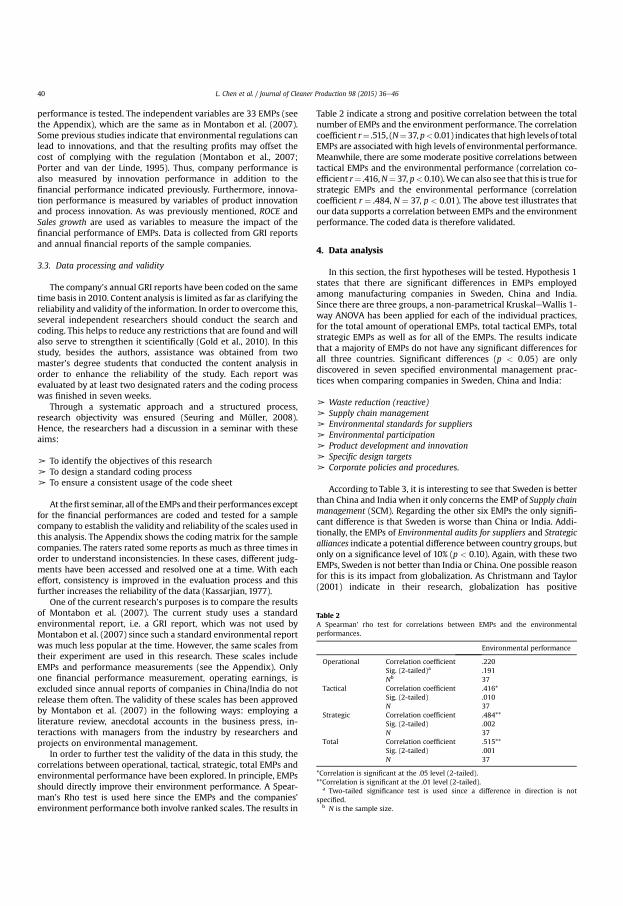
performance is tested. The independent variables are 33 EMPs (seethe Appendix), which are the same as in Montabon et al. (2007).Some previous studies indicate that environmental regulations canlead to innovations, and that the resulting profits may offset thecost of complying with the regulation (Montabon et al., 2007;Porter and van der Linde, 1995). Thus, company performance isalso measured by innovation performance in addition to thefinancial performance indicated previously. Furthermore, innova-tion performance is measured by variables of product innovationand process innovation. As was previously mentioned, ROCE andSales growth are used as variables to measure the impact of thefinancial performance of EMPs. Data is collected from GRI reportsand annual financial reports of the sample companies.
3.3. Data processing and validity
The company’s annual GRI reports have been coded on the sametime basis in 2010. Content analysis is limited as far as clarifying thereliability and validity of the information. In order to overcome this,several independent researchers should conduct the search andcoding. This helps to reduce any restrictions that are found and willalso serve to strengthen it scientifically (Gold et al., 2010). In thisstudy, besides the authors, assistance was obtained from twomaster’s degree students that conducted the content analysis inorder to enhance the reliability of the study. Each report wasevaluated by at least two designated raters and the coding processwas finished in seven weeks.
Through a systematic approach and a structured process,research objectivity was ensured (Seuring and Müller, 2008).Hence, the researchers had a discussion in a seminar with theseaims:
➢ To identify the objectives of this research➢ To design a standard coding process➢ To ensure a consistent usage of the code sheet
At thefirst seminar, all of the EMPs and their performances exceptfor the financial performances are coded and tested for a samplecompany to establish the validity and reliability of the scales used inthis analysis. The Appendix shows the coding matrix for the samplecompanies. The raters rated some reports as much as three times inorder to understand inconsistencies. In these cases, different judg-ments have been accessed and resolved one at a time. With eacheffort, consistency is improved in the evaluation process and thisfurther increases the reliability of the data (Kassarjian, 1977).
One of the current research’s purposes is to compare the resultsof Montabon et al. (2007). The current study uses a standardenvironmental report, i.e. a GRI report, which was not used byMontabon et al. (2007) since such a standard environmental reportwas much less popular at the time. However, the same scales fromtheir experiment are used in this research. These scales includeEMPs and performance measurements (see the Appendix). Onlyone financial performance measurement, operating earnings, isexcluded since annual reports of companies in China/India do notrelease them often. The validity of these scales has been approvedby Montabon et al. (2007) in the following ways: employing aliterature review, anecdotal accounts in the business press, in-teractions with managers from the industry by researchers andprojects on environmental management.
In order to further test the validity of the data in this study, thecorrelations between operational, tactical, strategic, total EMPs andenvironmental performance have been explored. In principle, EMPsshould directly improve their environment performance. A Spear-man’s Rho test is used here since the EMPs and the companies’environment performance both involve ranked scales. The results in
Table 2 indicate a strong and positive correlation between the totalnumber of EMPs and the environment performance. The correlationcoefficient r¼ .515, (N¼37,p<0.01) indicates that high levels of totalEMPs are associatedwith high levels of environmental performance.Meanwhile, there are some moderate positive correlations betweentactical EMPs and the environmental performance (correlation co-efficient r¼ .416,N¼ 37, p< 0.10).We can also see that this is true forstrategic EMPs and the environmental performance (correlationcoefficient r ¼ .484, N ¼ 37, p < 0.01). The above test illustrates thatour data supports a correlation between EMPs and the environmentperformance. The coded data is therefore validated.
4. Data analysis
In this section, the first hypotheses will be tested. Hypothesis 1states that there are significant differences in EMPs employedamong manufacturing companies in Sweden, China and India.Since there are three groups, a non-parametrical KruskaleWallis 1-way ANOVA has been applied for each of the individual practices,for the total amount of operational EMPs, total tactical EMPs, totalstrategic EMPs as well as for all of the EMPs. The results indicatethat a majority of EMPs do not have any significant differences forall three countries. Significant differences (p < 0.05) are onlydiscovered in seven specified environmental management prac-tices when comparing companies in Sweden, China and India:
➢ Waste reduction (reactive)➢ Supply chain management➢ Environmental standards for suppliers➢ Environmental participation➢ Product development and innovation➢ Specific design targets➢ Corporate policies and procedures.
According to Table 3, it is interesting to see that Sweden is betterthan China and India when it only concerns the EMP of Supply chainmanagement (SCM). Regarding the other six EMPs the only signifi-cant difference is that Sweden is worse than China or India. Addi-tionally, the EMPs of Environmental audits for suppliers and Strategicalliances indicate a potential difference between country groups, butonly on a significance level of 10% (p < 0.10). Again, with these twoEMPs, Sweden is not better than India or China. One possible reasonfor this is its impact from globalization. As Christmann and Taylor(2001) indicate in their research, globalization has positive
Table 2A Spearman’ rho test for correlations between EMPs and the environmentalperformances.
Environmental performance
Operational Correlation coefficient .220Sig. (2-tailed)a .191Nb 37
Tactical Correlation coefficient .416*Sig. (2-tailed) .010N 37
Strategic Correlation coefficient .484**Sig. (2-tailed) .002N 37
Total Correlation coefficient .515**Sig. (2-tailed) .001N 37
*Correlation is significant at the .05 level (2-tailed).**Correlation is significant at the .01 level (2-tailed).
a Two-tailed significance test is used since a difference in direction is notspecified.
b N is the sample size.
L. Chen et al. / Journal of Cleaner Production 98 (2015) 36e4640

environmental effects because global ties increase self-regulatorypressures on firms in low-regulation countries. Even though In-dian and China have less strict environmental regulation thanSweden, the global tie still pushes the big manufactures to increaseself-regulatory pressures and helps them to implement betterenvironmental management practices. In this way, the largemanufacturing companies in India and China may reach the sameenvironmental standard as their international competitors.
The next analysis explores Hypothesis 2, which states: there aresignificant differences between process industries and the othermanufacturing industries in terms of their employment of EMPs. Allof the EMPs are on non-parametric scales where the sample com-pany for process one is 17 and non-process ones are listed at 20.Since the sample size for both groups is less than 30, a non-parametrical Mann-Whitney-U-test is performed for each individ-ual EMP, as well as a total number of operational EMPs, tacticalEMPs, strategic EMPs and EMPs in their entirety. When a test isconducted at a significance level of 5% (p < 0.05), there is not asignificance between these two groups. Furthermore, since theresult can be caused by relative small samples, a further test at the10% level is applied. There are minor differences between processand non-process industries at a 10% level (p < 0.10) in terms of thefollowing EMPs:
➢ Creating a market for waste products which belongs to theoperational EMPs. Process manufacturing companies do betterwith this EMP.
➢ Environmental audits of suppliers and Use of life cycle analysis ordesign for environment which belong to tactical EMPs. Non-process manufacturing companies do better in both of thesetwo EMPs.
Corporate environmental standards and environmental audit-ing are often motivated by regulatory pressures (Khanna andAnton, 2002). Process industries including pulp and paper pro-ducers as well as chemical producers often face more pressures
from external stakeholders and have more regulatory pressures.Moreover, the pulp and paper industry has a mature waste prod-ucts market. For example, the European pulp and paper industryproduces eleven million tons of waste where 70% of it is recycled(Monte et al., 2009). Additionally, Azapagic (1999) stated in herreview paper that an increasing pressure on the chemical andprocess industries will improve their environmental performance.As a result a more acceptable life cycle analysis coupled with amulti-objective optimization as a process design tool will optimizethe environmental, economic, technical and other miscellaneousaspects of this industry simultaneously. However, it is interesting tonote that according to the current study, a process industry is notnecessarily better in EMPs compared to a non-processmanufacturing industry. Previous studies are often limited to justanalyzing one individual industry rather than a comparison of oneindustry to another. As a result, empirical research is limited in thisarea and more research should concentrate on this in the future.
At the next stage of data analysis, a correlation between envi-ronmental practice, firm innovation and financial performance isinvestigated. For all companies, the sum of all environmentalpractice scores has been calculated as well as the aggregate scoresfor operational, tactical and strategic practices. These scores(shown in Table 4) have then been compared as far as their ROCEand Sales growth is concerned. Since EMPs are known as rankedscales, a correlation between EMPs and the financial performance istested by Spearman’s Rho test, which is a nonparametric correla-tion analysis that is capable of both ranked and continuous scales.Some tests have a reduced number of sample sizes due to an un-availability of certain financial performance measures. As can beseen in Table 4, neither the total amount of environmental man-agement practices, strategic EMPs, tactical EMPs or operationalEMPs have significant correlations with these two measures offinancial performance e namely the ROCE and in their Sales growth.
In order to further compare the results with ones in Montabonet al. (2007), the Spearman’s rho correlation tests have beenapplied looking at the financial performance and six other selectedvariables, which have been identified to be significant according toa conclusion reached by Montabon et al. (2007). These six EMPsare: Recycling, Proactive waste management, Remanufacturing,Environmental design, Specific design targets and Surveillance of themarket for environmental issues. The results can be found in Table 5.According to a current study, there are not any significant corre-lations between these EMPs and the financial performances.
At this point, a further test between the rest of the 27 EMPs andthe financial performances was conducted. Four specific EMPs havesignificant correlations with the financial performances andinclude Environmental information, Supply chain management,Environmental statuses for suppliers and Environmental risk analysis,
Table 3Ranks for EMPs between Sweden, China and India (p < 0.05).
Country N Mean rank
Waste reduction (reactive) Sweden 16 20.50India 12 15.88China 9 20.50Total 37
Supply chain management Sweden 16 24.31India 12 9.58China 9 22.11Total 37
Environmental standard for suppliers Sweden 16 21.75India 12 12.29China 9 23.06Total 37
Environmental participation Sweden 16 19.81India 12 24.33China 9 10.44Total 37
Product development and innovation Sweden 16 15.72India 12 17.75China 9 26.50Total 37
Specific design targets/goals Sweden 16 21.31India 12 11.29China 9 25.17Total 37
Corporate policy/procedure Sweden 16 17.75India 12 24.88China 9 13.39Total 37
Table 4Spearman’s rho test for the correlations between operational, tactical, strategic andtotal EMPs as well as for financial Performance.
Return on capitalemployed
Salesgrowth
Operational Correlation coefficient -.126 .227Sig. (2-tailed) .532 .197Sample size N 27 34
Tactical Correlation coefficient �.031 �.256Sig. (2-tailed) .879 .144N 27 34
Strategic Correlation coefficient �.118 �.076Sig. (2-tailed) .558 .669N 27 34
Total Correlation coefficient .005 �.070Sig. (2-tailed) .979 .694N 27 34
L. Chen et al. / Journal of Cleaner Production 98 (2015) 36e46 41

as seen in Table 6. Only Environmental informationwas observed tohave a positive strong correlation with Sales growth (r ¼ .501,N ¼ 34, p < 0.05) which indicates higher levels of environmentalinformation that was disclosed and was also associated with higherlevels of Sales growth. Sufficient environmental disclosure can in-crease an external stakeholder’s confidence, and thereby, increase aheightened market acceptability of the products. This can, in turn,also favor Sales growth. Furthermore, the three other EMPsexhibited negative correlations with regards to Sales growth (seeTable 6). Therefore, regarding Hypothesis 3, we conclude that onlyspecifically selected EMPs (which differ from the ones in Montabonet al., 2007) have correlations with the financial performances, andsuch correlations can be seen as either positive or negative.
When searching for correlations between environmental prac-tices, the performances and the process and product innovations,again a Spearman’s Rho test was applied since the EMPs and theinnovation performance rankings are on both scales. As was con-ducted previously, the test starts with obtaining the overall scoresfor environmental practices (operational, tactical, strategic andtotal) in order to identify whether any specific level of practiceseems to have a greater impact. The results in Table 7 indicated thatthere is not a correlation between operational EMPs and the level ofinnovation performance. However, there is a strong positive
correlation between two other variables, i.e. a correlation coeffi-cient of r ¼ .570 (N ¼ 36, p < 0.001) indicates that higher levels oftactical EMPs are associated with higher levels of innovation per-formance (products). Meanwhile, there is medium correlation be-tween strategic EMPs and their innovation performance (products)with a correlation coefficient of r ¼ .489 (N ¼ 36, p < 0.001). Acorrelation between total EMPs and the innovation performance(products) are strong and positive with a correlation coefficient ofr ¼ .556 (N ¼ 36, p < 0.001). One reason for this phenomena is thatEMPs can be treated as an overall strategic organizational approach,which plays an important role in planning the product/processdesign nowadays (Tseng et al., 2008a, 2008b; Tseng, 2011a, b). Anempirical research on German manufacturing companies alsoshows a positive correlation with the implementation level ofenvironmental management systems and environmental product/process innovation (Wagner, 2007). In EU countries, there areunique standards for environmental management systems such asthe EU Environmental Management and Auditing Scheme (EMAS).Rennings et al. (2006) conducted a study that gathered data on a setof German EMAS-validated facilities. Their research indicates thatthere is a positive impact on the maturity of environmental
Table 5Spearman’s rho test for correlations between six specific EMPs and the financialperformances.
Return onemployedcapital
Sales growth
Recycling Correlation coefficient �.026 �.200Sig. (2-tailed) .899 .256N 27 34
Waste reduction(proactive)
Correlation coefficient �.022 .142Sig. (2-tailed) .915 .423N 27 34
Remanufacturing Correlation coefficient .325 .209Sig. (2-tailed) .098 .235N 27 34
Environmental design Correlation coefficient .246 �.091Sig. (2-tailed) .217 .607N 27 34
Specific design targets/goals
Correlation coefficient .077 �.316Sig. (2-tailed) .702 .068N 27 34
Surveillance of market Correlation coefficient .068 .034Sig. (2-tailed) 34 .847N �.122 34
Table 6Spearman’s rho test indicating correlations between selected EMPs and the financialperformances.
Return on capitalemployed
Salesgrowth
Environmentalinformation
Correlation coefficient �.287 .501**Sig. (2-tailed) .147 .003N 27 34
Supply chainmanagement
Correlation coefficient �.079 �.341*Sig. (2-tailed) .697 .048N 27 34
Environmentalstandard forsuppliers
Correlation coefficient �.160 �.358*Sig. (2-tailed) .427 .038N 27 34
Environmental riskanalysis
Correlation coefficient .073 �.424*Sig. (2-tailed) .718 .012N 27 34
*Correlation is significant at the .05 level (2-tailed).**Correlation is significant at the .01 level (2-tailed).
Table 7Spearman’s rho test for correlations between EMPs and the innovationperformances.
Innovationperformance(products)
Innovationperformance(process)
Operational Correlation coefficient .079 .191Sig. (2-tailed) .648 .265N 36 36
Tactical Correlation coefficient .570** .046Sig. (2-tailed) .000 .791N 36 36
Strategic Correlation coefficient .489** .186Sig. (2-tailed) .002 .277N 36 36
Total Correlation coefficient .556** .098Sig. (2-tailed) .000 .568N 36 36
*Correlation is significant at the .05 level (2-tailed).**Correlation is significant at the .01 level (2-tailed).
Table 8Spearman’s rho test for the correlations between six specific EMPs and their inno-vation performances.
Innovationperformance(products)
Innovationperformance(process)
Recycling Correlation coefficient .213 .140Sig. (2-tailed) .212 .415N 36 36
Waste reduction(proactive)
Correlation coefficient .073 .044Sig. (2-tailed) .674 .798N 36 36
Remanufacturing Correlation coefficient �.048 �.114Sig. (2-tailed) .781 .509N 36 36
Environmentaldesign
Correlation coefficient .541** .449**Sig. (2-tailed) .001 .006N 36 36
Specific designtargets/goals
Correlation coefficient .525** .123Sig. (2-tailed) .001 .473N 36 36
Surveillance ofmarket
Correlation coefficient .679** .150Sig. (2-tailed) .000 .381N 36 36
*Correlation is significant at the .05 level (2-tailed).**Correlation is significant at the .01 level (2-tailed).
L. Chen et al. / Journal of Cleaner Production 98 (2015) 36e4642

management systems as far as their environmental process in-novations are concerned. Furthermore, environmental manage-ment systems have a positive impact on environmental productinnovations and learning processes. Most Indian and Chinesecompanies do not comply with EMAs and are currently in themiddle of a learning process when it comes to these standards. Dueto the inclusive nature of these examples, it is reasonable to notethat a significant correlation exists between innovation and per-formance in products rather than when it comes to process, oper-ations, tactics, various strategies and the total amount of EMPs.
At this point, correlations between the previously selected sixselected variables (identified with the financial performances inMontabon et al., 2007) and the innovation performances have beentested. From Table 8, it can be seen that Environmental design ispositively correlated significantly to both product and processinnovation. Additionally, Specific design targets and the Surveillanceof markets are both positively correlated significantly to productinnovation. Environmental considerations will also affect a com-pany’s research and design practices and drive them to designmoreeco-efficient products and create more product innovations (Nociand Verganti, 1999). This result can also be supported by an envi-ronmental modernization theory and empirical research byRennings et al. (2006). According to their study, the implementa-tion of environmental policies connects environmental manage-ment to technical/environmental innovations including productand process innovations.
At this point, correlations, between 27 other EMPs and theinnovation performanceswere tested. They found both positive anddirect connections between several different EMPs and theirinnovation performances both in product and in process. Forexample, Product Development, Innovation, Design, and Strategicalliance all correlate positively to their innovation performanceswith respect to both product and process. Life cycle analysis, Specificdesign targets, Communication, Integration with long-term businessstrategy, and Surveillance of market also correlate positively toinnovation performance of product. The Environmental missionstatement correlates positively to innovation performance of pro-cess. Again, these EMPs belong at tactical and strategic levels. Theresults are also in line with those of Theyel (2000), where theyfound that several EMPs will improve environmental innovation,performance and possibly reduce costs.
In order to test Hypothesis 4, the Spearman’s Rho analysis isapplied to examine Early supplier involvement, Environmentalstandard for suppliers, an Environmental audit for suppliers and theircorrelation with a firm’s financial performances. Not every com-pany’s financial data can be obtained, thus these companieswithout data on ROCE or Sales growth were excluded. The resultsare presented in Table 9, which indicates that there are significant
negative correlations between Environmental standard for suppliersand Sales growth. It also means that that higher Environmentalstandard for suppliers leads to lower Sales growth. These Environ-mental standards for suppliers can approve of the environmentalfriendly quality of the product, and thereby, meet an everincreasing market demand for environmentally friendly products.However, on the other hand, it may increase costs, not only forsuppliers, but also for the company itself. Additionally, it mayprolong the design and production process and further delay thetime of introducing products to the market. A positive impact formarkets might only be realized in the long-term as the marketneeds time to accept a greener product and possibly at a higherprice. On a short-term scale, a stricter Environmental standard forsuppliers will increase the purchasing cost and then increase thefinal price, which will be negative to Sales growth.
In order to test Hypothesis 5, the environmental performanceamong manufacturing companies in Sweden, India and China arecompared. According to Montabon et al. (2007), the Environmentalperformance is measured using the following indicators: Reductionin significant environmental incidents, Environmental certification,Continuous improvement, Recycling performance, Customer andshareholder perception of environmental performance, Independentaudits of environmental performance, Waste reduction, Resourceconsumption (water, energy, steam, solids, fuel) and Cost savings forenvironmental projects and activities. These factors are also scoredbased on the content analysis of a company’s GRI report.
A non-parametrical KruskaleWallis 1-way ANOVA has beenperformed and the results show only two factors, Customer andShareholder Perception and Cost savings for environmental projectsand activities have a significance difference level of5% (p < 0.05)among manufacturing companies in Sweden, India and China forenvironmental performance. It is also interesting to note that inCustomer and shareholder perception, India ranks highest while inCost savings for environmental projects and activities, China ranks thehighest. This indicates that in India, the public requirement forenvironment performance is high, whereas in China, recent quickeconomic developments, costs and profits are still the main drivingforces for evaluating performance. In fact, other environment per-formances do not show any significant differences. As stated before,globalization creates pressure for large manufacturing companiesin developing companies such as China and India to improve theirenvironmental performance in order to catch up with their globalcompetitors. This could be the reason for why a difference ofenvironment performance between these countries is diminishing.
5. Results
A growing number of companies publishing GRI reports indicatean increasing engagement in standardized and effective measuresfor environmental practices and performance. In this study, the GRIreport has been applied as an innovative approach for collectingdata and comparing the EMPs between different industries andcountries. A total of 37 companies were selected from Sweden,China and India in order to investigate the links between EMPs anda company’s performances.
According to the results of the statistical analysis, there exists nosignificant difference in EMPs between a process industry versusother manufacturing industries at the 5% level (p < 0.05). There areseven EMPs employed differently by Sweden, China and India at the5% level (p < 0.05). These seven EMPs include Waste reduction(reactive), Supply chain management, Environmental standards forsuppliers, Environmental participation, Product development andinnovation, Specific design targets and Corporate policies and pro-cedures. One interesting finding is that in most of these EMPs,Sweden is not necessarily better than China or India except in
Table 9Spearman’s rho test for correlations between an early supplier’s involvement, anEnvironmental standard for suppliers and an environmental audit for suppliers andthe financial performance.
Return on capitalemployed
Sales growth
Early supplierinvolvement
Correlation coefficient �.014 .009Sig. (2-tailed) .945 .958N 27 34
Environmentalstandard forsuppliers
Correlation coefficient �.160 �.358*
Sig. (2-tailed) .427 .038N 27 34
Environmentalaudits ofsuppliers
Correlation coefficient .103 �.236Sig. (2-tailed) .608 .180N 27 34
*Correlation is significant at the .05 level (2-tailed).**Correlation is significant at the .01 level (2-tailed).
L. Chen et al. / Journal of Cleaner Production 98 (2015) 36e46 43

Supply chain management. The small and medium sized companiesin Sweden, China and India still did not provide for any sustain-ability disclosure. Most of the sample companies in these threecountries are top companies in the world or at least in their owncountry due to one sample selection criterione the GRI report. Alsothose large companies who have standards such as EMAS and ISO14001 often transfer their environmental management practices toother facilities worldwide. This could be one reason for explainingwhy there are not many significant differences concerning theperformance in sample companies in these countries. Nevertheless,the study result still shows that globalization and the changingmanufacturing environment have an impact on reducing the dif-ference in the employment of EMPs in these countries, particularlywith these large companies.
Furthermore, direct correlations have not been found betweentactical, strategic, total EMPs and a company’s financial perfor-mance according to these samples. However, when investigatingthe correlation between EMPs and the innovation performance, itcan be found that higher levels of tactical EMPs, strategic EMPs andtotal EMPs are associated with higher levels of innovation perfor-mance (products). Concerning the 6 EMPs which are identified assignificantly correlating to financial performance and innovationperformance in Montabon et al. (2007), a significant correlationcannot be seen between these 6 EMPs and the financial perfor-mances in these 37 samples. However, Environmental design ispositively and significantly correlated to innovation performance,both in product and in process. Additionally, some special EMPsincluding Specific design targets and Surveillance of Markets are bothsignificantly correlated to product innovation in a positive way. It isinteresting to note that there is a negative correlation betweenEnvironmental standard for suppliers and Sales growth. One possi-bility is that stricter Environmental standards for suppliers will in-crease purchasing costs, which will lead to less market acceptance.Four specific EMPs have correlations with the financial perfor-mances and these include Environmental Information, Supply chainmanagement, Environmental for Suppliers and Environmental riskanalysis. Moreover, only Environmental Information category wasshown to have a strong and positive correlation with Sales growth.This shows that a sufficient and efficient environmental informa-tion disclosure to the public will have the potential to increase amarket acceptance for products and then increase Sales growth.
After comparing the environmental performances of Sweden,China and India, only Customer and shareholder perception and Costsavings for environmental projects and activities display a significantdifference (p < 0.05) between these three countries. Again, ac-cording to these samples, Sweden is not necessarily doing betterthan China or India with respect to environmental performance.
6. Conclusion and managerial implications
The research results have managerial implications for envi-ronmental management within the field of operations manage-ment. First of all, the research findings clearly indicate thatenvironmental management at tactical, strategic and at all levelshave positive correlations with product innovations. Thus, in orderto improve product innovation and keep a competitive advantage,the decision makers of companies have to consider the strategicimportance of environmental friendly operations. Moreover,Design and Design for Specific design targets are strongly correlatedwith innovation performance (products) in a positive way. Thisindicates that managers must be aware that in order to achieveinnovation performance, it is important to put more efforts at theearly stages of a production process. For example, a companyshould have an environmental consideration for eco-efficiency atthe research and design stage.
Regarding the 33 EMPs, only environmental information hasstrong and positive correlation with Sales growth. This shows theimportance of environmental information disclosure. Managersshould put more efforts into announcing environmental informa-tion that can improve their relationship to external stakeholders,including customers. In general, operational, tactical, strategic andtotal EMPs are statistically insignificant with regards to financialperformance. This result is almost consistent with findings in Hoferet al. (2012). Therefore, companies perceiving investments inenvironmental management and further improving their EMPsmay not immediately gain economic profit. For example, one resultthis study shows is that a stricter Environmental standard for sup-pliers will increase purchasing costs, which will lead to less marketacceptance and reduce Sales growth. These potentially high upfrontcosts and their uncertain payoffs will discourage a company’sattempt to improve their environmental practices (Hofer et al.,2012). However, according to this research, the improved EMPscan still have a positive impact on environmental performance. Inthis case, there are positive correlations with innovation perfor-mance, which may lead to a favorable financial performance in thefuture.
This research also indicates that there is a lacking of manage-ment awareness concerning environmental management perfor-mance audits and their available procedures are still uncertain.From a managerial perspective, the findings of this paper shouldfurther raise awareness of standardized formats for reportingenvironmental management practices like following the GlobalReporting Initiative guideline. In this way, it enables companies toobtain a transparent internal and external communication systemas well as a visual control of the triple bottom line on a companylevel (Hedberg and von Malmborg, 2003). Also, this researchshould further raise awareness of potential business performanceimprovements, especially in the manufacturing industry. Thisawareness should help decision makers to make better choices asfar as their environmental practice strategies and implementationsare concerned. In this study, the investigation is mainly based ondata from GRI reports. Due to a time lag between an EMPsimplementation and its effect on a company’s performance, thecompanies who follow the GRI reporting system may not neces-sarily perform better than others in the short run. However, thetransparency in a sustainability reporting system should enhancethe opportunity to gain a potential competitive advantage andimprove long term relationships with internal and externalstakeholders.
7. Limitations
In this study, all of the data is collected based on GRI andfinancial reports in 2010. One limitation is the time lag betweenenvironmental management practice implementation and its spe-cific effect on a company’s performance. One future extension willbe to investigate companies using a GRI reporting standard forseveral years. This should definitely be interesting, but a limitationto this is a further reduction of the potential sample, since only alimited number of companies have adopted a GRI reporting stan-dard and have a history over several consecutive years.
In this research, the total sample consists of 37 companies,which are split into three different groups based on regions. Thesample size is another limitation of this paper, since advancedstatistical methods often require larger sample sizes. An increasedsample size could also help achieve significant results for some ofthe tests that were borderline significant. Nevertheless, as a GRIreport often exceed 100 pages, a large sample size increases thedifficulties in the content analysis and it also requires a more rigidmethod for clarifying reliability and validity in the content analysis.
L. Chen et al. / Journal of Cleaner Production 98 (2015) 36e4644

Appendix. List of variables for raters
This list is adopted and modified from Montabon et al., 2007.Details of the definition can be found in Montabon et al., 2007.Grading scale should follow 1: not doing it, 3: alludes to doing it.5: quantitative measures, categories, and targets.
1. Environmental practices
1A. Operational practices
1. Recycling2. Waste reduction (proactive)3. Waste reduction (reactive)4. Remanufacturing5. Substitution6. Consume internally7. Packaging8. Spreading risk9. Creating a market for waste products
10. Energy11. Money spent on environmental initiatives12. Environmental information13. Rewards as an incentive for an environmental project
1B. Tactical practices
14. Supply chain management15. Early supplier involvement16. Environmental standards for suppliers17. Environmental audits of suppliers18. Environmental awards/recognition19. Environmental participation20. Use of life cycle analysis or design for environment21. Product development and innovation22. Environmental design23. Specific design targets24. Environmental risk analysis25. Environmental management systems (EMS)26. Communication
1C. Strategic practices
27. Integration with long-term business strategy28. Corporate policies and procedures29. Environmental mission statement30. Employee programs31. Environmental department/teams (existence/extent of
formal organizational structure)32. Surveillance of the market for environmental issues33. Strategic alliances
2. Performance measures
2A. Environmental Performance measures
34. Reduction in significant environmental incidents35. Environmental certification36. Continuous improvement37. Recycling performance38. Customer and shareholder perception of environmental
performance39. Independent audits of environmental performance
40. Waste reduction41. Resource consumption (water, energy, steam, solids, fuel)42. Cost savings for environmental projects and activities
2B. Financial performance measures
43. Return on capital employed (ROCE)44. Sales growth
2C. Innovation Performance Measures
44. Innovation performance (products)45. Innovation performance (process)
References
Azapagic, A., 1999. Life cycle assessment and its application to process selection,design and optimisation. Chem. Eng. J. 73 (1), 1e21.
Chakravarthy, B., 1997. A new strategy framework for coping with turbulence. SloanManag. Rev. 38 (2), 126e127.
Christmann, P., Taylor, G., 2001. Globalization and the environment: determinantsof firm self-regulation in China. J. Int. Bus. Stud. 32 (3), 439e458.
Devinney, T.M., Yip, G.S., Johnson, G., 2010. Using frontier analysis to evaluatecompany performance. Br. J. Manag. 21 (4), 921e938.
DiMaggio, P.J., Powell, W.W., 1983. Reprinted from the American Sociological As-sociation. The Iron Cage Revisited e Institutional Isomorphism and CollectiveRationality in Organizational Fields, vol. 48, pp. 147e160.
Donnelly, K., Beckett-Furnell, Z., Traeger, S., Okrasinski, T., Holman, S., 2006. Eco-design implemented through a product-based environmental managementsystem. J. Clean. Prod. 14 (15e16), 1357e1367.
Feldmann, A., 2011. A Strategic Perspective on Plants in Manufacturing Networks.Doctoral dissertation. Department of Management and Engineering, LinköpingUniversity.
Gold, S., Seuring, S., Beske, P., 2010. Sustainable supply chain management andinter-organizational resources: a literature review. Corp. Soc. Responsib. Envi-ron. Manag. 17, 230e245.
Hall, J., Matos, S., 2010. Incorporating impoverished communities in sustainablesupply chains. Int. J. Phys. Distrib. Logist. Manag. 40 (1/2), 124e147.
Hedberg, C.-J., von Malmborg, F., 2003. The global reporting initiative and corporatesustainability reporting in Swedish companies. Corp. Soc. Responsib. Environ.Manag. 10 (3), 153e164.
Hirsch, P.M., 1975. Organizational effectiveness and the institutional environment.Adm. Sci. Q. 20 (3), 327e344.
Hofer, C., Cantor, D.E., Dai, J., 2012. The competitive determinants of a firm’s envi-ronmental management activities: evidence from US manufacturing industries.J. Oper. Manag. 30 (1e2), 69e84.
Huber, J., 2008. Pioneer countries and the global diffusion of environmental in-novations: theses from the viewpoint of ecological modernisation theory. Glob.Environ. Change 18, 360e367.
Jabbour, C.J.C., Santos, F.C.A., Nagano, M.S., 2008. Environmental managementsystem and human resource practices: is there a link between them in fourBrazilian companies? J. Clean. Prod. 16 (17), 1922e1925.
Johnstone, N., Labonne, J., 2009. Why do manufacturing facilities introduce envi-ronmental management systems? Improving and/or signaling performance.Ecol. Econ. 68 (3), 719e730.
Kassarjian, H.H., 1977. Content analysis in consumer research. J. Consum. Res. 4 (1),8e18.
Khanna, M., Anton, W.R.Q., 2002. What is driving corporate environmentalism:opportunity or threat? Corp. Environ. Strategy 9 (4), 409e417.
Koufteros, X.A., Cheng, T.C.E., Lai, K.H., 2007. ‘‘Black-box’’ and ‘‘gray-box’’ supplierintegration in product development: antecedents, consequences and themoderating role of firm size. J. Oper. Manag. 25 (4), 847e870.
Krippendorff, K., 2012. Content Analysis: an Introduction to its Methodology, thirded. Sage, Thousand Oaks, CA.
Marasco, A., 2008. Third-party logistics: a literature review. Int. J. Prod. Econ. 113(1), 127e147.
Moneva, J.M., Archel, P., Correa, C., 2006. GRI and the camouflaging of corporateunsustainability. Account. Forum 30 (2), 121e137.
Montabon, F., Sroufe, R., Narasimhan, R., 2007. An examination of corporatereporting, environmental management practices and firm performance. J. Oper.Manag. 25 (5), 998e1014.
Monte, M.C., Fuente, E., Blanco, A., Negro, C., 2009. Waste management from pulpand paper production in the European Union. Waste Manag. 29 (1), 293e308.
Montgomery, R., Sanches, L., 2002. Efficiency: the sustainability criterion thatprovides useful guidance for statistical research. Stat. J. UN Econ. Comm. Eur. 19(1/2), 29e40.
L. Chen et al. / Journal of Cleaner Production 98 (2015) 36e46 45
Noci, G., Verganti, R., 1999. Managing ’green’ product innovation in small firms. R&DManag. 29 (1), 3e15.
Porter, M.E., van der Linde, C., 1995. Green and competitive: ending the stalemate.Harv. Bus. Rev. 73 (5), 120e134.
Rennings, K., Ziegler, A., Ankele, K., Hoffmann, E., 2006. The influence of differentcharacteristics of the EU environmental management and auditing scheme ontechnical environmental innovations and economic performance. Ecol. Econ. 57(1), 45e59.
Russo, M.V., Fouts, P.A., 1997. A resource-based perspective on corporate environ-mental performance and profitability. Acad. Manag. J. 40 (3), 534e559.
Sarkis, J., Gonzalez-Torre, P., Adenso-Diaz, B., 2010. Stakeholder pressure and theadoption of environmental practices: the mediating effect of training. J. Oper.Manag. 28 (2), 163e176.
Sarkis, J., Zhu, Q., Lai, K.-h, 2011. An organizational theoretic review of green supplychain management literature. Int. J. Prod. Econ. 130 (1), 1e15.
Seuring, S., Müller, M., 2008. From a literature review to a conceptual framework forsustainable supply chain management. J. Clean. Prod. 16 (15), 1699e1710.
Shorideh, F.A., Ashktorab, T., Yaghmaei, F., 2012. Iranian intensive care unit nurses’moral distress: a content analysis. Nurs. Ethics 19 (4), 464e478.
Tate, W.L., Ellram, L.M., Kirchoff, J.F., 2010. Corporate social responsibility reports: athematic analysis related to supply chain management. J. Supply Chain Manag.46 (1), 19e44.
Theyel, G., 2000. Management practices for environmental innovation and perfor-mance. Int. J. Oper. Prod. Manag. 20 (2), 249e266.
Tseng, M.L., 2011a. Using a hybrid MCDM model to evaluate firm environmentalknowledge management in uncertainty. Appl. Soft Comput. 11 (1), 1340e1352.
Tseng, M.L., 2011b. Green supply chain management with linguistic preferences andincomplete information. Appl. Soft Comput. 11 (8), 4894e4903.
Tseng, M.L., 2013. Modeling sustainable production indicators with linguisticpreferences. J. Clean. Prod. 40, 46e56.
Tseng, M.L., Lin, Y.H., Chiu, A.S.F., Liao, J.C.H., 2008a. Using FANP approach on se-lection of competitive priorities based on cleaner production implementation: acase study in PCB manufacturer, Taiwan. Clean. Technol. Environ. Policy 10 (1),17e29.
Tseng, M.L., Lin, Y.H., Wu, W.W., Liao, C.H., 2008b. An exploration of relationshipsbetween environmental practice and manufacturing performance using the PLSpath modeling. WSEAS Transact. Environ. Dev. 4 (6), 487e502.
Vachon, S., Klassen, R.D., 2006. Green project partnership in the supply chain: thecase of the package printing industry. J. Clean. Prod. 14, 661e671.
Wagner, M., 2007. On the relationship between environmental management,environmental innovation and patenting: evidence from Germanmanufacturing firms. Res. Policy 36 (10), 1587e1602.
Walls, J.L., Berrone, P., Phan, P.H., 2012. Corporate governance and environmentalperformance: is there really a link? Strat. Manag. J. 33 (8), 885e913.
Wolf, J., 2011. Sustainable Supply chain management integration: a qualitativeanalysis of the German manufacturing industry. J. Bus. Ethics 102 (2), 221e235.
Wu, Z., Pagell, M., 2011. Balancing priorities: Decision-making in sustainable supplychain management. J. Oper. Manag. 29 (6), 577e590.
Yang, M.G., Hong, P., Modi, S.B., 2011. Impact of lean manufacturing and environ-mental management on business performance: an empirical study ofmanufacturing firms. Int. J. Prod. Econ. 129 (2), 251e261.
Zhu, Q., Sarkis, J., 2004. Relationships between operational practices and perfor-mance among early adopters of green supply chain management practices inChinese manufacturing enterprises. J. Oper. Manag. 22 (3), 265e289.
Zhu, Q., Sarkis, J., 2007. The moderating effects of institutional pressures onemergent green supply chain practices and performance. Int. J. Prod. Res. 45(18/19), 4333e4355.
L. Chen et al. / Journal of Cleaner Production 98 (2015) 36e4646


IIIPAPER


The relationship between disclosures of corporate social performanceand financial performance: Evidences from GRI reportsin manufacturing industry
Lujie Chen a,n, Andreas Feldmann b, Ou Tang a
a Division of Production Economics, Department of Management and Engineering, Linköping University, SE-581 83 Linköping, Swedenb Division of Industrial Management, Department of Industrial Economics and Management, Royal Institute of Technology, SE-100 44 Stockholm, Sweden
a r t i c l e i n f o
Article history:Received 15 April 2014Accepted 4 April 2015
Keywords:Corporate social responsibilityDisclosures of social performanceFinancial performanceGlobal Reporting InitiativeEmpirical research
a b s t r a c t
Whether the corporate social performance affects the financial performance is still unclear in manymanufacturing companies. We commonly expect, on one side, that profitable corporations have strongerincentives to reveal information on the social performance in order to improve their publicity; on theother hand, companies may face the fear of rising costs due to Corporate Social Responsibility (CSR)activities. With increasing concerns of CSR, it is timely to investigate the relationship between thedisclosure of corporate social performance and the financial performance. In this paper with the abovestudy objective, we use Global Reporting Initiative (GRI) reports of 75 sample companies, collectevidences by applying the method of structured content analysis of the cases and attempt to identify thisrelationship. The corporate social performance is measured by the indicators according to the GRIguidelines, i.e. within the categories of Labor practices and decent work, Human Rights, Society as wellas Product responsibility. Financial performance is measured by return on equity, sales growth and cashflow/sales ratio. Using statistical evaluation methods, our results indicate that the categories of HumanRights, Society as well as Product responsibility display a significant and positive correlation with thereturn on equity. Same conclusion also holds for many CSR indicators. Nevertheless, when examining theCSR practices across different manufacturing sectors, we have not observed significant differences. Thestudy results are important for understanding the development and implementation of CSR practices inthe manufacturing industry.
& 2015 Elsevier B.V. All rights reserved.
1. Introduction
The common definition of sustainability by the BrundtlandReport (WCED, 1987) is under three umbrellas: economic accom-plishment, social justice and environmental stability. According tothe reports of EC (2002), Bansal (2005) and Moneva et al. (2007),the corporate social responsibility (CSR) is considered as contribu-tions of companies to sustainable development. The CSR conceptshould be included in the corporate strategies concerning theareas of environmental influence, as well as the society livingconditions development, willing behavior and business ethics.Such strategies will then define the codes of conduct based onwhich the companies implement their operations (AECA, 2004).
In recent decades, companies are paying increasing attentionsto CSR and its related performances. Different stakeholders raise
pressures to companies to improve their CSR performances andrelease the related reports. Such pressures include for example,public concern, regulatory forces, consumer pressure, industrypeer pressures, reputation concerns, media interest and perceivedmarket advantage (Gallear et al., 2012). For company itself,improving and reporting their CSR work are one kind of invest-ments for sustainable development, and thus an evaluation oftheir consequence should be relevant.
The debates on the relationship between CSR and corporateperformances are not new. There are some studies in this concern.Carroll (1979) provides a comprehensive conceptual model forpresenting the key aspects of corporate social performances.Clarkson (1995) applies the stakeholder theory to establish aframework for analyzing corporate social performances.
If we examine the relationship between CSR and more speci-fically the associated financial performances, there are controver-sial results. Some researchers argue that there should be a positiverelationship between the disclosure of CSR performances andcompany financial performances. The reasoning is that by report-ing and improving their CSR work, companies can receive the
Contents lists available at ScienceDirect
journal homepage: www.elsevier.com/locate/ijpe
Int. J. Production Economics
http://dx.doi.org/10.1016/j.ijpe.2015.04.0040925-5273/& 2015 Elsevier B.V. All rights reserved.
n Corresponding author. Tel.: þ46 13 281770; fax: þ46 13 281101.E-mail addresses: [email protected] (L. Chen),
[email protected] (A. Feldmann), [email protected] (O. Tang).
Please cite this article as: Chen, L., et al., The relationship between disclosures of corporate social performance and financialperformance: Evidences from GRI.... International Journal of Production Economics (2015), http://dx.doi.org/10.1016/j.ijpe.2015.04.004i
Int. J. Production Economics ∎ (∎∎∎∎) ∎∎∎–∎∎∎
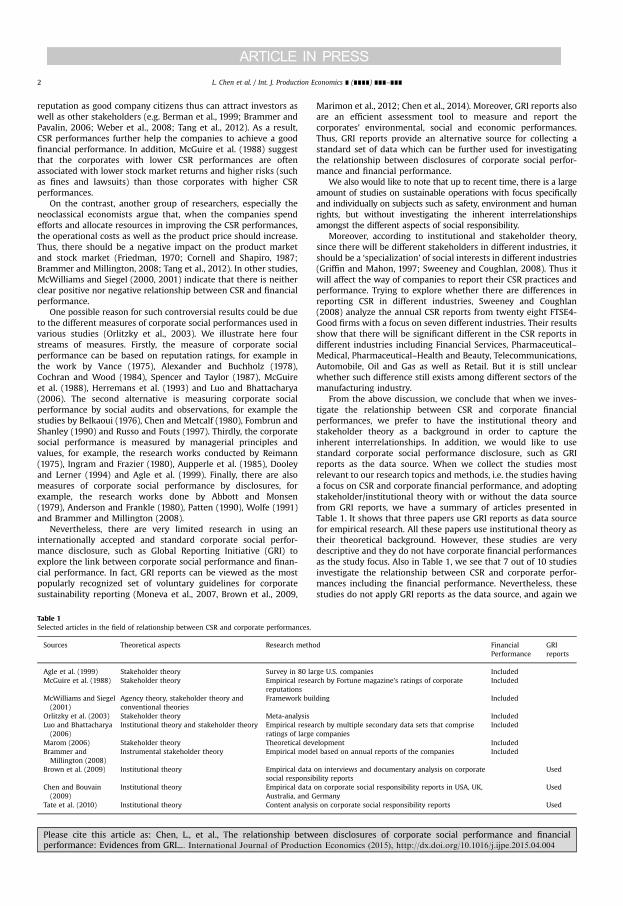
reputation as good company citizens thus can attract investors aswell as other stakeholders (e.g. Berman et al., 1999; Brammer andPavalin, 2006; Weber et al., 2008; Tang et al., 2012). As a result,CSR performances further help the companies to achieve a goodfinancial performance. In addition, McGuire et al. (1988) suggestthat the corporates with lower CSR performances are oftenassociated with lower stock market returns and higher risks (suchas fines and lawsuits) than those corporates with higher CSRperformances.
On the contrast, another group of researchers, especially theneoclassical economists argue that, when the companies spendefforts and allocate resources in improving the CSR performances,the operational costs as well as the product price should increase.Thus, there should be a negative impact on the product marketand stock market (Friedman, 1970; Cornell and Shapiro, 1987;Brammer and Millington, 2008; Tang et al., 2012). In other studies,McWilliams and Siegel (2000, 2001) indicate that there is neitherclear positive nor negative relationship between CSR and financialperformance.
One possible reason for such controversial results could be dueto the different measures of corporate social performances used invarious studies (Orlitzky et al., 2003). We illustrate here fourstreams of measures. Firstly, the measure of corporate socialperformance can be based on reputation ratings, for example inthe work by Vance (1975), Alexander and Buchholz (1978),Cochran and Wood (1984), Spencer and Taylor (1987), McGuireet al. (1988), Herremans et al. (1993) and Luo and Bhattacharya(2006). The second alternative is measuring corporate socialperformance by social audits and observations, for example thestudies by Belkaoui (1976), Chen and Metcalf (1980), Fombrun andShanley (1990) and Russo and Fouts (1997). Thirdly, the corporatesocial performance is measured by managerial principles andvalues, for example, the research works conducted by Reimann(1975), Ingram and Frazier (1980), Aupperle et al. (1985), Dooleyand Lerner (1994) and Agle et al. (1999). Finally, there are alsomeasures of corporate social performance by disclosures, forexample, the research works done by Abbott and Monsen(1979), Anderson and Frankle (1980), Patten (1990), Wolfe (1991)and Brammer and Millington (2008).
Nevertheless, there are very limited research in using aninternationally accepted and standard corporate social perfor-mance disclosure, such as Global Reporting Initiative (GRI) toexplore the link between corporate social performance and finan-cial performance. In fact, GRI reports can be viewed as the mostpopularly recognized set of voluntary guidelines for corporatesustainability reporting (Moneva et al., 2007, Brown et al., 2009,
Marimon et al., 2012; Chen et al., 2014). Moreover, GRI reports alsoare an efficient assessment tool to measure and report thecorporates' environmental, social and economic performances.Thus, GRI reports provide an alternative source for collecting astandard set of data which can be further used for investigatingthe relationship between disclosures of corporate social perfor-mance and financial performance.
We also would like to note that up to recent time, there is a largeamount of studies on sustainable operations with focus specificallyand individually on subjects such as safety, environment and humanrights, but without investigating the inherent interrelationshipsamongst the different aspects of social responsibility.
Moreover, according to institutional and stakeholder theory,since there will be different stakeholders in different industries, itshould be a ‘specialization’ of social interests in different industries(Griffin and Mahon, 1997; Sweeney and Coughlan, 2008). Thus itwill affect the way of companies to report their CSR practices andperformance. Trying to explore whether there are differences inreporting CSR in different industries, Sweeney and Coughlan(2008) analyze the annual CSR reports from twenty eight FTSE4-Good firms with a focus on seven different industries. Their resultsshow that there will be significant different in the CSR reports indifferent industries including Financial Services, Pharmaceutical–Medical, Pharmaceutical–Health and Beauty, Telecommunications,Automobile, Oil and Gas as well as Retail. But it is still unclearwhether such difference still exists among different sectors of themanufacturing industry.
From the above discussion, we conclude that when we inves-tigate the relationship between CSR and corporate financialperformances, we prefer to have the institutional theory andstakeholder theory as a background in order to capture theinherent interrelationships. In addition, we would like to usestandard corporate social performance disclosure, such as GRIreports as the data source. When we collect the studies mostrelevant to our research topics and methods, i.e. the studies havinga focus on CSR and corporate financial performance, and adoptingstakeholder/institutional theory with or without the data sourcefrom GRI reports, we have a summary of articles presented inTable 1. It shows that three papers use GRI reports as data sourcefor empirical research. All these papers use institutional theory astheir theoretical background. However, these studies are verydescriptive and they do not have corporate financial performancesas the study focus. Also in Table 1, we see that 7 out of 10 studiesinvestigate the relationship between CSR and corporate perfor-mances including the financial performance. Nevertheless, thesestudies do not apply GRI reports as the data source, and again we
Table 1Selected articles in the field of relationship between CSR and corporate performances.
Sources Theoretical aspects Research method FinancialPerformance
GRIreports
Agle et al. (1999) Stakeholder theory Survey in 80 large U.S. companies IncludedMcGuire et al. (1988) Stakeholder theory Empirical research by Fortune magazine's ratings of corporate
reputationsIncluded
McWilliams and Siegel(2001)
Agency theory, stakeholder theory andconventional theories
Framework building Included
Orlitzky et al. (2003) Stakeholder theory Meta-analysis IncludedLuo and Bhattacharya(2006)
Institutional theory and stakeholder theory Empirical research by multiple secondary data sets that compriseratings of large companies
Included
Marom (2006) Stakeholder theory Theoretical development IncludedBrammer andMillington (2008)
Instrumental stakeholder theory Empirical model based on annual reports of the companies Included
Brown et al. (2009) Institutional theory Empirical data on interviews and documentary analysis on corporatesocial responsibility reports
Used
Chen and Bouvain(2009)
Institutional theory Empirical data on corporate social responsibility reports in USA, UK,Australia, and Germany
Used
Tate et al. (2010) Institutional theory Content analysis on corporate social responsibility reports Used
L. Chen et al. / Int. J. Production Economics ∎ (∎∎∎∎) ∎∎∎–∎∎∎2
Please cite this article as: Chen, L., et al., The relationship between disclosures of corporate social performance and financialperformance: Evidences from GRI.... International Journal of Production Economics (2015), http://dx.doi.org/10.1016/j.ijpe.2015.04.004i

need to mention that the study results are controversial concern-ing the relationship between CSR and corporate financial perfor-mances. Apparently, there is a research gap in our concerns.
Current study is motivated by the above discussion. Theresearch objectives in this paper are: firstly, investigating theinherent interrelationships amongst different aspects of socialresponsibility by conducting the descriptive analysis on differentsocial performance indicators; secondly, comparing CSR perfor-mance in different industries; and thirdly, investigating therelationship between CSR performance and company financialperformance.
To achieve the above research objectives, content analysis andstatistical analysis are used respectively for collecting data andanalyzing data. The GRI report has been selected as the datasources for this research, since it is expected to be commonlyadopted global criterion for CSR and sustainability reportingaccording to the literature (Skouloudis et al., 2009; Prado‐Lorenzo et al., 2009; Tsang et al., 2009; Brown et al., 2009;Rasche, 2009; Levy et al., 2010; Marimon et al., 2012). The GRIreport itself provides assessments on economic, environmentaland social performance. Concerning the social performance, itprovides four categories which include labor practices and decentwork performance indicators, human rights performance indica-tors, society performance indicators and product responsibilityperformance indicators. In our study, the levels of CSR and theirperformance are coded using the content analysis on GRI reports.The financial data is collected from annual reports of the samplecompanies. We have to mention that traditionally, the companies'CSR practices and performance should include both the environ-mental and social aspects. In this paper, we only investigate thecorporate social performance whereas environmental aspect hasbeen discussed in previous research by the same authors (Chenet al., 2014).
The contribution of this paper is to bring some insights to theresearchers in academia and managers in industry to understandthe CSR and its practices based on GRI guidelines. The differenceson reporting CSR performance between different sub sectors inmanufacturing industry are also tested. Moreover, the relationshipbetween the disclosure of CSR performance and financial perfor-mance is analyzed by building four constructs from GRI socialperformance indicators.
The paper is organized as follows: Firstly, we will establish atheoretical background for this research based on related litera-ture. Following that the main methodology will be introduced,rational sample choosing, content analysis as well as constructbuilding will be our main focus in this part. Then the researchfindings will be presented. Finally, the conclusions, managementimplications as well as future research agenda will be drawn anddiscussed.
2. Theoretical background and research framework
In order to achieve the research objective which is investigatingthe inherent interrelationships amongst different aspects of cor-porate social responsibility, we apply descriptive analysis ondifferent CSR performance indicators in various categories. Mean-while, institutional theory can provide a solid framework fordeveloping research hypothesis concerning the other two researchobjectives. Details and research hypothesis are presented below.
2.1. Institutional theory
As defined by Gray et al. (1987), corporate social reporting is “theprocess of communicating the social and environmental effects oforganizations' economic actions to particular interest groups within
society and to society at large”. Thus organization should be thecentral focus in the study of CSR. In the meantime, Baum (1996)defined in his book that institutional theory can be applied in theresearch on organizations. The established rules and norms ofdominant institutions must be confirmed by the organizations, andconsequently the organizations can gain support and be perceived aslegitimate. John et al. (2001) also have a similar discussion concerningparticular the manufacturing industry. They further state that for themanufacturing companies, intuitions mainly include agencies thatestablish industry regulations, quality norms for example suppliers,customers, competitors, industry certifications such as ISO certifica-tions, and professional organizations.
Moreover, McWilliams et al. (2006) discuss in their research,institutional difference can lead to different activities and expecta-tions for companies. For companies in different industry, theirexternal pressures can lead to different processes for determiningwhich activities to engage in and how much to invest. In otherwords, based on different institutional needs, the companies indifferent industries can decide whether they want to and howthey want to invest in reporting their sustainable work. The studyof CSR performance of different industries should be of interesting.
There are in fact several studies of CSR performance reported indifferent countries and industries. These studies suggest differ-ences regarding reporting CSR performance among differentindustries. For example, Wanderley et al. (2008) examine CSRinformation disclosure based on the Webs from different countriesand various industries. Their results show that both the industrysector and the country of origin have a significant impact on CSRinformation disclosure. Tsang (1998) conducts a longitudinal studyof corporate social performance disclosures in Singapore forbanking, food and beverages and hotel industries. He finds thatthe bank industry has disclosed significantly less social informa-tion than the hotel industry.
The literature shows that it is important to take into accountthe industry categories when studying the CSR since differentindustries may have different stakeholders (Sturdivant and Ginter,1977; Sweeney and Coughlan, 2008). As stated by Boutin-Dufresneand Savaria (2004), in some particular industries, companies maybe more socially responsible than others due to the nature of theirbusiness activities.
In literature, one manufacturing industry, automotive industryhas been emphasized a lot on CSR practices. An essential factor inautomotive industry's agenda nowadays is the adoption of CSRpractices (CARS 21, 2006; Frigant, 2009), for example, to improvethe road safety as well as providing job opportunities together withwage-labor nexus in car-manufacturing regions (Frigant, 2009).
Based on the above discussion, we found that some particularindustries countenance comparatively high regulatory pressures frominternal and external stakeholders, and these regulatory pressuresshould also drive the companies to report CSR performance differently.Therefore, it is interesting to compare the CSR performance amongindustry sectors, more specifically the automotive industry with othermanufacturing industry such as metals products industry. The firstresearch hypothesis is derived from the above discussion:
H1. There is a significant difference regarding reporting CSR perfor-mance among different industrial sectors in the manufacturingindustry.
2.2. Disclosure of CSR performance and corporate financialperformance
Whether the measure of CSR performance relates negatively orpositively to the companies' financial performance is still a datableissue. Cochran and Wood (1984) indicate that the average age of acompany's assets is highly correlated with the ranking of its social
L. Chen et al. / Int. J. Production Economics ∎ (∎∎∎∎) ∎∎∎–∎∎∎ 3
Please cite this article as: Chen, L., et al., The relationship between disclosures of corporate social performance and financialperformance: Evidences from GRI.... International Journal of Production Economics (2015), http://dx.doi.org/10.1016/j.ijpe.2015.04.004i

responsibility. Aupperle et al. (1985) argue that there is norelationship between the measure of CSR performance and profit-ability, neither in short term nor in long term. However, Waddockand Graves (1997) suggest significant positive correlationsbetween CSR performance index and financial performances suchas return on assets in the long run. As Waddock and Graves (1997)explained based on slack resources theory, the companies, whichhave a better financial situation, should have more resources to beallocated on improving corporate social performances. Conse-quently these companies can achieve a high standard on CSR. Inshort, a better corporate financial performance provides theorganization the slack resources to engage in the CSR practicesas well as reporting their CSR performance.
Also according to Jones (1995), trust, cooperativeness as well astrustworthiness are subsets of ethical principles, which can helpthe organizations to achieve significant competitive advantages.The satisfaction of various stakeholder groups is instrumental fororganizational financial performance (Orlitzky et al., 2003). Thistheory suggests a positive relationship between CSR performanceand corporate financial performance. Accordingly, the followinghypothesis can be developed:
H2. There is a positive correlation between the disclosure of CSRperformance and corporate financial performance.
3. Research methodology
In this section, we provide a brief introduction of data collec-tion and structured content analysis of cases. We also refer to ourprevious study (Chen et al., 2014), in which similar methodologyhas been used with more detail description. Nevertheless weshould note that these two studies have different orientations ofinvestigation, i.e. in previous study the environmental manage-ment practices are the main focus, and in addition we haveentirely different samples when comparing the two studies.
3.1. Data collection
Since one of the research purposes is to compare CSR perfor-mance between different industries and different regions, we needsample companies for which it is possible to measure all the CSRvariables in a standard and consistent manner. As stated before inthe introduction, GRI report has recently developed as a widelyapplied format of CSR measurement. It represents voluntaryguidelines for measuring companies CSR performance and repre-sents a reliable public reference of consciousness and information(Marimon et al., 2012). Thus, we use the Sustainability DisclosureDatabase (Global Reporting Initative, 2013) for choosing thesample companies. The sample companies should fulfill the selec-tion criteria as follows:
� The company should belong to a manufacturing industry.� The company should introduce GRI reporting system.
� The company should publish standard GRI reports on 2012following sustainability reporting guidelines version 3.1 (GRI,2013).
Finally, 75 companies satisfy the selection criteria and areincluded as samples in this study. Since that one research purposeis to compare CSR performance in different industries, the samplesfrom manufacturing industry are divided into five groups, i.e.automotive industry, metals products industry, forest and paperindustry, chemical industry and health care industry. The samplesare summarized in Table 2, with sample numbers in each grouprespectively indicated.
Recall that another research purpose is to investigate therelationship between CSR performance and financial performancefor manufacturing companies, it is necessary to define the mea-sures of the financial performance. The financial measurementswe use in this research are Sales growth, Return on equity (ROE)and Cash flow/Sales ratio.
Sales growth: This states an increase in sales over a specificperiod of time.
ROE: This measures how well the corporation applied rein-vested earnings to generate additional earnings. A measurement ofhow much profit the corporation can produce given the resourcescontributed by the stakeholders (Weber et al., 2008).
Cash flow/Sales ratio: This ratio, expressed as a percentage, iscalculated by comparing the company's operating cash flow to itsnet sales or revenues. This financial indicator measures thecompany's ability to turn sales into cash (Cash Flow IndicatorRatios, 2014). A high ratio normally indicates the company'scapability of utilizing a larger portion of its revenue into profits,as well as net cash flow.
All the data for measuring the financial performances iscollected for the 2012 fiscal year from the database DataStream.
3.2. Structured content analysis
To make a cross-industry comparison of CSR, the contentanalysis can be a good choice. It is also useful for a longitudinalstudy to understand the trends in CSR for specific case companies(Tate et al., 2010). In this paper, content analysis is applied toextract data from annual GRI sustainability reports of the samplecompanies.
Human raters are used to code the information included in thereports. Human coding is desirable for this research since raterscan assess the intensity as well as presence of specific CSRimplementation by reading the contextual information that arecontained in the reports (Hofer et al., 2012). However, contentanalysis has a disadvantage in time and resource consuming.These constrain the sample numbers. Another disadvantage ofhumane coding is subjective: it can be supplemented by usingmultiple raters to read the reports to verify the score (Seuring andMüller, 2008). In this study we also have multiple raters for eachreport.
Table 2Sample companies.
Automotive (14) Aebi Schmidt, Dogus Otomotiv, Fiat Group, Ford Motor Company, Hyunda Mobis, MAN Group, KOEL, Kia Motors, Sapa Group, Piaggio Group, PSAPeugeot Citroën, Volvo Car Corp.,Volkswagen, Valeo
Metals products (24) Acerinox SA, Acindar Grupo, Alcoa, Arcelor Mittal USA, Arcelor Mittal, APERAM, Bekaert SA, BHP Billiton, Componenta, Essar Steel, Elval, Halcor, LaFarga Group, Kyungshin, OutoKumpu, Nyrstar, Novelis, Qatar Steel Company, Qatalum, Sandvik, SAIL, SSAB, Talvivaara, Yamana DesenvolvimentoMineral
Forest and paper (13) Ahlstrom, Stora Enso, Billerud AB, Canfor, Catalyst Paper, Domtar, Mestä group, Resolute Forest Products, SCA, Duratex, Nippon Paper, UPM-kymmene, Martela
Chemical (10) Air Products, DuPont, DyStar Singapore, Ecolab, Hanwha Chemical, Methanex, Praxair, Arizona Chemical, BASF SE, BorougeHealth care products(14)
Amgen Inc., APL, F. Hoffmann-La Roche Ltd, Infinitus China, LG Household and Health Care, Meda, Merck Germany, MerckUSA, Novozymes, OrionGroup, UCB, Fosun Pharmaceutical, Jointown Pharmaceutical, Nova Nordisk
L. Chen et al. / Int. J. Production Economics ∎ (∎∎∎∎) ∎∎∎–∎∎∎4
Please cite this article as: Chen, L., et al., The relationship between disclosures of corporate social performance and financialperformance: Evidences from GRI.... International Journal of Production Economics (2015), http://dx.doi.org/10.1016/j.ijpe.2015.04.004i

Validity is a key factor of approving the quality of contentanalysis. There are two ways to establish the validity. First of all,we can guide the raters by a consistent valid coding scheme. Thiscoding structure should guide raters to the focal concept. Then itcan be seen as a valid coding scheme (Potter and Levine‐Donnerstein, 1999). Secondly, the raters' decision can be assessedagainst by standards. The coding can be assumed as a validprocess, if the codes meet the standard for right decision making(Potter and Levine‐Donnerstein, 1999).
GRI report itself is supposed to provide a comprehensive,visible, consistent measurement system for assessing the com-pany's sustainability work (Brown et al., 2009; Marimon et al.,2012). For the social performance measurement, the GRI reportprovides 45 indicators which cover four categories concerning CSR(more details see the Appendix):
� Labor practices and decent work performance indicators.� Human rights performance indicators.� Society performance indicators.� Product responsibility performance indicators.
Moreover, all the contents of GRI report published are througha validation process themselves according to the G3.1 guideline(G3.1, 2013). Thus, we use this GRI guided indicators in the socialpart as a coding structure and score base for the content analysisto approve the validity. We also set the standard for raters to judgeif the decision making is right. The grading scale is between 1 and5, with (1) indicating no active (not reported), (3) indicatingmedium active (partially reported) and (5) high active (fullyreported). For example a fully reported indicator variable mayinclude quantitative measures, categories, and targets.
4. Results
After structured content analysis of the sample cases andcoding process, statistical analysis by SPSS (Statistical Productand Service Solutions) is conducted. The results are presented inthis section.
4.1. Descriptive statistics
In order to investigate the inherent interrelationships amongstdifferent aspects of CSR, at first we have investigated the descrip-tive statistics of all the CSR indicators.
4.1.1. Indicator protocols set for labor practice and decent work (LA)The indicators related to labor practice and decent work are
ranked in Table 3. The three highest ranked indicators are LA1:Total workforce by employment type, employment contract, andregion, broken down by gender; LA 7: Rates of injuries andaccidents and LA 12: Percentage of employees receiving regularperformance and care development reviews, by gender. Two ofthese indicators, LA1 and LA7, have an average above 4 and theyare the highest ranked indicators overall. The only indicator with amean value below 2 is LA 15: Return to work and retention ratesafter parental leave, by gender.
It is easy to see that the indicators which are easy to bequantified or measured have higher scores than others. Companiesput more efforts to measure the rates of injuries and accidentssince it will increase their operating cost and damage theirreputation readily.
4.1.2. Indicator protocols set for human rights (HR)In Table 4 the indicators for human rights (HR) are listed. The
top factor measured by companies is HR6: Operations and
significant suppliers identified as having significant risk for inci-dents with child labor, and measures taken to contribute to theeffective abolition of child labor. This indicator is followed by HR7:Operations and significant suppliers identified as having signifi-cant risk for incidents of forced or compulsory labor, and measuresto contribute to the elimination of all forms of forced or compul-sory labor. HR4 is ranked the third highest in the category, butwith an average score of 3.35 which is low compared to the othercategories. As many as three out of eleven indicators (HR8, HR10and HR11) have a mean value below 2 which are more than anyother category. Considering that many of the indicators receive alot of media attention (child labor, forced labor, discrimination andsecurity), it is noteworthy that this category has the lowestaverage scores of all four categories.
4.1.3. Indicator protocols set for society (SP)The society indicators are ranked in Table 5. The top indicator is
SP8: Monetary value of significant fines and total number of non-monetary sanctions for noncompliance with laws and regulations.From this, we can assume that companies focus more on indicatorsthat are closely related to costs, which can impact on the financialperformance directly. SP8 is closely followed by SP3 and SP5.Interestingly, a Wilcoxon signed rank test shows that SP3, which istraining against corruption is significantly (po .05) higher thanSP2, which is about the portion of the business that has beenanalyzed for corruption. One explanation could be that it is lesssensitive to put employees through training than to actually auditbusiness units on corruption. The means of two indicators are
Table 3Descriptive statistics on labor practice and decent work (LA).
N Minimum Maximum Mean Std. deviation
LA1 75 1 5 4.28 1.073LA2 75 1 5 3.56 1.491LA3 75 1 5 3.11 1.886LA4 75 1 5 3.69 1.786LA5 75 1 5 3.29 1.909LA6 75 1 5 3.32 1.918LA7 75 1 5 4.25 1.128LA8 75 1 5 3.45 1.758LA9 75 1 5 2.76 1.859LA10 75 1 5 3.37 1.634LA11 75 1 5 3.64 1.714LA12 75 1 5 3.80 1.611LA13 75 1 5 3.72 1.530LA14 75 1 5 2.41 1.764LA15 75 1 5 1.61 1.314
Table 4Descriptive statistics of human rights (HR).
N Minimum Maximum Mean Std. deviation
HR1 75 1 5 2.41 1.733HR2 75 1 5 3.19 1.776HR3 75 1 5 2.57 1.780HR4 75 1 5 3.35 1.871HR5 75 1 5 3.24 1.829HR6 75 1 5 3.59 1.794HR7 75 1 5 3.45 1.818HR8 75 1 5 1.91 1.621HR9 75 1 5 2.55 1.933HR10 75 1 5 1.72 1.457HR11 75 1 5 1.99 1.656
L. Chen et al. / Int. J. Production Economics ∎ (∎∎∎∎) ∎∎∎–∎∎∎ 5
Please cite this article as: Chen, L., et al., The relationship between disclosures of corporate social performance and financialperformance: Evidences from GRI.... International Journal of Production Economics (2015), http://dx.doi.org/10.1016/j.ijpe.2015.04.004i

below 2: SP9 Operations with significant potential or actualnegative impacts on local communities; SP10 Prevention andmitigation measures implemented in operations with significantpotential or actual negative impacts on local communities. Thesetwo indicators have relatively less attention since their effectscannot be detected in the short run; their impacts are mainly
through external stakeholders, e.g., local communities in thelong run.
4.1.4. Indicator protocols set for product responsibility (PR)From Table 6, we can find that the top ranked product
responsibility performance indicator is PR1: Life cycle stages inwhich health and safety impacts of products and services areassessed for improvement, and percentage of significant productsand services categories subject to such procedures. Meanwhile,there is no indicator with a mean value below 2. It is easy to derivethat companies really mind the product responsibilities among theCSR indicators. The reason is that these product responsibilityindicators are strongly correlated with the products reputation inthe product market. This kind of reputation can direct impact oncompanies' market performance.
4.2. GRI constructs
The GRI reports are built around categories and sub-categories,which in turn can be tested as constructs (See Table 7). If theinternal consistency for a category or sub-category is low, it is anindication that the indicators do not measure the same latentvariable, which in turn has effects on the design of future researchon CSR. The main categories are as previously described LaborPractices (LA), Human Rights (HR), Society (SP) and ProductResponsibility (PR). Each main category consists of between5 and 8 sub-categories as illustrated in Table 7. Some of the sub-categories consist of a single indicator while others consist of up to4 indicators. By calculating Cronbach's alphas for all multi-indicator constructs, it is possible to test their internal consistency.According to previous studies, alphas above .7 usually indicate ahigh internal consistency, though for exploratory research alphasabove .6 can be accepted (Hair et al., 1998). On the aggregated levelLabor Practices, Human Rights, Society and Product Responsibility
Table 6Descriptive statistics of product responsibility indicators.
N Minimum Maximum Mean Std. deviation
PR1 75 1 5 3.83 1.647PR2 75 1 5 2.79 1.961PR3 75 1 5 3.64 1.806PR4 75 1 5 2.87 1.954PR5 75 1 5 3.35 1.782PR6 75 1 5 3.29 1.909PR7 75 1 5 3.00 1.945PR8 75 1 5 2.47 1.898PR9 75 1 5 3.48 1.913
Table 5Descriptive statistics of society indicators.
N Minimum Maximum Mean Std. deviation
SP1 75 1 5 3.43 1.780SP2 75 1 5 3.16 1.882SP3 75 1 5 3.72 1.729SP4 75 1 5 3.51 1.863SP5 75 1 5 3.72 1.790SP6 75 1 5 3.05 1.999SP7 75 1 5 3.43 1.897SP8 75 1 5 3.77 1.857SP9 75 1 5 1.85 1.650SP10 75 1 5 1.91 1.686
Table 7Categories on social performance from GRI report.
Categories Indicators (See Appendix) Cronbach's alpha
Labor Practices and Decent Work Performance Indicators .861Employment (LA_A) LA1, LA2, LA3, LA15 .554Labor/Management Relations (LA_B) LA4, LA5 .640Occupational Health and Safety (LA_C) LA6, LA7, LA8, LA9 .609Training and Education (LA_D) LA10, LA11, LA12 .634Diversity and Equal Opportunity (LA_E) LA13 –
Equal Remuneration for Women and Men (LA_F) LA14 –
Human Rights Performance Indicators .897Investment and Procurement Practices (HR_A) HR1, HR2, HR3 .773Non-discrimination (HR_B) HR4 –
Freedom of Association and Collective (HR_C) HR5 –
Child Labor (HR_D) HR6 –
Forced and Compulsory Labor (HR_E) HR7 –
Security Practices (HR_F) HR8 –
Assessment (HR_G) HR9 –
Remediation (HR_H) HR10 –
Society Performance Indicators .854Local Communities (SP_A) SP1, SP9, SP10 .777Corruption (SP_B) SP2, SP3, SP4 .738Public Policy (SP_C) SP5, SP6 .671Anti-Competitive Behavior (SP_D) SP7 –
Compliance (SP_E) SP8 –
Product Responsibility Performance Indicators .900Customer Health and Safety (PR_A) PR1, PR2 .701Product and Service Labeling (PR_B) PR3, PR4, PR5 .747Marketing Communications (PR_C) PR6, PR7 .664Customer Privacy (PR_D) PR8 –
Compliance (PR_E) PR9 –
L. Chen et al. / Int. J. Production Economics ∎ (∎∎∎∎) ∎∎∎–∎∎∎6
Please cite this article as: Chen, L., et al., The relationship between disclosures of corporate social performance and financialperformance: Evidences from GRI.... International Journal of Production Economics (2015), http://dx.doi.org/10.1016/j.ijpe.2015.04.004i

all have strong alphas, indicating strong constructs. On the sub-category level, constructs are weaker but the majority is stillwithin the acceptable levels. LA_A falls slightly below the thresh-old value, indicating that the included indicators may not measurethe same thing. The ranking of both individual and aggregatedindicators shows Labor Practices to be important (See Table 3).Since the constructs in this paper are based on the standardizedformat in the GRI report and due to the high ranking of LaborPractices, it was decided to include LA_A for further analysis butwith extra care taken in the interpretation of the results.
4.3. Cluster analysis
In order to see if there are different patterns on how CSRpractices are implemented and reported, a cluster analysis has beenconducted, first based on the averages of each category (Labor,Human Rights, Society and Product responsibility) and then basedon the averages for the sub-categories. A K-means cluster analysis isperformed with three clusters. The choice of three clusters is basedon having an expected number of cases in each cluster above 20.Additionally two or four clusters do not provide significant addi-tional insights. The results (see Tables 8 and 9) suggest a paralleladoption of all four categories: there is no indication of a sequentialadoption where some categories are fully adopted and the remain-ing ones are not. Both for categories and sub-categories, allindicators, follow the same pattern; the score for cluster 1 is lowerthan the score for cluster 2, which in turn is lower than cluster 3. Acloser inspection of the sub-categories shows that, among thelowest performing cluster members, Security Practices (HR_F),Remediation (HR_H), Customer Privacy (PR_D) have an average of1.0, i.e. none of the 24 companies reports anything in these sub-categories. The overall picture for this cluster is the same, withaverage scores consistently below 3. The best performing clusterhas averages above 4.0 for 3 out of 4 categories and 17 out of 24sub-categories. The sub-category assessment (HR_G) is the only onethat deviates from the general pattern with an average score below3, thus the result indicates that this sub-category is not generallyadopted by the companies in this sample.
4.4. Comparison in industries
To test whether there is any significant difference in CSRperformance indicators between automotive industry, metalsproducts industry, forest and paper industry, chemical industryand health care industry, a non-parametrical Kruskal–Wallis 1-way ANOVA has been applied for all the GRI indicators concerningthe social performance. We only find two indicators havingsignificant differences among industries among 45 indicators tobe tested. These indicators are LA14: Ratio of basic salary andremuneration of women to men by employee category, by sig-nificant locations of operation (p¼ .012) and PR7: Total number ofincidents of non-compliance with regulations and voluntary codesconcerning marketing communications, including advertising,
promotion, and sponsorship by type of outcomes (p¼ .027). Thuswe conclude that within the manufacturing industry, there is little(or no) indication of consistent differences between the fiveindustrial sectors mentioned above. The results reject the hypoth-esis H1. As a conclusion, there is no significant difference regardingreporting CSR performance among different industrial sectors inthe manufacturing industry.
4.5. Correlations between the disclosure of corporate socialperformance and financial performance
At last we have investigated the correlation between CSRindicators and financial performance. For all companies, theaverage of all scores of corporate social practices has beencalculated, as well as the average scores for LA indicators, HRindicators, SP indicators and PR performance indicators. Thesescores have then been compared to the sales growth, return onequity and cash flow/sales ratio by applying the Spearman's rhocorrelation tests. All except labor practices have displayed asignificant positive correlation with the ROE (see Table 10).
A similar pattern emerges for the correlations between theconstructs (sub-categories) in Table 7 and financial performance,see Tables 11–14. In Labor Practices and Decent Work performanceindicators, Occupational Health and Safety (LA_C) and Equal Remu-neration for Women and Men (LA_F) are significantly correlated withROE. Meanwhile, Diversity and Equal Opportunity (LA_E) has apositive and significant correlation with cash flow/sales.
In Human Rights performance indicators, Investment and Pro-curement Practices (HR_A) is significantly correlated with ROE.Assessment (HR_G) is significantly correlated with sales growth.In Society performance indicators analysis, it is found that Com-pliance (SP_E) is significantly correlated with ROE. In ProductResponsibility performance indicators, it is found that MarketingCommunications (PR_C) have significant correlations with ROE.
Based on above analysis, LA_C, LA_F, HR_A, HR_G, SP_E and PR_Call have positive and significant correlations with ROE. Due to someconstructs having low Cronbach's Alphas, these results have beenfurther verified on the indicator level. No further significances have
Table 8Final cluster centers.
Cluster
1 (N¼28) 2 (N¼21) 3 (N¼27)
LA_AVG 2.46 3.27 4.27HR_AVG 1.54 2.65 3.96SP_AVG 1.99 3.12 4.30PR_AVG 1.80 3.28 4.49
Table 9Final cluster centers for sub-categories.
Cluster
1 (N¼24) 2 (N¼23) 3 (N¼28)
LA_A 2.69 2.74 3.86LA_B 2.08 3.35 4.82LA_C 2.52 3.28 4.38LA_D 2.86 3.32 4.48LA_E 2.83 3.96 4.29LA_F 1.33 1.78 3.86HR_A 1.53 2.62 3.83HR_B 1.50 3.78 4.57HR_C 1.42 3.52 4.57HR_D 1.83 3.78 4.93HR_E 1.58 3.61 4.93HR_F 1.00 1.52 3.00HR_G 1.08 1.52 2.43HR_H 1.00 1.43 3.29SP_A 1.53 1.93 3.52SP_B 2.22 3.35 4.62SP_C 2.58 2.96 4.43SP_D 1.58 3.78 4.71SP_E 2.00 4.30 4.86PR_A 2.21 3.00 4.50PR_B 2.28 3.00 4.38PR_C 1.79 2.83 4.57PR_D 1.00 1.96 4.14PR_E 1.67 3.96 4.64
L. Chen et al. / Int. J. Production Economics ∎ (∎∎∎∎) ∎∎∎–∎∎∎ 7
Please cite this article as: Chen, L., et al., The relationship between disclosures of corporate social performance and financialperformance: Evidences from GRI.... International Journal of Production Economics (2015), http://dx.doi.org/10.1016/j.ijpe.2015.04.004i

been found and there are no large inconsistencies within constructswith significant correlations. The result seems support the result inearly studies reasoning according to the slack resources theory,which states that the profitable companies can have more resourcesto be spent on corporate social performance. Moreover, the CSR canbring incremental benefits for companies and then on the otherhand the disclosure of CSR also helps the companies to mitigatepotential harm from negative events (Peloza, 2006). However, it isinteresting to note that only one construct (LA_E) among allconstructs has significant correlations to sales growth or cashflow/sales. According to Orlitzky et al. (2003), ROE is a measure ofcorporate financial performance which examines the internalresources utilization for the company, whereas, sales growth andcash flow/sales are more intend to external measures of corporatefinancial performance. The result of our study shows that improvedcorporate social performance as well as more transparent disclo-sures of corporate social performance would have a strong relation-ship with improving the internal utilization of financial resources of
the companies. But such corporate social performance and itsdisclosures are not necessarily improving the company's externalfinancial performances.
5. Conclusion and managerial implications
The study results have managerial implications for CSR perfor-mances especially concerning the social part. First of all, the studyfindings show that amongst different categories of corporate socialresponsibility, the labor practice and decent work have receivedthe highest attention. Moreover, the indicators which are easy to
Table 10Correlations between average scores of social indicators with financial performances.
Sales growth ROE Cash flow/sales
Spearman's rho LA_AVG Correlation Coefficient .105 .200 � .093Sig. (1-tailed) .215 .078 .255N 59 52 53
HR_AVG Correlation Coefficient � .102 .265a .099Sig. (1-tailed) .221 .029 .240N 59 52 53
SP_AVG Correlation Coefficient � .048 .246a .105Sig. (1-tailed) .360 .040 .227N 59 52 53
PR_AVG Correlation Coefficient .054 .294a .114Sig. (1-tailed) .341 .017 .209N 59 52 53
a Correlation is significant at the .05 level (1-tailed).
Table 11Correlations between Labor Practices and Decent Work performance indicatorswith financial performances.
Salesgrowth
ROE Cash flow/sales
Spearman'srho
LA_A CorrelationCoefficient
.096 .095 � .151
Sig. (1-tailed) .234 .252 .140N 59 52 53
LA_B CorrelationCoefficient
.097 .143 � .020
Sig. (1-tailed) .232 .156 .443N 59 52 53
LA_C CorrelationCoefficient
.134 .250a � .019
Sig. (1-tailed) .155 .037 .446N 59 52 53
LA_D CorrelationCoefficient
� .004 .055 � .143
Sig. (1-tailed) .487 .349 .153N 59 52 53
LA_E CorrelationCoefficient
� .146 � .022 � .427b
Sig. (1-tailed) .134 .439 .001N 59 52 53
LA_F CorrelationCoefficient
.178 .250a .086
Sig. (1-tailed) .089 .037 .269N 59 52 53
a Correlation is significant at the .05 level (1-tailed).b Correlation is significant at the .01 level (1-tailed).
Table 12Correlations between Human Rights Performance Indicators with financialperformances.
Salesgrowth
ROE Cash flow/sales
Spearman'srho
HR_A CorrelationCoefficient
.013 .337a .222
Sig. (1-tailed) .460 .007 .055N 59 52 53
HR_B CorrelationCoefficient
� .204 .113 .043
Sig. (1-tailed) .061 .214 .380N 59 52 53
HR_C CorrelationCoefficient
� .131 .144 .073
Sig. (1-tailed) .161 .155 .301N 59 52 53
HR_D CorrelationCoefficient
� .010 .191 .009
Sig. (1-tailed) .470 .088 .476N 59 52 53
HR_E CorrelationCoefficient
� .084 .227 .025
Sig. (1-tailed) .264 .053 .429N 59 52 53
HR_F CorrelationCoefficient
� .097 .168 .064
Sig. (1-tailed) .232 .117 .323N 59 52 53
HR_G CorrelationCoefficient
� .303a � .056 � .106
Sig. (1-tailed) .010 .346 .225N 59 52 53
HR_H CorrelationCoefficient
.015 .179 .215
Sig. (1-tailed) .457 .102 .061N 59 52 53
a Correlation is significant at the .01 level (1-tailed).
L. Chen et al. / Int. J. Production Economics ∎ (∎∎∎∎) ∎∎∎–∎∎∎8
Please cite this article as: Chen, L., et al., The relationship between disclosures of corporate social performance and financialperformance: Evidences from GRI.... International Journal of Production Economics (2015), http://dx.doi.org/10.1016/j.ijpe.2015.04.004i

be quantified or measured often have higher scores than others.There is no indicator in the category of product responsibility witha mean value below 2. This indicates that companies are makingefforts to improve their performance in product responsibility,possibly because the product related CSR indicators are closelyrelated to market performance, brand value as well as competi-tiveness for the companies. Based on the cluster analysis of all CSRindicators, we can detect a parallel adoption of four categories,instead of a sequential progress where one category would beadopted before the others. Based on the current dataset and theemployed statistical tools, it is not possible to test for thedevelopment trajectories. But it is reasonable that the paralleladoption is a reflection of a parallel development.
When comparing the CSR performance indicators betweendifferent industries, only two indicators out of 45 indicators havesignificant difference, namely LA14 and PR7. This result shows thatin general there is no consistent difference in the disclosures of CSRperformance among automotive industry, metals products industry,forest and paper industry, chemical industry and health care
industry. This could indicate that CSR indicators are indeed generaland relevant across industries. Another explanation can be found inthe method. Since the indicators measure degree of disclosure, itdoes not necessarily reflect the amount of work put into thatcategory. A company with sites only in developed countries withstrict governmental control of labor conditions will find it mucheasier to reach full disclosure in these areas than a company with atruly global foot print, even if the latter does more work. Concern-ing the two indicators showing the difference, one possible reasonis that the automotive industry often compliances to such industrystandards (for example labor union standards) that are issued on aregular basis. The adherence to such standards has as a positiveimpact on their performance (Buren and Patterson, 2012).
In this paper, we take a comparatively short-term view (fromtime horizon perspective) to analyze the relationships betweenthe disclosures of CSR and financial performances in manufactur-ing companies. The results indicate that those companies doingwell on the GRI indicators like wisely perform well financially,particularly as the measure is based on ROE. Therefore, our studysupports the opinion that the profitable companies may have extraresources to report and improve corporate social performance; inthe meantime, CSR publicity and improvement can potentiallybring in significant competitive advantage for these companiesand thus complement the economic goals of the companies in theshort-term perspective. These results are in the line with the slackresource theory as well as the findings by Waddock and Graves(1997). Generally speaking, the disclosure of corporate socialperformance and corporate financial performance mutually affecteach other through a virtuous cycle.
In this paper we suggest to measure the CSR performanceaccording to the reporting system. This measurement is based oncontent analysis on the GRI reports mostly. As discussed by Chen andBouvain (2009), though this measuring method presents a helpfulevidence of the relative importance of the issue that the companyintends to represent to readers, it is not necessarily associate with theimportance related to the actual CSR practice. Thus, a furtherchecking or auditing system is necessary for the external stake-holders to assess the actual CSR work in these companies.
The findings of this study should be of interest for managers,government policy makers and investors. For those managers whocan allocate companies' resources during investment, they shouldconsider the potential payback from allocating some resourcestowards a transparent disclosure of corporate social performance.Such investment can efficiently utilize the internal financialresource of the companies, as well as remedy negative
Table 13Correlations between Society performance indicators with financial performances.
Salesgrowth
ROE Cash flow/sales
Spearman'srho
SP_A CorrelationCoefficient
.051 .183 � .002
Sig. (1-tailed) .350 .097 .495N 59 52 53
SP_B CorrelationCoefficient
.052 .230 .125
Sig. (1-tailed) .347 .051 .186N 59 52 53
SP_C CorrelationCoefficient
� .120 .097 .180
Sig. (1-tailed) .184 .246 .099N 59 52 53
SP_D CorrelationCoefficient
� .128 .137 � .112
Sig. (1-tailed) .166 .166 .213N 59 52 53
SP_E CorrelationCoefficient
� .058 .239a .052
Sig. (1-tailed) .333 .044 .356N 59 52 53
a Correlation is significant at the .05 level (1-tailed).
Table 14Correlations between Product Responsibility Performance Indicators with financial performance.
Sales growth ROE Cash flow/sales
Spearman's rho PR_A Correlation Coefficient .118 .210 .126Sig. (1-tailed) .188 .068 .183N 59 52 53
PR_B Correlation Coefficient .097 .213 � .006Sig. (1-tailed) .232 .065 .482N 59 52 53
PR_C Correlation Coefficient .006 .403a .207Sig. (1-tailed) .482 .002 .068N 59 52 53
PR_D Correlation Coefficient � .079 .150 � .021Sig. (1-tailed) .275 .144 .441N 59 52 53
PR_E Correlation Coefficient � .019 .154 .185Sig. (1-tailed) .442 .139 .092N 59 52 53
a Correlation is significant at the .01 level (1-tailed).
L. Chen et al. / Int. J. Production Economics ∎ (∎∎∎∎) ∎∎∎–∎∎∎ 9
Please cite this article as: Chen, L., et al., The relationship between disclosures of corporate social performance and financialperformance: Evidences from GRI.... International Journal of Production Economics (2015), http://dx.doi.org/10.1016/j.ijpe.2015.04.004i

communications coverage. Moreover, the managers should beencouraged to pursue GRI reporting activities with increased vigoror to investigate the underlying causes of the positive relationshipbetween the categories of Human Rights, Society as well asProduct responsibility with the return on equity.
However, there are still some limitations for GRI guideline itself.For example, GRI reports are not sufficient in providing informationfor the CSR performance assessment at suppliers' level. As Lee andKim (2009) discussed in their research, for company's daily supplychain management practices, lack of specific information of the CSRperformance assessment at suppliers' level is a big disadvantage.The development of evaluation measures for suppliers can be acrucial determinant in improving a company's performance. There-fore, it is very important for the GRI report developers consideringhow to develop concise and practical measurement indicators forthe social performance from a supply chain perspective.
This research provides a structured content analysis of CSRreports, especially it considers the social parts in the reports. TheCSR report presents a comprehensive coverage of social indicators.Using this social disclosure rating system, stakeholders can assessa company's commitment towards CSR issues and contrast themwith the actual performance. In this way, companies have abaseline to compare the CSR performances between each other.Moreover, it also provides companies the chance to benchmarkfrom the best practice in order to establish a sustainable business.For the policy-makers, they should consider the provision ofappropriate support and training for companies to publish stan-dard CSR reports, for example under GRI guidelines.
For investors, our study offers the empirical results as following:first of all, GRI reports can be used as an effective method to assessthe companies' sustainable work; and secondly, our study supportsthe conclusion in Rajput et al., (2012), namely a sustainable businessprovides a basis for securing the financial performance.
6. Limitations and future research suggestions
As the main content of GRI report always exceeds 100 pages, it isdifficult to apply content analysis to collect data from a large sampleof companies. In this paper, we have investigated 75 companiesacross Europe, Asia and America. The limited sample size restrainsthe possibility to conduct more advanced statistical analysis. Theanalysis crossing the regions could be of interest, but our samplesare distributed unevenly for these three regions due to moreavailable samples from Europe. With a larger sample size, it wouldalso be possible to further investigate the reason that the LaborPractices has a low internal consistency with the GRI structure.
Tang et al. (2012) analyzed 130 companies using panel datawith a time span from 1995 to 2007. They found that companiesimprove profits if they adopt a consistent CSR strategy, whichinvolves related dimensions of CSR and starts with those moreinternal to the companies. Oikonomou et al. (2012) conducted alongitudinal analysis of corporate social performance and financialrisk, and they use a large sample of panel data between the years1992 and 2009. They found that corporate social responsibility isnegatively and weakly related to the systematic company risk. Inaddition, corporate social irresponsibility is positively and stronglyrelated to the financial risk. However, in the above mentionedstudies, the corporate social performances are not evaluated usinga consistent reporting system. Whereas with the availability of GRIreports, we can repeat the similar longitudinal studies with somein-depth research focuses. Such a study should bring managersand researchers more insights to understand the developmentpath of CSR practice, and its relationship with financial perfor-mance from a long term perspective.
Again the longitudinal studies may also have a focus on certainregions. Since the Swedish manufacturing companies adopted GRI
reporting system for a relatively longer time, we can conduct alongitudinal panel data analysis during a period for the Swedishmanufacturing companies for the future research.
Appendix A. List of variables for raters
This list is adopted Global Reporting Initiative G3. Details of thedefinition can be found in sustainability reporting guidelinesversion 3.1. Grading scale should follow 1: not doing it, 3: alludesto doing it . . . 5: quantitative measures, categories, and targets.
1. Labor practices and decent work performance indicators1A: Employment
� LA1: Total workforce by employment type, employmentcontract, and region, broken down by gender.
� LA2: Total number and rate of new employee hires andemployee turnover by age group, gender, and region.
� LA3: Benefits provided to full-time employees that are notprovided to temporary or part-time employees, by signifi-cant locations of operation.
� LA15: Return to work and retention rates after parentalleave, by gender.
1B: Labor/management relations� LA4: Percentage of employees covered by collective bargain-
ing agreements.� LA5: Minimum notice period(s) regarding operational
changes, including whether it is specified in collectiveagreements.
1C: Occupational health and safety� LA6: Percentage of total workforce represented in formal
joint management–worker health and safety committeesthat help monitor and advice on occupational health andsafety programs.
� LA7: Rates of injury, occupational diseases, lost days, andabsenteeism, and total number of work-related fatalities, byregion and by gender.
� LA8: Education, training, counseling, prevention, and risk-control programs in place to assist workforce members,their families, or community members regarding seriousdiseases.
� LA9: Health and safety topics covered in formal agreementswith trade unions.
1D: Training and education� LA10: Average hours of training per year per employee by
gender, and by employee category.� LA11: Programs for skills management and lifelong learning
that support the continued employability of employees andassist them in managing career endings.
� LA12: Percentage of employees receiving regular perfor-mance and care development reviews, by gender.
1E: Diversity and equal opportunity� LA13: Composition of governance bodies and breakdown of
employees per employee category according to gender, agegroup, minority group membership, and other indicators ofdiversity.
1F: Equal remuneration for women and men� LA14: Ratio of basic salary and remuneration of women to
men by employee category, by significant locations ofoperation.
2. Human rights performance indicators2A: Investment and procurement practices
� HR1: Percentage and total number of significant investmentagreements and contracts that include clauses incorporatinghuman rights concerns, or that have undergone humanrights screening.
L. Chen et al. / Int. J. Production Economics ∎ (∎∎∎∎) ∎∎∎–∎∎∎10
Please cite this article as: Chen, L., et al., The relationship between disclosures of corporate social performance and financialperformance: Evidences from GRI.... International Journal of Production Economics (2015), http://dx.doi.org/10.1016/j.ijpe.2015.04.004i

� HR2: Percentage of significant suppliers, contractors, andother business partners that have undergone human rightsscreening, and actions taken.
� HR3: Total hours of employee training on policies andprocedures concerning aspects of human rights that arerelevant to operations, including the percentage of employ-ees trained.
2B: Non-discrimination� HR4: Total number of incidents of discrimination and
corrective actions taken.2C: Freedom of association and collective
� HR5: Operations and significant suppliers identified inwhich the right to exercise freedom of association andcollective bargaining may be violated or at significant risk,and actions taken to support these rights.
2D: Child labor� HR6: Operations and significant suppliers identified as
having significant risk for incidents of child labor, andmeasures taken to contribute to the effective abolition ofchild labor.
2E: Forced and compulsory labor� HR7: Operations and significant suppliers identified as
having significant risk for incidents of forced or compulsorylabor, and measures to contribute to the elimination of allforms of forced or compulsory labor.
2F: Security practices� HR8: Percentage of security personnel trained in the orga-
nization's policies or procedures concerning aspects ofhuman rights that are relevant to operations.
2G: Assessment� HR10: Percentage and total number of operations that have
been subject to human rights reviews and/or impactassessments.
2H: Remediation� HR11 Number of grievances related to human rights filed,
addressed and resolved through formal grievancemechanisms.
3. Society performance indicators3A: Local communities
� SP1: Percentage of operations with implemented localcommunity engagement, impact assessments, and develop-ment programs.
� SP9: Operations with significant potential or actual negativeimpacts on local communities.
� SP10: Prevention and mitigation measures implemented inoperations with significant potential or actual negativeimpacts on local communities.
3B: Corruption� SP2: Percentage and total number of business units ana-
lyzed for risks related to corruption.� SP3: Percentage of employees trained in organization's anti-
corruption policies and procedures.� SP4: Actions taken in response to incidents of corruption
3C: Public policy� SP5: Public policy positions and participation in public
policy development and lobbying.� SP6: Total value of financial and in-kind contributions to
political parties, politicians, and related institutions bycountry.
3D: Anti-competitive behavior� SP7: Total number of legal actions for anticompetitive beha-
vior, anti-trust, and monopoly practices and their outcomes.3E: Compliance
� SP8: Monetary value of significant fines and total number ofnon-monetary sanctions for noncompliance with laws andregulations.
4. Product responsibility performance indicators4A: Customer health and safety
� PR1: Life cycle stages in which health and safety impacts ofproducts and services are assessed for improvement, andpercentage of significant products and services categoriessubject to such procedures.
� PR2: Total number of incidents of non-compliance withregulations and voluntary codes concerning health andsafety impacts of products and services during their lifecycle, by type of outcomes.
4B: Product and service labeling� PR3: Type of product and service information required by
procedures and percentage of significant products andservices subject to such information requirements.
� PR4: Total number of incidents of non-compliance withregulations and voluntary codes concerning product andservice information and labeling, by type of outcomes.
� PR5: Practices related to customer satisfaction, includingresults of surveys measuring customer satisfaction.
4C: Marketing communications� PR6: Programs for adherence to laws, standards, and volun-
tary codes related to marketing communications, includingadvertising, promotion, and sponsorship.
� PR7: Total number of incidents of non-compliance withregulations and voluntary codes concerning marketingcommunications, including advertising, promotion, andsponsorship by type of outcomes.
4D: Customer privacy� PR8: Total number of substantiated complaints regarding
breaches of customer privacy and losses of customer data.4E: Compliance
� PR9: Monetary value of significant fines for noncompliancewith laws and regulations concerning the provision and useof products and services.
References
Agle, B.R., Mitchell, R.K., Sonnenfeld, J.A., 1999. Who matters to CEOs? Aninvestigation of stakeholder attributes and salience, corporate performance,and CEO Values. Acad. Manag. J. 42 (5), 507–525.
Abbott, W.F., Monsen, R.J., 1979. On the measurement of corporat social responsi-bility: self-reported disclosure as a method of measuring corporate socialinvolvement. Acad. Manag. J. 22 (3), 501–515.
Anderson, J.C., Frankle, A.W., 1980. Voluntary social reporting: an isobeta portfolioanalysis. Account. Rev. 55 (3), 467–479.
AECA(Spanish Accounting and Company Administration Association, 2004. Con-ceptual Framework on Social Responsibility, Document No. 1 on CorporateSocial Responsibility. AECA, Madrid.
Alexander, G.J., Buchholz, R.A., 1978. Corporate social performance and stockmarket performance. Acad. Manag. J. 21 (3), 479–486.
Aupperle, K.E., Carroll, A.B., Hatfield, J.D., 1985. An empirical investigation of therelationship between corporate social responsibility and profitability. Acad.Manag. J. 28 (2), 446–463.
Bansal, P., 2005. Evolving sustainability: a longitudinal study of corporate sustain-able development. Strateg. Manag. J. 26 (3), 197–218.
Baum, J.A.C., 1996. Organizations, technology and structuring. In: Clegg, S.R., Hardy,W.R., Nord, W.R. (Eds.), Handbook of Organization Studies. Sage, London.
Belkaoui, A., 1976. The impact of the disclosure of the environmental effects oforganizational behavior on the market. Financ. Manag. 5 (4), 26–31.
Berman, S.L., Wicks, A.C., Kotha, S., Jones, T.M., 1999. Does stakeholder orientationmatter? The relationship between stakeholder management models and firmfinancial performance. Acad. Manag. J. 42 (5), 488–506.
Boutin-Dufresne, F., Savaria, P., 2004. Corporate social responsibility and financialrisk. J. Invest. 13 (1), 57–66.
Brammer, S.J., Pavelin, S., 2006. Corporate reputation and social performance: theimportance of fit. J. Manag. Stud. 43 (3), 435–455.
Brammer, S., Millington, A., 2008. Does it pay to be different? An analysis of therelationship between corporate social and financial performance. Strateg.Manag. J. 29 (12), 1325–1343.
Brown, H.S., de Jong, M., Levy, D.L., 2009. Building institutions based on informationdisclosure: lessons from GRI's sustainability reporting. J. Clean. Prod. 17 (6),571–580.
L. Chen et al. / Int. J. Production Economics ∎ (∎∎∎∎) ∎∎∎–∎∎∎ 11
Please cite this article as: Chen, L., et al., The relationship between disclosures of corporate social performance and financialperformance: Evidences from GRI.... International Journal of Production Economics (2015), http://dx.doi.org/10.1016/j.ijpe.2015.04.004i

Buren, H.J., Patterson, K.D.W., 2012. Institutional predictors of and complements toindustry self-regulation with regard to labor practices. Bus. Soc. Rev. 117 (3),357–382.
CARS 21, 2006. A Competitive Automotive Regulatory System for the 21st Century,Luxembourg: European Commission. Office for Official Publications of theEuropean Communities.
Carroll, A.B., 1979. A three-dimensional model of corporate performance. Acad.Manag. Rev. 4 (4), 497–505.
Cochran, P.L., Wood, R.A., 1984. Corporate social responsibility and financialperformance. Acad. Manag. J. 27(1), 42–56.
Cornell, B., Shapiro, A.C., 1987. Corporate stakeholders and corporate finance.Financ. Manag. 16 (1), 5–14.
Chen, K.H., Metcalf, R.W., 1980. The relationship between pollution control recordand financial indicators revisited. Account. Rev. 55 (1), 168–177.
Chen, S., Bouvain, P., 2009. Is corporate responsibility converging? A comparison ofcorporate responsibility reporting in the USA, UK, Australia, and Germany.J. Bus. Ethics 87 (1), 299–317.
Chen, L., Tang, O., Feldmann, A., 2014. Applying GRI reports for the investigation ofenvironmental management practices and company performance in Sweden,China and India. J. Clean. Prod., http://dxdoi.org/10.1016/j.jclepro.2014.02.001,in press.
Clarkson, M.B.E., 1995. A stakeholder framework for analyzing and evaluatingcorporate social performance. Acad. Manag. Rev. 20 (1), 92–117.
Dooley, R., Lerner, L., 1994. Pollution, profits, and stakeholders: the constrainingeffect of economic performance on CEO concern with stakeholder expectations.J. Bus. Ethics 13 (9), 701–711.
EC, 2002. Communication from the Commission, Concerning Corporate SocialResponsibility: A Business Contribution to Sustainable Development, availableat: ⟨http://europa.eu.int/comm/employment_social/soc-dial/csr/csr2002_en.pdf⟩(accessed 14.03.14.).
Fombrun, C., Shanley, M., 1990. What's in a name? Reputation building andcorporate strategy. Acad. Manag. J. 33 (2), 233–258.
Friedman, M., 1970. The social responsibility of business is to increase its profits.New York Times, 13 September, pp. 122–126.
Frigant, V., 2009. CSR in the auto industry: do the first-tier suppliers havestakeholders? Int. J. Automot. Technol. Manag. 9 (4), 377–393.
Gallear, D., Ghobadian, A., Chen, W., 2012. Corporate responsibility, supply chainpartnership and performance: an empirical examination. Int. J. Prod. Econ. 140(1), 83–91.
Gray, R., Owen, D., Maunders, K., 1987. Corporate social reporting: Accounting andaccountability. Prentice-Hall, UK.
GRI, 2013. Sustainability Reporting Guidelines, Version 3.1. Global ReportingInitiative, Amsterdam.
Griffin, J.J., Mahon, J.F., 1997. The corporate social performance and corporatefinancial performance debate: twenty-five years of incomparable research. Bus.Soc. 36 (1), 5–32.
G3.1. 2013. Defining report content: the process: step3: validation-Checking thecompleteness of the material aspects, Accessed January, 2013. ⟨https://www.globalreporting.org/reporting/G3andg3-1/guidelines-online/TechnicalProtocol/DefiningReportContentTheprocesss/Pages/Step3Validation.asp⟩ (accessed 14.03.14.).
Hair, J., Anderson, R., Tatham, R, Black, W., 1998. Multivariate Data Analysis, 5thedition. Prentice Hall, New Jersey.
Herremans, I.M., Akathaporn, P., McInnes, M., 1993. An investigation of corporatesocial responsibility reputation and economic performance. Account. Organ.Soc. 18 (7-8), 587–604.
Hofer, C., Cantor, D.E., Dai, J., 2012. The competitive determinants of a firm'senvironmental management activities: evidence from US manufacturing indus-tries. J. Oper. Manag. 30 (1–2), 69–84.
Ingram, R.W., Frazier, K.B., 1980. Environmental performance and corporatedisclosure. J. Account. Res. 18(2), 614–622.
Jones, T.M., 1995. Instrumental stakeholder theory: A synthesis of ethics andeconomics. Acad. Manag. Rev. 20 (2), 404–437.
Lee, K.-H., Kim, J.-W., 2009. Current status of CSR in the realm of supply manage-ment: the case of the Korean electronics industry. Supply Chain Manag.: Int. J.14 (2), 138–148.
Levy, D.L., Brown, H.S., De Jong, M., 2010. The Contested politics of corporategovernance the case of the global reporting initiative. Bus. Soc. 49 (1), 88–115.
Luo, X., Bhattacharya, C.B., 2006. Corporate social responsibility, customer satisfac-tion, and market value. J. Mark. 70 (4), 1–18.
Marom, I.Y., 2006. Toward a unified theory of the CSP–CFP link. J. Bus. Ethics 67 (2),191–200.
Marimon, F., Alonso-Almeida, M.d.M., Rodríguez, M.d.P., Cortez Alejandro, K.A.,2012. The worldwide diffusion of the global reporting initiative: what is thepoint? J. Clean. Prod. 33, 132–144.
McWilliams, A., Siegel, D., 2000. Corporate social responsibility and financialperformance: correlation or misspecification? Strateg. Manag. J. 21 (5),603–609.
McWilliams, A., Siegel, D., 2001. Corporate Social Responsibility: a theory of thefirm perspective. Acad. Manag. Rev. 26 (1), 117–127.
McWilliams, A., Siegel, D.S., Wright, P.M., 2006. Corporate social responsibility:strategic implications. J. Manag. Stud. 43 (1), 1–18.
McGuire, J., Sundgren, A., Schneeweis, T., 1988. Corporate social responsibility andfirm financial performance. Acad. Manag. J. 31 (4), 854–872.
Moneva, J.M., Rivera-Lirio, J.M., Muñoz-Torres, M.J., 2007. The corporate stake-holder commitment and social and financial performance. Ind. Manag. DataSyst. 107 (1), 84–102.
Oikonomou, I., Brooks, C., Pavelin, S., 2012. The impact of corporate socialperformance on financial risk and utility: a longitudinal analysis. Financ.Manag. 41 (1), 483–515.
Orlitzky, M., Schmidt, F.L., Rynes, S.L., 2003. Corporate social and financialperformance: a meta-analysis. Organ. Stud. 24 (3), 403–441.
Patten, D.M., 1990. The market reaction to social responsibility disclosures: the caseof the Sullivan Principles signings. Account. Organ. Soc. 15 (6), 575–587.
Peloza, J., 2006. Using corporate social responsibility as insurance for financialperformance. Calif. Manag. Rev. 48 (2), 52–72.
Potter, W.J., Levine‐Donnerstein, D., 1999. Rethinking validity and reliability incontent analysis. J. Appl. Commun. Res. 27 (3), 258–284.
Prado‐Lorenzo, J.M., Gallego‐Alvarez, I., Garcia‐Sanchez, I.M., 2009. Stakeholderengagement and corporate social responsibility reporting: the ownershipstructure effect. Corp. Soc. Responsib. Environ. Manag. 16 (2), 94–107.
Rajput, N., Batra, G., Pathak, R., 2012. Linking CSR and financial performance: anempirical validation. Probl. Perspect. Manag. 10 (2), 42–49.
Rasche, A., 2009. Toward a model to compare and analyze accountability stan-dardse the case of the UN global compact. Corp. Soc. Responsib. Environ.Manag. 16, 192–205.
Reimann, B.C., 1975. Organizational effectiveness and management's public values:a canonical analysis. Acad. Manag. J. 18 (2), 224–241.
Russo, M.V., Fouts, P.A., 1997. A resource-based perspective on corporate environ-mental performance and profitability. Acad. Manag. J. 40 (3), 534–559.
Seuring, S., Müller, M., 2008. From a literature review to a conceptual frameworkfor sustainable supply chain management. J. Clean. Prod. 16 (15), 1699–1710.
Spencer, B.A., Taylor, G.S., 1987. A within and between analysis of the relationshipbetween corporate social responsibility and financial performance. Akron Bus.Econ. Rev. 18 (3), 7–18.
Skouloudis, A., Evangelinos, K., Kourmousis, F., 2009. Development of an evaluationmethodology for triple bottom line reports using international standards onreporting. Environ. Manag. 44, 298–311.
Sturdivant, F.D., Ginter, J.L., 1977. Corporate social responsiveness, managementattitudes and economic performance. Calif. Manag. Rev. 19 (3), 30–39.
John St, C.H., Cannon, A.R., Pouder, R.W., 2001. Change drivers in the newmillennium: implications for manufacturing strategy research. J. Oper. Manag.19 (2), 143–160.
Sweeney, L., Coughlan, J., 2008. Do different industries report Corporate SocialResponsibility differently? An investigation through the lens of stakeholdertheory. J. Mark. Commun. 14 (2), 113–124.
Tang, Z., Hull, C.E., Rothenberg, S., 2012. How corporate social responsibilityengagement strategy moderates the CSR-financial performance relationship.J. Manag. Stud. 49 (7), 1274–1303.
Tate, W.L., Ellram, L.M., Kirchoff, J.F., 2010. Corporate Social Responsibility Reports: aThematic analysis related to supply chain management. J. Supply Chain Manag.46 (1), 19–44.
Tsang, E.W., 1998. A longitudinal study of corporate social reporting in Singapore:the case of the banking, food and beverages and hotel industries. Account.Audit. Account. J. 11 (5), 624–635.
Tsang, S., Welford, R., Brown, M., 2009. Reporting on community investment. Corp.Soc. Responsib. Environ. Manag. 16 (3), 123–136.
Vance, S.C., 1975. Are socially responsible firms good investment risks? Manag. Rev.64 (8), 18–24.
Waddock, S.A., Graves, S.B., 1997. The corporate social performance-financialperformance link. Strateg. Manag. J. 18 (4), 303–319.
Wanderley, L.S.O., Lucian, R., Farache, F., de Sousa, Filho, Milton, José, 2008. CSRinformation disclosure on the web: a context-based approach analysing theinfluence of country of origin and industry sector. J. Bus. Ethics 82 (2), 369–378.
Weber, O., Koellner, T., Habegger, D., Steffensen, H., Ohnemus, P., 2008. The relationbetween the GRI indicators and the financial performance of firms. Prog. Ind.Ecol.: Int. J. 5 (3), 6.
Wolfe, Robert, 1991. In: Post, James E. (Ed.), The use of Content Analysis to AssessCorporate Social Responsibility in Research in Corporate Social Performanceand Policy, 12. JAI Press, Greenwich, CT, pp. 281–307.
World Commission on Environment and Development (WCED)., 1987. Our Com-mon Future. Oxford University Press, Oxford.
L. Chen et al. / Int. J. Production Economics ∎ (∎∎∎∎) ∎∎∎–∎∎∎12
Please cite this article as: Chen, L., et al., The relationship between disclosures of corporate social performance and financialperformance: Evidences from GRI.... International Journal of Production Economics (2015), http://dx.doi.org/10.1016/j.ijpe.2015.04.004i

IVPAPER


1
An empirical evaluation of sustainable operations practices and performance in
the Swedish manufacturing industry
Lujie Chen*, Andreas Feldmann, Ou Tang
Submitted to Journal of Cleaner Production
An early version of the paper was presented at the 21th International Annual
EurOMA Conference, 20-25 June, 2014, Palermo, Italy.

2

3
An empirical evaluation of sustainable operations
practices and performance in the Swedish manufacturing
industry
Lujie Chen1*, Andreas Feldmann
2, Ou Tang
1
1 Division of Production Economics, Department of Management and Engineering,
Linköping University, SE-581 83 Linköping, Sweden
2 Division of Industrial Management, Department of Industrial Economics and Management, Royal Institute of
Technology, SE-100 44 Stockholm, Sweden
* Corresponding author. Tel.: +46-13-281770; fax: +46-13-281101.
E-mail addresses: [email protected] (Lujie Chen), [email protected] (Andreas Feldmann),
[email protected] (Ou Tang)

4
An empirical evaluation of sustainable operations
practices and performance in the Swedish manufacturing
industry
Abstract
This study explored whether there are patterns linking sustainability practices and
performance in the Swedish manufacturing industry. Meanwhile, the relationships between
sustainability improvement practices and companies’ triple bottom line performance were
investigated using survey data from Swedish manufacturing companies. Treating each
sustainability practice and performance indicator as an individual item, factor analysis and
cluster analysis were conducted to explore the potential patterns and relationships. The results
indicated that the triple bottom line provides a valid outline for representing companies’
sustainability practices in the Swedish manufacturing industry. In terms of sustainability
performance, the results showed that economic performance was often treated as a separate
category in practice, whereas environmental sustainability and social sustainability were
often combined. Process and product technology level was positively correlated with
environmental performance and innovation performance. Economic, social, and
environmental practices had positive correlations with performance in the respective area.
Even though not all social and environmental practices directly improved companies’
economic performance, some social and environmental practices, such as education,
individual development, and environmental health improvement, had an indirect effect and,
thus, are deserving of specific attention. These selected practices often had a positive impact
on product and process innovation, which could further improve companies’ economic
performance.
Keywords: Sustainability, operations strategies, operations performance, survey
1. Introduction
Sustainability is a broad concept that integrates not only economic accomplishments, but also
environmental stability and social justice. As defined by Kleindorfer et al. [1], sustainable
operations management should combine the profit and productivity issues of classical
operations management with wider concerns over the company’s environmental and social
5
impacts. However, balancing economic, environmental, and social performance is not an easy
task for many companies, as they face internal resource constraints (e.g., budgets and costs)
and external pressures (e.g., market competition and government regulations) [2]. In order to
achieve sustainable development over the long term, companies need to implement
continuous improvement strategies and practices in order to promote their environmental and
social reputations.
Several studies have explored the relationship between companies’ environmental
management and their operations management. Gupta [3] stated that environmental
management has an impact on companies’ daily operations management in a variety of ways,
such as through product planning, the usage of raw materials and energy, air and water
pollution control, waste disposal operations, and the design and production of green products.
Sarkis [4] suggested that the manufacturing industry should view progress, productivity,
profitability, and environmental consciousness as integrated goals for operations management.
Hanna and Newman [5] indicated that new trends are forcing environmental issues into
operations management, such as the elimination of waste and pollution prevention. Montabon
et al. [6] explored the relationship between environmental management practices and
company performance by analyzing U.S. and non-U.S. companies’ reports in different
industries. They suggested the existence of a positive and significant relationship between the
two. Chen et al. [7] analyzed the relationship between environmental management practices
and company performance with data collected from a content analysis of Global Reporting
Initiative (GRI) reports for manufacturing companies in Sweden, China, and India. The
research results illustrated that most environmental management practices are not positively
correlated to a company’s financial performance in a direct manner. However, since
environmental management practices can improve innovation performance, there will be
some positive gains in financial performance.
An increasing number of publications have investigated related social sustainability issues. In
an empirical study, Carter [8] collected data from in-depth interviews and surveys,
identifying the ethical concerns affecting the relations between U.S. purchasing managers and
their non-U.S. suppliers. Luo and Bhattacharya [9] used secondary data from multiple
sources to analyze the relationship between corporate social responsibility (CSR) and market
value. The study result indicated that companies with less innovative inputs had lower
customer satisfaction due to poor CSR performance; consequently, their market value will be
harmed. Sharma and Henriques [10] examined how the stakeholders and their interactions

6
impact the types of sustainability practices implemented in the Canadian forest product
industry. Social and ecological stakeholders often focus on ecological diversities. In addition
they also have concerns over activities directly or indirectly the company’s economic
stakeholders, such as customers, on whom the company’s financial well-being depends. The
results showed that, in the pulp and paper industry, the focus of sustainability performance
has been changed, in that stakeholders have moved away from a narrow concern with the
early stages, such as eco-efficiency, toward a wider scope of sustainability practices, such as
building industrial ecosystems in a region.
However, the aforementioned studies still have some limitations. First, most of these studies
have only focused on one aspect of sustainability, such as environmental, social, or economic
sustainability, without considering the issues with respect to the “triple bottom line.” Second,
these studies have often explored the link between environmental/social practices and
company performance in a static manner. Very few studies have treated sustainability
explicitly in an organizational learning context, i.e., in terms of sustainability improvement
efforts in sustainability. Third, most of the studies have not had an explicit focus on the
manufacturing industry, despite the fact that, in industrialized countries such as Sweden, the
manufacturing industry contributes significantly to economic outputs. The manufacturing
industry is more energy and raw materials resource intensive than the service industry. As
such, the manufacturing industry is facing relatively high external and internal pressures with
respect to sustainability practices and performance [7]. Therefore, it is useful to conduct
empirical research on the manufacturing industry, investigating the learning and
improvement patterns influencing sustainable operations and company performance in terms
of the triple bottom line.
One recent study by Chen et al. [7] showed that some specific environmental practices can
have a positive impact on company performance, especially innovation performance
including product and process innovation. However, it remains unclear whether the strategic
choice of technology, i.e., technology-driven companies vs. less technology-driven
companies, will produce different results in terms of environmental performance and
innovation performance. Other research concerns include: whether companies attempt to
integrate sustainability into their business strategy instead of treating it simply as an add-on;
how a sustainability strategy can be developed and how sustainability targets can be set for
the entire manufacturing system; whether companies decide on sustainability strategy at the
7
headquarters or whether every plant designs its own strategy according to its specific needs.
To our knowledge, no empirical studies have addressed these questions.
Motivated by these issues, we conducted an empirical study to investigate the links between
the three bottom lines, namely the economic, environmental, and social aspects of
sustainability, and company performance in the manufacturing industry. Moreover, this study
focused on the dynamic nature of such links, i.e., whether there are patterns related to
sustainability practices and performance. Each sustainability practice and performance
indicator was treated as an individual item, and factor analysis and cluster analysis were used
to explore the potential patterns. More specifically, the following research questions guided
our study:
What are the focuses for companies when implementing different sustainability
improvement practices?
What are the focuses for companies when evaluating their sustainability
performance?
Do companies make the same amount of effort with respect to different categories
of sustainability improvement practices?
What is the relationship between sustainability improvement practices and
company performance?
How are companies mapping their sustainability strategy and targets? Is it a
centralized approach or a decentralized approach, with local plants building their
own sustainability strategy?
Does a company’s process and product technology level impact its environmental
performance and innovation performance?
To answer the above research questions, we collected data from a sample consisting of all
Swedish manufacturing companies with more than 200 employees. The survey instrument
focused specifically on companies’ sustainability improvement practices and the related
performance. We chose to focus on the Swedish manufacturing industry, particularly because
it has a long tradition of improving performance through research and development
expenditures and other innovation practices and efforts [11]. In this paper, we first present the
theoretical framework, including sustainable theory, dynamic resource-based view, and
ecological modernization theory. These theories provide the background for the development
of the study’s research questions. In Section 3, we describe the empirical data collection

8
methods, as well as the validity and reliability of this research. We present the statistical
analyses and results in Section 4, followed by a discussion of the theoretical generalizability
and managerial implications of the findings. We offer some conclusions and avenues of
future research in the final section.
2. Theoretical background
The questionnaire used in this empirical research was developed on the basis of a conceptual
framework modified from the results of previous research conducted by Chen et al. [12]. This
conceptual framework attempts to synthesize different perspectives on sustainability from the
viewpoint of the manufacturing industry. For this study, sustainability was evaluated
according the triple bottom line, i.e., environmental, social, and economic issues. These
issues were further divided into constructs (sub-categories) relevant to manufacturing,
providing results for six constructs (see the appendix). Furthermore, specific measurement
items needed to be validated for each construct. (The validation and reliability test is
explained in section 3.2.)
For this paper, we explored how companies implement sustainability improvement practices
and what they focus on when evaluating sustainability performance. Moreover, we examined
the potential links between practices and performance from a dynamic perspective. Thus, in
order to provide a context for the research questions, as presented in the previous section, we
discuss sustainable theory, dynamic resource-based view, configuration of sustainability
strategy and ecological modernization theory in the following subsections.
2.1 Sustainable theory
Sustainable theory can provide the theoretical background for the survey design and
development in this study. According to Gimenez et al. [13], sustainable theory can be
defined at two levels. First, at the macroeconomic level, sustainable development can be
defined as “the development that meets the needs of the present without compromising the
ability of future generations to meet their needs” (see [14]). Second, at the microeconomic
level, sustainable theory can be operationalized at the company/plant level. Elkington [15]
developed this concept by applying the triple bottom line to measure a company’s overall
performance, thereby integrating the company’s economic, environmental, and social
sustainability. The triple bottom line measurement helps companies to identify their present
and future demands, and to efficiently balance organizational responsibilities between various
stakeholders.

9
According to a literature review by Chen et al. [12], economic sustainability can be measured
at the plant level as cost, market, and economic stability. Environmental sustainability is
related to ecosystem vitality, which includes air pollution and water quality related to the
ecosystem, biodiversity protection, climate change performance (e.g., CO2 emissions), and
renewable energy usage; environmental health, which includes environmental burden of
disease, and air pollution and water quality related to humans; and environmental factors
within production, which include material use, energy consumption, renewable resources,
waste generation, treatment, and disposal, and the recycling of materials, energy, and waste.
Social sustainability is often related to governance, education, community, individual civil
liberties, and human rights (see appendix).
Hence, the following three research questions have been developed from the above principle.
What are the focuses for companies when implementing different sustainability
improvement practices?
What are the focuses for companies when evaluating their sustainability
performance?
Do companies make the same amount of effort with respect to different categories
of sustainability improvement practices?
2.2 Dynamic resource-based view
Barney [16] first developed the resource-based model for illustrating competitive advantages.
This model shows that by using rare, valuable, replaceable resources, companies can gain a
sustained competitive advantage. Helfat and Peterraf [17] extended this resource-based model
into the dynamic resource-based view, which suggests that all companies’ capabilities can be
seen in a dynamic way that involves adaptation, change, integration, and the building or
reconfiguring of other capabilities. According to this dynamic resource-based view,
improvements in various organizational practices and performance can exemplify the
company’s capacity for development. There have been some applications of this perspective
in the examination of sustainable operations. For example, Vachon and Klassen [18] used this
theory to explain why environmental project cooperation with customers was positively
correlated to environmental performance. In addition, Sarkis et al. [19] suggested that
building operational capabilities through sustainable operations in a green supply chain can
make continuous improvements to the company’s reputation and positively impact other
performance indicators.

10
For companies, economic profitability is still the top reason for adopting environmental and
social improvement practices. According to the literature [19] [20], improved sustainability
practices, especially environmental ones, may have a positive impact on economic
performance in the following ways.
First, improved sustainability practices, such as environmentally friendly programs, can help
to secure competitive advantage and add value to the company’s core business programs [20],
[21]. Moreover, it has also been suggested that companies can do better in their financial
output with the help of different sustainability programs, including environmental
certification and employee well-being improvement programs [13].
Second, sustainability practices can improve companies’ innovation possibilities, such as
product innovation and process innovation, and thus economic profitability can be achieved
[7].
Third, even though sustainability practices may not improve companies’ gains over the short
term, continuous environmental improvements can help companies to achieve better
performance over the long term [20].
The following research question was generated from the above discussion:
• What is the relationship between sustainability improvement practices and
company performance?
2.3 Configuration of sustainability strategy
A sustainability strategy can be decided upon either through a centralized approach or a
decentralized approach. Olson et al. [22] stated that “a measure of the dispersion of
responsibilities as well as decision authority from top management to lower management
levels, including the implementation and development of procedures and methods can be
described as configuration.” When implementing sustainability practices, companies may still
have different configurations of their sustainability strategy. This variation is of particular
concern when a company is operating in a global environment with footprints worldwide.
In practice, companies can set either a fully centralized or decentralized sustainability
strategy, or alternatively a mixture of the two. Understanding such configurations is
important in organizational studies, since the selection of a configuration affects companies’
coordination mechanisms, and accordingly their operations and performance. However, there
has been no empirical investigation into how companies, especially manufacturing ones, map

11
the configuration of sustainability strategies based on the triple bottom line. Thus, we present
another research question.
• How are companies mapping their sustainability strategy and targets? Is it a
centralized approach or a decentralized approach, with local plants building their
own sustainability strategy?
2.4 Ecological modernization theory
Ecological modernization theory is an important theory in environmental sociology.
Considering the micro-level analysis, the general idea of ecological modernization theory is
that companies can allocate resources to technology innovations designed to help them
improve their environmental performance and, in turn, achieve better economic performance.
In other words, ecological modernization theory supports the notion that through
“ modernization” (i.e., innovation and technology development) companies can achieve both
environmental performance improvement and industrial development [23], [19]. The effects
of technological innovation are also explained by this theory, as pointed out in [19] and [24].
In effect, manufacturing companies can access operational opportunities for performance
improvements by overcoming obstacles to innovation. Therefore, according to ecological
modernization theory, manufacturers can implement strategies related to their production and
process, which will affect their innovation and environmental performance. Thus, a further
research question is:
Does the choice of technology impact environmental performance and innovation
performance?
3. Methods
This section presents the data collection, and discusses the validity and reliability of the data.
3.1 Data collection
This study relied on data from a survey that was administered during the first half of 2014. As
mentioned earlier, Chen et al. [12] conducted a literature review to investigate the
sustainability issues in manufacturing. By aggregating and categorizing the sustainability
concerns of previous literature, Chen et al.’s study identified the important sustainability
factors of manufacturing in terms of environmental, social, and economic dimensions. For the
current study, we designed the survey questionnaire based on the results and the conceptual
model generated by Chen et al. [12]. A 5-point Likert scale was applied in the survey. Since

12
the quality of a survey depends greatly on the understanding and cooperation between
questionnaire designers and respondents, the designers were available to the respondents by
email and phone if any questions arose [25]. Pilot testing was conducted among a group
consisting of experts from companies and academic institutions in Sweden. Such an approach
confirmed that the questionnaire was suitable for achieving the basic research objectives and
that respondents would be able to understand the main items regarding sustainable operations
performance and practices (see appendix for the relevant part of the questionnaire).
According to the study objectives of this paper and the results of the pilot test, targeted
survey respondents were managers in charge of their company’s sustainable operations who
had good knowledge of their company’s sustainable strategy, sustainability practices, and
performance. Most of these managers were at the middle or high management levels in their
companies. This selection of respondents was supported by the suggestions of Zhu et al. [25]
and Bowen et al. [26] who showed positive correlations between middle managers’ attitudes
toward company environmental proactivity and green supply chain management operations.
The sample population for this research was composed of Swedish companies in the
manufacturing industry. From Statistics Sweden (SCB), we obtained a list of all the Swedish
manufacturing companies across different sectors. We then narrowed that list to include only
companies with more than 200 employees, since the pilot test indicated that companies of
that size (mid- and large-sized companies) often devote attention to sustainable operations
and often have someone in charge of such operations. The sample also covered the entire
Swedish territory so as to ensure the representativeness of the sample. We then made phone
calls to each of the companies, requesting the contact information of the managers in charge
of the company’s sustainable operations. Finally, the questionnaire was mailed to 349
Swedish manufacturing companies, and 101 useable responses were returned (a response rate
of 29%). Once we had received all the responses, we conducted an analysis using SPSS in
order to investigate the relationships between sustainable operations practices, and
environmental, economic, and social performance.
We checked for non-response bias using a t-test comparison between the characteristics of
early respondents and late respondents, including the respondents’ position and years in the
manufacturing industry. No significant differences (p<0.05) were detected between early
respondents and late respondents, indicating no serious non-response bias in the data.

13
3.2 Validity and reliability
According to sustainable theory and the conceptual model, we developed the constructs
shown in Table 1, which include technology level, economic sustainability improvement
practices, environmental sustainability improvement practices, social sustainability
improvement practices, economic sustainability performance, innovation performance,
environmental sustainability performance, and social sustainability performance. Since
common method bias can occur when the same methods are used for collecting data and can
affect the collected data’s validity and reliability [27], [28], we used Harman’s single-factor
test to evaluate this bias [29]. All of the measured items were loaded into one single factor by
conducting principal component analysis with an unrotated factor solution. The evaluation
results showed that 31.90% of variance was explained with all items loaded into a single
factor. Thus, the common method bias was not seen as a significant problem in this dataset
(see critical value in [30]).
To further analyze the survey data, we calculated the Cronbach’s alpha coefficients and
item-total correlations for the empirical data (see Table 1). All of the factors for technology
level, economic sustainability improvement practices, environmental sustainability
improvement practices, social sustainability improvement practices, economic sustainability
performance, innovation performance, environmental sustainability performance, and social
sustainability performance had reliability values (alphas) of 0.807, 0.867, 0.837, 0.828, 0.878,
0.773, 0.861, and 0,833, respectively. All these reliability values were well above the
threshold value of 0.70 suggested by Nunnally et al. [31]. This test thus confirmed the
constructs’ reliability. Moreover, all of the factors within each construct had high item-total
correlation values, i.e., the values were larger than 0.50, which is the threshold value
recommended by Hair et al. [32]. In other words, these were acceptable values with respect to
the corresponding higher-level constructs for this exploratory research study.

14
Table 1. Validity and reliability of the constructs
Constructs Items Corrected Item-Total
Correlation Cronbach’s alpha
Technology level Process technology 0.677 0.807 Product technology 0.677
Economic
sustainability
improvement
practices
Cost 0.656
0.867 Market 0.775 Growth
0.815
Environmental
sustainability
improvement
practices
Ecosystem vitality 0.722
0.837 Environmental health 0.819 Environmental factors
within production 0.591
Social sustainability
improvement
practices
Governance 0.588
0.828 Education 0.562 Individual 0.795 Community 0.697
Economic
sustainability
performance
Cost 0.593
0.878
Return on investment 0.723 Economic stability 0.761 Market 0.729 Growth 0.756
Innovation
performance
Product innovation 0.564 0.773 Process innovation 0.631
Environmental
sustainability
performance
Ecosystem vitality 0.469
0.861 Environmental health 0.631 Environmental factors
within production 0.631
Social sustainability
performance
Governance 0.815
0.833 Education 0.788 Individual 0.619 Community 0.617
4. Results
The results of the analysis are presented in this section.
4.1 Descriptive analysis of technology level, sustainability practices, and performance
As seen in Table 2, the technology level was relatively high for the Swedish manufacturing
companies, with a mean value higher than 3.7. Comparing the three aspects of sustainability
improvement, it is not surprising that economic improvement practices ranked the highest
among all sustainability improvement practices.

15
Table 2. Descriptive data of technology level, sustainability practices, and performance
Mean Median Mode Std. Deviation
Technology levela
Process technology levela 3.73 4.00 4 .874
Product technology levela 3.75 4.00 4 .925
Sustainability practicesb
Cost 4.30 4.00 4 .707
Market 4.18 4.00 4 .754
Growth 4.26 4.00 4 .757
Ecosystem vitality 2.93 3.00 4 1.175
Environmental health 3.23 3.00 4 1.153
Environmental factors within production 3.69 4.00 4 .890
Governance 2.96 3.00 2 1.193
Education 3.01 3.00 3 .933
Individuals 2.80 3.00 3 1.113
Community 2.97 3.00 3 1.120
Sustainability performancec
Cost 3.55 4.00 4 .753
ROI 3.59 4.00 4 .767
Economic stability 3.63 4.00 4 .680
Market 3.76 4.00 4 .724
Growth 3.55 4.00 3 .770
Quality 3.94 4.00 4 .732
Delivery 3.76 4.00 4 .776
Flexibility 3.97 4.00 4 .688
Product Innovation 3.65 4.00 4 .823
Process Innovation 3.45 3.00 3 .870
Ecosystem vitality 3.23 3.00 3 .944
Environmental health 3.47 3.00 3 .954
Environmental factors within production 3.65 4.00 4 .855
Governance 3.49 3.00 3 .921
Education 3.33 3.00 3 .811
Individuals 3.34 3.00 3 .776
Community 3.28 3.00 3 .773
a. 1 = very low; 2 = low; 3 = medium; 4 = high; 5 = very high.
b. 1 = very low; 2 = low; 3 = medium; 4 = high; 5 = very high.
c. 1 = very poor; 2 = poor; 3 = fair; 4 = good; 5 = excellent.
The adoption of environmental sustainability practices was found to be less than the adoption
of economic ones, with mean values of 2.93, 3.23, and 3.69 for the respective three
environmental improvement practices. However, environmental practices within production
had the highest mean value of 3.69, showing that for these manufacturing companies,
production-related environmental issues were the most important. The social improvement
practices, including governance, education, individuals, and community, were ranked lowest.
Meanwhile, there was a diversified level of implementation with several sustainability
practices, namely ecosystem vitality, environmental health, governance, individuals, and

16
community. These five practices had relatively higher standard deviations over 1.00. For
sustainability performance, the results were relatively less diversified, since no factor in this
category had a standard deviation higher than 1.00. All sustainability performance had a
mean value ranging from 3.00 to 4.00.
In sum, the empirical results showed that the Swedish manufacturing industry has adopted
relatively weak social sustainability practices. In addition, the implementation level for the
sustainability improvement practices had relatively high variation, especially when
considering environmental and social improvement practices. This indicates that there are
different attitudes among manufacturing companies toward adopting environmental and
social sustainability practices. Some manufacturers may have implemented such practices
proactively, whereas others may have reactive attitudes toward environmental and social
issues.
4.2 Mapping the sustainability strategy
In this subsection of this paper, we investigate how Swedish manufacturing companies set
their sustainability strategy. Based on the review study in [12] and the pilot test among
researchers and companies, we included eleven areas for indicating sustainability strategy in
the questionnaire. These areas again covered economic, environmental, and social aspects. In
order to determine whether the sustainability strategy is defined centrally or de-centrally in
the manufacturing network, we provided a 5-point Likert scale ranging from ‘locally’ (1) to
‘centrally’ (5). The results are given in Table 3.
Economic sustainability strategies included cost, market, economic sustainability, and growth;
such strategies displayed the most centralized tendency. This category was followed by
environmental sustainability strategies, containing ecosystem vitality, environmental health,
and environmental factors within production. The last category was social sustainability
strategies, which had the lowest tendency toward centralization. This category included
governance, individual, education, and community.
We also must note that there was a limited number of companies in the sample with
centralized control over all sustainability strategies, i.e., out of 101 companies, only nine had
the maximum score of 5 for all sustainability strategy settings. In general, the Swedish
manufacturing companies in the sample tended to define their sustainability strategies either
centrally or locally depending on the type of sustainability strategy being introduced.
Economic sustainability strategy was more likely to be set centrally, whereas social

17
sustainability strategy was more likely to be set locally. Environmental sustainability strategy
showed a mixed pattern. Since Swedish manufacturing companies with more than 200
employees are likely to be international companies with global networks, a possible
explanation for these findings is that for social sustainability strategy, manufacturers need to
consider local interests such as local community development, individual welfare, and
personal development in the specific areas/regions. Therefore, such a strategy needs to be
formed locally.
Table 3. Orientation of sustainability strategy setting (centralized vs. decentralized)
Area of Sustainability
strategy a
Mean Median Mode Std. Deviation
Cost 3.42 3.00 3 1.228
Market 3.83 4.00 5 1.028
Economic stability 4.07 4.00 5 1.019
Growth 4.10 4.00 5 .917
Ecosystem vitality 3.01 3.00 3 1.317
Environmental health 2.98 3.00 3 1.292
Environmental factors
within production
2.91 3.00 3 1.248
Governance 2.02 2.00 2 .666
Individual 1.94 2.00 2 .639
Education 2.13 2.00 2 .623
Community 2.10 2.00 2 .727
a. 1 = local; 2 = mostly local; 3 = mixed; 4 = mostly central; 5 = central.
4.3 Technology level with environmental performance and innovation performance
The correlations between technology level and innovation performance as well as
environmental performance were investigated using the Pearson correlation coefficient.
Preliminary analysis was conducted to ensure that there was no violation of the assumptions
of linearity, normality, or homoscedasticity. The results are shown in Table 4. There was a
strong positive correlation between process technology level and environmental performance,
including Ecosystem performance, Environmental health performance, and Production
environmental performance, with correlation coefficient values of r=0.410, r=0.425, and
r=0.336, respectively (N=77, p<0.001). Meanwhile, there was a medium to strong correlation
between product technology level and environmental performance (i.e., Production
environmental performance, Ecosystem performance, Environmental health performance)
with correlation coefficients of r=0.240, r=0.306, and r=0.321, respectively (N=77, p<0.001).
The relationship between product technology level and innovation performance (products and
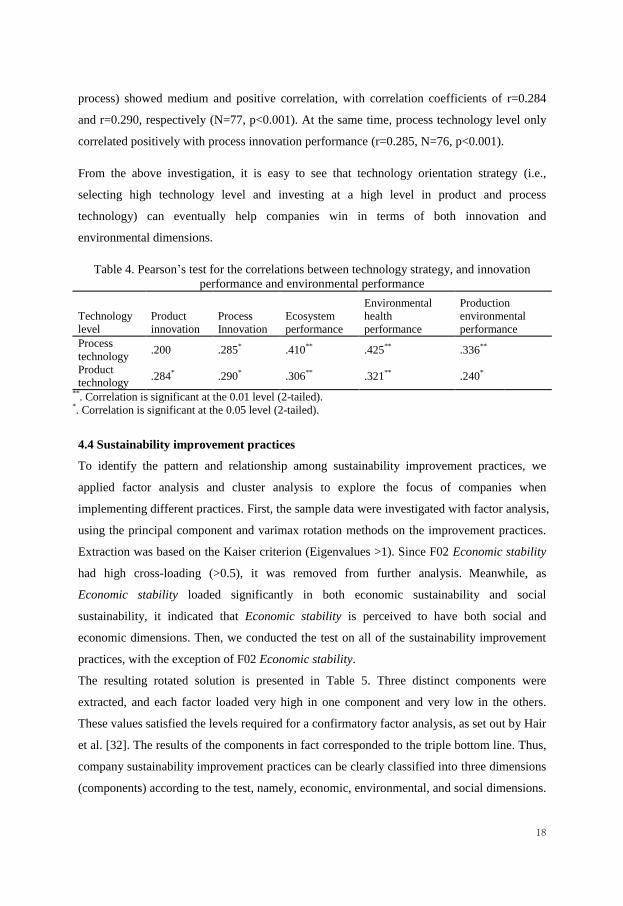
18
process) showed medium and positive correlation, with correlation coefficients of r=0.284
and r=0.290, respectively (N=77, p<0.001). At the same time, process technology level only
correlated positively with process innovation performance (r=0.285, N=76, p<0.001).
From the above investigation, it is easy to see that technology orientation strategy (i.e.,
selecting high technology level and investing at a high level in product and process
technology) can eventually help companies win in terms of both innovation and
environmental dimensions.
Table 4. Pearson’s test for the correlations between technology strategy, and innovation
performance and environmental performance
Technology
level
Product
innovation
Process
Innovation
Ecosystem
performance
Environmental
health
performance
Production
environmental
performance
Process
technology .200 .285
* .410
** .425
** .336
**
Product
technology .284
* .290
* .306
** .321
** .240
*
**. Correlation is significant at the 0.01 level (2-tailed).
*. Correlation is significant at the 0.05 level (2-tailed).
4.4 Sustainability improvement practices
To identify the pattern and relationship among sustainability improvement practices, we
applied factor analysis and cluster analysis to explore the focus of companies when
implementing different practices. First, the sample data were investigated with factor analysis,
using the principal component and varimax rotation methods on the improvement practices.
Extraction was based on the Kaiser criterion (Eigenvalues >1). Since F02 Economic stability
had high cross-loading (>0.5), it was removed from further analysis. Meanwhile, as
Economic stability loaded significantly in both economic sustainability and social
sustainability, it indicated that Economic stability is perceived to have both social and
economic dimensions. Then, we conducted the test on all of the sustainability improvement
practices, with the exception of F02 Economic stability.
The resulting rotated solution is presented in Table 5. Three distinct components were
extracted, and each factor loaded very high in one component and very low in the others.
These values satisfied the levels required for a confirmatory factor analysis, as set out by Hair
et al. [32]. The results of the components in fact corresponded to the triple bottom line. Thus,
company sustainability improvement practices can be clearly classified into three dimensions
(components) according to the test, namely, economic, environmental, and social dimensions.

19
In other words, the statistical analysis results indicated that the triple bottom line is a good
classification of companies’ sustainability practices.
Each component could be further divided into different factors, as highlighted in Table 5.
Thus, the focus of companies when implementing different sustainability improvement
practices was tested empirically. The statistical results confirmed three factors for economic
sustainability improvement practices, i.e., Cost, Market, and Growth; three factors for
environmental sustainability improvement practices, i.e., Ecosystem vitality, Environmental
health, and Environmental factors within production; and four factors for social sustainability
improvement practices, i.e., Governance, Education, Individual, and Community.
Table 5. The Rotated Component Matrixa on sustainability improvement practices
Sustainability improvement practices Component
1 2 3
Cost -.091 .829 .289
Market .106 .918 .053
Growth .217 .916 .059
Ecosystem vitality .247 .089 .860
Environmental health .231 .087 .893
Environmental factors within production .279 .248 .702
Governance .761 .224 .064
Education .707 .011 .220
Individual .830 -.013 .353
Community .801 .057 .242
Extraction Method: Principal Component Analysis.
Rotation Method: Varimax with Kaiser Normalization.
a. Rotation converged in 5 iterations.
4.5 Focuses of sustainability performance
Conducting the same analysis on the questions related to performance generated different
results. Only two components were found (see Table 6) using the same method of extraction.
The pattern that emerged suggested that economic performance could be rated as its own
category, and environmental sustainability and social sustainability could be combined into
one. In this case, the cross-loadings, especially between environmental sustainability and
economic sustainability, were much higher. The higher covariance between environmental
sustainability and economic sustainability could indicate a stronger tie between those two
than with social sustainability. However, the reason for this requires further investigation.
Extracting three components produced the same pattern as in Table 5, but with many
problematic cross-loadings. First, performance indicators correlated differently compared to

20
improvement practices. Second (but related), social and environmental performance were
more closely related than social and environmental improvement practices. In conclusion,
this factor analysis indicated that, when studying sustainability performance, we should
combine environmental and social sustainability and model them as a combined category.
Table 6. Rotated Component Matrixa on sustainability performance
Sustainability performance Component
1 2
Cost .187 .780
Market .245 .860
Growth .165 .893
Ecosystem vitality .701 .427
Environmental health .704 .451
Environmental factors within production .605 .415
Governance .704 .291
Education .760 .100
Individual .812 .213
Community .805 .024
Extraction Method: Principal Component Analysis.
Rotation Method: Varimax with Kaiser Normalization.
a. Rotation converged in 3 iterations.
4.6 Cluster analysis
As one research question suggests, it is useful to explore whether Swedish manufacturing
companies dedicate the same amount of effort to the various sustainability improvement
practices Thus, we chose a cluster analysis method for investigating the empirical evidence.
A K-means cluster analysis with three clusters was selected. Three clusters were chosen
partly due to the sample size, ensuring a reasonable number of expected responses in each
cluster. In addition, the choice of three clusters also reflected the factor analysis results in
three different components. As seen in Table 7, there were reasonable numbers of cases in
each cluster (36, 20, and 31 respectively). One interesting finding from the cluster analysis
was that 22.98% of the companies (20 out of 87, Cluster 2) made the same amount of effort
with respect to economic, environmental, and social improvement practices. The companies
in all clusters placed a good amount of emphasis on economic sustainability practices,
although Cluster 3 (last column in Table 7) had a significantly lower score in G01 Cost. The
companies in Cluster 1 (36 out of 87 companies) put relatively more effort into
environmental improvement practices, but less effort into social improvement practices. In
Cluster 3 (31 out of 87), companies put less effort into both environmental and social

21
improvement practices.
Table 7 also shows that the economic improvement practices were of common interest to all
companies, but the companies had mixed attitudes with regard to the other two types of
sustainability improvement practices (i.e., either interested in both, interested in one aspect,
or not interested at all). However, when further improvement practices need to be adopted,
many companies will first seek to implement environmental improvement practices, instead
of social ones. None of the clusters prioritized social improvement practices over
environmental ones.
We then used the empirical data to test whether a company that puts more effort into one
sustainability category performs better in the corresponding category. Alternatively, the
question is: does a company in Cluster 1, which puts more effort into environmental
sustainability, perform better in environmental sustainability than the companies in other
clusters? The cluster analysis was conducted, and the results are shown in Table 8. We should
note that, for this analysis, the clusters of the companies were based on sustainability
improvement practices, i.e., the results in Table 7. The values of the performance indicators
were calculated for each cluster. Overall, Cluster 2, which dedicated greater effort to all
aspects of sustainability practices than the other two clusters, also performed relatively better
in all dimensions except for Flexibility (G08). In terms of the companies in Clusters 1 and 3,
there was an indication that companies belonging to Cluster 1 outperformed those in Cluster
3 with respect to environmental sustainability performance (cf. G11 to G13 in Table 8). In
this case, there was no obvious difference with respect to the other sustainability performance
indicators.
Table 7. Final cluster centers on sustainability improvement practices Sustainability improvement practices 1 (N=36) 2 (N=20) 3 (N=31)
Cost (F01) 4.33 4.50 4.03
Market (F03) 4.08 4.60 4.03
Growth (F04) 4.14 4.70 4.00
Ecosystem vitality (F05) 3.17 4.10 1.81
Environmental health (F06) 3.58 4.30 2.03
Environmental factors within production (F07) 3.75 4.40 2.97
Governance (F08) 2.69 4.10 2.39
Education (F09) 3.03 3.80 2.39
Individuals (F10) 2.86 4.05 1.87
Community (F11) 2.89 4.30 2.16

22
Table 8. Performance indicators for clusters Sustainability performance 1 (N=36) 2 (N=20) 3 (N=31)
Cost (G01) 3.52 3.88 3.33
ROI (G02) 3.54 3.80 3.48
Economic stability (G03) 3.56 3.86 3.54
Market (G04) 3.70 3.94 3.65
Growth (G05) 3.43 3.80 3.50
Quality (G06) 4.00 4.00 3.76
Delivery (G07) 3.63 3.94 3.81
Flexibility (G08) 3.86 3.94 4.04
Product Innovation (G09) 3.60 3.88 3.46
Process Innovation (G10) 3.31 3.88 3.23
Ecosystem vitality (G11) 3.37 3.75 2.73
Environmental health (G12) 3.73 3.94 2.88
Environmental factors within production (G13) 3.73 4.06 3.19
Governance (G14) 3.46 4.19 3.12
Education (G15) 3.31 3.67 3.12
Individuals (G16) 3.40 3.73 3.00
Community (G17) 3.22 3.56 3.12
In a business context, we often think that companies should work on their weaknesses in
order to improve. However, these results suggest that we can also alternatively claim that
there is a benefit for companies when they dedicate more work to their strengths.
4.7 Relationship between practices and performance
We applied statistical analysis in order to investigate the relationship between sustainability
improvement practices and company performance. The results are shown in Table 9.
Generally speaking, each aspect of improvement practices indicated a strong correlation with
the corresponding performance area (sections A, B, C in Table 9).
First of all, when searching for correlations between economic practices and economic
performance, a Pearson test was used. As expected, we found very strong correlations
between all practices and performance indicators related to economic sustainability (financial
performance, see section A in Table 9). In addition, Cost improvement practices (F01) were
positively correlated with environmental sustainability performance, including Ecosystem
vitality (G11), Environmental health (G12), and Environmental factors within production
(G13). Consistent with the factor analysis, economic improvement practices in Growth (F04)
were positively correlated with all financial and environmental sustainability performance as
well as Governance (G14) and Education (G15) in social sustainability, and Process
innovation (G10). Market improvement practices (F03) were positively correlated with all of

23
the financial sustainability performance and environmental sustainability performance
indicators, including Ecosystem vitality (G11) and Environmental health (G12), as well as
social performance in Governance (G14).
The results regarding the relationship between environmental improvement practices and
environmental performance are shown in section B of Table 9. It is interesting to note that all
of the environmental improvement practices were positively and strongly significantly
correlated with environmental performance. These results indicate that higher levels of
environmental improvement practices are associated with better environmental performance.
This result is in line with the previous findings of the cluster analysis (refer to section 4.6).
The results for testing the relationship between social improvement practices and social
performance are shown in section C of Table 9. Most of the social improvement practices
were correlated positively and significantly with social performance. The same conclusion
can be drawn here that better social improvement practices are associated with better social
performance.
To analyze how the environmental improvement practices correlated to economic
performance, the same Pearson test was used, and the results are shown in Table 9. The
environmental improvement practices, including Environmental health (F06) and
Environmental factors within production (F07), were positively correlated with Process
innovation (G10). These results indicate that if companies pay more attention to the
environmental factors within production, e.g., better waste management, the introduction of
renewable raw materials, or better recycling of materials, their innovation performance will
be positively affected, especially in terms of process.
The relationship between social improvement practices and economic performance is also
presented in Table 9. Most of the social improvement practices did not necessarily correlate
with the companies’ economic performance. However, it is interesting to note that most
companies’ sustainable social improvement practices were correlated with their innovation
performance. For example, improvement practices in Education (F09) and Individual (F10)
improved companies’ performance in both Product innovation (G09) and Process innovation
(G10). Companies’ improvement practices in Governance (F08) improved companies’
performance in Process innovation (G10). These results suggest that investment in employees’
education and individual development programs can help companies to achieve better
innovation possibilities.

24
Table 9. The correlation between sustainability improvement practices and performance
indicators
From the statistical analysis, another interesting finding was that there were neither positive
nor negative correlations between sustainability improvement practices and operational
performance, such as Quality conformance to specification (G06), Delivery (G07), and
Flexibility (G08). Only Education (F09) had a positive, strong correlation with Quality
conformance to specification (G06). This result indicates that the investment in education,
such as employee training programs, has the potential to improve companies’ operational
performance, especially in terms of quality management.
Considering the relationship between different improvement practices and innovation
performance, we found some interesting results. Most economic, environmental, and social
improvement practices had strong and positive correlations with Process innovation (G10).
At the same time, as we discussed earlier, only two social improvement practices (i.e.,
Education (F09) and Individual (F10)) had positive correlations with Product innovation
(G09). This result is similar to that found in our previous research using companies’ GRI
(Global Reporting Initiative) reports [7]. In Chen et al.’s study, product innovation was found
F01 F03 F04 F05 F06 F07 F08 F09 F10 F11
A
G01 .264* .301
** .364
** .189 .282
* .347
** .203 .227
* .210 .118
G02 .265* .368
** .399
** .146 .198 .204 .281
* .116 .193 .048
G03 .309**
.332**
.434**
.048 .096 .128 .243* .212 .072 .091
G04 .333**
.329**
.410**
.108 .208 .213 .205 .108 .100 .067
G05 .189 .272* .318
** .090 .221 .162 .177 .028 .085 .070
G06 .130 .160 .154 .073 .032 .143 .131 .240* .086 .197
G07 .158 .119 .145 -.003 -.076 .035 .072 .098 .054 .141
G08 -.013 -.044 .011 -.021 -.044 .067 -.022 .047 -.049 -.001
G09 .015 .124 .201 .096 .088 .168 .161 .279* .277
* .179
G10 -.010 .183 .245* .189 .293* .228* .260* .320** .365** .190
B
G11 .348** .284* .297** .584** .518** .430** .223 .136 .297** .129
G12 .313** .344** .346** .481** .573** .452** .181 .182 .230* .083
G13 .378** .160 .276* .380** .403** .575** .301** .126 .217 .129
C
G14 .203 .298** .383** .256* .279* .394** .546** .207 .382** .328**
G15 -.023 .146 .231* .166 .166 .130 .240* .544** .304** .145
G16 .059 .164 .181 .235* .324** .292* .374** .294* .461** .394**
G17 .056 .029 .127 .088 .106 .194 .280* .262* .337** .464**

25
to be more closely related to environmental practices such as environmental design, specific
design targets/goals, and market surveillance. Thus, the results suggest that product
innovation is more closely associated with market-driven factors. Meanwhile, Process
innovation (G10), such as the implementation of cleaner technologies to prevent pollution
[33], is relatively easier for companies to achieve if they improve their internal production
processes.
With the subsequent step of data analysis, we investigated the correlation between overall
sustainability improvement practices and company performance. We calculated the sum of all
economic improvement practice scores for all of the companies in the sample, as well as the
aggregate scores for environmental improvement practices, social improvement practices,
and overall sustainability improvement practices. These scores (shown in the correlation
matrix in Table 10) were then compared as far as the companies’ operational performance,
innovation performance, and environmental performance were concerned. It can be seen that
overall sustainability improvement practices were correlated positively with financial
performance, operational performance, innovation performance, environmental performance,
and social performance.
Table 10. Correlation matrix for overall sustainability improvement practices and company
performance
1 2 3 4 5 6 7 8 9
1 Economic_improvement_practices 1
2 Environmental_improvement_practices .214* 1
3 Social_improvement_practices .271**
.657**
1
4 Financial_performance .117 .169 .293**
1
5 Operational_performance .083 .146 .282**
.899**
1
6 Innovation_performance .103 .201* .336
** .885
** .900
** 1
7 Environmental_performance .195 .349**
.299**
.831**
.804**
.864**
1
8 Social_performance .112 .215* .378
** .874
** .887
** .932
** .863
** 1
9 Sustainable_improvement_practices .595**
.824**
.885**
.329**
.299**
.345**
.403**
.371**
1
**. Correlation is significant at the 0.01 level (2-tailed).
*. Correlation is significant at the 0.05 level (2-tailed).
5. Discussion of the findings and their implications
As competition among companies continues to intensify, companies need to put more effort
into not only traditional economic practices, but also social and environmental ones, in order
to protect their competitive position and to meet the demand from different stakeholders.
However, it is still unclear as to whether there is a tangible return for those efforts in terms of

26
the three bottom line practices. This study attempted to provide answers to this question by
conducting a survey in the Swedish manufacturing industry.
Cluster analysis indicated different amounts of effort devoted to improving various types of
sustainability practices. When the Swedish companies in the sample implemented
sustainability practices, they often adopted economic improvement practices first and
foremost, followed by environmental practices. Social sustainability practices received
relatively less attention than the compared with other two areas. This may be due to the fact
that a global social accountability standard, such as SA8000, is less widespread in the
Swedish manufacturing industry than the environmental standard, such as ISO14000; or
companies might consider environmental improvement practices to be easier to implement
than social ones. However, such arguments need to be investigated further.
The study results also showed that some environmental and social improvement practices
were adopted in a diversified pattern. These included ecosystem vitality, environmental
health, governance, individuals, and community. Some manufacturers demonstrated proactive
attitudes toward sustainability practices, whereas others were more reactive. Nevertheless, in
terms of sustainability performance, the Swedish manufacturers in the sample showed a less
diversified pattern. The analysis also suggested that companies often assign economic
performance to a separate category when reviewing sustainability performance, while
combining environmental sustainability and social sustainability into one category.
Furthermore, the effort put into economic, social, and environmental practices were found to
have positive correlations with economic, social, and environmental performance,
respectively. Nevertheless, most social and environmental improvement practices were not
necessarily found to improve companies’ financial performance. However, it is interesting to
note that several environmental practices and social practices ha a positive relationship with
companies’ innovation performance, including product and process innovation. These
findings are in line with the results of authors’ previous research [7]. Finally, most
environmental and social improvement practices did not correlate with economic
improvement practices.
With regard to the configuration of sustainability strategy, only a limited number of Swedish
manufacturers had centralized control over all aspects of sustainability. When such an issue is
compared from the perspective of the three bottom lines, economic sustainability strategy

27
displayed the most centralized tendency, social sustainability strategy was often developed
locally, and environmental sustainability strategy showed a mixed pattern.
We should also note that, in this study, the Swedish manufacturing industry demonstrated a
relatively high level of process and product technology. Advancing at a high level of product
and process technology can ultimately benefit manufacturers in terms of both innovation
performance and environmental performance. This, perhaps, should be highlighted as the
competitive advantage of Swedish manufacturers.
This research offers a theoretical contribution by incorporating the operations strategy
perspective into sustainability aspects. According to Angell and Klassen [33], environmental
operations issues, such as pollution control, waste minimization, and reduce/reuse/recycle
policies, can be regarded as an additional component of operations strategy. In this survey,
we used environmental improvement practices to stand in for these environmental operations
issues that can be seen as an important part of a company’s overall operations strategy.
Moreover, social improvement practices can also be viewed as another important part of
companies’ operations strategy. Within the context of operations strategy, sustainable
development pressures can affect the operational management of value-adding activities.
Such sustainability pressures affect product and process issues across the whole production
chain. Again, these activities include material use, energy consumption, renewable resources,
waste generation, waste treatment, waste disposal, and recycling of material, energy, and
waste.
From this research, we can derive several managerial implications for operations
management. First of all, managers may need to increase their awareness of social
sustainability improvement practices, since their implementation is relatively lacking
compared with the other two dimensions. There is a need to investigate whether and how SA
8000 and other core social sustainability standards should be introduced into the
sustainability improvement control system, so that social sustainability will receive additional
attention. In addition, decision makers should put more effort into designing and employing
proactive or value seeking sustainable operations strategies for improving environmental,
social, and economic performance. In order to achieve product and process innovation and
sustain a competitive advantage, company managers should consider the strategic importance
of some social and environmental practices, for example, education and individual
development, as well as practices that improve environmental health. Furthermore, the
manufacturing industry should invest in product and process technology, since such

28
investments can finally help companies to achieve success in innovation and environmental
performance.
Although this survey focused on the manufacturing industry in Sweden, the results can be
useful for other industries. The idea of integrating and developing these sustainability
improvement practices into an overall operations strategy is still relatively new to many
companies. Thus, learning and benchmarking how other companies have introduced such
strategies and practices into their organizations should aid in more successful implementation
and execution [4]. Balancing people, planet, and profit is still a difficult task for
manufacturers. It requires the integration of different departments within the organizations, as
well as proper resource allocation. In addition, key performance indicators must include
sustainability aspects, so that sustainable management can be achieved.
6. Limitations and further research
There are still some limitations in this research. One limitation is the sample population,
which was restricted to Swedish manufacturing companies with more than 200 employees.
This was mainly due to the high willingness of mid- and large-sized companies to answer the
survey questions on sustainable operations, as well as the greater prominence/availability of
sustainability practices and the presence of a responsible person at these bigger companies.
We are uncertain as to whether the research results can be generalized to the entire
manufacturing industry, including relatively small manufacturing companies. Therefore, a
further survey in small manufacturing companies should be conducted. In addition,
sustainability concerns can vary in different (e.g., developed vs. developing) countries.
Therefore, one direction of future research could be to extend our study to other countries.
Consequently, it could be interesting to compare countries, particularly with those in
emerging markets. Finally, the impact of sustainable operations on a company’s performance,
both from short-term and long-term perspectives, could be investigated in future research. For
example, it could be further verified by conducting experiments in different industries, setting
control variables for the short and long run.

29
Appendix: List of variables in the questionnaire, all measured with a 5-point Likert
scale
1. Economic improvement practices in the following areas
F01. Cost e.g.: labor cost, energy cost, material cost, facility cost, and logistic cost
F02. Economic stability e.g.: favorable tax, exchange rate fluctuations
F03. Market e.g.: international markets and potential demand
F04. Growth e.g.: industry growth, competitiveness in the host region
2. Environmental improvement practices in the following areas
F05. Ecosystem vitality e.g.: Air pollution and water quality related to the ecosystem,
biodiversity protection, and climate change performance
F06. Environmental health e.g.: Environmental burden of disease, air pollution and water
quality related to humans
F07. Environmental factors within production e.g.: Material use, energy consumption,
renewable resources, waste generation, waste treatment, waste disposal, recycling of material,
energy, and waste
3. Social improvement practices in the following areas
F08. Governance e.g.: Corruption, political stability, trade and tariff barriers
F09. Education e.g.: General education level
F10. Individual e.g.: Civil liberties, human rights
F11. Community e.g.: Equity, safety, cohesion, local technology
4. Economic performance in the following areas
4.1 Financial performance
G01. Cost
G02. Return on investment
G03. Economic stability
G04. Market
G05. Growth
4.2 Operational performance
G06. Quality conformance to specification
G07. Delivery
G08. Flexibility
4.3 Innovation performance
G09. Product innovation
G10. Process innovation

30
5. Environmental performance in the following areas
G11. Ecosystem vitality
G12. Environmental health
G13. Environmental factors within production
6. Social performance in the following areas
G14. Governance
G15. Education
G16. Individual
G17. Community
31
References
[1] Kleindorfer PR, Singhal K, Wassenhove LN. Sustainable operations management.
Production and Operations Management 2005; 14(4): 482-92.
[2] Zhu Q, Sarkis J, Geng Y. Green supply chain management in China: pressures, practices
and performance. International Journal of Operations & Production Management 2005; 25(5):
449-68.
[3] Gupta MC. Environmental management and its impact on the operations function.
International Journal of Operations & Production Management 1995; 15(8): 34-51.
[4] Sarkis J. Manufacturing’s role in corporate environmental sustainability-concerns for the
new millennium. International Journal of Operations & Production Management 2001;
21(5/6): 666-86.
[5] Hanna MD, Newman WR. Operations and environment: an expanded focus for TQM.
International Journal of Quality & Reliability Management 1995; 12(5): 38-53.
[6] Montabon F, Sroufe R, Narasimhan R. An examination of corporate reporting,
environmental management practices and firm performance. Journal of Operations
Management 2007; 25(5): 998-1014.
[7] Chen L, Tang O, Feldmann A. Applying GRI reports for the investigation of
environmental management practices and company performance in Sweden, China and India.
Journal of Cleaner Production 2014.
[8] Carter CR. Ethical issues in international buyer–supplier relationships: a dyadic
examination. Journal of Operations Management 2000; 18(2): 191-208.
[9] Luo X, Bhattacharya CB. Corporate social responsibility, customer satisfaction, and
market value. Journal of Marketing 2006; 70(4): 1-18.
[10] Sharma S, Henriques I. Stakeholder influences on sustainability practices in the
Canadian forest products industry. Strategic Management Journal 2005; 26(2): 159-80.
[11] OECD. Innovation Policy and Performance: a Cross Country Comparison. Paris: OECD
Report; 2005.

32
[12] Chen L, Olhager J, Tang O. Manufacturing facility location and sustainability: A
literature review and research agenda. International Journal of Production Economics 2014;
149: 154-63.
[13] Gimenez C, Sierra V, Rodon J. Sustainable operations: their impact on the triple bottom
line. International Journal of Production Economics 2012; 140(1): 149-59.
[14] Brundtland GH. World Commission on Environment and Development: Our Common
Future. Oxford University Press; 1987.
[15] Elkington J. Cannibals with Forks: The Triple Bottom Line of Sustainability. Gabriola
Island: New Society Publishers; 1998.
[16] Barney J. Firm resources and sustained competitive advantage. Journal of Management
1991; 17(1): 99-120.
[17] Helfat CE, Peteraf MA. The dynamic resource‐based view: capability lifecycles.
Strategic Management Journal 2003; 24(10): 997-1010.
[18] Vachon S, Klassen RD. Green project partnership in the supply chain: the case of the
package printing industry. Journal of Cleaner Production 2006; 14(6): 661-71.
[19] Sarkis J, Zhu Q, Lai K. An organizational theoretic review of green supply chain
management literature. International Journal of Production Economics 2011; 130(1): 1-15.
[20] Zhu Q, Sarkis J. Relationships between operational practices and performance among
early adopters of green supply chain management practices in Chinese manufacturing
enterprises. Journal of Operations Management 2004; 22(3): 265-89.
[21] Hansmann K, Kroeger C. Environmental management policies: a comparison of reactive
and proactive approaches. Greener Manufacturing and Operations: From Design to Delivery
and Back 2001; 191(204): 14.
[22] Olson EM, Slater SF, Hult GTM. The importance of structure and process to strategy
implementation. Business Horizons 2005; 48(1): 47-54.

33
[23] Jänicke M. Ecological modernisation: new perspectives. Journal of Cleaner Production
2008; 16(5): 557-65.
[24] Murphy J, Gouldson A. Environmental policy and industrial innovation: integrating
environment and economy through ecological modernisation. Geoforum 2000; 31(1): 33-44.
[25] Zhu Q, Sarkis J, Lai K. Green supply chain management: pressures, practices and
performance within the Chinese automobile industry. Journal of Cleaner Production 2007;
15(11): 1041-52.
[26] Bowen FE, Cousins PD, Lamming RC, Farukt AC. The role of supply management
capabilities in green supply. Production and operations management 2001; 10(2): 174-89.
[27] Oh L, Teo H, Sambamurthy V. The effects of retail channel integration through the use
of information technologies on firm performance. Journal of Operations Management 2012;
30(5): 368-81.
[28] Podsakoff PM, MacKenzie SB, Lee J, Podsakoff NP. Common method biases in
behavioral research: a critical review of the literature and recommended remedies. Journal of
Applied Psychology 2003; 88(5): 879.
[29] Buckley MR, Cote JA, Comstock SM. Measurement errors in the behavioral sciences:
The case of personality/attitude research. Educational and Psychological Measurement 1990;
50(3): 447-74.
[30] Olhager J, Prajogo DI. The impact of manufacturing and supply chain improvement
initiatives: a survey comparing make-to-order and make-to-stock firms. Omega 2012; 40(2):
159-65.
[31] Nunnally JC, Bernstein IH, Berge JMT. Psychometric Theory. McGraw-Hill New York;
1967.
[32] Hair JF, Tatham RL, Anderson RE, Black W. Multivariate Data Analysis: Pearson
Prentice Hall Upper Saddle River, NJ; 2006.

34
[33] Angell LC, Klassen RD. Integrating environmental issues into the mainstream: an
agenda for research in operations management. Journal of Operations Management 1999;
17(5): 575-98.

VPAPER

1
Does supplier involvement affect Swedish manufacturers’ sustainability?
Lujie Chen, Ou Tang
Submitted to Journal of Business Ethics
An early version of this paper has been presented and received Purchasing
& Supply Management Best Paper Award at 6th European Decision
Sciences Institute Conference, 31 May to 3 June 2015, Taormina, Italy.

2

3
Does supplier involvement affect Swedish manufacturers’ sustainability?
Lujie Chen ([email protected])
Division of Production Economics, Department of Management and Engineering,
Linköping University, SE-581 83 Linköping, Sweden
Ou Tang
Division of Production Economics, Department of Management and Engineering,
Linköping University, SE-581 83 Linköping, Sweden
Abstract
This study examines the moderating role of supplier involvement in the focal
company’s sustainable initiatives. Survey methodology was used to collect data from
349 Swedish manufacturers. Partial least squares structural equation modeling was then
applied to analyze the causal relationships and moderating effects. The results showed
that there was a significant positive relationship between sustainable drivers and
sustainable improvement practices within the focal company itself. The focal
company’s sustainable improvement practices significantly contributed to its
sustainable performance. Moreover, the high levels of supplier involvement in
environment-related work significantly strengthened the relationship between the focal
company’s sustainable practices and performance. This study contributes to the
literature in the field of green supply chain management. The results indicate not only
that a “win-win” opportunity exists for members of the Swedish manufacturing industry
who implement sustainable practices, but also that organizational green capabilities can
be strengthened by cooperating with suppliers through organizational learning.
Keywords: Corporate social responsibility, Corporate sustainability, Empirical research,
Organizational sustainability cooperation, Structural equation model, Supplier
involvement, Sweden

4
1. Introduction
There is a growing interest among academics and practitioners in studying
sustainable supply chain management. Developing countries, such as China, have
dedicated a lot of effort to green supply chain management (Zhu et al., 2007, 2008; Zhu
and Sarkis, 2006, 2007). North America and Europe are also main clusters focusing on
green supply chain issues with the aim of sustaining societal development (Srivastava,
2007). For example, Sweden, as a typical developed European country, has set very
strict regulations regarding environmental protection and social justice across the whole
supply chain (Norrman and Jansson, 2004).
In these developed countries, external and internal stakeholders, such as
customers, government, local community, and non-governmental organizations (NGOs),
put a lot of pressure on companies to be more environmental and social friendly.
Moreover, stakeholders intensively investigate the companies’ environmental and social
performance concerning sustainability. If a company has misbehaviors related to
sustainability issues, its reputation can easily be damaged and its market share will
quickly be lost, impacting its overall economic performance. Recently, as many
European manufacturers have begun outsourcing overseas, companies must extend their
sustainability management not only to the focal company, but also to the suppliers and
their sustainable practices and performance. In other words, a significant part of
sustainability risk has shifted from direct and close control of the focal company to the
suppliers across a global supply chain (Caniëls et al., 2013). There are several cases
reporting such concerns: Apple’s supplier has had serious problems with hazardous
waste run-off and occupational health (Day et al., 2012); Coca Cola has been blamed for
using production water taken from public sources in India, damaging the local
community’s interests; Nike has been defamed for the environmentally unfriendly
performance of its global subcontractors (Parmigiani et al., 2011). Therefore, the sound
sustainable performance of a focal company might be destroyed by the inadequate level
of sustainable administration of its suppliers (Caniëls et al., 2013; Faruk et al., 2001).
To reduce these kinds of risks, companies should develop sustainable strategies
and operations technology that involve suppliers in the related sustainable work.
Meanwhile, the focal companies should help and support suppliers to comply with
environmental and social standards (Caniëls et al., 2013). However, it is still unclear
how supplier involvement affects the manufacturers’ sustainability. This problem still
5
has not been investigated extensively by researchers. Vachon and Klassen (2008)
conducted a survey in the North American manufacturing industry to examine the
environmental collaboration between suppliers and focal companies. Seuring and
Müller (2008) presented a literature review on the same issue. They claimed that
suppliers, focal companies, and customers are connected in supply chains, and the focal
companies should have the key responsibility for environmental and social performance.
There have been several other studies in this field focusing mainly on the focal
company’s sustainability drivers and performance (Henriques and Sadorsky, 1995, 1996,
1999), green purchasing (Green et al., 1998), and the focal company’s internal
environmental practices and performance (Zhu et al., 2005), among other issues.
However, the question of whether suppliers’ involvement in sustainable work
moderates the relationships between sustainable operations practices and performance
has not been assessed in depth, especially in Nordic countries. Therefore, this
investigation of supplier involvement is of notable academic and operational interest to
the manufacturing industry. It is often assumed that the involvement of various
suppliers in sustainable work will change the relationships between the practices and
associated performance of the focal companies. Understanding these moderating
relationships is useful for manufacturing managers, as it can enable them to decide on
cooperation strategies concerning suppliers and to address environmental, social,
economic, and operational issues. Therefore, this problem is critical to supply chain
management and sustainable management from strategic perspectives (Carter and
Rogers, 2008; Sanders, 2012).
To investigate the above research problem, we conducted empirical research
based on data collected from the Swedish manufacturing industry. This paper will be
structured as follows: First, the related literature and the conceptual model are presented.
We then describe how the data were collected and present the validity and reliability of
the data used in this study. The results of the analyses are presented in Section 4. The
final section discusses the theoretical and practical implications, and also describes the
potential directions for future research.
2. Related literature and conceptual model
2.1 The relationship between sustainability drivers and sustainability practices
Stakeholder theory contributes to the investigation of the relationship between
sustainability drivers and sustainable practices. As Freeman (1984, p. 46) defined, “A

6
stakeholder is any identifiable group or individual who can affect the achievement of an
organization’s objectives or who is affected by the achievement of an organization’s
objectives.” In the context of sustainable practice and performance, pressures from
various stakeholders can drive companies to adopt different environmentally friendly
practices and other socially friendly practices. In turn, these pressures will impact on the
related company performance. Zhu and Sarkis (2007) argued that environmentally
friendly supply chain management practices are positively associated with
organizational learning and management support, whereas pressures from stakeholders
can moderate this relationship. González-Benito and González-Benito (2006) conducted
a literature review to classify the determining factors in a company’s environmental
proactivity, including different practices and strategies. They found that stakeholder
pressures are one crucial determining factor.
Customers are often considered important stakeholders for companies. Customers
can influence companies’ adoption of environmentally friendly practices, for example,
due to their demand for more green products. There have been several studies showing
that customer concern is one key driver for companies implementing environmental
management practices. Henriques and Sadorsky (1996) also suggested that pressure
from customers contributes significantly to companies developing an environmental
plan. Khanna and Anton (2002) found that companies selling final products and in
closer contact with customers are more likely to have more comprehensive
environmental management practices than those companies producing intermediate
products.
According to the literature, stakeholders can also be categorized as external or
internal. The difference between external and internal stakeholders lies in their ability to
control critical organizational resources. Even though external stakeholders do not have
the ability to directly control critical organizational resources for the company, they do
have the capacity to impact public opinion on the company’s sustainable practice and
reputation (Sarkis et al., 2010; Sharma and Henriques, 2005). Such external
stakeholders include NGOs, government, regulators, and customers.
As suggested by Haanaes et al. (2011), we took line leaders into consideration in
our study since our respondents were manufacturing companies. (The definition of line
leaders will be given in section 3.2). Moreover, Haanaes et al. also considered the
advisory board to be a driver for company’s sustainable work. Regulators can be
7
important stakeholders, influencing companies to implement specific sustainable
management practices (Zhu and Sarkis, 2007). In sum, in this study, Government and
regulators, Advisory board, Line leaders, Advocacy organizations and NGOs, and
Customers are included as the main sustainability drivers.
Thus, based on stakeholder theory, we make the following hypothesis:
H1: There is a causal relationship between sustainability drivers and sustainable
improvement practices.
2.2 The relationship between sustainable practices and performance
There have been a number of studies exploring the relationship between
sustainable practices and performance. López et al. (2007) conducted a study on the
relationship between sustainable practices and company performance by investigating
the Dow Jones Sustainability Index. Zhu and Sarkis (2004) examined the relationships
between environmentally friendly practices and company performance, particularly
environmental and economic performance. Their focus was on Chinese manufacturing
companies. Zhu et al. (2005) also studied the Chinese manufacturing industry,
investigating the drivers, practices, and performance related to green supply chain
management. Vachon and Klassen (2008) analyzed environmental practices and
company performance in the package printing industry.
In an empirical investigation, Chen et al. (2014) examined the relationship
between environmental management practices and financial performance in the
manufacturing industry by using Global Reporting Initiative (GRI) reports and financial
reports. The results indicated that most environmental management practices have
positive correlations with a company’s financial performance. Chen et al. (2014)’s study
also suggested that managers should pay particular attention to product innovation,
since it correlates positively and significantly with environmental management at
tactical, strategic, and other levels.
Furthermore, Chen et al. (2015) conducted research to investigate the
relationship between the disclosure of corporate social performance and the financial
performance by carrying out a content analysis of 75 GRI reports. The research results
indicated that many CSR indicators, such as product responsibility, human rights, and
society, correlate positively and significantly with financial performance.
Schaltegger and Synnestvedt (2002) investigated the relationship between
environmental practices and economic success and suggested that there should be a

8
causal relationship between eco-efficiency and better company performance. According
to the above discussion, most of this research has suggested that the implementation of
sustainable practices will correlate to better sustainable performance; thus, we develop
the following research hypothesis:
H2: There is a causal relationship between sustainable improvement practices and
performance.
2.3 The moderating role of supplier
Although the development of green supply chain management has been growing,
it has done so mainly in Europe and North America (Srivastava, 2007). Currently, in EU
countries, most companies must comply with sustainable management systems, for
example, the EU Environmental Management and Auditing Scheme (EMAS, see Chen
et al., 2014). Other standards, such as ISO 14001, have also been implemented in the
daily practices of operations, purchasing, and supply chain managers. At the same time,
social standards, e.g., Social Accountability (SA) 8000 and Code of Conduct, have not
been as widely adopted (Seuring and Müller, 2008). Focal companies more frequently
require their suppliers to operate in line with environmental criteria than with social
criteria. In addition, suppliers’ work might be documented via related environmental
and social management systems, such as ISO 14001 and SA 8000. Suppliers will be
delisted if they cannot comply with these sustainability regulations. Employees at
supplier companies are trained for this environmental work across companies in order to
improve supply relations and the performance of both the focal company and supplier
company (Seuring and Müller, 2008).
The relational view and resource dependence theory can serve as the theoretical
background for investigating the moderating effects of supplier involvement in
environmental work. According to the relational view, organizational capabilities can be
strengthened by incorporating the existing resources of different organizations across
the whole supply chain through organizational learning (Dyer and Singh, 1998;
Takeishi, 2001; Vachon and Klassen, 2008). There have also been several empirical
studies supporting the relational view. Previous studies by Chen et al., (2004), Liker and
Wu, (2000), and Vachon and Klassen (2008) showed that if the focal companies have
better cooperation with their suppliers, the focal companies’ performance can be
enhanced. The reason is that suppliers and focal companies can cooperate and learn
from each other through inter-organizational learning, as suggested by the relational

9
view (Dyer and Singh, 1998). In this way, not only can company performance be
improved, but also the organizational capabilities can be strengthened (Dyer and Singh
1998; Kleindorfer et al., 2005).
Similarly, Resource dependence theory was first proposed by Emerson (1962)
then further developed by Pfeffer and Salancik (1978, p. 26-27) to suggest that
“organizations depend on others in their environment for resources to ensure their long
run viability.” It assumes that organizations must depend on other organizations to
protect strategically vital resources and reduce uncertainty and risks (Heide, 1994;
Singh et al., 2011). The resource exchange between suppliers and focal companies can
be applied as a mechanism to control and reduce possible environmental/social risks.
In light of these, we developed the following research hypotheses on the
moderating effect of supplier involvement in the focal company’s sustainable work
considering economic, environmental, and social aspects:
H3: Supplier involvement in the focal company’s economic work moderates the focal
company’s sustainable improvement practices and performance.
H4: Supplier involvement in the focal company’s environmental work moderates the
focal company’s sustainable improvement practices and performance.
H5: Supplier involvement in the focal company’s social work moderates the focal
company’s sustainable improvement practices and performance.
2.4 Conceptual model
According to the discussion above, we built a conceptual model (Fig.1) to
explore the moderating effects of supplier involvement in the relationship between
sustainability improvement practices and performance. In this investigation, the
relationship between sustainable drivers, sustainable practices, and sustainable
performance was our major concern. The conceptual model and the related items were
first developed based on the results of previous literature reviews (Chen et al., 2014;
Haanaes et al., 2011; Linton et al., 2007). Subsequently, this conceptual model and its
contents were verified by company managers and academic experts. More details of this
model will be given in section 3.2.

10
Fig. 1. The conceptual model for this research
3. Methods
3.1 Data collection
Swedish manufacturing companies made up the sample for this research. SCB
(Statistics Sweden) provided a list of those companies belonging to the manufacturing
industry. Previous research has suggested that larger companies have more resources
and larger scale operations, which enable greater innovation (Russo and Fouts, 1997).
Moreover, bigger companies are subject to greater public scrutiny, prompting greater
social responsiveness (Pfeffer and Salancik, 1978; Sharma and Henriques, 2005). Our
preliminary investigation also indicated that medium- and large-sized companies (more
than 200 employees) often have a professional manager who is responsible for
sustainable operations. Thus, in this study, we only targeted the middle- and large-sized
companies in the Swedish manufacturing industry with more than 200 employees;
smaller companies were excluded.
Frohlich (2002) and Huo et al. (2014) suggested that the response rate can be
improved by showing the respondents the value of the research, as well as
demonstrating the relevance of study to their companies. Therefore, the research
assistant made telephone calls to all of the sample companies before we sent the survey
by email. The research assistant introduced the main contents of this survey and the
possible managerial implications for the company over the phone. Moreover, the
research assistant also attempted to identify the most appropriate person at the company
to answer the survey questions. Through this step, 349 companies provided the

11
information, including name, email, and title, of the contact person. In the end, 101
useable surveys were returned with a response rate of 29%.
Common method bias can occur when the same methods are used for collecting
data (Oh et al., 2012; Podsakoff et al., 2003). The most popular and acceptable approach
for evaluating common method bias is Harman’s single-factor test (Buckley et al., 1990;
Podsakoff et al., 2003). The principal component analysis was conducted to load all of
the items used in this study into one factor with an unrotated factor solution. The test
results showed that 31.90% of variance was explained with all items loaded into a single
factor. Therefore, the common method bias was not detected in the dataset (see critical
value in Olhager and Prajogo, 2012).
3.2 Measures
According to the previous literature review (Chen et al., 2014) and the survey by
Haanaes et al. (2011), we developed constructs specifically for sustainability drivers,
supply chain involvement in different aspects of sustainability work, sustainability
improvement practices, and different aspects of sustainability performance, as shown in
Table 1. We used 5-point Likert scales to measure these constructs.
Sustainability drivers were measured using five items, as mentioned in section
2.1. According to the literature, line leaders can be defined as leaders of a specific
production line. They lead several non-leadership employees/operators in the module of
a factory. The advisory board is an organization of experts who have been selected to
help a company improve business operations, for example, doing sustainable work more
efficiently. There are two kinds of measurement models for latent constructs (Freeze
and Raschke, 2007). Reflective measures are caused by the latent constructs, whereas
formative measures cause the latent constructs (Freeze and Raschke, 2007). Thus, the
sustainability drivers can be viewed as formative constructs. Meanwhile, sustainability
improvement practices and sustainable performance can be seen as reflective constructs.
The validity and reliability of these constructs are further discussed in the following part.
Table 1. Constructs and related items used in this research
Constructs Items Code
Sustainability drivers Government and regulators B11
Advisory board B12
Line leaders B13
Advocacy organizations and NGOs B14
Customers B15

12
Supply chain
involvement in
different aspects
work
Supplier involvement in economic-related work C09
Supplier involvement in environmental-related
work
D07
Supplier involvement in social-related work E09
Economic
sustainability
improvement
practices
Cost e.g.: labor cost, energy cost, material cost,
facility cost, and logistics cost
F01
Economic stability e.g.: favorable tax, exchange
rate fluctuations
F02
Market e.g.: international markets and potential
demand
F03
Growth e.g.: industry growth, competitiveness in
the host region
F04
Environmental
sustainability
improvement
practices
Environmental improvement practices in
ecosystem vitality
F05
Environmental improvement practices in
ecosystem vitality
F06
Environmental improvement practices in
production
F07
Social sustainability
improvement
practices
Governance e.g.: Corruption, political stability,
trade and tariff barriers
F08
Education e.g.: General education level F09
Individual e.g.: Civil liberties, human rights F10
Community e.g.: Equity, safety, cohesion, local
technology
F11
Financial
performance
Cost e.g.: labor cost, energy cost, material cost,
facility cost, and logistics cost
G01
Return on investment G02
Economic stability e.g.: favorable tax, exchange
rate fluctuations
G03
Market e.g.: international markets and potential
demand
G04
Growth e.g.: industry growth, competitiveness in
the host region
G05
Operational
performance
Quality conformance to specification G06
Delivery G07
Flexibility G08
Innovation
performance
Product innovation G09
Process innovation G10
Environmental
sustainability
performance
Environmental performance in ecosystem vitality G11
Environmental performance in environmental
health
G12
Environmental performance in production G13
Social sustainability
performance
Social performance in governance G14
Social performance in education G15
Social performance in individual G16
Social performance in community G17

13
3.3 Data Analysis
The partial least squares (PLS) method, which is a second-generation
multivariate analysis (Fornell and Larcker, 1987), was applied in this study. The
software SmartPLS 3.0 was used for the PLS data analysis. PLS analysis has different
characteristics compared to the first generation of regression-based analysis. PLS
analysis is a kind of maximum likelihood variance-based Structural Equation Modeling
(SEM) tool that can model relationships among multiple dependent and independent
constructs simultaneously (Haenlein and Kaplan, 2004). PLS regression analysis
generalizes and combines features from multiple regression analysis and principal
component analysis, and can maximize predictive accuracy (Abdi, 2003).
We chose PLS as the main data analysis method because of the modeling
features and sample size of this research. More specifically, PLS analysis allowed us to
integrate the measurement and the related structural models (Bollen, 2014; Thatcher and
Perrewe, 2002). This method can measure the unobserved (latent) variables, as well as
reflective and formative constructs (Hair et al., 2011). In this research, sustainability
drivers, sustainability practices, and sustainability performance were modeled as latent
variables. Moreover, the sustainability drivers were modeled as formative constructs.
Nevertheless, the first-generation SEM tools, such as covariance-based ones, are limited
in their ability to describe formative constructs (Hair et al., 2011; Zhang et al., 2014).
The sample size requirement was another reason for selecting PLS regression
analysis, since the method is more suitable than traditional SEM techniques for handling
smaller sample sizes. The sample size in this research satisfies the rule of thumb that it
should be at least ten times larger than the largest number of structural paths directed at
any one construct (Chin et al., 2003; Oh et al., 2012). The rule of thumb for covariance-
based SEM states that the sample size should be at least five times the number of
indicators estimated (Bentler and Chou, 1987). To be more specific, due to the
complexity of this research model, the sample size had to be at least 180 respondents for
applying the covariance-based SEM; with the PLS method, the sample number could be
reduced to 40, which is ten times the maximum number of path relationships directed at
a particular construct (Hair et al., 2011).
Lastly, the research objective was another motivating factor for us to choose
PLS as the main data analysis method. Our research focuses on the causal relationships
between sustainability drivers, sustainable improvement practices, and performance.

14
PLS regression analysis is quite suitable for examining causal effect relationships
among different latent constructs (Hair et al., 2011). Moreover, our research is not only
exploratory, but also focused on theory development. Thus, PLS is a better choice, since
this approach is especially useful for exploratory research, as well as predictive and
theory development (Ringle et al., 2012; Hair et al., 2011).
In the following discussions, we validate the measurement model and then
discuss the structural model results. The measurement model in this research can be
divided into a formative measurement model and a reflective measurement model.
Reflective measurement models can be assessed using different statistical criteria:
Cronbach’s alpha for composite reliability and internal consistency reliability
Indicator loadings for indicator reliability
Average variance extracted (AVE) for convergent validity
Heterotrait-monotrait ratio (HTMT) for testing the discriminant validity
On the other hand, according to Jarvis et al. (2003), when the causality direction is from
items to construct, the construct should be formative. Thus, sustainability drivers should
be modeled as formative constructs in this research. Checking the validity of formative
constructs included testing the variance inflation factor (VIF) to avoid multicollinearity
and testing the indicator weights to approve the validity.
4. Results
4.1 Measurement model
The reliability and validity of the reflective constructs are shown in Table 2.
Three tests were applied to determine the convergent validity and internal consistency
reliability of the ten reflective constructs: AVE of a construct, the construct’s composite
reliability, and the construct’s Cronbach’s Alpha. Urbach and Ahlemann (2010, p. 19)
stated, “Convergent validity concerns the level to which individual items are indicating
a construct converge in contrast to items measuring various constructs.” Fornell and
Larcker (1981) introduced average variance extracted (AVE) as a criterion for
convergent validity. The AVE values (shown in Table 2) were all above 0.5, indicating
that a latent variable is on average adequate to explain more than half of the variance of
its indicators. Therefore, all of the constructs in the reflective measurement showed
sufficient convergent validity. Composite Reliability and Cronbach’s Alpha were
employed to measure the internal consistency. Most constructs were above the
recommended threshold value of 0.7 (Chin, 1998), except for sustainable practice,

15
which was very close with a value of 0.694 (considered to be an acceptable level, Hair
et al., 1998). The result indicated proper internal consistency in the first and second
orders.
According to Chin (1998), to verify the indicator reliability, all of the indicators
loaded in the reflective model should be higher than 0.7 with a significance of at least
0.05 (T Statistics larger than 1.96). As shown in Table 3, all of the indicators in the
reflective model passed the reliability test. In other words, more than 70% of the
indicators’ variance was explained by the corresponding latent variable.
To check the discriminant validity, the examination of cross-loadings and the
Fornell-Larcker criterion are the most common approaches (Urbach and Ahlemann,
2010). However, as indicated in the latest research by Henseler et al. (2014), these two
approaches are not reliable in many research situations: the Fornell-Larcker criterion
tests whether the AVE is bigger than the square of constructs correlation. However,
according to the research and simulation analysis by Hui and Wold (1982) and
Lohmöller (1989), variance-based SEM methods, such as PLS, are likely to
overestimate indicator loadings (Henseler et al., 2014). Moreover, PLS methods in
general are likely to underestimate the structural model relationships (Marcoulides et al.,
2012). Therefore, PLS methods tend to pass the Fornell-Larcker criterion easily.
Considering the examination of cross-loadings, the PLS regression method
examines each independent latent construct respectively, and then checks the entire
SEM. Thus, the loadings will be inflated in the cross-loadings (Henseler et al., 2014).
This is a potential drawback for conducting cross-loadings to check the discriminant
validity in a PLS approach. Henseler et al. (2014), in fact, suggested a stricter rule, the
heterotrait-monotrait ratio (HTMT) of the correlations, for testing the discriminant
validity. HTMT tests the correlations of indicators across constructs measuring different
phenomena. The advantage of the HTMT method is that it is not necessary to have
factor loadings first. Therefore, it avoids the potential problems of inflated cross-
loadings and regression dilution (Henseler et al., 2014). Therefore, we calculated the
HTMT ratios for all of the first-order latent constructs, with the results shown in Table 4.
To validate the formative constructs, we used a bootstrapping procedure to obtain the
significance level of all of the indicator weights. The results are shown in Table 5. Most
of these formative indicators were at the acceptable level (see the value suggested by
Chin, 1998), except for the driver Line leaders. Thus, we deleted this factor from the

16
subsequent analyses. Meanwhile, although the weight for the driver Government and
regulators had a value slightly lower than 0.2, according to previous research (Caniëls
et al., 2013; Large and Thomsen 2011; Zhu and Sarkis 2006, 2007; Zhu et al., 2007),
government and regulatory pressures cannot be neglected when studying sustainability
drivers/pressures. As suggested by Hair et al., (2014), if an indicator has a high
theoretical relevance, it should be retained. Thus, considering its theoretical relevance
based on previous research, we decided to retain Government and regulators in the
subsequent analyses. Then, we calculated the variance inflation factor (VIF) to avoid the
multicollinearity among the formative indicators (Fornell and Bookstein, 1982). All
these values were well below the threshold value of 10 suggested by Hair et al. (2014).
Table 2. Internal consistency reliability and convergent validity for the reflective measurement
models First order AVE Composite
Reliability
Cronbach’s
Alpha
Second order AVE Composite
Reliability
Cronbach’s
Alpha
Environmental
improvement
practices
0.752 0.901 0.833 sustainable
practice 0.622 0.831 0.693
Economic
improvement
practices
0.654 0.882 0.819
Social
improvement
practices
0.660 0.886 0.826
Financial
performance 0.651 0.903 0.865 sustainable
performance 0.573 0.870 0.812
Operational
performance 0.647 0.846 0.726
Innovation
performance 0.814 0.897 0.773
Environmental
performance 0.782 0.915 0.859
Social
performance 0.647 0.879 0.816
Table 3. Indicator reliability (Meanings of variables are listed in Table 1 and the Appendix) Construct Item loadings T Statistics
Economic improvement practices
F01 0.772 11.073
F02 0.681 12.554
F03 0.872 22.943
F04 0.894 35.151
Environmental improvement practices
F05 0.874 32.237
F06 0.920 54.602
F07 0.803 15.288
Social improvement practices
F08 0.781 14.751
F09 0.741 13.848
F10 0.898 48.690

17
F11 0.822 19.200
Financial performance
G01 0.744 9.155
G02 0.793 13.967
G03 0.802 13.694
G04 0.842 26.114
G05 0.847 28.822
Operational performance
G06 0.840 17.818
G07 0.851 13.013
G08 0.715 9.669
Innovation performance
G09 0.886 34.079
G10 0.918 63.409
Environmental performance
G11 0.927 55.914
G12 0.918 44.935
G13 0.803 12.547
Social performance
G14 0.785 14.564
G15 0.733 10.393
G16 0.867 26.655
G17 0.826 13.922
Table 4. Correlations and Heterotrait-Monotrait Ratio (HTMT) 1 2 3 4 5 6 7 8
1.Economic improvement practices
2.Environmental improvement practices 0.413
3.Environmental performance 0.420 0.676
4.Financial performance 0.535 0.264 0.608
5.Innovation performance 0.200 0.252 0.619 0.560
6.Operational performance 0.111 0.039 0.406 0.598 0.656
7.Social improvement practices 0.389 0.669 0.261 0.215 0.360 0.139
8.Social performance 0.272 0.339 0.701 0.479 0.709 0.469 0.538
Table 5. Variance inflation factors (VIF) and weights for formative scales
Construct Items VIF Weight P-value
Sustainable drivers Government and regulators 1.367 0.183 0.233
Advisory board 1.742 0.416 0.005
Advocacy organizations and NGOs 1.415 0.537 0.000
Customers 1.154 0.237 0.085
4.2 Structural model
The structural model was tested by performing SmartPLS. The hierarchical
analysis results and moderation results are shown in Fig. 2. We made R2 stand for each
dependent construct’s coefficients of determination. Those values (R2) indicated

18
whether the independent variables of the model explained substantial variance of this
construct. According to the criteria by Chin (1998), the coefficients of determination
shown in Fig.2 were medium (R2=0.4) and small (R
2=0.314). This result confirmed that
the structural model was acceptable.
The path relationships (standardized beta coefficients of least squares
regressions) of the structural model could be assessed by means of performing
bootstrapping (Urbach and Ahlemann, 2010). The significance of the estimators of the
proposed model could be obtained by calculating t-statistics. Thus, bootstrapping using
5,000 samples (Hair et al., 2014) was performed to estimate the statistical significance
of the structural paths by calculating the t-values. The results of the path coefficients are
shown in Fig. 2.
The results of the significant paths provided empirical support for the two
proposed causal relationships, as well as one moderating effect, as Table 6 presents. The
regression coefficients were in the predicted direction with predicted significance levels,
with the exception of the moderating effects of supplier involvement in the focal
company’s economic work and supplier involvement in the focal company’s social
work. The possible reason for this is that most Swedish manufacturers have
implemented very strict environmental assessment and control systems for their
suppliers. However, they do not have sophisticated and mature auditing systems
concerning the social aspects compared to the environmental ones. Very similar to
German manufacturers, most Swedish manufacturing companies follow the EU Eco-
Management and Auditing Scheme (EMAS) and ISO 140001 standard (Wagner, 2007).
Moreover, other environmental restrictions have been set by the European Union. For
example, the restriction of hazardous substances (RoHS) has been implemented for
waste electrical and electronic equipment (WEEE) (Chen et al., 2014; Tseng, 2013).
These regulations help the focal companies in Sweden to guide and help their suppliers
across the whole supply chain to achieve better environmental performance. In effect,
the suppliers can be more involved in the focal companies’ environmental improvement
practices by following these environmental regulations and restrictions.

19
*p<0. 1.
**p<0.05.
***p<0.001. Fig. 2. Structural model with path coefficient estimates.
We applied a blindfolding method with an omission distance of 7 in order to test
the predictive relevance of this structural model (Hair et al., 2014). All Q2 values
obtained were higher than zero. Thus, the structural model achieved satisfactory
predictive power.
The effect size f2 measures whether an independent latent variable has a
substantial impact on a dependent latent variable (Cohen, 2013; Urbach and Ahlemann,

20
2010). The f2
in this structural model was calculated using the PLS algorithm. The
results showed that for the endogenous latent variable sustainable performance, the f2 of
sustainable improvement practice was 0.225, signifying relatively medium effects (Chin,
2010; Cohen, 2013). For sustainable improvement practices, only the variable
sustainable drivers exhibited large effects (with f2 values equal to 0.667).
Table 6. The results of hypothesis testing
Hypothesis Contents Results T -Value
H1 There is causal relationship between sustainability drivers
and sustainable improvement practices
Support 9.712***
H2 There is causal relationship between sustainable
improvement practices and performance.
Support 4.342***
H3 Supplier involvement in the focal company’s economic
work moderates the focal company’s sustainable
improvement practices and performance.
Reject 0.435
H4 Supplier involvement in the focal company’s environmental
work moderates the focal company’s sustainable
improvement practices and performance.
Support 1.656*
H5 Supplier involvement in the focal company’s social work
moderates the focal company’s sustainable improvement
practices and performance.
Reject 1.453
*p<0. 1.
**p<0.05.
***p<0.001.
Therefore, we can conclude that Swedish manufacturers have developed their
sustainable awareness because of internal and external drivers from government and
NGOs, and customer needs. Moreover, this awareness has translated into powerful
sustainable improvement practice adoption. Meanwhile, some of these practices have
contributed to several areas of sustainable performance, including economic,
environmental, and social aspects. However, this contribution is still at the mid-level.
We can see that a “win-win” opportunity exists for members of the Swedish
manufacturing industry who implement sustainable practices. These practices appear to
be achieving what is anticipated of them based on their causal and positive relationships
with overall company performance. But how to further expand these kinds of positive
effects remains an interesting question for these companies and academic research. For
example, what weaknesses can be found in Swedish manufacturers when they are
implementing sustainable improvement practices? Do sustainable management tools
need to be enhanced? Or do personal skills need to be developed?
4.3 The effects of supplier involvement on the environmental focus

21
As discussed in the previous part, we found that supplier involvement in the
focal company’s environmental work moderated the relationship between the focal
company’s sustainable improvement practices and performance. However, we still did
not know how these moderating effects influenced the focal company. For instance, did
they affect the environmental improvement practices or environmental performance?
Thus, a t-test via statistical packages (SPSS) was conducted. The sample was split into
two groups based on the level of supplier involvement in the environmental-related
work identified by the respondents. Of the 101 respondents, 48 companies reported a
high level of supplier involvement in the environmental-related work, whereas 51
reported a low level. Two respondents did not answer this specific question. Then, we
used the t-test to compare these two groups of companies with respect to their
environmental improvement practices in ecosystem vitality, environmental
improvement practices in environmental health, and environmental improvement
practices in production, product, and process innovation performance, and their
corresponding environmental performance in ecosystem vitality, environmental health,
and production. These results are presented in Table 7.
There were no significant differences between these two groups of companies
concerning environmental performance. Meanwhile, there were significant differences
regarding environmental improvement practices, especially in ecosystem vitality and in
environmental health. Therefore, the results suggest that companies with different levels
of supplier involvement do things differently in terms of their emphasis on different
environmental improvement practices; at the same time, the results do not suggest that
there is a difference in the level of environmental-related performance achieved. Thus,
the involvement of various suppliers in the environmental issues will cause the
relationships between implemented practices and related performance to vary in the
focal companies, mainly since suppliers affect the focal companies’ environmental
improvement practices. For countries with very strict environmental regulation systems,
managers of the focal companies will choose suppliers based not only on their ability to
fulfill environmental regulations, but also their ability to cooperate efficiently on
environmental practices in the long run (Caniëls et al., 2013). Thus, suppliers also have
the motivation to invest time and money to involve themselves in the focal companies’
environmental improvement practices, such as environmental quality management.
Meanwhile, as Caniëls et al. (2013) stated, Several manufacturers develop their
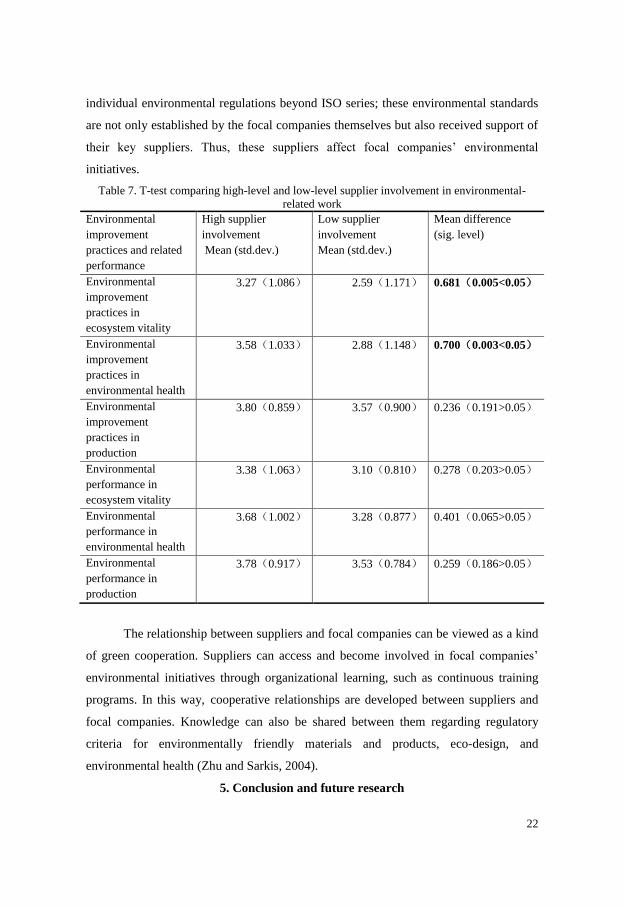
22
individual environmental regulations beyond ISO series; these environmental standards
are not only established by the focal companies themselves but also received support of
their key suppliers. Thus, these suppliers affect focal companies’ environmental
initiatives.
Table 7. T-test comparing high-level and low-level supplier involvement in environmental-
related work
The relationship between suppliers and focal companies can be viewed as a kind
of green cooperation. Suppliers can access and become involved in focal companies’
environmental initiatives through organizational learning, such as continuous training
programs. In this way, cooperative relationships are developed between suppliers and
focal companies. Knowledge can also be shared between them regarding regulatory
criteria for environmentally friendly materials and products, eco-design, and
environmental health (Zhu and Sarkis, 2004).
5. Conclusion and future research
Environmental
improvement
practices and related
performance
High supplier
involvement
Mean (std.dev.)
Low supplier
involvement
Mean (std.dev.)
Mean difference
(sig. level)
Environmental
improvement
practices in
ecosystem vitality
3.27(1.086) 2.59(1.171) 0.681(0.005<0.05)
Environmental
improvement
practices in
environmental health
3.58(1.033) 2.88(1.148) 0.700(0.003<0.05)
Environmental
improvement
practices in
production
3.80(0.859) 3.57(0.900) 0.236(0.191>0.05)
Environmental
performance in
ecosystem vitality
3.38(1.063) 3.10(0.810) 0.278(0.203>0.05)
Environmental
performance in
environmental health
3.68(1.002) 3.28(0.877) 0.401(0.065>0.05)
Environmental
performance in
production
3.78(0.917) 3.53(0.784) 0.259(0.186>0.05)

23
This research has several managerial implications. First of all, the findings
further validate that sustainable improvement has a significant, positive influence on
overall sustainable performance. Therefore, “win-win” opportunities do exist in the
Swedish manufacturing industry, especially among larger companies. These results are
also consistent with previous studies by Zhu et al. (2008). Although Zhu et al. (2008)
focused on the context of a developing country, they achieved similar results. Therefore,
the findings from this study suggest that a green opportunity also exists in developed
countries such as Sweden. This knowledge can help those manufacturing companies
that are resisting the sustainable challenge to be more proactive in future
environmentally and socially friendly work. They should recognize the value of
sustainable improvement practices and green cooperation with suppliers. Secondly, the
results also indicate that sustainable strategic goals should be shared with suppliers. An
organization should develop a sustainable-oriented culture to promote an organizational
learning environment. Furthermore, companies should generate sustainable
improvement practices and tools. In doing so, the performance of the whole
organization will be improved.
Thirdly, supplier involvement in the focal company’s environmental work
enhances the relationship between a focal company’s sustainable improvement practices
and its performance. This is a very interesting finding not only for academia, but also
for manufacturing companies. There are many manufacturers outsourcing their
production to low-cost countries, such as those in Eastern Europe, China, and South-
East Asia. Therefore, it is difficult for these companies (Lindgreen et al., 2009) to check
whether their supplier has the same level of concern and ability to do sustainable work.
The sustainable performance of the supplier will also affect the focal company’s
reputation and interests. Thus, we also suggest that, in order to achieve better
sustainable performance, companies need to incorporate sustainable culture into the
whole supply chain. Sustainable needs should not be seen as an add-on for the
company’s strategy, but should be considered an integral part of all operations
departments, and inshore and offshore suppliers (Lindgreen et al., 2009).
This research had several limitations that provide the opportunity for future
avenues of research. First of all, we only focused on the Swedish manufacturing
industry. Sweden is a developed country that has very strict regulations, especially in
terms of environmental protection and green manufacturing. Whether these results are

24
generalizable to developing countries still needs to be examined. A cross-industry and
cross-country survey should be conducted in order to generate more samples for
comparison. Moreover, a longitudinal analysis could help researchers to investigate
whether these effects are enhanced or diminished over the years. In this research, we
only considered supplier involvement; we did not incorporate the impact of customers.
Therefore, we plan to conduct follow-up research including customers alongside
suppliers and focal companies so as to better comprehend sustainable supply chain
management. Moreover, it would be interesting to better understand the types of
diffusion mechanisms and learning processes that occur between suppliers, focal
companies, and customers. A multiple case study could help to uncover these
mechanisms.
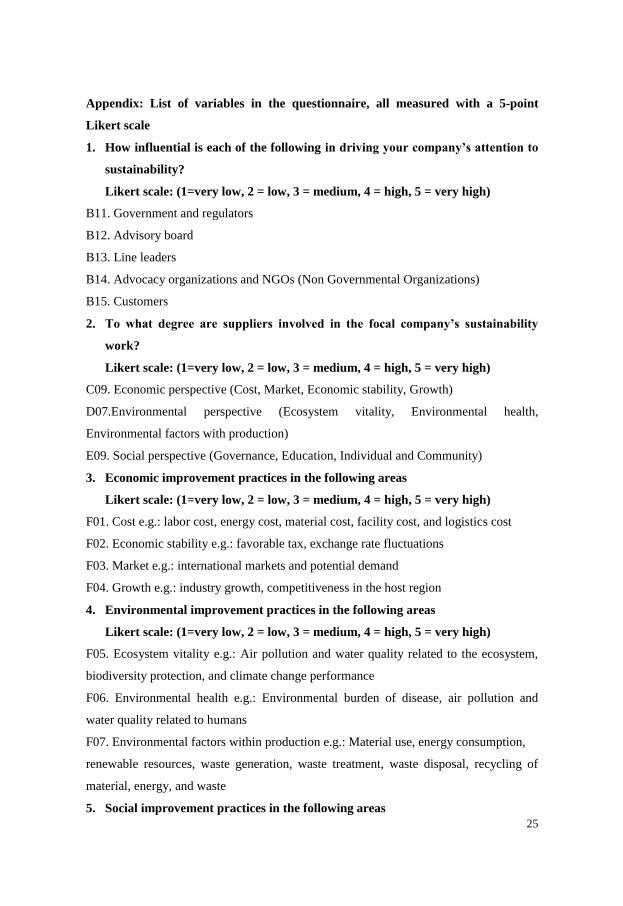
25
Appendix: List of variables in the questionnaire, all measured with a 5-point
Likert scale
1. How influential is each of the following in driving your company’s attention to
sustainability?
Likert scale: (1=very low, 2 = low, 3 = medium, 4 = high, 5 = very high)
B11. Government and regulators
B12. Advisory board
B13. Line leaders
B14. Advocacy organizations and NGOs (Non Governmental Organizations)
B15. Customers
2. To what degree are suppliers involved in the focal company’s sustainability
work?
Likert scale: (1=very low, 2 = low, 3 = medium, 4 = high, 5 = very high)
C09. Economic perspective (Cost, Market, Economic stability, Growth)
D07.Environmental perspective (Ecosystem vitality, Environmental health,
Environmental factors with production)
E09. Social perspective (Governance, Education, Individual and Community)
3. Economic improvement practices in the following areas
Likert scale: (1=very low, 2 = low, 3 = medium, 4 = high, 5 = very high)
F01. Cost e.g.: labor cost, energy cost, material cost, facility cost, and logistics cost
F02. Economic stability e.g.: favorable tax, exchange rate fluctuations
F03. Market e.g.: international markets and potential demand
F04. Growth e.g.: industry growth, competitiveness in the host region
4. Environmental improvement practices in the following areas
Likert scale: (1=very low, 2 = low, 3 = medium, 4 = high, 5 = very high)
F05. Ecosystem vitality e.g.: Air pollution and water quality related to the ecosystem,
biodiversity protection, and climate change performance
F06. Environmental health e.g.: Environmental burden of disease, air pollution and
water quality related to humans
F07. Environmental factors within production e.g.: Material use, energy consumption,
renewable resources, waste generation, waste treatment, waste disposal, recycling of
material, energy, and waste
5. Social improvement practices in the following areas

26
Likert scale: (1=very low, 2 = low, 3 = medium, 4 = high, 5 = very high)
F08. Governance e.g.: Corruption, political stability, trade and tariff barriers
F09. Education e.g.: General education level
F10. Individual e.g.: Civil liberties, human rights
F11. Community e.g.: Equity, safety, cohesion, local technology
6. Economic performance in the following areas
Likert scale: (1=very poor, 2 = poor, 3 = fair, 4 = good, 5 = excellent)
6.1 Financial performance
G01. Cost
G02. Return on investment
G03. Economic stability
G04. Market
G05. Growth
6.2 Operational performance
G06. Quality conformance to specification
G07. Delivery
G08. Flexibility
6.3 Innovation performance
G09. Product innovation
G10. Process innovation
7. Environmental performance in the following areas
G11. Ecosystem vitality
G12. Environmental health
G13. Environmental factors within production
8. Social performance in the following areas
G14. Governance
G15. Education
G16. Individual
G17. Community

27
References
Abdi, H. (2003). Partial least squares regression (PLS-Regression). In M. Lewis-Beck,
A. Bryman, & T. Futing (eds.), Encyclopedia for research methods for the social
sciences, (pp. 792-795). Thousand Oaks, CA: Sage.
Bollen, K. A. (2014). Structural equations with latent variables. New York, NY: John
Wiley & Sons.
Carter, C. R., & Rogers, D. S. (2008). A framework of sustainable supply chain
management: Moving toward new theory. International Journal of Physical Distribution
& Logistics Management, 38(5), 360-387.
Caniëls, M. C. J., Gehrsitz, M. H., & Semeijn, J. (2013). Participation of Suppliers in
Greening Supply Chains: An Empirical Analysis of German Automotive Suppliers.
Journal of Purchasing and Supply Management, 19(3), 134-143.
Chen, L., Olhager, J., & Tang, O. (2014). Manufacturing facility location and
sustainability: A literature review and research agenda. International Journal of
Production Economics, 149, 154-163.
Chen, L., Tang, O., & Feldmann, A. (2014). Applying GRI reports for the investigation
of environmental management practices and company performance in Sweden, China
and India. Journal of Cleaner Production, 98, 36-46.
Chen, L., Feldmann, A., & Tang, O. (2015).The relationship between disclosures of
corporate social performance and financial performance: Evidences from GRI reports in
manufacturing industry. International Journal of Production Economics, accepted, DOI:
10.1016/j.ijpe.2015.04.004
Chin, W. W. (1998). The partial least squares approach to structural equation modeling.
Modern Methods for Business Research, 295(2), 295-336.

28
Chin, W. W. (2010). How to write up and report PLS analyses. In V. Esposito Vinzi, W.
W. Chin, J. Henseler, & H. Wang (eds.), Handbook of partial least squares: concepts,
methods and applications in marketing and related fields (pp. 655-690). Berlin,
Germany: Springer.
Chin, W. W., Marcolin, B. L., & Newsted, P. R. (2003). A partial least squares latent
variable modeling approach for measuring interaction effects: Results from a Monte
Carlo simulation study and an electronic-mail emotion/adoption study. Information
Systems Research, 14(2), 189-217.
Cohen, J. (2013). Statistical power analysis for the behavioral sciences (Rev. Ed.). New
York, NY: Academic Press.
Day, J. M., Melnyk, S. A., Larson, P. D., Davis, E. W., & Whybark, D. C. (2012).
Humanitarian and disaster relief supply chains: A matter of life and death. Journal of
Supply Chain Management, 48(2), 21-36.
Dyer, J. H., & Singh, H. (1998). The relational view: Cooperative strategy and sources
of interorganizational competitive advantage. Academy of Management Review, 23(4),
660-679.
Emerson, R.M. (1962).Power-dependence relations, American Sociological Review, 27
(1), 31-41.
Faruk, A. C., Lamming, R. C., Cousins, P. D., & Bowen, F. E. (2001). Analyzing,
mapping, and managing environmental impacts along supply chains. Journal of
Industrial Ecology, 5(2), 13-36.
Fornell, C., & Bookstein, F. L. (1982). Two structural equation models: LISREL and
PLS applied to consumer exit-voice theory. Journal of Marketing Research, 19(4), 440-
452.
29
Fornell, C., & Larcker, D. F. (1981). Evaluating structural equation models with
unobservable variables and measurement error. Journal of Marketing Research, 18(1),
39-50.
Fornell, C., & Larcker, D. F. (1987). A second generation of multivariate analysis:
Classification of methods and implications for marketing research. Review of
Marketing, 1, 407-450.
Freeman, R. E. (1984). Strategic management: A stakeholder approach. Pitman,Boston,
Massachusetts.
Freeze, R.D., & Raschke, R.L. (2007). An assessment of formative and reflective
constructs in IS research. In Proceedings of the 15th European Conference on
Information Systems (ECIS 2007) (pp. 1481-1492), Geneva.
González-Benito, J., & González-Benito, Ó. (2006). A review of determinant factors of
environmental proactivity. Business Strategy and the Environment, 15(2), 87-102.
Green, K., Morton, B., & New, S. (1998). Green purchasing and supply policies: Do
they improve companies' environmental performance? Supply Chain Management: An
International Journal, 3(2), 89-95.
Haanaes, K., Balagopal, B., Arthur, D., Kong, M. T., Velken, I., Kruschwitz, N. et al.
(2011). First look: The second annual sustainability & innovation survey. MIT Sloan
Management Review, 52(2), 77-83.
Haenlein, M., & Kaplan, A. M. (2004). A beginner's guide to partial least squares
analysis. Understanding Statistics, 3(4), 283-297.
Hair, J. F., Hult, G. T. M., Ringle, C., & Sarstedt, M. (2014). A primer on partial least
squares structural equation modeling (PLS-SEM). Thousand Oaks, CA: Sage.

30
Hair, J. F., Ringle, C. M., & Sarstedt, M. (2011). PLS-SEM: Indeed a silver bullet. The
Journal of Marketing Theory and Practice, 19(2), 139-152.
Heide, J.B. (1994). Interorganizational governance in marketing channels. Journal of
Marketing, 58 (1), 71-85.
Henriques, I., & Sadorsky, P. (1995). The determinants of firms that formulate
environmental plans. In J. E. Post (Ed.), Research in corporate social performance and
policy. Sustaining the natural environment: Empirical studies on the interface between
nature and organizations (pp. 167-197). London, UK: JAI Press.
Henriques, I., & Sadorsky, P. (1996). The determinants of an environmentally
responsive firm: An empirical approach. Journal of Environmental Economics and
Management, 30(3), 381-395.
Henriques, I., & Sadorsky, P. (1999). The relationship between environmental
commitment and managerial perceptions of stakeholder importance. Academy of
Management Journal, 42(1), 87-99.
Henseler, J., Ringle, C. M., & Sarstedt, M. (2014). A new criterion for assessing
discriminant validity in variance-based structural equation modeling. Journal of the
Academy of Marketing Science, 43(1), 115-135.
Jarvis, C. B., MacKenzie, S. B., & Podsakoff, P. M. (2003). A critical review of
construct indicators and measurement model misspecification in marketing and
consumer research. Journal of Consumer Research, 30(2), 199-218.
Khanna, M., & Anton, W. R. Q. (2002). Corporate environmental management:
Regulatory and market-based incentives. Land Economics, 78(4), 539-558.
Kleindorfer, P. R., Singhal, K., & Wassenhove, L. N. (2005). Sustainable operations
management. Production and Operations Management, 14(4), 482-492.

31
Lindgreen, A., Swaen, V., Maon, F., Andersen, M., & Skjoett-Larsen, T. (2009).
Corporate social responsibility in global supply chains. Supply Chain Management: An
International Journal, 14(2), 75-86.
López, M., Garcia, A., & Rodriguez, L. (2007). Sustainable development and corporate
performance: A study based on the Dow Jones Sustainability Index. Journal of Business
Ethics, 75(3), 285-300.
Marcoulides, G. A., Chin, W. W., & Saunders, C. (2012). When imprecise statistical
statements become problematic: A response to Goodhue, Lewis, and Thompson. MIS
Quarterly, 36(3), 717-728.
Norrman, A. & Jansson, U. (2004). Ericsson’s proactive supply chain risk
management approach after a serious sub-supplier accident. International Journal of
Physical Distribution & Logistics Management, 34 (5), 424–456.
Oh, L., Teo, H., & Sambamurthy, V. (2012). The effects of retail channel integration
through the use of information technologies on firm performance. Journal of Operations
Management, 30(5), 368-381.
Pfeffer, J. & Salancik, G.R. (1978). The External Control of Organizations: A Resource
Dependence Perspective, Harper & Row, New York.
Parmigiani, A., Klassen, R. D., & Russo, M. V. (2011). Efficiency meets accountability:
Performance implications of supply chain configuration, control, and capabilities.
Journal of Operations Management, 29(3), 212-223.
Sanders, N. R. (2012). Supply chain management: A global perspective. Hoboken, NJ:
John Wiley & Sons.

32
Schaltegger, S., & Synnestvedt, T. (2002). The link between ‘green’and economic
success: Environmental management as the crucial trigger between environmental and
economic performance. Journal of Environmental Management, 65(4), 339-346.
Seuring, S., & Müller, M. (2008). From a literature review to a conceptual framework
for sustainable supply chain management. Journal of Cleaner Production, 16(15), 1699-
1710.
Singh, P.J., Power, D. & Chuong, S.C. (2011).A resource dependence theory
perspective of ISO 9000 in managing organizational environment. Journal of Operations
Management, 29 (1), 49-64.
Srivastava, S. K. (2007). Green supply-chain management: A state-of-the-art literature
review. International Journal of Management Reviews, 9(1), 53-80.
Takeishi, A. (2001). Bridging inter- and intra-firm boundaries: Management of
supplier involvement in automobile product development. Strategic Management
Journal, 22(5), 403-433.
Tseng, M. L., Wu, W. W., Lin, Y. H., & Liao, C. H. (2008). An exploration of
relationships between environmental practice and manufacturing performance using the
PLS path modeling. WSEAS transactions on environment and development, 4(6), 487-
502.
Urbach, N., & Ahlemann, F. (2010). Structural equation modeling in information
systems research using partial least squares. Journal of Information Technology Theory
and Application, 11(2), 5-40.
Vachon, S., & Klassen, R. D. (2008). Environmental management and manufacturing
performance: The role of collaboration in the supply chain. International Journal of
Production Economics, 111(2), 299-315.

33
Zhang, M., Zhao, X., & Qi, Y. (2014). The effects of organizational flatness,
coordination, and product modularity on mass customization capability. International
Journal of Production Economics, 158, 145-155.
Zhu, Q., & Sarkis, J. (2006). An inter-sectoral comparison of green supply chain
management in China: Drivers and practices. Journal of Cleaner Production, 14(5), 472-
486.
Zhu, Q., & Sarkis, J. (2007). The moderating effects of institutional pressures on
emergent green supply chain practices and performance. International Journal of
Production Research, 45(18-19), 4333-4355.
Zhu, Q., Sarkis, J., Cordeiro, J. J., & Lai, K. (2008). Firm-level correlates of emergent
green supply chain management practices in the Chinese context. Omega, 36(4), 577-
591.
Zhu, Q., Sarkis, J., & Geng, Y. (2005). Green supply chain management in China:
Pressures, practices and performance. International Journal of Operations & Production
Management, 25(5), 449-468.
Zhu, Q., Sarkis, J., & Lai, K. (2007). Green supply chain management: Pressures,
practices and performance within the Chinese automobile industry. Journal of Cleaner
Production, 15(11), 1041-1052.


