Study to assess the effects of magnetohydrodynamic ...
139
LABORATORY STUDY TO ASSESS THE EFFECTS OF MAGNETOHYDRODYNAMIC ELECTROMAGNETIC PULSE ON ELECTRIC POWER SYSTEMS PHASE I FINAL REPORT 0mUN ROOM 175 DO NOT TRANSFER TO ANOTHER PERSON I+ you wish someone else to bee this report, send in name with report and the library will arrange a loan. LIBRARV LOAN COPV CY 969 3 9 7’
Transcript of Study to assess the effects of magnetohydrodynamic ...

LABORATORY STUDY TO ASSESS THE EFFECTS OF
MAGNETOHYDRODYNAMIC ELECTROMAGNETIC PULSE ON ELECTRIC POWER SYSTEMS
PHASE I FINAL REPORT
0mUN ROOM 1 7 5
DO NOT TRANSFER TO ANOTHER PERSON I + you wish someone else to bee th is report, send in name with report and the library w i l l arrange a loan.
LIBRARV LOAN COPV
C Y 9 6 9 3 9 7’

I, I

ORNL/S~b-83/43374/1/V3 D is t . Category UC-97:7,b,c
Energy D i v i s i o n
STUDY TO ASSESS THE EFFECTS OF MAGNETOHYDRODYNAMIC ELECTROMAGNETIC PULSE ON
ELECTRIC POWER SYSTEMS PHASE I
FINAL REPORT
J. R. Legro N. C. Abi-Samra
F. M. Tesche
Manuscript Completed: December 1984 Date Published: Flay 1985
Report Prepared By
West i nghouse E l ec tri c Corporat ion Advanced Systems Technology
-777 Penn Center Blvd. P i t tsburgh, PA 15235
under Subcontract 19X-43374C
f o r
P. R. Barnes, Technical Moni tor Power Systems Techno1 ogy Program
Energy D i v i s i o n . Oak Ridge Nat ional Laboratory
Oak Ridge, Tennessee 37831 operated by
MARTIN MARIETTA ENERGY SYSTEMS, I N C . f o r t he
U.S. DEPARTMENT OF ENERGY under Contract No. DE-AC05-840R21400
1 3 4 4 5 6 0043737 2 i I


FOREWORD
The D i v i s i o n o f E l e c t r i c Energy Systems (EES) o f the Uni ted States
Department o f Energy (DOE) has formulated a program f o r the research and development o f technologies and systems f o r t h e assessment , operat ion, and c o n t r o l o f e l e c t r i c power systems when subjected t o electromagnetic pu lse (EMP). The DOE/EES EMP program plan i s documented i n a DOE r e p o r t e n t i t l e d Program Plan f o r Research and Development o f Technologies and Systems f o r E l e c t r i c Power Systems Under the In f luence o f Nuclear Electromagnetic Pulses , DOE/NBB-003, May 1983. The research documented i n t h i s Oak Ridge Nat ional Laboratory (ORNL) r e p o r t was conducted under program p l a n elements E l , "EMP Surge Character izat ion and E f f e c t s " and
E2, "EMP Assessment Methodology Development and Testing. It
The research documented i n t h i s volume considers e l e c t r i c power system models and methodology app l icab le t o explore the i n t e r a c t i o n between magnetohydrodynamic-electromagnetic pulse (MHD-EMP) and c i v i l i a n e l e c t r i c u t i l i t y systems. The r e s u l t s o f t h i s work w i l l be used i n subsequent phases of t h e research program t o s imulate such i n t e r a c t i o n , t o assess the poss ib le consequences and t o explore re levant m i t i g a t i o n techniques.
A l l data p e r t a i n i n g t o MHD-EMP environments have been obtained from pub1 i c domain documents and u n c l a s s i f i e d source mater ia ls . Such in fo rmat ion i s presented here in f o r i l l u s t r a t i v e purposes o n l y and does n o t represent ac tua l ' weapon c h a r a c t e r i s t i c s o r maximum t h r e a t environments .
This r e p o r t i s Volume 3 o f a 4-volume s e t t h a t describes an EMP assessment methodology f o r e l e c t r i c power systems. Volume 1 i s an Executive Summary. ( t h i s volume) covers MHD-EMP, and Volume 4 covers source-region EMP (SREMP) .
Volume 2 covers h i g h - a l t i t u d e EMP (HEMP), Volume 3
iii

ACKNOWLEDGMENTS
The research f o r t h i s r e p o r t was sponsored by t h e D i v i s i o n o f E l e c t r i c a l Energy Systems , Uni ted States Department o f Energy under Contract No. W-7405-ENG-26 w i t h the Union Carbide Corporat ion and Contract No. DE-AC05-840R21400 w i t h Mar t i n Mar ie t ta Energy Systems, Inc.
The authors wish t o acknowledge and thank M r . Ken K l e i n o f t h e United States Department o f Energy, M r . P. Randy Barnes, D r . Thomas Reddoch and M r . Paul Gnadt o f Oak Ridge Nat ional Laboratory, M r . Dennis Grimes o f t h e Westinghouse Defense Center, M r . Robert Nowlin o f t he Arizona Pub l ic Service Company and M r . David Cooper o f t he Southern Ca l i f o rn ia Edison Company. The authors a1 so acknowledge the assistance of D r . Vernon A1 bertson, U n i v e r s i t y o f Minnesota f o r t he understanding of geomagnetic storms and D r . Conrad Longmire, Miss ion Research Corporation, f o r guidance i n MHD-EMP environments.
i v

CONTENTS
. . Page . . .. FOREWORD .............................................................. ill
ACKNOWLEDGMENTS ......................................................... i v
LIST OF FIGURES ...................................................... v i i
LIST OF TABLES ...................................................... x
ABSTRACT ............................................................ x i
1 . INTRODUCTION ..................................................... 1
2 . MHD-EMP ENVIRONMENTAL DESCRIPTION .............................. 4 2.1 I n t r o d u c t i o n .............................................. 4 2.2 The Physics o f MHD-EMP Generation ......................... 5 2.3 Determination o f The MHD-EMP E l e c t r i c F i e l d ............... 6 2.4 MHD-EMP E l e c t r i c F i e l d Approximation ..................... 13 2.5 Summary .................................................. 15
3 . MHD-EMP COUPLING TO POWER SYSTEMS ............................. 22 3.1 I n t r o d u c t i o n ............................................. 22 3.2 Spectral Ana lys is o f MHD-EMP F ie lds ...................... 23 3.3 Comparison o f MHD-EMP t o Geomagnetic Storm
Environments ............................................. 26 3.4 MHD-EMP E x c i t a t i o n o f A S ing le Conductor ................. 31 3.5 MHD-EMP E x c i t a t i o n o f A Mult i-Conductor L ine ............. 32 3.6 Transmission L ine Sample Ca lcu la t i on ..................... 33 3.7 S u ~ a r y .................................................. 35
4 . MHD-EMP ASSESSMENT METHODOLOGY ................................ 41 4.1 I n t r o d u c t i o n ............................................. 41 4.2 Methodology S t ruc tu re .................................... 43 4.3 MHD-EMP Coupling and System Response ..................... 44 4.4 Power Transformer Analys is ............................... 54 4.5 System Sta te Analys is .................................... 59 4.6 DC Transmission Analys is ................................. 63 4.7 Generator Analys is ....................................... 64 4.8 Instrument Transformer Analys is .......................... 65 4.9 Inst rumentat ion. Contro l and Relay System Analys is ....... 66 4.10 Power Fuse Analys is ...................................... 68 4.1 1 U t i 1 i t y Communication Systems Analys is ................... 68 4.12 Summary .................................................. 71
5 . NETWORK MODELS AND ANALYSIS CODES ............................. 72 5.1 I n t r o d u c t i o n ............................................. 72 5.2 DC Response Network Topology ............................. 72 5.3 Models f o r Power System Components ....................... 75
V

5.4 Grounding R e s i s t a n c e ..................................... 80 5.5 A n a l y s i s Codes ........................................... 81 5.6 Summary .................................................. 82
6 . CONCLUSIONS AND RECOMMENDATIONS ............................... 85
7 . BIBLIOGRAPHY .................................................. 88
APPENDIX A . DETERMINATION OF THE MHD-EMP ELECTRIC F I E L D AT THE EARTH ' S SURFACE ....................................... 90
APPENDIX B . ELECTRIC F I E L D EXCITATION OF ABOVE-GROUND CONDUCTORS ............................................ 96
v i

Figure LIST OF FIGURES
Page
1 Measured magnetometer data a t Johnston I s l a n d f o r se lec t Fishbowl t e s t s ......................................... 8
2 Generation o f i n i t i a l MHD-EMP s igna l (0.1 t o 10 seconds) ...... 9
3 Generation o f l a te - t ime MHD-EMP (g rea ter than 10 seconds) ..... 9
4 MRC S t a r f i s h s imu la t ion surface magnetic f i e l d contours ...... 10
5 MRC S t a r f i s h s imu la t ion surface magnetic f i e l d d i r e c t i o n ..... 11
6 MRC S t a r f i s h s imu la t ion surface e l e c t r i c f i e l d contours ...... 17
7 MRC S t a r f i s h s imu la t ion surface e l e c t r i c f i e l d d i r e c t i o n ..... 18
8 Spat ia l i n v a r i a n t f ( t ) f unc t i on f o r MHD.EMP .................. 19
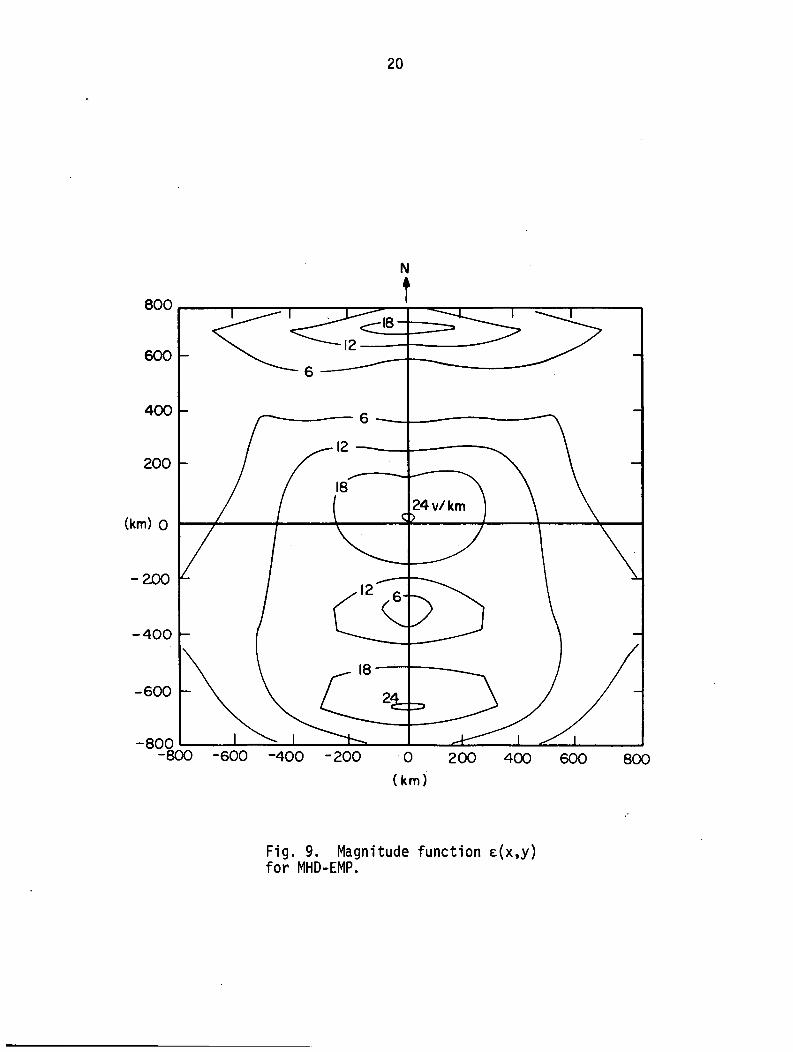
9 Magnitude f u n c t i o n ~ ( x . y) f o r MHD.EMP ........................ 20
10 U n i t vec to r func t ion 6(x. y) f o r MHD-EMP ...................... 21
l l a Time domain magnetic f l u x dens i t y ............................ 24
11 b Frequency domain magnetic f l u x dens i ty ....................... 24
12a Time domain e l e c t r i c f i e l d ................................... 25
12b Frequency domain e l e c t r i c f i e l d .............................. 25
13 Typical measured magnetometer data i n the Northern Uni ted States f o r a geomagnetic storm ............................... 28
14 Spat ia l o r i e n t a t i o n o f 161-kV l i n e and MHD-EMP e l e c t r i c f i e l d ......................................................... 36
15 161-kV c i r c u i t AC s i n g l e l i n e diagram ........................ 37
16 DC model 3 - l i n e diagram f o r 161-kV c i r c u i t ................... 37
17 Segmentation o f 161-kV c i r c u i t t o f a c i l i t a t e e x c i t a t i o n c a l c u l a t i o n s ................................................. 38
18 161-kV c i r c u i t modeled t o c a l c u l a t e the MHD-EMP neu t ra l
19
cu r ren t I,,,( t ) ................................................ 39
Sample problem neu t ra l cu r ren t as a func t i on o f t ime f o r MHD-EMP e x c i t a t i o n ............................................ 40
v i i

Figure Page
20 Sequence o f events f o r s ing le . h igh a l t i t u d e weapon bu rs t .... 42 21a
21 b
21 c
21 d
21 e
21 f
21 9
21 h
21 i
Flowchart f o r MHD-EMP coup1 i n g and system response ........... 45 Flowchart f o r power t ransformer ana lys is ..................... 46
F1 owchart f o r sys tern s t a t e anal ys i s .......................... 47
Flowchart f o r DC t ransmission ana lys is ....................... 48
Flowchart f o r generator ana lys is ............................. 48
Flowchart f o r instrument t ransformer ana lys is ................ 49 Flowchart f o r inst rumentat ion c o n t r o l system and p r o t e c t i v e r e l a y system ana lys is ............................. 50
Flowchart f o r power fuse ana lys i s ............................. 51
Flowchart f o r u t i l i t y communications system ana lys i s ......... 52
22
23
24
Typica l magnet izat ion curve f o r power t ransformer ............ 60 Typica l threshold o f damage curve f o r power t ransformers ..... 60 Typica l power fuse c h a r a c t e r i s t i c curves ..................... 69
25a
25b
Segment o f power system . g r i d ................................. 74
DC response network ........................................... 74
26
27
A1
DC models o f power system components ......................... 77
Conceptual f lowchar t f o r MHD-EMP assessment codes ............ 84 Or ien ta t i on o f t he e l e c t r i c (E ) magnetic (Bx) and c u r r e n t
Y vectors a t the e a r t h - a i r (Z=O) i n t e r f a c e ..................... 95
B1 Conducting body i n f r e e space. i l l um ina ted by a plane wave ... 97 82 Conducting body located over l ossy hal f -space and exc i ted
by an i nc iden t plane wave .................................... 97
B3 Vector d i r e c t i o n s f o r v e r t i c a l l y po la r i zed and h o r i z o n t a l l y po la r i zed i n c i d e n t and r e f l e c t e d f ie l .ds ......... 99
B4 Coordinates d e f i n i n g azimuth and e leva t i on angles o f inc idence ................................................... 101
v i i i

Page
B5
B6
87
Ba
B9
B10
B11
81 2
Figure
Geometry o f i s o l a t e d cu r ren t element over a p e r f e c t conductor ...................................................lOl
Source and observat ion p o i n t l oca t i ons f o r d e f i n i t i o n
Long e l e c t r i c a l conductor over 1 ossy ground, exc i ted by an i n c i d e n t f i e l d . . . . . . . . . . . . . . . . . . . . . . . . . . . . . . . . . . . . . . . . . . . lo6
D i f f e r e n t i a l sec t ion o f t ransmission 1 i n e model f o r above-
Quasi-DC d i f f e r e n t i a l sec t ion o f t ransmission l i n e model
Quasi-DC equ iva len t c i r c u i t f o r t o t a l l i n e o f l eng th L, having load res is tances o f R1 and R2 a t each end ............ 110
o f lossy hal f -space Green's funct ion. . ..................... .lo4
ground conductor. .......................................... . l o6
f o r above-ground conductor.. ............................... .110
Quasi-DC d i f f e r e n t i a l sec t ion f o r mul t i -conductor l i n e ..... .112
Equivalent e x c i t a t i o n models o f a mul t i -conductor l i ne . . ... .113
i x

LIST OF TABLES
Tab1 e Page
1 E x c i t a t i o n o f 161-kV l i n e by section ....................... 34
2 Approximate RMS e x c i t i n g currents f o r power transformers ............................................... 56
3 GM storm load f low 500-kV l i n e simulation .................. 62
4 Typical conductor 60-Ht resistances f o r d i f f e r e n t voltage 1 eve1 s ............................................. 76
X

STUDY TO ASSESS THE EFFECTS OF MAGNETOHYDRODYNAMIC ELECTROMAGNETIC PULSE
ON ELECTRIC POWER SYSTEMS
J . R. Legro N. C. Abi-Samra
F. M. Tesche*
ABSTRACT
The h i g h - a l t i t u d e b u r s t o f a nuclear device over t h e cont inenta l Uni ted States can expose e l e c t r i c u t i l i t y power systems t o intense, t r a n s i e n t electromagnetic pulses (EMP). I n a d d i t i o n t o t h e i n i t i a l t r a n s i e n t s designated as f a s t t r a n s i e n t high-a1 t i tude EMP (HEMP) and in termediate t ime EMP, electromagnetic s igna ls a r e a l s o perceived a t t imes from seconds t o hundreds o f seconds a f t e r t h e burst . This s ignal has been def ined by the term magnetohydrodynamic-el ectromagnetic pu lse (MHD-EMP). The MHD-EMP phenomena has been both detected i n ac tua l weapon t e s t s and pred ic ted from t h e o r e t i c a l models.
This volume documents a p re l im inary research e f f o r t t o : (1 ) i n v e s t i g a t e the nature and coupl ing o f the MHD-EMP environments t o e l e c t r i c power systems, (2 ) d e f i n e t h e cons t ruc t ion o f approximate system response network models and, (3) document t h e development o f a u n i f i e d methodology t o assess equipment and systematic v u l n e r a b i l i t y .
The MHD-EMP environment i s compared t o a q u a l i t a t i v e l y s i m i l a r na tura l event, t h e electromagnetic environment produced by geomagnetic s torms .
The research, t o date, does n o t inc lude an at tempt t o q u a n t i f y power system performance i n an MHD-EMP environment. This e f f o r t has been t o develop t h e a n a l y t i c a l t o o l s and techniques necessary t o perform such assessments a t a l a t e r t ime. I t i s an t ic ipa ted t h a t the MHD-EMP
methodology w i l l be incorporated i n t o a comprehensive EMP assessment process t o i n v e s t i g a t e t o t a l system r i s k .
*LuTech Incorporated , LaFayette, CA.
x i


1. INTRODUCTION
I n the event o f s i n g l e o r m u l t i p l e h i g h - a l t i t u d e nuc lear burs ts over t h e cont inenta l Uni ted States, i t i s expected t h a t a l a r g e geographic area o f t he count ry w i l l be i l l um ina ted by in tense t r a n s i e n t electromagnetic f i e l d s . The f i r s t o f these events t o be perceived on t h e ground i s an extremely f a s t t r a n s i e n t having c h a r a c t e r i s t i c r i s e times r e l a t e d s t rong ly t o t h e gamma r a d i a t i o n output r a t e from the nuc lear device. The t o t a l f i e l d du ra t i on i s approximately a microsecond. Known as a high-a1 t i t u d e electromagnetic pulse (HEMP) , t h i s t r a n s i e n t f i e l d has the p o t e n t i a l t o cause d i r e c t and consequential damage t o e l e c t r i c power systems as we l l as system operat ional upset. Immediately f o l lowing t h e i n i t i a l f a s t HEMP t r a n s i e n t , scat tered gamma r a y photons and i n e l a s t i c gammas from’weapon neutrons c rea te a d d i t i o n a l i o n i z a t i o n r e s u l t i n g i n the second p a r t ( in te rmed ia te t ime) o f the HEMP
. s igna l . Th is second s igna l can occur i n a t ime i n t e r v a l from one microsecond t o about one second.
Electromagnetic s igna ls a re a l s o perceived a t much l a t e r t imes (seconds t o hundreds o f seconds a f t e r t h e bu rs t ) due t o magnetic bubble formation and hydrodynamic motion o f t h e heated atmosphere and debr is remaining from t h e explosion. Th is type o f electromagnetic t r a n s i e n t has been def ined by t h e term magnetohydrodynamic-electromagnetic pulse (MHD-EMP). These MHD-EMP s igna ls have been both detected i n actual t e s t s and pred ic ted f rom t h e o r e t i c a l models.
Since the Uni ted States e l e c t r i c power network o f generation, t ransmiss ion and d i s t r i b u t i o n may be exposed t o EMP environments, i t i s of c r i t i c a l importance t o na t i ona l s e c u r i t y t h a t a q u a n t i t a t i v e and comprehensive methodology be developed t o assess the v u l n e r a b i l i t y o f e l e c t r i c power systems t o t h i s new, e x t e r n a l l y imposed, t r a n s i e n t environment. The c r e a t i o n o f such an assessment technique would enable a l l i n te res ted p a r t i e s t o q u a n t i f y the p o t e n t i a l r i s k t o e x i s t i n g systems, and exp lo re m i t i g a t i n g system hardware appl i c a t i o n s and
opera t iona l s t ra tegy . EMP assessments have been performed f o r o the r types o f e l e c t r i c a l systems, such as m i l i t a r y a i r c r a f t , m i s s i l e s and
2
communications f a c i l i t i e s . The unique p roper t i es o f t h e e l e c t r i c power system, such as i t s complex e l e c t r i c a l in te rconnect ion over a vas t geographic area s t rong ly i nd i ca tes t h a t a separate EMP assessment methodology should be developed w i t h s p e c i f i c focus on the e l e c t r i c power system.
Sect ion 2 o f t h i s r e p o r t presents an overview o f t he physics o f MHD-EMP t r a n s i e n t generation and environmental d e f i n i t i o n . Measured r e s u l t s from the Fishbowl t e s t se r ies a r e presented and the r e s u l t s o f numerical s imulat ions o f t h e S t a r f i s h nuc lear event a re summarized. I n order t o use the ca l cu la ted data i n an e f f i c i e n t manner f o r power system assessment, an approximate method i s suggested f o r represent ing the MHD-EMP e l e c t r i c f i e l d on t h e e a r t h ' s surface.
I n Sect ion 3, t h e coup l ing o f t h e MHD-EMP t r a n s i e n t e l e c t r i c f i e l d t o the e l e c t r i c power system i s discussed. A spec t ra l ana lys is o f t h e t r a n s i e n t i s presented i n order t o demonstrate t h e v a l i d i t y o f model l ing
the e f f e c t o f t h e e l e c t r i c f i e l d as "quasi-dc" vo l tage sources impressed on an equ iva len t dc power system network. The MHD-EMP environment i s compared t o a s i m i l a r power system environment produced by geomagnetic storm phenomena.
Sect ion 4 considers i n d e t a i l t he elements o f a power system assessment methodology under MHD-EMP environments. I t i s shown t h a t s i g n i f i c a n t elements o f geomagnetic storm assessment methodology, modi f ied as requi red, can be evoked t o understand the r e l a t i o n s h i p between MHD-EMP and the e l e c t r i c power system.
I n Sect ion 5, t h e topo log i ca l aspects o f t he e l e c t r i c power system a r e discussed. Su i tab le models f o r power systems assessment a r e presented coupled w i t h an ana lys i s o f d i g i t a l computer codes needed t o
study the impact o f MHD-EMP on power systems.
The r e p o r t concludes w i t h a summary o f recommended areas o f add i t i ona l research t o b e t t e r r e f i n e both the environmental d e f i n i t i o n and the assessment methodology.
The research t o date, does n o t inc lude any at tempt t o q u a n t i f y power system performance i n an MHD-EMP environment. The Phase I e f f o r t

3
has been to define the tools and techniques necessary to perform such assessments i n subsequent phases. The development o f comprehensive methodology is the prerequisite to consistent and meaningful risk assessment.
I

4
2. MHD-EMP ENVIRONMENTAL DESCRIPTION
2.1 Introduction
Any assessment of MHD-EMP impact on electric uti1 ity power systems must begin with an understanding of the physical generation of this transient electromagnetic phenomena and an appropriate environmental definition suitable for power system analysis. It is equally important to place in perspective the quantity and quality of measured data and the success of event simulation via digital codes and other analytical techniques .
Much of what is empirically known about a MHD-EMP environment is based upon magnetometer data acquired during actual nuclear events such as the Fishbowl test series conducted in the Pacific Ocean. The data obtained from the Starfish test (1962) has often been chosen as a benchmark case due to the large negative change, over time, in the ambient magnetic flux density as measured at Johnston Island. Figure 1 shows the magnetometer measurements at Johnston Island for Starfish and two other Fishbowl tests.
Thus, the body of measured data, which exists in the open literature, is limited to a very small sample of magnetometer recordings, at a few locations in the Pacific, for tests which occurred over twenty years ago. To the authors' knowledge, no evaluation of the random and systematic uncertainty nor the response characteristics has been offered for the instrumentation. The limited number of tests did not include replication of any single event. The ratification of the above-ground nuc measurement.
In order to the continental Starfish, Longm
lear Test Ban Treaty effectively put an end to event
estimate an MHD-EMP environment which could exist over United States for a nuclear event comparable to re has taken the measured data of Starfish and
essentially doubled the magnitude of the change in magnetic flux density [l]. The modification is offered to account for the change in geographic latitude between the Pacific test site and the continental

5
United States corresponding t o the increase i n the e a r t h ' s ambient magnetic f l u x dens i ty as a f u n c t i o n o f l a t i t u d e .
Event s imulat ion v i a d i g i t a l codes has met w i t h mixed success. I n c o n t r a s t t o HEMP, which has been postu la ted f o r a longer t ime as a s i g n i f i c a n t t h r e a t t o m i l i t a r y and c i v i l i a n systems and whose phenomenology has been inves t iga ted by a number o f independent research e f f o r t s , MHD-EMP t h r e a t awareness and s i g n i f i c a n t s imulat ion has been l i m i t e d t o a major research e f f o r t sponsored by t h e Defense Nuclear Agency (DNA).
Given the above perspect ive on t h e a v a i l a b l e research, t h i s sect ion presents an overview o f a body o f physics t o model MHD-EMP generation. Based upon t h i s theory, examples o f MHD-EMP s imulat ion w i l l be discussed i n terms o f t h e change i n the e a r t h ' s magnetic f l u x dens i ty as measured a t the surface. O f more d i r e c t i n t e r e s t t o e l e c t r i c power system analys is i s t h e t r a n s l a t i o n o f t h i s magnetic environment t o a corresponding s e t o f surface tangent ia l e l e c t r i c f i e l d s . The sect ion concludes w i t h a suggested approximate format f o r MHD:EMP e l e c t r i c f i e l d d e f i n i t i o n t o f a c i l i t a t e the numerical evaluat ion i n a power system assessment mechanism.
2.2 The Physics o f MHD-EMP Generation
I n response t o t h e S t a r f i s h measurements, several a n a l y t i c a l e f f o r t s have attempted t o develop a theory f o r p r e d i c t i n g t h e mechanisms f o r generating the MHD-EMP environment i n general and S t a r f i s h i n p a r t i c u l a r . As discussed i n the Defense Nuclear Agency (DNA) ,EMP
Course [2], a t l e a s t two d i s t i n c t physical mechanisms are thought t o be responsib le for generat ing the MHD-EMP environment. The f i r s t r e s u l t s i n the e a r l y p o r t i o n o f t h e MHD-EMP s ignal ( l e s s than ten seconds a f t e r the b u r s t ) w h i l e t h e second produces t h e response l a t e r than t e n seconds.
As i l l u s t r a t e d i n F igure 2, a nuclear burs t a t h igh a l t i t u d e s gives
r i s e t o a r a p i d l y expanding ion ized f i r e b a l l , c o n s i s t i n g o f bomb debr is and ho t gas. This plasma tends t o be diamagnetic, i n t h e sense t h a t i t excludes the e a r t h ' s magnetic f i e l d from the i n t e r i o r o f the f i r e b a l l .

6
As the f i r e b a l l expands and r i s e s , i t w i l l deform the e a r t h ' s geomagnetic f i e l d l i n e s , c r e a t i n g a magnetic f i e l d disturbance o f wide spread propagation. D i r e c t l y under t h e b u r s t po in t , a temporary l a y e r o f ion ized a i r i s created by atmospheric absorpt ion o f x-rays produced by the weapon. This reg ion tends t o s h i e l d the area under the b u r s t f o r t h e "ear ly " p o r t i o n o f t h e MHD-EMP s ignal .
As t ime progresses, the ho t ion ized a i r under t h e b u r s t begins t o r i s e and moves across the e a r t h ' s geomagnetic f i e l d l i n e s causing l a r g e atmospheric cur ren ts t o f low. Th is motion may account f o r the second phase o f t h e MHD-EMP s igna l . As shown i n F igure 3, these atmospheric cur ren ts are imaged i n t h e earth. An observer on t h e ground would measure a change i n the e a r t h ' s ambient magnetic f l u x densi ty .
Under cont rac t t o t h e Defense Nuclear Agency (DNA) several t h e o r e t i c a l e f f o r t s have been undertaken by Mission Research Corpora- t i o n (MRC) i n an at tempt t o model MHD-EMP product ion and o b t a i n a numerical s imu la t ion o f t h e S t a r f i s h magnetic f l u x v a r i a t i o n s . The i n i t i a l research [3] focused on the l a r g e negat ive change associated w i t h S t a r f i s h s ince i t was postu la ted t h a t t h i s s ignal would have the more s i g n i f i c a n t impact. For t h i s purpose, t h e MHDEMP code w r i t t e n by MRC computes the t r a n s i e n t magnetic f l u x dens i ty a t the surface o f t h e e a r t h as a f u n c t i o n o f t ime. Th is c a l c u l a t i o n i s based upon i n p u t data suppl ied by t h e M I C E code [4] which computes t h e behavior o f the d is tu rbed atmosphere i n t h e v i c i n i t y o f t h e burst .
The MRC s imulat ion, g iven t h i s vers ion o f the MHDEMP code, extends for a per iod o f t ime from 20 seconds t o 110 seconds a f t e r the b u r s t i n an attempt t o r e p l i c a t e t h e measured change i n magnetic f l u x d e n s i t y as obtained f o r S t a r f i s h a t Johnston Is land. This research i s s i g n i f i c a n t i n t h e sense t h a t , f o r t h e f i r s t t ime, the response pred ic ted by t h e s imulat ion, based on f i r s t p r i n c i p l e s , tends t o correspond t o
measurements a t Johnston Is land. The ac tua l accuracy o f the data f i t must be evaluated given:
0 The u n c e r t a i n t y f a c t o r s contained i n t h e M I C E i n p u t data.
0 The e l i m i n a t i o n o f any Beta patch e f f e c t s .

7
0 The distortion introduced by the finite spatial boundaries of the simulation grid.
0 The required shift in spatial location for Johnston Island from an actual distance of approximately 23 km north of the burst to a "best fit" distance of 179 km north in the simulation.
0 The weaker correlation at elapsed times less than forty seconds.
Given all o f the above qualifications, it remains that this simulation, for the first time, tended to agree with measured data at a given spatial location.
Continuing research by MRC modified the MHDEMP code to include the effects of initial magnetic bubble expansion, plasma pressure gradients and ion inertia in an attempt to simulate the first forty seconds of the Starfish event. The research project also investigated the sensitivity o f the simulation to the atmospheric conductivity which exists between the burst point and ground.
An equally important output of the MRC research is that the numerical simulations indicate spatial variations of the MHD-EMP magnetic flux over a wide surface area. The MRC research [3,5] presents a series o f such contour plots illustrating the magnitude of the change in magnetic flux density AI 81 on the earth's surface at discrete points in time. This phenomena is illustrated in Figure 4 for Starfish at an elapsed time after the burst. In this plot, the origin (0,O) is directly under the burst point while Johnston Island is at the approximate coordinate (23.4,O) in kilometers from the origin.
Since the change in magnetic flux density is a vector quantity it is necessary to understand direction as well as magnitude. The corresponding direction of the magnetic phenomena illustrated in Figure 4 is displayed as Figure 5 of this report.
2.3 Determination of The MHD-EMP Electric Field
The environments of more direct interest to electric power system assessment are the time and spatially varying electric fields associated

8
300
200
IO0
0
n v)
a -100 H 5: a 2 -200
: -300
-4ocl
-so(
-6oc
-70(
I00 200 300 TIME (SECONDS)
Fig. 1. Measured magnetometer data a t Johnston I s land f o r se lec t Fishbowl t e s t s [3].

9
'IC FIELD
Fig. 2. signal. (0.1 to 10 seconds)
Generation o f initial MHD-EMP
(? 0 IMAGED CURRENTS -IN EARTH
Fig. 3. (Greater than 10 seconds)
Generation o f late-time MHD-EMP.

10
N
t 80(
60(
44x
2oc
(km) 0
- 20c
-4OC
-6oc
-8OC - € IO -600 -400 -200 0
(km)
Contour Gauss B . 0.002 C 0.004 D 0.006
Fig. 4. magnetic field contours.
MRC Starfish simulation surface

11
Fig. 5. magnetic field direction.
MRC Starfish simulation surface

12
w i t h the change i n magnetic f l u x environment caused by the MHD-EMP event. It i s t h e ex is tence o f t h i s e l e c t r i c f i e l d environment which serves as the d i r e c t s t imulus t o the e l e c t r i c u t i l i t y network. This e l e c t r i c f i e l d a r i s e s from the i n t e r a c t i o n o f t he MHD-EMP magnetic f i e l d and t h e f i n i t e conducting ear th . The e l e c t r i c f i e l d o f i n t e r e s t i s t angen t ia l t o and loca ted a t t he sur face o f t h e ear th .
The r e l a t i o n s h i p i s based upon t h e impressed magnetic f i e l d d e n s i t y computed from t h e MICE/MHDEMP codes a t t h e e a r t h ' s surface. For a magnetic f i e l d dens i t y denoted as Bx, o r i e n t a t e d i n t h e x d i r e c t i o n , t he corresponding e l e c t r i c f i e l d which i s l o c a l l y o r i en ta ted i n t h e y
d i r e c t i o n and assumed t o be independent o f t he x and y coord inates can be expressed as:
where the e a r t h i s assumed t o have an e l e c t r i c a l c o n d u c t i v i t y o f
u mhos/meter and a pe rmeab i l i t y p equal t o t h a t o f f r e e space. Since equation (1) i s o f t h e form:
F(w) = G(w) H(w) (2 1
I t i s poss ib le t o express equation (1 ) through the convo lu t ion opera tor as:
t f ( t ) = g ( t ) * h ( t ) =I g(t-.r)h(.r) d.r (3 1
0
Employing the appropr ia te transform p a i r s f o r equation (1 ) y i e l d s t h e f o l l o w i n g expression f o r t h e t ime dependent e l e c t r i c f i e l d i n terms o f t he magnetic f i e l d s :

13
The details of the above derivation are contained in Appendix A of this report. Equation (4) may be evaluated by direct integration or equation (1) may be evaluated in the frequency domain and the inverse transform taken numerically to obtain the time dependent, transient electric field.
In equation (4), the magnitude of the time dependent electric field is inversely proportional to the square root of the earth conductivity (a). mhos/meter has been selected. A method to accommodate local earth conductivities different from the assumed value is discussed in Subsection 3.3.5.
For the purpose of this report, a value of
For the MRC simulation of the Starfish event, the values of the electric field contours have been calculated as shown in Figure 6. The electric field direction is generally normal to the magnetic flux direction as shown in Figure 7.
2.4 MHD-EMP Electric Field Approximation
As indicated in the previous discussion of MHD-EMP fields, the behavior of the electric field is rather complicated. Not only does the electric field differ from the magnetic flux in its dependence on time, but the spatial dependence is geographically complex. A rigorous electric field environmental definition would require a numerical solution resulting in a set o f spatial electric field contour plots and the corresponding directional plots at many discrete times after the burst. In lieu of this definition it is desirable to formulate more approximate models of electric field environment to simp1 ify the power system assessment.
A first approximation could be constructed where the environment is defined as an electric field which is spatially uniform for the system or facility under investigation. This uniform field has a given time dependence. Field polarization is taken into account by the assumption that the field is always parallel to a conductor, thereby providing a "worst case" response.

14
I n a sense, t h i s approach i s s i m i l a r t o what i s done f o r t h e HEMP
environment. For a system o r f a c i l i t y whose phys ica l dimensions a r e small compared t o t h e d is tances over which the i n c i d e n t f i e l d changes, such an approximation may be acceptable.
I n the case o f a la rge , interconnected power system, the usual geographic s i z e i s much g rea te r than t h e d is tance over which t h e f i e l d changes. This necess i ta tes a more accurate, and complex, environmental d e f i n i t i o n .
One poss ib le way t o achieve t h i s o b j e c t i v e i s t o approximate t h e t ime dependent e l e c t r i c f i e l d as a product o f th ree independent terms:
I n t h i s approximation we separate the t ime and s p a t i a l behavior o f t he e l e c t r i c f i e l d environment. The term e(x,y) represents t h e s p a t i a l l y dependent, t ime i n v a r i a n t magnitude o f t h e f i e l d . The term E(x,y) i s a u n i t vec to r descr ib ing t h e s p a t i a l l y dependent, t ime
i n v a r i a n t d i r e c t i o n o f t h e f i e l d . The func t i on f ( t ) describes t h e t ime dependent, s p a t i a l l y independent behavior o f t h e f i e l d . Using such an approximation, both small geographic and l a r g e geographic systems can be considered.
I n order t o more accu ra te l y conform t o the o r i g i n s o f t h e MHD-EMP magnetic signa e l e c t r i c f i e l d form:
E, (X¶Y ;t>
, i t may be pre ferab le t o separate the d e f i n i t i o n o f t h e environment i n t o a ''sum o f products" expression o f t he
The f i r s t product term corresponds t o the e a r l y MHD-EMP s igna l ,
wh i l e t h e second accounts f o r t h e l a t e r t ime environment. As a l o g i c a l extension o f t he above, m u l t i p l e MHD-EMP events could be formatted i n t o a f i n i t e se r ies o f "sums o f products" i n an e f f o r t t o describe t h e complete environment as one expression.
15
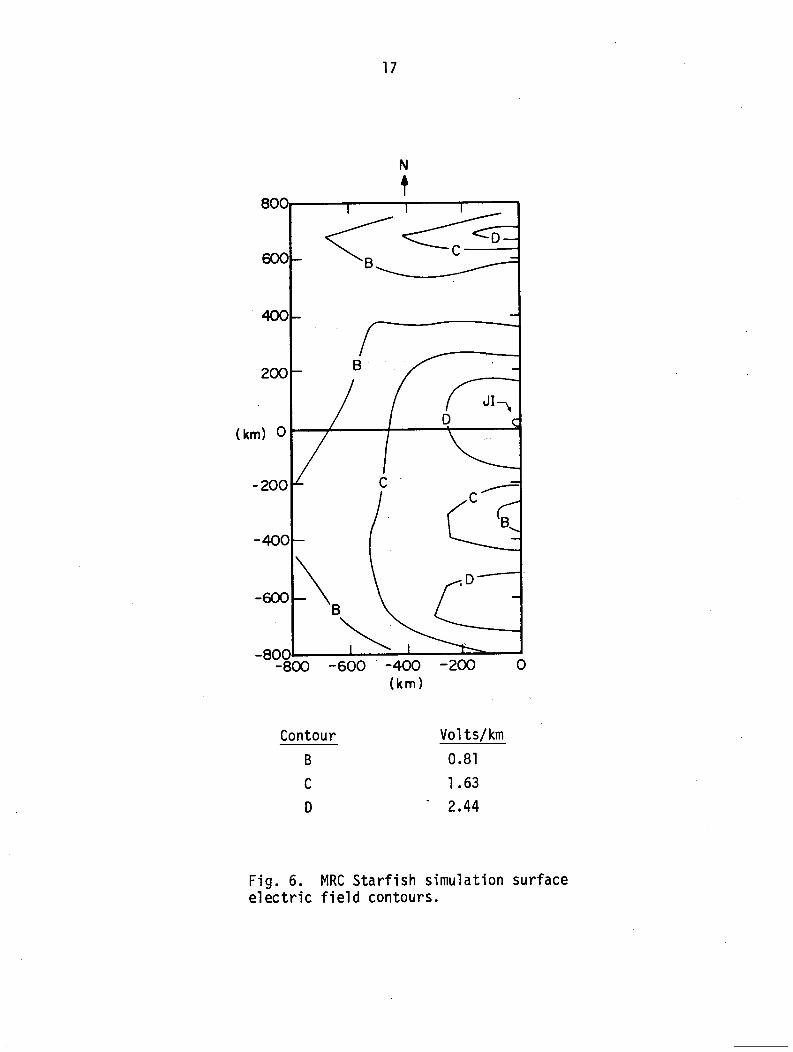
A conceptual example of an electric field 'format given by equation (5) is shown in Figures 8, 9, and 10. The data is derived from the MRC simulation of Starfish [5]. Figure 8 graphically illustrates a possible f(t) which is spatially invariant. Figure 9 depicts a time independent contour plot of electric field magnitude E(X,Y) while Figure 10 is the corresponding unit vector function e(x,y). As of the date of this report, the authors have not examined the error introduced by representing the transient electric field in the above format.
2.5 Summary
In this section, the origin and characteristics of the MHD-EMP) phenomena have been discussed. The environment of direct interest for power system assessment has been defined as the transient electric field tangent to and located at the surface of the earth. This electric field can be obtained from measured or simulated values of the change in magnetic flux density evaluated at the same location. There exists only a limited amount of test data obtained during actual nuclear bursts. The nature of the experiment precludes direct replication or additional opportunity. Environmental simulations, based on existing techniques, have achieved only limited success for the quantative emulation of the measured event.
In equation (5) an approximate representation for the electric field environment has been introduced which considers the spatial dependence to be independent of the time dependence. It is recommended that Oak Ridge National Laboratory (ORNL) evaluate the suggested format in conjunction with Defense Nuclear Agency (DNA) and other MHD-EMP researchers so that future investigations of the environments a1 so include studies of how to reasonably represent the electric field in a directly usable form for power system assessment.
This recommendation is made in support of the ORNL intent to develop a set of environmental scenarios serving as the inputs to power system risk assessment studies. Employing the scenarios in the preliminary risk assessments to be performed during Phase I1 of the
16
research may r e s u l t i n a smal ler subset o f environments which can then be considered as "reasonable worst case" inputs .
Adoption of the suggested format may a l so a l l ow f o r t he fo l l ow ing :
0 Environmental d e f i n i t i o n which can accommodate mu1 t i p l e MHD-EMP generation i n an e f f i c i e n t manner by t h e a d d i t i o n o f "sum o f product" terms as required.
0 Development o f a p u b l i c domain d e f i n i t i o n o f t h e environment a v a i l a b l e t o power systems researchers i n t e r e s t e d i n assessing the system vu1 nerabi 1 i ty under t h e MHD-EMP environment.
Given the inherent unce r ta in t y contained w i t h i n the measured data and the s imu la t ion techniques, use o f an approximate format o f t he suggested type may be a p r a c t i c a l and cos t e f f i c i e n t veh ic le t o f a c i l i t a t e system assessment.
17
N
t
Contour Vol t s / km B 0.81 C 1.63 D - 2.44
F i g . 6. e l e c t r i c f i e l d contours.
MRC S t a r f i s h simulat ion surface

18
N
t 800- I I 1 1 1 I
-800 I I I I 1 I -800 -600 400 -200 0 200 400 600 800
( k m )
Fig. 7 . e lec t r i c f i e l d direction.
MRC Starf ish simulation surface

19
0 '.O .?5 C'"''''''-l
I I I 1 I I I I 1 I I
40 80 120 160 200 240 280 320 360 TI ME ( SECONDS
Fig. 8. f o r MHD-EMP.
Spatial invariant f (t) function
20
800
600
400
200
(km) 0
-200
-400
- 600
N
t
-800
( k m )
Fig. 9. Magnitude func t i on E(X,Y) for MHD-EMP.

21
N
t 8 o o p I I I I I I
600-
400-
200
(km) 0
-
-m -
-400-
-600 -: -
-800. I I I I 1 I -800 -600 400 400 0 200 400 600 800
(km)
Fig. 10. f o r MHD- EMP . Unit vector function e(x,y)

22
3. MHD-EMP COUPLING TO POWER SYSTEMS
3.1 Introduction
The MHD-EMP environment, detected and simulated as a transient change in the ambient magnetic flux density at the earth's surface, can be considered in terms o f the corresponding transient electric field. It has been shown that this electric field, tangent to and located at the surface of the earth, exhibits complex spatial and time characteristics.
In order to understand the coupling of the electric field to power system lines and components, this section begins with a discussion of the frequency distribution of the magnetic and electric transients. Such analysis is necessary to determine if the power system excitation models must employ ac concepts or, if the spectral content is such, that the electric field can be reasonably approximated as a quasi-static (dc) excitation.
Since MHD-EMP environments can only be created by the detonation o f a nuclear device at high altitudes over the earth's surface, it would facilitate the understanding of the environment if one could identify a phenomena, naturally occurring, whose transient electric and magnetic environment has similar characteristics to the MHD-EMP event. This section discusses geomagnetic storm phenomena as such a candidate environment. The investigation continues with a discussion of the electric field coup1 ing mechanism to single and mu1 ti-conductor 1 ines. The approach taken by geomagnetic storm researchers is shown to be consistent with and essentially equivalent to a more general development based on conductor excitation via electromagnetic field s.cattering theory .
The section concludes with a simple numeric example illustrating the coupling of the MHD-EMP electric field environment to a three-phase 161-kV transmission line. The response of interest is expressed as the very low frequency circulating current similar to geomagnetic induced current.
-,

23
3 . 2 Spectral Analys is o f MHD-EMP F ie lds
I n order t o understand and model t h e coup l ing o f t h e MHD-EMP e l e c t r i c f i e l d environment t o t h e power system network, i t i s necessary t o examine the spec t ra l content o f such e x c i t a t i o n . MHD-EMP i s d i f f e r e n t from HEMP and SREMP i n t h a t the e l e c t r i c f i e l d s produced a r e character ized by low f i e l d magnitudes (vo l ts /km r a t h e r than k i l o v o l ts/m) , 1 imi ted spec t ra l content and longer t ime dura t ion (hundreds o f seconds r a t h e r than microseconds). These d i f fe rences suggest t h a t a separate coupl ing mechanism and power system network models should be developed s p e c i f i c a l l y f o r MHD-EMP assessment.
Based upon t h e t ime domain p l o t s const ructed by Longmire [ l ] f o r t h e magnetic f l u x dens i t y and corresponding e l e c t r i c f i e l d , a frequency domain _ p l o t f o r each was constructed. The r e s u l t s a re shown as F igure 11 and F igure 12. It i s s i g n i f i c a n t t h a t even though t h e t ime domain MHD-EMP behavior has several r a p i d l y r i s i n g spikes a t elapsed times less than 40 seconds, t h e corresponding spectrum i s seen t o conta in o n l y low frequency components l e s s than 1 Hz. I n t h e case o f magnetic f l u x , above 0.05 Hz, t h e spec t ra l components a r e two orders o f magnitude below t h e pr imary spec t ra l components a t 1 ower frequencies.
To assess t h e coupl ing mechanism o f such e x c i t a t i o n t o the power system, one can consider an appropr ia te system response funct ion. Such a func t i on might be the respec t ive cu r ren t f l o w i n g i n a conductor f o r a u n i t e x c i t a t i o n i n the frequency domain. I f t h e t r a n s i e n t behavior o f t h i s response func t i on has a c h a r a c t e r i s t i c t ime which i s l e s s than t y p i c a l s ignal t imes, i t i s reasonable t o cons t ruc t a coup l ing model o f t he system us ing dc concepts only. I n t h e frequency domain, t h i s imp l i es t h a t t h e network w i l l have na tu ra l resonances a t frequencies h igher than those contained i n t h e d r i v i n g waveform and t h a t a constant i s a l l t h a t i s needed t o represent t h e system coupl ing response, A reasonable break p o i n t frequency f o r power system networks i s on t h e order o f 0.1 Hz. The- MHD-EMP spec t ra l d i s t r i b u t i o n s s t rong ly suggests t h a t a reasonable coup l ing model may be const ructed where the e l e c t r i c f i e l d takes the form of dc e x c i t a t i o n and t h e network topology f o r
coup1 i n g i s a mu1 t i p 1 e-source, dc r e s i s t i v e network.

24
lo3
lo2
101
100
(Gammas) -280
-
E - E
-720
-1160
-1600
F ig . l l ( a ) . Time domain magnetic f l u x densi ty .
10-1
Frequency (Hz )
Fig. 11 (b ) . Frequency domain magnetic f l u x density.
roo

25
10
6
0
(F)
-5
-10
-15
Fig. 12(a). Time domain electric field.
Frequency (Hz )
Fig. 12(b). Frequency domain electric field.

26
3.3 Comparison of MHD-EMP to Geomagnetic Storm Environments
Solar flare activity can result in the transient emission of particles which then are captured by and interact with the earth's ionosphere and magnetic field. The corresponding transient variations in the ambient magnetic flux density can be measured at the surface of the earth. For power systems analysis, this phenomena has been defined by the term geomagnetic storms. A typical magnetometer record for such phenomena is shown as Figure 13. The particle interaction is thought to cause extensive changes in the topside ionosphere and has been modelled as a trans-global ring current. For the northern hemisphere, this circulating current is postulated to exist at altitudes above 100 km and 1 ocated approximately 60' north 1 ati tude.
It has been known for over thirty years that geomagnetic storms have the potential to damage or operationally impact electric power systems. From an engineering perspective, the interaction of the impressed magnetic signal on the earth can give rise to earth-surface potentials (ESP). For power system lines which are grounded at both ends, at remote locations, the ESP stimulus results in a corresponding circulating current in the line with a ground return path. This very low frequency "quasi -dc" has been defined as geomagnetic induced current (GIC). Analysis of the geomagnetic storm environment and its impact on electric power systems have been extensively investigated by A1 bertson et. al. in a series of technical papers and reports [6,7,8,9]. The initial parameter which invites comparison between these two independent events is the measured magnetometer data. The large negative transient contained in Starfish, as shown in Figure ll(a) has the same shape as the negative transient, located between 60 and 120 minutes, in the storm signal (Figure 13). Although the Starfish data exhibits a faster rise time plus a larger magnitude, from a qualitative perspective, the measured events have many similar features. A more detailed comparison is presented below.

27
3.3.1 Durat ion
The du ra t i on o f geomagnetic storm e f f e c t s on e l e c t r i c power systems i n a s p e c i f i c geographic reg ion w i l l be on the order o f tens o f minutes t o hours w i t h degree o f i n t e n s i t y vary ing unpred ic tab ly from low t o severe du r ing t h e storm period. As i nd i ca ted i n Figure 13, t h i s environment i s charac ter ized by b r i e f per iods o f r e l a t i v e l y r a p i d s ignal change contained w i t h i n much longer per iods o f constant s igna l magnitude. When the r e l a t i o n s h i p between the change i n magnetic f l u x dens i t y ( A B ) as a func t i on o f t ime and t h e corresponding e l e c t r i c f i e l d as computed by equation (4 ) i s examined, i t can be shown t h a t , f o r a constant e a r t h conduc t i v i t y , a magnetic s igna l v a r i a t i o n o f 20.3 gammas o r l e s s occur r ing i n a t ime per iod o f 60 minutes w i l l r e s u l t i n a very small e l e c t r i c f i e l d . The e l e c t r i c f i e l d s o f s i g n i f i c a n c e a r e produced
by the r a p i d AB/A t events. Due t o the long du ra t i on o f the environment, i t i s no t p r a c t i c a l f o r geomagnetic storm researchers t o evaluate the e n t i r e event [SI. A reasonable "worst case" approach has been adopted t o consider o n l y major s igna l v a r i a t i o n s and compute the "worst case" e l e c t r i c f i e l d t h a t can e x i s t f o r a t ime per iod o f minutes.
The magnetic environment created by a s i n g l e MHD-EMP event i s expected t o e f f e c t i v e l y l a s t no more than 400 seconds. Thus, although a f i n i t e sequential se r ies o f MHD-EMP events w i l l n o t cont inuously i l l u m i n a t e the power system f o r any l eng th o f t ime comparable t o geomagnetic storms, the MHD-EMP t r a n s i e n t e x c i t a t i o n i s s i m i l a r t o the reasonable "worst case" geomagnetic storm e x c i t a t i o n i n terms o f durat ion.
3.3.2 Magnetic Flux Density
A key element i n the cha rac te r i za t i on o f both environments i s the magnitude and t ime r a t e o f change of t he surface magnetic f l u x dens i ty .
For geomagnetic storm s igna ls , t h e range o f the t ime ra tes o f change (A t ) extends from 30 seconds t o 3600 seconds. , A t y p i c a l "severe" environment a t the northern border of the con t inen ta l Uni ted States could be considered as a l A s l = 800 gamnas w i t h a corresponding A t = 180

28
600
400
200
0
- 200 -400
-600
I I I I I
.. -
1 I I 1 I
.. - .
A
.! I I I I I 60 I20 180 240 300
TIME (MINUTES)
I I I I I I 60 I20 180 240 300
TIME (MINUTES)
Fig. 13. the Northern United States f o r a geomagnetic storm.
Typical measured magnetometer data i n

29
seconds. On a normalized base this environment can be expressed as 4.44 gammas/second.
In contrast, MHD-EMP magnetic transients have time rates of change for measured events (Starfish) from four seconds to forty seconds (late negative heave). Expressed on the same normalized base, this approxi- mately equals 30.0 gammas/second to 18 gammas/second. Longmire's estimate for Starfish over mid-America would essentially double the above values.
3.3.3 Electric Field Magnitude
Previous research in geomagnetic storm environments [7] have numerically evaluated a "severe" electric field at 6.2 volts/km (10.0 volts/mile) for and an assumed assumption, the an approximate locations.
electric power systems located near the Canadian border earth conductivity of mhos/meter. On the same MHD-EMP electric field as shown in Figure 9 can achieve value of 24 volts/km (38.4 volts/mile) at select
A frequency comparison can be undertaken if a period is developed For a period constructed for these aperiodic transient electric fields.
from the time rate of change of the form:
T = 2At (7 1
The geomagnetic storm contains an equivalent frequency of 0.003 hertz or less. The MHD-EMP stimulus can range from 0.07 hertz to less than 0.01 hertz (Starfish late negative signal ). This quantification supports the contention that both types of field environments can be considered as "quasi-static" (dc) excitation in power system analysis.
3.3.4 Electric Field Spatial Characterization
The fixed location, in the Northern hemisphere, of the auroral current zone created by the geomagnetic storm results in a storm invariant spatial distribution for the electric field. Maximum field exposure is experienced at or under the current zone. The tangential

30
sur face e l e c t r i c f i e l d i s po la r i zed i n a near east-west d i r e c t i o n . For areas o f constant e a r t h conduc t i v i t y , t h e l o c a l f i e l d magnitude decreases propor t iona l t o l a t i t u d e .
As i s c l e a r l y ev ident by Figures 9 and 10, t h e s p a t i a l cha rac te r i - za t i on o f t he MHD-EMP e l e c t r i c f i e l d i s a d i r e c t f u n c t i o n o f b l a s t loca t ion . For constant e a r t h conduc t i v i t y , a l o n g i t u d i n a l s h i f t i n t he b l a s t l o c a t i o n w i l l r e s u l t i n an equiva lent s h i f t f o r t h e f i e l d pa t te rn . Analysis r e q u i r i n g a l a t i t u d i n a l s h i f t i n b l a s t l o c a t i o n i s more complex. This movement w i l l impact both the pa t te rn and t h e magnitude o f t he e l e c t r i c f i e l d due t o b u r s t p o s i t i o n as a func t i on o f t h e angle o f t he e a r t h ' s magnetic f i e l d . It may be necessary t o compute a new MICE/MHDEMP s imu la t ion f o r any scenario which requ i res a l a t i t u d i n a l s h i f t .
3.3.5 Ear th Conduct iv i t y
For both environments, t h e l o c a l magnitude o f ea r th c o n d u c t i v i t y a t o r near t h e surface w i l l determine the l o c a l magnitude o f t h e e l e c t r i c f i e l d . An approach t o t h i s concern can be developed f rom the r e l a t i o n s h i p between the magnetic f l u x dens i t y and t h e e l e c t r i c f i e l d shown as equation (4). The c o n d u c t i v i t y (a) i s constant w i t h respect t o the i n teg ra t i on . The e l e c t r i c f i e l d can be computed assuming a un i fo rm value fo r conduc t i v i t y . To accommodate a l o c a l c o n d u c t i v i t y d i f f e r e n t from t h e assumed value, t h e e l e c t r i c f i e l d magnitude can be cor rec ted by a constant K as fo l lows:
where a = actual c o n d u c t i v i t y = assumed c o n d u c t i v i t y
OO
For example, assume an e l e c t r i c f i e l d o f 10 volts/km computed f o r a a,
o f mhos/meter must be adjusted f o r a a o f mhos/meter.

31
Using equation (8) the required correction factor is computed as K=3.16 and adjusted value of the electric field is 31.6 volts/km.
In summary, despite the quantitative differences between the two phenomena, there exists sufficient similarity to invoke many of the methodologies and models developed for geomagnetic storm assessment as directly applicable for MHD-EMP investigation.
3.4 MHD-EMP Excitation of A Single Conductor
In Section 3.2, it has been shown that the MHD-EMP electric field environment can reasonably be approximated as a very low frequency (quasi-static) excitation for grounded systems. Previous research [6] in the coupling of like fields, due to geomagnetic storms, has used the auroral current/magnetic flux density to compute the tangential electric field at the surface of the earth. An earth surface potential model (ESP) is then evoked to calculate the geomagnetic induced current (GIC). An alternate, yet consistent approach is to use the description of the surface electric field to determine the total incident field on a conductor and thus the excitation source. This method employs electro- magnetic field scattering theory, modified as required to account for lossy ground and finite conductor parameters.
A general development of this approach is discussed as Appendix B of this report. As indicated in this Appendix, the very low frequency of the MHD-EMP electric field allows the following simplifications:
0 The long wavelength of the exciting field allows for a reasonable approximation of the electric field at the height of the conductor to be equal to the field at the surface of the earth.
0 Since any vertical field component at the earth's surface is neglected, the incident field at the conductor is only the tangential field along the conductor.
J
0 For any conductor section the very low frequency (quasi-static) incident field eliminates any need to incorporate capacitive and inductive conductor parameters. The conductor is characterized solely by resi s ti ve el ements .

32
The conductor excitation i s i n the form of a distributed, .per-unit length voltage source whose value i s identical to the incident plus ground-reflected e l ec t r i c f i e ld tangential t o the conductor a t every point expressed as:
The excitation i s polarized only i n the horizontal plane. The total voltage source ( V o ) for the length of conductor is computed by:
Knowledge of the total se r ies c i r cu i t resistance allows the corresponding quasi-static current, t o be computed
3.5 MHD-EMP Excitation of A Multi-Conductor L
the response , by Ohms Law.
ne
As discussed i n Appendix B, general f i e ld coupling to a m u l t i - conductor l i n e will r e su l t i n each conductor having a different voltage source, depending on the variations o f the phase of the incident f i e ld as i t passes over the l ine. In practice, however, for the quasi-static MHD-EMP f i e lds , these phase variations a re negligible. Each conductor excitation source can be modeled as equal and identical t o the f i e ld tangential t o the surface of the earth. Given this approximation, i t can be shown, by general network theory, that the identical voltage sources located i n the equivalent conductors can be shifted to and equivalenced by a single voltage source i n a reference conductor (earth) w i t h no change i n the net response of the c i rcu i t . T h u s , the source of l i ne excitation can be considered as a voltage source i n o r a t the surface of the ground. The l ine response can be determined from an ea r t h- su rf ace potentia 1 approach .
I t should be noted that this approach is correct only as long a s the voltage sources i n each conductor a r e identical i n phase as can be approximated i n the case of MHD-EMP excitation. In the case of higher frequency excitation, such as tha t encountered i n h i g h a l t i t ude EMP

33
(HEMP), t he phase dif ferences o f t he i nc iden t f i e l d from conductor t o conductor a r e important and a surface ESP approach cannot be employed.
3.6 Transmission L ine Sample Ca lcu la t i on
The concept o f MHD-EMP power system e x c i t a t i o n , and the computation o f t he response cu r ren t i s i l l u s t r a t e d i n the fo l l ow ing example. Consider a hypothe t ica l 161 -kV s i n g l e c i r c u i t (three-phase) 1 i n e connecting substat ions A and B. The s p a t i a l o r i e n t a t i o n o f the l i n e and the MHD-EMP e l e c t r i c f i e l d environment i s shown as Figure 14. The l o c a t i o n o f t he b u r s t i s a t o r i g i n coordinate (0,O).
The MHD-EMP e l e c t r i c f i e l d environmental parameters a re as fo l l ows :
0 Magnitude f u n c t i o n ~ ( x , y ) as shown i n Figure 14. For t h i s example, t h e magnitude i s s e t equal t o 20 v o l t s / k i l o - meter f o r t he e n t i r e l i n e . The vo l tage source w i l l be modeled as an earth-surface p o t e n t i a l (ESP).
0 U n i t vec tor f unc t i on e(x,y) as shown i n Figure 14. The u n i t vec tor general d i r e c t i o n i s from east t o west w i t h the p o l a r i z a t i o n as shown.
0 Time f u n c t i o n f ( t ) as shown i n Figure 8.
The above cha rac te r i za t i on i s cons is ten t w i t h the MHD-EMP e l e c t r i c f i e l d approximation discussed i n Section 2 o f t h i s repor t . The 161-kV l i n e parameters a re as fo l l ows :
0 Total l eng th (L) o f t h e l i n e i s 170 ki lometers.
0 Per-un i t res is tance o f each conductor i s 0.06 ohms/kilo- meter. To ta l conductor res is tance ( R ) i s ca l cu la ted by the product o f t h e per u n i t r e s i s t a n c k a n d the l eng th o f the conductor. I n t h i s example RL i s equal t o 10.2 ohms.
The subs ta t ion parameters a re as fo l lows:
0 A t each subs ta t ion the l i n e i s terminated by a two-winding transformer as shown i n Figure 15. The wye-del t a winding c o n f i g u r a t i o n serves t o i s o l a t e the 161-kV l i n e from the remaining g r i d f o r a - dc ana lys is .

34
Each transformer wye winding res is tance ( R ) i s equal t o 0.18 ohms per phase.
e A t each substat ion the re e x i s t s an a d d i t i o n a l te rmina t ion ground res is tance equal t o 1.0 ohms from the wye winding neut ra l t o a remote ground po in t .
Y
The t h r e e - l i n e dc model c i r c u i t i s shown i n F igure 16 o f t h i s repor t . The e f f e c t of any s h i e l d wi res has been removed from t h i s exampl e ca 1 cu l a t i on.
To f a c i l i t a t e c a l c u l a t i o n o f t he MHD-EMP f i e l d coupl ing t o the 161-kV l i n e , t he l i n e has been p a r t i t i o n e d i n t o th ree segments as shown i n Figure 17. For each sect ion, t he l i n e and the e x c i t i n g f i e l d have been t rans la ted t o t h e i r equiva lent north-south and east-west components. The e x c i t a t i o n i s computed f o r each sec t ion as shown i n Table 1.
Table 1 EXCITATION OF 161 -KV LINE BY SECTION
Sect i o n Length (Km) E-Fie1 d (V/Km) Exc i ta t ion(Vo1 t s )
1 28.0 ~90' 20.0 ~ 2 7 0 ' (560) 48.5 L18Oo 0.0 L180° 0.0
2 38.1 ~270' 20.0 ~270' 7 62 22.0 L18Oo 2.0 L180° 0.0
3 50.0 L270° 18.8 L270° 940 50.0 L18Oo 6.8 L18Oo 340
For each sect ion, t he l o c a l e x c i t a t i o n i s the product o f t he l i n e l eng th and the tangent ia l e l e c t r i c f i e l d a t t h i s s p a t i a l l oca t i on . Due t o the s p e c i f i c o r i e n t a t i o n o f t h i s l i n e and the e l e c t r i c f i e l d
d i r e c t i o n , t he l o c a l e x c i t a t i o n f o r Sect ion 1 i s assumed t o be opposi te i n s ign w i t h respect t o t he remainder o f t he l i n e . The ne t t o t a l e x c i t a t i o n ( V ( t ) ) i s t h e sum of t he i n d i v i d u a l sec t ion exc i ta t i ons . I n t h i s example V ( t ) i s equal t o 1482 f( t) .

35
For t h i s example, t he i n i t i a l l i n e response o f i n t e r e s t i s the magnitude and d i r e c t i o n o f t he neu t ra l cur ren t IN(t) caused t o f l ow by vo l tage source V ( t ) . To f a c i l i t a t e t h i s c a l c u l a t i o n the equiva lent s i n g l e - l i n e dc model i s const ructed as shown i n F igure 18. The res is tance o f each p a r a l l e l l i n e conductor can be se t t o an equiva lent equal t o R /3. The same l o g i c i s employed f o r each transformer t o achieve an equiva lent p a r a l l e l winding res is tance equal t o R /3. The vo l tage source i s s e t a t 1482 f(t).
Y
Y
The corresponding neu t ra l cur ren t IN(t) i s computed using Ohms Law. I n t h i s example IN(t) i s equal t o 268.5 amperes f(t). A graphic i l l u s t r a t i o n o f t h i s response cu r ren t i s shown as Figure 19. An approximate value f o r each phase dc magnitude can be determined as one- th i rd o f t he neu t ra l cu r ren t magnitude.
3.7 Summary
Spectral ana lys is o f t he MHD-EMP magnetic f l u x dens i ty and surface t o tangent ia l e l e c t r i c f i e l d i nd i ca tes on ly very low frequency content. For power system analys is , t he e l e c t r i c f i e l d can be considered as a quas i - s ta t i c type o f exc i ta t i on . This type o f e x c i t a t i o n i s q u a l i t a t i v e l y s i m i l a r t o t h a t experienced by the power system dur ing a geomagnetic storm. This s i m i l a r i t y a l lows the adoption o f e x i s t i n g geomagnetic storm analyses techniques and models f o r MHD-EMP i nves t i ga t i on .
The i n t e r a c t i o n between power l i n e s and the quas i - s ta t i c e l e c t r i c f i e l d can be obtained from an ear th-sur face p o t e n t i a l (ESP) o r an i n c i d e n t f i e l d s c a t t e r i n g theory development. For MHD-EMP environments, e i t h e r approach y i e l d s comparable r e s u l t s . For d i g i t a l code computa- t i o n a l and modeling e f f i c i e n c y , t he ESP e x c i t a t i o n model requi res fewer vo l tage sources f o r t he same g r i d under analys is . As shown i n the
161-kV l i n e example, t h e response o f i n t e r e s t ( t h e c i r c u l a t i n g quasi-dc cu r ren t ) i s a s t rong func t i on of the s p a t i a l o r i e n t a t i o n o f t he l i n e analys is , t he corresponding e l e c t r i c f i e l d and the dc res is tance values f o r 1 ine, t ransformer and ground te rmina t ion model elements.

36
N
t 200
(krn) 0
7
I -200 0
(km)
Fig. 14. Spat ia l o r i e n t a t i o n o f 161-kV l i n e and MHD-EMP e l e c t r i c f i e l d .
200

37
-3 F-4 A B
A &I* A
e-
Fig. 15. l i n e diagram.
161-kV C i r c u i t AC s i n g l e
Fig. 16. 161-kV c i r c u i t .
DC model 3 - l i n e diagram f o r

38
+ Q (X,Y) = 2 0 VOLTSIKM e(X,Y =270° Y
‘f \
L) Q ( x , y ) = 2 0 VOLTWKM b( X,Y) = 250°
CIRCUIT TOPOLOGY MHD -EMP TOPOLOGY
Fig. 17. Segmentation of 161-kV circuit to facilitate excitation calculations.

39
. .
I ~ ( t I ' 2 6 8 . 5 f ( t ) DC AMPERES
Fig. 18. 161-kV c i r c u i t modeled t o calculate the MHD-EMP neutral current I N ( t ) .
I

40
‘I
-
-
i I 1 I I 1 I I I I
TIME ( SECONDS)-
Fig. 19. Sample problem neutral current as a function o f time f o r MHD-EMP excitat ion.
...

41
4. MHD-EMP ASSESSMENT METHODOLOGY
4.1 Introduction
This section discusses the overall development of a process to assess the effects of an MHD-EMP environment on electric power systems. The methodology must be considered in context with the entire event. For a single high-altitude nuclear burst, the MHD-EMP environment will always be preceded by an HEMP environment. As shown in Figure 20, the two distinct environments, as perceived by the power system, are separated in time. The system under investigation will sense and react to the existence of HEMP for seconds until the formation of the MHD-EMP environment. In power systems analysis, where devices operate in the order o f 60 Hz cycle times and short-term stability is a concern, an elapsed time of second(s) between the two environments is a significant separation. The power system will change "state" due to the existence of HEMP, but many of the transient operations occurring within this change of "state" will essentially be completed within an elapsed time of seconds. The power system can be considered to be in a new "state" which serves as one set of initial conditions for MHD-EMP assessment.
This separation by "state:' within the framework of an overall assessment technique, may also be required due to the vast differences in the natures of the environments and the corresponding power system modeling techniques. Initial investigation indicates that it may be practically impossible to employ a single set of models within a unified assessment code to simulate both HEMP and MHD-EMP effects. The environmental format suggested in this report may be applicable for single or multiple MHD-EMP environments only. The assessment of scenarios which require the simultaneous existence of both HEMP and MHD-EMP environments must be addressed in future research.
Investigation into the nature of the MHD-EMP phenomena indicates that a reasonable expression for the coupling of the environment to the power system can be expressed as a set of quasi-dc branch currents caused to flow in system lines and cables. This coupling response i s

Event
High Altitude Weapon Burst
Prompt HEMP Environment
Intermediate HEMP Environment
System HEMP Responses(s)
MHD-EMP Environment
System MHD-EMP Responses(s)
1 o - ~ 1 o-6 1 o - ~ 1 oo
A
\Microseconds I
Milliseconds 1
lo3 SECONDS
P N
1Hundreds o f Seconds I
IHundreds o f Seconds ].
Fig. 20. Sequence o f events for single, high altitude weapon burst.

43
q u a l i t a t i v e l y s i m i l a r t o the concept o f geomagnetic induced cur ren ts ( G I C ) formed i n response t o the so la r storm environment. Therefore, w i t h an appropr ia te change i n environmental d e f i n i t i o n , t he MHD-EMP assessment methodology can b u i l d upon the e x i s t i n g body o f research and ana lys is techniques developed t o assess the impact o f GIC . The assessment "wheel" needs n o t t o be "re-invented' ' bu t ra the r adapted and expanded t o s u i t t he event. I n a complementary manner, d e t a i l e d assessment concerning the impact o f MHD-EMP on the power system can lead
t o a greater understanding of t he cause and e f f e c t s o f G I C on the same system.
4.2 Methodology St ruc ture
By d e f i n i t i o n , methodology i s a system o f p r i n c i p l e s , p rac t i ces and procedures app l ied t o a se t o f knowledge t o achieve a spec i f i ed ob jec t ive . The process i s s t ructured; i t can be considered as a ser ies o f i n t e r r e l a t e d tasks. (1) in fo rmat ion gathering, t he establ ishment o f requ i red data bases, (2) in fo rmat ion t ransformat ion, t h e modeling and s imu la t ion o f systems by a n a l y t i c a l techniques, and (3) assessment, t h e comparison of t w o o r more data bases i n an at tempt t o q u a n t i f y cause and ef fect re la t i onsh ips . The MHD-EMP assessment methodology has been developed w i t h i n the contex t o f t h i s de f i n i t i on .
Each task may take the form o f :
For t he purpose o f t h i s repor t , the complete se t o f tasks which c o n s t i t u t e the methodology process has been p a r t i t i o n e d i n t o several subsets which address spec i f i c aspects o f t he assessment. These subsets are def ined as:
0
0 Power Transformer Analysis 0 System Sta te Analysis
0 DC Transmission Analysis 0 Generator Analysis . 0 Instrument Transformer Analysis
MHD-EMP Coupling and System Response

44
0 Inst rumentat ion Control and Pro tec t i ve
0 Power Fuse Analysis 0 U t i l i t y Communications System Analys is
Relay System Analysis
The corresponding f lowchar t f o r each o f these subsets i s i l l u s t r a t e d as Figure 21 (a) through 21 (i). The s p e c i f i c assessment formed from one subset may modify, o r cause a d d i t i o n a l i t e r a t i o n s o f another subset. For example, t he mis-operat ion o f a p r o t e c t i v e r e l a y scheme due t o the presence o f power frequency harmonic generat ion by power t ransformer increased e x c i t a t i o n may r e s u l t i n breaker operat ion. The c i r c u i t swi tch ing creates a new se t o f cond i t ions the impact o f which can be assessed i n terms o f change i n system load f l ow and t r a n s i e n t s t a b i l i t y . The complete process should inc lude m u l t i p l e , recurs ive assessments t o understand the s e n s i t i v i t y o f t h e range o f i n d i v i d u a l component responses on t o t a l system performance.
4.3 MHD-EMP Coupling and System Response
The methodology process begins w i t h t h e t r a n s l a t i o n o f t he MHD-EMP environment, as seen by a power system g r i d , i n t o the corresponding i n i t i a l system response. This o b j e c t i v e i s achieved by the sequent ia l accomplishment o f f o u r tasks.
4.3.1 Data Base: MHD-EMP Environment (A1 )
I n task A l , a data base i s estab l ished t o q u a n t i f y t he MHD-EMP environment def ined as the tangent ia l e l e c t r i c f i e l d E(x,y;t). A poss ib le format can be s i m i l a r t o t h a t proposed i n Sect ion 2.4. It i s envisioned t h a t a group o f such data bases w i l l be given t o the research team by Oak Ridge Nat ional Laboratory corresponding t o s imulat ions o f i n t e r e s t . The expression o f t he event i n terms o f t h e e l e c t r i c f i e l d o n l y may serve t o decouple t h e cause from the environment s u f f i c i e n t t o
consider the formatted data bases as "canonical" and the re fo re a v a i l a b l e i n the p u b l i c domain.

45
Power. System Gr 1 d 4 I B1 Data Base Power. System Gr 1 d I
i
I Model Power System Response
Networks -
DC B r m e n t s
Fig. 21(a). Flowchart f o r MHD-EMP coupling and system response.

46
77
I - - - - 1
F1 Data Base , 60 Hz Harmonic
Generation
I D1 Data Base I I DC Branch Currents I
F2 Assessments Power Transformer I n s u l a t i o n Damage
Model Power Transformer
61 Sys tern Add i t i ona 1
VAR -- Demand
e
Fig. 2 1 ( b ) . Flowchart for power transformer analysis .

47
K L a E e - 1 , , 62 Data Base I System Addi t ional System Load Flow S t a b i l i t y VAR Demand
I.--- I
Load Flow
P J1 Assessment
Change o f System S t a t e
Fig. 21(c). Flowchart f o r system s t a t e analys is .

48
- - - F3 Data Base
DC Terminal F l Data Base
I 60 Hz Harmonic L - Generation r
- - -
DC Converter
Fig. 21(d). Flowchart for DC transmission analysis.
Generator Design F1 Data Base
I 60 Hz Harmonic Generation L - - , -
63 Assessment Generator Damage
Fig. 21 (e). anal ysi s . Flowchart for generator

49
H2 Assessment
I D1 Data Base
I DC Braich Currents - - -
F1 Data Base I 60 Hz Harmonic
Generation L,, - -
H3 Assessment
P
’ Current Transfonner Operat ion
r I
Vol tage Transformer Operat i o n
I 64 Data Base Instrument
Transformers
Fig. 21 (f),. transformer analysis.
Flowchart for instrument

50
I 2 Data Base
H3 Assessment Vol tage Transformer
Operat ion
H2 Assessment Current Transformer
Operat ion
77
13 Data Base
I J I I I
Instrumentat ion and Contro l Systems
P r o t e c t i v e Relay Systems
Assessment Instrumentat ion and
Contro l System Operation I J2 P
53 Assessment Relay System
Operat ion
Fig. 21 (9). system and protective relay system analysis.
Flowchart for instrumentation control

51
r - - - - ' F1 Data Base I 60 Hz Harmonic
Generation I - - - - -
1 r - - - -1 I
I D1 Data Base I
1-1 DC Branch Currents
J L - - - - J
P I
65 Data Base Power Fuses
H4 Assessment Fuse Operation
Fig. 21(h). Flowchart f o r power fuse ana lys is .

52
82 Data Base
I I A1 Data Base MHD-MP Environment
83 Data Base System Line Comnunications
L1 ne C m u n i cation
System Radio Comnunications
c
Fig. 21(i). Flowchart f o r utility communications system analysis.
T7 T7
c2 Model Line CGiiGication
Response
C3 Assessment Radio Communi ca t i on
Operation L

53
The group of data bases will be used i n Phase I 1 of the Research Program t o perform preliminary risk assessments. Based on the resu l t s of this analysis, a smaller s e t may be selected to re f lec t a "reasonable" worst-case environment (s) . These environmental d a t a bases will be used for more detailed assessments i n Phase I11 of the program.
4 . 3 . 2 Data Base: Power System Grid (61)
In this task, a d a t a base will be established for the power system g r i d exposed t o the tangential e l ec t r i c f ie ld . T h e data base must include the following information:
"State" of the e l ec t r i c power system in terms of 60 Hz e lec t r i c connection.
Spatial orientation and c i r cu i t length for applicable transmission, subtransmission and distribution networks.
DC resistance per u n i t length for the conductors contained within the above networks.
Location, winding resistance and winding connection for a l l power transformer and s h u n t reactor banks contained w i t h i n the g r i d .
Location and terminating dc resistance for a l l power ground points contained within the grid.
Location of a l l power system components, 'such as ser ies capacitors which serve t o block the flow of dc current.
4 . 3 . 3 Model : Power System' Response Networks ( C 1 )
In this task, the previously compiled data bases will be processed into a set o f equivalent dc power system response networks. The number and complexity of these networks will be determined by the dc open-circuit nodes i n the power system gr id .
Each network will consist of lumped res i s t ive branch elements and distributed dc voltage sources. The network will then be solved to compute the time varying dc branch currents. Additional discussion

54
concerning the topology, equipment models and dc source quantification within these networks is contained in Section 5 of this report.
4.3.4 Data Base: DC Branch Currents (Dl)
This portion of the methodology concludes with the establishment of a data base which contains a listing o f the time varying magnitude o f all dc branch currents. The currents will be assumed to flow simultaneously with the 60 Hz current in applicable conductors and wi nd i ngs .
4.4 Power Transformer Analysis
It is known that the simultaneous ac and dc excitation of a power transformer can result in the following phenomena:
0 Possible insulation deterioration or damage due to internal localized heating conditions.
0 Harmonic generation due to transformer core half-cycle saturation.
0 Increased transformer VAR requirements.
Each of the above conditions must be addressed by the methodology for those network branches where this type o f excitation will occur. The data base containing the dc branch currents was established as task D1. The incorporation of this information with applicable transformer excitation models will allow for the assessment of potential insulation damage, and create both an harmonic data base and an additional VAR demand data base.
4.4.1 Model : Power Transformer Excitation (El 1
In this task, the dc excitation current is evaluated by transformer excitation models, into an equivalent value for combined excitation. Tests on full-scale single-phase core-form transformers, as well as analytical studies [15] have shown that the equivalent ac exciting

55
current can be approximated by -
Ieq - Iac + Idc
where = dc current per phase Idc
K = proportionality constant = ac magnetizing current Iac
A value of 2.8 for K has been found t o f i t da t a for GIC current magnitudes. Additional research should be performed t o validate the approximation and the value of K for MHD current levels. I t i s instructive to note that for any appreciable dc level, the to ta l equivalent exciting current I can be roughly estimated by neglecting eq the I,, term i n equation (11). To i l l u s t r a t e this p o i n t , Table 4.2 depicts a range of approximate values of transformer ac excitation current for units of different voltage levels. In any assessment, actual transformer data should be employed.

56
Table 2
APPROXIMATE RMS EXCITING CURRENTS FOR POWER TRANSFORMERS
Percent of Full Load Current Nominal Winding Voltage 0.5% 1 .O% 4.0%
(W (Amps) (Amps) (Amps)
69 115 230 345 500 800 1200
.5 1 4
.82 1.66 6.63 1.66 3.31 13.25 3.5 7.0 28 6.15 12.3 49 8.2 16.4 65.7 12.6 25.2 100.8
An example of a typical power transformer ac magnetization curve is shown as Figure 22. The data represents a medium size generator step-up unit. Normal operating conditions are at point A on the graph. .By the relationship shown in equation ( l l ) , an additional dc excitation of 6.786 per-unit exciting current results in transformer operation at a 1.3 per-unit excitation level (point B). For a high-voltage wye-grounded winding whose 1 .O per-unit exciting current equals 7.0 amperes, ( Iac), a corresponding value of Idc equal to 47.5 amperes (rms) is required.
Equation (1 1 ) has been derived for two-winding transformers. However, it can also be applied to autotransformers if an equivalent value for Idc is first calculated to account for the unequal value of current in the series and common windings. For this case, Idc is obtained by the expression:
where: Is = dc current in series winding
= dc current in common winding N = the turns ratio of the series winding with IC
respect to the common winding (Ns/Nc)

57
4.4.2 Assessment: Transformer Insulation Damage (F2)
To access the possi bil i ty of insulation damage due to overexci ta- tion, for any transformer, the value of I obtained in task El is located on the transformer magnetization curve and the corresponding value of per unit excitation is obtained. Transformer damage threshold curves are normally presented as an inverse time, per-unit, .excitation relationship. The interpretation is that, for a given per-unit excitation, a time duration of more than the corresponding time may result in thermal degregation of the insulation. It is important to understand that this comparison does not indicate the amount of damage but merely the threshold of damage. More detailed investigation is required to obtain the quantitative risk. A typical curve for the permissible short-time overexcitation of power transformers is shown as Figure 23. As indicated in the graph, a per-unit overexcitation equal to 1.3 (point B) which exists for longer than 18 seconds (0.3 minutes) may place the transformer at risk.
eq
4.4.3 Data Base: 60 Hz Harmonic Generation (Fl)
Another aspect of simultaneous excitation o f power transformers is the local generation of 60 Hz harmonics in the exciting current. Spectral content of the current waveform has been empirically measured for various lower levels of dc current combined with normal ac excitation. Given the fact that the harmonic response is a complex function of transformer design and construction, the existing limited amount of test data cannot be expanded to achieve accurate generaliza- tion for all types and designs.
Within the power systems community there is general appreciation that the effects of increasing excitation are more pronounced in
. single-phase core form transformers. The relative impact on three-phase three or five-legged core designs or three-phase shell designs has not enjoyed the same degree of analysis to provide conclusive opinions. For autotransformer banks , a series of experiments conducted by Minnesota Power and Light indicates the following:

58
0
0
. o
In
For the same neutral dc magnitude, a bank comprised of three single-phase units is a greater harmonic generator than a corresponding three-phase autotransformer installation.
The magnitude o f the second harmonic current varies directly with the dc excitation.
For the same neutral dc magnitude a three-phase she1 1 -form autotransformer is a more significant harmonic current generator than a corresponding three-phase t hree-1 egged-core autotransformer.
the absence of an extensive, existing data base for all common types of transformer constructions , additional research using both emperical and analytical techniques is required before this task can be accompl i shed . 4.4.4 Data Base: System Additional VAR Demand (Gl)
As a pre-requisite to system analysis such as load flow and stability, the increased VAR requirements caused by transformer over- excitation must be developed.
This data base can be established in two ways [7]. The more precise approach for a given transf,ormer design is founded on the harmonic content of the exciting current as follows:
wh,ere: Q = reactive power V = RMS value of the applied 60 Hz voltage
= RMS value of the ith harmonic component of Ii
n = highest order harmonic value the exciting current
59
As an al ternate approach, the reactive power could be approximated from the following:
where Q = reactive power V
I exc
= RMS value o f the applied 60 Hz voltage = normal RMS exciting current a t normal
operating voltage w i t h no dc current per phase
K = proportionality constant = DC current per phase I dc
Previous research [7) has indicated that K=2.8 appears t o be a reasonable approximation. I t will be necessary t o validate this approach for MHD-EMP level dc currents.
4.5 System State Analysis
I t is expected tha t system reactive power requirements will increase due to power transformer increased excitation. The location and magnitude of these increased VAR demand loads have previously been established via the data base compiled i n task G 1 . The impact o f the system change i n " s ta te" must be assessed from the following aspects:
0 System Load Flow 0 System Short-Term Stabi l i ty 0 System Switching Surge
For each assessment several base-case steady s t a t e conditions for the power system must be specified. The additional reactive power demand would then be integrated i n t o the system model to quantify response.

60
Fig. 22. power transformer.
Typ ica l magnet izat ion curve f o r
Fig. 23. ,Typica l th resho ld of damage curve f o r power transformers.

61
4.5.1 Data Base: System Load Flow and S tab i l i ty
T h i s data base establishes the base case steady s t a t e condition of the system prior to the introduction of MHD-EMP effects . The type o f data required is consistent with that usually given for conventional system studies. I t must be emphasized again, t h a t the s t a t e of the system, defined i n this task, i s "as modified" by any HEMP effects prior to the s t a r t of the MHO-EMP analysis.
4.5.2 Model: Load Flow (Hl)
The required load flow models are identical t o those contained i n typical existing load flow digi ta l programs. The additional reactive power demand a t each bus of interest can be modeled as s h u n t reactive loads. The output of the simulation will reveal the following system sumari es :
0 New real and reactive power bus values and corresponding power flows i n each l ine.
0 Load area net generation and load, losses, t i e l i ne flows and net power export.
0 Line losses.
0 Buses w i t h h i g h and low voltages.
0 Overloaded 1 ines.
0 Regulated bus data.
In those cases where system reactive power requirements exceed the capabi 1 i ty of generation and other reactive power sources, the existing systems loads represented a s constant MVA i n typical load flow studies will be modified t o become voltage dependent. A t each affected bus, a percentage of the load would be changed from constant MVA t o constant impedanc,e, varying as the square of the bus voltage. This percentage would be s e t dependent on the level of the dc circulating current.

62
An understanding o f t he change i n system load f low due t o MHD-EMP e f f e c t s can be gained from s i m i l a r ana lys is fo r systems i n a geomagnetic storm environment. Previous research [7] f o r a 500-kV l i n e s imu la t ion and a maximum e l e c t r i c f i e l d o f 6.2 vo l t s / k i l omete r y ie lded the fo l l ow ing load f l o w changes as tabulated i n Table 3.
Table 3
GM STORM LOAD FLOW 500-KV LINE SIMULATION
System Aspect System Change
System MVAR Increase = 90% Bus Voltage *Decrease = 21% System Load Decrease = 7% Generation Decrease = 8% System Losses Increase = 7%
*Worst Case Load Bus
The above change i n system parameters i s a d i r e c t r e s u l t o f the increase i n system MVAR requirements due t o power t ransformer ove rexc i ta t i on on ly and do no t r e f l e c t any generat ion load r e j e c t on load shedding act ions.
4.5.3 Model: System S t a b i l i t y (11)
I n add i t i on t o the q u a n t i f i c a t i o n o f t he new steady-state load f l o w caused by the MHD-EMP env-ironment, t he e f f e c t s on system s t a b i l i t y as i t moves from s t a t e t o s t a t e must a l so be considered. The load f l o w def ines the i n i t i a l steady-state condi t ions. The s t a b i l i t y program represents dynamic models o f generation, load, r e a c t i v e power compensation and HVDC transmission. The system would then be d is tu rbed by the a d d i t i o n o f t h e MHD-EMP caused r e a c t i v e loads. The program

63
output would quantify the dynamic response of the system, such as generator swing angles as a function of time. In addition, the effects of load shedding schemes and line tripping must be considered.
In addition to the above, the effects of long-line energization, single and three-pole reclosing and other switching phenomena must be investigated using existing analysis techniques.
4.5.4 Assessment: Change of System State ( J l )
The combination of load flow, stability and switching surge studies caused by and in the presence of an MHD-EMP environment will lead to an understanding of complete system operational response and final system state after the nuclear event. In the case of MHD-EMP assessment, several system base cases should be studied. These cases should range from systems essentially unaffected by the HEMP environment to cases where the power system is critically disturbed by HEMP irior to the MHD-EMP assessments.
4.6 DC Transmiss,ion Analysis
Based on previous analyses [7] of direct current transmission and terminal station operation during geomagnetic storm environments, dc system operation must be assessed for the following aspects.
0 Terminal harmonic f i 1 ter performance 0 Probability o f terminal commutation failure
In each of the above assessments, the spectral content of the power frequency harmonics (Data base F1) must be compared to the dc terminal data base to ascertain possible impact.
4.6.1 Data Base: DC Terminal (F3)
In task F3 the equipment present in the dc converter terminals is quantified in terms of harmonic filter rating and commutation performance. In terms of the odd harmonic filters (5, 7, 11 , 13) and

64
the high-pass f i l t e r s the parameters of fundamental current rating and harmonic current rating are quantified. The probability of commutation fa i lure is based upon the comparison of voltage harmonic dis tor t ion level and commutator performance.
4.6.2 Assessment: DC Converters and Fi l te rs ( G 2 )
The dc terminal assessment would quantify the probability o f damage t o harmonic f i l t e r s due t o sustained overload. In the case of protective systems which remove f i l t e r s from operation d u r i n g overload s t a t e s , the impact of f i l t e r absence must be addressed. Failure of converter commutation must be viewed from the perspective of d i rec t equipment damage and/or loss of dc transmission capabili ty.
4.7 Generator Analysis
The over excitation of generator step-up transformers will resu l t i n harmonic current as seen by the generator windings. The second harmonic (negative sequence) current in particular could produce severe heating problems i n the machines. The heating occurs due t o rotor coupling and consequential flow i n sol i d rotor forgings, non-magnetic rotor wedges and retaining rings w i t h heat concentrated a t shrink f i t interfaces. The result ing I R loss causes melting and other damage to the rotor structure. Negative sequence currents may also result due t o phase current imbalance caused by unequal excitation o f the transformer bank .
2
4.7.1 Data Base: Generator Design (F4)
This data base will be formed from generator design information and applicable ANSI standards, which define the permissible magnitude/time duration of the square of the negative sequence current, i n per u n i t .
4.7.2 Assessment : Generator Damage (63)
The preliminary assessment consists of the comparison of the negative sequence current t o the threshold levels fo r generator designs.

65
More detailed analysis, based on manufacturers specif ic data may be required t o determine the probable extent of the damage.
4.8 Instrument Transformer Analysis
Knowledge o f the steady s t a t e and t ransient performance o f instrument transformers exposed t o an MHD-EMP environment is of c r i t i c a l importance fo r instrumentation and protective relay system assessment. The simultaneous ac and dc excitation will result in transformer operation closer t o o r i n the saturation s t a t e . The partial o r fu l l saturation will cause the secondary voltage o r current waveform t o deviate from the primary waveform. For t ransient f a u l t conditions, a dc o f f se t in the f a u l t current of the same polarity as the dc branch current can substant ia l ly reduce the time t o saturation.
4.8.1 Data Base : Instrument Transformers (64)
The data base should contain the following information (1) bus location of the instrument transformer, ( 2 ) operating character is t ics including saturation curves and time to saturation charac te r i s t ics , ( 3 ) configuration of secondary connection, (4) connected r a t io , and ( 5 ) burden. T h i s information is used i n conjunction w i t h the harmonic data base (Fl) and the dc branch current data base (Dl) t o quantify operational performance i n terms of the modified nature o f the secondary waveforms.
4.8.2 Assessment: Current Transformer Operation (H2)
Based on the magnitude and time history of the dc branch current exciting the current transformer, i n conjunction w i t h ac excitation, the percent e r ror of CT response will be calculated. For a given magnitude of dc current, i t i s expected tha t higher CT ra t ios combined w i t h lower secondary burdens will r e f l ec t be t te r performance. The error will a l so be investigated t o ascertain the change i n r a t i o e r ror and phase angle e r ro r f o r a given transformer. Secondary waveform harmonic content must be investigated. I t i s expected tha t the to ta l harmonic content will be

66
a function of self-generated harmonics and harmonics caused by nearby power transformers. An analysis must be made of the possible magnitude of CT remanent flux and reduced time to saturation under fault conditions.
4.8.3 Assessment: Voltage Transformer Operation (H3)
In a manner consistent with the assessment described for current transformers, a similar analysis will be made for voltage transformers. It is expected that the voltage transformer will be less impacted in performance for a given level of dc current. Assessment of capacitive coupled voltage transformers (CCVT) must also be accomplished.
4.9 Instrumentation, Control and Relay System Analysis
Subsequent to the assessment of current and voltage transformer operation in an MHD-EMP environment, this information must be integrated into the analysis of instrumentation, control and protective relay schemes. For instrumentation, the assessment should consist of the quantification of measurement error introduced by the modified secondary waveforms of the instrument transformer. Control system operation must be investigated to ascertain the impact of misleading input information. Protective relay schemes must be investigated in the context of relay security and operational dependabi 1 i ty .
4.9.1 Data Base: Instrumentation and Control Systems (12)
This data base will contain the operating characteristics of measurement instrumentation including transducers and metering systems. Measured system parameters for assessment are voltage, current, frequency, real and reactive power. The control system data bases should include the operating characteristics for systems such as automatic generation control , load frequency and voltage control schemes. The ability of control systems to filter ''bad" data must be included in this documentation.

67
4.9.2 Assessment: Instrumentation and Control System Operation (52)
The assessment will quantify the amount of measurement error contained in the output of instrumentation systems. The total error will be the combination of the ratio and phase angle errors of the instrument transformers in conjunction with the modified uncertainty of transducers and metering systems. A sensitivity analysis should be performed based on instrument transformer secondary burden. Control system operational assessment is based upon the ability of these systems to perform their intended functions given distorted power system parameter input data.
4.9.3 Data Base: Protective Relay System (13)
In this task, a data base is established for the protective relays installed on the system. Information contained in the base will include (1) type of relay, (2) relay settings, (3) relay operating characteris- tics and, (4) corresponding instrument transformer( s).
4.9.4 Assessment: Protective Relay System Operation (53)
The assessment will consist of the quantification of relay system security and relay system dependability. A loss of security is defined as an undesired relay operation in the absence of these system conditions for which the relay must perform its intended function. The loss of relay system dependability is defined as the failure to operate or, operation with excessive delay for system abnormal conditions. For example, dependent on relay design, the primary effect of current transformer secondary distortion may be zero-crossing shift, peak reduction, rms value reduction or harmonic content. Relay systems of particular interest include current differential protection, overcurrent protection, undervol tage schemes and distance relaying applications based on line impedance parameters.

68
4.10 Power Fuse Analys is
The combination o f normal power frequency c u r r e n t and t h e dc c o n t r i b u t i o n from the MHD-EMP event may r e s u l t i n power fuse misoperation. Th is p o t e n t i a l r i s k assumes increas ing importance s ince the fuse i s a s i n g l e opera t ion device. A blown power fuse requ i res manual replacement which can increase t h e t ime requ i red f o r e l e c t r i c a l serv ice res to ra t i on . The dc cu r ren t may a l so impact system device coord inat ion.
4.10.1 Data Base: Power Fuses (65)
Th is data base cons is ts o f fuse opera t ing curves which d e p i c t t he r e l a t i o n s h i p between t ime and rms t o t a l cur ren t . A t y p i c a l se t o f curves i s shown as F igure 24.
4.10.2 Assessment : Fuse Ooeration (H4 1
The power fuse data bases w i l l be compared t o t h e expected values o f 60 Hz and power frequency harmonic rms c u r r e n t combined w i t h t h e MHD-EMP dc value t o asce r ta in t h e p r o b a b i l i t y o f fuse operat ion.
4.11 U t i l i t y Comnunication Systems Analys is
U t i l i t y communication systems can inc lude a wide v a r i e t y o f methods. The in fo rmat ion t r a n s f e r may be voice, analog o r d i g i t a l i n form corresponding t o t h e te lemetry , c o n t r o l and/or p r o t e c t i v e system func t ions requi red. For MHD-EMP assessment, communications can be considered as two general categor ies.
0 Radio communication systems inc lud ing p o i n t - t o - p o i n t microwave and base s ta t ion /mob i le r a d i o equipment.
0 Wire based communication systems which can take the form of (1) power l i n e c a r r i e r , (2 ) s h i e l d wire, (3 ) u t i l i t y owned tw is ted p a i r and coax ia l c i r c u i t s , and (4) leased telephone 1 ine.

69
- CURRENT IN A'MPERES
Fig. 24. Typical power fuse.characteristic curves.

70
In the case of wire communications, the MHD-EMP environment is identical to that previously discussed for the power system grid. For assessment of radio communication links only, additional environmental definition concerning signal propagation in and through the atmosphere and ionosphere will be required. As a practical expedient, a single "reasonable worst case" environment could be defined for use with several surface electric field environments.
4.11 . l Data Base: System Line Communications (B2)
In this task the spatial orientation, circuit impedance in terms of dc resistance and ground connections for the line communication systems is detailed. In the case o f power line carrier systems, this data base will have previously been defined in task Bl.
4.11.2 Model: Line Communication System Response (C2)
Based on the information gathered in the previous task and the specified electric field environment, an equivalent dc network is simulated and resolved for the individual dc branch currents. This approach is qualitatively identical to that used in the power system res pon se n et wo r k .
4.11.3 Assessment: Line Communication ODeration fD2)
Given the time dependent magnitude of the dc branch currents, the increase in channel noise and/or threshold of circuit upset is assessed. As an example, previously measured upset threshold for a type L-4 power feed loop circuit occurred between 420 and 600 milliamperes of dc current. In addition, an increase o f 10 dB in intermodulation noise was experienced at a dc line current of 435 milliamperes.
4.11.4 Data Base: System Radio Communications (B3)
In preparation for assessment of uti1 ity radio communications in an MHD-EMP environment, the systems are categorized by (1) the frequency of the carrier, ( 2 ) the normal signal to noise ratio and, (3) type o f function and/or information content.

71
4.11.5 Assessment: Radio Communication Operation (C3)
The propagation of the above types of radio comnunication system through the atmospheric environment is analyzed to determine the probability of and the duration of loss of communication channel. It is expected that higher frequency communications 1 inks will be more affected than lower carrier frequencies. For example, during a severe geomagnetic storm, a 1500 kHz signal was attenuated by 33 dB, while at 820 kHz, the attenuation was 19.8 dB. Mobile radio communications frequency bands between 1600 and 2850 kHz or 3.1 to 512 MHz may be severely affected.
4.12 Summary
The MHD-EMP assessment methodology is consistent with the techniques employed for power system analysis under geomagnetic storm environments. The spatial variability of the electric field excitation as a function of burst location introduces additional complexity for the MHD-EMP event. The higher intensity of the MHD-EMP electric field, in local areas, requires the analysis to be extended to subtransmission and distribution networks located in these areas.
The methodology is predicated upon the ability to quantify the magnitude and direction of quasi-dc circulating currents. This transient phenomena, in conjunction with normal power frequency current interacts with power and instrument transformers to place the system at some risk. Preliminary risk assessments, planned for subsequent phases of the research effort will serve to validate the approach documented herei n.

72
5. NETWORK MODELS AND ANALYSIS CODES
5.1 Introduction
The geographic extent of the power system grid, subject to evaluation by the MHD-EMP assessment methodology, is explicitly dependent on the corresponding geographic profile of the surface tangential , transient electric field E(x,y;t). By convention, the surface coordinate origin (0,O) is located at the equivalent ground zero location for the high altitude nuclear burst. Previous MRC simulations [3] indicate that the affected area may be several million square kilometers. Within the continental United States, such an expanse will certainly contain an extremely complex power system grid operated by more than one electric utility. .
In this section, it will be shown that the interconnected power system grid can be modelled as a series o f isolated dc response networks for the quantification of the induced circulating currents. Each network is constructed from dc models of power system components , purely resistive in nature, and voltage sources corresponding to the electric field.
The section concludes with a discussion of the various digital analysislsimulation codes embedded in the methodology. The discussion jncludes identification of several existing candidate codes and requirements for additional code development.
5.2 DC Response Network Topology
The fundamental concept which a1 lows the interconnected power system grid to be modelled as a series of dc networks is based on the fact that a continuous dc path must exist between ground points for the flow o f the induced circulating currents. DC network discontinuity will occur due to:
0 Prior fragmentation of the power system grid caused by HEMP environments.
73
0 Existence o f i solated-winding power. transformers whose s imu la t i on models incorpora te a dc open c i r c u i t .
0 Series capac i to rs and o ther e l e c t r i c a l equipments whose models a re dc open c i r c u i t s .
I n order t o i l l u s t r a t e t h e above concept, an example o f a dc response network developed from a scenario o f power system g r i d i s presented i n F igure 25(a) and 25(b). The g r i d o f F igure 25(a) conta ins a t y p i c a l m ix tu re o f iso la ted-winding power transformers, an autotransformer (bus 7 ) and shunt reac to rs (bus 5 and bus 6). The presence o f the d e l t a transformer winding connection a t a bus w i l l r e s u l t i n a dc open c i r c u i t c o n d i t i o n i n t h e response network model. The corresponding dc response network (F igure 25(b)) cons i s t s o f appropr ia te dc res is tance branches and dc vo l tage sources i nse r ted a t each ground loca t i on .
I n t h i s simple example, t h e magnitude o f t h e e l e c t r i c f i e l d , E(X,Y)
i s assumed t o be constant and the d i r e c t i o n 6(x,y) i s assumed f i x e d . Given these assumptions, i t can be pred ic ted t h a t t he induced dc c i r c u l a t i n g cu r ren t w i l l f l o w from t h e ground te rmina t ion a t bus 8 t o the ground te rmina t ions a t bus 1 and bus 3 . The magnitude o f each vo l tage source i s a f unc t i on o f t h e l eng th o f conductor between each grounded bus and t h e s p a t i a l o r i e n t a t i o n o f t h e conductor and the f i e l d d i r e c t i o n . I f requi red, each vo l tage source can be modelled as the respec t ive equ iva len t Norton cu r ren t source.
Any MHD-EMP power system assessment w i l l e n t a i l t he s o l u t i o n of many dc coup l ing response networks. Each network may represent transmission, subtransmission o r d i s t r i b u t i o n segments o f t h e power system g r id . Previous geomagnetic storm assessments [7] have concentrated on c i r c u i t s o f opera t ing vo l tages a t o r above 69 kV. Maximum e l e c t r i c f i e l d s were simulated a t 6.2 vo l t s / k i l omete r . Th is maximum f i e l d va lue combined w i t h t y p i c a l l i n e lengths a t s p e c i f i c opera t ing vo l tages and code s i z e 1 i m i t a t i o n s were c o n t r i b u t i n g f a c t o r s i n s imu la t ion l i m i t a t i o n .

74
Fig . 25(a). Segment o f power system g r i d .
BUS I BUS 2 B.US3 BUS4
F ig . 25(b). DC response network.

75
For MHD-EMP environments i t is expected that certain areas of the power system g r i d can experience e l ec t r i c f i e ld gradients several times
V/km. Hence, l ines of shorter lengths a t lower evels must be considered.
greater than 10 operating vol tage
5
The component
3 Models for Power System Components
models which const i tute the MHD-EMP response network are s t r i c t dc equivalents fo r each type of equipment. This fac t has bo th advantages and drawbacks. The advantages consist of a simple dc network which contains frequency independent models. A practical drawback to this approach i s that the dc equivalents of power system components are n o t normally contained i n the system data bases of most u t i l i t i e s since there a re very few applications where such models are needed i n frequent u t i l i t y studies. Typical dc component models a re presented as Figure 26. These models a re discussed below.
5.3.1 Transmission and Distribution Conductors
Transmission l ines , dis t r ibut ion feeders and cables a re represented by the lumped dc resistance of the conductors. The most accurate data i s established by the d i rec t measured values of dc resistance. A practical approximation can be derived by the application of a correction factor (0.95 to 1.0 depending on the s ize and construction of the conductor) t o the relevant positive sequence resistance [8]. The correction is required due t o the fact tha t skin and proximity e f fec ts for a dc current a r e negligible when compared to 60 Hz current. Table 4 depicts typical conductor 60 Hz resistance for select voltage levels.
Once the dc resistance of each conductor is known, the dc resistance of the l i ne or feeder can be simulated by paralleling the phase conductors. For example, for a typical three phase l i ne , the total lumped resistance incorporated i n t o the response network is one-third of the value for a phase conductor.

76
Table 4
TYPICAL CONDUCTOR 60 HZ RESISTANCES FOR DIFFERENT VOLTAGE LEVELS
Voltage( kV) Construction 60 Hz Resistance(ohms/ki lometer)
69 138 138 345 500 500 765 7 65 1200 1200
(Typical ) "H" Design Vertical Design Horizontal Design Delta Design Vertical Design Hori zonta 1 Design Horizontal Design Delta Design Horizontal Design
0.1875 0.0786 0.0867 0.0419 0.0344 0.0314 0.0153 0.01 33 0.0222 0.0071
5.3.2 Power Transformers
Power transformer models, incorporated into the system networks, can be developed according to the following criteria:
8
0 Existence of dc circuit connections within transformer .
res pon se
the
0 DC resistance of transformer windings.
Select models developed per the above criteria are contained in Figure 26. The existence of a delta winding configuration will always result in an equivalent dc open circuit. With the exception of autotransformers, any ungrounded winding will result in an equivalent dc open circuit. In the case of the ungrounded autotransformer, the series winding only will be represented. All transformer configurations which

77
1. TWO CIRCUIT SOLATED WINDING TRANSFORMERS
NEUTRAL
IMPEDANCE b GROUNDED NEUTRALS
U N G g k D E i a C E' C'
2. TWO CIRCUIT AUTO TRAKFORMER
I O '
SDL?D/:Y 0 1 r b ' GROUNDED AUTO
L ' e. 1 CI
c I 1 - C '
OC MODEL FOR THREE LINE I SIMULATION
1
I I I I I I I I I I I I I I I I I I I I I I
I
DC MODEL FOR sir.;x LINE SIMULATIOX
R Y 3 _m__
Fig. 26. DC models o f power system components.

78
\
=%%OR BANKS
I 6 SURGE
ARRESTORS
I
7. BREAKERS1 O- I RECLOSURES b-z- I
0. W M O N I C FILTERS
RL
I
0
1
RB 0-
b c .RB
Rc Rc Rc
0
b
C
RL II.
I I I I I I I I I I
/-
Fig. 26. components. (continued)
DC models o f power system

79
conta in grounded windings can be represented by a 1 umped r e s i s t i v e element, per phase. Grounded autotransformer app l i ca t ions are represented by both t h e ser ies winding res is tance and the common winding resistance. Any a d d i t i o n a l res is tance between t h e transformer ground connection terminal and the ground plane i s modelled separately.
The value f o r any p a r t i c u l a r dc winding res is tance can be obtained
f r o m manufacturer 's data where t h e res is tance i s d i r e c t l y measured. I n the absence o f such data, approximate values can be der ived from s h o r t - c i r c u i t impedance values. The assumption i s made t h a t the pr imary winding res is tance and t h e r e f e r r e d value o f the secondary winding res is tance a r e equal. A s i m i l a r approach i s used f o r autotransformers. The res is tance observed a t the h igh vo l tage terminal ( low vo l tage shorted) i s t h e sum o f t h e ser ies winding res is tance and the r e f e r r e d value o f t h e common winding res is tance. The r e f e r r e d value i s based upon the r a t i o o f ser ies t o common terms. The i n d i v i d u a l winding res is tances a r e approximated by assigning h a l f the shor t c i r c u i t res is tance t o the ser ies winding and the r e f e r r e d remaining h a l f t o the common w i nd i ng .
5.3.3 Shunt Reactors
Shunt reac tors a r e requi red i n the ana lys is o f t h e c i r c u l a t i n g MHD induced cur ren ts s ince they provide a path t o ground. The model cons is ts o f the dc res is tance o f the shunt reac tor and can be ca lcu la ted o r approximated given the manufacturer 's data. Reactance, as i n the case o f t ransformers, i s n o t presented i n the model. The th ree phase model cons is ts o f a res is tance equal t o one- th i rd o f the phase resistance.
5.3.4 Capacitors
Ser ies o r shunt capaci tors are open c i r c u i t s f o r the dc and quasi dc cur ren ts and hence they a r e l e f t o u t o f the system model. I n f a c t , ser ies capaci tors a c t t o s e c t i o n a l i z e t h e power system and block the passage o f t h e c i r c u l a t i n g induced currents .
,

80
5.3.5 Surge Arresters
Surge a r res te rs of a l l designs resu l t i n an open c i r cu i t i n the response network since they provide an extremely high resistance to ground a t quasi-dc frequencies. A possible area of concern ex is t s for a r res te r operation i n the MHD-EMP environment. I t has been reported [9] that dc current due to geomagnetic storms can resul t in a neutral shif t \
which prevents the re-sealing o f the a r res te r . This aspect of a r res te r performance will be investigated as p a r t of j o i n t HEMP/MHD-EMP assessments.
5.4 Grounding Resistance
The power system response network must also incorporate the dc grounding resistance which will ex is t between the system component model and the network ground plane. In the absence of measured values, a reasonable approximation must be made for this res i s t ive element. In many cases, this terminating resistance is a significant percentage of total c i r c u i t resistance.
Previous studies for geomagnetic storm environments [7] have specified a value of 1 ohm fo r the resistance a t each ground connection in l ieu of measured data. Sensit ivity analysis of magnitude of circulating current as a function of grounding resistance and comparison t o measured neutral currents validate the above assumption. In the absence of measured data, any "reasonable" worst-case assessment must include practical estimates of soil conditions on a s i te-specif ic basis. For example, an analysis which includes an a r i d topology may require an estimate of several ohms per termination. In this case, the assumption of a terminating impedance based on some uniform value (0.5 ohms as used in previous analysis) , will resu l t in a significant overestimation for the magnitude of the circulating current.
In the case of h i g h impedance grounds, where the 60 Hz impedance i s established by a reactor, the effect ive dc resistance associated w i t h that reactance would be incorporated i n the response network.

5.5 Analysis Codes
As indicated by the assessment methodology, complete power system analysis wi 11 requi re the use of several network/system simulations. These simulations a re best accomplished via d ig i ta l codes and d ig i ta l data processors. A conceptual flowchart indicating the type and relationship between elements of this body of code is shown as Figure 27. Code subsets and tasks a re discussed as follows:
5.5.1 System Response Network Analysis
The calculation of c i rculat ing induced currents due t o the MHD-EMP envi ronment requires only a dis t r ibuted source, dc system representation. The mathematical solution is straightforward, b u t the code must be able t o represent a large network in a single analysis.
One good candidate for t h i s analysis i s the Electromagnetic Transients Program (EMTP) [10,11]. This program has become an industry standard and does not require any modification t o existing code t o perform the simulation. For large systems, the EMTP is instal led in a CRAY and/or CDC 7600 environment. I f appropriate, a dedicated version of EMTP could be developed for this analysis.
Data base i n p u t / o u t p u t requirements fo r EMTP would be enhanced by the development of pre-processor and post-processor modules. The pre-processor should contain graphic d ig i t iz ing capabi l i ty , since many parameters o f the MHD-EMP environment and power system g r i d data bases a re graphic i n format. The EMTP post-processor would create data format compatibility and automatic calculation o f system harmonics and reactive power data bases required by subsequent analysis codes.
5.5.2 System Load Flow/Dynamic Simulation
There ex i s t s a number of load flow/dynamic simulation programs in comnon use w i t h i n the power system analysis community. One such set of these programs is the Westinghouse WESTCAF System Planning and Analysis package. This 1 i brary of power system analysis programs incorporates detailed load flow and dynamic system models implemented from a common

82
data base. Maximum system size for load flow is 4,000 buses, and 8,000 branches. The WESTCAF package a1 so contains a short-circuit program, eigenvalue analysis, and network equivalent capability.
5.5.3 Switching Surge Analysis
The effects of 1on.g line energization, single and three pole reclosing and other switching operations in the MHD-EMP environment can be investigated by the use of the EMTP program. This program has been used by Mohan [12] and others to perform similar studies for geomagnetic storm envi ronments.
5.5.4 Power Fuse Analysis
For lower-voltage distribution systems, the simultaneous presence of ac and dc current may affect the proper operation and coordination of power fuses. To evaluate this situation, an analysis code could be developed to assess this concern. It is expected that preliminary risk assessment on distribution systems will clarify the need for such a tool.
5.6 Summary
For MHD-EMP assessment, the ac power system grid topology can be simulated as a set of dc equivalent networks. Thus, the initial system response, transient induced branch currents, is approximated as a slowly time-varying dc phenomena. The reasonability of this approach is supported by:
0 The very-low frequency content of the electric field excitation.
0 Strong similarity between MHD-EMP and geomagnetic storm envi ronment s .
0 Validation of this technique, for geomagnetic storm simulations, based on measured values of the magnitude and spectral content of the induced current and the associated impact on system parameters.

83
From a perspect ive o f balanced uncer ta in ty , p r e l iminary i n v e s t i g a t i o n i n d i c a t e s t h a t any e r r o r s introduced by a dc s imu la t ion i n l i e u o f a very low frequency ac approach may be swamped by t h e uncer ta in ty inherent i n the environmental d e f i n i t i o n .
D i g i t a l code development requi red by t h e MHD-EMP assessment methodology can incorporate, w i t h some mod i f i ca t ion , e x i s t i n g codes now used i n storm assessment. The s p a t i a l ex ten t o f t h e MHD-EMP environment i n d i c a t e s the use o f s i g n i f i c a n t capac i ty load f l o w codes. A t t h i s t ime, t h e authors a n t i c i p a t e the use o f an 8,000 branch program. Pre l im inary assessments w i l l reveal any requirements f o r a l a r g e r capaci ty code.

84
I I
Q
v)
W
U 0
V
c, S
W
v)
W
v)
v)
<
5 I n I
= L 0
cc
h
W 0
E: 0
V

85
6. CONCLUSIONS AND RECOMMENDATIONSc
I n i t i a l research t o investigate the e f fec ts of an h i g h a l t i t ude nuclear burst on the e l e c t r i c power system indicates t ha t the MHD-EMP environment - may place the system a t some risk. The nature of the threa t can be qual i ta t ively defined i n terms o f quasi-dc induced currents caused to flow between system ground connections due t o the existence of a t rans ien t , surface tangential , e lec t r i c f i e ld . In preparation for quantitative r i sk assessment , an extensive methodology has been developed. This methodology incorporates the necessary environmental and power system d a t a bases, coupling response mechanisms and power system analysis techniques necessary t o perform quant i ta t ive assessment.
In the areas o f MHD-EMP environmental def ini t ion, power system coup1 i n g response , methodology development and system analysis , the following conclusions a re reached:
\
1 .
2.
3 .
4.
A high a l t i t u d e nuclear weapon burst will produce bo th HEMP and MHD-EMP t ransient electromagnetic environments. The radical ly d i f fe ren t natures of these t ransients , as seen by an e l e c t r i c power system requires separate system response models and assessment methodologies.
For power systems analysis, the MHD-EMP environment can be defined as a spat ia l and time dependent, surface tangential , t rans ien t e l e c t r i c f i e ld . Additional def ini t ion for r a d i o frequency propagation will be required for those assessments which include u t i l i t y radio communication systems.
Spectral analysis of typical MHD-EMP magnetic and e l e c t r i c f i e l d s indicates t ha t the e l e c t r i c f i e ld can be approximated as a quasi-dc stimulus to the power system.
Previous MHD-EMP environmental formats a re not o f a form t h a t can be d i rec t ly used i n power systems analysis. To f a c i l i t a t e this type of assessment a sui table approximate environment may be expressed in terms of three independent parameters: (1 ) spa t i a l ly dependent magnitude of the e l ec t r i c f i e ld E ( x , Y ) ; ( 2 ) spa t ia l ly dependent direction of the e l e c t r i c f i e l d e (x ,y) ; and ( 3 ) a time-dependent, spa t ia l ly invariant function f ( t ) .
86
5.
6.
7 .
8.
This d e f i n i t i o n o f E(x,y;t) cou ld be expanded, by a sum o f products s t ruc tu re , t o incorpora te g rea ter accuracy f o r a s i n g l e bu rs t o r u n i f i e d environmental d e f i n i t i o n i n the case o f m u l t i p l e weapons' bursts .
The na ture o f t he MHD-EMP environment e x h i b i t s s u f f i c i e n t s i m i l a r i t y t o the geomagnetic storm environment such t h a t a p a r a l l e l system response mechanisms and assessment methodology can be defined.
The system response network conta ins dc r e s i s t i v e models and t ime vary ing dc d i s t r i b u t e d vo l tage sources. The i n i t i a l response o f i n t e r e s t i s q u a n t i f i e d as t h e t ime vary ing dc induced cu r ren ts f l ow ing simul taneously w i t h normal 60 Hz cur ren ts .
The ex is tence o f these dc branch cur ren ts i s t h e bas is f o r subsequent power system ana lys is . Over-exci t a t i o n o f electro-magnetic equipment such as transformers may r e s u l t i n d i r e c t damage t o t h i s equipment as we l l as power system opera t iona l upset.
E x i s t i n g power system ana lys is d i g i t a l codes, such as EMTP and WESTCAF, can be mod i f ied and/or d i r e c t l y incorporated i n t o t h e MHD-EMP assessment methodology. These, and s i m i l a r programs, a r e c u r r e n t l y used i n geomagnetic storm/power system assessment.
Th is i n v e s t i g a t i o n o f t he MHD-EMP phenomena has revealed several areas o f add i t i ona l research requ i red t o perform d e t a i l e d and accurate r i s k assessment. These inves t i ga t i ons should be accomplished as p a r t o f
t h e Phase I1 research e f f o r t p r i o r t o ac tua l p re l im ina ry assessments.
The recommendations f o r a d d i t i o n a l research are:
Deta i led development o f an MHD-EMP environmental d e f i n i t i o n d i r e c t l y s u i t a b l e fo r power systems ana lys is . Suggested bas is f o r such research i s t he €(x,y;t) expression contained i n t h i s repo r t . The research should be a coordinated e f f o r t o f t h e Defense Nuclear Agency and Oak Ridge Nat ional Laboratory w i t h assistance from the Phase I research team. F ina l d e f i n i t i o n would be incorporated i n t o t h e o v e r a l l scenario d e f i n i t i o n s suppl ied by ORNL t o t h e research team.
Add i t iona l emperical and a n a l y t i c a l i n v e s t i g a t i o n o f power and instrument transformer response t o simultaneous ac and dc e x c i t a t i o n . Th is research should i nc lude

87
actual equipment testing and response simulation. Critical parameters include quantification of direct damage, harmonic generation, waveshape distortion, and increased reactive power requirements.
3. Investigation of simultaneous ac and dc current versus power system fuse performance. Fuse mis-operation , especially within distribution networks, may result in si gni f icant el ectr i c service interrupt ion.
4. Operation of surge arresters under the MHD-EMP environ- ment. The investigation should concentrate on the probabi 1 i ty of re-seal failure.
88
7. B I BLOGRAPHY
1. Longmire, C. , Technical Presentation, DOE/ORNL P r o j e c t Review Meeting, October 20, 1983.
2. DNA EMP COURSE, BDM/W-82-305-TRY Prepared By t h e BDM Corporation, January , 1 983.
3. Chavin, S., Crevier, W. F., K i l b , R. W., and Longmire, C. L., "MHD- EMP Code Simulat ion o f S tar f i sh , " MRC-R-516, Miss ion Research Corporation , August , 1979.
4, Fajen, F. E. , "Mice: An I m p l i c i t D i f fe rence Scheme For MHD Calcu- l a t i ons , " DNA-2877ZY Mission Research Corporation, March, 1973.
5. C. Longmire, Miss ion Research Corporation, P r i v a t e Correspondence t o F. M. Tesche, LuTech, Inc., A p r i l , 1982.
6. Albertson, V. D., and Van Baelen, J . A., " E l e c t r i c and Magnetic F ie lds a t t h e Ear th ' s Surface Due t o Auroral Currents," I E E E Transactions on Power Apparatus and Systems, Vol. PAS-89, No. 2, A p r i l , 1970, pp. 578-584.
7. " I n v e s t i g a t i o n o f Geomagnetically Induced Currents I n t h e Proposed Winni peg-Dul uth-Twin C i t i e s 500- kV Transmission L ine , " EPRI EL-1949, E l e c t r i c Power Research I n s t i t u t e , Ju ly , 1981.
8. Albertson, V. D., Kappenman, J. G., Mohan, N., and Skarbakka, G. A., "Load-Flow Studies i n t h e Presence o f Geomagnetically- Induced-Currents ,I' I E E E Paper F79-702-2, presented a t the 1979 Summer Power Meeting , Vancouver , B.C.
r
9. Albertson, V. D., and Slothower, J. C., "The e f f e c t s o f Solar Mag- n e t i c A c t i v i t y on E l e c t r i c Power Systems," U n i v e r s i t y o f Min. , Aca. o f Science, Vol. 34, November 2, 1967, pp. 94-100.
10. Dommel, H., and Meyer, W. S . , "Computation o f Electromagnetic Transients," Proceedings o f t he IEEE, Vol. 62, pp. 983-993, Ju ly , 1974.
11. User 's Manual - Electromagnetic Trans ients Program (EMTP) , Bonne- v i l l e Power Admin is t ra t ion, Port land, Oregon.
12. Mohan, N., Kappenman, J. G., and Albertson, V . D., "Harmonics and Switching Trans ients i n t h e Presence o f Geomagnetically- Induced Currents," IEEE Paper F79 694-1, presented a t t h e 1979 Summer Power Meeting, Vancouver, B.C.

89
13. Albertson, V. D . , Clayton, R. E . , Thorson, J. M., J r . , and Tr ipathy, S. C . , "Solar-Induced Currents i n Power Systems: Cause and Ef fec ts : , " IEEE Transactions on Power Apparatus and - Systems," Vol. PAS-92, No. 2 , March/April, 1973 s PP. 477 4//*

90
APPENDIX A
DETERMINATION OF THE MHD-EMP ELECTRIC FIELD AT THE EARTH'S SURFACE
In the determination of the MHD-EMP induced currents flowing i n grounded conductors on the earth's surface, i t i s necessary t o f i r s t compute the tangential electric field which excites these conductors. This electric field arises from the interaction with the late-time MHD-EMP magnetic field and the conducting earth.
The geometry for this discussion i s shown as Figure A-1. On the surface of the earth there i s an impressed magnetic f l u x density, denoted a s Bx, oriented in the x direction. The earth i s assumed t o have an electrical conductivity of (T mhos/meter, and a permeability equal t o t h a t of free t h a t computed from the
Within the earth, equation :
space. This impressed magnetic field density i s MICE/MHD-EMP codes a t the earth's surface.
the electric field i s described by the following
i n which the displacement current term has been neglected [All. Because the earth is imperfectly conducting, i t 'can suppor t a volume current density, and this i s related t o the electric field by:
For an electric f ie ld which i s locally oriented i n the y direction and assumed t o be independent of the x and y coordinates, this equation reduces t o the following form:
3 a2J 2 = p(T az a t 2
(A3 1

91
Considering t ime harmonic (Four ie r transformed) s igna ls , t h i s r e l a t i o n can be expressed i n the frequency domain as:
which may be solved t o y i e l d t h e s p a t i a l d i s t r i b u t i o n o f induced cu r ren t i n the e a r t h as:
Jy(z) = A, e -z/6 ,-jz/6
where 6 i s t h e s k i n depth def ined as:
( A 5
and A, = J ( 0 ) i s t h e value o f t he volume cu r ren t on t h e e a r t h ' s s u r f ace.
Y
The i n t e g r a l o f t h e volume cu r ren t from -m t o 0 i n the z d i r e c t i o n
, provides the equ iva len t sur face cu r ren t K and i s g iven as: Y
= /' Jy(z) dz = AO KY -OD m (A7
A t t h e e a r t h ' s surface, t h e volume cu r ren t d e n s i t y i s r e l a t e d t o the l o c a l e l e c t r i c f i e l d as:
Jy(o) = A, = d y ( o ) (AB)
and thus t h e sur face cu r ren t can be expressed as :
- a6 . - - - EY KY - (1) EY 2S

92
where Zsis the equivalent surface impedance of the earth.
Since the surface current is related t o the t o t a l magnetic field on the surface as:
Ky = Hx
and given the fact t h a t t h , ; i s relateh t o the magnetic f l u x as:
Bx = Po Hx
the electric field on the earth surface may thus be expressed as:
This last expression may be written as:
which is o f the form:
F ( w ) = G(w) H(w) (A141
In the time domain, i t i s possible t o express this t h r o u g h the convolution operator * as:
f ( t ) = g ( t ) * h ( t ) = / t g ( t - T) h(- r ) d-c (A1 5) 0
where g ( t ) and h ( t ) are the Fourier transform pairs of G(w) and H(w) respectively. The following Fourier transform pairs [A21 are noted:

93
. and
1 1
6 fi l o 6
Inserting these into equation (A15) yields the following expression for the time dependent electric field in terms of the magnetic field
t x i ( t ' ) dt' 1 1 Ey(t) =
This equation may be evaluated by direct tntegration, or if desired, equation (A13) may be evaluated in the frequency domain and the inverse transform taken numerically to compute the transient field.
\

94
BIBLIOGRAPHY
A l . Ramo, S., and J. R. Whinnery, FIELDS AND WAVES I N MODERN RADIO, John Wiley and Sons, New York, 1964.
A2. HANDBOOK OF MATHEMATICAL FUNCTIONS, M. Abramowitz and I. Stegun, Eds., NBS Publ icat ion #55, June, 1964.

95
I - Z = O PLANE
Fig. A l . current vectors a t the ear th-air (Z=O) ixterface.
Orientation of the e l ec t r i c (E ) magnetic (P,) and

96
APPENDIX B
ELECTRIC FIELD EXCITATION OF ABOVE-GROUND CONDUCTORS
B. 1 Introduction
This appendix serves to discuss the MHD-EMP excitation of above-ground conducting 1 ines from an electromagnetic (EM) field point of view. In previous discussions of low frequency field coupling arising from geomagnetic storms [Bl,B2] the excitation of such lines has been formulated in the context of a field-induced ground potential which tends to induce currents in conductors connected to the ground at two different points. An alternate and entirely consistent manner of representing the excitation of such grounded conductors is to consider the total tangential electric field incident on the conductor, and use this to determine the induced current. This alternate approach of viewing the coupling problem is discussed in detail. The appendix concludes with a discussion of the equivalence of the geomagnetic storm coupling approach to the excitation of conductors using an electromagnetic field perspective only. The equivalence is possible due to the quasi-static (very low frequency) nature of both MHD-EMP and geomagnetic storm phenomena.
8.2 General EM Field Interaction with Conducting Bodies
As a starting point, consider the general scattering problem illustrated in Figure B1. A perfectly conducting body having a surface denoted by S is located in free space and is illuminated by an incident plane-wave electric field, denoted as E!nc This incident electric field induces a surface current J to flow on the conductor and this in turn produces a scattered field in such a way, that the total tangential electric field on the body surface (i.e., the incident plus the scattered field) is zero. The relation between the induced body current J(F') and the incident electric field Einc(r) may be expressed [B3] via an integral equation of the form

97
Fig.. B1. i l l u m i n a t e d by a plane wave.
Conducting body i n f r e e space,
INCIDENT E inc FIELD
REFLECTED'\
/ / / / / / / / / / / / / / / 1 1 1 1 11 1 FIELD
Q , C
I
Fig. B2. Conducting body loca ted over l ossy half-space and exc i ted by an i n c i d e n t plane wave.

98
where the f u n c t i o n E(;',:) i s t he f r e e space Green's tenso r f o r t h e r a d i a t i o n problem, and represents t h e vec to r e l e c t r i c f i e l d a t p o s i t i o n F due t o u n i t c u r r e n t elements a t p o s i t i o n F ' . As discussed [B3], t h i s
Green's f u n c t i o n i s de f i ned as:
I n t h i s and i n t h e expressions t o f o l l o w , w i s t h e angular frequency, k = w/c and p0 i s t h e pe rmeab i l i t y o f f r e e space.
Note t h a t i n equat ion ( B l ) t h e term EinC(F) denotes o n l y t h e
t a n g e n t i a l component o f t h e i n c i d e n t e l e c t r i c f i e l d on t h e body surface. The normal component i s n o t needed f o r t h e de terminat ion o f t h e s c a t t e r i n g behavior o f t he body. General ly, t h e de terminat ion o f t h e c u r r e n t d i s t r i b u t i o n J(F') i n t h e above equat ion i s impossib le t o do a n a l y t i c a l l y , and numerical methods such as t h e method o f moments [B4] a r e used.
B.3 E f f e c t o f Ground On EM Coupl ing
When t h e conduct ing body i s l oca ted near another body, say over a conduct ing ground plane, i t i s necessary t o modi fy t h e i n t e g r a l equat ion i n equat ion ( B l ) . As i n d i c a t e d i n F igure 82, t h e t a n g e n t i a l e l e c t r i c f i e l d on the body i s now composed o f n o t o n l y t h e i n c i d e n t f i e l d , b u t a l s o a component which has been r e f l e c t e d from t h e ground plane. As discussed [B5], s ince t h e i n c i d e n t f i e l d i s a p lane wave, i t i s poss ib le t o use p lane wave r e f l e c t i o n c o e f f i c i e n t s t o represent t h e r e f l e c t e d
f i e l d f rom the ground plane. Th is r e f l e c t e d f i e l d may be added t o t h e i n c i d e n t f i e l d t o p rov ide t h e t o t a l i n c i d e n t f i e l d on t h e body.
For t h e v e r t i c a l l y po la r i zed i n c i d e n t e l e c t r i c f i e l d shown i n F igure B3(b), t h e t o t a l e l e c t r i c f i e l d components a t a he igh t h above
t h e e a r t h a r e g iven by

99
a. Horizontal Polarization
b. Vertical Polarization
Fig. B3. and horizontally polarized incident and reflected fields.
Vector directions for vertically polarized

100
(B3 1 i n c e-jkycos J) COS @ [ + Rv e - j k2hs in $1 cos ,+ Ez(h,y) = E
Ey(h,y) = E i n c e-jkycos $ cos @ [ 1 - Rv e -jk2hsin $ 1 s i n $ cos @ (B4)
where Rv i s t h e r e f l e c t i o n c o e f f i c i e n t f o r v e r t i c a l l y po la r i zed f i e l d s and i s g iven by:
The angles $ and @ descr ibe t h e d i r e c t i o n s o f inc idence o f t h e i n c i d e n t f i e l d , and are shown i n F igure B4. The term represents t h e r e l a t i v e d i e l e c t r i c constant o f t h e ear th , such t h a t E = E ~ E ~ .
po la r i zed i n c i d e n t f i e l d shown i n F igure B3(a) a re g iven as S i m i l a r l y , t h e t o t a l f i e l d components f o r t h e h o r i z o n t a l l y
EZ(hyy) = 0 (B6) f
(B7 1 i n c ,-jky cos $ cos @ (1 + Rh e - j k2hs in I)) sin @ Ey(hYy) = E
where the r e f l e c t i o n c o e f f i c i e n t Rh i s g iven as:
Rh
I n add
t2 2
2 - - s i n $ - (E& + &)- cos $ )
4 s i n J, - (Er(1 + &) - cos ~ 1 )
t i o n t o t h e mod i f i ca t ion o f t h e i n c dent f i e l d f o r determin ing the induced body cur ren ts , i t i s necessary t o modify t h e kernel o f t h e i n t e g r a l equation. Th is i s necessary because t h e r a d i a t i o n proper ty of an elemental cu r ren t moment i s a f f e c t e d by t h e presence o f t h e ground plane. As i l l u s t r a t e d i n F igure 85, a cu r ren t

101
Z
00 t CONDUCTOR ?
0
1 ;1 AIR
DIRECTION OF- PROPAGATION \
\ 1 (6, P o ) I / / / Y
/ GROUND 1 ( P O c C , Q )
Fig. B4. elevation angles of incidence.
Coordinates defining azimuth and
OBSE RVAT ION POINT
PRIMARY SOURCE
/ PERFECT CONDUCTOR ,
IMAGE SOURCE
Fig. B5. over a perfect conductor.
Geometry of isolated current element

102
element J(F') i s located above the ground and the e l ec t r i c f i e ld i s observed a t a point F. I f the ground were removed, the expression for the e l ec t r i c f i e ld i s simply that given by the f ree space Green's function of equation (82). For the case of the ground being a perfect conductor, a simple image theory [6] may be employed in order t o calculate the f i e l d , as depicted i n Figure B5.
For the case of a lossy ground (one having a f i n i t e conductivity) the general expressions for the e l ec t r i c f i e l d s become rather complicated, involving integrals over an in f in i t e range which must be evaluated numerically. As discussed [B7], the e l ec t r i c f i e ld produced by a current element positioned above the ground plane may be expressed us ing a vector potential and the following equation:
For a ver t ica l ly oriented current element (one the z di rec t ion) , located a t the position z = h as shown i n Figure B6, and having a moment IdR, the vector potential has been shown [B7], t o also be only in the z
direction and takes the form:
For a horizontally oriented current element i n the x direction, the potential has both x and z components, and is expressed:

103
In both of these expressions, the terms B and 8, are constants for the air and the earth regions respectively, and are solutions to a propagation equation which must be determined numerically. The term n is the complex index of refraction, defined as:
The parameters 0 and p relate to the position of the field observation point, as shown in Figure B6,
The above expressions may now be used to construct the Green's tensor for the lossy ground. This simply consists of computing the x, y, and z components of the electric fields which are produced by x , y, and z directed current elements, in order to form the 3 by 3 tensor. As a result of these modifications, the integral equation for the body current then becomes
/ / J ( F i ) . [ ifs(?, F l ) + E (F, ? I ) ] dF' = inc(?) + EFef(F) (B13) S 9 Et
where the kernel has been expressed as a free space part and another part representing the ground plane effects. In this expression, it is. important to note that the domain of the integral equation remains over only the body. The ground plane effects are entirely accounted for by the modifications o f the kernel and the tangential incident field.
104
Source I Observation poi n t
W Y
X I J
Fig. B6. Source and observation point locations for definition of lossy half-space Green's function.

105
B.4 App l i ca t i on t o General F i e l d Coupling t o Long Conductors
The preceding concepts may now be app l ied t o t h e case o f a long conducting w i r e over a ground plane, as shown i n F igure 87. I n t h i s
case, i t i s des i red t o c a l c u l a t e t h e cur ren ts f l o w i n g i n t h e wire, as a f u n c t i o n o f t h e i n c i d e n t f i e l d . Other i n v e s t i g a t o r s [B8,B9] have s tud ied t h e behavior o f such cu r ren ts and i t has been demonstrated t h a t
a t low frequencies t h e i n t e g r a l equation (813) may be solved i n an approximate sense by us ing a simple t ransmiss ion l i n e model. As shown
i n F igure B8, t h e l i n e above the ground i s modelled as a l ossy transmission 1 i n e whose per -un i t - leng th se r ies impedance i s approximated [B5] as:
where jwL i s t he i n d u c t i v e impedance o f t h e w i r e above the ground and i s given by:
-' ( a ) PO jwL = j w 2.rr cosh
The term Zi i s t h e i n t e r n a l impedance o f t he wi re, and i s ca lcu- l a t e d t o be:
where'yw i s the complex propagation constant i n t h e w i re ma te r ia l , and i s expressed as:
The term Z i s t he ground impedance given by: 9

106
E t = Einc t + E:ef
Fig. 87. Long electrical conductor over ground, excited by an incident field.
1 ossy
L - “s + 0 I
0
fc
Fig. B8. Differential section of transmission line model for above-ground conductor. ’

107
( l ) ( j y 2 h ) 4rha zg = -
g 1
where:
The shunt per-unit-length admittance of the transmission 1 ine model consists o f a capacitive term in series with another element t o account for the loss within the ground plane. The capacitive element of the l ine i s given by the usual expression for a wire above a perfectly conducting ground:
2 m 0 j w C = j w
cosh-I (h /a )
and the other series admittance element i s approximated [B5] as:
The excitation o f per-uni t-1 e n g t h voltage
2 Y g = ys
zg
this line i s in the form o f a distributed source, whose value is identical t o the incident
plus ground-reflected electric field tangential t o the wire:
A t the ends of the l ine, where the load impedances are located, there are additional lumped voltage sources representing the effects of the electric field tangential t o the load conductors ( i .e . , the electric field normal t o the earth surface). For lines which are typically very long, the contribution of these sources t o the overall response i s

108
t y p i c a l l y neglected, so t h a t o n l y t h e ho r i zon ta l e l e c t r i c f i e l d p lays an
impor tant r o l e i n t h e e x c i t a t i o n o f t h e l i n e . However, as has been demonstrated by Vance [B5], when the i n c i d e n t f i e l d i s v e r t i c a l l y po la r ized , t h i s component o f t h e e l e c t r i c f i e l d can, a t t imes, have a s i g n i f i c a n t impact on t h e o v e r a l l response. I n the present discussion,
however, we a r e consider ing o n l y h o r i z o n t a l l y po la r i zed i n c i d e n t f i e l d s , and t h i s e x c i t a t i o n i s zero.
Thus, as i n t h e case o f a general s c a t t e r i n g body over t h e ground plane, t h e e f f e c t s o f t h e l ossy ground on t h i s t ransmiss ion l i n e mani fest themselves through a mod i f i ca t ion o f t he cu r ren t propagation r e l a t i o n s (by t h e ‘ add i t i on o f a se r ies res is tance and the shunt conductance i n t h e t ransmiss ion l i n e ) and i n a m o d i f i c a t i o n o f t h e source e x c i t a t i o n o f t h e l i n e .
B.5 Coupling o f Quas i -S ta t i c F ie lds t o Lines
I n app ly ing t h i s formalism t o t h e problem o f MHD-EMP coup l ing t o a power l i n e , i t i s poss ib le t o make a number o f s i m p l i f y i n g assumptions. F i r s t , because o f t h e very low frequency na ture o f t h e MHD-EMP environment, a l l induc tors may be considered t o be sho r t c i r c u i t e d , and a l l capac i to rs can be t rea ted as open c i r c u i t s . When t h i s i s done, t h e per -un i t - leng th equ iva len t c i r c u i t of t h e power l i n e reduces t o t h a t i n F igure B9. The r e s i s t i v e element i n t h i s c i r c u i t represents t h e l o s s i n t h e conductor i t s e l f , p lus any ground loss which may be present i n t h e problem.
When a l i n e o f l eng th L i s a t tached t o grounded loads a t each end o f t h e l i n e , t h e low frequency equ iva len t c i r c u i t shown i n F igure B10 r e s u l t s . The res is tances R1 and R2 represent t h e e f f e c t i v e dc res is tances o f any load equipment placed on the end o f t h e l i n e , p lus a
c o n t r i b u t i o n o f t h e f o o t i n g ( o r grounding) res is tances a t t h e ends. The res i s tance Rt i s t h e t o t a l l i n e res is tance and i s g iven by:

109
and the total voltage source is:
Because it is assumed that there is no vertical component of the electric field on the earth surface, only this tangential electric field contributes to the excitation voltage of the line.
Using this approach, the total quasi-dc current flowing in the line and in the terminating resistances can be expressed as:
In summarizing this calculative method for the quasi-dc problem, it is possible to say that the important excitation quantity for the line is the total tangential electric field along the wire, and the important line or load parameters are the resistance due to loss effects in both the conducting line and the ground, the footing resistances at each load end of the line and the resistances in the loads at the line ends.
B. 6 Appl ication to Mu1 ticonductor Lines
In many practical power system applications, the lines of interest are not simple, single wire lines, but consist of three-phase lines with a possible fourth conductor serving as a ground conductor for lightning protection. In such a case, it is important to develop a field coupling model useful for predicting the line currents.
The general field coupling to an open multiconductor line has been discussed [SlO], where it i s shown that each wire of the multiconductor bundle can have a different voltage source, depending on the variations of phase of the incident field as it passes over the transmission line. Generalizing the quasi-static per-unit-length model of the single wire line in Figure B9 to a multiconductor line, the equivalent section o f

110
.
Fig. B9. Quasi-DC differential section of transmission 1 ine model for above-ground conductor.
V, = Vs L RT = RL L
Fig. B10. Quasi-DC equivalent circuit for total line of length L , having load resistances of R, and R2 at each end.

111
l i n e shown i n F igure B11 r e s u l t s . Each conductor can have a d i f f e r e n t pe r -un i t - l eng th res is tance, depending on the s i z e and composi t ion o f t h e conductors. I n p r i n c i p l e , each conductor has a s l i g h t l y d i f f e r e n t
per -un i t - leng th e x c i t a t i o n vol tage, due t o the phase v a r i a t i o n o f t h e i n c i d e n t f i e l d . I n p rac t i ce , however, f o r t he q u a s i - s t a t i c MHD-EMP f i e l d s , these phase v a r i a t i o n s a r e n e g l i g i b l e , so t h a t a l l sources on
t h e conductors i n F igure B11 a r e i d e n t i c a l , and equal t o the tangen t ia l e l e c t r i c f i e l d a t t he w i r e l oca t i on . Because the e l e c t r i c f i e l d above the ground plane i s a very s lowly vary ing f u n c t i o n o f t he he igh t above
the ground due t o the low frequency ( l ong wavelength) na ture o f t he f i e l d s , t h i s e x c i t a t i o n i s e s s e n t i a l l y equal t o the tangen t ia l e l e c t r i c f i e l d on the ground surface.
Representing each load a t t he ends o f t he mul t i conductor l i n e as a
s imple res is tance, the o v e r a l l c i r c u i t model f o r a l e n g t h o f m u l t i -
conductor l i n e i s shown i n F igure B12a. Note t h a t i n t h i s model, t he e x c i t a t i o n vo l tage source i n each l i n e i s t he same as t h e o thers , and i s
g iven by equat ion (B24). Given a knowledge o f t h e var ious load and l i n e res is tances, t h e i n d i v i d u a l conductor cu r ren ts and the common mode ( o r b u l k ) c u r r e n t on the l i n e may be computed us ing a simple dc ana lys is .
It i s use fu l t o compare t h i s c a l c u l a t i v e approach t o t h e e l e c t r o - magnetic coup1 i n g problem t o t h a t presented f o r t he geomagnetic storms [Bl ,BZ]. The e l e c t r i c and magnetic f i e l d s i n and above the e a r t h sur face a r e ca lcu la ted , based upon an assumed known d i s t r i b u t i o n o f aurora l cur ren ts . Un l ike the presenta t ion here, t he model f o r t he e a r t h [ S l ] cons is ted o f several layers , which added somewhat t o the complex i ty o f t h e representa t ion o f t h e f i e l d s , bu t t he bas ic concept o f f i e l d c a l c u l a t i o n i s very s i m i l a r .
However, ins tead o f computing the e l e c t r i c f i e l d on t h e conductors themselves and us ing these as t h e e x c i t a t i o n sources, t he e l e c t r i c f i e l d
on the e a r t h surface was computed. This induced "ground p o t e n t i a l " was then used t o compute t h e conductor cur ren ts . That t h i s approach i s i d e n t i c a l t o t h e f i e l d approach descr ibed i n t h i s appendix f o r quasi-dc
e x c i t a t i o n s can be demonstrated i n F igure B12b. From t h e vo l tage s h i f t theorem [ B l l ] , i t i s seen t h a t t h e i d e n t i c a l vo l tage sources loca ted i n

112
-0.""' 0 2 RL2
0
REFERENCE 0
Fig. B11. Quasi-DC differential section for multi-conductor 1 ine.

113
A L V e
e R22 RN 4; R2I e
A A V
- 4; RNI RN2
VO +
VO Rl
I
a. Phase Conductor Excitation
R l 2 R2
b. Reference Conductor Excitation
Fig. B12. a mu1 ti-conductor 1 ine.
Equivalent excitation models of

114
the individual phase conductors i n Figure B12a may a l l be shifted t o an equivalent voltage source in the reference conductor, with no change i n the net response of the c i r cu i t . This i s equivalent t o saying t h a t the source of excitation of the l i ne i s a voltage source occurring i n the ground , and hence i s a "ground potential . I '
This approach i s correct, .as long a s the voltage sources i n each o f the individual phase conductor a re ident ical , as is t rue i n the case of quasi-static MHD-EMP excitation. However, i n the case of higher frequency excitation, such as that encountered i n the h i g h a l t i t ude EMP (HEMP) spectrum where the phase differences of the incident f i e l d from wire to wire become important, the ground potential concept breaks down. In th i s case the tangential components of the e l ec t r i c f i e ld on the wires must be used t o determine the induced currents.

115
BIBLIOGRAPHY
B l . Albertson, 'V. D., and Van Baelen, J. A., " E l e c t r i c and Magnetic F i e l d s a t t h e E a r t h ' s Surface Due t o Auroral Currents," I E E E Transact ions- on Powey--, Vol . PAS-89, No. 2, Apr11, 1910 Y PP* 5/8-5840
82. Albertson, V. D., e t . a l . , "Load Flow Studies i n the Presence o f Geomagnetical ly - Induced Currents , I' I E E E Power Paper, F-79-702-2, Presented a t t h e I E E E Summer Power Meeting, Vancouver, B r i t i s h Columbia, J u l y 15-20, 1979.
83. Van Blade1 , J. , ELECTROMAGNETIC FIELDS, McGraw-Hill , New York, 1964.
B4. Harr ington, R. F. , FIELD COMPUTATION BY MOMENT METHODS, r e p r i n t e d by t h e author , 1968.
85. Vance, E. F., COUPLING TO SHIELDED CABLES, Wi ley In te rsc ience, New York, 1978.
B6. Harr ington, R. F. , TIME HARMONIC ELECTROMAGNETIC FIELDS, McGraw- H i l l , New York, 1961.
B7. Sommerfield, A. , PARTIAL DIFFERENTIAL EQUATIONS I N PHYSICS, Aca- demic Press, New York, 1964.
88. Sunde, E. D., EARTH CONDUCTION EFFECTS I N TRANSMISSION SYSTEMS, D. Van Nostrand Co., New York, 1949.
B9. Fontaine, J. M., e t . a l . , "Ground E f f e c t s i n the Response o f a Single-Wire Transmission L ine I l l u m i n a t e d by an EMP," ELECTROMAGNETICS, Vol 2, No. 1 , January-March, 1982.
B10. Tesche, F. M., and T. K. L iu , "Recent Developments i n Electromag- n e t i c F i e l d Coupling t o Transmission L ines ," Transact ions o f t h e 4 t h Symposium and Technical E x h i b i t i o n on EMC, Zur ich, Switzer land, March 10-12, 1981.
B l l Balabanian, N. FUNDAMENTALS OF CIRCUIT THEORY, A l l y n and Bacon, Inc. , Boston, 1962.


117
ORNL/S~b-83/43374/1/V3 D i s t . Category 97
INTERNAL DISTRIBUTION
1-24. P. R. Barnes 25. R. B. B r a i d 26. R. S. C a r l s m i t h 27. F. C. Chen 28. L. G. Chr is tophorou 29. R . I . Crutcher 30. S. J. Dale 31. W . Fulkerson 32. P. A. Gnadt 33. T. L. Hudson 34. J. M. MacDonald 35. F. W. Manning
36. 37.
38- 58. 59. 60. 61.
64.
67.
70.
62-63.
65-66.
68-69.
B. W . McConnell J. W . Miche l M. C. M i l l e r M. 0. Pace R. A. Stevens J. P. S t o v a l l C e n t r a l Research L i b r a r y Document' Reference Sect i on Energy I n f o r m a t i o n L i b r a r y Laboratory Records - RC Labora tory Records Department ORNL Patent Sec t ion
EXTERNAL DISTRIBUTION
71-80. N. C. Abi -Samra, Westinghouse E l e c t r i c Corporat ion, Advanced Systems Technology, 777 Penn Center Boulevard, P i t t s b u r g h , PA 15232
81. W. E. Adams, D i r e c t o r f o r Rad ia t ion , Defense Nuclear Agency, Washington, DC 20305
82. V. D. A lher tson, Department o f E l e c t r i c a l Engineer ing, 123 Church S t r e e t , S . W . , Uni v e r s i t y o f M i nnesota, M i nneapol i s, MN 55455
83. H. W. Askins, Jr., The C i t a d e l , Char leston, SC 29409
84. C. E. Baum, NTYEE, K i r k l a n d AFB, NM 87117
85. D. W. Bensen, Federa l Emergency Management Agency, Research D i v i s i o n , 500 C S t r e e t , S.W., Washington, DC 20472
86. T. B o l t , ED-SD, U.S. Army Engineer ing, USAEDH, P.O. Box 1600, H u n t s v i l l e , AL 35087
87. J. N. Bombardt, R&D Associates, 105 E. Vermi j o S t r e e t , S u i t e 450,
88. G. E. B r a c k e t t , Code H25, Navy Surface Weapons Center, 1091 New
Colorado Spr ings, CO 80903
Hampshi r e Avenue, S i 1 v e r Spr ings, MD 20903-5000
89. E. H. Brehm, Department GK/CN32, Brown, Bover i , and Cie, A k t i e n g e s e l l Schaf t , Post fach 351, D-6800 Mannheim 1, West Germany

118
90.
91.
92.
93.
94.
95.
96.
97.
98.
99.
100.
101.
102.
103.
104.
105.
106.
107.
F. C. Buchholz, P a c i f i c Gas & E l e c t r i c Co., 7 7 Beale S t r e e t , Room 2933, San Franc isco, CA 94106
J . F. Buck, Wisconsin E l e c t r i c Power Company, 231 W. Michigan, Milwaukee, W I 53201
L. M. Burrage, McGraw-Edison, P.O. Box 100, 11131 Adams Road, F r a n k s v i l l e , W I 53126
H. S . Cabayan, Lawrence L ivermore Laboratory , P.O. Box 5504, Livermore, CA 94550
F. L. Cain, Georgia I n s t i t u t e o f Technology, Eng ineer ing Experiment S t a t i o n , A t l a n t a , GA 30332
R. N. C a r l i l e , Department o f E l e c t r i c a l and Computer Engineer ing, Uni v e r s i t y o f Ar izona, Tucson, Ar izona 85721
I . J . Carney, Nuclear S u r v i v a b i l i t y Organizat ion, Boeing Aerospace Company, P.O. Box 3999, S e a t t l e , WA 98124
V. L. C h a r t i e r , B o n n e v i l l e Power A d m i n i s t r a t i o n , P.O. Box 491-ER, Vancouver, WA 98666
K. K. Chen, Sandia N a t i o n a l Laboratory , Drawer 1333, P.O. Box 5800, K i r k l a n d AFB, NM 87185
H. E. Church, Aluminum Company o f American, 1501 Alcoa B u i l d i n g , P i t t sburgh, PA 15219
B. C ikotas, DNA/RAEE, 6801 Telegraph Road, A lexandr ia , VA 22310
C. F. C lark , B o n n e v i l l e Power A d m i n i s t r a t i o n , P.O. Box 3621, Por t land, OR 97208
R. E. Clayton, Power Technologies, P.O. Box 1058, 1482 E r i e Boulevard, Schenectady, NY 12301-1058
A. C l e r i c i , Sanelmi, V i a Pergo les i 25, 20124 Mi lano, I t a l y
H. W. Col born, Nor th Ameri can E l e c t r i c Re1 i abi 1 i t y Counci 1, Research Park, Terhume Road, Pr ince ton , NJ 08540-3573
0. E. Cooper, Southern C a l i f o r n i a Edison Company, P.O. Box 800, 2244 Walnut Grove Avenue, Rosemead, CA 91770
R . Cor t ina , ENEL-Centro Ricerca, Automatica, V I A V o l t a 1, Cologno Monzese (Ml ) , I t a l y
G. Dahlen, Royal I n s t i t u t e o f Technology, S-100-44, Stockholm, Sweden

119
108. J. Darrah, Headquarters NORAD/G5, Peterson AFB, CO 80914
109. Defense Technica l I n f o r m a t i on Center, Cameron S t a t i o n , A lexandr ia , VA 22314
110. J. J. Dougherty, E l e c t r i c Power Research I n s t i t u t e , P.O. Box 10412, Palo A l to , CA 94303
111. W. M. Druen, 8200 South Memorial Parkway, S u i t e D, H u n t s v i l l e , AL 35802
112. J . C. Engimann, Commonwealth Edison, 1319 S. F i r s t Avenue, Maywood, I L 60153
113. D. M. Er icson, Jr., Sandia Nat iona l Laboratory , D i v i s i o n 6414,
114. W . E. Ferro, E l e c t r i c Research and Management, Inc., P.O. Box 235,
. . K i r k l a n d AFB, NM 87185
Thomaston, ME 04861
115. W . G. Finney, P r o j e c t Manager, Stanley Consul tants , Inc., Stanley B u i l d i n g , Muscatine, I A 52761
116. M. F i t z g e r a l d , MITRE Corp., P.O. Box 208, Bedford, MA 01730
117. F. F isher , General E l e c t r i c Corporat ion, E l e c t r i c U t i l i t y Systems Engi n e e r i ng Department, Bui l d i n g 5, Room 306, Schenectady, NY 12345
118. P. B. Fleming, Science and Engineer ing Associates, Inc. , Mar i ners Square, S u i t e 127, 1900 Nor th Nor th lake Way, P.O. Box 31819, Seat t 1 e, WA 981 03
119. R. Ful lwood, Science A p p l i c a t i o n s , Inc., 5 Palo A l t o Square, S u i t e 200, Palo A l t o , C A 94304
120. M. R. Gent, Nor th American E l e c t r i c R e l i a b i l i t y Counci l , Research Park, Terhume Road, P r i nceton, NJ 08540-3573
121. S. M. G i l l i s , Economic and P u b l i c P o l i c y , Department o f Economics,
122. W . Graham, R&D Associates, P.O. Box 9695, Marina Del Rey, CA 90291
Duke U n i v e r s i t y , Durham, NC 27706
123. J. 3. Grainger, 5004 Hermitage Dr ive , Raleigh, NC 27612
124. I . S. Grant, Power Technologies, Inc., 1482 E r i e Blvd.,
125.
Schenectady , NY 12305
A. R. Gr i tzke , U.S. Department o f Navy, Theater Nuclear Warfare P r o j e c t O f f i c e , Washington, DC 20360
120
126. J. Gut, Research I n t i t u t e f o r P r o t e c t i v e Const ruc t ion , Auf der Mauer 2, CH-8001 Zur ich , Swi tzer land,
127. V. Guten, R-52, Nat iona l S e c u r i t y Agency, F o r t G. Mead, MD 20755
128. R. J. Har r ing ton , George Washington U n i v e r s i t y , Department of E l e c t r i c a l Eng ineer ing and Computing Scienc.e, Washington, DC 20052
129. M. F. Hebb, F l o r i d a Power Corp., P.O. Box 14042, M a i l Code AB, S t . Petersburg, FL 33733
130. M. H. Hesse, JEC 5008, Rennselear P o l y t e c h n i c I n s t i t u t e , Troy, NY 12181
131. D. Higgins,' JAYCOR, Santa Barbara F a c i l i t y , P.O. Box 30281, 360 South Hope Avenue, Santa Barbara, CA 93105
132. D. W. H i l son , Tennessee V a l l e y A u t h o r i t y , 1100 Chestnut S t r e e t , Tower 2, Chattanooga, TN 37402
133. F. C. Holdes, P a c i f i c Gas & E l e c t r i c Company, 3235-18th S t r e e t , San Francisco, CA 94110
134. W. S. Howington, Noranda Aluminum, Inc., P.O. Box 70, New Madrid, MO 63869
135. R. Hutchins, BDM Corporat ion, 1801 Randolph, S.W., Albuquerque, NM 87106
136. J. Hunt, Emergency Preparedness Admin is t ra to r , San D i ego Gas and E l e c t r i c Company, P.O. Box 1831, San Diego, C A 92112
Canada M5G1 X6 137. V. I n k i s , O n t a r i o Hydro, U7E1, 700 U n i v e r s i t y Avenue, Toronto,
138. Wasyl Jan i schewskyj, E l e c t r i c a l Engi n e e r i ng Dept . , Uni v e r s i t y o f Toronto, Toronto, Canada M5SlA4
139. H. P. Johnson, Georgia Power Company, 270 Peachtree S t r e e t , 11 th F l o o r , A t l a n t a , GA 30303
140. V. K. Jones, Science and Eng ineer ing Associates, Inc., Mar iners Square, S u i t e 127, 1900 Nor th Nor th lake Way, P.O. Box 31819, S e a t t 1 e, WA 981 03
141. F. R. Kalhammer, D i r e c t o r , Energy Management and U t i l i z a t i o n D i v i s i o n , E l e c t r i c Power Research I n s t i t u t e , 3412 H i l l v i e w Avenue, P.O. Box 10412, Palo A l t o , CA 94303
142. W . Karzas, R&D Associates, P.O. Box 9695, Mar ina Del Rey, CA 90291
143. K. W. K l e i n , C h i e f of Power D e l i v e r y Branch, Department o f Energy, CE-143, D i v i s i o n o f E l e c t r i c Energy Systems, F o r r e s t a l B u i l d i n g , Room 5E-052, 1000 Independence Avenue, S.W., Washington, DC 20585

144.
145.
146.
147.
148.
149.
150.
151.
152-1 61.
162.
163.
164.
165.
166.
167.
168.
169.
170.
171.
172.
121
N. Ko lc io , American E l e c t r i c Power, 1 R i v e r s i d e Plaza, Columbus, OH 43216
J. Labadie, IRT, 6800 Poplar Place, McLean, VA 22131
H. T. Lam, South C a r o l i n a P u b l i c Serv ice A u t h o r i t y , 1 R i v Dr., Monks Corner, SC 29461
T. R. LaPorte, Professor , P o l i t i c a l Science, I n s t i t u t e o f Government Studies, Uni v e r s i t y o f C a l i f o r n i a , 109 Moses Hal 1 , Berkeley, CA 94720
d
R. C. Latham, Duke Power Company, P.O. Box 33189, C h a r l o t t e , NC 28242 ;
A. L a t t e r , R&D Associates, P.O. Box 9695, Mar ina Del Rey, CA 90291
J. S. Lawler, Department o f E l e c t r i c a l Engineer ing, U n i v e r s i t y o f Tennessee , Knoxvi 1 1 e, TN 37 91 6
K. S. H. Lee, Dikewood D i v i s i o n o f Kaman Science Corp., 2800 28th S t r e e t , S u i t e 3780, Santa Monica, CA 90405
J. R. Legro, Westinghouse E l e c t r i c Corporat ion, Advanced Systems Technology, 777 Penn Center Boulevard, P i t t s b u r g h , PA 15235
M. Lessen, C o n s u l t i n g Engineer, 12 Country Club Dr ive , Rochester, NY 14618
L i b r a r y , JAYCOR, 205 S W h i t i n g S t r e e t , A lexandr ia , VA 22304
J. Locasso, Rockwell I n t e r n a t i o n a l , 3370 Meraloma Avenue, P.O. Box 4192, M a i l Code 031-BB17, Anaheim, CA 92803
C. L. Longmire, M i s s i o n Research Corporat ion, P.O. Drawer 719, Santa Barbara, CA 93102
W . C. Makl in , IRT Corporat ion, 6800 Pop lar Place, McLean, VA 22101
R. M. M a l i szewski , American E l e c t r i c Power Serv i ce Corp. , 1 R i v e r s i d e Plaza, P.O. Box 16631, Columbus, OH 43216-6631
J. N. M a l l o r y , Southern C a l i f o r n i a Edison Co., P.O. Box 800, Rosemead, CA 91770
J. D. Mar t in , H a r r i s Corporat ion, PRD E l e c t r o n i c s D i v i s i o n , 6801 J e r i cho Turnp i k e y Syosset t , NY 11791
P. S. Maruvada, Hydro-Quebec I n s t i t u t e o f Research, 1800 Montee S t e - J u l i e , Varennes, Quebec, CANADA JOLZPO
R. G. McCormack, CERL, Corps o f Engineers, P.O. Box 4005, Champaign, I L 61820
G. F. Meenaghan, V ice Pres ident f o r Academic A f f a i r s and Dean o f t h e Col lege, The C i t a d e l , Char leston, SC 29409

122
173.
174.
1-7 5.
176.
177.
178.
179.
180.
181.
182.
183.
184.
185.
186.
187.
188.
189.
190.
191.
C. Menemenl i s , Uni v e r s i t y o f Pat ras , Pat ras , Greece
A. S . M i c k l ey , Phi 1 adel ph i a E l e c t r i c Corp. , 2301 Market S t r e e t , Phi 1 adel p h i a, PA 191 01
I . N. Mindel , I I T Research I n s t i t u t e , 10 West 35 th S t r e e t , Chicago, I L 60616
D. L. Mohre, Cajun E l e c t r i c Power Corp., P. 0. Box 15440, Baton Rouge, LA 70895
B. B. Mrowca, B a l t i m o r e Gas & E l e c t r i c Co., P.O. Box 1475, Ba l t imore , MD 21203
K. M u l l e r , IABG, E i n s t e i n s t r a s s e 20, 8012 Ottobrunn, West Germany
Este-M Murtha, Booz A l l e n and Hamil ton, General Serv ices A d m i n i s t r a t i o n , 18 th & F S t r e e t s , N.W., Washington, DC 10405
H. P. Nef f , Department o f E l e c t r i c a l Engineer ing, U n i v e r s i t y of Tennessee, Knoxvi 11 e, TN 3791 6
B. 0. N e t t l e s (Code 203), Naval E l e c t r o n i c Systems Eng ineer ing Center, Char leston, 4600 M a r r i o t t D r i v e , Nor th Char leston, SC 29418
D. R. Nevius, Nor th American E l e c t r i c R e l i a b i l i t y Counci l , Research Park, Terhume Road, Pr inceton, NJ 08540-3573
G. B. N i l e s , B a l t i m o r e Gas & E l e c t r i c Company, P r i n c i p a l Eng. Room 1020, P.O. Box 1475, Bal t imore, MD 21203
B. Noel, Los Alamos N a t i o n a l Laboratory , M a i l S t a t i o n 5000, P.O. Box 1663, Los Alamos, NM 87545
B. Nowlin, Ar izona P u b l i c S e r v i c e Company, P.O. Box 21666, Phoenix, AR 85036
R. Oats , Atomic Weapons Research E s t a b l i shment , Bui 1 d i ng D57 , Aldermaston, Reading, RG74PR, England
G. O r r e l l , Dep. Associ a t e D i r e c t o r f o r N a t i onal Preparedness , Federa l Emergency Management Agency, 500 C S t r e e t , S.W. , Washi ngton , DC 20555
L. Par is , U n i v e r s i t y o f Pisa, V ia D i o t i s a l v i 2, 56100 P I S A /
R. Parker, RDA, P.O. Box 9335, Albuquerque, NM 87119
R. Parkinson, Science A p p l i c a t i o n s , Inc., 5150 E l Camino Real, S u i t e B-31, LOS A l tos , CA 94022
A. P i g i n i , C E S I - V i a Rubahi mo 59-Mi 1 ano, I t a l y

123
192. J . 6. Posey, Ohio Brass Co., 380 N. Main S t r e e t , Mansf ie ld , OH 44903
193. M. Rabinowitz, E l e c t r i c Power Research I n s t i t u t e , 3412 H i l l v i e w Avenue, P.O. Box 10412, Palo A l t o , CA 94303
194. W. A. Radaski, Metatech Corp., 358 South F a i r v i e w Avenue, S u i t e E, Goleta, CA 93117
195. J . J . Ray, B o n n e v i l l e Power A d m i n i s t r a t i o n , P.O. Box 3621, Por t land, OR 97208
196. T. J . Reed, Westinghouse E l e c t r i c Corporat ion, Advanced Systems . Technology, 777 Penn Center Boulevard, P i t t s b u r g h . PA 15235
197. R. L. R e t a l l a c h , American E l e c t r i c Power, 1 R i v e r s i d e Plaza, Columbus, OH 43216
198. J . R i chardson, N a t i onal Academy o f Sci ence, 21 01 C o n s t i t u t i o n Avenue, Washi ngton, DC 20418
199. F. Rosa, Nuclear Regulatory Commission, D i v i s i o n o f Systems I n t e g r a t i o n , MS P1030, Washington, DC 20555
200. D. H. Sandel l , Harza Eng ineer ing Co., 150 South Wacker Dr ive , Chicago, I L 60606
201. J. A. Sawyer, MITRE Corp., MS-H070, P.O. Box 208, Bedford, MA 01703
202. R. A. Schaefer, Metatech Corp., 20 Sunnyside Avenue, S u i t e D, M i l l Va l ley , CA 94941
203. M. Schechter, A.D.A., P.O. Box 2250(81), Hai fa , 31021, I s r a e l
204. H. S ingara ju, A i r Force Weapons Laboratory, K i r k l a n d AFB, NM 87117
205. A. C. Smith, Jr., Beam Research Program, Lawrence L ivermore Nat iona l Laboratory , P.O. Box 808, Livermore, CA 94550
206. J . C. Smith, 1 Adams Avenue, P.O. Box 44, Canonsburg, PA 15317
207. R. Smith, DNA, RAEE, 6801 Telegraph Road, A lexandr ia , VA 22310
208.
209.
W. Sol 1 f rey, RAND Corp., 1700 Mai n S t r e e t , Santa Moni ca, CA 90406
H. Songster, E l e c t r i c Power Research I n s t i t u t e , E l e c t r i c a l Systems D i v i s i o n , 3412 H i l l v i e w Avenue, P.O. Box 10412, Palo A l t o , CA 94303

124
G. K. Soper, Defense Nuclear Agency, Washington, DC 20305
S . Spohn, DB4C2, Defense I n t e l l i g e n c e Agency, Washington, DC 20301
.. .
210.
21 1.
212.
213.
214.
21 5.
21 6-225.
3. R. Stewart , Power Technologies, Inc., P.O. Box 1058, 1482 E r i e Boulevard, Schenectady, NY 12301-1058
R. L. S u l l i v a n , Department o f E l e c t r i c a l Engineer ing, Co l lege of Engi n e e r i ng, Uni v e r s i t y o f F1 o r i da, Gai nesv i 11 e, FL 3261 1
I . 0. Sunderman, L i n c o l n E l e c t r i c System, P.O. Box 80869, L i n c o l n , NE 68501
R. W. Sutton, Science A p p l i c a t i o n s , Inc., 1710 Goodridge D r i v e , P.O. Box 1303, McLean, VA 22102
F. M. Tesche, LuTech, Inc., 3742 M t . D i a b l o Boulevard, La faye t te , CA 94549
226. L. Thione, CESI-Via R u b a t t i n o 54 20734, Mi lano, I t a l y
227. R . J. Thomas, 302 P h i l l i p s H a l l , Cornel1 U n i v e r s i t y , I thaca, NY 14853
228. R. Torres, BDM Corporat ion, 1801 Randolph, S.W., Albuquerque, NM 87106
229. W. T y l e r , NT, K i r k l a n d AFB, NM 87117
230. M. A. Uman, Department o f E l e c t r i c a l Engineer ing, U n i v e r s i t y of
231. E. F. Vance, Route 3, Box 268A, F o r t Worth, TX 76140
232.
F l o r i d a , Gainesv i l le . , FL 32611
D. R. Volzka, Wisconsin E l e c t r i c Power Company, 231 West Mich igan S t r e e t , Milwaukee, W I 53201
j233. J. Vora, Nuclear Regulatory Commission, MS 5650 NL, Washington, DC 20555
234. C. D. Whitescarber, M a r t i n M a r i e t t a Orlando Aerospace, Sandlake Road Complex (SLRC), M a i l P o i n t 399, P.O. Box 5837, Orlando, FL 32855
235. W. P. Wigner, 8 Ober Road, Pr inceton, NJ 08540
236. M. W. W i k, F o r s v a r e t s M a t e r i e l verk, S-11588 Stockhol m, Sweden
237. C. B. Wi l l iams, I R T Corp., 7650 Convoy Court , P.O. Box 80817, San Diego, CA 92138

125
238. W. H. Wi l l iams, D i v i s i o n Manager, AT&T I n f o r m a t i o n Systems,
239, D. D. Wilson, Power Technologies, Inc., P.O. Box 1058,
B u i l d i n g 83, Room 1823, 100 Southgate Parkway, Morr istown, NJ 07960
Schenectady , NY 12301
240. U. P. Wissrnann, AEG-Telefunken, General E l e c t r i c Company, 1 R i v e r Road, B u i l d i n g 36-444, Schenectady, NY 12345
241. H. W. Zai n i nger, Zai n i n g e r Eng ineer ing Company, 3408 Vance Court , San Jose, CA 95132
242. I n s t i t u t e f o r Energy Analys is , ORAU - L i b r a r y
243, A s s i s t a n t Manager f o r Energy Research & Development, DOE/ORO Oak Ridge, TN 37830
G i ven f o r d i s t r i b u t i on as shown i n DOE/TIC-4500 under Category UC-97a,b,c ( E l e c t r i c Energy Systems)
244-897.
*U. S. GOVERWENT PRINTING OFFICE: 1985-544-045/?0006