289-001 Right middle cingulate gyrus stimulation Stimulation site ...
Upload
anonymous-vqrjlenCategory
view
214download
0
8/20/2019 Study the Effect of the Different Stimulation Levels for TEOAEs by the Non-Linear Models
http://slidepdf.com/reader/full/study-the-effect-of-the-different-stimulation-levels-for-teoaes-by-the-non-linear 1/14
International Journal of Application or Innovation in Engineering& Management (IJAIEM)Web Site: www.ijaiem.org Email: [email protected]
Volume 4, Issue 11, November 2015 ISSN 2319 - 4847
Volume 4, Issue 11, November 2015 Page 69
ABSTRACT
In this work, we study the effect of different stimulation levels on TEOAEs in the hearing process using non-linear models for
the stimulus levels (10, 20, 30, 40, 50, 60, 70, 80, 90, 100, 110, and 120) dB. We found that the latency as a function to
stimulation level, by the results of TEOAEs we get from the different stimulus levels in the relationship of time-frequency.
Therefore, relationship of time-frequency is very important in comparison results the different stimulus level with the previous
studies and also useful in the study of hearing process in humans. At the analysis of relationship of time-frequency we get a lot of the results that show the characteristics for TEOAEs. From these results obtained in study the effect of different stimulus
levels for TEOAEs in the relationship of time-frequency are the energy distribution and waveform behavior of TEOAEs.
Energy distribution of TEOAEs shows the pool (concentration) energy in a number of spots (points) and the energy distribution
varies from one stimulus level to another. Effect of waveform behavior TEOAEs by different stimulus levels, so latency is as a
function to the frequency and the stimulation level.
Keywords: Non-Linear Model, Stimulation Levels, TEOAEs Latency, and TEOAEs Frequency.
1. INTRODUCTION
After 20 years on the discovery Kemp 1978, otoacoustic emissions (OAEs) have become widely used in the field of
diagnostic and clinical examination [1, 2, 3, 4, and5] for the detection of early hearing loss, And so by many
researchers note a relationship between the hearing deterioration and several OAE parameters [6]. Demonstrated when
the absence of transient evoked otoacoustic emissions (TEOAEs) in the ears leads to the audiometrically weakness
frequency range, for hearing threshold levels more than 20 dB [6, 7, and 8], this within clinical roles other potential,
and which ones newborn screening [9]. So used OAE test target as the hearing threshold is limited by the complexity of
their generation mechanisms [9].
Until now, the generation OAEs mechanism does not fully create. According to Shira and Guinan 1999 [10], two
reasonable mechanisms have been proposed for the generation TEOAEs in the cochlea are: 1) non-linear
intermodulation distortion (IMD) because of non-linear characteristics of the basement membrane (BM) [9, 11, and
12], 2) linear reflection from cochlear regions extended toward the base [11, 13]. The two components are
characterized through latencies and curves different (short-latency, curves more accurate for non-linear distortion and
long-latency, curves least accurate for linear reflection) [9, 14], so can of excellence between them by analyzing
resulting the responses TEOAEs from the different stimulation levels of technique latency-frequency analysis.
Experimental studies provided plenty of evidence on the existence of: 1) A long latency-transient evoked otoacoustic
emission (LL-TEOAE) component [11, 15, 16, and 17], and this properties supports the generation of TEAOEs by
coherent linear reflection generation from the tonotopic region. 2) Short latency-transient evoked otoacoustic emission(SL-TEOAE) component, which growing much faster with increasing stimulus level [11, 12, and 13], and this
properties supports the generation of TEAOEs by non-linear intermodulation distortion (IMD). Recently, experimental
and theoretical studies of modern [10, 11, 18, and 19] suggest that TEOAEs produces from linear reflection mechanism
and not from non-linear distortion (It is mostly created by place-fixed linear reflection).
Latency is the time required for the transmission of the sound wave along the cochlear membrane from the base to the
tonotopic site (As tonotopic sites are distributed along the basilar membrane of the cochlea according to the Greenwood
frequency mapping) and back to the basement membrane of the new (the time of the distance traveled by the sound
wave within the cochlea), with a very small contribution comes from the transmission wave in the outer and middle ear
[6]. Through the latency-frequency analysis techniques, we get the information about the transmission of the sound
wave along the basement membrane, and this information can be defined latency as a function of frequency [6]. The
evaluation of the relationship between latency, frequency, and the stimulation level of TEOAEs by: 1) tone bursts [6,
16, 20, and 21]. 2) Clicks [6, 15, 16, 22, 23, 24, and 25]. 3) latency-frequency analysis techniques (according to recentstudies). Experimentally, you can prediction in LL, SL- TEOAEs on the basis of transmission non-linear cochlear
models (a set of mathematical algorithms).
Study the Effect of the Different Stimulation
Levels for TEOAEs by the Non-Linear Models
Adnan M. AL-Maamury1, Fadhil F. Mejdhab
2
1Al-Mustansiriyah University, College of Science, Department of Physics Baghdad-Iraq
2Al-Mustansiriyah University, College of Science, Department of Physics Baghdad-Iraq

8/20/2019 Study the Effect of the Different Stimulation Levels for TEOAEs by the Non-Linear Models
http://slidepdf.com/reader/full/study-the-effect-of-the-different-stimulation-levels-for-teoaes-by-the-non-linear 2/14
8/20/2019 Study the Effect of the Different Stimulation Levels for TEOAEs by the Non-Linear Models
http://slidepdf.com/reader/full/study-the-effect-of-the-different-stimulation-levels-for-teoaes-by-the-non-linear 3/14
International Journal of Application or Innovation in Engineering& Management (IJAIEM)Web Site: www.ijaiem.org Email: [email protected]
Volume 4, Issue 11, November 2015 ISSN 2319 - 4847
Volume 4, Issue 11, November 2015 Page 71
Where:
is a Gaussian average of the square of the BM velocity over a length scale of order one-tenth of octave.
is the transverse velocity scale around which the abovementioned transition between the two asymptotic linear
regimes occurs [26].
The “effective damping function” becomes
So Eq. (2) becomes
The effective damping be the velocity almost constant in the lower levels and high , and
increases quadratically with BM velocity in the low to intermediate level range, create cubic distortion products [11].
Which is define:
So that
In this model, the two parameters and are working on determine the form of the nonlinear response of the
cochlear amplifier. The active nonlinear anti-damping term of the second line of Eq. (6) is little different from that
used in [30], where is a nonlinear function of the BM transverse displacement. Stimulation process occurs in this
model using parameter N=1000, Roughness=0.001, Nonlin term=7..*10-2
, tmax (ms) =20, Nt =1024, TEOAEs=click
0.05 ms - 10 kHz.
3. RESULTS AND DISCATION
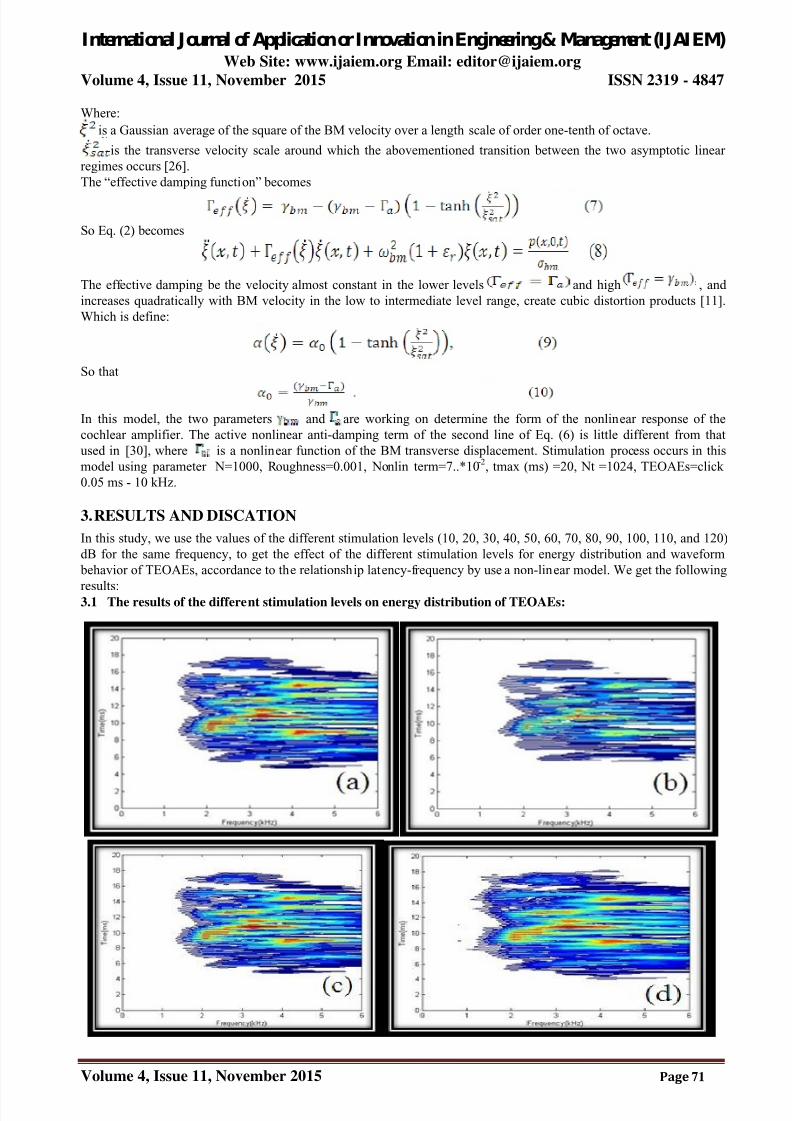
In this study, we use the values of the different stimulation levels (10, 20, 30, 40, 50, 60, 70, 80, 90, 100, 110, and 120)
dB for the same frequency, to get the effect of the different stimulation levels for energy distribution and waveform
behavior of TEOAEs, accordance to the relationship latency-frequency by use a non-linear model. We get the following
results:3.1 The results of the different stimulation levels on energy distribution of TEOAEs:

8/20/2019 Study the Effect of the Different Stimulation Levels for TEOAEs by the Non-Linear Models
http://slidepdf.com/reader/full/study-the-effect-of-the-different-stimulation-levels-for-teoaes-by-the-non-linear 4/14
International Journal of Application or Innovation in Engineering& Management (IJAIEM)Web Site: www.ijaiem.org Email: [email protected]
Volume 4, Issue 11, November 2015 ISSN 2319 - 4847
Volume 4, Issue 11, November 2015 Page 72
Figure 1 shows the energy distribution TEOAEs in the different stimulation levels, (a) stimulus level 10 dB, (b)
stimulus level 20 dB, (c) stimulus level 30 dB, (d) stimulus level 40 dB, (e) stimulus level 50 dB, (f) stimulus level 60
dB, (g) stimulus level 70 dB, (h) stimulus level 80 dB, (i) stimulus level 90 dB, (j) stimulus level 100 dB, (k) stimulus
level 110 dB, and (l) stimulus level 120 dB.

8/20/2019 Study the Effect of the Different Stimulation Levels for TEOAEs by the Non-Linear Models
http://slidepdf.com/reader/full/study-the-effect-of-the-different-stimulation-levels-for-teoaes-by-the-non-linear 5/14

8/20/2019 Study the Effect of the Different Stimulation Levels for TEOAEs by the Non-Linear Models
http://slidepdf.com/reader/full/study-the-effect-of-the-different-stimulation-levels-for-teoaes-by-the-non-linear 6/14
International Journal of Application or Innovation in Engineering& Management (IJAIEM)Web Site: www.ijaiem.org Email: [email protected]
Volume 4, Issue 11, November 2015 ISSN 2319 - 4847
Volume 4, Issue 11, November 2015 Page 74

8/20/2019 Study the Effect of the Different Stimulation Levels for TEOAEs by the Non-Linear Models
http://slidepdf.com/reader/full/study-the-effect-of-the-different-stimulation-levels-for-teoaes-by-the-non-linear 7/14
International Journal of Application or Innovation in Engineering& Management (IJAIEM)Web Site: www.ijaiem.org Email: [email protected]
Volume 4, Issue 11, November 2015 ISSN 2319 - 4847
Volume 4, Issue 11, November 2015 Page 75
8/20/2019 Study the Effect of the Different Stimulation Levels for TEOAEs by the Non-Linear Models
http://slidepdf.com/reader/full/study-the-effect-of-the-different-stimulation-levels-for-teoaes-by-the-non-linear 8/14

8/20/2019 Study the Effect of the Different Stimulation Levels for TEOAEs by the Non-Linear Models
http://slidepdf.com/reader/full/study-the-effect-of-the-different-stimulation-levels-for-teoaes-by-the-non-linear 9/14
International Journal of Application or Innovation in Engineering& Management (IJAIEM)Web Site: www.ijaiem.org Email: [email protected]
Volume 4, Issue 11, November 2015 ISSN 2319 - 4847
Volume 4, Issue 11, November 2015 Page 77
1.0318 7.9492 7.9492 7.9687 7.9687
1.3 14.4531 7.9296 7.9296 7.9101
1.6378 9.1992 9.1992 9.1992 9.1992
2.0636 9.4531 9.4335 9.4531 9.4531
2.6 10.1367 10.1367 10.1367 10.1367
3.2757 10.8984 10.8984 10.7617 10.7617
4.1272 8.8671 8.8671 8.9843 9.1015
5.2 8.9843 8.9843 9.0039 9.0039
Level 90 dB 100 dB 110 dB 120 dB
Frequency Time Time Time Time
0.8189 8.4765 8.4765 8.4765 8.4765
1.0318 7.871 7.9101 7.8906 7.9101
1.3 7.9101 5.2148 5.2148 5.2148
1.6378 5.1953 4.8828 4.8828 4.8828
2.0636 9.4726 5.1953 5.1953 5.1953
2.6 10.1562 5.6835 5.6835 3.9648
3.2757 10.7617 10.7617 5.8789 3.3593
4.1272 8.8871 8.8871 8.8867 4.1015
5.2 9.0039 9.0039 9.0039 8.9062
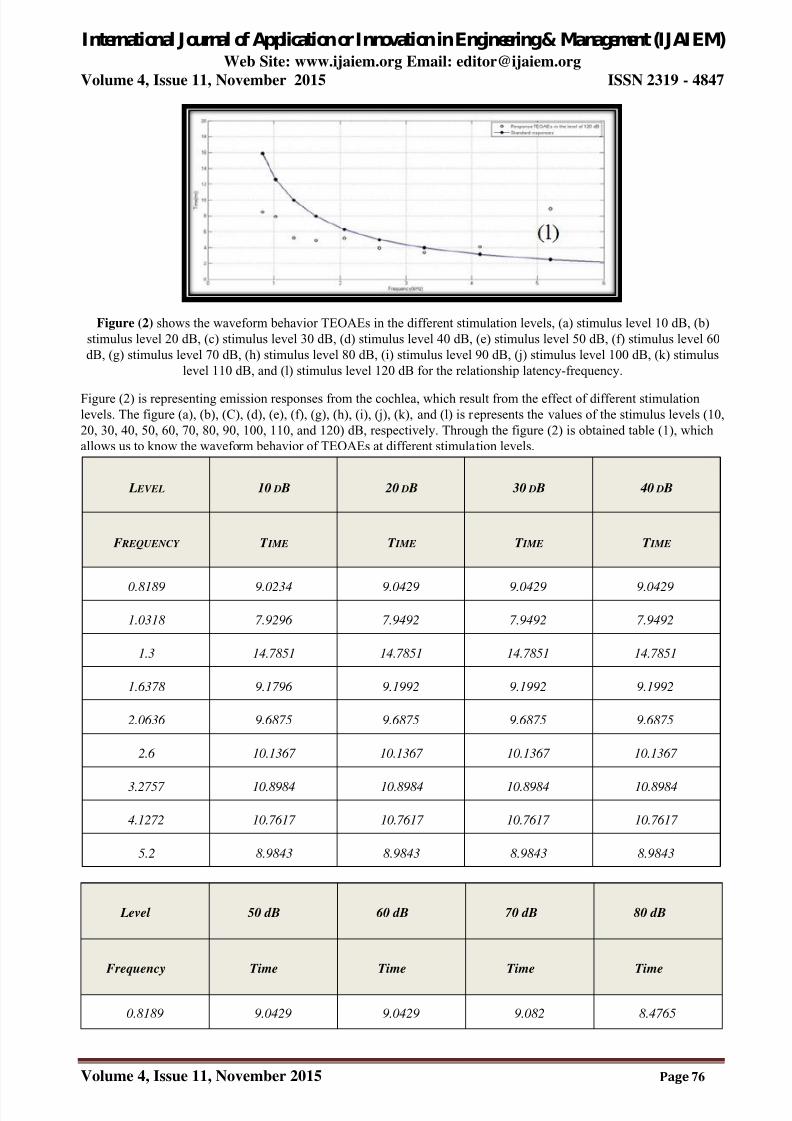
From table 1, we can know effect amount of the different stimulation levels on latency of TEOAEs for each frequency.
So we will work on the study of waveform behavior TEOAEs using the relationship of time-frequency for stimulation
levels (10, 20, 30, 40, 50, 60, 70, 80, 90, 100, 110 and 120) dB, as follows:

8/20/2019 Study the Effect of the Different Stimulation Levels for TEOAEs by the Non-Linear Models
http://slidepdf.com/reader/full/study-the-effect-of-the-different-stimulation-levels-for-teoaes-by-the-non-linear 10/14
International Journal of Application or Innovation in Engineering& Management (IJAIEM)Web Site: www.ijaiem.org Email: [email protected]
Volume 4, Issue 11, November 2015 ISSN 2319 - 4847
Volume 4, Issue 11, November 2015 Page 78

8/20/2019 Study the Effect of the Different Stimulation Levels for TEOAEs by the Non-Linear Models
http://slidepdf.com/reader/full/study-the-effect-of-the-different-stimulation-levels-for-teoaes-by-the-non-linear 11/14
International Journal of Application or Innovation in Engineering& Management (IJAIEM)Web Site: www.ijaiem.org Email: [email protected]
Volume 4, Issue 11, November 2015 ISSN 2319 - 4847
Volume 4, Issue 11, November 2015 Page 79

8/20/2019 Study the Effect of the Different Stimulation Levels for TEOAEs by the Non-Linear Models
http://slidepdf.com/reader/full/study-the-effect-of-the-different-stimulation-levels-for-teoaes-by-the-non-linear 12/14

8/20/2019 Study the Effect of the Different Stimulation Levels for TEOAEs by the Non-Linear Models
http://slidepdf.com/reader/full/study-the-effect-of-the-different-stimulation-levels-for-teoaes-by-the-non-linear 13/14

8/20/2019 Study the Effect of the Different Stimulation Levels for TEOAEs by the Non-Linear Models
http://slidepdf.com/reader/full/study-the-effect-of-the-different-stimulation-levels-for-teoaes-by-the-non-linear 14/14