Study on water heating - labelling / standards · Study on water heating - labelling / standards...
32
SAVE - EU Water Heating – Task 1 ECI: K. Lane, J. Lipp, May 2001 SAVE 1998 Area: Rational use of energy in equipment Study on water heating - labelling / standards The foundation for the policy to be followed in creating an energy use information system for domestic hot water appliances (SAVE program contract no. XVII/4.101/Z/98-092) Final report Task 1 Energy Supply Report – May, 2001 Environmental Change Institute, University of Oxford Kevin Lane, Judy Lipp 1
Transcript of Study on water heating - labelling / standards · Study on water heating - labelling / standards...

SAVE - EU Water Heating – Task 1 ECI: K. Lane, J. Lipp, May 2001
SAVE 1998
Area: Rational use of energy in equipment
Study on water heating - labelling / standards The foundation for the policy to be followed in creating an energy use
information system for domestic hot water appliances (SAVE program contract no. XVII/4.101/Z/98-092)
Final report
Task 1 Energy Supply
Report – May, 2001
Environmental Change Institute,
University of Oxford
Kevin Lane, Judy Lipp
1

SAVE - EU Water Heating – Task 1 ECI: K. Lane, J. Lipp, May 2001
EU Water Heaters Project Task 1 Report
Table of contents 1. Introduction .............................................................................................................................. 3
1.1 Scope of this report ........................................................................................................... 3 1.2 Structure of this report ...................................................................................................... 3
2. Electricity generation and consumption ................................................................................... 4 2.1 Efficiency of electricity generation................................................................................... 5 2.2 Efficiency of electricity generating plant.......................................................................... 5
3. Domestic gas ............................................................................................................................ 5 3.1 Natural gas infrastructure and household supply .............................................................. 6
4. District heating ......................................................................................................................... 8 4.1 Efficiency of CHP plant.................................................................................................... 9
5. Fuel access in Europe............................................................................................................... 9 6. National and EU policy ............................................................................................................ 9
6.1 EU regulation .................................................................................................................. 10 6.1.1 Electricity Directive................................................................................................. 10 6.1.2 Gas Directive ........................................................................................................... 10 6.1.3 Encouraging renewables .......................................................................................... 11
7. Environmental impact ............................................................................................................ 11 7.1 Allocating carbon emissions to natural gas usage........................................................... 12 7.2 Allocating carbon emissions to delivered electricity (used and saved) .......................... 12
8. Energy prices.......................................................................................................................... 15 9. Summary ................................................................................................................................ 15 10. References .......................................................................................................................... 16 Glossary......................................................................................................................................... 18 Conversion factors......................................................................................................................... 18 Appendix A: Emission and efficiency of typical power plants ..................................................... 19 Appendix B: Generation mix for EU countries ............................................................................ 23 Appendix C: Households with access to natural gas .................................................................... 30 Appendix D: Emission factors for EU electricity production ....................................................... 31 Appendix E: Emission factors of different fuels in the UK........................................................... 32
2
SAVE - EU Water Heating – Task 1 ECI: K. Lane, J. Lipp, May 2001
1. Introduction In order to be able to make a comparison between appliances using different energy sources (electricity, gas, district heating) it is essential to have a clear view of the environmental impact and prices of these different energy sources. Therefore it is necessary to consider the whole process from primary energy to energy supplied to the appliance.
1.1 Scope of this report The availability of typical values of the environmental impact of energy use and prices for electricity, gas and district heating per country, group of countries and EU will be considered. System boundaries of energy supply systems will be defined as well as certain characteristics of these systems like: • which primary energy source is used; • what is the efficiency of a power plant; • what is the environmental impact of the process expressed in fuels used and emissions
produced; • energy prices. These characteristics should be collected for all EU countries. By making an analysis of the figures collected, typical values for the environmental impact of energy use per country, group of countries and EU will come out. These values will be used as input for the impact analysis of Task 6 of this study. This report will not examine supply side issues for domestic water heating that is powered by biomass or solar, microCHP or other self generation.
1.2 Structure of this report The three main fuels for heating water will be examined in this task report. Initially, an introduction to the use of each of these fuels will be made. 1. Electric 2. Gas 3. District heating Access to these fuels in each Member State country will be then be summarised, followed by the most important EU-wide policy for these fuels. The environmental impact of these fuels, especially carbon dioxide emissions will then be assessed. And finally, the cost of these fuels in each country will be provided.
3

SAVE - EU Water Heating – Task 1 ECI: K. Lane, J. Lipp, May 2001
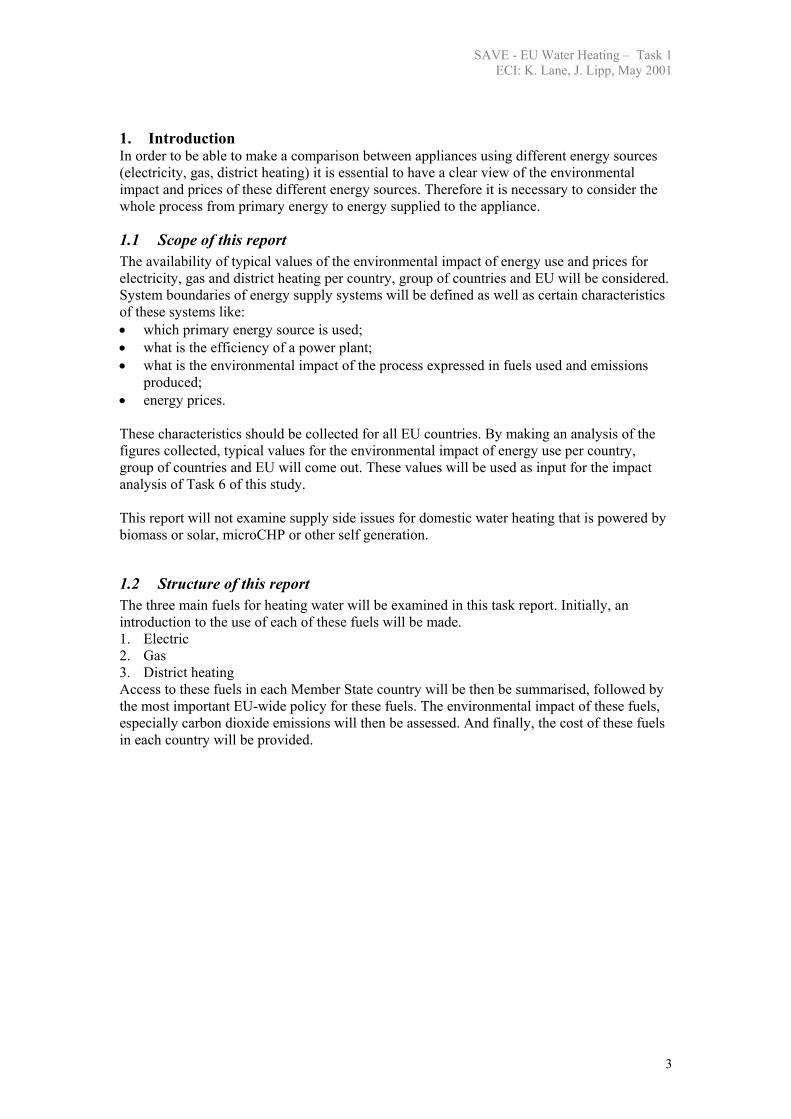
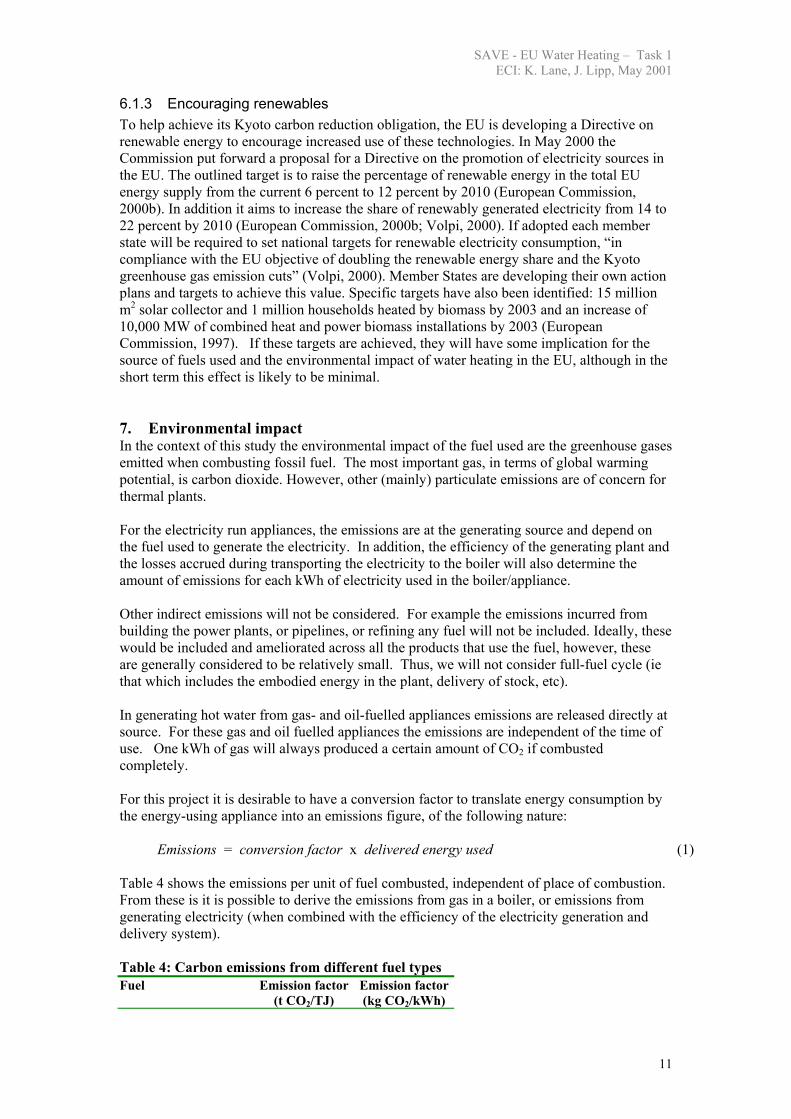
2. Electricity generation and consumption Electricity across Europe is generated in various ways, from fossil-fuel plants, large-scale hydro, through to nuclear power stations. Conventional thermal power plants burn fossil fuel (coal, gas, orimulsion, and oil) to drive turbines, which then generate electricity. The ‘waste’ heat from burning the fuel can also be usefully used – and where this is done the plants are termed combined heat and power (CHP) plants. Since the 1950s electricity by nuclear fission has been possible and now provides a large source of energy for many EU countries. For several EU countries, large-scale hydro-electricity provides a significant amount of energy. The total amount of useful energy is dependent, of course, on the amount of rainfall so is variable from year to year. Figure 1 shows the average profile of the source of electricity for each of the EU countries in 1995.
0
25
50
75
100
BE DK GE GR SP FR IR IT LU NL AU PO FI SW UK
Perc
enta
ge (%
)
Other
Geothermal, wind,PVHydro
Nuclear
Gas
PetroleumproductsCoal
Figure 1: Source of electricity generation in EU Member States, 1995 Source: Eurostat (1997) The changes in the EU electricity generating mix from 1982-1996 are given Appendix B, country by country. The main changes in the EU electricity generation profile since 1970 consist of a large increase in nuclear generation, a slight decrease in the consumption of oil and a corresponding increase in the use of natural gas. Nuclear power’s rate of expansion in meeting electricity demand is slowing down. In the future, the share of gas in power generation is expected to grow throughout Europe, as has been happening through the 1990s. This is expected to be the major change in fuel mix in the future, followed by a decrease in solid fuel consumption (European Environment Agency, 1995). Electricity consumption by the domestic sector varies across the EU. Household electricity consumption is highest in northern countries, where gas usage is low. In Sweden and Finland electricity consumption is 10,400 and 7,600 kWh/annum respectively (CADENCE, 2000). Beyond that simple statement, levels of efficiency, warm winters (and minimal space heating) and the choice of alternative fuels affect the picture. For the other 13 member states, the average electricity consumption varies within the range of 2,700-5,600 kWh pa per household (CADENCE, 2000).
4
SAVE - EU Water Heating – Task 1 ECI: K. Lane, J. Lipp, May 2001
2.1 Efficiency of electricity generation To derive a complete picture of the efficiency of electricity generation, all the stages of production and distribution need to be taken into account. The following are all the activities where energy is used/lost: • construction of plant; • commission of plant; • extraction of primary fuel; • processing of primary fuel; • transport of primary fuel; • combustion of the primary fuel; • distribution of electricity from plant to household; • decommissioning of plant. However, in this study we are mainly interested in the efficiency of the generating plant itself, since this is the phase where most of the environmental impact occurs.
2.2 Efficiency of electricity generating plant Generally, the ratio of generated electricity to primary energy will describe the efficiency of a generating plant. Table 1 gives common figures for different types of plant.
Table 1: Efficiency of power plants
Type Plant Efficiency (%) CCGT1 47 Nuclear 36 Coal2 37 Oil3 38 Diesel 38 Source: Bates (1995) p6. 1combined cycle gas turbine 2conventional steam plant 3 oil fired steam plant At present the most efficient thermal plant is a combined cycle gas turbine (CCGT), with an efficiency of 47%. The values given in Table 1 are for new plants in the UK and can vary from country to country and over time. It is worth noting that the efficiency of all of the above thermal plants has increased over the years. Estimating the efficiency of combined heat and power (CHP) plants – which generate electricity by burning fossil fuels and also make use the ‘waste’ heat – is more problematic. Accounting for the efficiency of CHP plants can be done in different ways, though the two main methods are by ‘additional firing’ and ‘exergy’. If the heat that is used is also included in the efficiency calculation then the efficiency can be higher than an electricity only plant. When the transmission and other losses are included with the efficiency of the plant an overall system efficiency can be obtained. Typical values for different types of plant in the UK are given in Appendix A. 3. Domestic gas Increasingly EU householders have access to gas, either directly through ‘mains’ pipe connections or via bottled LPG (liquid petroleum gas). Piped, i.e. natural gas is by the far the most common form of gas use in European homes and is expected to increasingly replace the use of bottled LPG as the gas network is extended.
5
SAVE - EU Water Heating – Task 1 ECI: K. Lane, J. Lipp, May 2001
LPG is generally available to many households in all EU countries, but is only significant at the household level for a few countries, notably Portugal, Spain and Greece. “Natural gas is currently the fuel of choice throughout Europe and is continuing to increase its market share in virtually all market sectors and in all EU Member States.” (European Commission, 2000). Between 1998 and 2020, gas demand in Europe is expected to increase by 45%, increasing the share of primary energy supply from 21 to 27 per cent in this period. Two-thirds of this increase will be used in power generation, including CHP production (European Commission, 2000).
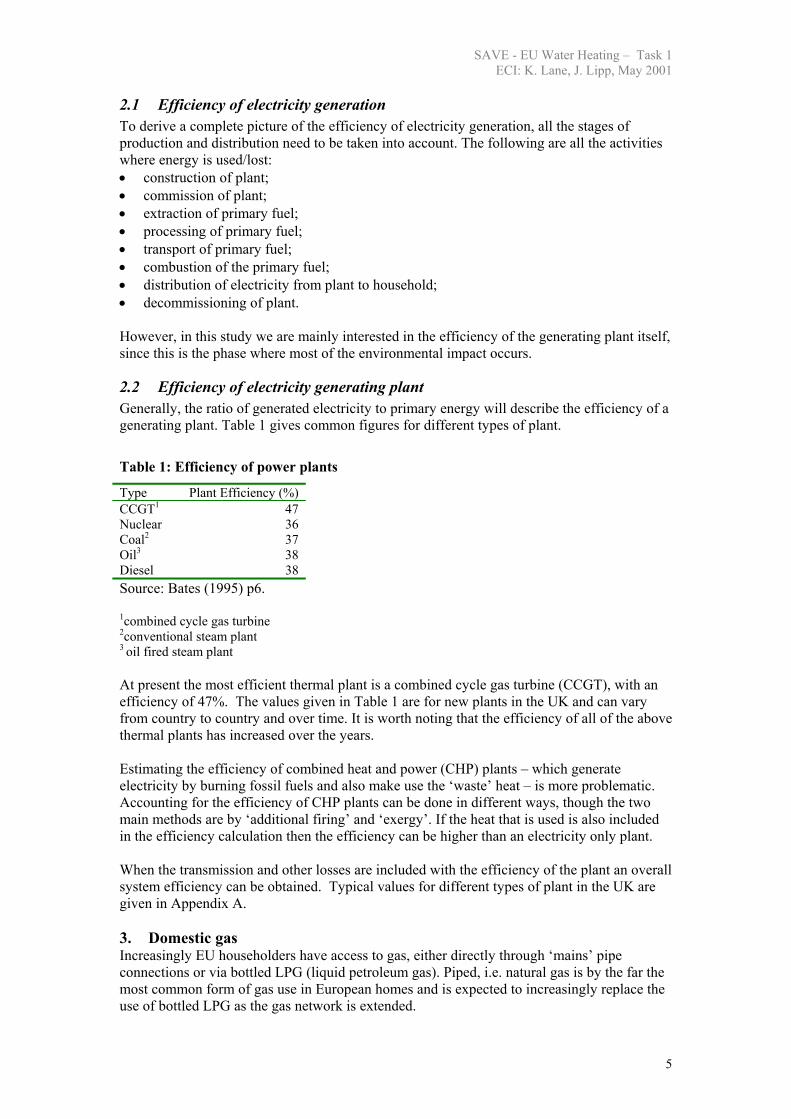
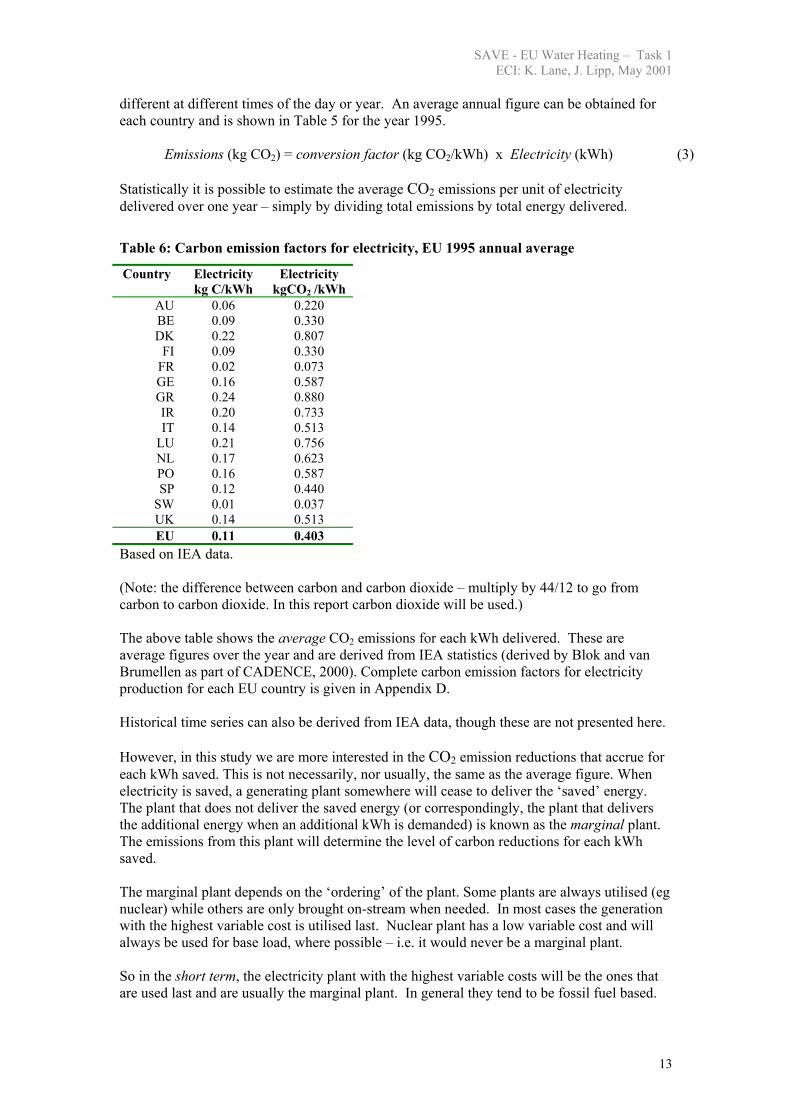
3.1 Natural gas infrastructure and household supply The number and proportion of households, which have access to natural gas, varies strikingly across the EU. Countries, in which less than one third of households are connected, can be divided into two groups according to national plans for expansion of the network. That is, those with no immediate plans for further expansion, and those countries where the expansion of the gas network is a prominent element of national energy policy. Finland and Sweden have minimal gas networks, with less than 2% of households being supplied with natural gas (Figure 2). In both of these countries, natural gas is playing a more prominent role in power generation, district heating and CHP, however further development of the low pressure distribution network depends on Finland’s linkage to the continental gas network. Studies are underway to determine the feasibility of this, but there are no plans for expansion in the near future. In Denmark, only a small proportion of households (12%) are connected, however another 27% of households make use of natural gas indirectly through district heating and CHP (Dansk Naturgas, 1999). Appendix C provides more detail on households with access to natural gas in each Member State.
69.6
81.942.0
41.0
97.0
26.0
55.0
37.4
27.012.0
2.6
1.21.5
0.2
Figure 2: Households connected to the natural gas network, EU, 1997-9 (%) Portugal, Greece and Northern Ireland all have major development projects underway for the construction of a natural gas network:
6
SAVE - EU Water Heating – Task 1 ECI: K. Lane, J. Lipp, May 2001
• the Portuguese natural gas network was planned for completion in 1997. However,
technical and financial hurdles are such, that domestic sector penetration is proceeding slowly;
• construction of the low pressure distribution network in Greece is still in the very early stages, and only around 8,000 households in the Athens area had access to natural gas in 1999. A tender for the development of the gas network in the three most highly populated regions of Greece (inhabited by over 50% of the country’s population) is underway. Natural gas is considered unlikely to have a dramatic impact on the domestic sector, at least in the near future. The bulk of domestic sector fuel-switching will involve the conversion of oil-fired collective heating systems for apartment buildings. In other respects, the opportunities for fuel-switching in Greek households are limited, (about 21% have solar water heating) and the costs of conversion from other fuels may be prohibitive for individual households;
• domestic consumers in Northern Ireland (part of UK) started to receive natural gas in 1997, after completion of the Scotland to Northern Ireland Pipeline in 1996.
In Spain and Ireland, the gas network is expanding at a considerable rate, and continuation of this trend constitutes a prominent element of national energy policy. In Spain, for example, the number of domestic consumers grew from 1.9 million in 1990 (17% of households) to 3.16 million in 1997 (27%). The Irish natural gas company Bord Gáis Éireann planned to extend the natural gas supply by at least 18,000 households in 1998, representing a further 6% on the existing customer base of 322,000. In 1998, 72 million households (48% of all EU households) were connected to the natural gas network; the proportion is growing at about 1% p.a. Therefore, by 2000, half of all homes in the European Union had access natural gas. The most rapid increase in new connections is occurring in (in order) Germany, Austria, Spain, UK, Belgium, the Netherlands, Italy and Denmark. See Appendix C for a list of the most recent available estimates for the number of domestic consumers (and the proportion of connected households) in each country. The largest national group of domestic consumers is found in the UK. Germany provides the second largest national consumer group. The state with the highest proportion of domestic connections is the Netherlands. Security of Supply About 40 percent of the EU’s gas demand is currently covered by imports from Algeria, Norway and Russia. This import dependency is expected to reach 66 percent by 2020 as domestic (EU) gas supplies decline. Europe is in a good position regarding security of supply as “more than 80% of the total proven gas reserves in the world are located in regions from which the EU is already importing gas or from which it is within reasonable distance. Europe is therefore expected to have sufficient potential for broadening its supply base provided that the necessary economic and price incentives prevail (European Commission, 2000). Difference in gas across EU Across the EU there are different types of gas in different regions. These have different calorific values, as well as different emissions when combusted. For instance in the UK, liquid petroleum gas (LPG) has an emission factor of 0.234 kg of CO2 per kWh, while natural gas emits 0.188 and town gas 0.200 kg CO2 per kWh. By contrast the 1991 EU median value for natural gas is 0.202 kg CO2/kWh. However, because the variation across countries is small and sometimes difficult to obtain we use the median EU figures given in Table 4, for all countries (NAEI, 2000; Eurostat, 1997). The efficiency of distribution plays a role in the amount of gas that reaches the end user. In the transport of gas from fields to the home some gas is lost (e.g. leaking pipelines), however, examination of these losses is beyond the scope of this study.
7

SAVE - EU Water Heating – Task 1 ECI: K. Lane, J. Lipp, May 2001
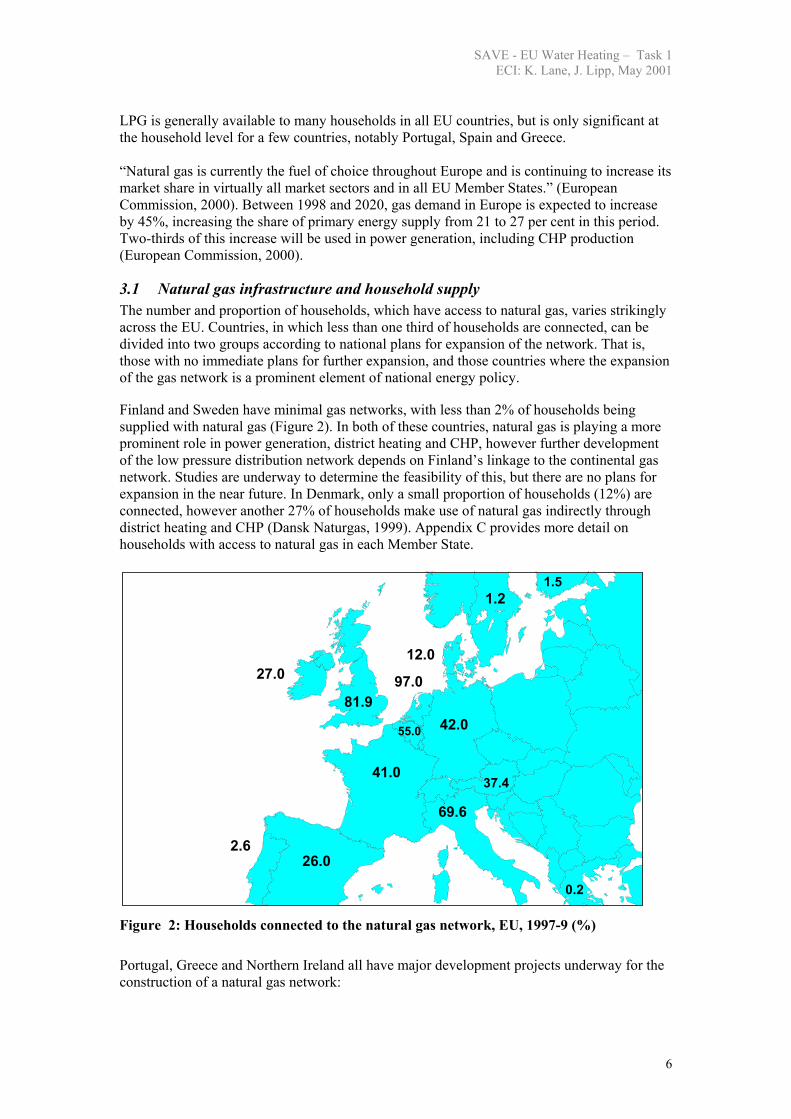
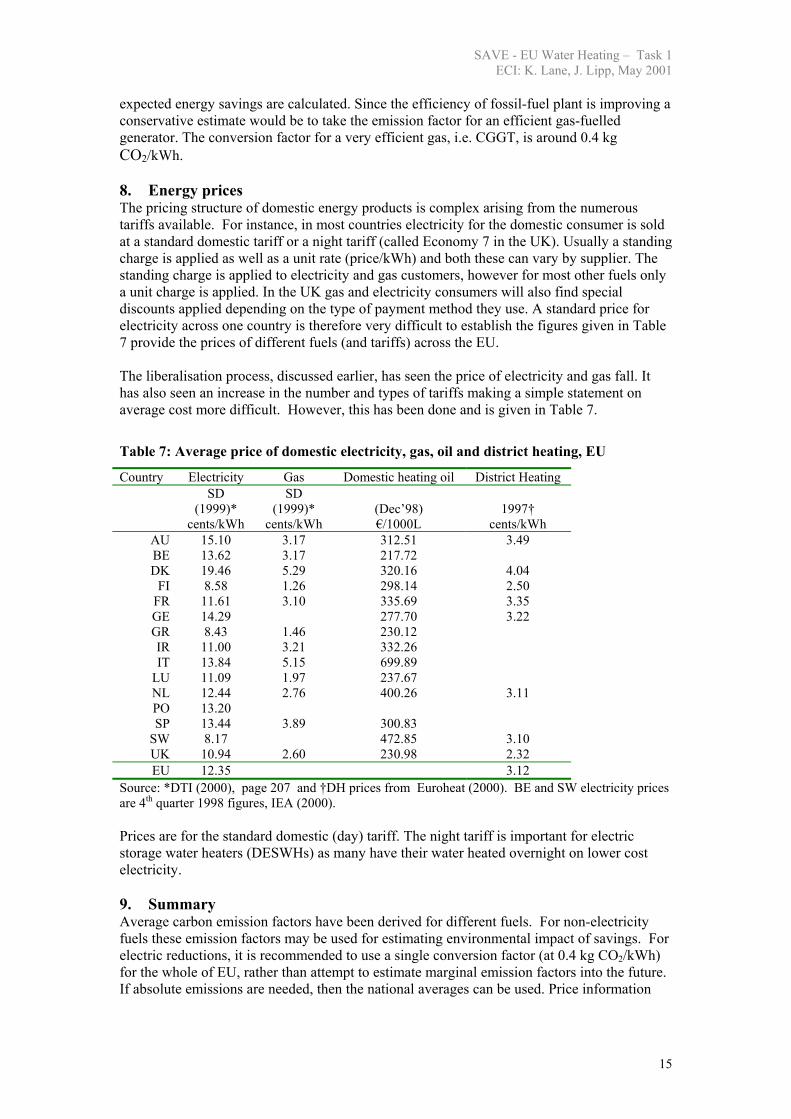
4. District heating District Heating (DH) offers excellent opportunities for achieving both energy savings and reducing environmental pollution. It is an extremely flexible technology, which can make use of any fuel including the energy in waste, renewable energy and, most significantly, the application of combined heat and power (CHP). DH is a heating system in which steam or hot water for space or water heating is piped from a central boiler plant or electric power/heating plant to a cluster of buildings. In the EU, DH penetration in the national heat markets ranges from 1 to 50%, with the largest share in Scandinavia (50% in Finland and Denmark, 38% in Sweden). The national market shares of DH and DH produced in conjunction with CHP in the EU are shown in Figure 3 (Euroheat, 2000).
0102030405060708090
100
Austria
Denmark
Finlan
d
France
German
y
Greeec
eIta
ly
Netherl
ands
Sweden UK
Shar
e (%
)
DH share DH produced by CHP
Figure 3: Share of district heating (and DH produced by CHP) in the EU, percentage of households connected, 1997 Source: Euroheat, 2000 Future development of DH is expected in the EU. The general positive attitude towards this source of heating coupled with the its environmental and conservation benefits means DH is on the energy policy agenda of many countries. Growth is expected in most countries that currently have a low level of penetration. Austria, France, Italy, and the UK all have growth of their DH/CHP sectors as part of their energy policy goals. In Southern countries like Greece and Spain district cooling is more appropriate, although some new DH plants are planned in the short term For countries with high penetration already, there is limited scope for expansion and little is expected in Denmark and Finland. However, 3% growth per year for the next 10 years is expected in Sweden (Euroheat, 2000).
8

SAVE - EU Water Heating – Task 1 ECI: K. Lane, J. Lipp, May 2001
4.1 Efficiency of CHP plant Estimating the efficiency of combined heat and power (CHP) plants – which generate electricity by burning fossil fuels and also make use the ‘waste’ heat – is more problematic. Accounting for the efficiency of CHP plants can be done in different ways, though the two main methods are by ‘additional firing’ and ‘exergy’. If the heat that is used is also included in the efficiency calculation then the efficiency can be increased to over 50%. 5. Fuel access in Europe One of the key limiting factors to fuel choice is the availability of fuel to the householder. If a household is not connected to the national grid supply, it is unlikely they will choose that fuel. Within the EU it is assumed that every household has access to ‘mains’ electricity, i.e. connected to the national grid. However, access to natural gas is less widespread. The development of natural gas field in the North Sea, northern Africa, and towards the east has meant an increase in the availability of this fuel to householders. At present almost half of all EU households have access to piped natural gas. The trend towards increased access is expected to increase, such that by 2020, around 70% of EU households may be connected to the gas distribution network. The following table will summarise the percentage of households that have access to specific fuels.
Table 2: Household access to electricity, district heating and gas; EU 1998
Country Electricity access (%)
District heating access (%)
Piped natural gas access (%)
Use of bottled LPG
AU 100 12.4 37.4 BE 100 55.0 DK 100 54.2 12.0 FI 100 50.0 1.5 FR 100 3.5 41.0 GE 100 12.0 42.0 GR 100 1.0 0.2 IR 100 27.0 IT 100 1.0 69.6 LU 100 NL 100 3.0 97.0 PO 100 2.6 SP 100 26.0 SW 100 38.0 1.2 UK 100 1.0 81.9 EU 100 48 Source: CADENCE (2000), Euroheat (2000) 6. National and EU policy Policy developments at the EU and Member State levels can and will have influences, directly and indirectly, on water heating considerations in European households. Liberalisaton of the energy industries (gas and electric), for instance, is expected to result in price reductions for end users. The type of fuels used may be influenced, amongst other things, by prices, but also by environmental priorities within a country. The recent EU White paper on renewable energy, for instance, will encourage the increasing use of solar thermal water heating and biomass systems. While individual country priorities may result in an increase in gas use because of a reduction in nuclear dependence. These national and EU considerations thought to affect the water heaters market are summarised in this section.
9

SAVE - EU Water Heating – Task 1 ECI: K. Lane, J. Lipp, May 2001
6.1 EU regulation Two of the main policy interventions at the EU level expected to have a significant effect on the energy market are the electric and gas directives. These require ‘deregulation’ (strictly this should be liberalisation) of these markets, leading to increased competition, easier supply across EU, lower prices and more pricing structures. The rate of liberalization of these markets varies from country to country and until the process is complete the full implication on the market are uncertain. The draft renewables directive if adopted will also have an effect, although a smaller one, on the EU energy markets.
6.1.1 Electricity Directive The EU directive for a common / single electricity market (Community Directive 96/92/EC) was adopted by Member States in December1996. And February 1999 marks the date that competition became the norm, not the exception, for electricity trade and production across the EU. Prior to the Directive, the EU electricity market had been based generally on monopoly production and distribution and 15 separate, national markets (European Commission, 1999b). The objective of the Directive is manifold, designed to: • increase efficiency by introducing competitive forces into the electricity market; • lower electricity prices and to make prices competitive across the single market; • improve the service of electricity supply, protecting the old, disadvantaged and the
environment; • reduce the reserve capacity and make better use of resources; • provide customer choice based on their priorities of price, locality, cleanness, service etc. (European Commission, 1999b) In February 2000 more than 60% of EU electricity consumers were able to purchase their electricity from any EU supplier (European Commission, 1999b) covering the majority of large and medium sized purchasers in the EU and domestic consumers in some countries. Price reductions are already being felt across the EU to the benefit of business and consumers.
6.1.2 Gas Directive The adoption of the Natural Gas Directive (Community Directive 98/30/EC) in June 1998 is expected to make a strong contribution to increasing gas demand (European Commission, 1999a). With effect from 10 August 2000, Member States are now obliged, by law, to transpose the directive into national legislation. Progress to date has been swift, with 80% of the EU market already open to competition, this despite a requirement of only 20% for 2000 and 33% by 2008. This level of opening is expected to increase to 90% by 2008. Whether progress into the future will continue at the same pace remains to be seen but one thing is certain, this marks the beginning of a new era in the European gas market (European Commission, 2000). The opening up of national markets to competition and the integration of the 15 national gas markets to create a single free market with cross-border trade will foster a competitive industry. The Gas Directive is expected to help minimize natural gas prices for consumers, as a result of increased competitiveness among suppliers. As traditional monopolies are opened to competition, the European gas industry will undergo significant restructuring. Individual member states have the right to implement the Directive at their own pace. The UK gas market, for instance, has been fully liberalised since 1998 and Germany’s market is almost 100% open too. By 2008 five additional Member States will be fully open to competition: Austria, Italy, the Netherlands, Spain and Sweden (European Commission, 2000).
10
SAVE - EU Water Heating – Task 1 ECI: K. Lane, J. Lipp, May 2001
6.1.3 Encouraging renewables To help achieve its Kyoto carbon reduction obligation, the EU is developing a Directive on renewable energy to encourage increased use of these technologies. In May 2000 the Commission put forward a proposal for a Directive on the promotion of electricity sources in the EU. The outlined target is to raise the percentage of renewable energy in the total EU energy supply from the current 6 percent to 12 percent by 2010 (European Commission, 2000b). In addition it aims to increase the share of renewably generated electricity from 14 to 22 percent by 2010 (European Commission, 2000b; Volpi, 2000). If adopted each member state will be required to set national targets for renewable electricity consumption, “in compliance with the EU objective of doubling the renewable energy share and the Kyoto greenhouse gas emission cuts” (Volpi, 2000). Member States are developing their own action plans and targets to achieve this value. Specific targets have also been identified: 15 million m2 solar collector and 1 million households heated by biomass by 2003 and an increase of 10,000 MW of combined heat and power biomass installations by 2003 (European Commission, 1997). If these targets are achieved, they will have some implication for the source of fuels used and the environmental impact of water heating in the EU, although in the short term this effect is likely to be minimal. 7. Environmental impact In the context of this study the environmental impact of the fuel used are the greenhouse gases emitted when combusting fossil fuel. The most important gas, in terms of global warming potential, is carbon dioxide. However, other (mainly) particulate emissions are of concern for thermal plants. For the electricity run appliances, the emissions are at the generating source and depend on the fuel used to generate the electricity. In addition, the efficiency of the generating plant and the losses accrued during transporting the electricity to the boiler will also determine the amount of emissions for each kWh of electricity used in the boiler/appliance. Other indirect emissions will not be considered. For example the emissions incurred from building the power plants, or pipelines, or refining any fuel will not be included. Ideally, these would be included and ameliorated across all the products that use the fuel, however, these are generally considered to be relatively small. Thus, we will not consider full-fuel cycle (ie that which includes the embodied energy in the plant, delivery of stock, etc). In generating hot water from gas- and oil-fuelled appliances emissions are released directly at source. For these gas and oil fuelled appliances the emissions are independent of the time of use. One kWh of gas will always produced a certain amount of CO2 if combusted completely. For this project it is desirable to have a conversion factor to translate energy consumption by the energy-using appliance into an emissions figure, of the following nature:
Emissions = conversion factor x delivered energy used (1) Table 4 shows the emissions per unit of fuel combusted, independent of place of combustion. From these is it is possible to derive the emissions from gas in a boiler, or emissions from generating electricity (when combined with the efficiency of the electricity generation and delivery system). Table 4: Carbon emissions from different fuel types Fuel Emission factor
(t CO2/TJ) Emission factor(kg CO2/kWh)
11

SAVE - EU Water Heating – Task 1 ECI: K. Lane, J. Lipp, May 2001
Peat 105 0.378 Coke 108 0.389 Brown coal 105 0.378 Hard coal 94 0.338 Brown coal briquettes 99 0.356 Black lignite 99 0.356
Crude oil 75 0.270 Gas/diesel oil 74 0.266
Refinery gas 58 0.209 Coke oven gas 46 0.166 Gasworks gas 59 0.212 LPG 65 0.234 Natural gas 56 0.202 Source: Eurostat (1997, p75) These are based on 1991 values as the median of factors used in the Member States. There are other emissions resulting from the burning of fossil fuels, which include methane (CH4), Nitrous Oxide (N2O), Nitrogen Oxides (NOX) Sulphur Dioxide (SO2). Appendix E shows all emission factors of different fuels.
7.1 Allocating carbon emissions to natural gas usage From the above data it is recommended to use the conversion factor of 0.2 kg CO2 for each kWh of natural gas used in the appliance.
Emissions (kg CO2) = conversion factor (kg CO2/kWh) x Gas use (kWh) (2) The carbon factor for LPG should be slightly greater than for natural gas and an average figure is 0.23 kg CO2/kWh is recommended.
7.2 Allocating carbon emissions to delivered electricity (used and saved) Unlike gas/oil/fuel burned in the appliance, the conversion factor for electricity is not a fixed constant, since the generating mix changes through time, and also varies during the day, week and seasons. Thus, the temporal effects of electricity generation need to be explored. For electricity generated by nuclear power, the carbon emissions are assumed to be zero. However, there are some embodied CO2 emissions due to the production of the plant (e.g. in the cement), though these are not considered in this study. However, the main environmental impact of this type of generation, is the nuclear waste generated as a by-product of the nuclear fission process. At present processing and storing the highly toxic waste is very challenging. For electricity generation by thermal plants some pollutants can be removed through technical fixes, such as scrubbing. Thus, sulphur dioxide has been substantially reduced since the large combustion plant Directive, which required generators to reduce some of their emissions. However, removing CO2 emissions from thermal plants is possible though very costly at present. For each country the emissions from generating electricity will be different due to differing efficiencies of plant, different fuels used and distribution losses. The figures will also be
12
SAVE - EU Water Heating – Task 1 ECI: K. Lane, J. Lipp, May 2001
different at different times of the day or year. An average annual figure can be obtained for each country and is shown in Table 5 for the year 1995.
Emissions (kg CO2) = conversion factor (kg CO2/kWh) x Electricity (kWh) (3) Statistically it is possible to estimate the average CO2 emissions per unit of electricity delivered over one year – simply by dividing total emissions by total energy delivered.
Table 6: Carbon emission factors for electricity, EU 1995 annual average
Country Electricity kg C/kWh
Electricity kgCO2 /kWh
AU 0.06 0.220 BE 0.09 0.330 DK 0.22 0.807
FI 0.09 0.330 FR 0.02 0.073 GE 0.16 0.587 GR 0.24 0.880 IR 0.20 0.733 IT 0.14 0.513
LU 0.21 0.756 NL 0.17 0.623 PO 0.16 0.587 SP 0.12 0.440
SW 0.01 0.037 UK 0.14 0.513 EU 0.11 0.403
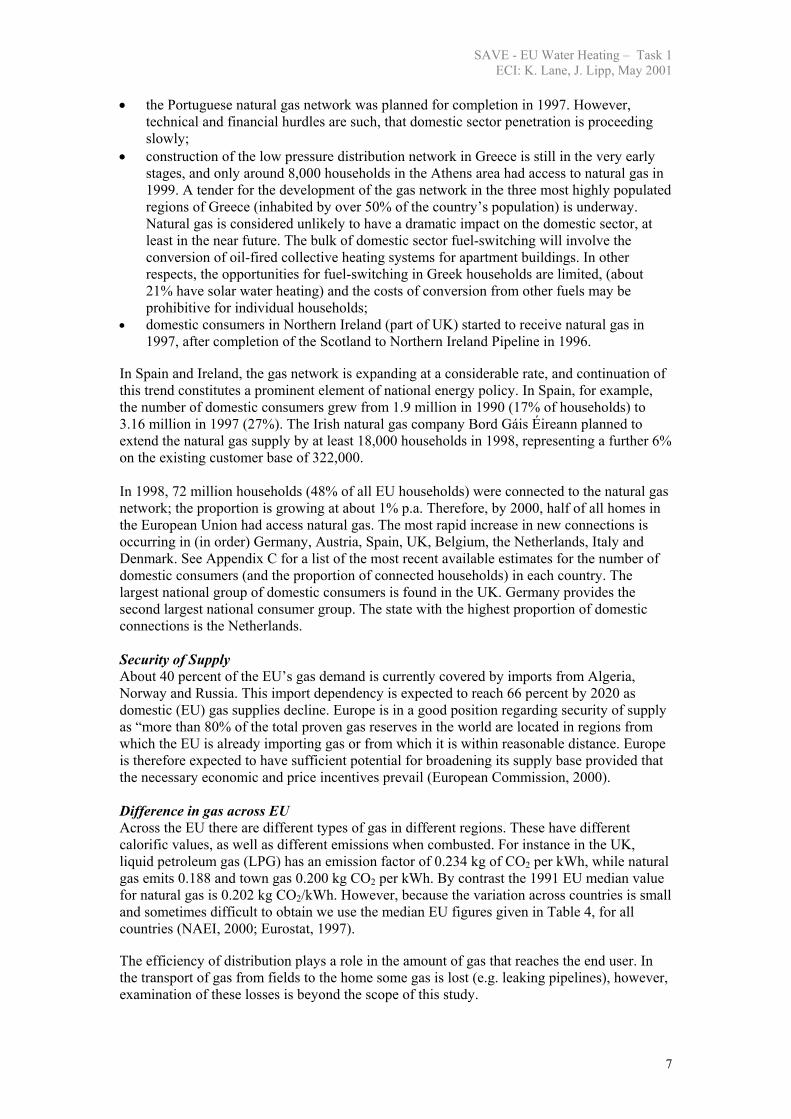
Based on IEA data. (Note: the difference between carbon and carbon dioxide – multiply by 44/12 to go from carbon to carbon dioxide. In this report carbon dioxide will be used.) The above table shows the average CO2 emissions for each kWh delivered. These are average figures over the year and are derived from IEA statistics (derived by Blok and van Brumellen as part of CADENCE, 2000). Complete carbon emission factors for electricity production for each EU country is given in Appendix D. Historical time series can also be derived from IEA data, though these are not presented here. However, in this study we are more interested in the CO2 emission reductions that accrue for each kWh saved. This is not necessarily, nor usually, the same as the average figure. When electricity is saved, a generating plant somewhere will cease to deliver the ‘saved’ energy. The plant that does not deliver the saved energy (or correspondingly, the plant that delivers the additional energy when an additional kWh is demanded) is known as the marginal plant. The emissions from this plant will determine the level of carbon reductions for each kWh saved. The marginal plant depends on the ‘ordering’ of the plant. Some plants are always utilised (eg nuclear) while others are only brought on-stream when needed. In most cases the generation with the highest variable cost is utilised last. Nuclear plant has a low variable cost and will always be used for base load, where possible – i.e. it would never be a marginal plant. So in the short term, the electricity plant with the highest variable costs will be the ones that are used last and are usually the marginal plant. In general they tend to be fossil fuel based.
13

SAVE - EU Water Heating – Task 1 ECI: K. Lane, J. Lipp, May 2001
0.0
0.2
0.4
0.6
0.8
1.0
1.2
AU BE DK FI FR GE GR IR IT LU NL PO SP SW UK EU
emis
sion
fact
or (k
g C
O2/
kWhe
)
totalfossilgas
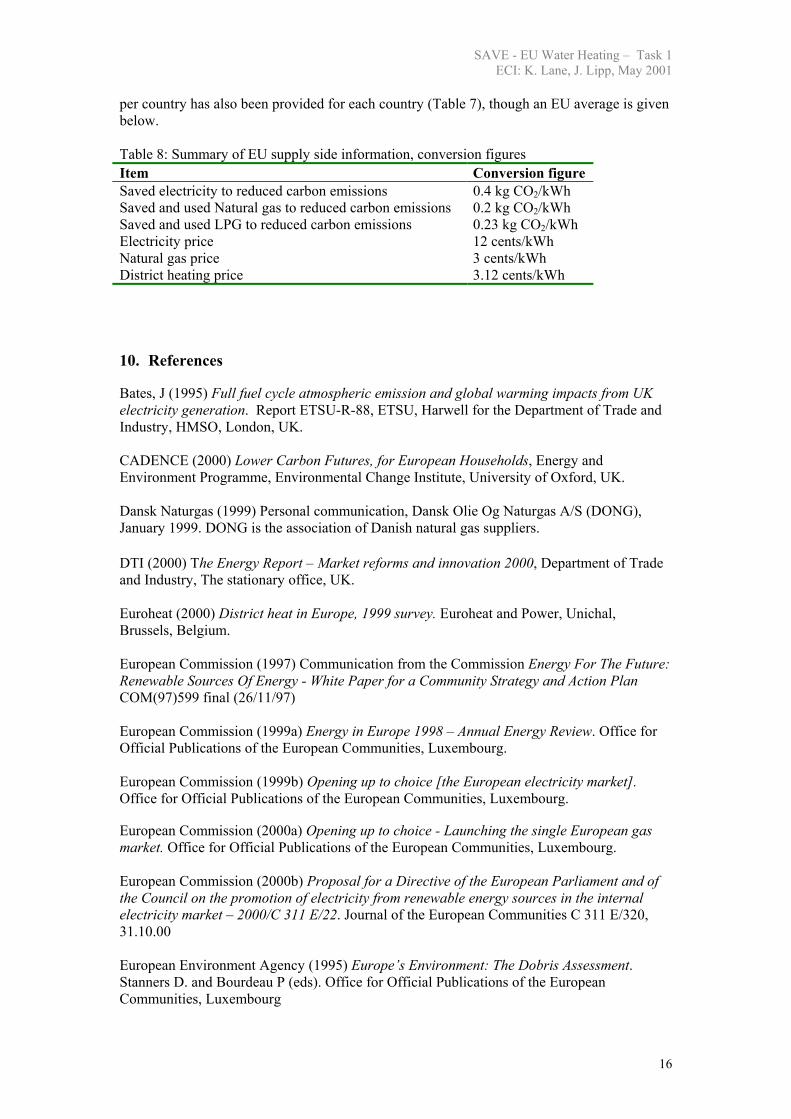
Figure 3: Emission factors for EU countries, 1995 Source: Blok and van Brummelen, in CADENCE (2000) If the reduced energy demand continues into the future, then the generating capacity will necessarily be smaller that would otherwise have been. In this case some plant will cease to be used, or some new plant that was to be built will not be built. Thus, in the long term, the marginal plant may be different to the short-term marginal plant. There is pressure to increase renewable energy capacity (as part of green house gas reduction targets), embodied at EU level in an aim to generate 12% by renewables by 2010. This is a challenging target. In addition, new nuclear generating capacity is not being sought. Thus, at present, it would appear that the additional plants that would need to be built, either additional capacity or replacement, will be gas-fired (either CCGT or CHP plant). Thus, it is likely that the marginal plant will still be fossil fuelled plants (though probably more efficient than the current stock). So, it is recommended that the average emissions from such generation should be used as a conversion when estimating emissions from saved electricity. Adopting this method has two main points in its favour. First, a single conversion is being used which means subsequent calculations are very simple - using a complex supply side model would take involve an extra layer of complexity. Secondly, it is a very transparent how the conversion is being made. To obtain a more refined emission factors would mean resorting to complex modelling of the supply side for the whole of Europe. Within the scope of this study this is not possible, and not even desirable – the substantial additional effort that would be required to refine the conversion is not warranted. Taking a single figure for the whole of Europe becomes more realistic, when viewed within a single EU-wide market for electricity. With the adoption of the Electric Directive (CEC, 1998) a fully liberalised EU market for electricity is likely in the next few years. In light of this argument, a single emissions factor for the whole of Europe, should be based on the marginal plant (fossil-fuel) when an estimate of emissions are needed when the
14
SAVE - EU Water Heating – Task 1 ECI: K. Lane, J. Lipp, May 2001
expected energy savings are calculated. Since the efficiency of fossil-fuel plant is improving a conservative estimate would be to take the emission factor for an efficient gas-fuelled generator. The conversion factor for a very efficient gas, i.e. CGGT, is around 0.4 kg CO2/kWh. 8. Energy prices The pricing structure of domestic energy products is complex arising from the numerous tariffs available. For instance, in most countries electricity for the domestic consumer is sold at a standard domestic tariff or a night tariff (called Economy 7 in the UK). Usually a standing charge is applied as well as a unit rate (price/kWh) and both these can vary by supplier. The standing charge is applied to electricity and gas customers, however for most other fuels only a unit charge is applied. In the UK gas and electricity consumers will also find special discounts applied depending on the type of payment method they use. A standard price for electricity across one country is therefore very difficult to establish the figures given in Table 7 provide the prices of different fuels (and tariffs) across the EU. The liberalisation process, discussed earlier, has seen the price of electricity and gas fall. It has also seen an increase in the number and types of tariffs making a simple statement on average cost more difficult. However, this has been done and is given in Table 7.
Table 7: Average price of domestic electricity, gas, oil and district heating, EU
Country Electricity Gas Domestic heating oil District Heating
SD
(1999)* cents/kWh
SD (1999)*
cents/kWh
(Dec’98) €/1000L
1997†
cents/kWh AU 15.10 3.17 312.51 3.49 BE 13.62 3.17 217.72 DK 19.46 5.29 320.16 4.04
FI 8.58 1.26 298.14 2.50 FR 11.61 3.10 335.69 3.35 GE 14.29 277.70 3.22 GR 8.43 1.46 230.12 IR 11.00 3.21 332.26 IT 13.84 5.15 699.89
LU 11.09 1.97 237.67 NL 12.44 2.76 400.26 3.11 PO 13.20 SP 13.44 3.89 300.83
SW 8.17 472.85 3.10 UK 10.94 2.60 230.98 2.32 EU 12.35 3.12
Source: *DTI (2000), page 207 and †DH prices from Euroheat (2000). BE and SW electricity prices are 4th quarter 1998 figures, IEA (2000). Prices are for the standard domestic (day) tariff. The night tariff is important for electric storage water heaters (DESWHs) as many have their water heated overnight on lower cost electricity. 9. Summary Average carbon emission factors have been derived for different fuels. For non-electricity fuels these emission factors may be used for estimating environmental impact of savings. For electric reductions, it is recommended to use a single conversion factor (at 0.4 kg CO2/kWh) for the whole of EU, rather than attempt to estimate marginal emission factors into the future. If absolute emissions are needed, then the national averages can be used. Price information
15
SAVE - EU Water Heating – Task 1 ECI: K. Lane, J. Lipp, May 2001
per country has also been provided for each country (Table 7), though an EU average is given below. Table 8: Summary of EU supply side information, conversion figures Item Conversion figure Saved electricity to reduced carbon emissions 0.4 kg CO2/kWh Saved and used Natural gas to reduced carbon emissions 0.2 kg CO2/kWh Saved and used LPG to reduced carbon emissions 0.23 kg CO2/kWh Electricity price 12 cents/kWh Natural gas price 3 cents/kWh District heating price 3.12 cents/kWh 10. References Bates, J (1995) Full fuel cycle atmospheric emission and global warming impacts from UK electricity generation. Report ETSU-R-88, ETSU, Harwell for the Department of Trade and Industry, HMSO, London, UK. CADENCE (2000) Lower Carbon Futures, for European Households, Energy and Environment Programme, Environmental Change Institute, University of Oxford, UK. Dansk Naturgas (1999) Personal communication, Dansk Olie Og Naturgas A/S (DONG), January 1999. DONG is the association of Danish natural gas suppliers. DTI (2000) The Energy Report – Market reforms and innovation 2000, Department of Trade and Industry, The stationary office, UK. Euroheat (2000) District heat in Europe, 1999 survey. Euroheat and Power, Unichal, Brussels, Belgium. European Commission (1997) Communication from the Commission Energy For The Future: Renewable Sources Of Energy - White Paper for a Community Strategy and Action Plan COM(97)599 final (26/11/97) European Commission (1999a) Energy in Europe 1998 – Annual Energy Review. Office for Official Publications of the European Communities, Luxembourg. European Commission (1999b) Opening up to choice [the European electricity market]. Office for Official Publications of the European Communities, Luxembourg. European Commission (2000a) Opening up to choice - Launching the single European gas market. Office for Official Publications of the European Communities, Luxembourg. European Commission (2000b) Proposal for a Directive of the European Parliament and of the Council on the promotion of electricity from renewable energy sources in the internal electricity market – 2000/C 311 E/22. Journal of the European Communities C 311 E/320, 31.10.00 European Environment Agency (1995) Europe’s Environment: The Dobris Assessment. Stanners D. and Bourdeau P (eds). Office for Official Publications of the European Communities, Luxembourg
16

SAVE - EU Water Heating – Task 1 ECI: K. Lane, J. Lipp, May 2001
Eurostat (1997) Environmental Statistics 1996. European Communities, Brussels, Belgium. IEA (1998) Natural Gas Distribution – Focus on Western Europe. International Energy Agency, December IEA (2000) Key World Energy Statistics from the IEA – 2000 edition. International Energy Agency, Paris. NAEI (2000) National atmospheric emissions inventory. http://www.aeat.co.uk/netcen/airqual/naei/home.html, accessed January 2001. ETSU, Harwell, UK. Stern, J.P. (1998) Competition and Liberalization in European Gas Markets – A Diversity of Models. Energy and Environmental Programme, the Royal Institute of International Affairs, London, UK. Swedish National Energy Administration (1999). Swedish Electricity Market 1998. Volpi, G (2000) Taking the road to renewables? Strengths and weaknesses of the draft European Renewables Directive in Renewable Energy World, Vol 3, No 6, Nov-Dec 2000, James and James, Science Publishers Limited, London, UK. Note: Certain sections of this paper, notably parts of Section 3, are taken directly from a previous report done by the current authors. The full reference to this work, as given above, is CADENCE (2000) Lower Carbon Futures, for European Households, Energy and Environment Programme, Environmental Change Institute, University of Oxford, UK.
17

SAVE - EU Water Heating – Task 1 ECI: K. Lane, J. Lipp, May 2001
Glossary Term Meaning C Carbon
CH4 Methane
CO Carbon monoxide
CO2 Carbon dioxide
NOx Nitrous oxide
N2O Nitrous dioxide
PM10 Term used for particulate matter with a mean aerodynamic diameter of ten micrometers
(microns) or less. These anthropogenic pollutants affect the biosphere often in unknown ways. Three of the main hazards PM10 can pose are toxicity , carcinogenicity and acidity
SO2 Sulphur dioxide
Conversion factors For the purpose of presenting its energy balances the OECD has adopted Tonnes of Oil Equivalent as the unit of account. One tonne of oil equivalent (TOE) is defined as 107 kilocalories (41.868 gigajoules). This quantity of energy is, within a few per cent, equal to the net heat content of 1 tonne of crude oil. 1 Mtoe = 4.1868 x 10⁴ TJ 1 Mtoe = 107 Gcal 1 Mtoe = 3.968 x 10⁷ MBtu 1 Mtoe = 11,630 GWh
18

SAVE - EU Water Heating – Task 1 ECI: K. Lane, J. Lipp, May 2001
Appendix A: Emission and efficiency of typical power plants Source: DTI (1995) Page 16, 17 Table of contents - emissions and efficiency of generation in UK. Table number Type of plant A.1 Gas CCGT A.2 Nuclear A.3 Best practice coal A.4 Best practice coal with FDG and low NOx burners A.5 Best practice oil fire generation A.6 Orimulsion Table A.1 – Emissions from electricity generation by Gas CCGT, UK 1993 A. By Fuel cycle process stage Process Efficiency Emission factors (g/kWh) of energy input to the process stage
(%) CO2 CH4 N2O NOx CO NMVOC SO2 ParticsDistribution 92 Generation 47 187.8 0.022 0.003 0.200 0.030 0.014 Transport 100 0.0 0.023 0.003 Processing 100 Extraction 98 5.7 0.070 0.000 0.014 0.004 0.039 0.000
B. Relative to final energy demand Process Cumulative
EfficiencyEmission factors (g/kWh) of energy output to the process stage
(%) CO2 CH4 N2O NOx CO NMVOC SO2 ParticsDistribution 92 Generation 43 432.1 0.051 0.007 0.460 0.069 0.033 Transport 43 0.0 0.053 0.007 Processing 43 Extraction 43 13.3 0.017 0.000 0.034 0.008 0.092 0.001TOTAL 43 445.5 0.268 0.007 0.494 0.077 0.132 0.001
19
SAVE - EU Water Heating – Task 1 ECI: K. Lane, J. Lipp, May 2001
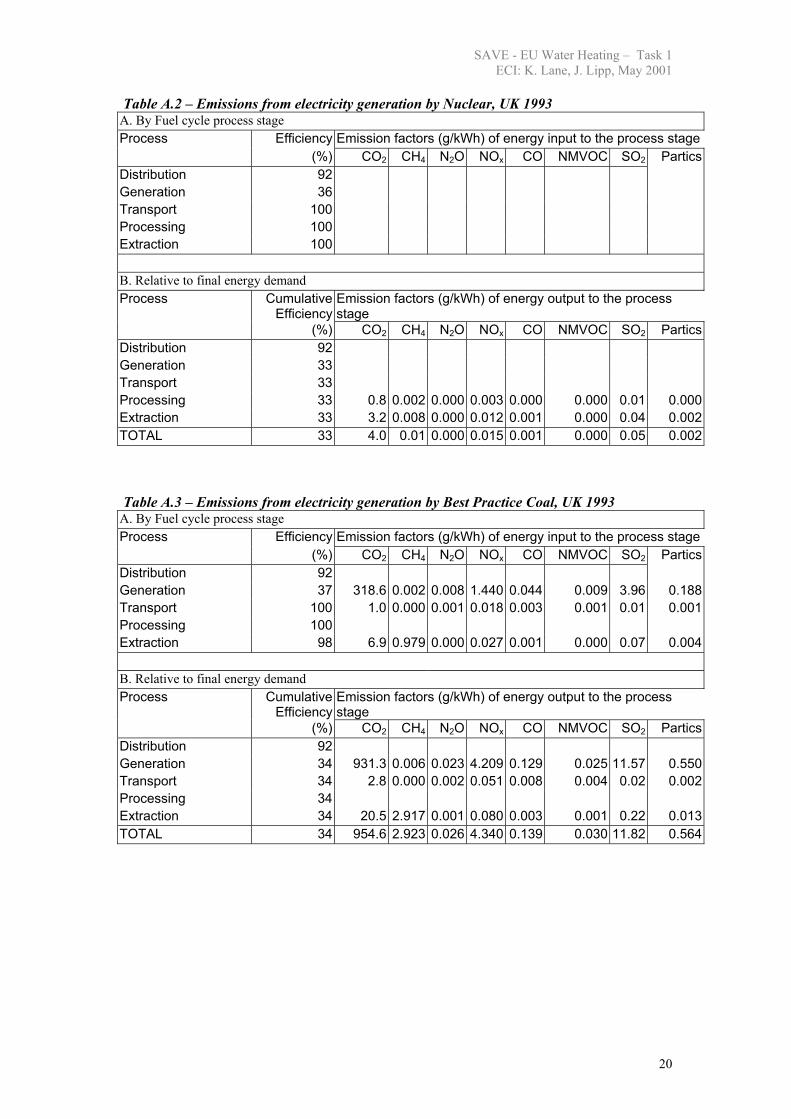
Table A.2 – Emissions from electricity generation by Nuclear, UK 1993 A. By Fuel cycle process stage Process Efficiency Emission factors (g/kWh) of energy input to the process stage
(%) CO2 CH4 N2O NOx CO NMVOC SO2 ParticsDistribution 92 Generation 36 Transport 100 Processing 100 Extraction 100
B. Relative to final energy demand Process Cumulative
EfficiencyEmission factors (g/kWh) of energy output to the process stage
(%) CO2 CH4 N2O NOx CO NMVOC SO2 ParticsDistribution 92 Generation 33 Transport 33 Processing 33 0.8 0.002 0.000 0.003 0.000 0.000 0.01 0.000Extraction 33 3.2 0.008 0.000 0.012 0.001 0.000 0.04 0.002TOTAL 33 4.0 0.01 0.000 0.015 0.001 0.000 0.05 0.002 Table A.3 – Emissions from electricity generation by Best Practice Coal, UK 1993 A. By Fuel cycle process stage Process Efficiency Emission factors (g/kWh) of energy input to the process stage
(%) CO2 CH4 N2O NOx CO NMVOC SO2 ParticsDistribution 92 Generation 37 318.6 0.002 0.008 1.440 0.044 0.009 3.96 0.188Transport 100 1.0 0.000 0.001 0.018 0.003 0.001 0.01 0.001Processing 100 Extraction 98 6.9 0.979 0.000 0.027 0.001 0.000 0.07 0.004
B. Relative to final energy demand Process Cumulative
EfficiencyEmission factors (g/kWh) of energy output to the process stage
(%) CO2 CH4 N2O NOx CO NMVOC SO2 ParticsDistribution 92 Generation 34 931.3 0.006 0.023 4.209 0.129 0.025 11.57 0.550Transport 34 2.8 0.000 0.002 0.051 0.008 0.004 0.02 0.002Processing 34 Extraction 34 20.5 2.917 0.001 0.080 0.003 0.001 0.22 0.013TOTAL 34 954.6 2.923 0.026 4.340 0.139 0.030 11.82 0.564
20

SAVE - EU Water Heating – Task 1 ECI: K. Lane, J. Lipp, May 2001
Table A.4 – Emissions from electricity generation by Best practice coal with FDG and low NOx burners, UK 1993 A. By Fuel cycle process stage Process Efficiency Emission factors (g/kWh) of energy input to the process stage
(%) CO2 CH4 N2O NOx CO NMVOC SO2 ParticsDistribution 92 Generation 36 320.7 0.002 0.008 0.940 0.044 0.009 0.41 0.059Transport 100 0.4 0.000 0.000 0.006 0.001 0.001 0.00 0.000Processing 100 Extraction 98 7.1 1.349 0.000 0.028 0.001 0.000 0.08 0.004
B. Relative to final energy demand Process Cumulative
EfficiencyEmission factors (g/kWh) of energy output to the process stage
(%) CO2 CH4 N2O NOx CO NMVOC SO2 ParticsDistribution 92 Generation 33 963.4 0.006 0.024 2.842 0.132 0.026 1.25 0.176Transport 33 1.3 0.000 0.001 0.017 0.004 0.002 0.00 0.001Processing 33 Extraction 33 21.7 4.134 0.001 0.087 0.004 0.001 0.24 0.013TOTAL 33 986.5 4.140 0.026 2.928 0.139 0.029 1.49 0.190 Table A.5 – Emissions from electricity generation by Best Practice Oil, UK 1993 A. By Fuel cycle process stage Process Efficiency Emission factors (g/kWh) of energy input to the process stage
(%) CO2 CH4 N2O NOx CO NMVOC SO2 ParticsDistribution 92 Generation 38 264.0 0.003 0.002 1.300 0.051 0.012 4.86 0.140Transport 100 0.2 n.a. 0.000 0.002 n.a. n.a. 0.00 0.000Processing 96 10.4 0.001 0.000 0.061 0.007 0.193 0.11 0.003Extraction 98 11.6 0.052 0.000 0.033 0.005 0.039 0.00 0.000
B. Relative to final energy demand Process Cumulative
EfficiencyEmission factors (g/kWh) of energy output to the process stage
(%) CO2 CH4 N2O NOx CO NMVOC SO2 ParticsDistribution 92 Generation 35 751.4 0.007 0.004 3.700 0.145 0.034 13.83 0.398Transport 35 0.4 n.a. n.a. 0.006 n.a. n.a. 0.00 0.000Processing 34 31.0 0.004 0.000 0.181 0.020 0.574 0.33 0.010Extraction 33 35.2 0.159 0.001 0.099 0.015 0.117 0.00 0.001TOTAL 33 817.9 0.169 0.005 3.985 0.180 0.726 14.06 0.410
21

SAVE - EU Water Heating – Task 1 ECI: K. Lane, J. Lipp, May 2001
Table A.6 – Emissions from electricity generation by Orimulsion, UK 1993 A. By Fuel cycle process stage Process Efficiency Emission factors (g/kWh) of energy input to the process stage
(%) CO2 CH4 N2O NOx CO NMVOC SO2 ParticsDistribution 92 Generation 34 265.0 n.a. n.a. 0.940 n.a. n.a. 6.54 0.060Transport 100 6.8 n.a. n.a. 0.177 0.019 0.005 0.12 0.005Processing 96 7.4 0.000 0.000 0.024 0.006 0.000 0.001Extraction 100 4.9 0.015 0.000 0.016 0.004 0.001 0.00 0.001
B. Relative to final energy demand Process Cumulative
EfficiencyEmission factors (g/kWh) of energy output to the process stage
(%) CO2 CH4 N2O NOx CO NMVOC SO2 ParticsDistribution 92 Generation 31 842.9 n.a. n.a. 2.990 n.a. n.a. 20.80 0.191Transport 31 21.7 n.a. n.a. 0.563 0.059 0.016 0.40 0.017Processing 30 24.6 0.001 0.001 0.078 0.021 0.000 0.003Extraction 30 16.1 0.051 0.001 0.052 0.014 0.002 0.00 0.002TOTAL 30 905.4 0.052 0.001 3.683 0.095 0.019 21.20 0.212
22
SAVE - EU Water Heating – Task 1 ECI: K. Lane, J. Lipp, May 2001
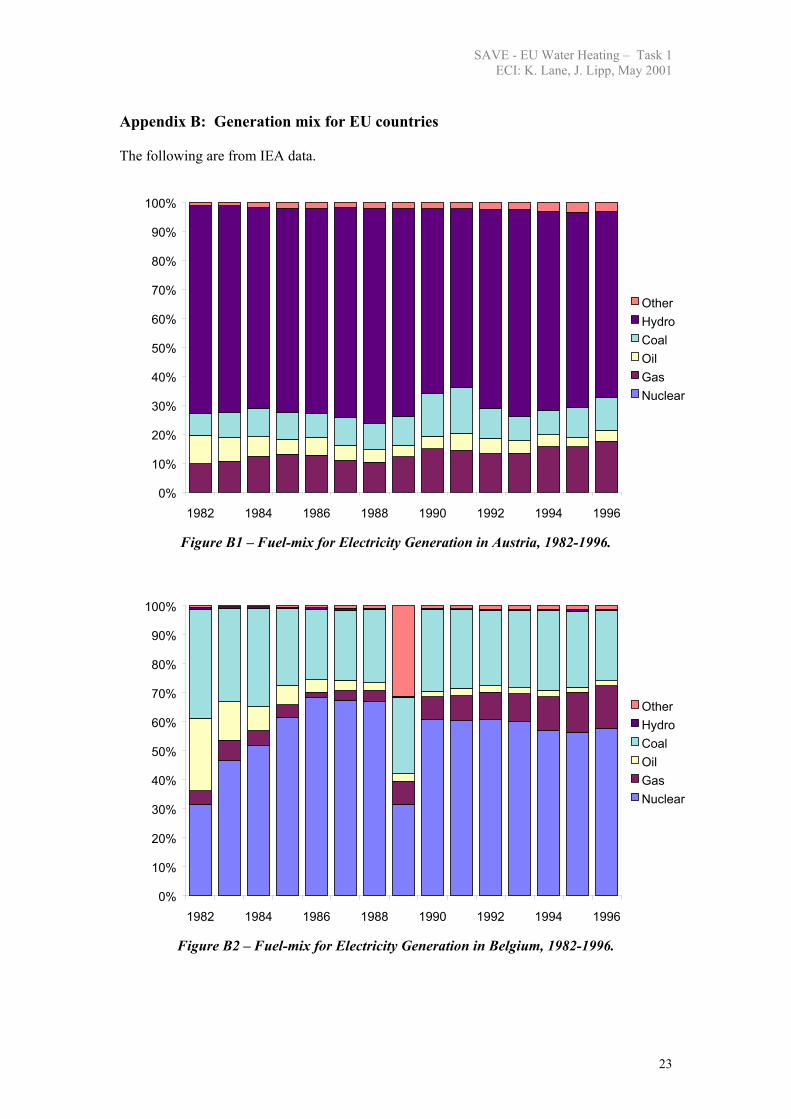
Appendix B: Generation mix for EU countries The following are from IEA data.
0%
10%
20%
30%
40%
50%
60%
70%
80%
90%
100%
1982 1984 1986 1988 1990 1992 1994 1996
OtherHydroCoalOilGasNuclear
Figure B1 – Fuel-mix for Electricity Generation in Austria, 1982-1996.
0%
10%
20%
30%
40%
50%
60%
70%
80%
90%
100%
1982 1984 1986 1988 1990 1992 1994 1996
OtherHydroCoalOilGasNuclear
Figure B2 – Fuel-mix for Electricity Generation in Belgium, 1982-1996.
23
SAVE - EU Water Heating – Task 1 ECI: K. Lane, J. Lipp, May 2001
0%
10%
20%
30%
40%
50%
60%
70%
80%
90%
100%
1982 1984 1986 1988 1990 1992 1994 1996
Hydro/OtherCoalOilGas
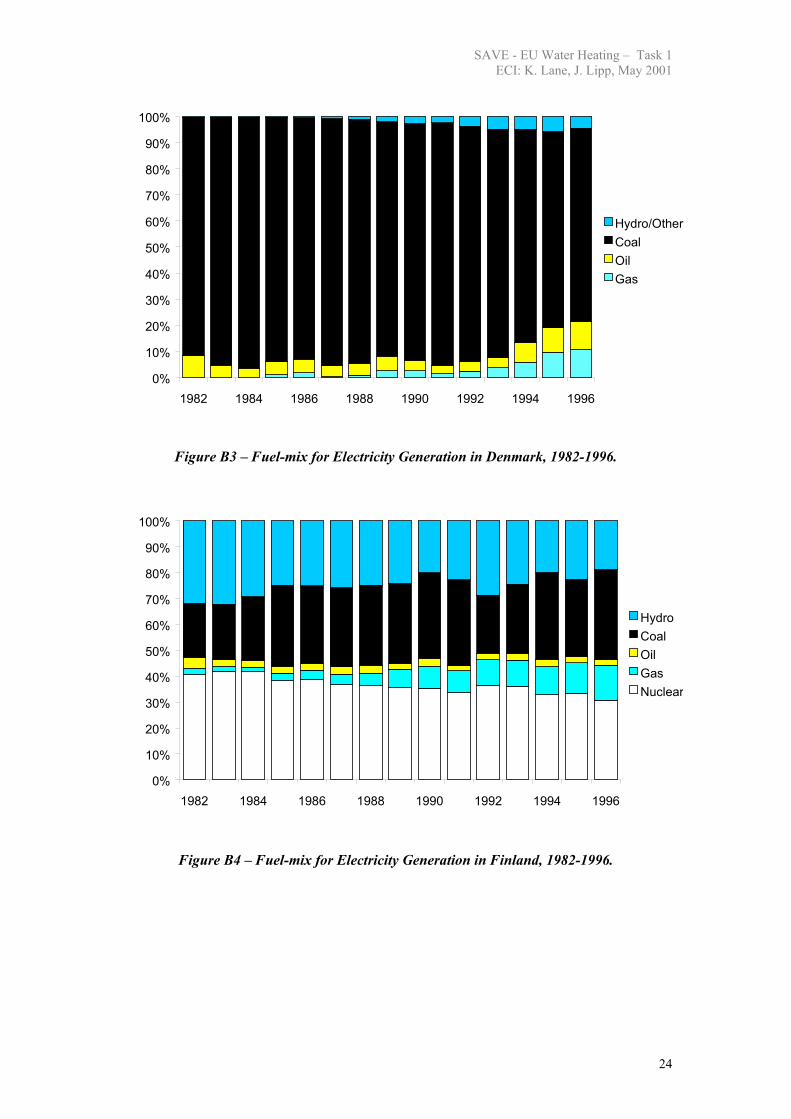
Figure B3 – Fuel-mix for Electricity Generation in Denmark, 1982-1996.
0%
10%
20%
30%
40%
50%
60%
70%
80%
90%
100%
1982 1984 1986 1988 1990 1992 1994 1996
HydroCoalOilGasNuclear
Figure B4 – Fuel-mix for Electricity Generation in Finland, 1982-1996.
24
SAVE - EU Water Heating – Task 1 ECI: K. Lane, J. Lipp, May 2001
0%
10%
20%
30%
40%
50%
60%
70%
80%
90%
100%
1982 1984 1986 1988 1990 1992 1994 1996
HydroCoalOilNuclear
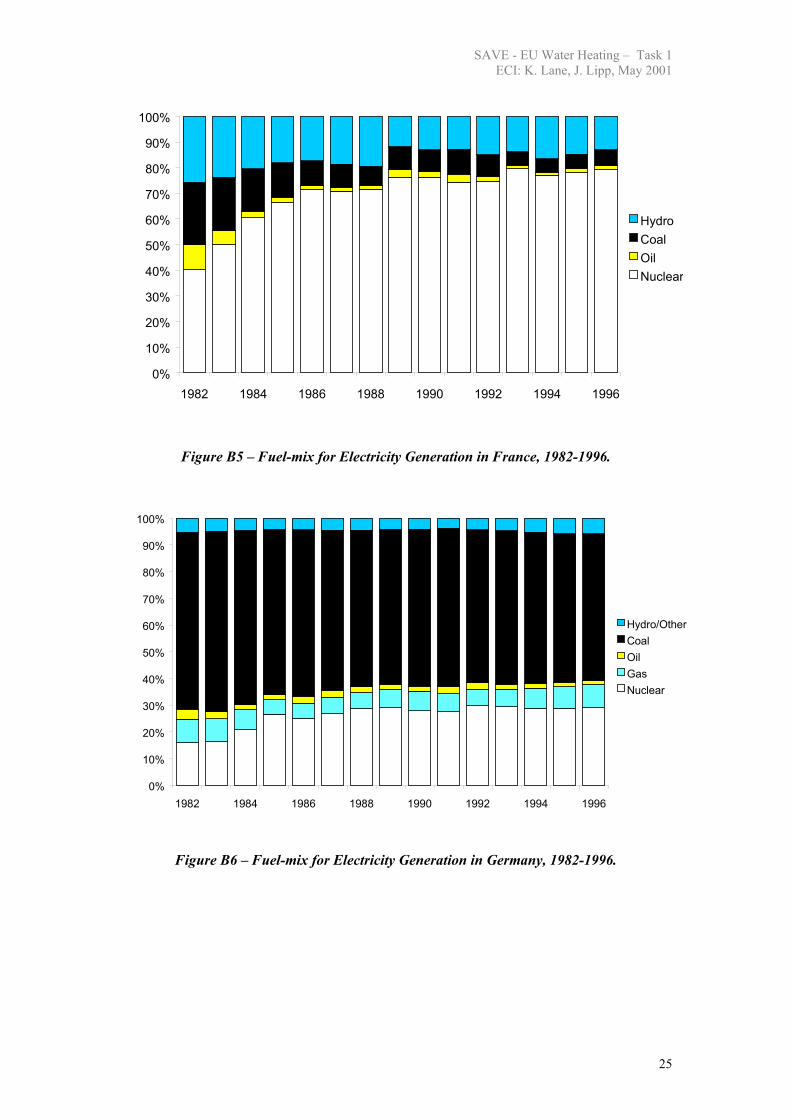
Figure B5 – Fuel-mix for Electricity Generation in France, 1982-1996.
0%
10%
20%
30%
40%
50%
60%
70%
80%
90%
100%
1982 1984 1986 1988 1990 1992 1994 1996
Hydro/OtherCoalOilGasNuclear
Figure B6 – Fuel-mix for Electricity Generation in Germany, 1982-1996.
25
SAVE - EU Water Heating – Task 1 ECI: K. Lane, J. Lipp, May 2001
0%
20%
40%
60%
80%
100%
1982 1984 1986 1988 1990 1992 1994 1996
HydroCoalOilGasNuclear
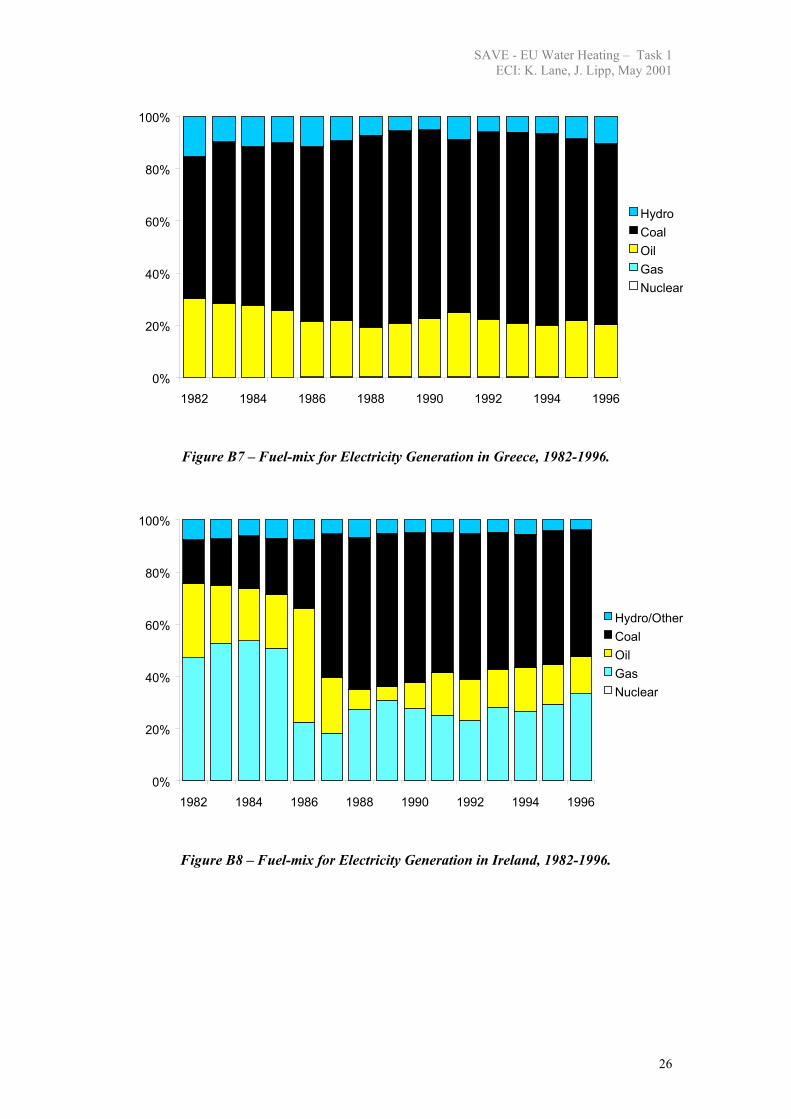
Figure B7 – Fuel-mix for Electricity Generation in Greece, 1982-1996.
0%
20%
40%
60%
80%
100%
1982 1984 1986 1988 1990 1992 1994 1996
Hydro/OtherCoalOilGasNuclear
Figure B8 – Fuel-mix for Electricity Generation in Ireland, 1982-1996.
26
SAVE - EU Water Heating – Task 1 ECI: K. Lane, J. Lipp, May 2001
0%
10%
20%
30%
40%
50%
60%
70%
80%
90%
100%
1982 1984 1986 1988 1990 1992 1994 1996
Hydro/OtherCoalOilGasNuclear
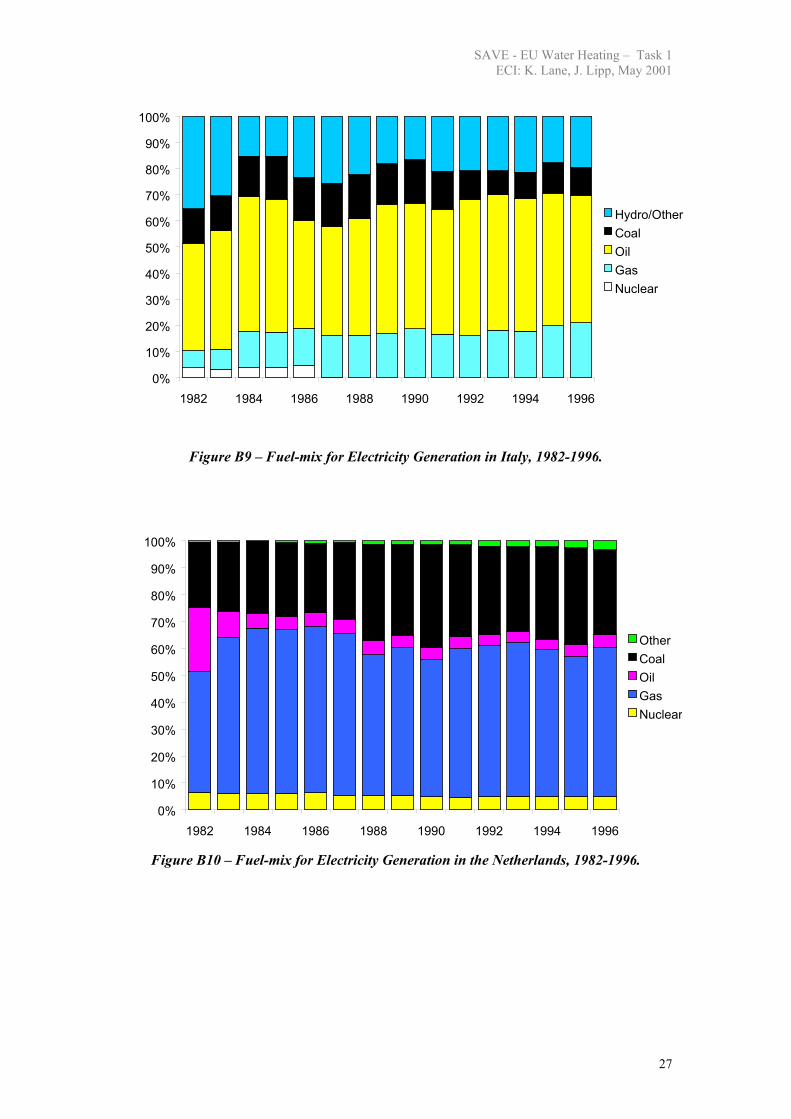
Figure B9 – Fuel-mix for Electricity Generation in Italy, 1982-1996.
0%
10%
20%
30%
40%
50%
60%
70%
80%
90%
100%
1982 1984 1986 1988 1990 1992 1994 1996
OtherCoalOilGasNuclear
Figure B10 – Fuel-mix for Electricity Generation in the Netherlands, 1982-1996.
27

SAVE - EU Water Heating – Task 1 ECI: K. Lane, J. Lipp, May 2001
0%
10%
20%
30%
40%
50%
60%
70%
80%
90%
100%
1982 1984 1986 1988 1990 1992 1994 1996
OtherHydroCoalOil
Figure B11 – Fuel-mix for Electricity Generation in Portugal, 1982-1996.
0%
10%
20%
30%
40%
50%
60%
70%
80%
90%
100%
1982 1984 1986 1988 1990 1992 1994 1996
HydroCoalOilGasNuclear
Figure B12 – Fuel-mix for Electricity Generation in Spain, 1982-1996.
28

SAVE - EU Water Heating – Task 1 ECI: K. Lane, J. Lipp, May 2001
0%
10%
20%
30%
40%
50%
60%
70%
80%
90%
100%
1982 1984 1986 1988 1990 1992 1994 1996
OtherHydroCoalOilGasNuclear
Figure B13 – Fuel-mix for Electricity Generation in the United Kingdom, 1982-1996.
29

SAVE - EU Water Heating – Task 1 ECI: K. Lane, J. Lipp, May 2001
Appendix C: Households with access to natural gas Table C: Household with access to the natural gas and annual connections, EU, 1997-9
Country Households with natural gas
(1000s)
% All households
Annual connections*
Source
AU 1,207 37.4 54,500 Eurogas, 1998; Dörfler and Reiss, 1995
BE 2,303 55.0 38,700 Eurogas, 1998; FIGAS, 1997 DK 289 12.0 19,8001 Dansk Naturgas, 1999 FI 35 1.5 100 Maakaasuyhdistys, 1998 FR 9,590 41.0 134,4002 Eurogas, 1998; GdF, 1999 GE 14,720 42.0 762,5003 Ruhrgas, 1999 GR 8 0.2 -4 Kouloumoundras, 1999 IR 322 27.0 18,000 BGE, 1999 IT 14,100 69.6 111,0005 SNAM, 1999 LU - NL 6,491 97.0 88,0006 EnergieNed, 1998; PO 74 2.6 41,200
projected ISR, 1999
SP 3,271 26.0 180,280 Sedigas, 1998a SW 52 1.2 -7 Eurogas, 1998 UK 19,897 81.9 255,000 Eurogas, 1998; BG, 1998 EU-15 72,539 48 Notes: *often averaged over several years 1 Rough estimate based on expansion of the distribution network since 1985, and an estimated 297,000 households connected (289,000 households connected plus 8,000 waiting for connection at the end of 1998) at the end of 1999 (Dansk Naturgas, 1999). 2 Estimate based on GdF (1999) figure of 160,000 new natural gas customers in 1998; Have assumed that the household sector in France is represented in the new connections in the same proportion (84%) it contributes to the overall number of GdF customers. 3Refers to annual increase in number of households using natural gas for space heating; in Germany, virtually all households connected to the network use natural gas for space heating (IER, 1998). 4 No published data available, however it is planned to extend the network into areas serving 50% of the population by 2006; the number of households connected will be much lower than this, especially considering that over 50% of households live in apartment blocks and are unlikely to benefit from gas for water and cooking (domestic sector unlikely to benefit from natural gas immediately). 5 SNAM data for the expansion of the gas distribution network suggests that the average number of household connections per year between 1992 and 1998 was 195,000 (SNAM, 1999). This is almost twice as large as ENI’s figure. SNAM is unlikely to be referring to all customers in the domestic, commercial and residential sector because dividing these figures by household numbers gives around 70%, the expected level of penetration. 6 No further network development expected in the Netherlands, other than to keep pace with new construction (Ecofys, 1998). 7 No data, however the domestic market is unlikely to develop further in the near future (Svenska Gasföreningen, 1999). Source: CADENCE (2000)
30

SAVE - EU Water Heating – Task 1 ECI: K. Lane, J. Lipp, May 2001
Appendix D: Emission factors for EU electricity production
Table D: CO2 emission factors for electricity, EU 1995 average
Country Average electricity (kg CO2 /kWh)
Average electricity from coal (kg CO2/kWh)
Average electricity from gas (kg CO2 /kWh)
AU 0.220 0.784 0.643 BE 0.330 0.742 0.465 DK 0.807 0.837 0.600 FI 0.330 0.793 0.487 FR 0.073 0.784 0.336 GE 0.587 0.918 0.569 GR 0.880 0.937 0.000 IR 0.733 0.764 0.511 IT 0.513 0.631 0.468 LU 0.756 1.067 0.000 NL 0.623 0.657 0.493 PO 0.587 0.795 0.000 SP 0.440 0.876 0.798 SW 0.037 0.935 0.988 UK 0.513 0.815 0.454 EU 0.403 0.793 0.502 Gas conversion factors should be 0.2 kg CO2/kWh for natural gas and 0.23 kg CO2/kWh for LPG.
31
SAVE - EU Water Heating – Task 1 ECI: K. Lane, J. Lipp, May 2001
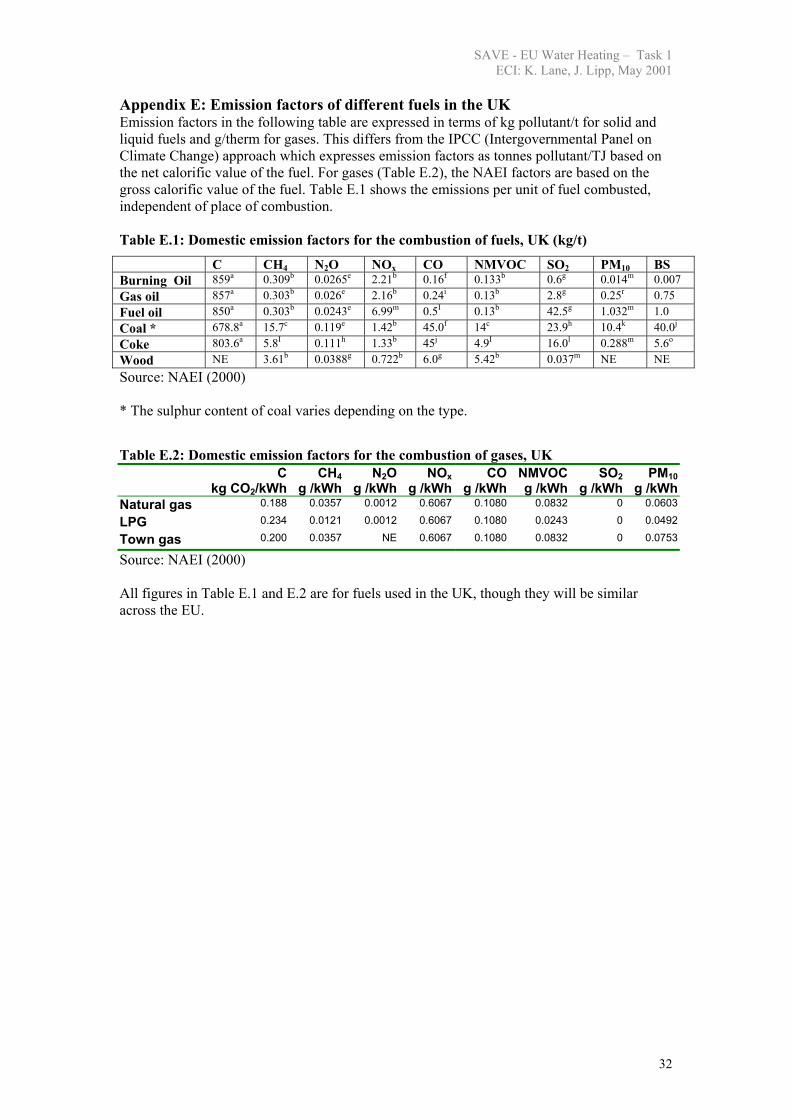
Appendix E: Emission factors of different fuels in the UK Emission factors in the following table are expressed in terms of kg pollutant/t for solid and liquid fuels and g/therm for gases. This differs from the IPCC (Intergovernmental Panel on Climate Change) approach which expresses emission factors as tonnes pollutant/TJ based on the net calorific value of the fuel. For gases (Table E.2), the NAEI factors are based on the gross calorific value of the fuel. Table E.1 shows the emissions per unit of fuel combusted, independent of place of combustion. Table E.1: Domestic emission factors for the combustion of fuels, UK (kg/t)
C CH4 N2O NOx CO NMVOC SO2 PM10 BS Burning Oil 859a 0.309b 0.0265e 2.21b 0.16f 0.133b 0.6g 0.014m 0.007 Gas oil 857a 0.303b 0.026e 2.16b 0.24i 0.13b 2.8g 0.25r 0.75 Fuel oil 850a 0.303b 0.0243e 6.99m 0.5I 0.13b 42.5g 1.032m 1.0 Coal * 678.8a 15.7c 0.119e 1.42b 45.0f 14c 23.9h 10.4k 40.0j Coke 803.6a 5.8I 0.111h 1.33b 45j 4.9I 16.0l 0.288m 5.6o Wood NE 3.61b 0.0388g 0.722b 6.0g 5.42b 0.037m NE NE Source: NAEI (2000) * The sulphur content of coal varies depending on the type. Table E.2: Domestic emission factors for the combustion of gases, UK
C kg CO2/kWh
CH4g /kWh
N2Og /kWh
NOxg /kWh
COg /kWh
NMVOC g /kWh
SO2 g /kWh
PM10g /kWh
Natural gas 0.188 0.0357 0.0012 0.6067 0.1080 0.0832 0 0.0603
LPG 0.234 0.0121 0.0012 0.6067 0.1080 0.0243 0 0.0492
Town gas 0.200 0.0357 NE 0.6067 0.1080 0.0832 0 0.0753
Source: NAEI (2000) All figures in Table E.1 and E.2 are for fuels used in the UK, though they will be similar across the EU.
32