
Study on the evolution of some deforestation drivers and...
114
European Commission Directorate-General for Environment Study on the evolution of some deforestation drivers and their potential impacts on the costs of an avoiding deforestation scheme In the context of the Framework Contract No. DG ENV/G.1/FRA/2006/0073 Specific Contract No. DG.ENV.G.1 VA/11 ARES(2008) 52924 Final Report March 2010 Member of Consortium
Transcript of Study on the evolution of some deforestation drivers and...

European Commission Directorate-General for Environment
Study on the evolution of some deforestation drivers and their potential impacts on the costs of an avoiding deforestation scheme In the context of the Framework Contract No. DG ENV/G.1/FRA/2006/0073
Specific Contract No. DG.ENV.G.1 VA/11 ARES(2008) 52924
Final Report
March 2010 Member of Consortium

2
Authors:
Koen Rademaekers, ECORYS
Lisa Eichler, ECORYS
Johannes Berg, ECORYS
Michael Obersteiner, IIASA
Petr Havlik, IIASA
Contributing authors:
Kentaro Aioki, IIASA
Steffen Fritz, IIASA
Aline Moisner, IIASA
Lillah Lucie Emmik Sørensen, COWI
Koen Overmars, ECORYS
Disclaimer: The views expressed in this study are those of the authors and do not necessarily reflect the views of the European Commission or of its services. This report merely acts as a guideline document for policy makers and does not seek to establish the Commission's future policy inthis area.
ECORYS Nederland BV
P.O. Box 4175
3006 AD Rotterdam
Watermanweg 44
3067 GG Rotterdam
The Netherlands
T +31 (0)10 453 88 00
F +31 (0)10 453 07 68
W www.ecorys.com
Registration no. 24316726
ECORYS Macro & Sector Policies
T +31 (0)31 (0)10 453 87 53
F +31 (0)10 452 36 60

3
Table of Contents
Index of Tables 5
Index of Figures 7
Abbreviations 9
1 Introduction 11 1.1 Context 11 1.2 Reading guide 14
1.2.1 Key definitions 16
2 Drivers of deforestation 19 2.1 Current levels of deforestation and forest degradation 19
2.1.1 Worldwide deforestation figures 19 2.1.2 Regional status of deforestation 20
2.2 Deforestation drivers at global level 22 2.2.1 Direct drivers 22 2.2.2 Indirect drivers 24 2.2.3 Actors 27
2.3 Drivers of deforestation in Africa (Sub-Saharan Africa) 27 2.3.1 Direct drivers 28 2.3.2 Indirect drivers 31 2.3.3 Actors 34
2.4 Deforestation drivers in Latin America (Amazonia) 35 2.4.1 Direct drivers 35 2.4.2 Indirect drivers 40 2.4.3 Actors 43
2.5 Asia and the Pacific (Southeast Asia) 44 2.5.1 Direct drivers 45 2.5.2 Indirect drivers 48 2.5.3 Actors 52
2.6 Realistic future outlook in the three hotspot regions 53 2.6.1 Realistic future outlook for Sub-Saharan Africa 53 2.6.2 Realistic future outlook for Latin America and the Caribbean 54 2.6.3 Realistic future outlook for Pacific Asia 55
3 Scenario development 57 3.1 Understanding the baseline 58 3.2 Identifying various policy shock areas 59

4
3.2.2 Policy shock area 1: change in biofuels demand 62 3.2.3 Policy shock area 2: change in wood demand 66 3.2.4 Policy shock area 3: change in demand for meat 67 3.2.5 Policy shock area 4: dual increases in demand for meat and 1st
generation biofuels 67 3.2.6 Policy shock area 5: infrastructure development 68 3.2.7 Policy shock area 6: improved biodiversity protection 69 3.2.8 Policy shock area 7: governance development and other policy
factors 70 3.3 Short description of the modelling framework 70
4 Modelled changes in deforestation levels and associated marginal costs of avoided deforestation 73 4.1 Deforestation levels under different policy shock scenarios 74
4.1.1 Regional deforestation implications of the policy shock scenarios 76 4.1.2 Associated costs of avoided deforestation under different policy
shock scenarios 79 4.1.3 Alternative analyses with different baselines 83
4.2 Infrastructure development and implications for deforestation based on market accessibility in the Congo Basin 84 4.2.1 Projected infrastructure development implications for deforestation 88
4.3 The role of biodiversity protection in avoided deforestation 90 4.3.1 Comparison of current and projected biodiversity protection levels 91 4.3.2 Comparison of biodiversity scenario effects 94 4.3.3 Conclusions on the role of biodiversity protection in avoiding
deforestation 96 4.4 Congo Basin case study on governance development 98
5 Conclusions and policy recommendations 101 5.1 Future deforestation levels under various policy shock scenarios 101 5.2 Implications for associated costs of avoided deforestation 103 5.3 Identification of policy priorities 104
5.3.1 On a global scale… 105 5.3.2 On a regional level… 106
5.4 Further research steps to improve the estimation of the level of deforestation and the costs of REDD 111 5.4.1 Estimation of the level of deforestation and degradation 111 5.4.2 Estimation of total global REDD costs 111 5.4.3 Limitations associated with assumptions taken for the modelling
exercise 113 5.5 Closing remarks 114
5
Index of Tables
Table 2.1 Highest deforestation rate and highest net annual area change per country globally 20
Table 2.2 Highest deforestation rate and highest annual area change per country for Africa 21
Table 2.3 Highest deforestation rate and highest annual area change per country for Latin America 21
Table 2.4 Highest deforestation rate and highest annual area change per country for Asia 22
Table 2.5 FAO projections for the development of arable land 23 Table 2.6 African wood production output (2006) 31 Table 2.7 Brazilian sugar production and export 37 Table 2.8 Production and consumption trends: wood products in Asia 47 Table 3.1 5 biofuels policy shock scenarios for further analysis 63 Table 3.2 Overview of total production of biofuels in the European Union –
baseline and 5 scenarios 63 Table 3.3 Amounts of co-products per unit of crop feedstock for biofuels
production 65 Table 4.1 Deforested area without REDD between 2020-2030 in Mha and for
various policy shock scenarios 77 Table 4.2 Indexed sequence of scenario policy shock ranking amongst selected
regions 79 Table 4.3 Marginal costs of different RED level under different policy shock
scenarios, in US$/tCo2 80 Table 4.4 Infrastructure implications on deforestation levels and costs of
avoided deforestation in the Congo Basin (marginal costs are expressed in US$ / tCO2) 88
Table 4.5 Summary table of protected area for 2009 and 2030 91 Table 4.6 Avoided deforestation (hectares / year) under increased biodiversity
protection scenario compared to BAU scenario without incentive payment in the Congo Basin 94
Table 5.1 Summary overview of regional policy shock analysis 110


7
Index of Figures
Figure 1.1 General framework for analysis 14 Figure 2.1 International trade of forest products 24 Figure 2.2 Fuelwood consumption in Africa 30 Figure 2.3 Brazilian soybean production from 1994-2008 in million bushels 36 Figure 2.4 World 2008 soybean exports in percent by major exporting countries 37 Figure 2.5 Export shares of Brazilian forest products to the ten major importing
countries in 2006 39 Figure 2.6 International Soybean product price development in US Dollar per
tonne 41 Figure 2.7 Latin America’s export partners in 2008 (in % of total exports) 44 Figure 2.8 Sub-regional breakdown: Asia 45 Figure 2.9 Direct causes of forest area changes in tropical Southeast Asian
countries, 1990-2000 46 Figure 2.10 Gross domestic product development in Asia 49 Figure 2.11 Value added and relative size of forestry sector in Asia and the Pacific
Region 50 Figure 3.1 Overview of scenario building and modelling approach 57 Figure 4.1 Global deforested area without REDD under various policy shock
scenarios between 2020-2030 (Mha) 74 Figure 4.2 Percent change (compared to baseline) of global deforested area
without REDD under various policy shock scenarios between 2020 and 2030 75
Figure 4.3 Impact of policy shock scenarios on deforested area without REDD between 2020-2030 compared to baseline (in % change compared to the baseline) 77
Figure 4.4 Marginal costs of different RED levels under different policy shock scenarios compared to baseline 2020-2030 81
Figure 4.5 Current road network (circa 2000) and location of large cities in the Congo River Basin 85
Figure 4.6 Planned road networks (red lines) and location of large cities in the Congo River Basin 86
Figure 4.7 Current market accessibility (in hours) to the nearest large cities in the Congo River Basin 87
Figure 4.8 Projected market accessibility (in hours) to the nearest large cities in the Congo River Basin 87
Figure 4.9 Annual deforestation (in % of forested area) rate between 2020 and 2030 under baseline vs. with expansion of the road network 89
Figure 4.10 Worldwide protected area for 2009 and additional protected area according to biodiversity scenario for 2030 92

8
Figure 4.11 Congo basin countries: currently protected area by status today (2009); additional protected area according to biodiversity scenario for 2030; and underlying MODIS forest cover (2004) 93
Figure 4.12 Effects of protected area on avoided deforestation (forest cover loss in percent) in the Congo Basin for 2030 95
Figure 4.13 Relationship between carbon price and the estimated effects of avoided deforestation in avoiding extinctions 97
Figure 4.14 Spatial patterns of predicted species extinctions under different avoided deforestation scenarios 98

9
Abbreviations
AiC Action in Context
ASMGHG Agricultural Sector and Mitigation of Greenhouse Gas
AZE Alliance for Zero Extinction
BAU Business As Usual
CER Certified Emission Reductions
COP Conference of the Parties
EC European Commission
EPA United States Environmental Protection Agency
EPIC Environmental Policy Integrated Climate
EU European Union
EU ETS European Union Emissions Trading Scheme
FAO Food and Agriculture Organization of the United Nations
FAOSTAT Statistical Database of the Food and Agriculture Organization of the United
Nations
FLEG Forest Law Enforcement and Governance
FRA Global Forests Resource Assessment
GATT General Agreement on Tariffs and Trade
GDP Gross domestic product
GGI Greenhouse Gas Initiative
GHG Greenhouse Gas
GLOBIOM Global Biomass Optimization Model
G4M Global Forest Model
HRU Homogeneous Response Unit
IAD Institutional Analysis and Development Framework
IFA International Fertilizer Industry Association
IFRPI International Food Policy Research Institute
IIASA International Institute for Applied Systems Analysis
IPCC Intergovernmental Panel on Climate Change
IPTS Institute for Prospective Technology Studies
JRC Joint Research Centre
IUCN International Union for Conservation of Nature
MCPFE Ministerial Conference on the Protection of Forests in Europe
Mha Million hectares
MTOE Million Tonnes Oil Equivalent
NASA National Space Agency
NGO Non-governmental organization
NPP National Protection Plan
PBL Dutch Planbureau voor de Leefomgeving
POLES Prospective Outlook on Long-term Energy Systems
PPP Purchasing power parity

10
RED Reducing emissions from deforestation
REDD Reducing emissions from deforestation and degradation
REDD+ Reducing emissions from deforestation and degradation including conservation,
sustainable forest management and sink enhancement
REDD++ Reducing emissions from deforestation and degradation including conservation,
sustainable forest management and sink enhancement and afforestation
SPWP Secondary Processed Wood Product
ITTO International Tropical Timber Organization
UNCED United Nations Conference on Environment and Development
UNEP United Nations Environment Programme
UNFCCC United Nations Framework Convention on Climate Change
USDA United States Department of Agriculture
WCMC World Conservation Monitoring Centre
WTO World Trade Organization
YSSP Young Scientists Summer Program

11
1 Introduction
This chapter provides a brief description of the context, the purpose and the overall analytical framework of this study.
1.1 Context
Tropical deforestation is considered the second largest source of anthropogenic greenhouse gas emissions (IPCC, 2007) and is expected to remain a major emission source for the foreseeable future (MEA, 2005). Despite policy efforts on reducing deforestation, around 13 million hectares of forests continue to be lost every year (FAO, 2006). The reduction of greenhouse gas emissions from tropical deforestation is now recognised as an essential component of international efforts to mitigate climate change. Soares-Filho et al. (2006), for example, suggest that protecting around 130 million hectares of land from deforestation in the Amazon could reduce global carbon emissions by 17 giga tonnes over the next 50 years. However, accurate assessment of the magnitudes of potential emissions reductions is still hindered by large uncertainties in quantifying contemporary emissions from deforestation. Deforestation can play a role in both global warming and cooling, and it also leads to reductions in biodiversity, disturbed water regulation, and the destruction of the resource base and livelihoods for many of the world’s poorest (Williams, 2003). Reducing deforestation would therefore not only reduce greenhouse gas (GHG) emissions, but would also provide additional benefits to the climate system. This includes preserving the net carbon sink that may be present in old-growth tropical forests, and the evapotranspiration and rain- and-cloud formation function that cools the tropics and maintains rainforest extent. Moreover, tropical forests host over half of all global biodiversity, and their preservation is essential for maintaining the richness of life on Earth. Driving forces of deforestation Deforestation is caused by multiple drivers and pressures, including conversion for agricultural uses, infrastructure development, wood extraction (Geist and Lambin, 2002, Angelsen and Kaimowitz, 1999; Schaeffer et al., 2005; Fearnside, 2006), agricultural product prices, and a complex set of additional institutional and location-specific factors (UNFCCC, 2006), which can be extremely important in certain localities. Most importantly, the specific characteristics and magnitude of (in particular) the socio-economic drivers behind deforestation vary widely across continents, regions and countries.

Final Report 12
Deforestation has a wide range of appearances ranging from selective logging to complete clear-cutting of forests. Box 1.1 provides definitions of deforestation, forest degradation and forest decline.
Box 1.1 FAO definitions: deforestation and forest degradation
Deforestation is the conversion of forest to another land use or the long-term reduction of the tree canopy
cover below the minimum of 10 %.
Forest degradation concerns the changes within the forest class which affect the forest stand, quality or site
negatively. Reduction of the tree canopy above the original threshold of 10 % is classified as forest degradation
Forest decline can be defined as the two processes of deforestation and forest degradation, which have both
common and specific drivers, and which may or may not be spatially and temporally interrelated and will differ
between regions.
Due to these definitions, activities such as logging often fall under the category of forest degradation and are therefore not included in the deforestation statistics provided by the FAO. Therefore, the rates of forest degradation are remarkably higher than deforestation rates. It is of further interest to note that deforestation and forest degradation occur due to different driving forces and that deforestation does not necessarily follow degradation. In reality, the difference between deforestation and forest degradation is blurred and no data available on global scales currently can systematically distinguish between the two. Thus, while this study focuses on exploring deforestation, forest degradation is always closely intertwined. Focus of the study The focus of the study is on deforestation. Despite forest degradation representing a higher overall rate than deforestation, deforestation has a higher socio-economic and environmental impact. Among other impacts, tropical deforestation is considered the second largest source of anthropogenic greenhouse gas emissions (IPCC, 2007) and is expected to remain a major emission source for the foreseeable future. This is the reason for focusing this study on deforestation. Mechanisms for reducing deforestation Tropical deforestation and degradation typically bring concrete socio-economic benefits for some, often accompanied with high societal costs/impacts for others. Impacts of tropical deforestation change over time and space, often with various scale levels involved (i.e. the effects of climate change are global, while the impacts of land use policies are merely local). The impacts are also closely linked to the climate and thus depend on how climate change evolves in the future. At the same time, tropical deforestation itself is also a determinant in climate change scenarios. Alternative policy responses to reduce deforestation and forest degradation will have varying socio-economic impacts in different localities. Policies addressing deforestation and degradation will directly impact on land use choices. This impact will depend on a range of factors, including the characteristics of location-specific societal, environmental and economic factors driving current land use, and on the design of international climate policies addressing the issue.

13
With regard to forest-related issues international climate-policy discussions have previously focused on afforestation1 and forest management. Discussions on new innovative financial mechanisms provide optimism for more effective synergies between deforestation and carbon policies (UNFCCC, 2006; Schulze et al., 2003; Persson and Azar, 2006; Moutinho et al., 2006). In 2005, Papua New Guinea and Costa Rica proposed to the United Nations Framework Convention on Climate Change (UNFCCC) that carbon credits be provided to protect existing native forests (UNFCCC/CD/2005 misc.). The potential for activities to reduce deforestation and degradation in order to help mitigate climate change is widely acknowledged (Soares-Filho et al., 2006; Gullison et al., 2007). As a consequence, official international discussions were initiated at the United Nations Framework Convention on Climate Change (UNFCCC) 11th Conference of the Parties (COP) on the issue of Reducing Emissions from Deforestation and Degradation (REDD) in developing countries (UNFCCC, 2005). At COP-11 the UNFCCC launched a process for investigating the technical issues surrounding the feasibility of reducing GHG emissions from deforestation. At the Bali UNFCCC meetings in December 2007, two processes were agreed upon in the negotiations to advance work on deforestation issues. These include undertaking “a programme of work on methodological issues related to a range of policy approaches and positive incentives that aim to reduce emissions from deforestation and forest degradation in developing countries …” (see Decision – CP.13) and consideration of “policy approaches and positive incentives on issues relating to REDD in developing countries” (see Decision – CP.13 Bali Action Plan). At the end of 2007, the parties to the UNFCCC confirmed their commitment to address the global climate challenge through the Bali Action Plan and the Bali Road Map for an agreement to be completed at the COP to the UNFCCC in Copenhagen at the end of 2009. COP 14 in Poznan marked the half-way point between adoption of the ‘Bali Action Plan’ where the international community agreed to work toward a comprehensive climate agreement by 2009, and COP 15, when this agreement is expected to be adopted. Poznan thus provided the opportunity to draw together the advances made throughout the course of 2008 and move from theoretical discussions toward negotiation mode in 2009. With regards to REDD, discussions focused on methodological issues. The Parties agreed on a decision text that encourages robust national forest monitoring systems, capacity building and use of Intergovernmental Panel on Climate Change (IPCC) Guidelines and Good Practice Guidance. An expert meeting will be held in 2009, and a technical paper will be prepared on the cost of implementing methodologies and monitoring systems. Purpose of the study Within this general context, the purpose of the study is twofold:
� To better understand the linkages between different drivers for land-using competing products (e.g. forests, agriculture, etc.) and their significance taking
1 Afforestation is the process of establishing a forest on land that is not a forest, or has not been a forest for a long time by
planting trees or their seeds. The term may also be applied to the legal conversion of land into the status of royal forest.

Final Report 14
into account a global economic and political environment with higher incomes and productivity, increasing energy prices and increased food demand.
� To estimate the effects of changes in drivers on deforestation levels. � To assess the costs and challenges for reducing deforestation in order to limit
climate change and preserve biodiversity.
1.2 Reading guide
Given the rather complex approach for carrying out this study, the following diagram (Figure 1.1) provides a general overview of how this study is conducted and presented in this report.
Figure 1.1 General framework for analysis
[Source: ECORYS/IIASA]
The following sub-sections further outline the report and explain the connections depicted in the figure above. For a more detailed description of the methodologies used for each step, we refer to Error! Reference source not found.. Detailed analysis of deforestation drivers, their effects and possible evolution The first part of the report (Chapter 2) focuses on presenting current deforestation levels (Section 2.1) as well as a comprehensive analysis of global (Section 2.2) and regional (Sections 2.3, 2.4 and 2.5) deforestation drivers (proximate causes and underlying drivers), their impacts on deforestation levels as well as their possible evolution (Section 2.6). The relationship between the deforestation/forest degradation rate and its direct and indirect drivers (also called proximate causes and underlying causes) is identified. A specified list of drivers for the different regions and a ranking of its drivers considering their contribution to forest decline is provided. This analysis forms the basis of the present study, allowing subsequent steps to be carried out on a solid and up-to-date knowledge base. It should be noted that the driver analysis serves as basic input for the

15
modelling process, but is broader than what will be included in the final scenarios to be used for model runs. Qualitative scenario development The next chapter (Chapter 3) starts out by presenting a global baseline (business as usual projection) to compare any scenarios against. As a next step, qualitative scenarios are constructed on various potential future policy shocks (i.e. changes in drivers) based on the findings of the driver analysis and their most likely futures (Chapter 2). During this exercise, the storylines of seven policy shock areas are developed. These policy shock areas were set up to explore the effects of the following changes in drivers on the level of deforestation (in hectares) as well as on the associated costs of avoided deforestation (in US$). The seven policy shock areas are:
1. The effect of various biofuels policies (e.g. only biodiesel vs. only 2nd generation vs. mixed sources, etc.) on demand for biomass;
2. The effect of increased demand for wood and wood products, particularly in the BRIC2 countries;
3. The effect of increasing demand for meat around the globe; 4. The effect of a dual policy shock of increased meat demand and increased 1st
generation biofuels demand; 5. The effect of worldwide improving infrastructure; 6. The role of increasing schemes protecting biodiversity and ecosystem services
(i.e. would certification schemes have an impact, what would happen if ecosystem services have market value, etc.); and
7. The role of good governance and how it supports sound forest policy. The first four of these policy shock areas (biofuels demand, wood demand, meat demand and the dual policy shock) will be analysed on a global scale. Another two policy shock areas (infrastructure development and biodiversity protection) will be modelled both on a global scale as well as geographic-explicit level for a case study on the Congo basin. Finally, the impact of changing governance will be modelled only in a geographic-explicit manner for the Congo Basin. Scenario modelling on deforestation levels and associated costs of avoided deforestation The outcomes of the scenario runs in the IIASA models (GLOBIOM and G4M) are presented in Chapter 4. This chapter first depicts the results in terms of the future area deforested in million hectares on a global scale (Section 4.1) as well as in the three hotspot regions (Section 4.1.1). As a second angle for analysis results on the impacts of changes in drivers’ features (i.e. an introduced policy shock) on the cost of reducing deforestation are provided (Section 4.1.2). Furthermore, a geographic-explicit case study of the Congo Basin provides further more detailed insights into selected scenarios on infrastructure development, biodiversity protection and governance improvement and their impacts on deforestation in the selected hotspot area (Sections 4.2, 4.3 and 4.4, respectively).
2 BRIC = Brazil, Russia, India and China
Final Report 16
EU options for achieving 2020 and 2030 avoided deforestation targets Chapter 5 provides a synthesis of findings on the various implications of the policy shock scenarios for avoided deforestation. The chapter also offers key conclusions for policy-making.
1.2.1 Key definitions
Important definitions of avoided deforestation measures The following box provides a summary overview of the various avoided deforestation terminologies.
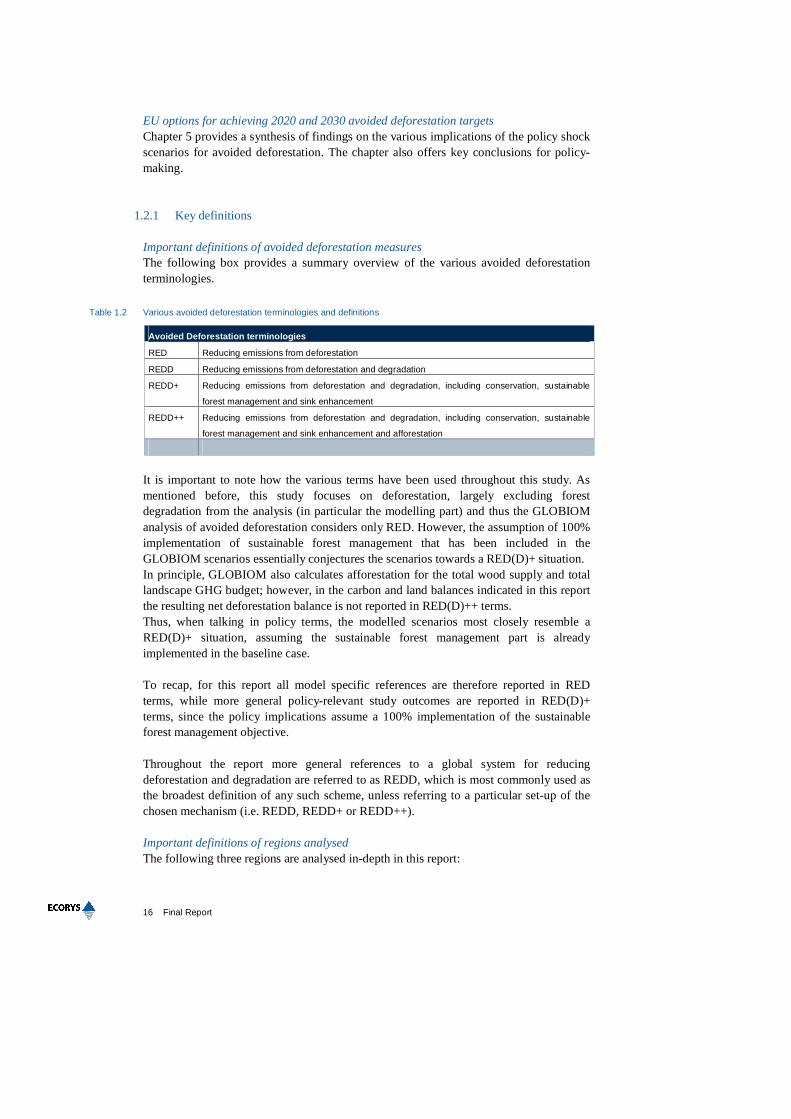
Table 1.2 Various avoided deforestation terminologies and definitions
Avoided Deforestation terminologies
RED Reducing emissions from deforestation
REDD Reducing emissions from deforestation and degradation
REDD+ Reducing emissions from deforestation and degradation, including conservation, sustainable
forest management and sink enhancement
REDD++ Reducing emissions from deforestation and degradation, including conservation, sustainable
forest management and sink enhancement and afforestation
It is important to note how the various terms have been used throughout this study. As mentioned before, this study focuses on deforestation, largely excluding forest degradation from the analysis (in particular the modelling part) and thus the GLOBIOM analysis of avoided deforestation considers only RED. However, the assumption of 100% implementation of sustainable forest management that has been included in the GLOBIOM scenarios essentially conjectures the scenarios towards a RED(D)+ situation. In principle, GLOBIOM also calculates afforestation for the total wood supply and total landscape GHG budget; however, in the carbon and land balances indicated in this report the resulting net deforestation balance is not reported in RED(D)++ terms. Thus, when talking in policy terms, the modelled scenarios most closely resemble a RED(D)+ situation, assuming the sustainable forest management part is already implemented in the baseline case. To recap, for this report all model specific references are therefore reported in RED terms, while more general policy-relevant study outcomes are reported in RED(D)+ terms, since the policy implications assume a 100% implementation of the sustainable forest management objective. Throughout the report more general references to a global system for reducing deforestation and degradation are referred to as REDD, which is most commonly used as the broadest definition of any such scheme, unless referring to a particular set-up of the chosen mechanism (i.e. REDD, REDD+ or REDD++). Important definitions of regions analysed The following three regions are analysed in-depth in this report:

17
Sub-Saharan Africa: Angola, Benin, Botswana, Burkina Faso, Burundi, Cameroon, Cape Verde, Central African Republic, Chad, Comoros, Democratic Republic of Congo, Congo Republic, Cote d’Ivoire, Djibouti, Equatorial Guinea, Eritrea, Ethiopia, Gabon, Gambia, Ghana, Guinea, Guinea Bissau, Kenya, Lesotho, Liberia, Madagascar, Malawi, Mali, Martinique, Mauritania, Mozambique, Namibia, Niger, Nigeria, Rwanda, Sao Tomé and Principe, Senegal, Seychelles, Sierra Leone, Somalia, South Africa, Sudan, Swaziland, Tanzania, Togo, Uganda, Zambia, Zimbabwe. Southeast Asia:
� South Asia: Afghanistan, Bangladesh, Bhutan, India, Maldives, Nepal, Pakistan, Sri Lanka AND
� Pacific Asia: Brunei Durasallam, Fiji Islands, Indonesia, Kiribati, Republic of Korea, Malaysia, Myanmar, Papua New Guinea, Philippines, Samoa, Singapore, Solomon Islands, Thailand, Tonga, Vanuatu.
Latin America and the Caribbean: Argentina, Bahamas, Barbados, Belize, Bermuda, Bolivia, Brazil, Chile, Colombia, Costa Rica, Cuba, Dominica, Dominican Republic, Ecuador, El Salvador, Grenada, Guatemala, Guyana, Haiti, Honduras, Jamaica, Mexico, Netherlands Antilles, Nicaragua, Panama, Paraguay, Peru, St. Lucia, St. Vincent, Suriname, Trinidad and Tobago, Uruguay, Venezuela. While the driver analysis in Chapter 2 sometimes refers to broader regions or singles out specific countries, the modelling exercise focuses on results for three regions (and their countries) only: Sub-Saharan Africa, Pacific Asia, and Latin America and the Caribbean. This focus has been chosen due to the fact that these three regions represent worldwide deforestation hotspots.


19
2 Drivers of deforestation
After a brief introduction on the current levels of deforestation and forest degradation, this chapter provides an overview of direct and indirect drivers of deforestation on a global as well as on regional levels.
2.1 Current levels of deforestation and forest degradation
Many different datasets concerning the most recent rates of deforestation and forest degradation exist. The data3 on deforestation for this report are taken from the Global Forest Resources Assessment 2005 (FAO, 2006). The study has stated that the total forest area has decreased but that the rate of deforestation has slowed down due to increased plantation and landscape restoration.
2.1.1 Worldwide deforestation figures
Worldwide deforestation figures confirm the continued trend in net forest decline. The overall net loss4 in the period 2000-2005 was about 7.3 million hectares forest area per year (or 0.18% of forest cover which equals 2.2 times the size of Belgium) versus a net loss of 8.9 million hectares (or 0.22% of forest cover) per year in the period from 1990 to 2000. It is important to differentiate between the highest deforestation rate (in %) and the highest overall annual net losses of forest (in hectares). The table below presents the ten countries with the largest annual net negative change rate and the largest net loss in forest area for the period from 2000 to 2005 (FAO, 2006).
3 This report uses primarily FAO methodology, data and estimations. It should be noted that FAO data has not been verified and
therefore there might be errors in the estimations of emission levels and/or of their trends. Thus, analytic work presented in
this study is conditional on the validity of FAO data and forecasts. 4 Net loss is the difference between the worldwide deforested area (which was approximately 13 million hectares annual in the
period 1990-2005) and the parallel worldwide forest growth

Final Report 20
Table 2.1 Highest deforestation rate and highest net annual area change per country globally
Deforestation rate 2000-2005 Annual net loss 2000-2005
Country
Annual change rate in % (in
1000 ha/year) Country
Annual change in 1000 ha/year (in
% negative change)
Comoros -7.4% (-1) Brazil -3,103 (-0.6%)
Burundi -5.2% (-9) Indonesia -1,871 (-2.0%)
Togo -4.5% (-20) Sudan -589 (-0.8%)
Mauritania -3.4% (-10) Myanmar -466 (-1.4%)
Nigeria -3.3% (-410) Zambia -445 (-1.0%)
Afghanistan -3.1% (-30) Tanzania -412 (-1.1%)
Honduras -3.1% (-156) Nigeria -410 (-3.3%)
Benin -2.5% (-65) DR Congo -319 (-0.2%)
Uganda -2.2% (-86) Zimbabwe -313 (-1.7%)
Philippines -2.1% (-157) Venezuela -288 (-0.6%)
World -0.18% (-7,317) World -7,317 (-0.18%) [Source: Global Forest Resources Assessment 2005 (FAO, 2006)]
2.1.2 Regional status of deforestation
Given the fact that some regions are endowed with greater and more biologically-diverse forest ecosystems than others, it is important to take a closer look at these global figures (broken down into regional trends). Deforestation is most prominent in tropical regions such as Africa Latin America and parts of Asia. Net deforestation is not very high in Asia, but this is due to increase in plantation, mainly in China. In Indonesia and Myanmar, Cambodia, Philippines and Malaysia deforestation rates are high. Africa Africa accounted for a net loss of 4.0 million hectares per year (which equals about the size of Belgium and is equivalent to 0.3% of the entire African forest cover) and an average annual negative change rate of -0.62% from 2000 to 2005. The table below presents the five African countries with the largest annual net negative change rate and the largest net loss in forest area for the period from 2000 to 2005.

21
Table 2.2 Highest deforestation rate and highest annual area change per country for Africa
Deforestation rate 2000-2005 Annual net loss 2000-2005
Country
Annual change rate in % (in 1000
ha/year) Country
Annual change in 1 000 ha/year
(in % negative change)
Burundi -5.2% (-9) Sudan -589 (-0.8%)
Togo -4.5% (-20) Zambia -445 (-1.0%)
Mauritania -3.4% (-10) Tanzania -412 (-1.1%)
Nigeria -3.3% (-410 Nigeria -410 (-3.3%)
Benin -2.5% (-65) DR Congo -319 (-0.2%) [Source: Global Forest Resources Assessment 2005 (FAO, 2006)]
Africa suffered the second largest net loss in forests per annum with Burundi having the second largest deforestation rate in the world, followed by Togo and Mauritania. As far as annual net loss is concerned, hotspots include Sudan, Zambia, Tanzania, Nigeria and DR Congo. Latin America Latin America accounted for the largest loss of forest losing 4.3 million hectares per annum (which equals about 1.3 times the size of Belgium and is equivalent to 0.5% of the entire Latin American and Caribbean forest cover) and an average annual negative change rate of approx. -0.5% from 2000-2005. The table below presents the five Latin American countries with the largest annual net negative change rate and the largest net loss in forest area for the period from 2000 to 2005.
Table 2.3 Highest deforestation rate and highest annual area change per country for Latin America
Deforestation rate 2000-2005 Annual net loss 2000-2005
Country
Annual negative change rate in
% (in 1000 ha/year) Country
Annual change in 1000 ha/year (in
% net negative change)
Honduras -3.0% (-156) Brazil -3,103 (-0.6%)
El Salvador -1.7% (-5) Venezuela -288 (-0.6%)
Ecuador -1.7% (-198) Bolivia -270 (-0.5%)
Guatemala -1.3% (-54) Mexico -260 (-0.4%)
Nicaragua -1.3% (-70) Ecuador -198 (-1.7%) [Source: Global Forest Resources Assessment 2005 (FAO, 2006)]
Brazil, where 60% of Amazon rainforests are located, accounted by far for the largest annual net losses, followed by Venezuela, Bolivia, Mexico and Ecuador. Regions with high annual net negative change deforestation rates in between the years 2000 and 2005 include Honduras, El Salvador, Ecuador, Guatemala and Nicaragua. For comparative reasons Brazil only faced an annual net negative deforestation rate of -0.6%. Southeast Asia Southeast Asia reported a net gain of approximately 1.0 million hectares per year (which equals about the 30% of the size of Belgium and is equivalent to 0.4% of the entire Southeast Asian forest cover), due to large-scale afforestation projects in China, and an

Final Report 22
average annual positive change rate of 0.18% in the mentioned period of time. The table below presents the five Southeast Asian countries with the largest annual net negative change rate and the largest net loss in forest area for the period from 2000 to 2005.
Table 2.4 Highest deforestation rate and highest annual area change per country for Asia
Deforestation rate 2000-2005 Annual net loss 2000-2005
Country
Annual net negative change
rate in % (in 1000 ha/year) Country
Annual change in 1000 ha/year (in %
net negative change)
Philippines -2.1% (-157) Indonesia -1,871 (-2.0%)
Pakistan -2.1% (-43) Myanmar -466 (-1.4%)
Indonesia -2.0% (-1,871) Cambodia -219 (-2.0%)
Cambodia -2.0% (-219) Philippines -157 (-2.1%)
Sri Lanka -1.5% (-30) Malaysia -140 (-0.7%) [Source: Global Forest Resources Assessment 2005 (FAO, 2006)]
The Philippines and Pakistan have the highest deforestation rates, followed by Indonesia, Cambodia and Sri Lanka. The annual net loss in Indonesia has been remarkably large. Further, countries with high deforestation rates have been Myanmar, Cambodia, Philippines and Malaysia.
2.2 Deforestation drivers at global level
This section presents direct and indirect global drivers of deforestation and their relative importance.
2.2.1 Direct drivers
Direct drivers of deforestation are those causes directly leading to forest decline. For example, ‘excessive logging’ or ‘forest conversion into agricultural land’ directly imply a reduction of forests. Scientists today agree that agricultural expansion is the most important direct driver of land use change globally, followed by infrastructure development and wood extraction.5 Agricultural expansion The table below shows projections of the development of arable land in developing countries for 2015 and 2030: the total area of arable land will increase in all regions over the coming years. This can partially be attributed to rising demands of food production. Another indirect driver connected to agricultural expansion in recent years has been the production of biofuels. A large part of this agricultural expansion will be at the expense of currently forested areas. 5 These three direct drivers are mentioned in 96%, 72%, and 67 % of the studies investigating causes of deforestation in a
meta-analysis of Geist and Lambin (2002).

23
Table 2.5 FAO projections for the development of arable land
Arable land (million ha)
Total Rainfed Irrigated
Developing countries
1997-99 956 754 202
2015 1,017 796 221
2030 1,076 834 242
Sub-Saharan Africa
1997-99 228 223 5.3
2015 262 256 6.0
2030 288 281 6.8
Latin America and Caribbean
1997-99 203 185 18
2015 223 203 20
2030 244 222 22
South Asia
1997-99 207 126 81
2015 210 123 87
2030 216 121 95
East Asia
1997-99 232 161 71
2015 233 155 78
2030 237 151 85
[FAO (2002). World agriculture: towards 2015/2030 Summary report]
Infrastructure development Countries aiming to meet the pace of the globalization have to ensure that the basis for reaching that aim is set with an effective and efficient infrastructure. In order to gain an advantage of location in competition with other nations, countries will strive to extend, improve and modernize their countries infrastructure. Especially developing countries with a comparably weak infrastructure are forced to upgrade their infrastructure in order to attract foreign direct investments. Infrastructural developments are foreseen to have positive and negative effects with regard to deforestation. As countries modernize and improve the efficiency and effectiveness of their infrastructure, less areas may need to be deforested as the demand for infrastructure could potentially be satisfied without new roads, railroads etc. Developing countries, however, as surfaced above, may rather have to extend their current infrastructure instead of modernizing it. Such an extension is likely to have negative effects on deforestation. On the one hand, forests will be cut and replaced by roads and railroads. In addition, previously more remote patches of forest may become more vulnerable to logging due to expanded road infrastructure.

Final Report 24
Wood extraction and forest products The international trade of forest products (1983-2005), is presented in Figure 2.1. Over the 1983 to 2005 period, the total value of forest products traded in the international market increased from around US$60 billion to US$257 billion, an average annual growth rate of 6.6%. The fast growth was mostly a result of the developments in the international trade of Secondary Processed Wood Products (SPWP) (an average increase of above 8% per year), particularly wooden furniture.6 It is important to realise that international trade represents only 3.5% of the total global roundwood production: domestic consumption of fuel wood is not included in these figures; and thus, do not show in these international trade figures. Nevertheless, the international trade figures do provide a general impression of the increasing global demand for wood and wood products.
Figure 2.1 International trade of forest products
[Source: Advisory Committee on paper and wood products: GLOBAL WOOD AND WOOD PRODUCTS FLOW TRENDS AND
PERSPECTIVES: http://www.fao.org/forestry/media/12711/1/0/]
2.2.2 Indirect drivers
Next to the direct drivers of deforestation, one can also observe more indirectly related global drivers affecting the pressure levels on the direct drivers. The indirect drivers of deforestation are a complex interplay of many economic, institutional/governance, technological and demographic/cultural factors.7 In the further analysis of deforestation drivers throughout this report, one will find that there is rarely a single direct or indirect driver responsible for deforestation; most often, multiple processes work simultaneously or sequentially causing deforestation. The main broad categories of global indirect deforestation drivers are:
� Economic growth and associated pressures on natural resources: global GDP increased from about US$ 16 trillion in 1970 to US$47 trillion in 2005 and is
6 Advisory Committee on paper and wood products: GLOBAL WOOD AND WOOD PRODUCTS FLOW TRENDS AND
PERSPECTIVES: http://www.fao.org/forestry/media/12711/1/0/ 7 These have been mentioned 81%, 78%, 70%, 66% and 61% in deforestation studies, respectively) (Geist and Lambin, 2002).

25
projected to grow to almost US$ 100 trillion by 2030, assuming constant prices. As a result, increased pressures regarding trade-offs between different land uses arise. Policies as well as economic considerations on the profitability of various land uses play an important indirect role in increasing or relieving pressure on deforestation. More precisely, the following drivers play a role in deforestation:
o International trade and shifting regional balance: developed economies accounted for most of the GDP in the period 1970-2005. The rapid growth of developing and transition economies, especially in Asia, will swing the balance significantly in the next 25 years.
o Mining for minerals: Globally, market growth of minerals accounted for 15% of all the cases of global deforestation (Geist and Lambin, 2002). As worldwide demand for minerals rises, mining areas – often located in remote, forested areas are further exploited, contributing to forest degradation and complete deforestation depending on the size of the mining operation as well as the type of mining carried out.
� The influence of worldwide policy-making/governance and technological innovation can influence deforestation in both positive and negative ways:
o Alternative energy policies: the use of biomass and biofuels is increasingly encouraged by many governments around the world and needs to be assessed as a driver of deforestation.
o Similarly, land use policies and planning can act as indirect drivers of deforestation if environmental concerns are not accounted for.
� Demographic changes and associated pressures on natural resources: the world’s population is projected to increase from 6.4 billion in 2005 to 7.5 billion in 2020 to 8.2 billion in 2030. As a consequence, food demand will increase significantly, as will the pressures on land to accommodate the housing, transportation and other needs of this growing population.
Economic growth (GDP) and associated pressures on deforestation One factor, which will nourish the demand for forest and agricultural products further is the development of global GDP. Besides the current financial and economic crisis, global GDP is expected to increase in the future. With a higher global GDP and increasing GDPs in particular regions and countries, the demand for forest (both in terms of products and space) and especially agricultural products will further increase. As a consequence, this increasing demand is likely to trigger further deforestation.8 Additional global indirect drivers of deforestation are negotiations and agreements by the World Trade Organization (WTO) to enhance global trade, establish free trade agreements and reduce trade barriers. A variety of these aspects can be seen as indirect drivers of deforestation whereas further liberalisation of international trade is expected to have very different impacts in different regions. Many elements of WTO agreements , among them the core agreement on the General Agreement on Tariffs and Trade (GATT), negatively affect the environment and limit the rights of individuals and governments to implement and maintain environmental standards and rules. While the developed world is largely in favour of trade measures which protect the environment, many countries in the
8 A very detailed description on the global GDP development forecasts is provided in Chapter 3 as this aspect also plays an
important role in the development of the baseline and the scenario storylines.

Final Report 26
developing world rely to great extent on the cultivation of rainforest areas in order to nourish economic growth through export and therefore fear environmental policies within the WTO. In order to address rising concerns of intensified deforestation due to trade liberalisation, the WTO has put forward actions on eco-labelling which support the certification of sustainably harvested timber and non-timber forest products. Such certification actions also aim at improving market access for sustainably harvested products and providing an incentive for their production. Governance and policy-making The role of local governance and institutions play in setting the policies and legislation to protect and/or sustainably manage forests can be considered a potential indirect driver of deforestation. If a country is facing a low capacity for good governance and the enforcement of policies and laws, it may be more prone to deforestation activities, such as illegal logging, unsustainable forest management, etc. At the same time, international policy-making can indirectly influence deforestation patterns. A most recent example are alternative energy policies (biomass, biofuels, etc.). Deforestation in the low- to middle income forest-rich regions (Africa, Latin America and the Caribbean, Southeast Asia) might be driven – in part - by European and US biomass/biofuels legislation and the corresponding increase in demand for raw materials.9 Several driving forces help explain the recent worldwide bioenergy promotion. Energy from biomass and biofuels in particular has attracted the interest of many in politics and industry in recent years with the goal of increasing the share of renewable energy sources, combating climate change and meeting the Kyoto Protocol targets. The EU and the United States have introduced policies promoting biomass and biofuels production and use. One of the main driving forces behind the promotion of biofuels was the idea to lower greenhouse gas emissions in the atmosphere. The objective being that the amount of CO2 emitted through the production and combustion of biofuels should not greatly exceed that which the plants used for biomass and biofuels would have absorbed throughout their growth and the photosynthesis. Besides this promise of improving the carbon balance, at least for energy used in transportation, the large-scale production of biofuels and biomass energy could also reduce energy dependency on fossil fuels. Further, bioenergy offers large new markets for agricultural producers that could stimulate rural growth and farm incomes. While the development of bioenergy can represent a broad range of opportunities, it also involves many trade-offs for the sustainable use of natural resources and for sustainable agriculture and rural development at local, national and global scales. Concerns about environmental and social effects of direct and indirect land use changes due to bioenergy production have recently been expressed by a variety of experts. Potential environmental impacts not only concern biodiversity conservation, water quality, and other natural
9 Additional supporting information on bioenergy legislation in the EU and the US as well as detailed trends in bioenergy
production worldwide can be found in Annex section Error! Reference source not found..

27
resources, but discussions have now started to question whether biofuels negatively influence the total greenhouse gas balance throughout their life cycle. Demographic changes (population growth) Similar to the issue of GDP development is the aspect of global population. The globe has experienced a rapid population growth throughout the last century. According to the US Census Bureau the world population increased from 3 billion in 1959 to 6 billion by 1999, a doubling that occurred over 40 years. Population projections imply that the global population will continue to grow throughout the first half of the 21st century, although at lower growth rates than seen throughout the second half of 20th century. A growing global population consequentially implies a growing demand for agricultural products and forest products (food/building/energy).10
2.2.3 Actors
On a global scale it can be said that various levels of actors are involved in driving deforestation. The primary actors are the people directly carrying out logging activities. This group includes, for example, small-scale local farmers using deforestation as a means to gain new land for subsistence farming. Other primary actors on a larger national or international scale include industrial farmers, wood and timber companies, etc. which carry out deforestation either to gain more land for alternative use purposes or to profit from the timber. Secondary and tertiary actors are those indirectly involved in deforestation. They include decision-makers, as well as national and international companies taking decisions on issues that present indirect pressures on deforestation, such as for example infrastructure development. The following three sections present direct and indirect drivers of deforestation as well as the key actors involved in Africa, Latin America as well as Southeast Asia and will refer to country-specific aspects whenever relevant.
2.3 Drivers of deforestation in Africa (Sub-Saharan Africa)
This section provides insight on deforestation drivers across the African continent. Although the section focuses on no country in particular, it is important to bear in mind that the drivers discovered for Africa help frame the geographic-explicit case study of the Congo Basin in Chapter 4. Africa’s 635 million hectares of forests account for 21.4% of its land area (= 16 %of the global forest area). In total, some 23 million hectares of this forest disappeared in the 1980s while another 20 million hectares gave way for other land uses in the 1990s.
10 As with the above issue of global GDP development, a very detailed description on the global population development
forecasts is provided in Chapter 3 as this aspect also plays an important role in the development of the baseline and the scenario storylines.

Final Report 28
Recent estimations show that another 4 million hectares of forest were deforested between 2000 and 2005, which is equivalent to one-third of the total deforested area on a global level. The current deforestation rate is estimated at about 0.4 to 0.7% per year and is likely to continue at this level.11 Many uncertainties exist regarding these estimations and figures could easily be understated (FAO, 2009). Overall, progress towards sustainable forest management in Africa appears to have been limited during the last fifteen years. Yet, there are some indications that net loss of forest area has slowed down and that the areas of forest designated for conservation of biological diversity has increased slightly. However, it is a fact that the permanent, rapid loss of forest area occurring in Africa is representing the highest percentage of any region during the 1980s, 1990s and early 2000s (FAO, 2006).
2.3.1 Direct drivers
The direct drivers of deforestation in Africa reflect the global pattern with agricultural expansion as the main driver of deforestation (FAO, 2009). Direct conversion of forest area into small-scale permanent agriculture accounts for approximately 60% of the total deforestation whereas direct conversion of forest area into large-scale permanent agriculture accounts for another 10% (FAO, 2002). However, also wood extraction and infrastructure development play a significant role in deforestation across Africa (Geist and Lambin 2002). The main direct drivers of deforestation in Africa (ranked based on relative importance) are thus:12
1. Small-scale permanent agriculture (deforestation); 2. Large-scale permanent agriculture (deforestation); 3. Fuel wood consumption (degradation); 4. Commercial logging and timber production (degradation); 5. Illegal logging (degradation); and 6. Infrastructure development (deforestation).
Small-scale agriculture Small-scale agriculture is vital for livelihoods in Africa accounting for 70 % of rural employment in 2005. The performance and productivity of African agriculture (both the subsistence sector and the commercial sector) calculated per capita has been categorised as very low in comparison with other regions (FAO, 2009). This is among others due to soil fertility as a major constraint on productivity13, but differences of productivity level exist between large-scale agriculture and small-scale agriculture. An analysis conducted by the World Bank explores the causes of productivity differences by farm size, which shows that yields per hectare are higher on large farms compared to small-scale farms,
11 The focus of the study is on deforestation, technically defined by the Food and Agriculture Organization of the United Nations
(FAO) as “the reduction of tree canopy to less than 10% crown cover”, rather than forest degradation, defined as a reduction in tree-canopy cover (but not below 10%). Despite forest degradation representing a higher overall rate than deforestation, deforestation has a higher socio-economic and environmental impact. Among other impacts, tropical deforestation is considered the second largest source of anthropogenic greenhouse gas emissions (IPCC, 2007) and is
expected to remain a major emission source for the foreseeable future. This is the reason for focusing this study on deforestation.
12 FAO, 2009; Geist and Lambin 2002 13 Interview with Derek Byerlee, co-director author of the report World Development Report 2008: Agriculture for Development.
Retrieved from World Bank homepage the 3rd of November: http://discuss.worldbank.org/content/interview/detail/5184/

29
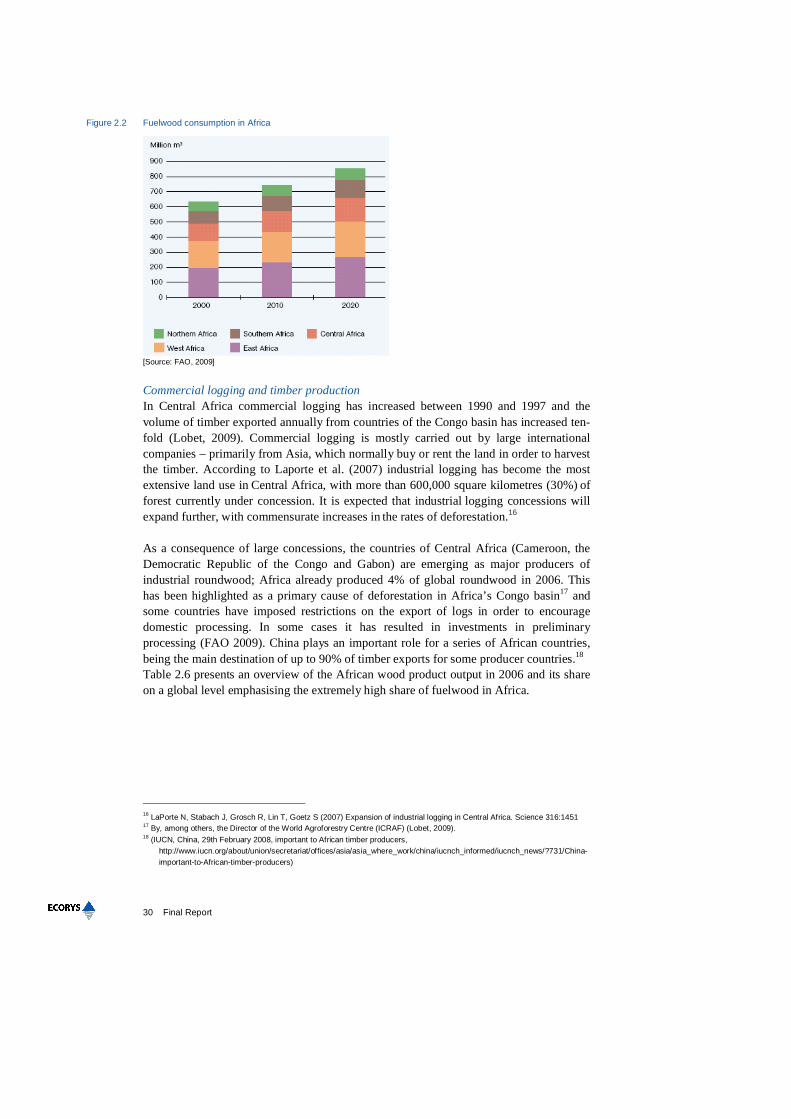
because of more intensive use of modern inputs as well as greater labour productivity14. This decline in productivity and subsequent decline in income has increased dependence on off-farm employment, including collection of fuel wood and production of charcoal (FAO, 2009). Studies point out that Africa is the only region in the world where the regional average of food production per person has been declining over the past 40 years, enhancing the demand for new agricultural land (FAO, 2002; African Development Bank, 2003). Large-scale permanent agriculture Deforestation for large-scale permanent agriculture is, unlike small-scale agriculture, often practised using slash-and-burn techniques. Thousands of hectares of land have been deforested this way. The converted land supports agricultural growth and delivers large harvests for 3-4 years, but then excessive use of fertilisers is necessary to yield a minimum harvest and additional land is needed for agricultural purposes. The extension of permanently cropped land in Africa is mainly aimed at subsistence farming to meet the needs of a growing population15; a substantial part of the deforestation for large scale-agricultural purposes, on the other hand, is carried out via foreign investment, as for example is the case of biofuels (Geist and Lambin, 2002). During recent years, global interest in biofuels as a result of rising fossil fuel prices has increased the extension of land for biofuels production on the African continent, for example through the planting of Jatropha species. Biofuels production is thereby representing an emerging driver for deforestation in Africa. Uncertainties exist whether investments in biofuels development will have long-term impacts on food security and a long-term solution for Africa’s energy problems (FAO 2009). Fuel wood consumption Wood extraction for domestic fuel wood or charcoal production remains a major issue in Africa, because most Africans still use wood and charcoal for cooking, since there are no other affordable energy sources available. Only 7.5% of the rural population currently has access to electricity (FAO 2009). Africa has shown a steady increase in wood removals in recent years, reporting a rise from 49,900 hectares annually (1990) to 66,100 hectares (2005). The increase of collection of fuel wood is also due to a decline in productivity and subsequent decline in income, which imply a greater dependence on off-farm employment, such as collection of fuel wood and production of charcoal increase (FAO, 2009). It is estimated that the majority of the removed wood is used as fuel wood, but since most of the fuel wood collection activities are not usually recorded, the actual quantity of wood removals might be understated (FAO, 2006). As seen from the Figure 2.2 below, fuel wood is estimated to continue to represent an important energy source for the coming decades. Forecasts made by the FAO show a 34% increase in fuel wood consumption from 2000 to 2020.
14 World Bank, Small-holder and large-scale in Africa: Are there tradeoffs between growth and equity? First printed 1989. The
study is focusing on Kenya and Malawi 15 Maize, millet, rice, sorghum, wheat, barley, beans, root and tuber crops are among the major crops cultivated in Africa, though
representing variations in the different regions (FAO 18th July 2008, Crop prospects and food situation for 2008 / 2009, http://appablog.wordpress.com/2008/07/18/fao-africa-crop-prospects-and-food-situation-for-2008-2009/)).
Final Report 30
Figure 2.2 Fuelwood consumption in Africa
[Source: FAO, 2009]
Commercial logging and timber production In Central Africa commercial logging has increased between 1990 and 1997 and the volume of timber exported annually from countries of the Congo basin has increased ten-fold (Lobet, 2009). Commercial logging is mostly carried out by large international companies – primarily from Asia, which normally buy or rent the land in order to harvest the timber. According to Laporte et al. (2007) industrial logging has become the most extensive land use in Central Africa, with more than 600,000 square kilometres (30%) of forest currently under concession. It is expected that industrial logging concessions will expand further, with commensurate increases in the rates of deforestation.16 As a consequence of large concessions, the countries of Central Africa (Cameroon, the Democratic Republic of the Congo and Gabon) are emerging as major producers of industrial roundwood; Africa already produced 4% of global roundwood in 2006. This has been highlighted as a primary cause of deforestation in Africa’s Congo basin17 and some countries have imposed restrictions on the export of logs in order to encourage domestic processing. In some cases it has resulted in investments in preliminary processing (FAO 2009). China plays an important role for a series of African countries, being the main destination of up to 90% of timber exports for some producer countries.18 Table 2.6 presents an overview of the African wood product output in 2006 and its share on a global level emphasising the extremely high share of fuelwood in Africa.
16 LaPorte N, Stabach J, Grosch R, Lin T, Goetz S (2007) Expansion of industrial logging in Central Africa. Science 316:1451 17 By, among others, the Director of the World Agroforestry Centre (ICRAF) (Lobet, 2009). 18 (IUCN, China, 29th February 2008, important to African timber producers,
http://www.iucn.org/about/union/secretariat/offices/asia/asia_where_work/china/iucnch_informed/iucnch_news/?731/China-important-to-African-timber-producers)

31
Table 2.6 African wood production output (2006)
Product Global Africa Share (%)
Industrial roundwood (million cubic metres) 1,635 69 4
Sawnwood (million cubic metres) 424 8.3 2
Wood-based panels (million cubic metres) 262 2.5 1
Pulp and paper (million tonnes) 195 3.9 2
Paper and paperboard (million tonnes) 364 2.9 1
Woodfuel (million cubic metres) 1,871 589 46
[FAO, 2008]
Illegal logging The exact amount of forests illegally cut down is subject to uncertainty due to the illegal nature of these activities. Annual losses in revenues and assets due to illegal logging on public lands worldwide are estimated to about $10 – 18 billion. In Cameroon, losses are estimated at $5.3 million; in Congo Brazzaville it is $4.2 million; in Gabon $10.1 million; and in Ghana losses reach $37.5 million per year. This revenue is being lost every year due to poor regulation of timber production.19 Illegal logging is usually associated with forest degradation, which is difficult to detect and delineate with current remote sensing techniques. Thus, reliable figures on the area affected by illegal logging are rarely available. Infrastructure Commercial logging and timber production in Africa carried out by large international companies is closely connected to the development of infrastructure. These companies are also responsible for creating new roads in the areas they operate in. Though transport extension was not directly aimed at promoting human settlement, road construction creates easy access for settlers, who colonise the areas around the newly implemented roads right after the logging is finished. In the republic of Congo the rate of road construction has increased from 156 km per year during the 1976 to1990 period to 660 km per year after 2000. In the Democratic Republic of Congo rates of logging for road construction increased from 336 km per year during the 1986 to1990 period to 456 km per year in 2000-2002 (Laporte et al. 2007). The relative significance of infrastructure development as a direct driver of deforestation in the Congo basin will be explored in more detail in Section 4.2.
2.3.2 Indirect drivers
The indirect drivers of deforestation vary from country to country and even within a country and are often complex in nature. Due to Africa’s diverse set of cultures, traditions, languages and political systems, a tendency is seen that in the majority of
19 (World Bank, 2003, Combating Illegal Logging in Africa, retrieved from
http://web.worldbank.org/WBSITE/EXTERNAL/NEWS/0,,contentMDK:20138130~menuPK:34457~pagePK:34370~piPK:34424~theSitePK:4607,00.html, 28th May 2009)

Final Report 32
cases, deforestation is driven by the full interplay of institutional, demographic, economic, technological, and cultural variables rather than by single-factor causation. For Africa the following indirect drivers are most often mentioned in deforestation studies (in order of importance): demographic, economic, technological, governance and socio-cultural (Geist and Lambin 2002). Furthermore, worldwide bioenergy policies and demand also play an indirect role in deforestation. Demographic drivers The underlying demographic drivers in Africa are mainly population growth and population density; both of which are closely interrelated with a range of direct and indirect drivers, including the increased demand for agricultural land, pressures on fuel wood, new settlements stimulated by easier access due to infrastructure development, land tenure arrangements, agro-technological change and increased demand for forest products. Population growth: Africa’s population grew from 472 million in 1980 to approximately one billion in 2009 and is expected to rise to 1.2 billion by 2020 (FAO, 2009). There are considerable variations in population size among countries, and these affect forests and forestry in a number of ways. For example, Nigeria, with a population of more than 127 million people, is the most populous country in Africa (African Development Bank, 2003) and has the world’s highest deforestation rate of primary forests. Logging, subsistence agriculture, and the collection of fuelwood are cited as the key direct causes of deforestation between 2000 and 2005; during this period the country lost more than half of its primary forests. In this case the demographic situation is regarded a leading indirect cause for the high deforestation rate (FAO, 2006). This also illustrates the above mentioned interrelation between multiple direct and indirect causes. Economic drivers The key economic driver affecting deforestation in Africa is overall market growth (in particular for forest products) and the associated intensified pressures on natural resources. Since 2000 much of Africa’s economic growth has been driven by exports of primary commodities, primarily to the emerging Asian economies. A tendency that is likely to continue (FAO 2009). Market growth is an indirect driver that is affecting forests in Africa mainly due to commercial logging and timber production. The market demand for forest resources is dominating because of intensified commercialisation of the wood market. The interrelation between the market variation and deforestation rates is exemplified through cocoa production in Ghana. With a 2% annual deforestation rate, Ghana has one of the highest deforestation rates in Africa. Large patches of tropical forest have been cleared to support the production of the second largest producer of cocoa beans in the world and still more is being cleared to respond to increasing demand. When world cocoa prices are low, Ghana’s foreign exchange earnings are significantly affected; which is often compensated for by increasing timber and mineral exports. Cocoa farming is thereby representing a direct as well as indirect cause of deforestation in Ghana (UNEP, 1999).

33
Technological drivers Regarding technology the most important indirect drivers of deforestation in Africa are agrotechnological change and harvesting (wood) technologies. Agrotechnological change: Technological change is a key adaptive response of a society to an increasing population. In the case of Africa, agro-technological improvements, or the lack thereof, are closely linked to the deforestation rate through the intensification of agricultural production. Improved cropping techniques would allow for increased outcome of the existing agricultural land already cleared and reduce the pressure for expansion to new agricultural lands. With the exception of South Africa and some countries in Northern Africa, science and technology development in the region has been relatively slow, largely because of: (a) low investments in science, education and research; (b) the high share of economic activities remaining in the informal domain, which curbs interest to invest in innovations; and (c) a failure to develop and use Africa’s strong base of traditional knowledge to deal with modern problems (FAO, 2009). The slow technological development is thus an indirect driver negatively affecting deforestation rates. It is likely that only with agrotechnological changes of production methods the existing agricultural sector will be capable of responding to the rising food demand from a growing population. The rapidly growing human population in Africa would need continuous support to gain rapid advances in agricultural and industrial technology (FAO, 2009). Harvesting (wood) technologies: With some exceptions, namely South Africa and some countries from Northern Africa, the wood technology developments in Africa have been rather slow. This development is due to a number of factors, which are listed below (FAO, 2009): low investments in science and R&D; large shares of economic activities remain in the informal sector which does not attract investments; traditional knowledge to address problems is not being applied. Bioenergy policy drivers In Africa, though growth in domestic biomass energy production will continue, the growth rate - when compared to the growth rate in other regions - will slow significantly. Most of this production will continue to be from traditional fuelwood and charcoal since the region currently does not set ambitious renewable energy targets for its electricity and heat production. The global interest and demand for biofuels, on the other hand, has increased investments in biofuels development for export purposes, for example through the planting of Jatropha species. Governance drivers Governance, including institutional and policy factors, are important underlying factors of deforestation. For Africa the main issues are the following20:
• Poor governance and corruption;
20 Additional supporting information on governance drivers in Africa is provided in Annex section Error! Reference source not
found..

Final Report 34
• Declining capacity of public forestry agencies, including research, education, training and extension. (FAO, 2009);
• Land tenure uncertainties, weak legal frameworks and other hindrances to the development of a competitive private sector.
• Poor inter-sectoral linkages, with high-priority sectors such as agriculture, mining, industrial development and energy effectively having a greater impact on forests than forest policy.
Socio-cultural drivers A special feature from Africa which affects the entire range of public sectors, including the forestry sector, is the critical situation of HIV/AIDS. The FAO recently stressed the impacts from HIV/AIDS as: (a) drastic decline in resources - human and financial - leaving less for long-term investments; (b) increased dependence on forest products, especially those that are easy to collect; (c) Loss of traditional knowledge; (d) shortage of skilled and unskilled labour - undermining forestry by affecting all key sectors such as wood industries, research, education, training, and forest administration; (e) increased costs to industry on account of absenteeism and higher bills for treatment; and (f) reduced public-sector investment in forestry, as most governments will have to devote more of their budgets to health care and combating HIV/AIDS (FAO 2009).
2.3.3 Actors
A wide range of diverse actors are influencing deforestation in Africa in one way or another reflecting a complex set of interrelations. The most influential actors and the role they play in the drivers identified are described below: Primary actors The primary actors identified are:
� Farmers/villagers (small-scale permanent agriculture and large-scale permanent agriculture) clear the forest to obtain more land for agricultural production and in search of fuelwood for cooking and lightning (Maathai in Lobet, 2009).
� Large international commercial logging companies (Laporte et al. (2007) from mainly Europe, China, Korea and Malaysia directly cause deforestation by logging and timber production for export as well as by constructing roads giving easy access to unplanned settlements.
� Settlers following the track of the commercial logging companies and expanding the deforested areas around the newly implemented roads.
Secondary actors The secondary actors identified are:
� Governmental bodies/politicians (local, national, international) are important actors influencing agricultural expansion, logging and infrastructure expansion.
� Producers of timber products are not necessarily the same as the commercial logging companies, but represent a direct buyer of – and thus demand for - the timber for processing it into wood products. While only some of these producers are located within the region, most producers of timber products are located in

35
Asia, others in America and Europe as they buy primary inputs from the African market.
� Foreign agricultural companies. For example, companies that buy the important agricultural export product such as cotton, cacao and coffee. External investments in large-scale agriculture in response to high food prices could have a negative impact on forests, which is regarded a potential major driver of deforestation in the future by FAO (FAO 2009). These agricultural companies are located in various regions of the world, however, the largest ones often headquartered in the USA.
� National and foreign mining companies exploiting existing mines and continuously searching for new mining sites can indirectly impact deforestation levels due to site exploitation and related infrastructure development and its potential impact on local forest resources.
Tertiary actors The tertiary actors identified are:
� Consumers in the developed and transition economies are influencing both secondary and primary actors via demand for tropical timber products.
� The international community in general can positively or negatively affect governments and politicians through political messages and international treaties related to forest issues.
2.4 Deforestation drivers in Latin America (Amazonia)
Almost half (45%) of the world’s tropical rainforest is found in tropical America, which equals about 281.2 million hectares. The largest unbroken stretch of rainforest is found in the Amazon River basin of South America. Over half of this forest lies in Brazil, which holds about one-third of the world's remaining tropical rainforests.
2.4.1 Direct drivers
In general terms the direct drivers in Latin America are (in order of importance): agriculture (deforestation), infrastructure expansion (deforestation), and wood extraction (deforestation). Agricultural expansion and other land use changes More and more land is used for agricultural production. In order to fulfil the demands of a growing population two different groups are engaged in agriculture. One group are national and foreign commercial agricultural firms applying large-scale cattle ranching and crop farming in order to supply these agricultural commodities for exportation and national food production.21 The other group comprises an increasing number of
21 According to Pomareda and Hartwich, Latin America is home to at least 15 million farms and more than 100,000 agricultural industries—small- to medium-size plants that process food and agricultural products or produce inputs (Pomadera and Hartwich, 2006).
Final Report 36
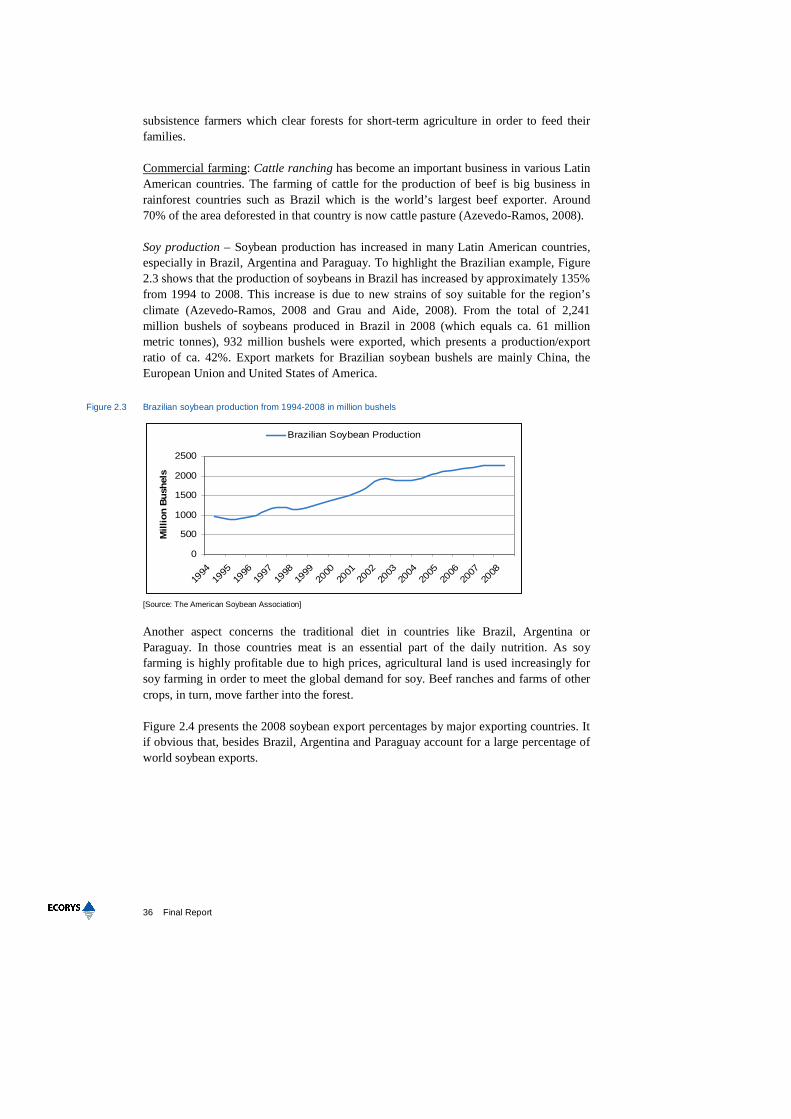
subsistence farmers which clear forests for short-term agriculture in order to feed their families. Commercial farming: Cattle ranching has become an important business in various Latin American countries. The farming of cattle for the production of beef is big business in rainforest countries such as Brazil which is the world’s largest beef exporter. Around 70% of the area deforested in that country is now cattle pasture (Azevedo-Ramos, 2008). Soy production – Soybean production has increased in many Latin American countries, especially in Brazil, Argentina and Paraguay. To highlight the Brazilian example, Figure 2.3 shows that the production of soybeans in Brazil has increased by approximately 135% from 1994 to 2008. This increase is due to new strains of soy suitable for the region’s climate (Azevedo-Ramos, 2008 and Grau and Aide, 2008). From the total of 2,241 million bushels of soybeans produced in Brazil in 2008 (which equals ca. 61 million metric tonnes), 932 million bushels were exported, which presents a production/export ratio of ca. 42%. Export markets for Brazilian soybean bushels are mainly China, the European Union and United States of America.
Figure 2.3 Brazilian soybean production from 1994-2008 in million bushels
0
500
1000
1500
2000
2500
1994
1995
1996
1997
1998
1999
2000
2001
2002
2003
2004
2005
2006
2007
2008
Milli
on B
ush
els
Brazilian Soybean Production
[Source: The American Soybean Association]
Another aspect concerns the traditional diet in countries like Brazil, Argentina or Paraguay. In those countries meat is an essential part of the daily nutrition. As soy farming is highly profitable due to high prices, agricultural land is used increasingly for soy farming in order to meet the global demand for soy. Beef ranches and farms of other crops, in turn, move farther into the forest.
Figure 2.4 presents the 2008 soybean export percentages by major exporting countries. It if obvious that, besides Brazil, Argentina and Paraguay account for a large percentage of world soybean exports.

37
Figure 2.4 World 2008 soybean exports in percent by major exporting countries
United States
41%
Argentina17%
Canada2%
Other2%Paraguay
6%
Brazil32%
[Source: The American Soybean Association]
Bioenergy production - In Latin America and the Caribbean, biomass energy production is projected to grow in all dimensions (traditional fuelwood, forest industry needs, biofuels). The relative availability and favourable investment climate compared to other regions of the world will allow the region to maintain its competitive advantage in plantation forestry. The extent of this type of forestry will largely depend on global demand for biomass and biofuels.
Sugarcane – the causality link between soy production and sugarcane production needs to be explored in terms of indirect land use change: sugarcane cultivation claiming land that was previously available for soy cultivation, the latter advancing into rainforest areas. Again, it is worth to exemplify this development on the basis of the Brazilian case. Besides a decreased production of products derived from sugar cane in the 2005/2006 crop year, the basic sugar cane harvest increased substantially. At the same time export rates decreased, which may be paid to the fact of increased domestic demand of sugar for biofuels production.
Table 2.7 Brazilian sugar production and export
Crop
Year
Sugar production
in tones
Annual change in production in %,
indexed at 2004/2005 levels
Sugar
export in
tones
Sugar exports
in %
2005/2006 25,905,723 -2.69 17,598,792 67.9
2006/2007 29,882,433 12.25 19,596,754 65.6
2007/2008 30,760,165 15.55 18,608,154 60.5
[Source: UNICA - Sugar Cane Association Brazil]
Subsistence farming: Shifting Cultivation – people without money and political power use trees for building material as well as slash-and-burn techniques to clear forest for short-term agriculture, planting crops like bananas, palms, manioc, maize, or rice (Manta Nolasco, 2007). After the soil has lost its productivity the people move on to new areas (Martin, 2008).

Final Report 38
Illegal crops- in the case of Latin America, especially coca, is often cultivated in marginal areas, mainly because of poor accessibility, which reduces legal controls and entails deforestation (Grau and Aide, 2008). Mining: A variety of minerals are known to exist in the Amazon Basin. Among those are diamonds, bauxite (aluminium ore), manganese, iron, tin, copper, lead and gold (Gurmendi, 1999). As these minerals remain in demand on an international scale, mining companies will keep up their existing extraction operations and continue to search for new explorations sites. Depending on the type of mineral, mining operations at the site can cause severe forest degradation and deforestation: sites are often located in remote, forested areas. Large plots of forest need to be extracted in order to mine for the minerals; in addition, often new roads need to be cut through wooded area in order to transport the minerals to the market. Finally, mining operations often have heavy environmental impacts, such as on water quality, soil, etc. and thus indirectly affecting forest health in their surroundings. Infrastructure development Infrastructure development plays an important role in deforestation in Latin America. A strong link between road building and logging activities exists throughout Latin American countries, e.g. in Brazil. That link is furthermore supported by the fact that countries, in which the costs for building roads are rather high, such as Bolivia, experience comparatively low rates of deforestation (Jaramillo and Kelly, 1998). In addition, the construction of dams for the generation of hydroelectric power as well as oil and gas pipelines and new settlements can be seen as a cause of deforestation (Manta Nolasco, 2007). Prominent examples of these developments can be found in Venezuela, Ecuador and Peru as well as Brazil and Paraguay. Wood extraction As seen in section 2.1.2 the total net loss of forest area is very high in Latin America which is codetermined by the high wood extraction in Brazil. Wood is extracted at a rate of approximately 1.5 million hectares per year in the Amazonian region of Brazil (Azevedo-Ramos, 2008). Of the entire Brazilian wood production ca. 35% are exported to the EU-27. The EU imports approximately 2% of the roundwood, 25% sawnwood, 20% veneer and 42% plywood from Brazil (based on FAOSTAT and TTAP import data). In addition, Figure 2.5 presents the share of the ten major importing countries of Brazilian forest products in 2006.22
22 The FAOSTAT definition of “Forest products”includes the following products: Roundwood, Fuelwood and Charcoal, Industrial
Roundwood, Sawnwood, Wood-based panels, Pulp, Paper and Paperboard, Species.

39
Figure 2.5 Export shares of Brazilian forest products to the ten major importing countries in 2006
China17%
Netherlands14%
Argentina8%
United Kingdom
6%
Japan5%
USA35%
Spain3%
Italy6%
Finland3%
Germany3%
[Source: FAOSTAT Database]
Related to the logging activities in Brazil is the issue of selective logging. Selective logging describes the practice of felling one or two trees and leaving the forest around those trees intact. Often believed to be a sustainable alternative to clear-cutting, data from Brazil show that when selective logging is added to the overall figure of forest loss, the total forest loss figure increases two-fold (Stanford University, 2005). The FAO stated that fuelwood is usually not recorded and that the actual amount of wood removals is undoubtedly higher (FAO, 2006). Harvesting trees for fuelwood, a major cause of deforestation in other tropical areas of the world, especially in Africa, is only a secondary contributor to deforestation rates in Latin America (Jaramillo and Kelly, 1998). Illegal logging Illegal logging of trees presents a further serious problem for the forestry sector in Latin America. The drivers behind illegal logging and its exact extent remain hard to detect, also due to a lacking common legal definition. Furthermore, the following factors, with some of them already surfaced above, are believed to enhance illegal logging (Seneca Creek Associates, LLC & Wood Resources International, LLC, 2004):
� unclear or poorly enforced forest tenure; � weak political institutions; � poverty; � corruption; � inadequate natural resources planning and monitoring; � lax enforcement of sovereign laws and regulations.
The exact extent of illegal logging in Latin America, in terms of forest area lost due to illegal logging remains unclear as different estimations exist. Estimates vary widely and depend on what is perceived as “illegal”. For the case of Latin America, estimations for illegal logging range from 20-90% for Brazil, 80% for Bolivia, 70% for Ecuador, 80-90% for Peru and 42% for Columbia (Seneca Creek Associates, LLC & Wood Resources International, LLC, 2004). As illegal logging is believed to play a greater role for local people and firms, only 5 to10 % of the global round wood production is assumed to be

Final Report 40
derived from illegal logging (Seneca Creek Associates, LLC & Wood Resources International, LLC, 2004).
2.4.2 Indirect drivers
The most important indirect drivers of deforestation in Latin America are (in order of importance): economic, governance and socio-cultural. In addition, certain technological and demographic causes can be identified. Economic drivers Key economic drivers for deforestation in Latin America include market growth, market failures as well as income and employment. Market growth: Since the enforcement of Structural Adjustment policies (International Monetary Fund and the World Bank) throughout some Latin American countries, these economies have applied economic development policies based on the export of raw materials (Grau and Aide, 2008). Export-oriented industrial agriculture has risen as a consequence of these policies. In turn, land use change to accommodate this rising demand for industrial agriculture production has become one of the main drivers of deforestation in Latin America. In countries such as Brazil, Bolivia, Paraguay, and Argentina, extensive areas of seasonally dry forests with enough rainfall for rain-fed agriculture are now being deforested, mainly for soybean production (Grau and Aide, 2008). The largest portion of this soybean yield is exported to China and the European Union (Grau and Aide, 2008)23. Brazil, where planting of genetically modified soy is restricted to great extent, is supplying ca. 63% of the EU soybean imports. Argentina supplies nearly 50% of the EU’s soy meal imports. However, as the Argentinean soy beans are often genetically modified and as EU labelling requirements constrain imports of GMOs, Argentina’s exports are increasingly directed towards Asian markets. The increasing demand in international commodity markets (e.g. for cash crops and minerals) is thus a driver of deforestation as the value attached to the land and minerals covered by forests has been consistently increasing throughout recent years. Deforestation rates can be directly linked to commodity prices. The figure below presents the price developments for various soy products over the past years as an indication for increasing global demand and thus overall increased pressures on the Amazon forest.
23 The EU is the main global importer of soy, followed by China which is experiencing strong import growth. In 2003, the EU
imported 36.9 million tons of soy beans and meal. China imported 19.4 million tons of soy products, of which 18 million tons soybeans and 1.4 million tons soy oil. (Dros, 2004)

41
Figure 2.6 International Soybean product price development in US Dollar per tonne
0
200
400
600
800
1000
1200
1400
2003/04 2004/05 2005/06 2006/07 2007/2008
US
Do
llar
Soybeans Soybean oil Soybean Cake
[Source: FAO monthly price and policy update February 2009]
This problem is, however, not limited to just one commodity (soy beans): export cash-crops such as sugarcane also factor in the continuous drive for further land use change towards agriculture. Indirect effects of other policies: Besides the growing demand for commodities derived from forests, deforestation is also triggered by policy measures aiming at other goals and having indirect and many times unforeseen effects on forests. This is for instance the case with certain agricultural policies promoting sustainable agricultural production systems characterised by high biodiversity levels, which have not been able to meet the demand for agricultural products of a growing population (Grau and Aide, 2008). Therefore, the positive intentions of the sustainable agricultural policies turned out to have rather negative effects in terms of deforestation: due to the relatively low productivity of these practices, more land area was required to meet the demand for agricultural commodities. In addition, in Latin America, the forestry industry plays an important role in many countries economies. Once again, focussing on Brazil, the forestry sector accounts for 7.1% of exports, approximately 2 million jobs and about 4% of the GDP (based on FAOSTAT Data). Given the fact that the forestry sector plays such a crucial role in national income (GDP) as well as in terms of employment, any further policies for stricter protection, reduced forestry activities, etc. likely meet strong resistance. Thus, countries highly dependent on their forestry sector and without the right governance system in place (e.g. Finland is a good practice example), are prone to face further deforestation indirectly induced from this “high dependency” factor. Governance drivers Governance, including policy and institutional factors are important underlying factors of deforestation and forest degradation. For Latin America the main issues are the following:24
• Lack of clear land policies, equitable and secure property rights; • Policies focussing to a large extent on economic growth generated by industrial
development;
24 More detailed information on governance drivers is provided in Annex section Error! Reference source not found.

Final Report 42
• Weak and non-integrated environmental policies; policies addressing different environmental aspects are very often not coordinated;
• Weak and centralized regulatory systems. Socio-cultural drivers The main socio-cultural driver of deforestation in Latin America is unsustainable consumption patterns. Cultural homogenisation, as far as consumption patterns are concerned, can be seen as a further cause for deforestation. Latin American countries still have a low per capita consumption level compared to the developed world. This per capita daily calorie consumption (generated by meat and food crops) will increase as the regions economy grows and the changes in diet will increase the regional and global demand for food (Grau and Aide, 2008). The “soy-boom” presents a good example as soy beans easily help to feed the growing global population (Grau and Aide, 2008). The implications of the “soy-boom” on deforestation may even be amplified in Latin America due to existing consumption patterns in many Latin American countries. The daily nutrition in countries as Brazil, Argentina or Paraguay consists to great extent of meat. Therefore large agricultural areas are occupied by cattle farming. In order to gain space for soy cultivation, forest has to be cut. Technological drivers The size of farms and the use of technology have an impact on deforestation. According to a study which addressed the interrelation of technical efficiency and tropical deforestation in the Brazilian Amazonian Forest, the technology used and the size of farms has an impact on deforestation. Farms which use very outdated and less efficient technology for their agricultural activities cause more deforestation. Interesting is the fact that the same counts for farms using very efficient and modern machinery as well as technology as these farms are able to reclaim more land for the agricultural activities. Technology is therefore closely linked to the deforestation rate through the intensification of agricultural production within the commercial branch due to technological improvements on the one side, and the intensification of slash and burn farming in the subsidence sector due to a lack of technology on the other side. The same study further states that smaller farms convert more forested land into agricultural land than large landowners (Marchand, 2009). It has been mentioned that various soy cultivations make use of transgenetic cultivars. This can also be regarded as a technological factor as the transgenetic soybeans are now suitable for geographical regions that were ineligible for non-transgenetic cultivars. As these cultivars find their way into new regions massive transportation infrastructure projects (waterways, highways, railways, etc) are required and additional forest area has be cleared (Manta Nolasco, 2007 and Azevedo-Ramos, 2008). Demographic driver: population growth Among the causes for deforestation is the issue of population growth. In 2008 the Latin American population was at approximately 500 million, and it is expected to increase by 50% by 2050 (Grau and Aide, 2008). Furthermore, the per capita consumption in Latin America is below the level of the developed world, and it can be expected that the overall consumption will increase as well (Grau and Aide, 2008). The growing population on the one hand and the economic growth on the other hand demand for more natural

43
commodities and are likely to cause more deforestation as rural and agricultural lands will inevitably have to increase.
2.4.3 Actors
The deforestation and land-use in general throughout Latin America is driven by a complex set of actors as well as international and national economic and demographic developments (Grau and Aide, 2008). These actors all follow different goals which often correlate and therefore cause further deforestation. Primary actors:
� (Small-scale) Farmers from the poor social stratum using deforestation as a method to provide new land for food crop cultivation;
� National and regional (Large-scale) Farmers looking for new land in order to increase production of food crops (e.g. soy beans) and cattle for export;
� National and international (primarily from the USA, Europe and China) wood and timber companies; as well as
� The local mining industry (operated partly by international firms primarily from Europe and Australia).
Secondary/tertiary actors:
� National companies looking for additional land to harvest non-food crops e.g. sugar cane for the production of biofuels;
� Governmental bodies/politicians (local, national, international) interested in economic growth and pressured to provide infrastructural development for a growing population. These politicians often have to implement contradictory policies as far as forest and environmental conservation is concerned.
Each of the presented actors faces certain pressures and constraints caused by the mentioned international and national economic and demographic developments. The so-called primary actors have to be seen as the ones directly responsible for deforestation. In this respect the subsidence and commercial farmers, the wood and timber companies as well as the mining industry have to be mentioned. These actors directly see an advantage and direct value in clearing forested land and using the wood or land for further agricultural or industrial purposes. These actors are partly driven by individual considerations and pressures (e.g. in the case of the increasing number of small scale farmers that have to nourish their family) as well as regional, national and international market demands (e.g. commercial large scale farmers, timber and mining companies having to supply commodities to satisfy growing demand). The group of secondary actors includes national governmental bodies and institutions which actively propose and implement policies related to deforestation. In Latin America this group has indirectly promoted deforestation by primary actors through policies in favour of agricultural expansion and infrastructure development. A third category of actors comprises international governmental bodies, institutions and companies that indirectly stimulate deforestation without being directly involved in the country where deforestation takes place. This actor group promotes economic and

Final Report 44
political stimuli which may raise the demand for which primary actors then have to directly engage in deforestation. With regards to Latin America, the EU and US soy imports from Latin America and the industrial expansion by China implying increasing demand for minerals display such political stimuli. Latin America exports mainly commodities to China, such as oil, copper, soybeans and other minerals. An overview of Latin America’s export partners and the importance of the USA, Europe and China is presented in the figure below. The growing demand for resources linked to or from forests in other regions of the world presents an incentive for Latin American countries to increase supply as well. In order to profit from increasing demand and prices, many industrial sectors are eager to develop further and exploit more natural resources. This process then leads to deforestation.
Figure 2.7 Latin America’s export partners in 2008 (in % of total exports)
41%
18%
6%
3%
19%
13%
USA Europe China Africa&Middle East Latin Amercia other [Source: Euromonitor International from International Monetary Fund (IMF), Direction of Trade Statistics/trade sources/national
statistics]
2.5 Asia and the Pacific (Southeast Asia)
The Asia and the Pacific region (consisting of 47 countries) contains 18.6% of the world’s forest area located in a wide range of ecosystems, including tropical and temperate forests, mangroves, mountains and deserts (FAO, 2009). Rapid socio-economic development in this region is having significant impacts on all sectors, including forestry: demand for wood products is increasing; simultaneously, however, demand for environmental services (such as recreation, carbon sink, protective functions, etc.) of forests is also increasing (FAO, 2009).

45
Figure 2.8 Sub-regional breakdown: Asia
[Source: FAO, 2009]
Taking into account the two dominant development paths of the region – rapid economic growth through industrialisation of some countries and agriculture remaining the source of livelihoods for other countries – forest loss is expected to continue in most Asian countries over the next two decades at approximately today’s rate (FAO, 2009). This forecast is particularly worrying for large parts of Southeast Asia (Brunei, Cambodia, Indonesia, Lao People’s Democratic Republic, Malaysia, Myanmar, Philippines, Thailand, East Timor, Vietnam) because it has the highest relative rate of deforestation of any major tropical region. At current rates the region could lose up to ¾ of its original forests by 2100 and up to 42% of its biodiversity (Sodhi et. al., 2004). During the last decade, the loss of natural forest in the region has continued at a rate of approximately 1.9% annually.
2.5.1 Direct drivers
Overall, the direct drivers of deforestation in the Southeast Asian region can be divided into four main categories (in order of importance):
1. agricultural expansion (deforestation) a. expansion to satisfy increasing food demand b. land conversion to cash crops and other estate crops (such as tea, coffee,
cocoa, rubber and coconut)25 2. wood extraction (deforestation)
25 Estate crops are agricultural crops grown in a plantation system.

Final Report 46
a. commercial logging to satisfy worldwide demand for Asian timber b. illegal logging activities
3. infrastructure expansion (deforestation) a. economic growth and increasing population density b. subsidisation of road infrastructure
4. Natural disasters (degradation) 5. Exploitation of natural resources, such as mining activities (deforestation /
degradation) All drivers are closely interlinked with each other as well as with indirect drivers. The following figure provides an overview of the relative importance of these various direct causes to deforestation.
Figure 2.9 Direct causes of forest area changes in tropical Southeast Asian countries, 1990-2000
13%
29%
23%
9%
6%
20%
Direct conversion to small-scale permanent agriculture
Direct conversion to large-scale permanent agriculture
Intensification of agriculture in shifting cultivation areas
Expansion of shifting cultivation into undistributed forests
Gains in forest area and canopy cover
Other [Source: FAO, 2001]
Agricultural expansion The two main categories of agricultural expansion include increased cultivation to satisfy food demands and land conversion for cash and estate crops. Satisfying increasing food demand: The main agricultural causes are permanent cultivation (subsistence agriculture), shifting cultivation (swidden agriculture) and colonisation. From the 1800s onwards agricultural expansion was needed to meet the increasing local and global demand for rice. Rapid population growth has continued in Pacific Asia and today represents one of the biggest challenges for sustainable resource use. This expansion of subsistence as well as large-scale agriculture to satisfy food demand has continued ever since due to the continuous population growth in this region.
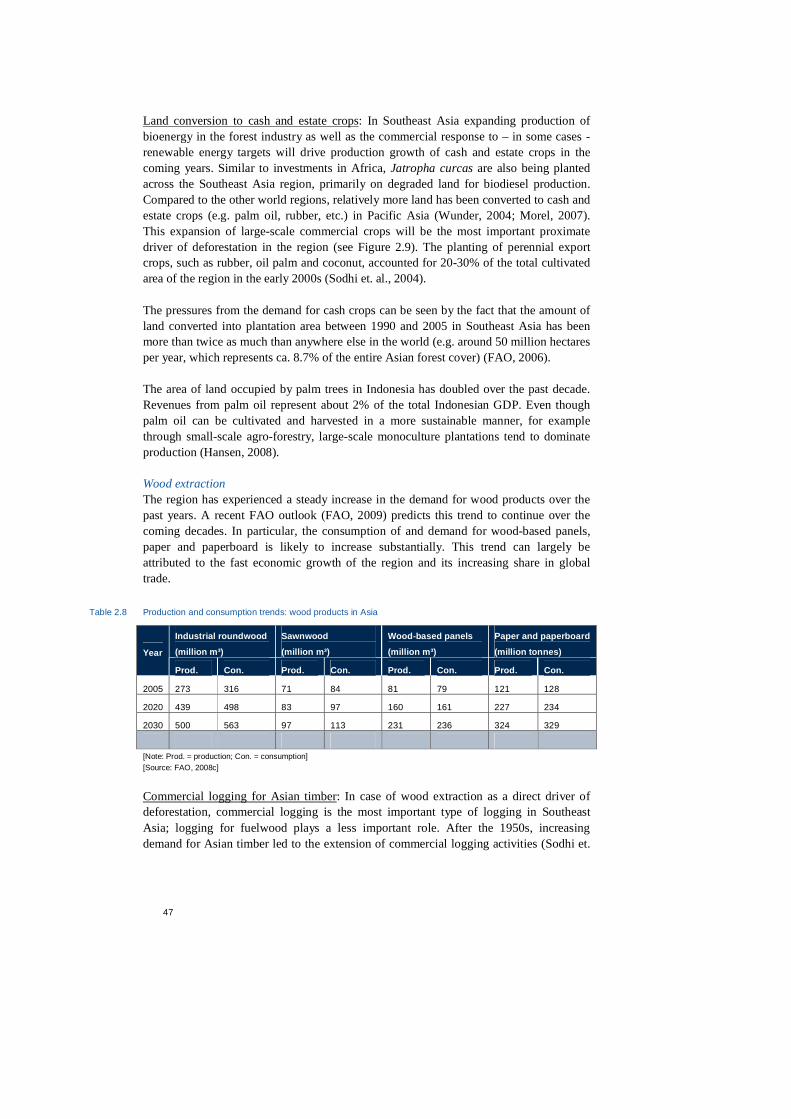
47
Land conversion to cash and estate crops: In Southeast Asia expanding production of bioenergy in the forest industry as well as the commercial response to – in some cases - renewable energy targets will drive production growth of cash and estate crops in the coming years. Similar to investments in Africa, Jatropha curcas are also being planted across the Southeast Asia region, primarily on degraded land for biodiesel production. Compared to the other world regions, relatively more land has been converted to cash and estate crops (e.g. palm oil, rubber, etc.) in Pacific Asia (Wunder, 2004; Morel, 2007). This expansion of large-scale commercial crops will be the most important proximate driver of deforestation in the region (see Figure 2.9). The planting of perennial export crops, such as rubber, oil palm and coconut, accounted for 20-30% of the total cultivated area of the region in the early 2000s (Sodhi et. al., 2004). The pressures from the demand for cash crops can be seen by the fact that the amount of land converted into plantation area between 1990 and 2005 in Southeast Asia has been more than twice as much than anywhere else in the world (e.g. around 50 million hectares per year, which represents ca. 8.7% of the entire Asian forest cover) (FAO, 2006). The area of land occupied by palm trees in Indonesia has doubled over the past decade. Revenues from palm oil represent about 2% of the total Indonesian GDP. Even though palm oil can be cultivated and harvested in a more sustainable manner, for example through small-scale agro-forestry, large-scale monoculture plantations tend to dominate production (Hansen, 2008). Wood extraction The region has experienced a steady increase in the demand for wood products over the past years. A recent FAO outlook (FAO, 2009) predicts this trend to continue over the coming decades. In particular, the consumption of and demand for wood-based panels, paper and paperboard is likely to increase substantially. This trend can largely be attributed to the fast economic growth of the region and its increasing share in global trade.
Table 2.8 Production and consumption trends: wood products in Asia
Industrial roundwood
(million m³)
Sawnwood
(million m³)
Wood-based panels
(million m³)
Paper and paperboard
(million tonnes) Year
Prod. Con. Prod. Con. Prod. Con. Prod. Con.
2005 273 316 71 84 81 79 121 128
2020 439 498 83 97 160 161 227 234
2030 500 563 97 113 231 236 324 329
[Note: Prod. = production; Con. = consumption] [Source: FAO, 2008c]
Commercial logging for Asian timber: In case of wood extraction as a direct driver of deforestation, commercial logging is the most important type of logging in Southeast Asia; logging for fuelwood plays a less important role. After the 1950s, increasing demand for Asian timber led to the extension of commercial logging activities (Sodhi et.
Final Report 48
al., 2004). Since the early 1970s, Pacific Asia has become the main source of tropical timber trade in the world. Nevertheless, it should be noted that the Southeast Asian region as a whole has made substantial progress toward implementing sustainable forest management through measures as reduced-impact logging and the use of certification to target niche markets. The International Tropical Timber Organization (ITTO) reported in 2006 that 14.4 million hectares (= 2.5% of the entire Asian forest cover) of natural tropical production forests are now managed sustainably in this region, mostly in India, Indonesia and Malaysia. Illegal logging activities: Logging remains an important economic activity in the region. Logging processes typically result in damage to about twice the number of trees as those actually harvested. In many of the Asian countries corruption and illegal activities undermine positive attempts to better manage and protect forest resources. There is major economic momentum behind illegal logging in some countries (Morel, 2007). In these countries, the contraction of formal economic sectors often opens opportunities for expansion of the informal sector, including illegal logging. A point in case was when a number of countries in Pacific Asia witnessed an increase in illegal logging following the 1997/98 economic crisis (Pagiola, 2004). Thus, declining demand for high-priced wood from legal operations reduced institutional capacity to protect forests as a result of lower budgets and increasing unemployment in the formal sector could increase illegal logging. Infrastructure expansion In studies were infrastructure plays a role in deforestation, transport extension is more often identified as the cause than settlement or market extension. Subsidised roads built into forested regions greatly stimulate deforestation by lowering transport costs (Wunder, 2004). This focus on expanding the current transportation infrastructure holds for all countries in the region. This is a priority to attract foreign investment. Natural disasters Forest fires – though they have always occurred in Pacific Asia – have worsened in recent years due to a combination of factors, including poor land conversion practices, logging and more intensive El Niño events. Tsunamis and landslides, as happened in 2004 affecting large parts of Thailand and Indonesia, also pose a threat to forests and larger ecosystems. Mining activities In Pacific Asia, mining of coal, gold, copper and bauxite has placed additional pressures on forests (Morel, 2007; Hansen, 2008). National and international companies, mainly from Europe and Australia will seek further opportunities for mineral exploitation across the region in the future.
2.5.2 Indirect drivers
The indirect drivers of deforestation in Asia that are mostly mentioned in case studies are (in order of importance): institutional, technological, and economic factors (Geist and

49
Lambin, 2002). Laurance (2007)26 identifies population density and increasing demand for timber and agricultural products in a globalising economy as the main indirect drivers. This is in line with the primary socio-economic drivers of forest loss in Asia that Sodhi et al (2004) have identified namely economic growth and increasing population density. Agriculture and logging are driven by population and economic demand. So it is the interplay of factors that explains the underlying forces of deforestation in Asia. Economic drivers The two main economic drivers for this region are its fast economic growth as well as national and international demand growth for forestry products. Fast economic growth: As indicated above, Southeast Asia has the fastest economic growth of all regions (see figure below).
Figure 2.10 Gross domestic product development in Asia
[FAO, 2009]
This rapid expansion of the economy in the emerging industrial economies will lead to an expanded middle class. This in turn results in an increased demand for food, fuel, etc. which consequently exert substantial pressure on the natural-resource-rich countries in the region. Other consequences of the industrialization process are the fact that agricultural expansion will slow whereas non-agricultural land uses, such as mining and urban expansion may continue to place pressure on forests. In the less developed countries of this region, agriculture will remain the key source of livelihoods and may – as a consequence of population growth and increased food demand – even expand in the coming decades.
26 Laurance, W.F. 2007. CURRENT SCI 1544 ENCE, VOL. 93, NO. 11.

Final Report 50
Demand (national and international) growth for forestry products: International and regional trade pressures as well as continuing economic growth pressures under conditions of depleted natural resources have been identified as two of the most critical underlying issues of deforestation in Indonesia as well as Pacific Asia in general. Part of this market growth and increasing pressures to deforest stems from demand for wood, part from demand for cash crops and thus increased land clearing for agriculture and plantations. In absolute terms, the value added generated by the forestry sector in the Asia and Pacific region rose from about US$100 billion in 2000 to about US$120 billion in 2006 (Figure 2.11). A large part of this increase can be attributed to the pulp and paper and wood-processing sectors, while the level of wood production has remained rather stable. This production pattern reflects the growing dependence of the region on wood imports and the changing structure of industry, with greater emphasis on more value-adding manufacturing. Despite the overall increase in production of forest products, the share of forestry in GDP and employment continues to decline (Figure 2.11), largely because of the even faster growth of other economic sectors.
Figure 2.11 Value added and relative size of forestry sector in Asia and the Pacific Region
[FAO, 2008]
Technological drivers The two main technological drivers of deforestation in Asia and the Pacific are technological advances in the forestry sector as well as agrotechnological change. Overall, the region has been at the forefront of developing and adopting green revolution technologies, which have contributed towards slowing or even reversing the horizontal expansion of agriculture. Technology in the forestry sector: Technology in the forestry sector from timber logging (e.g. use of chainsaws or heavy equipment) to wood processing (mainly, poor timber processing technology) and in the industrial and domestic consumption of wood (e.g., poor performance of domestic or industrial furnace technology) are an important driver of deforestation because damaging and wasteful techniques are used. The main problem in Asia (Thailand, Indonesia, Malaysia, Philippines) is in the logging part. Where in many

51
cases the forestry is already a major proximate cause of deforestation, wastage is actually increasing deforestation. (Geist and Lambin 2001). A possible development in Asia is afforestation. The majority of the world’s 2.8 million hectares of afforested area per year is mostly found in Asia, mainly in China. This is based on modelling outcomes from IIASA (IIASA/GAINS, 2008) as sound factual figures are not yet recorded. Agro-technological change: In Asia both agricultural intensification (in 20% of the cases), as well as agricultural extensification (in 16% of the cases) can be causes of deforestation (Geist and Lambin, 2001). In the first case farmers reduce their fallow period and permanently farm their land. This implies that the fallow stage (about 6-20 years depending on the system) in which forest can temporarily return is left out of the farming process. Intensification may occur in order to increase income from farming or may be caused by speculative motives to occupy land. Shifting between intensification and extensification, because of abrupt economic changes (price collapse, market shifts), or other calamities may increase this effect. Besides (or in combination with) changes in intensity, deforestation may be caused by changes in land holding size, labour intensity, and capital intensity and orientation in production (commercial/subsistence). Change to a large holding may occur at the expense of forest, whereas the shift into smaller holdings can force farmers also to use the forested areas of their lands. The shift from labour to capital intensive farming (mechanisation) can also increase deforestation (Geist and Lambin, 2001). Demographic drivers The two main demographic drivers in the Asia and Pacific region are population growth and migration. Population growth: This demographic trend triggers many of the other indirect and direct causes of deforestation, including the increased demand for agricultural land, migration, poverty, inadequate land and resource allocation, easier access due to infrastructure development, and increased demand for forest products (Morel, 2007). Asia and the Pacific region is home to more than half the world’s population. In Indonesia, for example, the population has grown from about 40 million in 1900 to 200 million in 1997 (Contreras-Hermosilla, 2000). The region’s population is projected to reach 4.2 billion by 2020, an increase of 600 million from 2006. Migration: Migration has been actively sponsored by Governments in Pacific Asia (particularly in Indonesia, Malaysia, Vietnam, the Philippines) to encourage people to establish new agricultural settlements. New settlements mainly form adjacent to forests and heavily impact local forest degradation and often lead to deforestation. In particular the urban population is expected to rise from 38% in 2005 to 47% in 2020. This will have significant migratory implications and cause different types of strains on forest resources, such as conversion of forests into suburbs and urban infrastructure projects. Governance drivers The Asia and Pacific region is very active in institutional and policy developments. A recent initiative to revise policies and legislation in order to allow greater involvement of

Final Report 52
diverse stakeholders in forestry, particularly through privatisation and community participation triggered various changes in the participation of actors, including: increased corporate investments in forestry; greater involvement of civil society organisations in policy making, forest management, research and awareness promotion; reduced authority of the public forestry agencies mainly due to the fact that other players are starting to take on more important roles; and the restoration of rights to indigenous forest communities. Another successful governance measure in the region includes the improvement in tenure conditions providing more incentive for landowners to grow trees. Despite the overall efforts, governance problems remain in some countries, unfortunately often those with the most forests. In those countries, combating corruption and illegal logging has been one of the main foci of policy efforts. Furthermore, conflicts disrupt forest management and policy efforts in some countries as well as adding additional pressures on natural resources.27
2.5.3 Actors
Due to the closely inter-linked proximate drivers as well as underlying causes, also the various actors associated with deforestation interact in various ways. In Pacific Asia, the primary actors are farmers – both subsistence and commercial -, loggers, and fuelwood collectors. One level removed, yet influencing deforestation rates are governmental bodies and agencies acting as secondary actors. On a third level, international institutions (and their policy instruments) as well as international companies indirectly influence deforestation levels in Pacific Asia. Primary actors A simple economic framework applies to subsistence households as well as large companies including farmers, ranchers, and loggers. Landholders and land claimants weigh cultural, economic, and legal considerations when making decisions about land use. A central issue is that some may find agriculture a more profitable, attractive land use than sustainable management of forests for timber and other products. “After an initial selective cut of timber, the present value of the next cut—30 years hence—may be only pennies a hectare. Conversion to pasture may offer tens or hundreds of dollars a hectare; conversion to soy or palm oil may offer $1,500 per hectare or more.” (Chomitz, 2007). Low wages, good soils, favourable climate and higher prices for agricultural products therefore all motivate continued deforestation on a subsistence level, as well as a commercial scale (Chomitz, 2007; Contreras-Hermosilla, 2000). Large-scale national, but also international loggers (mainly from China) are important agents of deforestation in Pacific Asia not only because they typically cut the most valuable species, but also because they facilitate access for others by building roads and clearing vast areas attracting landless migrants (Contreras-Hermosilla, 2000).In Asia, also fuelwood collectors continue to play an important role in degrading and deforesting areas around the cities (Contreras-Hermosilla, 2000).
27 Additional information on governance drivers in Asia is provided in Annex section Error! Reference source not found.

53
Secondary actors While primary actors are the direct agents of deforestation, secondary actors clearly contribute to the deforestation problem in Asia and the Pacific. Similar to and in close relation with the indirect drivers of deforestation in this region, governmental bodies and politicians on local, national and regional level are considered major secondary actors. Although the overall state of governance is regarded as good and stable in most countries of the region, capacity deficits on local and regional level may still have a negative influence on deforestation; for example, when the monetary incentives for land use change clearly outweigh the present benefits of forest protection. Tertiary actors Yet another level of actors one more step removed from the direct deforestation action on the ground are international institutions, policies of other countries and actions of international companies. As mentioned in previous sections, international policies, such as bioenergy policies, can change commodity prices and incentivise logging activities. Similarly, international companies will seek opportunities (mining, timber extraction, etc.) if local legislation fails to ensure a balance between resource protection and use. Furthermore, domestic consumers are also powerful actors as drivers for both forest and agriculture products demand. Domestic consumers determine demand and indirectly stimulate deforestation. For a more detailed description about forest product demand patterns see Table 2.8 above.
2.6 Realistic future outlook in the three hotspot regions
The previous sections have shown in detail which direct and indirect forces catalyse deforestation in Latin America, Sub-Saharan Africa and the Asia and the Pacific region. Using this review of historic and current trends it is possible to generate realistic futures for all three regions.
2.6.1 Realistic future outlook for Sub-Saharan Africa
Sketching a realistic future outlook for Sub-Saharan Africa is a manifold endeavour as many external forces are likely to influence the development of the region. In the case of Sub-Saharan Africa it can be anticipated that the population will continue to grow over the next 10 to 20 years and that many countries will also experience economic growth. These two growth components will trigger a variety of implications for the regions. A growing population with slowly increasing purchasing power will demand more energy and food in order to satisfy daily nutrition. Therefore, increased wood and meat demand as well as infrastructure expansion are likely to occur over the next 10 to 20 years. In Sub-Saharan Africa, wood extraction for domestic fuel wood or charcoal production will remain a major issue. It will be difficult to supply sufficient means of other energy sources, taking the growing population into account. The past and present development of wood extraction has shown that the majority of removed wood was and is used for fuel. Furthermore, commercial logging is expected to increase in volume, with Sub-Saharan

Final Report 54
countries such as Cameroon, the Democratic Republic of the Congo and Gabon emerging as major exporters of industrial round wood. The third driver of wood demand, using wood as a source of renewable energy, is expected to play an increasing role with external demand for biofuels triggering the production of biofuels in Sub-Saharan Africa. The economies in Sub-Saharan Africa will contribute to the increasing worldwide biofuels production and additional supply on the global market as the economies in Sub-Saharan Africa are likely to develop at slower rates than other regions. A large biofuels production capacity could therefore generate revenues through exporting the fuels to regions outside Sub-Saharan Africa. However, it is likely that, due to a lack of expertise and experience, primarily 1st generation biofuels technologies will be applied in Sub-Saharan Africa for a longer period of time, unless a rapid transfer of technology is achieved. Finally, given the very low levels of governance in the region, biodiversity protection and enforcement of any types of forestry policies will likely remain very difficult in the years to come.
2.6.2 Realistic future outlook for Latin America and the Caribbean
In Latin America and the Caribbean, countries will experience two significant developments which will lead to an increasing demand for wood and wooden products as well as meat. Many countries in this region are foreseen to experience a population growth on the one hand and a prosperous economic development on the other hand. By 2030, the purchasing power will have increased substantially and the private demand for high-quality wood products will have increased. Latin American wood exporting economies will face additional demand for high-quality timber by domestic consumers. On lower income levels wood demand may increase as the material will serve the poor as a basic material for energy generation and construction. In addition, wood may also play a role in national bioenergy strategies as a renewable source of energy. In Latin America and the Caribbean it is very likely that, in the short- and medium-term, biofuels production for either bioethanol, biodiesel, 2nd generation biofuels or a combination thereof will increase drastically given current trends. Latin American countries, especially Brazil, are already the major biofuels producing countries in the world and are likely to remain in that position. The emerging economies in the region will only be able to allay their thirst for fuels by investing heavily in the cultivation of bio-crops, which will correspond to the need of additional agricultural land to be obtained from forests. Furthermore, the meat demand is likely to increase despite the already high consumption of meat in countries like Argentina or Brazil. In Latin America and the Caribbean, the increased demand for meat will however not primarily be caused by the increased economic growth but by the growing population. Meat has been and will be a traditional stable and comparably cheap food in many Latin American countries. A growing population will naturally consume more meat.

55
2.6.3 Realistic future outlook for Pacific Asia
A realistic future outlook for Pacific Asia is to some extent comparable to the previous made statements with regard to Latin America and the Caribbean. For this region a rapid population and economic growth is likely to generate large demand for new infrastructure development in the coming decades. However, the population growth is foreseen to be of much greater nature in terms of total population figures than in the other two regions described above. Similarly, greater affluence tends to increase the demand for meat and high-quality wood products. On lower income levels, wood will serve the poor as a basic material for energy generation and construction. Pacific Asia will have to increase the production of biofuels significantly. Again, countries in the region will only be able to provide their economies with energy and fuel by investing heavily in the cultivation of bio-crops and biofuels production facilities. If these futures, or at least similar developments, occur throughout the regions, it is obvious that the problem of deforestation cannot be addressed with a one-stop solution. Rather, each region needs to tackle deforestation with specific sets of policy measures. These could be aided by overarching worldwide policies if deemed relevant. The modelling carried out in the remainder of this study is based on scenarios built from the driver analysis and likely futures presented in this qualitative review.


57
3 Scenario development
This chapter describes the baseline, the chosen scenarios analysed in this study and a brief explanation of the models used to run the scenarios. After a general description of how the baseline and scenarios will be juxtaposed in the modelling, the baseline scenario is presented followed by a more detailed description of previously identified policy shock areas. The current developments and most likely futures assessed in the previous chapter lead to the relevant scenarios to be investigated in this study.
Disclaimer: It should be noted here that all the chosen scenarios are merely examples of what
could happen in the future but are by no means linked to any real policy efforts.
This chapter provides the narrative storylines necessary for understanding the modelling results presented in Chapter 4. The combination of narrative storylines and modelling results will provide a quantitative understanding on how changes in drivers (i.e. policy shocks) influence the total future levels of deforestation (in hectares) as well as the cost of achieving the EU’s 2020 and 2030 policy goals on deforestation. The following figure (already presented in Chapter 1) depicts the various components of the scenario building and modelling approach. The figure is presented again to remind of its function as a guide through the modelling elements presented in this and the next chapter.
Figure 3.1 Overview of scenario building and modelling approach
[Source: ECORYS/IIASA]

Final Report 58
The following sections provide an overview of the baseline and define the storylines of the selected policy shock areas.
3.1 Understanding the baseline
As a first step, the baseline scenario is defined. This section provides a basic overview; for a more detailed description of the baseline, we refer to Annex section 6.3. Although the assumptions of the presented baseline scenario may already be - to some extent - outdated, the goal of comparing different scenarios is not affected. As can be reviewed in Figure 3.1, the baseline scenario is derived from the deforestation driver analysis in the previous chapter. For the more general global trends, such as population growth, economic growth, energy demand, etc., the baseline assumption is built on the global scenario from the POLES Model used for the background analysis of the Copenhagen Communication28. The reason to choose such a well-established scenario as a basic starting point is consistency with previous work and based on the fact that the model contains and presents recent and comprehensive assumptions regarding economic, social, technological and environmental developments in the future. This step of describing the baseline scenario is necessary to understand the status quo and gain a clear understanding of the starting point of the consequent policy shock analyses. The established baseline scenario will be used in order to compare the policy shock scenarios. The box overleaf presents a simplified storyline for the baseline scenario.
28
COM (2009)39, SEC (2009)101, Russ et. al, 2009

59
Box 3.1 Summary overview of the global baseline
Simplified storyline for the baseline scenario
Until 2030, the globe will experience a steady population growth, especially in the deforestation hotspots of
Sub-Saharan Africa (up to 2.1 billion people by 2030) and Pacific Asia as well as the Latin America and
Caribbean region (both regions are predicted to count up to 1.3 billion people by 2030). The developed world,
especially the EU-27 region will face a stagnating and aging population. The growing world population will,
however, also experience a prosperous global economic development. GDP will continue to grow. The
currently developed world will maintain its position on the top scale of GDP. The developing countries will
develop in terms of substantial GDP increases until 2030.
This growing population will have to be fed and provided with energy. Meat demand will increase, especially in
regions in which the GDP increases will allow the population to consume more meat as part of their daily diet.
Daily food calorie intake in Pacific Asia, for example, is expected to increase by almost 500 calories between
now and 2030. Domestic energy supply as well as energy for transportation is foreseen to be more and more
provided from biomass. The share of biofuels in total transport energy, for example, is foreseen to increase
from ca. 4% in 2020 to approximately 8% in 2030. The production of ethanol and biodiesel will continue to
increase and new technologies, such as second generation biofuels will gain more and more market shares
throughout the third decade of the century.
The increasing demand for transportation and biofuels together with logistical needs to supply a growing
population with food triggers the growth of another baseline scenario parameter: infrastructure. The
infrastructural improvements in currently underdeveloped and poor regions will contribute to great extent to a
substantially growing net of infrastructure around the globe. Infrastructure will open up access to forest areas
which were previously not accessible and thus not exploited for agricultural or forest production.
Finally, all these developments will be steered and fostered by a governance architecture which will be to a
large extent of national and bilateral nature pointing to a successful implementation of the FLEGT programme.
Until 2030, governance efforts will be able to implement a global biodiversity protection plan which assures
that 10% of the globe’s surface area will be protected by 2030.
The global baseline scenario is the departing point for all further analysis. It is therefore essential to understand the projected developments of the parameters in different regions across the globe under this baseline.
3.2 Identifying various policy shock areas
Seven policy shock areas have been identified for a quantitative modelling analysis on global scale as well as for the three deforestation hotspot regions. In total 12 policy shock scenarios are modelled under these seven policy shock areas. These policy shock scenarios explore how different ‘extreme’ developments of certain drivers affect the future level of deforestation (in hectares) and thus the potential costs (in $) involved in achieving the EU’s 2020 and 2030 policy goals on reducing deforestation.

Final Report 60
Global scenario analysis As can be seen in Figure 3.1, the selected policy shock areas on a global scale based on the driver analysis outcomes presented in Chapter 2 are as follows:
Box 3.2 Selected global policy shock scenarios
1. To measure the effect of biofuels policies on demand for biomass a policy shock is introduced whereby
a share of 15% of all transport energy in 2030 comes from biofuels that are produced from various
combinations of 1st and 2nd generation feedstocks. Five different combinations are modelled and
analysed.
2. To measure the effect of increased demand for wood and wood products two policy shock scenarios
are introduced increasing the overall demand for wood in 2020 by 10% for both policy shocks, by 15% in
2030 in the first policy shock and by 25% in 2030 in the second policy shock .
3. To measure the effect of increased demand for meat, an overall additional increase of 10% in animal
calorie consumption is introduced in the model for 2020 (15% for 2030).
4. To measure the effect of a simultaneous dual increase(s) in demand for meat and biofuels from 1st
generation feedstocks, the meat and one biofuels policy shock are combined and analysed.
5. To measure the effect of further infrastructure development, a policy shock consisting in reducing
transportation costs is implemented. We simulate a 10% decrease in emerging regions’ transportation
costs, and a 5% decrease in developing regions’ transportation costs.29
In practical terms, this policy shock analysis means that for each scenario separately, the shock will be incorporated in the baseline and the model re-run with these new assumptions. The storylines behind each of the policy shock scenarios will be explained in depth under each policy shock scenario section below. Geographic explicit case study: the Congo Basin As a separate step, the regional (POLES regions) results obtained from the above approach will then be explored in further detail for one case study region: the Congo Basin. The Congo Basin has been chosen as it is the geographic region with the highest deforestation rates outside the Amazon area and governed by different countries. This makes the analysis of the Congo Basin interesting in order to draw conclusions on the impact of different levels of governance on deforestation. In addition to analysing the 5 policy shock areas (resulting in ten policy shock scenarios) obtained from the Global land use model GLOBIOM, the area-specific case study will also involve three additional policy shock scenarios to be modelled using the geographic-explicit G4M model. The selected policy shock areas on a geographic explicit scale based on the driver analysis outcomes presented in Chapter 2 are as follows:
29 The BRIC countries are applied as emerging regions (10% decrease), all remaining non-OECD countries represent the
developing region (5% decrease).

61
Box 3.3 Selected geographic-explicit policy shock scenarios
5. To measure the effect of infrastructure expansion with regard to the Congo Basin, a policy shock
equivalent to the infrastructure policy shock on the global level is modelled. Here again, we simulate a
10% decrease in emerging regions’ transportation costs, and a 5% decrease in developing regions’
transportation costs.30
6. To measure the role of biodiversity protection and ecosystem services and their impact, a 15%
increase in the total area under protection is introduced as a shock for 2020 (20% for 2030). This
scenario will be based on a WCMC product on modelled new conservation areas by 2050.
7. To measure the role of good governance and how it supports/hinders sound forest policy, a policy shock
will be modelled using hurdle rates as a proxy for changes in the quality of governance.
For this case study we will draw on the qualitative driver analysis carried out in Chapter 2 and the quantitative results obtained from the policy shock scenarios to explain in more detail the possible future development storylines and their effects on this geographic explicit area. The basic output of this sub-task will be a geographic explicit example (case study) for one of the deforestation hotspots exploring in further detail the implications of the qualitative and quantitative findings on drivers and their potential impacts on the level of deforestation and associated cost implications of achieving the EU’s 2020/2030 policy goals.
30 The BRIC countries are applied as emerging regions (10% decrease), all remaining non-OECD countries represent the
developing region (5% decrease).

Final Report 62
3.2.2 Policy shock area 1: change in biofuels demand
Narrative storyline for the biofuels policy shock scenario
Under the biofuels policy shock 15% of total transportation fuel in 2030 will consist of biofuels.
Due to a post-2012 international agreement on climate change, stricter binding targets on GHG emissions
mitigation have been set, especially for the developed world. As emerging economies are still experiencing
growth, the global demand for transportation services will also continue to rise. In order to serve the demand
while facing an increasing scarcity and price for fossil fuels, the biofuels production will experience further
growth. As space is limited in densely populated developed countries, the production of biofuels will mainly
take place in developing countries and emerging economies in the southern hemisphere.
The figure of 15% of total transportation fuel in 2030 consisting of biofuels takes the past and present
developments on the global market for biofuels but also fossil fuels into account. Considering the time horizon
until 2030 and the projections of fossil fuels use and the expansion of biofuels production, 15% presents a
realistic figure as biofuels growth is further supported by climate mitigation considerations as well as increasing
concerns of increased energy security. Biofuels are thought to contribute to energy security for the transport
sector in two ways. First for countries with a large land base biofuels lead to less reliance of fossil fuel based
transport fuels. Second for countries which neither have a sufficiently large land base as well as no own
access to oil, biofuels help to diversify their fuel mix.
This scenario is in line with the most recent literature; for instance, a forthcoming study by Petr Havlík et al
(IOP Conference Series: Earth and Environmental Science 6, 2009) presents refined results of the GLOBIOM
model integrating the agricultural, bioenergy and forestry sectors. Results of this study show a strong
competition between traditional forests and biofuels production. The study compares various scenarios for
2030 analysing the influence of avoided deforestation policies as well as biofuels/biomass policies on
deforestation levels. Under no avoided deforestation policies and 10% (globally) fossil fuel substitution by
ethanol, some additional 100 million hectares of forest would disappear due to agricultural land expansion. A
similar area of traditional forests would be converted to short rotation forest plantations if second generation
technologies were deployed. Under avoided deforestation scenarios, the study finds that a carbon tax of US$
15 per ton of CO2 would be necessary to prevent deforestation induced by biofuels expansion.
The following table shows the 5 biofuels policy shock scenarios chosen for further analysis. These five biofuels policy shock scenarios were chosen based on a variety of different trends, technological developments and potential policies currently discussed in the international arena.

63
Table 3.1 5 biofuels policy shock scenarios for further analysis
Scenario name Description
Baseline POLES scenario for Copenhagen communication: 8.3 % of biofuels in total
transport energy in 2030
Portfolio (BIOF1) BIOF1 = 15% share of biofuels in total transport energy in 2030 in the form of a
mix of all three types of biofuels (1st generation biodiesel and ethanol and 2nd
generation bioethanol).
Ethanol (BIOF2) BIOF2 = 15% share of biofuels in total transport energy in the form of 1st
generation ethanol only in 2030.
Biodiesel (BIOF3) BIOF3 = 15% share of biofuels in total transport energy in the form of 1st
generation biodiesel only in 2030.
First generation (BIOF4) BIOF4 = 15% share of biofuels in total transport energy in 2030 from 1st
generation (mix of biodiesel and bioethanol) only.
Second generation (BIOF5) BIOF5 = 15% share of biofuels in total transport energy in 2030 from 2nd
generation only.
The following table shows the various levels of contributions of ethanol and biodiesel as well as second generation biofuels for the baseline as well as the 5 policy shock scenarios31.
Table 3.2 Overview of total production of biofuels in the European Union – baseline and 5 scenarios
(1000 GJ) Ethanol (1st G) Biodiesel (1st G) 2nd generation biofuels TOTAL
BASE EU27p 184,319 552,958 881,978 1,619,255
BIOF1 EU27p 504,105 1,512,314 864,180 2,880,599
BIOF2 EU27p 2,880,599 0 0 2,880,599
BIOF3 EU27p 0 2,880,599 0 2,880,599
BIOF4 EU27p 720,150 2,160,449 0 2,880,599
BIOF5 EU27p 0 0 2,880,599 2,880,599
[Source: IIASA]
Some model assumptions relevant for the biofuels scenarios On the supply side, we make a conservative assumption of zero autonomous technological progress in crop yield improvement. Indeed, autonomous technological progress refers to two counter-veiling processes influencing yield potentials. On the one hand, genetic breeding techniques lead to increases to the growth potential of crops. On the other hand, soil fertility is declining due to unsustainable management practice, to weather extremes causing crop outages and to pests and diseases becoming more prominent. On the contrary, induced technological progress, defined in terms of efficiency improvements obtained by switching to better crop management practices, is
31 The POLES scenario does not explicitly provide a split between bioethanol and biodiesel. However, the split of 75% biodiesel
and 15% bioethanol (= spread in 2007) can still be assumed and modelled under the above described scenarios in GLOBIOM.

Final Report 64
modelled in great detail. Endogenous switches between rainfed and irrigated agriculture and several levels of fertilizer applications cause the average yield to still increase substantially in developing countries due to increasing commodity prices for agricultural and forest products. This also implies that, because several crop management systems are represented, and endogenous switches between rainfed and irrigated agriculture are allowed in the model, the average yield is still sensitive to the market signals. (we refer to Annex section 6.2.5 for more details) Additionally, the model and its scenario runs – assuming that biodiesel is produced locally - excludes interregional trade of biofuels (biodiesel and bioethanol) whereas it takes into account the trade in primary biofuels inputs (e.g. palm oil) and therefore gives a preference to locally produced biofuels. This indirect trade barrier better reflects the current reality on the EU biofuels market where, to a large extent, because of current and past support and market protection, domestically produced biofuels prevail.32 This assumption also reflects better current physical realities on the biodiesel market, while gasoline biofuels substitutes are imported in different grades of ethanol receiving differential custom duties per unit of energy. Furthermore, the model assumes that additional cropland can only be gained from currently forested land. This assumption reflects a pessimistic view on the availability of other land types, such as grasslands for cropland conversion. The question of land reserves for cropland expansion is a strongly debated topic and this study applied a conservative assumption in this respect.33 This assumption was made for the following reasons:
� There is anecdotal evidence that other land than forest land is usually occupied by some use and some formal or informal ownership is established, which raises the cost of cropland expansion into these other land categories. Thus, the basic economics point at a high share of cropland expansion at the cost of forest land.
� To test this hypothesis the model would have to be dynamically calibrated to a
historical land cover change matrix. But the latter one is not available in reasonable quality yet to fully test the validity of this hypothesis. However, from our static calibration results there is indication of a strong validity of this hypothesis in many parts of the tropical belt. Further research and basic data collection is needed to inform such analysis.
32 A detailed representation of specific trade barriers in the modelling framework is possible, requires however (1) the acquisition
of very detailed data, (2) substantial work to include this information into GLOBIOM, which is something we will certainly do in future projects planned for 2010 and are willing to share, when ready, with DGENV.
33 A detailed sensitivity analysis on different reserve land assessments and their impact on deforestation are presented in Havlik et al. (forthcoming). Indeed, there seems to be high uncertainty about the past and future conversion matrix. For example, Searchninger et al. (2008), based on calculations using mainly FAO data, estimate that about 80 % of the new cropland in Brazil comes from forests. We want to remind that, because of the overall biofuels scenarios implemented in the baseline,
there is not only pressure on expansion of cropland, but also on short rotation plantations. Short rotation plantations are allowed to expand both in cropland and in grassland. Hence, there is an arbitrage whether short rotation tree plantations
will go on current cropland and move it further into forests, thus creating deforestation, or whether the cropland will stay in place, reducing deforestation, and short rotation tree plantations will go in majority to grassland. Hence, there is not a one to one relationship between cropland expansion and deforestation.

65
Finally, it has to be noted that co-products are included in the analysis of biofuels scenarios. Due to the nature of the model structure, which does not yet contain a flexible representation of different animal species, but a rather fixed aggregate of animal calories with fixed predefined feed ratios only differentiated by country, we decided to implement an approach similar to the one used for the Gallagher review (Gallagher, E. 2008; CE Delft, 2008). This means that the substitution ratios (tonne of co-product / tonne of feedstuff) are defined exogenously to the model and kept constant over the simulations. The co-products yields per unit of crop feedstock utilized in biofuels production are displayed in Table 3.3.34
Table 3.3 Amounts of co-products per unit of crop feedstock for biofuels production
Crop Amounts of co-products per unit of crop
feedstock for biofuels production
Wheat 0.323
Soy 0.83
Corn 0.30
Palm 0.02
Rapeseed 0.57
[Source: CE Delft, 2008]
The Land Use Change saving effect calculated in GLOBIOM does not capture fully the additional oil production, e.g. from palm necessary to substitute for the reduced soy oil production due to substitution of soy cake by other co-products. This is because of the model structure which represents final demand for oil in soybean equivalents. However the Ecofys support document to the Gallagher review, assuming that this additionally needed oil would come from palm, calculated that the difference between the “gross” land saving due to co-products – without additional oil production – and “net” land saving – fully accounting for the additional oil production – is about 10%. (Dehue and Hettinga, 2008). The calculations carried out for this current study underestimate thus the Land Use Change effect. Hence, the ‘with’ and ‘without’ co-products storylines provide the extreme bounds of the entire spectrum of possible deforestation levels: without co-products, deforestation is higher, with co-products, deforestation is lower (we refer to Annex section 8.1 for detailed information on the sensitivity analysis).
34 The values are taken from CE Delft supporting material to the Gallagher review (Croezen H. and Brouwer, F. 2008). The
calculation methodology in order to define substitution ratios is also extensively explained in the CE Delft supporting document ((Croezen H., Brouwer, F. 2008).

Final Report 66
3.2.3 Policy shock area 2: change in wood demand
Narrative storyline for the two wood demand policy shock scenarios
Under this policy shock scenario wood demand will increase by 15% and by 25% by 2030 (2 scenarios).
Increased demand for wood and wood products ranging from sawn wood to paper grades will be formulated as
an additional external demand shock. We will increase the overall demand for wood in 2020 by 10% (and then
by 15% in 2030 for the first wood scenario and by 25% in 2030 for the second wood scenario) compared to the
baseline. This demand shock can be interpreted as additional demand due to changes in lifestyle patterns
(e.g. middle income cohort preferring wood furniture of competing products in these countries) beyond the
BAU scenario.
Indeed, wood demand will be stimulated from three perspectives by 2030, not taking illegal logging into
account. Firstly, the fuel wood consumption of a growing population is likely to increase demand. Secondly, the
commercial demand for wood is likely to increase as a growing population, especially in developing and
emerging countries, will rely on wood as a construction material and hence increase commercial logging.
Thirdly, wood is likely to play an increasingly important role in national renewable energy strategies. On a
global scale, the assumptions of 15% and 25% increase in wood demand by 2030 display a reasonable
synthesis of overarching developments in past and present.
The additional demand for wood by 2030, in one policy shock 15% more, in another 25% more, will also imply
an increase in sustainable wood farming measures. It is expected that, by 2030, increasing amounts of wood
will be supplied by sustainable wood farming.
The GLOBIOM version implemented for scenario analysis in this study does not consider forest degradation processes mostly due to the fact that reliable data is not available on this particular issue. It should be noted that in the scenarios analysed it is assumed that the wood from forest conversion to agriculture is not used (slash-and-burn) by the forest industry. Instead wood supply stems from “sustainable” harvests only. The sustainable harvest corresponds to the mean annual increment within a simulation unit. This means that increased demand for wood will - in GLOBIOM - lead to conversion of unmanaged forest to managed forest, but not to deforestation per se. Sustainable forest management is defined by a simple rule that in a particular region the biomass removal in terms of harvest is not allowed to be above the current mean annual increment. This leads to the effect that increased wood demand adds additional value to managed forests compared to agriculture and, thus, may rather slow down deforestation. These assumptions could in theory also be replaced by assumptions of wood supply being based on forest management systems that lead to forest degradation such as high-grading stands for only a few high value timber trees. In our analysis for this study, however, we stayed away from an analysis of degradation. Thus, also in GLOBIOM scenarios we intentionally avoided an assessment of degradation. First, because no reliable statistics of degradation are available and second, there is still no convincing definition of degradation available which finally could be measured with sufficient certainty.35 35 Comment: European Forestry has to be careful as large scale clear cutting operations in e.g. Skandinavia could be
interpreted as forest degradation or "Plenterwald" single tree cuttings could be interpreted as high grading although such
Silvicultural operation are considered as sustainable semi-natural forest management. At the current state of knowledge and information on tropical degradation studies like ours should take a conservative approach. In a pure scientific report work, speculation of degradation would be more appropriate.

67
3.2.4 Policy shock area 3: change in demand for meat
Narrative storyline for the meat demand policy shock scenario
Under this policy shock scenario the global demand for meat will increase by 15% by 2030.
An increase of 15% in global demand for meat by 2030 can be justified by the proven fact that increasing
economic prosperity and societal wealth changes daily diet patterns in favour of meat.
Especially the growing population in the four BRIC countries will enhance the demand for meat. Combined
with the prosperous economic development and increasing purchasing power among many in these countries,
the daily diet will shift towards including a larger share of meat. New breeding methods and genetically
“improved” cattle in some countries may also lead to larger meat potential and lower prices – which will make
meat affordable for lower income classes as well.
Similar to the demand shocks in wood products consumption this demand shock in meat consumption can be
interpreted as additional lifestyle changes of particular population cohorts or changes in cultural habits, such
as changes in traditionally more vegetarian diets of the Indian population shifting to meat consumption.
To measure the effect of increased demand for meat, an overall increase of 10% in demand for meat compared to baseline will be introduced in the model for 2020 (15% for 2030). It should be noted here that in the current version of the model only demand for forage crops is represented, hence an increase in livestock production is not linked to increased grassland demand. This link would put additional pressure on deforestation in the meat shock scenarios.
3.2.5 Policy shock area 4: dual increases in demand for meat and 1st generation biofuels
Narrative storyline for the dual meat and 1st generation biofuels policy shock scenario
Under this policy shock scenario, the above described policy shock for increasing meat demand will be
modelled in combination with a policy shock of 1st generation biofuels use increase (BIOF4).
The underlying assumptions for an increase in global meat demand as well as the rising use of biofuels have
been elaborated upon in depth in the respective narrative storylines. As these developments are likely to
occur simultaneously, this storyline unites the two.
By 2030, increasing economic prosperity and societal wealth changes daily diet patterns in favour of meat on
the one hand. On the other hand, the increasing global demand for transportation services will boost the
production of biofuels further. As space is limited in densely populated developed countries, the production of
biofuels and meat will mainly take place in developing countries and emerging economies in the southern
hemisphere.

Final Report 68
To measure the effect of increased demand for meat and biofuels from 1st generation feedstock, a combined increase of 10% in demand for meat will be introduced in the model for 2020 (15% for 2030) as well as 15% share of biofuels in total transport energy in the form of 1st generation biodiesel only by 2030.
3.2.6 Policy shock area 5: infrastructure development
Narrative storyline for the infrastructure policy shock scenario
Under this policy shock scenario, the transportation costs will decrease by 10% in emerging economies and
5% in developing regions by 2030 compared to baseline (cf Annex A and Annex C). The 5% decrease will also
be modelled on a geographic explicit level for the Congo Basin case study.
As global trade will surpass the current economic and financial crisis, the need for extended, improved and
cost-effective infrastructure will lead to public and private investments in this area. Emerging and developing
countries will build new roads, railroads, and in particular cases harbours and airports. This will be done for
two particular reasons: Firstly, in order to actively participate and benefit from global trade flows, countries
need to provide the relevant infrastructure. Secondly, in order to be prepared for international competition and
attractive for foreign direct investments, countries need to aim at creating an advantage of location compared
to competing countries. By striving to provide a good investment environment and accessing remote regions,
the infrastructure will be improved in terms of efficiency and effectiveness. By 2030, travel time and distances
will be cut shorter – at the cost of land availability but at the profit of land accessibility.
Differences across regions and economies (a 10% cost decrease in emerging economies and 5% in
developing regions) can be justified by scale effects in infrastructure investments in emerging economies
which will pay off by 2030. This implicates that the infrastructure in emerging economies has already been
improving in the recent past and present. The cost-benefit ratio of future investments will be much more
positive as the cost-intensive investments have already been made. The picture is different in developing
countries. As the state of the infrastructure is not developed to great extent, large initial investments will have
to be taken in order to build and improve the infrastructure needed in order to cut costs.
Under this policy shock scenario, infrastructure is improving in developing countries and especially in emerging economies. We will simulate a 10% decrease in emerging regions’ transportation costs, and a 5% decrease in developing regions’ transportation costs and analyze the resulting changes in terms of deforested area. The BRIC countries will represent the emerging regions while all remaining non-OECD countries will represent the developing regions. It can be expected that an improved infrastructure will cause additional deforestation as additional transport possibilities provide better access to remote areas which open the path for further agricultural use.

69
3.2.7 Policy shock area 6: improved biodiversity protection
Narrative storyline for the biodiversity policy shock scenario
Under this policy shock scenario, areas under protection for biodiversity purposes will increase by 20% by
2030 as compared to the baseline (consisting of maintaining the current 10% of land area of all types of
ecosystems protected to 2030)
During the next few years, a rapid and drastic loss of biodiversity will be scientifically observed and proven
around the world. This loss and its corresponding negative implications for large ecosystems and partly the
human environment will lead to an international agreement on the protection of biodiversity putting forward
clear targets for increasing protected areas by 2030.
Furthermore, the inter-connected link between biodiversity loss and climate change becomes more obvious
and will contribute to policies in favour of biodiversity protection. By 2030, biodiversity policies will become
much more institutionalised and effective by having left the niche of preservation policy. Biodiversity concerns
will be much more integrated in working mechanisms of states, businesses and societies.
In addition, important pressures on biodiversity, such as climate impacts, chemicals, fragmentation of land,
biological pollution and the overuse of biological resources will be addressed in separate policies in the light of
reducing climate change impacts and indirectly increase the protection of biodiversity.
The policy shocks will consist of a 15% increase in protected areas worldwide by 2020, 20 % increase by 2030 as compared to the baseline (consisting of the currently 10% of land area of all types of ecosystems maintaining its protection in 2030). This scenario is based on a WCMC product on modelled new conservation areas, and hence made geographically explicit for the Congo Basin case study. The WCMC product for 2050 models a 20% increase in protected areas. This output will be used as geographic explicit input for our 2030 model runs as the WCMC figures for 2030 do not model a drastic change in protected areas.

Final Report 70
3.2.8 Policy shock area 7: governance development and other policy factors
Narrative storyline for the governance policy shock scenario
Under this policy shock scenario 2 options, constant and changing governance are considered for the
geographic explicit case study, the Congo Basin. The constant governance option displays the baseline
assumption.
Good governance will receive more attention in the global agenda to reduce deforestation. As deforestation is
especially high in regions where governance is weak, it presents an underlying cause of deforestation and
forest degradation.
Governance efforts may stagnate on a low level in the geographic explicit case study, which is the Congo
Basin, until 2030. The unwillingness of many corrupt governments and businesses to grapple with the causes
of deforestation will continue until 2030 and result in ineffective attempts to protect the public goods value of
forests, resulting in a deepening of the deforestation crisis.
On the other hand, governments may also realise that paying people to protect forests can be an effective way
to tackle deforestation and climate change but only if there is good governance of natural resources in place.
In the geographic explicit case study region, international institutions will help national governments to wisely
spend money on improving forest governance, institutions and policies at local, regional and national levels.
The rate of good governance will increase by 2030 and be effective, and equitable measures for REDD will be
implemented and will also bring crucial co-benefits including poverty alleviation and biodiversity conservation.
A low hurdle rate of deforestation means that deforestation can occur more easily when there are changes in the basic drivers. Increasing the hurdle rate would mimic an increase in the transaction cost to deforest due to better governance provisions. In case of better governance we will expect less deforestation. The following governance policy shock will be conducted in addition to the baseline assumption which assumes constant governance:
� Let governance, i.e. hurdle rates, converge linearly to a weighted global average over time; thus meaning improved governance and less deforestation.
A direct interpretation of which governance quality is changed exactly (illegal logging, corruption of government officials to give out concessions at below market price, etc.) will not be possible using this approach.
3.3 Short description of the modelling framework
As depicted in Figure 3.1, the above described baseline and policy shock scenarios are then fed into two models – GLOBIOM and/or G4M – to yield the modelling results for future deforestation levels and implications for associated marginal costs of avoiding deforestation. While Section 6.2 (insight into the modelling process) and Chapter 7 (GLOBIOM additional information) provide detailed information on the models and the modelling process, this section briefly introduces the two models and their main functions.

71
GLOBIOM GLOBIOM is a global recursive dynamic partial equilibrium model integrating the agricultural, bioenergy and forestry sectors with the aim to give policy advice on global issues concerning land use competition between the major land-based production sectors. Concept and structure of GLOBIOM are similar to the US Agricultural Sector and Mitigation of Greenhouse Gas (ASMGHG) model (Schneider, McCarl and Schmid 2007). The market is represented through product supply functions which are detailed, geographically explicit and mathematically expressed via Leontief production functions. Resource supply is expressed through general supply functions without detailed geographic information used (only water supply is currently represented in this way). Product demand functions are used to represent aggregate consumer behaviour via exogenous demand shifters depending on GDP and population development and price elasticity in order to capture demand changes induced by commodity price changes. In what follows we will present the model along Figure 6.8, where not only the product chains but also the land use change options are represented. The model directly represents production from three major land cover types: cropland, managed forest, and short rotation tree plantations.36 GLOBIOM is used in this study to model the future effects – in terms of hectares of deforestation – of the chosen policy shock scenarios. Results are expressed in hectares deforested on a global level as well as per region (Latin America & Caribbean, Sub-Saharan Africa, Pacific Asia). G4M As a second model, G4M is utilised to run the geo-graphic explicit case studies for the Congo basin. The model allows the global GLOBIOM results to be translated into geo-graphic explicit, mapped results for the Congo basin. The G4M estimates the annual above ground wood growth and harvesting costs. It keeps track of the above ground forest biomass. By comparing the income of managed forest (difference of wood price and harvesting costs, income by storing carbon in forests) with income by alternative land use at the same location (i.e. agriculture), the decision of afforestation or deforestation is made. As G4M is spatially explicit (currently on a 0.5°x0.5° resolution) the different deforestation pressures at the forest frontier can also be handled. Growth is determined by a potential National Protection Plan (NPP) map. At present this NPP map is static but can be changed to a dynamic NPP model which reacts to changes of temperature, precipitation, radiation or CO2 concentration. Main forest management options are species selection, application of thinning and choice of rotation time.
36 Grassland production is so far represented only indirectly without explicit linkage with livestock feed requirements. Work is
going on to improve on this aspect in the next version of the model.

Final Report 72
The model can use external information (like wood prices, prescribed land-use change) from other models or data bases (such as GLOBIOM), which guarantee food security and land for urban development or account for disturbances. As outputs, G4M produces forecasts of land-use change, carbon sequestration/emissions in forests, impacts of carbon incentives (e.g., avoided deforestation), and supply of biomass for bio-energy and timber. Methodology for translating deforested area outputs into costs of avoided deforestation Shock scenarios are carried out with GLOBIOM model, which considers only drivers of deforestation coming from agriculture or bioenergy production. We consider that the model operates under fixed total land constraint and decides about the land use depending on the profitability of different activities in particular Simulation Units. Deforestation itself is costly and the model would not do it if it is not profitable (the income which comes from the deforested land must be higher than the cost of deforestation). The cost of avoiding deforestation is therefore equal to the difference between the cost of deforestation itself and the future income from agricultural production (opportunity cost). Marginal cost is the cost of the last (most costly) unit of deforestation avoided, here expressed in US $/ ton of CO2. Technically, the marginal cost of reducing CO2 from deforestation is calculated so that there is a constraint in the model on the quantities of CO2 that may be emitted – e.g. 50% of the baseline (corresponding to a policy goal for instance). The marginal cost is then obtained as the dual value of this constraint. However, it should be highlighted that the constraint is varied between 0% and 90/100% in order to construct the RED supply schedule; thus we do not choose a single constraint level.

73
4 Modelled changes in deforestation levels and associated marginal costs of avoided deforestation
This chapter presents the modelling results for the previously developed and described policy shock scenarios. Section 4.1 presents deforestation levels under 10 different policy shock scenarios (five biofuels scenarios, two wood scenarios, one meat and one infrastructure scenario as well as one scenario combining one of the two wood scenarios with the meat scenario). As a first step, the projected future deforested area (in hectares) is presented under the baseline as well as under the effects of the 10 policy shock scenarios. Results are analysed on a global scale as well as for the three deforestation hotspots (Latin America and the Caribbean, Sub-Saharan Africa and Pacific Asia). In a second step, the marginal costs of reaching the 2020 and 2030 EU policy goals on deforestation37 are then calculated so that a “marginal cost” can be attributed to each of the 10 policy shock scenarios (drivers). This element, which determines the level of avoided deforestation, is the price which is paid for one tonne of carbon saved due to avoided deforestation. In order to conduct an alternative analysis of results and implications, the different policy shock scenarios were modelled under three different baselines – or business-as-usual (BAU) - assumptions. The core analysis presented in this chapter considers co-products but does not include autonomous yield growth. The detailed findings of a pessimistic BAU baseline, not taking into account co-products, and an optimistic BAU scenario, taking into account co-products and an autonomous yield growth of 1% per year are presented in Annex section 8.1. Next, results for the geographic-explicit infrastructure, biodiversity and governance policy shock scenarios are presented in separate sections (4.2, 4.3 and 4.4, respectively). Under these policy shocks, results depict the effect of expanded infrastructure, increased biodiversity protection and changing/improving governance on deforestation in the Congo Basin countries: Gabon, Equatorial Guinea, Democratic Republic of Congo, Republic of Congo, Central African Republic and Cameroon.
37 The European Union has put forward a policy goal of halting global forest cover loss by 2030 at the latest and to reduce gross
tropical deforestation by at least 50 % by 2020.

Final Report 74
4.1 Deforestation levels under different policy shock scenarios
This section presents the results and implications of the 10 modelled policy shock scenarios in terms of their effects on the total deforested area in million hectares without REDD measures from 2020 to 2030. First, Figure 4.1 provides an overview of the deforested area without REDD measures between 2020 and 2030 in million hectares (Mha) on a global level. In order to compare the scenario effects against the business as usual scenario, a red line displays the baseline (core baseline: with co-products but without autonomous yield growth).
Figure 4.1 Global deforested area without REDD under various policy shock scenarios between 2020-2030 (Mha)
80,76
72,1
98,13
87,58
66,27 65,65
92,6
102,9
70,62
62,64
67,32
0
10
20
30
40
50
60
70
80
90
100
110
BIOF1 BIOF2 BIOF3 BIOF4 BIOF5 WOOD15 WOOD25 MEAT BIOFMT INFRA
Scenario
Mha
Baseline BIOF1 = 15% share of biofuels in total transport energy in the form of a mix of all three types of biofuels (1st generation biodiesel
and ethanol and 2nd generation bioethanol). BIOF2 = 15% share of biofuels in total transport energy in the form of 1st generation ethanol only in 2030. BIOF3 = 15% share of biofuels in total transport energy in the form of 1st generation biodiesel only in 2030.
BIOF4 = 15% share biofuels in total transport energy in 2030 from 1st generation (mix of biodiesel and bioethanol) only. BIOF5 = 15% share of biofuels in total transport energy in 2030 from 2nd generation only. WOOD15 = Overall additional increase of 10% in demand for wood in 2020 and 15% in 2030 WOOD25 = Overall additional increase of 10% in demand for wood in 2020 and 25% in 2030 MEAT = Overall additional increase of 10% in demand for meat in 2020 and 15% in 2030 BIOFMT = Equivalent to a dual shock of BIOF3 and MEAT INFRA = Transportation costs will decrease by 10% in emerging economies and 5% in developing regions by 2030. [Source: IIASA]
The figure clearly shows that a variety of scenarios lead to increased deforestation around the globe when compared to the baseline, whereas only two policy shocks clearly reduce deforestation compared to the baseline and one further policy shock (WOOD15) resembles the baseline to a large extent. The following figure expresses the modelling results in terms of percent change of deforested area per policy shock scenario compared to the baseline.

75
Figure 4.2 Percent change (compared to baseline) of global deforested area without REDD under various policy shock
scenarios between 2020 and 2030
19,96
7,1
45,77
30,1
-1,56 -2,48
37,55
52,85
4,9
-6,95-10
0
10
20
30
40
50
60
BIOF1 BIOF2 BIOF3 BIOF4 BIOF5 WOOD15 WOOD25 MEAT BIOFMT INFRA
Scenario
Percent %
BIOF1 = 15% share of biofuels in total transport energy in the form of a mix of all three types of biofuels (1st generation biodiesel
and ethanol and 2nd generation bioethanol). BIOF2 = 15% share of biofuels in total transport energy in the form of 1st generation ethanol only in 2030.
BIOF3 = 15% share of biofuels in total transport energy in the form of 1st generation biodiesel only in 2030. BIOF4 = 15% share biofuels in total transport energy in 2030 from 1st generation (mix of biodiesel and bioethanol) only. BIOF5 = 15% share of biofuels in total transport energy in 2030 from 2nd generation only. WOOD15 = Overall additional increase of 10% in demand for wood in 2020 and 15% in 2030 WOOD25 = Overall additional increase of 10% in demand for wood in 2020 and 25% in 2030 MEAT = Overall additional increase of 10% in demand for meat in 2020 and 15% in 2030 BIOFMT = Equivalent to a dual shock of BIOF3 and MEAT INFRA = Transportation costs will decrease by 10% in emerging economies and 5% in developing regions by 2030. [Source: IIASA]
Shocks triggering high deforestation levels If the dual policy shock scenario of simultaenously increasing meat demand and first generation biodiesel production for transport energy (BIOFMT - a combination of BIOF3 and MEAT) would become reality, approximately 53% (or 35.58 million hectares) more area would be deforested between 2020 and 2030 compared to deforestation levels under the baseline. Similar negative effects would occur if either of these two policy shocks would occur (46% and 37% additional deforestation respectively), or also an increase of mixed first generation biofuels (biodiesel and bioethanol) in transport (BIOF4) leading to an additional 30% of deforestation, or even an increase of mixed first and second generation biofuels in transport (BIOF1) leading to an additional 20% of deforestation compared to baseline. Shocks delivering deforestation levels comparable to the baseline If, on a global scale, policies promoting a legal and economic framework in favour of promoting first generation bioethanol (only) use in transport (BIOF2) or promoting infrastructure development (INFRA) would be applied, deforestation would still increase compared to the baseline (7% and 5% additional deforestation respectively); but not as significantly as under the previously discussed scenarios. This does not however imply

Final Report 76
that the infrastructure (INFRA) and biofuels scenario (BIOF2) could be considered as environmentally friendly as deforestation would still increase but not in as large figures as for the before-mentioned policy shock scenarios. Shocks yielding reduced deforestation Policies inducing increased wood demand (both WOOD15 and WOOD25) would result in slightly less deforestation in terms of millions of hectares deforested than the BAU baseline (1.5 – 2.5% less deforested area). This positive outcome appears counter-intuitive at first. However, the model specifications considered that all additional wood demand will be satisfied from sustainable harvests. Therefore sustainable forest management would slightly reduce or at least balance out the deforestation level of the baseline. It remains to be seen whether such an assumption would be feasible in a real forest management and wood production environment. The most beneficial policy shock with regard to avoided deforestation, however, is an increase of 2nd generation (only) biofuels (BIOF5). This policy shock would deliver additional avoided deforestation of almost 5 million hectares (or a 7% reduction in deforestation levels) compared to the BAU baseline. This may seem rather counter-intuitive but can be explained by the fact that, in GLOBIOM plantations producing biomass for second generation biomass indirectly cause deforestation because plantations expand into cropland and move the latter into forests. However, the increased demand for wood, from all sources including traditional forests, increases the value of forests with respect to BAU. This, in turn, increases forests’ competitiveness in the competition for land vis-à-vis agricultural activities. As a final consequence agriculture intensifies with the result that less forests are permanently cleared as they become more valuable due to their wood production service.
4.1.1 Regional deforestation implications of the policy shock scenarios
Moving from this global overview to a regional analysis of results, Table 4.1 displays the deforested area without REDD between 2020 and 2030 in million hectares for the three hotspot regions.

77
Table 4.1 Deforested area without REDD between 2020-2030 in Mha and for various policy shock scenarios
Baseline BIOF1 BIOF2 BIOF3 BIOF4 BIOF5
WOOD
15
WOOD
25 MEAT BIOFMT INFRA
Sub-Saharan Africa 6.48 6.48 6.48 7.91 7.43 6.13 6.45 6.36 7.41 8.41 6.27
Other Pacific Asia 11.58 12.96 12.34 16.23 14.34 10.95 10.60 9.97 14.94 17.49 11.31
Latin America 49.26 61.32 53.27 73.99 65.81 45.56 49.21 49.32 70.25 76.99 53.04
BIOF1 = 15% share of biofuels in total transport energy in the form of a mix of all three types of biofuels (1st generation biodiesel
and ethanol and 2nd generation bioethanol).
BIOF2 = 15% share of biofuels in total transport energy in the form of 1st generation ethanol only in 2030. BIOF3 = 15% share of biofuels in total transport energy in the form of 1st generation biodiesel only in 2030.
BIOF4 = 15% share biofuels in total transport energy in 2030 from 1st generation (mix of biodiesel and bioethanol) only. BIOF5 = 15% share of biofuels in total transport energy in 2030 from 2nd generation only.
WOOD15 = Overall additional increase of 10% in demand for wood in 2020 and 15% in 2030 WOOD25 = Overall additional increase of 10% in demand for wood in 2020 and 25% in 2030 MEAT = Overall additional increase of 10% in demand for meat in 2020 and 15% in 2030 BIOFMT = Equivalent to a dual shock of BIOF3 and MEAT INFRA = Transportation costs will decrease by 10% in emerging economies and 5% in developing regions by 2030.
[Source: IIASA]
These total figures on a regional level can also be expressed as percent change compared to the baseline (Figure 4.3).
Figure 4.3 Impact of policy shock scenarios on deforested area without REDD between 2020-2030 compared to baseline
(in % change compared to the baseline)
[Source: IIASA]

Final Report 78
When reviewing the differences of scenario impacts as percent changes from the baseline, it becomes clear that results vary considerably across scenarios as well as across regions and can be interpreted under a variety of different aspects. Under all modelled futures (baseline and policy shocks), Latin America and the Caribbean region faces by far the largest degree of deforestation between 2020 and 2030 (ranging from -8% to +56% additional deforestation compared to the baseline depending on the scenario), followed by the Pacific Asia region (ranging from -14% to +51% additional deforestation compared to the baseline) and Sub-Saharan Africa (ranging from -5% to +30% additional deforestation compared to the baseline). Regional analysis of best and worst case policy shock scenarios In all three regions, policies resulting in a combination of increased meat demand and increased biofuels usage in transport from 1st generation biodiesel (only) (BIOMT) would clearly cause the largest degree of additional deforestation. While the greater intensity of a combined shock is naturally higher than any of the single shocks, a dual shock was included to offer a better idea on the types of impacts that most likely resemble reality. Most of the analysed policy shocks are unlikely to occur in an isolated manner.
� In Latin America and the Caribbean, this worst case policy shock combination could imply ca. 56% more deforested area than under the baseline scenario.
� In Pacific Asia this demand shock combination would likely lead to ca. 51% more deforestation than under the baseline scenario.
� In Sub-Saharan Africa the implications of the combined demand shock scenario are relatively less stark than in the other two regions, but would still imply an increase of deforestation of ca. 30% compared to the baseline.
Results furthermore show that different policy incentives would be needed in different regions in order to pursue optimal policies for avoiding deforestation.
� In Latin America and the Caribbean, policy measures leading to 2nd generation biofuels use (only) in transportation (BIOF5) represent the largest possible avoided deforestation opportunity. This could result in approximately 8% less deforestation compared to the baseline.
� The same argument holds true for Sub-Saharan Africa, where such a policy shock could reduce deforestation by up to 5% compared to the baseline.
� The situation differs in Pacific Asia. In this region, policies should strive toward promoting sustainable wood production (WOOD 25). Under this policy shock scenario, the region could avoid up to 14% deforestation between 2020 and 2030 than under the baseline scenario.
Table 4.2 ranks the different policy shock scenarios from worst to best case outcome for avoided deforestation in the three hotspot regions.

79
Table 4.2 Indexed sequence of scenario policy shock ranking amongst selected regions
Worst case
10th 9th 8th 7th 6th 5th 4th 3rd 2nd
Best case
1st
Sub-Saharan Africa BIOFMT BIOF3 BIOF4 MEAT BIOF1 BIOF2 WOOD15 WOOD25 INFRA BIOF5
Pacific Asia BIOFMT BIOF3 MEAT BIOF4 BIOF1 BIOF2 INFRA BIOF5 WOOD15 WOOD25
Latin America BIOFMT BIOF3 MEAT BIOF4 BIOF1 BIOF2 INFRA WOOD25 WOOD15 BIOF5
[Source: ECORYS]
The most striking inter-regional difference - not yet mentioned above - is:
• The meat demand policy shock scenario (MEAT) ranks 8th in Latin America and the Caribbean, causing additional deforestation level of 70,25 Mha, as well as in Pacific Asia, causing a deforestation level of 14,94 Mha, whereas it causes relatively less harm (7th rank) in Sub-Saharan Africa where it only leads to a deforestation level of 7,41 Mha. The picture as far as the ranking is concerned is exactly reversed with regards to the 1st generation mixed bioethanol and biodiesel demand policy shock scenario (BIOF4). In terms of total deforested area, as seen above, the levels are of course higher in Latin America and the Caribbean as well as in Pacific Asia than in Sub-Saharan Africa.
From this comparison, the following conclusions on a regional level can be drawn:
Overarching policies promoting the use of 1st generation biofuels (including a mixture of biodiesel and
bioethanol) and meat production should be avoided in all three observed regions.
In Pacific Asia, policy-makers should strive to promote sustainable forest management and harvests in order to
avoid additional deforestation. For Sub-Saharan Africa and Latin America / Caribbean, the worldwide
promotion and use of 2nd generation biofuels could reduce deforestation.
4.1.2 Associated costs of avoided deforestation under different policy shock scenarios
After the implications of different policy shock scenarios in terms of deforested area have been presented and described above, this section provides insights in the marginal costs (in 2005 US$) associated with the different levels of avoided deforestation. The methodology for translating deforested area into costs of avoided deforestation is the following: Shock scenarios are carried out with GLOBIOM model, which considers only drivers of deforestation coming from agriculture or bioenergy production. We consider that the model operates under fixed total land constraint and decides about the land use depending on the profitability of different activities in particular Simulation Units (simulation unit is a spatially explicit object, whose size varies between 10x10 and 50x50 km depending on its heterogeneity with respect to altitude, slope and soil). Deforestation itself is costly and the model would not do it if it is not profitable (the income which comes from the deforested land must be higher than the cost of deforestation). The cost of avoiding deforestation is thus equal to the difference between the cost of deforestation itself and the future income from agricultural production (opportunity cost). Marginal

Final Report 80
cost is the cost of the last (most costly) unit of deforestation avoided, here expressed in US$ per ton of CO2.
38 Table 4.3 presents the marginal costs of different RED ambition levels for the 10 policy shock scenarios in US$ per tonne of CO2 saved due to avoided deforestation. A classification of different percentages of avoided deforestation is undertaken in order to depict cost developments. RED 0% therefore displays the case where a RED mechanism is not used as a means to avoid deforestation; RED 50% depicts the case where 50% of deforestation is avoided through payments for avoided carbon releases; RED 75% and RED 90% follow the same definition.
Table 4.3 Marginal costs of different RED level under different policy shock scenarios, in US$/tCo2
Scenario
Avoided
deforestation
Baseline BIOF1 BIOF2 BIOF3 BIOF4 BIOF5 WOOD15 WOOD25 MEAT BIOFMT INFRA
RED 0% 2.85 4.98 4.24 8.64 6.62 1.97 2.83 2.62 7.55 10.94 3.58
RED 50% 10.85 13.25 12.54 19.9 17 10.09 10.79 10.79 17.55 23.7 10.95
RED 75% 17.14 20.06 20.25 30.17 25.74 15.6 17.14 17.14 29.51 33.77 17.39
RED 90% 25.02 28.33 28.68 42.19 37.86 23.31 25.02 25.02 42.42 46.78 24.76
BIOF1 = 15% share of biofuels in total transport energy in the form of a mix of all three types of biofuels (1st generation biodiesel and ethanol and 2nd generation bioethanol). BIOF2 = 15% share of biofuels in total transport energy in the form of 1st generation ethanol only in 2030. BIOF3 = 15% share of biofuels in total transport energy in the form of 1st generation biodiesel only in 2030. BIOF4 = 15% share biofuels in total transport energy in 2030 from 1st generation (mix of biodiesel and bioethanol) only. BIOF5 = 15% share of biofuels in total transport energy in 2030 from 2nd generation only. WOOD15 = Overall additional increase of 10% in demand for wood in 2020 and 15% in 2030 WOOD25 = Overall additional increase of 10% in demand for wood in 2020 and 25% in 2030
MEAT = Overall additional increase of 10% in demand for meat in 2020 and 15% in 2030 BIOFMT = Equivalent to a dual shock of BIOF3 and MEAT
INFRA = Transportation costs will decrease by 10% in emerging economies and 5% in developing regions by 2030. [Source: IIASA]
These results are depicted in terms of their cost difference compared to the baseline in Figure 4.4.
38 Technically, the marginal cost of reducing CO2 from deforestation is calculated so that there is a constraint in the model on
the quantities of CO2 that may be emitted – e.g. 50% of the baseline. Depending on the RED scenario, e.g. RED50%
means reduction of global CO2 emissions from deforestation emitted over the same perion in BAU by 50%. The marginal cost is then obtained from the dual value of this constraint multiplied by (1 + DISCOUNT_RATE) / DISCOUNT_RATE, and
hence represents the value of the total incentives necessary to avoid the deforestation forever (or also the value of a tax). Or the net present value of the total future opportunity cost. THIS CONVERSION IS IMPORTANT TO MENTION BECAUSE THE SIMPLE DUAL VALUE AND THE ADJUSTED ONE IS AN ORDER OF MAGNITUDE DIFFERENCE!

81
Figure 4.4 Marginal costs of different RED levels under different policy shock scenarios compared to baseline 2020-2030
-5
0
5
10
15
20
25
US$/tCO2
BIOF1 = 15% share of biofuels in total transport energy in the form of a mix of all three types of biofuels (1st generation biodiesel and ethanol and 2nd generation bioethanol). BIOF2 = 15% share of biofuels in total transport energy in the form of 1st generation ethanol only in 2030. BIOF3 = 15% share of biofuels in total transport energy in the form of 1st generation biodiesel only in 2030. BIOF4 = 15% share biofuels in total transport energy in 2030 from 1st generation (mix of biodiesel and bioethanol) only. BIOF5 = 15% share of biofuels in total transport energy in 2030 from 2nd generation only. WOOD15 = Overall additional increase of 10% in demand for wood in 2020 and 15% in 2030 WOOD25 = Overall additional increase of 10% in demand for wood in 2020 and 25% in 2030
MEAT = Overall additional increase of 10% in demand for meat in 2020 and 15% in 2030 BIOFMT = Equivalent to a dual shock of BIOF3 and MEAT
INFRA = Transportation costs will decrease by 10% in emerging economies and 5% in developing regions by 2030. [Source: IIASA]
This figure shows a rather logical trend: the more stringent the RED target, the more costly it becomes for achieving the target across all policy shock scenarios. The figure also clearly indicates that, apart from the dual shock, and no matter which RED target is chosen, the meat and the 1st generation biodiesel (BIOF3) policy shocks are always the most costly, whereas a 15% share of biofuels in total transport energy in 2030 from 2nd generation biofuels only (BIOF5) is always the least costly option, with signifiantly lower costs than under the baseline. In addition, some more specific statements can be made regarding the costs related to each level of avoided deforestation targets.

Final Report 82
� Under the 0%, 50% and 75% RED implementation case, the policy options of increasing sustainable wood demand (both WOOD15 and WOOD25) would result in lower costs than under the baseline scenario. Once again, these two policy shock scenarios have been modelled with the assumption of all additional wood products stemming from sustainable harvests and therefore the scenarios may not be fully realistic.
� Interestingly, this picture changes slightly under the RED 90% target, where now also the infrastructure policy shock (INFRA) implies smaller costs than under the baseline scenario. This reveals interesting implications. On the one hand infrastructure expansion and improvement creates and additional pressure on deforestation and on the other hand it makes RED implementation more efficient. In the case of 90% RED this efficiency gain even leads to negative costs differences as compared to the baseline case. Efficiency gains here mean less costly shifts to better agricultural production systems due to decreasing transportation costs.39
Furthermore, the variance between most costly and least costly policy shocks under each RED target increases substantially with more stringent targets, hence making the REDD mechanism need for financing not only higher when it becomes more stringent but also less predictable, and therefore making the situation potentially more difficult to implement.40 Estimates of total global costs of avoiding deforestation The estimates of incentive payments necessary to achieve certain RED41 targets are internally calculated by GLOBIOM. They are a function of the RED target imposed as a deforestation constraint. In the model, the carbon price is induced as the dual value of the constraint limiting CO2 emissions from deforestation to the scenario value, e.g. 50% of the emissions over the 2021-2030 compared to the BAU deforestation scenario. As GLOBIOM is a recursive dynamic model, the dual value represents annual marginal costs to achieve a certain RED target. This cost is equal to an annual incentive payment for postponing deforestation by one year. In other words, what is presented in this report as marginal RED cost is equivalent to the value of the incentive payments, mainly to be paid to the agricultural sector to intensify or relocate production, necessary to avoid the deforestation by decreasing land demand for agricultural production. Alternatively, it would be possible to compute a tax equivalent to the incentive payment by integrating the
39 Please note that an effort of finding an optimal REDD cutting point (in terms of % level) goes beyond the scope of this study
and therefore has not been attempted. 40 Under the RED 0% target, the difference between the most costly policy shock (BIOFMT) and the least costly (BIOF5) is US$
8.97 per tonne of CO2. Under the RED 50% target and the RED 75% target, the difference between these shocks increases to US$ 13.61 and US$
18.17 per tonne of CO2, respectively. Finally, under the RED 90% target the difference between the most costly scenario (BIOFMT) and the least costly option
(BIOF5) amounts to US$ 23.47. 41 In GLOBIOM we consider only RED, because of the decision to leave out degradation from the modelling exercise (also see
page 16). Thus, the assumption of sustainable forest management in our RED scenarios conjectures RED(D+) by
assuming 100% implementation of the sustainable forest management part of the D+ part. In principle, GLOBIOM also calculates afforestation for the total wood supply and total landscape GHG budget; however, in the carbon and land
balances indicated in this report the resulting net deforestation balance is not reported in RED++ terms. Thus, when talking in policy terms, the modelled scenarios closely resemble a REDD+ situation assuming the sustainable forest management part is implemented.

83
discounted stream of all future annual payments (see Kindermann et al. 2008 for more details on differences between an incentive and tax scheme).
However, the study does not allow for an estimation of total global costs of avoiding deforestation. The costs presented in this report do not include transaction costs, i.e. are net of transaction costs. In order to calculate the total costs, however, these transaction costs would have to be included. The level of most transaction costs highly depends on the chosen REDD implementation scheme. For example, unit Monitoring, Reporting and Verifying (MRV) costs dramatically decrease if carbon stocks are determined over large areas and by a combination of remote sensing and in-situ measurements (Boettcher et al., 2009). Since this study does not examine the various possibilities for REDD implementation schemes, a calculation of total global costs for avoiding deforestation remains outside of the scope of this study. The transaction costs will depend interalia on whether a stock or flow GHG accounting method is chosen or whether the economic instrument for REDD implementation is set up as a renewable carbon rental contract (tCER type) or permanent REDD contract for carbon conservation, or even as a global or country specific carbon tax. Thus, a mere multiplication of marginal costs by area does not suffice to give at least an idea of a minimum cost of REDD (without implementation costs).
4.1.3 Alternative analyses with different baselines
As a next step, an alternative analyses based on two different baselines was conducted in order to place the results in relation to a more pessimistic and a more optimistic BAU baseline. Whereas the detailed figures of these alternatives are presented in Annex section 8.1, a brief comparative summary follows here. The pessimistic case BAU scenario assumptions considering no co-products and no autonomous yield growth (although a yield growth through changing management is still possible)42 – results in the largest degrees of deforestation, in terms of millions of hectares deforested, as well as in marginal costs of different RED targets. The proportion of regional impacts remains the same as under the analysed BAU assumption throughout this chapter, only causing lower total deforestation (in Mha) in Sub-Saharan Africa than under the presented BAU assumption. The optimistic case BAU scenario assumptions considering an autonomous yield growth of 1% per annum – reveals a significantly lower degree of deforestation, in terms of millions of hectares deforested, as well as in marginal costs of different RED targets. Here again, the 42 Although the current model structure and corresponding co-products representation is very linear – one substitution coefficient
for any total quantity of feed substituted – it is valuable to include this pessimistic scenario for comparison purposes. In reality such linear relation may not hold true: due to the species and production systems structures of the livestock sector,
the substitution coefficients could actually decrease as the total quantity of available co-products increases. This non-linearity of co-products will only be represented in the updated version of the model at some point in the future. Hence, the
‘no co-products’ baseline represents, on the one hand, the worst, albeit unrealistic case, and, on the other hand, also enables a quantification of the importance of the co-products in the system when comparing these results to the baseline including co-products.

Final Report 84
proportion of regional impacts remains the same as under the analysed BAU assumption throughout this chapter. The drastically smaller figures for overall deforestation can be justified by the fact that less land is needed in order to satisfy the demand for crops due to constantly increasing yields. The effects on the different biofuels policy shock scenarios and the meat scenario further underline that finding, as the proportional impact of all biofuels scenarios decreases compared to an increasing impact of the meat policy shock. If an annual yield growth of 1% would be considered, policies in favour of biofuels in general would not have such a large impact as under the other two BAU assumptions because the increasing demand could be partially met by additional yield increases on existing land. On the other hand, it becomes obvious that an annual increase in yields has hardly any impact on the meat policy shock scenario. Policies promoting additional capacities for meat production would enhance deforestation as new land capacities would be needed. This argument is furthermore validated by the model as the impact of the dual policy shock scenario (BIOMT) approaches the impact of the meat policy shock, a clear sign that the biofuels impact within the dual policy shock loses in importance.
4.2 Infrastructure development and implications for deforestation based on market accessibility in the Congo Basin43
The geographic-explicit infrastructure development scenario was built by using market accessibility concepts44 that can explore spatial impacts of transportation network changes. The market accessibility is defined as travel time to the nearest big market (city)45 given, e.g. in hours. The market accessibility was calculated using current infrastructure data in the six Congo Basin countries: Cameroon, Central African Republic, The Democratic Republic of the Congo, Equatorial Guinea, Gabon, and Republic of Congo.46 This baseline of the current infrastructure network is based on roads existing by the year 2000. The infrastructure development scenario then considers only future road networks to examine the impacts of new and improved road networks on the market accessibility. In
43 Clarification: As this geographic-explicit infrastructure scenario concerns the Congo Basin only, marginal costs are also
presented for the Congo Basin only. These costs were calculated by separately constraining emissions from deforestation
in the Congo Basin and in the rest of the world. So the marginal cost is not equal to the global number which is presented for all other scenarios, but instead the Congo Basin number provides a more detailed estimation under the hypothesis that
the proportional reduction is the same in Congo and in the rest of the world. Thus, because of lower productivity of alternative activities to deforestation compared to other hotspot regions, the marginal cost in the Congo Basin is generally
lower. 44 A similar approach has been previously applied by Uchida and Nelson (2009) for the World Bank’s World Development
Report 2009. 45 To arrange the infrastructure development scenario, the market accessibility was calculated to the nearest market (city) with
over 1 million inhabitants. In the scenario, the following 4 cities with a population of over 1 million were considered in the Congo River Basin based on the estimated population in 2000: Kinshasa (Democratic Republic of the Congo); Douala (Cameroon); Brazaville (Republic of Congo); and Yaounde (Cameroon).
46 To estimate market accessibility in the Congo River Basin, a map of current transportation networks (circa the year 2000) including roads, railways and navigable rivers was compiled. Travel speeds were then assigned according to the detailed
transportation categories such as road types (asphalt, unpaved, forest road, logging path, etc.) and single or multiple track railways. In addition, the effect of slope on the travel speed was considered. Afterwards a “cost distance” algorithm was applied to trace minimum pathways and travel time to the nearest markets.

85
the assessment, future railway and navigable river networks are unchanged. Thus the following scenario for the infrastructure development was set up:
� Projected road network based on the new highway corridors proposed by the African Development Bank and improved Trans-African Road Network (Buys et.al., 2006).
Figure 4.5 and Figure 4.6 show the spatial distribution of the current and projected road networks in the Congo River Basin.
Figure 4.5 Current road network (circa 2000) and location of large cities in the Congo River Basin
[Note: 4 cities with a population over one million: Kinshasa (Democratic Republic of the Congo) and Brazaville (Republic of
Congo) are displayed as one metropolitan area; Douala (Cameroon);); and Yaounde (Cameroon).] [Source: IIASA]

Final Report 86
Figure 4.6 Planned road networks (red lines) and location of large cities in the Congo River Basin
[Source: IIASA]
Market accessibility Figure 4.7 and Figure 4.8 highlight the current and projected accessibility to the nearest market (cities with over 1 million inhabitants). The mean market accessibility in the region was estimated at 34.2 hours in the current infrastructure network and at 20.3 hours in the projected network (Simulation Unit level). Thus, the market accessibility to the nearest large cities is expected improve by 13.9 hours after the construction of new road networks.

87
Figure 4.7 Current market accessibility (in hours) to the nearest large cities in the Congo River Basin
[Source: IIASA]
Figure 4.8 Projected market accessibility (in hours) to the nearest large cities in the Congo River Basin
[Source: IIASA]

Final Report 88
Transportation costs Unit transportation costs per tonne have been computed as a function of oil price and labour costs per hour, for each simulation unit in the Congo Basin, using market accessibility information. After the realization of the new corridors in the Congo Basin, the unit transportation cost per tonne has been adjusted proportionally to the change in the number of hours required to access the major cities.
4.2.1 Projected infrastructure development implications for deforestation
The results of the infrastructure scenario in terms of deforestation in millions of hectares, and the associated price of avoiding deforestation in the Congo Basin are provided in the table below. The model is run in 10 year steps. Therefore the baseline is modelled for 2000, 2010, 2020 and 2030 - without any restriction on avoiding deforestation. The values of carbon dioxide emitted per period are then used as the benchmark with respect to which avoiding deforestation measures take place. The reduction of emissions under the RED scenarios is as follows:
� In 2000 and 2010, there is no avoiding deforestation measure; � In 2020, in all scenarios, CO2 emissions from deforestation decrease by 50%
compared to the 2010-2020 baseline (due to RED measures); � In 2030, CO2 emissions from deforestation decrease in different ways depending
on the RED scenarios: o 50% reduction compared to the 2020-2030 baseline emissions for RED_50 o 75% reduction compared to the 2020-2030 baseline emissions for RED_75 o 90% reduction compared to the 2020-2030 baseline emissions for RED_90
Table 4.4 Infrastructure implications on deforestation levels and costs of avoided deforestation in the Congo Basin
(marginal costs are expressed in US$ / tCO2)
Deforestation (in millions of hectares)
Baseline Infrastructure scenario
RED_BAU 3,68 7,89
RED 50% 2,09 2,07
RED 75% 1,13 1,09
RED 90% 0,52 0,48
Marginal Costs
Baseline Infrastructure scenario
RED 50% 3,69 6,29
RED 75% 5,92 8,5
RED 90% 7,57 9,65
[Source: IIASA]
As can be seen from this table, expanding the road network increases deforestation in the Congo Basin, and therefore increases the marginal cost of implementing RED. This is especially the case in the North-East of Congo (area enlarged in the previous map), which was landlocked before the modelled road construction. Nevertheless, as regards the costs

89
of avoiding deforestation, it should be stressed that the overall cost of avoided deforestation in general is much lower in the Congo Basin as compared to other deforestation hotspots because the profitability of other activities using land (e.g. agricultural production) is lower than in the rest of the world. The following figure presents the additional deforestation expected in the Congo Basin due to infrastructure expansion in a geographic-explicit manner. Deforestation levels expressed in average annual deforestation rates (in %) between 2020 and 2030 are presented. This figure reflects the particularly high deforestation levels in the North-East of the Congo.
Figure 4.9 Annual deforestation (in % of forested area) rate between 2020 and 2030 under baseline vs. with expansion of
the road network
Annual deforestation rate between 2020 and 2030 under baseline

Final Report 90
Annual deforestation rate between 2020 and 2030 with road network expansion
[Source: IIASA]
The construction of new highways and large routes across the region in the near future allows for the connection of already existing47 more local infrastructure networks with large centres of consumption and points of potential export. This leads to important reductions in travel time from many of the simulation units48. The reduction of the travel time in turn induces a reduction of transport costs, which in turn increases profitability of agricultural production in the simulation units, which had previously been non-attractive for production. This helps explain why overall deforestation levels increases considerably with the new infrastructure developments. Additionally, it helps explain why deforestation patterns change spatially and are now concentrated in the North-East Congo.
4.3 The role of biodiversity protection in avoided deforestation
The biodiversity scenario is treated separately from the other policy shock due to the different modelling approach applied and the additional analysis on a geographic-explicit level for the Congo Basin, similar to that presented for the infrastructure policy shock. For a detailed description of the classifications used for determining current and future protection statuses, we refer to Annex section 8.2.
47 Existing at least with respect to the data available, although local experts may argue that a large portion of this infrastructure
is virtually non-existent. 48 A simulation unit is a spatially explicit object, whose size varies between 10x10 and 50x50 km depending on its heterogeneity
with respect to altitude, slope and soil.

91
4.3.1 Comparison of current and projected biodiversity protection levels
The area of current and projected protection areas is summarized in the table below. The results show an overall increase in protected areas from 2009 to 2030 of approximately 433 Mha worldwide and 19 Mha in the Congo Basin.
Table 4.5 Summary table of protected area for 2009 and 2030
Year Protection status World area (hectares) Congo Basin* (hectares)
With High-Very High protection status 1,569,862,600 46,312,100
With Middle-Low protection status 1,118,212,000 26,063,100
2009
Current protection area total 2,688,074,700 72,375,200
Projected protected area in 2030 3,121,463,600 91,390,200 2030
Assumed real increase 2009-2030 433,388,900 19,015,000
* Cameroon, Central African Republic, Democratic Republic of the Congo, Equatorial Guinea, Gabon, and Republic of Congo. [Note: High – Very high protection status for the IUCN classes Ia, Ib, II, IV and internationally and national government managed
protected areas (e.g. World Heritage Convention, Ramsar Convention area). Middle-Low protection status for the IUCN classes III, V, VI and all other categories (e.g. forest park, wildlife management area)]
Figure 4.10 depicts this change from the baseline set by the status in 2009 in protected areas from 2009 to 2030 geographically on a worldwide scale. The protection status of the currently protected areas is classified by management objectives as mentioned above. When projected into the future (until 2030), the policy shock in form of a 20% increase in the total amount of protected areas on a worldwide scale shows that additional protected areas are introduced in particular across east and south Africa, along the west coast of the United States of America, across Russia, in south east Europe, across Southern America (especially Brazil and Argentina), and in Southeast Asia and Australia. The next figure (Figure 4.11) then zooms in on the Congo Basin countries: Cameroon, Central African Republic, The Democratic Republic of the Congo, Equatorial Guinea, Gabon, and Republic of Congo. This geographic-explicit analysis of the results for a specific case study region allows for a more detailed review of the projections. Once again the figure shows the currently protected areas in 2009 (both high-very high protection and medium-low protection levels) as well as the projected additional protected areas in 2030. Under the biodiversity policy shock scenario, the additional protected areas in 2030 will primarily have been established along the eastern and southern area of the Democratic Republic of Congo. From Figure 4.11 it can be seen that the additional protected area in the south of the Congo basin is not related to forest area but rather savannah mosaic bushlands. Thus, protection in those areas will not impact deforestation patterns. The other Congo Basin countries also show some geographically dispersed additional protected areas.

Final Report 92
Figure 4.10 Worldwide protected area for 2009 and additional protected area according to biodiversity scenario for 2030
[Source: WCMC]

93
Figure 4.11 Congo basin countries: currently protected area by status today (2009); additional protected area according to biodiversity scenario for 2030; and underlying MODIS forest cover (2004)
[Source: WCMC]

Final Report 94
4.3.2 Comparison of biodiversity scenario effects
Table 4.6 summarises avoided deforestation under the given biodiversity scenario. In the Democratic Republic of the Congo, for example, a large forested area (about 250,000 hectares in 2030) could be maintained if additional biodiversity protection areas were implemented.
Table 4.6 Avoided deforestation (hectares / year) under increased biodiversity protection scenario compared to BAU
scenario without incentive payment in the Congo Basin
Avoided Deforestation in hectares (% of current forest cover*)
Avoided Deforestation (hectares / year) 2010 2020 2030
Cameroon 32,536 (15%) 42,768 (20%) 47,034 (22%)
Central African Republic 47,836 (21%) 63,403 (28%) 74,113 (32.5%)
Republic of Congo 22,334 (10%) 29,589 (13%) 33,721 (15%)
Democratic Republic of the Congo 187,282 (14%) 231,235 (17%) 249,370 (19%)
Equatorial Guinea 3,409 (21%) 4,514 (28%) 5,275 (32%)
Gabon 27,027 (12%) 36,964 (17%) 44,034 (20%)
Total Congo Basin 320,424 408,473 453,547 * % of current forest cover is based on FAOSTAT 2005 data.
[Source: IIASA]
Similar to this quantified difference of deforestation rates when accounting for protected areas, Figure 4.12 maps out the avoided deforestation effect in a geographically explicit manner. The difficulty of distinguishing real differences in the two maps below shows that the current and additionally planned biodiversity protection areas can only make a relatively small difference in terms of reducing deforestation levels. This is due to the fact that most of the current and additional protection areas are not located in zones of high deforestation risk.

95
Figure 4.12 Effects of protected area on avoided deforestation (forest cover loss in percent) in the Congo Basin for 2030
Deforestation intensity if current and projected protection areas are respected
Deforestation intensity if current and projected protection areas are NOT respected
[Source: IIASA]

Final Report 96
4.3.3 Conclusions on the role of biodiversity protection in avoiding deforestation
Deforestation is significantly different in the biodiversity protection scenario as compared to the baseline scenario without biodiversity protection. Biodiversity protection is implemented by assuming full conservation of the respective forests according to the WCMC scenario. Deforestation of large areas can be avoided with increased protection areas as they are currently not protected in those countries where forest cover dominates, such as the Democratic Republic of the Congo. Although the positive effects of conservation on deforestation are substantial, even higher biodiversity conservation effects can be expected outside the forest domain in the Congo Basin. This is due to the fact that the majority of the additional projected protection areas (for 2030) are actually located outside the forest domain within the Congo Basin (see Figure 4.11). These projected protection areas are mostly located in grasslands and bushlands, which are outside the forest definition, due to their higher relative biodiversity benefit in this region. The wide expansion of protection areas in 2030 within forested areas is projected to be located in the less accessible mountainous parts of the Congo Basin - the Eastern border to Uganda and Rwanda. Therefore, the positive effects of newly protected areas on future deforestation levels could be further enhanced via parallel policies. The results thus suggest that well-established conservation schemes for existing protection areas (e.g. avoiding illegal logging) and further establishment of protection areas in forest ecosystems will increase the potential for avoided deforestation in the Congo Basin. The protection scenarios were calculated using the G4M model which assumes exogenous prices and does not account for regional or global leakage. Thus, the CO2 emissions in the scenario including biodiversity protection are most likely underestimated Impacts of incentives to reduce emissions from deforestation on global species extinctions49 As an additional step, it is possible to consider how and at what cost avoided deforestation via – for example increased biodiversity protection - can impact global species extinctions. Figure 4.13 shows the estimated effects of avoided deforestation on species extinction depending on the marginal cost of deforestation. The figure shows that under various prediction methods50, avoided deforestation measures could reduce extinctions across the entire range of likely carbon prices. For example, for a carbon price of US$ 7/tonne CO2, avoided deforestation could reduce 52–65% of global extinctions projected under the baseline scenario, whereas a price of US$ 25/tonne CO2 could reduce them by 86%–95% (for context, the average price of carbon traded worldwide in 2007-2008 was US$ 34/tonne CO2; Capoor, 2009). Importantly, the relationship between the
49 This sub-section of the report is based on a forthcoming publication by Bernardo B. N. Strassburg, Ana S.L. Rodrigues,
Mykola Gusti, Andrew Balmford, Steffen Fritz, Michael Obersteiner, R. Kerry Turner, Thomas M. Brooks (forthcoming) “Impacts of incentives to reduce emissions from deforestation on global species extinctions”. All results are preliminary and should be treated as confidential.
50 Three approaches for predicting the number of globally extinct species under each of the analysed scenarios were applied, by following (a) binary, (b) categorical and (c) continuous models to estimate the extinction risk for forest-dependent amphibian
and mammals. A fourth (d) approach estimated aggregated numbers of extinction species of endemic vertebrates and plants in hotspots and high-biodiversity wilderness areas. More information on the detailed methodology can be found in the forthcoming publication.

97
level of avoided deforestation incentives and their relative benefits for conservation is therefore robust to the approach employed to predict these benefits.
Figure 4.13 Relationship between carbon price and the estimated effects of avoided deforestation in avoiding extinctions
[Note: Values are in relation to a business-as-usual scenario for each of the methods employed to predict numbers of species’
extinctions: binary, categorical and continuous estimates of individual species’ extinction risk, and aggregated estimates
across species endemic to biogeographic regions.] [Source: IIASA]
Deforestation is not predicted to be uniformly distributed across the world, and accordingly neither is its impact on biodiversity. One way of investigating how biodiversity is affected under each scenario is to map predicted local extinctions, calculated as the difference between the original (2000) species richness and that expected under each scenario (Figure 4.14). Local extinctions are predicted to be most severe when deforestation hits regions with high species richness, such as the Congo Basin, Pacific Asia, the eastern Amazon and the Atlantic Forest of South America. Under the baseline scenario, these regions are predicted to become mainly deforested outside protected areas by 2100 (as already discussed in more detail for the Congo Basin), and would therefore suffer dramatic local extinctions. Predictably, the higher the level of investment in avoided deforestation, the fewer the expected extinctions. For higher carbon prices (10 US$/tonne or above), deforestation and subsequent local species extinctions could be averted in most of the Amazon and the Congo Basin. They would however remain significant (even if much reduced in relation to the baseline) in parts of the Atlantic Forest and Pacific Asia, and in other regions important for biodiversity such as the Tropical Andes.

Final Report 98
Figure 4.14 Spatial patterns of predicted species extinctions under different avoided deforestation scenarios
[Note: Local (A-E) and global (F-J) species extinctions, in year 2100, under a business-as-usual scenario (A, F) and under
avoided deforestation scenarios with carbon prices of 3 (B, G), 7 (C, H), 10 (D, I), and 25 (E, J) US$/tonne of CO2.] [Source: IIASA]
4.4 Congo Basin case study on governance development
Governance as well as other policy factors and corresponding institutional change are thought to be crucial drivers for land use patterns. Currently these patterns are, however, poorly understood and hardly measurable. The Congo Basin lends itself as a suitable case study area as governance levels are currently rather low compared to other parts of the world and thus there is room for projecting considerable improvements in governance in the future.

99
To assess the impact of changing governance, the improved governance scenario (governance development takes place and policy factors improve over time) is compared to the baseline under constant governance (no governance development over the next decades). A detailed description of the model results on governance is presented in Annex section 8.3. Modelling results using the current set-up seem to show that given the overall large size of deforestation happening under the business as usual scenario, even changing / improving governance cannot make a big difference in terms of decreasing the rate of deforestation in the Congo Basin. The basic drivers, mostly the need to increase food supplies, seem to be much stronger than an improvement in one institutional parameter. Better governance in combination with other policy successes, for example an increase in protected areas, could make a larger difference since better governance is assumed to allow for better implementation and reinforcement of more direct policy measures for protection. It also appears that the current model set up might not be fully adequate as improvement in governance is modelled through an aggregate parameter of the model. Further research will be needed to explicitly define what governance would really means in implementation terms. Examples of governance issues that could finally be modelled explicitly could range from elimination of illegal logging operations all the way to integrated fuel wood supply systems for subsistence farming communities. Such analysis could, however, only be implemented if the geography and mode of the baseline deforestation associated with these poorly governed processes would be measurable.


101
5 Conclusions and policy recommendations
This chapter provides a synthesis of key findings and implications for policy-making. The objective of this study was to assess to which extent our current consumption and production patterns as well as potential future shifts in these patterns affect deforestation levels and to draw conclusions on which policies would likely have the worst consequences in terms of causing additional deforestation, as more effort should be put on preventing these particular policies in the future.
5.1 Future deforestation levels under various policy shock scenarios
The modelling exercise developed for this study has shown that, when assessing the impacts of several rather extreme policy shock scenarios, it is possible to see which ones are the most striking ones in terms of further worsening deforestation levels. Indeed, the modelling exercise has shown that the two policy shocks leading to the worst consequences in terms of additional deforestation are (a) an increase in consumption of biodiesel (representing up to 15% of transport energy in 2030) and (b) an increase in meat consumption (15% more meat demand than in baseline): these two scenarios lead to a deforestation level in 2030 that is 46% and 37%, respectively, higher than in the baseline. Even if the biofuels policy shock is fed by a mix of first generation biofuels (a mix of biodiesel and bioethanol51), the results in terms of additional deforestation remain rather dramatic (30% more deforestation than in baseline). In the rather realistic case of a combined increase in 1st generation biofuels and meat consumption, the additional deforestation would even be 53% (36 Mha) higher than in the baseline scenario (which already takes into account an increase in those demands based on population and economic growth). Therefore, globally, more policy efforts should be made focussing in particular on reducing and/or limiting future increases in consumption of 1st generation biofuels (mainly biodiesel) and meat in order to help save the world’s forests from further deforestation. In reality, impacts of increased meat consumption can be expected to be even higher than shown in the figures presented here, since - due to the model specifications - it is assumed in this study that an increase in livestock production induces an increased demand in forage crops but not in grassland. Taking into account this link would put additional pressure on deforestation in the meat shock scenario. As regards infrastructure development leading to decreasing transportation costs (by 10% in emerging economies and by 15% in developing regions), the model shows that it would lead to a 5% increase in deforestation, due to an easier access to formerly remote areas, where agricultural expansion becomes easier, therefore at the expenses of forests.
51 The mix is based on the same distribution as in 2007, so 75% biodiesel and 25% bioethanol.
Formatted: Right: 2,6 cm,Bottom: 2,1 cm, Width: 21cm, Height: 29,7 cm

Final Report 102
On the contrary, in the case where the increased demand for biofuels would be fed by 2nd generation biofuels only, deforestation would actually decrease compared to the baseline. This is explained in the model by the fact that the increased demand for wood increases the value of forests and hence its « competitiveness » as compared to agriculture in the competition for land. For the geographic-explicit analysis on the Congo Basin, it has surfaced that increased biodiversity protection can make a difference in terms of avoiding deforestation in the region, by avoiding about half a million hectares of additional deforestation compared to baseline, which would represent about 20% of the current forest cover. Improved governance, on the other hand, does not reduce deforestation to great extent according to the model results. This might on the one hand be due to the way governance was modelled and thus related to a model artifact, or on the on the other hand be due to the other strong drivers of already high levels of deforestation in the region (see section 8.3). There are still a number of methodological issues open with respect to the measurement of governance quality and its projected change. Infrastructure developments, on the other hand, would reduce transportation costs and thus make agricultural production a more viable source of income in previously remote areas and consequently deforestation levels could increase (by 114%) if no avoiding deforestation scheme is put in place. However, infrastructure improvement not only acts as a cause for additional deforestation but could also foster efficiency gains in agriculture and forest management to such a degree that the implementation of an avoiding deforestation scheme (under the form of REDD+ for instance 52) would become less costly than under baseline conditions. This is indeed visible in the model results which show that infrastructure development scenario allows for a decreased deforestation as soon as the target for avoiding deforestation gets higher than 50 % (of avoided deforestation). Thus, if infrastructure development goes hand in hand with well-targeted forest protection, both the environment and the economy could win. It should be noted, however, that results may differ if analysed for regions other than the Congo Basin. The development of infrastructure is important for many developing and emerging economies around the world. The analysis of an infrastructure policy shock scenario across emerging and developing regions and its impact on global deforestation has shown that policies promoting infrastructure expansion are likely to increase deforestation, if not planned and managed with appropriate accompanying protective policies for the environment. Infrastructure improvement not only acts as a cause for additional deforestation, but could also foster efficiency gains in agriculture and forest management to such a degree that RED(D)+ implementation would become less costly than under baseline conditions. Thus, if infrastructure development goes hand in hand with well-targeted forest protection both the environment and the economy would win.
52 REDD+ stands for : Reducing emissions from deforestation and degradation, including conservation, sustainable forest
management and sink enhancement

103
5.2 Implications for associated costs of avoided deforestation
As an additional analytical step, the modelling exercise developed for this study has also shown the associated annual marginal costs of avoiding certain degrees of deforestation under the various policy shock scenarios. Several main findings and implications can be concluded from this study as regards the annual marginal costs of avoiding the deforestation. Logically, the more ambitious the goals of avoiding deforestation are set in terms of chosen RED targets, the more costly the endeavour becomes. When comparing marginal costs of a 50% avoiding deforestation scheme under baseline scenario and under some policy shocks scenarios, the modelling exercise shows that marginal costs would become almost 60 % higher if biofuels demand would raise up to representing 15% of total transport energy in 2030 and if this additional demand would be satisfied with 1st generation biofuels only (scenario BIOF4). And the same would occur if meat consumption was to increase by 15% compared to baseline in 2030. In case those two shocks are combined (which could be an evolution of world demand), marginal costs of avoiding deforestation (with a target of 50% of avoided deforestation) would become more than double than in a baseline scenario (with no shock on demand). This shows that world demand developments could have huge implications in terms of financing a REDD mechanism. Marginal costs of avoiding deforestation will vary by region. However, as no international policy decisions on the type of REDD mechanisms have been taken so far, it is not possible to estimate how different regions would be affected by these prices. Previous studies (Kindermann et. al., 2008 and DeFries et. al., 2002), however, indicate that the lowest-cost region would likely be Africa, followed by Latin America and Southeast Asia. In terms of future worldwide policy-making, policies promoting 1st generation biofuels production or meat production / cattle raising may have to be reconsidered/avoided once the environmental costs are internalised in the production of these goods through REDD measures. On the contrary, and this is again the underlying logic of the REDD concept, policies which indirectly avoid deforestation, such as 2nd generation biofuels or sustainable wood farming, could generate financial revenues through REDD measures and thus should be promoted in the future. These financial revenues would be spread across various stakeholders. The proportional distribution will depend to a large extent on the type of REDD mechanism chosen. Estimates of total global REDD costs The current study does not allow for an estimation of total global costs of avoiding deforestation. Indeed, the costs presented in this report do not include transaction costs and are ‘only’ estimates of incentive payments necessary to achieve certain RED targets, mainly to be paid to the agricultural sector to intensify or relocate production so that the land demand for agricultural decreases and therefore deforestation is postponed by one year. In the model, the carbon price is induced as the dual value of the constraint limiting CO2 emissions from deforestation to the scenario value, e.g. 50% of the emissions over

Final Report 104
2021-2030 compared to the BAU deforestation. Higher carbon prices will induce the model to allocate more land to forests, and consequently less deforestation will occur. In order to calculate the total costs of an avoiding deforestation mechanism, transaction costs (such as setting up, implementing, and verifying projects to reduce deforestation, verification expenses, etc.) would have to be included. The level of most transaction costs highly depends on the chosen REDD implementation scheme. For example, unit costs for Monitoring, Reporting, Verifying (MRV) dramatically decrease if carbon stocks are determined over large areas and by a combination of remote sensing and in-situ measurements (Boettcher et al., 2009). Transaction costs have been estimated to range from US$ 0.03 per tonne of CO2 for large projects to US$ 4.05 for smaller ones, with a weighted average of US$ 0.26 for all projects (Antinori, C., Sathaye, J., 2007). Since this study does not examine the various possibilities for REDD implementation schemes, a calculation of total global costs for avoiding deforestation remains outside its scope.53 However, to provide an indication of a rough estimation, Kinderman et. al (2008) have modelled total costs for reducing deforestation using three different models. According to their study, a 50% reduction in deforestation by 2030, for example could cost between US$ 17.2 billion and US$ 28.0 billion per year. Such a reduction in deforestation would have an associated benefit of reducing CO2 emissions by 1.5-2.7 Gt CO2 per year (compared to 2005 levels). The results of this study have shown that these cost estimates would be highly increased in case the scenarios analysed were to take place. As international discussions continue as to the best mechanisms for implementing REDD, one conclusion of this current study is that the stronger the RED target (i.e. higher percentage of avoided deforestation), the higher the likely variance in associated marginal costs when demand shocks occur; in other words, with more ambitious avoided deforestation targets, the need for financing not only becomes higher but also less predictable as the impacts of possible shocks become more influential. In addition, more stringent RED targets necessarily imply that transaction costs, potential leakage as well as institutional barriers are accounted for and addressed; all of which likely will raise total costs in practice.
5.3 Identification of policy priorities
As long as the modelling results of each individual policy shock scenario are analysed separately and within a regional context, the findings of this report are relatively easy to perceive and implications for the selected regions appear clear until 2030. However, in the interconnected world of today the results also have to be analysed in a highly integrated manner in order to provide effective and sustainable solutions for achieving the EU avoided deforestation goals for 2020 and 2030.
53 Total costs refer to the sum of opportunity costs and transaction costs of REDD implementation. The transaction costs part is
not assessed here as it is highly variable with the efficiency and effectiveness of the policy instruments chosen.
105
The baseline and policy shock scenario results as well as their financial implications in terms of associated marginal costs display the building blocks based on which future policy options should be shaped. Only if these quantitative findings will be combined with region-specific (also qualitative) findings will policy-making become effective. The global and regional analysis of the policy shock areas has rendered the potential negative implications on forests of certain policies and behaviours in favour of biofuels, meat production as well as infrastructure development more transparent. The following sub-sections briefly explore future implications for policy-making on a global and regional level.
5.3.1 On a global scale…
The main robust counter-measure to prevent potential negative consequences for deforestation across all scenarios is any measure that saves land and still produces the required increase in services such as food, energy and material supply (wood). Agricultural expansion (both for food and biofuels) is the single most important driver of deforestation projected up to 2030 and, thus, measures that decrease the land requirement per unit of food service delivered will help reduce deforestation. The most prominent measure in the agricultural sector is the increase of yields54 through better management practices in agricultural production covering both the crop and livestock sectors. Other measures include demand side measures of less land intensive consumption patterns, introduction of efficiency measures in the total food chain targeting food wastes and improvements in crop yield potentials through genetic improvement measures. Measures in the forest sector mostly point to measures that tackle degradation of forest carbon stocks through unsustainable forest management practices such as destructive high grading of a few commercially high yielding timber species using inadequate logging operations or failed forest regeneration after harvesting. This positive (or at least neutral) balancing of increased demand versus deforestation levels via better land management measures is exemplified55 in the two wood demand policy shock scenarios: all additional demand is covered from sustainable harvests and as a consequence does not lead to increased deforestation levels. At the same time, these sustainable approaches towards tackling increased demand (in this case wood) also significantly lower the associated marginal costs for achieving all RED ambition levels – marginal costs for both wood scenarios resemble the marginal costs under the baseline. Depending on the RED ambition level, marginal costs under the baseline as well as the two wood scenarios range from approximately US$ 3 without a REDD mechanisms (RED0% case) to around US$ 25 under a very ambitious REDD scheme aiming at avoiding 90 % of the deforestation (RED90% case). Thus, worldwide policies
54 Current global models do not, however, allow for capping productivity intensity and efficiency gains and those results are
shown by our analysis of the effects of the scenarios when the BAU includes a yield growth of 1% per annum. 55 This policy example has been chosen for simplicity purposes of explaining how avoided deforestation measures and
responding to increasing demand can go hand in hand, if the policy framework is carefully developed and implemented. This does not necessarily imply that the most realistic scenario has been chosen.

Final Report 106
stimulating the production of and demand for wood products from sustainably managed sources can potentially play a key role in limiting additional deforestation in the future. Even though this study primarily focussed on identifying which of the selected policy shocks is worst for future deforestation levels, some policy shocks turned out to have the potential to help reduce deforestation if implemented in the correct way, such as the mentioned wood demand scenario, as well as the development of a package of policies promoting 2nd generation biofuels. This has emerged as the only policy solution analysed in this study to lower net deforestation significantly. Our results indicate that due to increased wood demand and the subsequent improved valorisation of sustainably managed forests it is likely to increase their economic competitiveness compared to cropland. As a result investments in agricultural improvements appear as less costly than clearing forests leading in the aggregate to decreased cropland expansion into forests. However, there are caveats to be made in the sense that policies promoting 2nd generation biofuels will need to be well designed to create the right incentives leading to the projected positive impacts on gross deforestation. In particular, issues about reinforcing institutions regulating and monitoring land competition, allocation of property rights, and finally careful local studies on the social constraints to attain the projected potentials of wood supply. To this end, the EU could consider promoting certain production technologies or developments as well as promoting corresponding institutional and capacity building initiatives to help achieve the appropriate implementation of 2nd generation biofuels production, in addition to supporting a particular REDD financing mechanism. One example could be the stringent promotion of second generation biofuels around the world in order to reach the best case scenario (BIOF5) in all three selected regions. Such a diffusion of necessary technologies could be financially supported via a voluntary fund. Until 2030, the effect of such an approach would be a substantially decreasing demand for RED credits as less areas around the world would be deforested. As regards species extinction, the results show that the continuation of deforestation activities on a business-as-usual level is likely to result in very high levels of species extinctions at localised levels (tropics). Such losses are incompatible with global commitments to reduce rates of biodiversity loss (Balmford et. al., 2005). While this correlation between forest conservation and species protection has been proven, the exact ratio of protecting X% of forest amounts to saving X% of species from extinction has not been worked out yet.
5.3.2 On a regional level…
The regional conclusions are generally similar to the ones on the global level. In particular, the negative influences of some policy shocks on deforestation levels are largely identical. However, certain differences in results also imply different policy needs for an effective response. In particular, it is worth looking at how each region may lower deforestation levels in the future through tailored policy approaches.

107
Sub-Saharan Africa For Sub-Saharan Africa, modelling results have shown that increased global demand for 1st generation biodiesel and meat trigger the most severe additional deforestation, representing respectively 22% and 14% additional deforestation as compared to the baseline for the period between 2020 and 2030 (but “only” respectively 0.2% and 0.13% of current Sub-Saharan African forest cover). Global policies favouring 2nd generation biofuels and infrastructure development, on the other hand, are likely to actually have beneficial impacts with regards to lowering deforestation rates in Sub-Saharan Africa. Today’s transportation and logistics infrastructure in Africa is still poorly developed and highly inefficient. This situation currently triggers inefficiencies in the industrial and, even more importantly, the agricultural sectors. New technologies and infrastructure development could help create a more efficient agricultural system with advanced agricultural activities (e.g. multiple harvests and transportation of fertilizers) and therefore increase the yield of the land already available instead of expanding farmland through deforestation to compensate for the lack of yield. A reduction of deforestation would therefore be the result. At the same time, global demands for 2nd generation biofuels would likely stimulate a switch to land use for producing the raw material inputs to meet this increasing demand and thus some marginal areas, or areas currently deforested for other agricultural purposes could be converted into more sustainable energy crop plantations. In order to implement policies that avoid deforestation in Sub-Saharan Africa, two counteracting aspects have to be taken into consideration. On the one hand, the results for every policy shock scenario have shown rather small quantities of deforestation, compared to the other two regions analysed. Together with the findings from the geographic-explicit case study, however, one can draw the conclusion that possibilities to avoid deforestation exist by – for example – increasing the area of biodiversity protection sites. On the other hand, the poorly developed economies in Sub-Saharan Africa will demand comparably larger financial resources to implement policies in an efficient and effective manner. Therefore, when juxtaposing Sub-Saharan Africa to other regions, the aim of avoiding a comparably smaller degree of deforestation in this region may call for comparably larger financial efforts. Pacific Asia For Pacific Asia,, modelling results have shown that global demand increases in 1st generation biodiesel (or a mix of 1st generation biodiesel and bioethanol) and in meat would generate the most severe impacts for additional deforestation in the region. These demand increases would cause, respectively, 40% and 29% more deforestation than in the baseline for the period between 2020 and 2030, representing 2.4% and 1.7% of current Pacific Asian forest cover. In the Pacific Asia region, a rapidly increasing population will demand large amounts of wood, and only if such wood is provided through sustainable farming can deforestation be controlled at levels close to the baseline. Of course it should be mentioned here that policy shocks were analysed in the modelling exercise on a global level and policies of a single region will likely only become truly effective if other regions implement similar

Final Report 108
policy goals. Nevertheless, based on the likely development path of this region, sustainable high yield in agriculture as well as sustainable wood farming seem feasible policy foci for the near future. Taking into account the large and increasing population living in the region, policies also have to address the issue of outsourcing56 deforestation to other regions (e.g. Latin America) in order to satisfy certain needs of the regions economies and societies, including wood, meat and energy demands. The current comparably low deforestation rates (per capita) of the region should not lead to the impression that Pacific Asia is not indirectly responsible for more deforestation on a global scale (potential leakage phenomenon due to more and more regional demand being satisfied by supplies from other regions). As mentioned before, policy-makers have a chance to avoid deforestation in the region by implementing policies in favour of sustainable wood farming, 2nd generation biofuels and constantly improving the regions infrastructure efficiency and effectiveness, thereby reducing the needs for additional deforestation for new infrastructure development. In addition, proactive actions pointing out the external costs of increased meat consumption and 1st generation biofuels use of any kind could lead to less demand and thus indirectly lower deforestation rates in other regions of the world. Latin America and the Caribbean Similar to Sub-Saharan Africa and Pacific Asia, the Latin America and Caribbean region also suffers the most severe negative impacts on deforestation levels when global demand for 1st generation biofuels and meat increases. In addition, however, this region also suffers significant increases in deforestation levels even when the demand for biofuels is satisfied by a mix of all three types of biofuels (1st generation biodiesel and bioethanol combined with 2nd generation bioethanol). These policy shock scenarios lead to significant annual deforestation levels, corresponding to 50% additional deforestation as compared to the baseline in the case of 1st generation biodiesel and of 42% in the case of a meat consumption increase. It should be highlighted once again that any of the policy shocks has much larger impacts proportionally than in the other two regions, since the two shocks mentioned above (biodiesel and meat) represent 2.8 and 2.4% of current regional forest cover. In Latin America and the Caribbean, global developments towards 2nd generation biofuels is the only case leading to significantly reduced deforestation levels below the baseline. To some extent, sustainable wood farming policies could have a positive effect as well. When comparing the studied regions, the Latin America and Caribbean region is predicted to experience the highest levels of deforestation worldwide between 2020 and 2030 (on average more than 4 ½ times as much deforested area as in Pacific Asia and
56 Naturally, outsourcing deforestation is not a unique problem to this region only. Similarly, other emerging or developed
economies, such as China, Europe and the USA, need to be aware of outsourcing deforestation to vulnerable areas when pursuing current and future policies in the analysed fields. Some indications of this has been provided in Chapter 2 of the report.

109
more than 8 ½ times as in Sub-Saharan Africa across all scenarios). In no other region analysed will a wrong policy choice (both regional and worldwide policies) cause such high levels of corresponding deforestation. Any additional demand (additional to the baseline) for 1st generation biofuels or meat will have the most drastic consequences for forest loss and nowhere else in the world could a push for 2nd generation biofuels production avoid more deforestation. Summary of regional analysis The table overleaf (Table 5.1) provides a summarised overview of the regional analysis in terms of worst threats, associated additional deforestation, in absolute and relative terms, as well as potential policy measures to counteract these worst case policy shocks. While a global increase in 1st generation biodiesel and meat demand are by far the two policy shock scenarios with the most severe negative consequences for deforestation across all three regions, an increase in 2nd generation biofuels, an increase in sustainable wood demand, and for Sub-Saharan Africa and Pacific Asia also an increase in infrastructure development would likely not have any negative impacts on deforestation, rather these policy shocks would likely reduce deforestation across the regions compared to the baseline.

Final Report 110
Table 5.1 Summary overview of regional policy shock analysis
Associated increase in deforestation
compared to BAU
Major threats
(scenarios with most striking
consequences) In Mha In % of
baseline
In % of current
regional forest cover
Possible preventive policy actions
Sub-
Saharan
Africa
1st generation biodiesel
Meat
1.43
0.93
22 %
14%
0.2%
0.13%
Due to the continued struggles of Sub-Saharan economies it will demand comparably larger financial
resources to implement policies. Some relatively quick policy actions on a local level include increasing
biodiversity protection sites in forested areas as well as carefully planned infrastructure development.
On a more global level, actions aiming at preventing the increase of meat consumption and a focus on
developing 2nd generation biofuels for inclusion in transport fuels would benefit the region.
Pacific
Asia
1st generation biodiesel
Meat
Mix of 1st gen. biodiesel & bioethanol
4.65
3.36
2.76
40%
29%
24%
2.4%
1.7%
1.4%
Countries in this region should promote sustainable high yield agriculture and sustainable wood
farming. Furthermore, this rapidly developing region ought to be aware of potential increases in meat
demand often associated with increased prosperity and prepare for policies that can counteract such an
increase. Finally, Pacific Asia should also emphasise 2nd generation biofuels policies rather than
continuing its current cash crop developments for 1st generation biofuels.
Latin
America
1st generation biodiesel
Meat
Mix of 1st gen. biodiesel & bioethanol
Mix of all 3 types of biofuels
24.73
20.99
16.55
12.06
50%
42%
34%
24%
2.8%
2.4%
1.9%
1.4%
Latin America and the Caribbean region clearly has most to gain in terms of avoiding deforestation if a
REDD mechanism is established and protecting its forests becomes a valuable source of income. In
addition to promoting the implementation of a worldwide REDD system, the region should focus on
policies promoting the use and production of 2nd generation biofuels as well as support efforts for more
sustainable high yield agriculture so as to reduce the additional demand for land for meat production.

111
5.4 Further research steps to improve the estimation of the level of deforestation and the costs of REDD
It is important to point out certain limitations of this study and thereby highlighting future research needs. The core limitations centre on (a) the lack of reliable data for estimating the level of deforestation, (b) total cost calculations for REDD implementation, and (c) some limitations associated with the assumptions taken during the modelling exercise (in particular for trade in biofuels, sustainable wood farming, and new agricultural land).
5.4.1 Estimation of the level of deforestation and degradation
For the estimation of reference levels of future deforestation there are two points to take into account to arrive at better predictions:
1) calibration of the model based on current and historical data yielding better understanding of deforestation processes and model calibration; and
2) gathering of plausible driver and pressure data. There are several methodological possibilities for model calibration aiming at replicating the deforestation and degradation patterns in the base year or for historical periods. However, up to now reliable deforestation data has still not become available, thus hindering a robust estimation. For better calibration, the GLOBIOM model would require land transition information in order to allow consistent calibration of all land use changes including deforestation. The geographic explicit G4M model carries fewer degrees of freedom for the calibration and thus allows for less data demanding calibration of deforestation and degradation. We have calibrated towards FAO data, which are known not to be of the highest reliability. However, there are few alternatives and FAO is currently politically accepted as the most authoritative source of deforestation information. There is an additional problem with FAO data, which relates to the fact that only net deforestation is reported for tropical countries. Gross deforestation was derived by expert judgment for the purposes of this study. Estimation of the level of degradation is an even more daunting problem as information on the area and degree of degradation is not available. Estimation of degradation was omitted (REDD) from the analysis using the GLOBIOM model although degradation processes could easily be modelled if data were available. More quantitative information will have to be gathered in order to better estimate emissions from degradation. The remote sensing tools which are currently deployed are not sufficiently precise to reliably estimate the degree of degradation. In addition, degradation processes can also occur due to natural processes from the transition from climax state to overmaturity as well as due to disturbances. A factor decomposition will have to be conducted in order to derive the anthropogenic share for forest degradation.
5.4.2 Estimation of total global REDD costs
The analysis carried out in this study does not consider transaction costs, which strongly depend on the type of REDD implementation mechanism. Boettcher et al. 2009 have

Final Report 112
conducted a study on Monitoring Reporting Verifying (MRV) cost for LULUCF and REDD and have presented the results as a function of the mode of implementation. There are two main sources of cost reduction. Firstly, there are economies of scale: For example, a national REDD monitoring system of an average REDD country will come at a much higher cost than a truly global MRV system providing the same level of accuracy and precision in the estimation of carbon stocks or fluxes. Additionally, such a global MRV system would more easily capture leakage effects that would otherwise remain unaccounted for if national monitoring systems are established that cannot account for cross-border leakage. The other factor is economies of scope by policy coordination with other policies. The costs of avoided deforestation under a RED57 scheme will be substantially higher than under a REDD++ scheme if total emissions were accounted for. This is largely due to the fact that it is more costly to monitor, single out and account for emissions reductions achieved by avoided deforestation only (RED), rather than implementing an overall monitoring and accounting system that simply captures all associated developments, including not only avoided deforestation, but also avoided degradation, as well as improvements in conservation, sustainable forest management, sink enhancement and afforestation (REDD++). Finally, the highest uncertainty with respect to the estimation of total REDD costs is the efficiency and effectiveness of REDD policies deployed in a developing country context. Payments for carbon sequestration appear at first sight as attractive for local incomes and for ecosystem services. Yet tradeoffs may exist. The policies that are the best at alleviating poverty may not be the best (in terms of cost-effectiveness) at avoiding deforestation. In reviewing policies and considering implications one needs to ask whether paying poor land users for carbon seems especially efficient or inefficient and whether the constructed supply curves are indeed socially feasible and transaction costs appear as non-prohibitive. Indeed, there is little empirical research on the supply response of poor land user. Economic analyses of the supply response to carbon payments exist58 but they are focused solely upon the OECD countries and/or not upon the poor. For example, Pfaff et al. (2007) analyzed a large scale subsidy scheme in Costa Rica aiming to avoid deforestation and to support afforestation. They report full efficiency in only a small fraction of the cases. Inefficiencies are linked to factors such as access to capital, property rights, and technical effectiveness of physical implementation and transaction costs. Only empirical surveys once the first large scale REDD implementation projects were conducted will be informative for the estimation of implementation efficiency.
57
Avoided Deforestation terminologies
RED Reducing emissions from deforestation
REDD Reducing emissions from deforestation and degradation
REDD+ Reducing emissions from deforestation and degradation, including conservation, sustainable
forest management and sink enhancement
REDD++ Reducing emissions from deforestation and degradation, including conservation, sustainable
forest management and sink enhancement and afforestation
58 These analyses employ approaches from point estimates of average costs to engineering least-cost models to revealed
preference within past land use (Parks and Hardie, 1995; Callaway and McCarl, 1996; Stavins, 2000; Plantinga et al., 1999; Kerr et al., 2006)

113
Thus, the true costs of REDD implementation can potentially be much higher than estimated in this study as we calculate as a benchmark 100% efficiency in the implementation. Only empirical surveys once the first large scale REDD implementation projects were conducted will be informative for the estimation of implementation efficiency.
5.4.3 Limitations associated with assumptions taken for the modelling exercise
The three main assumptions that could potentially be a significant factor in changing some of the scenario results are the assumptions for biofuels, sustainable wood farming, as well as for the development of new agricultural land. In the current model set-up, trade in biofuels is restricted. Due to the multitude of support and trade policies implemented in different ways in different countries to promote biofuels production, it is a rather trivial task to set up the model in a way that perfectly reproduces them, especially because many of them have been set up rather recently. Including parameters representing trade in biofuels could potentially improve some of the modelling results; however, it will require increased research efforts and time to update the model accordingly. An update of results based on a model set-up including trade in biofuels is currently in progress and will most likely become available in the second half of 2010. As regards additional wood demand in the future, this demand has been assumed to stem from sustainable wood farms in the GLOBIOM model. Thus, the forest industry is assumed to use only wood from sustainable harvests. This means that increased demand for wood will – in GLOBIOM – lead to conversion of unmanaged forests to managed forests, but not to deforestation. Actually, increased wood demand therefore adds additional value to managed forests compared to agriculture and thus may even slow down deforestation in the current model set-up. It remains debatable whether this constraint is realistic for the period of 2020 to 2030, though public demand for sustainable wood sources has certainly increased over recent years. In order to increase the realism of the wood scenarios, further model development would have to take place to be able to allow GLOBIOM to source parts of the additional wood demand also from currently unmanaged forests, whereby some of these unmanaged areas would lose value due to unsustainable management and therefore cause additional deforestation to occur in the model. Finally, to address the current assumption that cropland expansion can occur in forests only, further research efforts need to be carried out focussing on the past and future conversion matrix. Similarly, pressure on conversion for short rotation plantations should be researched further in the future. Currently, short rotation plantations are allowed to expand both in cropland and in grassland in the model. Hence, there is currently an arbitrage whether short rotation tree plantations will go on current cropland and move cropland further into forests creating deforestation, or whether the cropland will stay in

Final Report 114
place, reducing deforestation, and short rotation tree plantations will go in majority to current grassland.
5.5 Closing remarks
Overall, the study demonstrates that future policy decisions and behaviours in various policy fields will directly or indirectly impact deforestation levels across the world. New policies to influence demand patterns or promote the dispersion of certain new technologies can help tackle global deforestation if they positively guide land use and land conversion patterns to favour sustainable production of agricultural products and to increase yield efficiency per hectare. At the same time, certain policy or behaviour directions clearly harmful to global forest cover developments (such as first generation biofuels and meat consumption) should clearly be avoided. As regards the costs associated with avoiding future deforestation, the study has shown large variances in potential marginal costs for avoiding a ton of CO2 emitted by conserving forests: these marginal costs can range from around US$ 3 without an avoiding deforestation scheme (RED0% case) for policy shock scenarios mimicking to a large extent the baseline (wood and infrastructure) to almost US$ 50 under a fully protective deforestation scheme (RED90% case) for highly destructive policy shocks (1st generation biodiesel and meat). It therefore shows that acting on the demand side can be quite powerful not only in terms of avoiding deforestation but also of limiting the costs of a REDD mechanism.


