Study on the Effect of Fe3+ on Zircon Flotation Separation ... · Minerals 2017, 7, 108 2 of 18...
18
minerals Article Study on the Effect of Fe 3+ on Zircon Flotation Separation from Cassiterite Using Sodium Oleate as Collector Huiqing Peng 1 , Wen Luo 1, *, Di Wu 1 , Xuexiang Bie 1 , Hui Shao 1,2 , Wenya Jiao 1 and Yike Liu 1 1 School of Resource and Environmental Engineering, Wuhan University of Technology, 122 Luoshi Road, Wuhan 430070, China; [email protected] (H.P.); [email protected] (D.W.); [email protected] (X.B.); [email protected] (H.S.); [email protected] (W.J.); [email protected] (Y.L.) 2 Bengbu Glass Industry Design and Research Institute, China National Building Material Group Co. Ltd., Bengbu 233018, China * Correspondence: [email protected] Received: 11 May 2017; Accepted: 15 June 2017; Published: 22 June 2017 Abstract: The effect of ferric ions (Fe 3+ ) on the flotation of zircon and cassiterite using sodium oleate (NaOL) was investigated by single mineral flotation tests, adsorption density tests, zeta potential measurements, solution chemistry analyses, and FTIR analyses. It is difficult for zircon to be separated from cassiterite by using NaOL alone. Nevertheless, the flotation of zircon was activated while that of cassiterite was depressed in the presence of Fe 3+ . Adsorption density tests indicated that the addition of Fe 3+ enhanced the adsorption of NaOL on zircon surfaces, whereas it receded on cassiterite surfaces. Zeta potential measurements and solution chemistry analyses found that H(OL) - 2 was the predominant species to determine the flotation behaviors of zircon and cassiterite. Furthermore, the addition of Fe 3+ at pH < 8 reduced the negative charges on the zircon and cassiterite surfaces. It was confirmed that the positive charges of zircon were caused by the positively charged species of Fe 3+ , including Fe 3+ , Fe(OH) 2+ , and Fe(OH) + 2 . Meanwhile, these results revealed that the hydroxy complex and the precipitate of Fe(OH) 3 (s) adsorbed onto the cassiterite surfaces caused the flotation of cassiterite to be inhibited. It can be concluded from FTIR analyses that the peaks of zircon at 894.14 cm -1 and 611.65 cm -1 were strengthened and the adsorption on zircon surfaces was found to be chemisorption due to the addition of Fe 3+ , whereas both chemical and physical adsorptions of NaOL on cassiterite surfaces were weakened, resulting in the different flotation behaviors of zircon and cassiterite in the presence of Fe 3+ . Keywords: ferric ions; zircon; cassiterite; flotation; sodium oleate 1. Introduction Zircon (ZrSiO 4 ), which is the most important zirconium-containing mineral on earth, has direct applications in the cast, glass, ceramic, and pigment industries because of its high melting point and steady chemical properties. And it is also used in the production of zirconium dioxide (ZrO 2 ) which is a highly refractory material. Zircon is known as a heavy mineral and defined as having a specific gravity greater than 3.5 [1], and it usually coexists with some heavy minerals including cassiterite, tantalum, niobium, magnetite, ilmenite, and some other minerals such as quartz, feldspar, and clay [2–5]. The enrichment of Zircon commonly occurs in pegmatite and placer deposits. Due to the relatively high specific gravity of zircon, the beneficiation of zircon along with other heavy minerals can be achieved by means of gravity separation when the gravity property differences between zircon and other minerals are significant. It is easy for light minerals to be removed in the Minerals 2017, 7, 108; doi:10.3390/min7070108 www.mdpi.com/journal/minerals
-
Upload
hoangquynh -
Category
Documents
-
view
213 -
download
0
Transcript of Study on the Effect of Fe3+ on Zircon Flotation Separation ... · Minerals 2017, 7, 108 2 of 18...

minerals
Article
Study on the Effect of Fe3+ on Zircon FlotationSeparation from Cassiterite Using Sodium Oleateas Collector
Huiqing Peng 1, Wen Luo 1,*, Di Wu 1, Xuexiang Bie 1, Hui Shao 1,2, Wenya Jiao 1 and Yike Liu 1
1 School of Resource and Environmental Engineering, Wuhan University of Technology, 122 Luoshi Road,Wuhan 430070, China; [email protected] (H.P.); [email protected] (D.W.);[email protected] (X.B.); [email protected] (H.S.); [email protected] (W.J.);[email protected] (Y.L.)
2 Bengbu Glass Industry Design and Research Institute, China National Building Material Group Co. Ltd.,Bengbu 233018, China
* Correspondence: [email protected]
Received: 11 May 2017; Accepted: 15 June 2017; Published: 22 June 2017
Abstract: The effect of ferric ions (Fe3+) on the flotation of zircon and cassiterite using sodium oleate(NaOL) was investigated by single mineral flotation tests, adsorption density tests, zeta potentialmeasurements, solution chemistry analyses, and FTIR analyses. It is difficult for zircon to be separatedfrom cassiterite by using NaOL alone. Nevertheless, the flotation of zircon was activated while that ofcassiterite was depressed in the presence of Fe3+. Adsorption density tests indicated that the additionof Fe3+ enhanced the adsorption of NaOL on zircon surfaces, whereas it receded on cassiteritesurfaces. Zeta potential measurements and solution chemistry analyses found that H(OL)−2 was thepredominant species to determine the flotation behaviors of zircon and cassiterite. Furthermore,the addition of Fe3+ at pH < 8 reduced the negative charges on the zircon and cassiterite surfaces.It was confirmed that the positive charges of zircon were caused by the positively charged species ofFe3+, including Fe3+, Fe(OH)2+, and Fe(OH)+2 . Meanwhile, these results revealed that the hydroxycomplex and the precipitate of Fe(OH)3(s) adsorbed onto the cassiterite surfaces caused the flotationof cassiterite to be inhibited. It can be concluded from FTIR analyses that the peaks of zircon at894.14 cm−1 and 611.65 cm−1 were strengthened and the adsorption on zircon surfaces was found tobe chemisorption due to the addition of Fe3+, whereas both chemical and physical adsorptions ofNaOL on cassiterite surfaces were weakened, resulting in the different flotation behaviors of zirconand cassiterite in the presence of Fe3+.
Keywords: ferric ions; zircon; cassiterite; flotation; sodium oleate
1. Introduction
Zircon (ZrSiO4), which is the most important zirconium-containing mineral on earth, has directapplications in the cast, glass, ceramic, and pigment industries because of its high melting pointand steady chemical properties. And it is also used in the production of zirconium dioxide (ZrO2)which is a highly refractory material. Zircon is known as a heavy mineral and defined as havinga specific gravity greater than 3.5 [1], and it usually coexists with some heavy minerals includingcassiterite, tantalum, niobium, magnetite, ilmenite, and some other minerals such as quartz, feldspar,and clay [2–5]. The enrichment of Zircon commonly occurs in pegmatite and placer deposits.
Due to the relatively high specific gravity of zircon, the beneficiation of zircon along with otherheavy minerals can be achieved by means of gravity separation when the gravity property differencesbetween zircon and other minerals are significant. It is easy for light minerals to be removed in the
Minerals 2017, 7, 108; doi:10.3390/min7070108 www.mdpi.com/journal/minerals

Minerals 2017, 7, 108 2 of 18
first stage, and the product of zircon from the first stage then needs further processing. However,gravity separation methods will perform well only when the particle size meets the requirements [6].Both too fine and coarse particle sizes will negatively affect the results. Hence, the fine fraction ofzircon concentrate from gravity separation still contains large amounts of impurities which cannotbe removed effectively. To improve the quality of products, zircon is further separated from otherheavy minerals, such as magnetite, ilmenite, and cassiterite, by a series of magnetic and electrostaticseparation processes. Usually, the removal of magnetite and ilmenite from zircon is easier to achievevia magnetic separation because these two minerals are magnetic. The electrostatic separationmethod [7] based on the different electric properties between the gangue and the valuable mineralsrequires clean mineral surfaces. The mineral surfaces of zircon are usually coated with some electricmetal minerals which contain titanium, iron, and other materials such as clay. These contaminantsmake it very difficult to achieve an effective separation using electrostatic separation. According tothe information mentioned above, the light minerals and magnetic minerals can be removed, andcassiterite as the main contaminant in zircon concentrate cannot be removed effectively. As a result, thefine zircon concentrate of poor quality must be purified using other beneficiation methods. Flotationis usually employed to treat this kind of mineral. Using flotation to purify zircon is certainly worthinvestigation for both technical and economic reasons [8].
Some researchers investigated the flotation of zircon. Zircon flotation could be achieved usingfatty acids, alkyl sulfates, or cationic collectors [9]. Sodium oleate (NaOL), as a typical fatty acidsurfactant, has been widely used as an effective collector of silicates and metal oxide minerals for yearsin industry. Meanwhile, the application of NaOL in zircon flotation was studied by Pavez and Peres ina system of monazite–rutile–zircon by using NaOL and hydroxamates [10]. Abeidu also used oleicacid to treat the flotation system of monazite–zircon [11]. Furthermore, phosphate-containing anioniccollectors and even xanthates were used for the selective flotation of zircon [12]. Bulatovic and DeSilvio [13] employed modified sulfosuccinamate-based mixtures as a collector, H2SiF6, HOOC–COOHand Na2SiO3 as the depressants in a strong acidic environment for the separation of zircon andtantalite–columbite from cassiterite concentrates, and good results were obtained.
Because of the association of magnetite, hematite, and ilmenite with zircon, ferric ions (Fe3+)usually exist in the lattice of cassiterite [14]. The release of Fe3+ from these iron-bearing minerals duringthe separation process makes the flotation environment more complex. It was reported that the metalions in silicates had a significant effect on the flotation separation [15,16]. Fe3+ effectively activated theflotation of silicates including spodumene, albite, and quartz in a NaOL system [17]. However, theeffect of Fe3+ on zircon flotation in a NaOL system is rarely reported. Hence, it is necessary to studythe effect of dissolved Fe3+ on the flotation of zircon and cassiterite.
In this work, the effect of Fe3+ on the flotation of zircon and cassiterite at various concentrationsand pH levels using an anionic NaOL collector was investigated. This study presents the surfacechemistry profiles and flotation behaviors in terms of single mineral flotation tests, adsorption densitytests, zeta potential measurements, solution chemistry analyses, and FTIR measurements.
2. Experimental
2.1. Minerals
This study was conducted with pure minerals. To ensure a better performance, the pure mineralswere prepared without any addition of chemicals. High-purity, handpicked cassiterite was obtainedfrom Kunming, Yunnan province, China. To obtain the pure zircon, a beach placer from Australiawas preliminarily utilized for gravity separation, including the use of a spiral chute and a shakingtable to remove the light minerals. The rough concentrate was then further enriched by high-gradientmagnetic separation (1 Tesla) and electrostatic separation to remove the magnetic and the electricimpurities, respectively. The purified zircon and cassiterite were ground using a porcelain mill andthen wet-sieved with distilled water. The fraction with particle size of −0.053 + 0.044 mm was selected

Minerals 2017, 7, 108 3 of 18
for flotation tests, and the finer fraction (−0.044 mm) was used for FTIR analyses. A portion of thisfraction (−0.044 mm) was further ground in an agate mortar and then micro-sieved to obtain particlesof size less than 5 µm for zeta potential measurements.
The pure mineral samples were confirmed by X-Ray Diffraction (XRD) and X-Ray Fluorescence(XRF). Figure 1 shows the XRD patterns of the purified zircon (a) and cassiterite (b) samples.The diffraction peaks recorded for zircon and cassiterite matched well with the patterns of standarddiffraction peaks [18]. According to the results, there were few impure peaks in Figure 1, indicatingthat the zircon and cassiterite were of high purity. The chemical compositions of the samples are listedin Table 1. The purity of zircon was about 92%, while that of cassiterite was above 95%, based on XRDand XRF results.
Minerals 2017, 7, 108 3 of 18
fraction (−0.044 mm) was further ground in an agate mortar and then micro-sieved to obtain particles of size less than 5 μm for zeta potential measurements.
The pure mineral samples were confirmed by X-Ray Diffraction (XRD) and X-Ray Fluorescence (XRF). Figure 1 shows the XRD patterns of the purified zircon (a) and cassiterite (b) samples. The diffraction peaks recorded for zircon and cassiterite matched well with the patterns of standard diffraction peaks [18]. According to the results, there were few impure peaks in Figure 1, indicating that the zircon and cassiterite were of high purity. The chemical compositions of the samples are listed in Table 1. The purity of zircon was about 92%, while that of cassiterite was above 95%, based on XRD and XRF results.
10 20 30 40 50 60 70 800
10000
20000
30000
40000
■
■
■
■■
■
■
■
■
■
Inte
nsit
y(C
ount
s)
2θ
-Zircon(a)
20 30 40 50 60 70 800
1000
2000
3000
4000
● ●
● ●
●●
●
●
●
●
Inte
nsit
y(C
ount
s)
2θ
-Cassiterite●
(b)
Figure 1. X-Ray diffraction (XRD) patterns of zircon (a) and cassiterite (b).
Table 1. Chemical compositions of the purified samples (mass fraction, %).
Sample Na2O Al2O3 SiO2 MgO P2O5 Pb K2O CaO Zircon 0.109 1.206 33.341 0.098 0.153 0.146
Cassiterite 0.72 0.97 0.32 0.03 0.59 Sample SnO2 TiO2 Fe2O3 ZrO2 La2O3 HfO2 U3O8 ThO2 Zircon 0.171 0.19 61.78 0.852 1.406 0.052 0.065
Cassiterite 95.7 0.44
Figure 1. X-Ray diffraction (XRD) patterns of zircon (a) and cassiterite (b).
Table 1. Chemical compositions of the purified samples (mass fraction, %).
Sample Na2O Al2O3 SiO2 MgO P2O5 Pb K2O CaO
Zircon 0.109 1.206 33.341 0.098 0.153 0.146Cassiterite 0.72 0.97 0.32 0.03 0.59
Sample SnO2 TiO2 Fe2O3 ZrO2 La2O3 HfO2 U3O8 ThO2
Zircon 0.171 0.19 61.78 0.852 1.406 0.052 0.065Cassiterite 95.7 0.44

Minerals 2017, 7, 108 4 of 18
2.2. Reagents
Sodium oleate (NaOL) was used as an anionic collector throughout the experiments. Freshlyprepared NaOL solutions were used in all the experiments. Dilute solutions of hydrochloric acid (HCl)and sodium hydroxide (NaOH) were used to adjust the pH of the mineral suspension. Ferric chloridehexahydrate (FeCl3·6H2O) was used as the source of Fe3+. All the chemicals used in this investigationwere provided by Sinopharm Chemical Reagent Co. Ltd. (Shanghai, China) and were of analyticalgrade. The water used throughout the experiments was distilled water.
2.3. Flotation Tests
Single mineral flotation tests were conducted using a XFG flotation machine with a volume of50 mL, and the stirring speed was kept at 1750 r/min. The experiments were performed based on theprocedure shown in Figure 2. A mineral suspension was prepared by successively adding 3.0 g selectedpure mineral particles of −0.053 + 0.044 mm and 45 mL distilled water into the 50 mL flotation cell.The suspension was conditioned by stirring for 1 min without adding any chemicals. The regulatorsused were Fe3+, HCl, and NaOH, while the collector used was NaOL. The pH of the mineral suspensionwas adjusted to the predetermined value by adding HCl or NaOH solutions. The differences of the pHmeasured before and after each flotation test were typically less than 0.2 pH units. The prepared FeCl3and NaOL solutions were added to the suspension in sequence. Each reagent was conditioned for2 min. Flotation was performed for a total of 3 min. The floating particles and the remaining materialswere separately collected, filtered, and dried in an oven at 75 ◦C for 2 h and then cooled in a desiccator.Finally, flotation recoveries were calculated based on the sample weights.
Minerals 2017, 7, 108 4 of 18
2.2. Reagents
Sodium oleate (NaOL) was used as an anionic collector throughout the experiments. Freshly prepared NaOL solutions were used in all the experiments. Dilute solutions of hydrochloric acid (HCl) and sodium hydroxide (NaOH) were used to adjust the pH of the mineral suspension. Ferric chloride hexahydrate (FeCl3∙6H2O) was used as the source of Fe3+. All the chemicals used in this investigation were provided by Sinopharm Chemical Reagent Co. Ltd. (Shanghai, China) and were of analytical grade. The water used throughout the experiments was distilled water.
2.3. Flotation Tests
Single mineral flotation tests were conducted using a XFG flotation machine with a volume of 50 mL, and the stirring speed was kept at 1750 r/min. The experiments were performed based on the procedure shown in Figure 2. A mineral suspension was prepared by successively adding 3.0 g selected pure mineral particles of −0.053 + 0.044 mm and 45 mL distilled water into the 50 mL flotation cell. The suspension was conditioned by stirring for 1 min without adding any chemicals. The regulators used were Fe3+, HCl, and NaOH, while the collector used was NaOL. The pH of the mineral suspension was adjusted to the predetermined value by adding HCl or NaOH solutions. The differences of the pH measured before and after each flotation test were typically less than 0.2 pH units. The prepared FeCl3 and NaOL solutions were added to the suspension in sequence. Each reagent was conditioned for 2 min. Flotation was performed for a total of 3 min. The floating particles and the remaining materials were separately collected, filtered, and dried in an oven at 75 °C for 2 h and then cooled in a desiccator. Finally, flotation recoveries were calculated based on the sample weights.
Figure 2. Flowsheet of single mineral flotation tests.
2.4. Adsorption Tests
The adsorption of NaOL on the surfaces of each mineral was evaluated by the solution depletion method, and the procedure of adsorption tests was similar to that used for the flotation tests; the concentrations of NaOL are measured before and after adsorption. The difference was assumed to be due to adsorption of NaOL onto the surface. The adsorption amount of the collector was calculated based on the following equation: = ( − ) ×
(1)
where Γ is the adsorbed amount of NaOL on the mineral surfaces in the absence and presence of Fe3+; C0 and C are the concentrations of NaOL in the pulp suspension before and after the interaction of NaOL with the mineral surfaces, respectively, for the desired time; V is the volume of the resultant solution; and m is the weight of mineral particles.
Three grams of mineral sample were added to 50 mL of aqueous solution with the desired pH and concentration of Fe3+ (8 × 10⁻⁵ mol/L) and NaOL (4 × 10⁻⁴ mol/L). The suspension was stirred at
Single minerals
Concentrate Tailing
1 min
2 min
Agitation
pH regulator
Fe3+
NaOL
2 min
2 min
3 min
Figure 2. Flowsheet of single mineral flotation tests.
2.4. Adsorption Tests
The adsorption of NaOL on the surfaces of each mineral was evaluated by the solution depletionmethod, and the procedure of adsorption tests was similar to that used for the flotation tests; theconcentrations of NaOL are measured before and after adsorption. The difference was assumed to bedue to adsorption of NaOL onto the surface. The adsorption amount of the collector was calculatedbased on the following equation:
Γ =(C0 − C)×V
m(1)
where Γ is the adsorbed amount of NaOL on the mineral surfaces in the absence and presence of Fe3+;C0 and C are the concentrations of NaOL in the pulp suspension before and after the interaction ofNaOL with the mineral surfaces, respectively, for the desired time; V is the volume of the resultantsolution; and m is the weight of mineral particles.

Minerals 2017, 7, 108 5 of 18
Three grams of mineral sample were added to 50 mL of aqueous solution with the desired pHand concentration of Fe3+ (8 × 10⁻⁵ mol/L) and NaOL (4 × 10⁻⁴ mol/L). The suspension was stirredat 25 ◦C for 10 min. After the adsorption, the suspension was centrifuged at 9000 rpm for 15 min,then the solution was immediately gathered to analyze the concentration of NaOL by a direct methodusing an UV-Visible spectrophotometer (UV-5500). To detect the characteristic peak, the absorbancesof NaOL solutions with the concentration of 2 × 10⁻⁴ mol/L at various pH were determined by fullspectrum scan (0.5 nm/s), and the spectra shown in Figure 3 indicated that one characteristic peak wasobserved for each solution sample in the range of 228.5 to 236 nm. It was seen from the spectra thatthere was a slight difference between the two maximum values of the characteristic peaks at pH 6 and 8;meanwhile, the two peaks were observed in the range of 228.5 to 232.5 nm. As a result, the wavelengthat 230 nm was selected as the optimal wavelength for absorbance tests, and the centrifuged solutionwas adjusted to pH 8 to prevent the negative effects of various forms of NaOL on the absorbance.The concentrations of the standard solution samples used for the standard curve shown in Figure 4were 0, 0.5, 1, 1.5, 2, and 2.5 × 10⁻⁴ mol/L, respectively.
Minerals 2017, 7, 108 5 of 18
25 °C for 10 min. After the adsorption, the suspension was centrifuged at 9000 rpm for 15 min, then the solution was immediately gathered to analyze the concentration of NaOL by a direct method using an UV-Visible spectrophotometer (UV-5500). To detect the characteristic peak, the absorbances of NaOL solutions with the concentration of 2 × 10⁻⁴ mol/L at various pH were determined by full spectrum scan (0.5 nm/s), and the spectra shown in Figure 3 indicated that one characteristic peak was observed for each solution sample in the range of 228.5 to 236 nm. It was seen from the spectra that there was a slight difference between the two maximum values of the characteristic peaks at pH 6 and 8; meanwhile, the two peaks were observed in the range of 228.5 to 232.5 nm. As a result, the wavelength at 230 nm was selected as the optimal wavelength for absorbance tests, and the centrifuged solution was adjusted to pH 8 to prevent the negative effects of various forms of NaOL on the absorbance. The concentrations of the standard solution samples used for the standard curve shown in Figure 4 were 0, 0.5, 1, 1.5, 2, and 2.5 × 10⁻⁴ mol/L, respectively.
200 300 400 500 600 700 800 900 1000 1100-0.25
0.00
0.25
0.50
0.75
1.00
1.25
1.50
1.75
2.00
Abs
orba
nce
Wavelength (nm)
pH=4 pH=6 pH=8 pH=10 pH=12
Figure 3. UV spectra of NaOL solution as a function of pH (NaOL: 2 × 10⁻⁴ mol/L).
0.0 0.5 1.0 1.5 2.0 2.5
0.0
0.2
0.4
0.6
0.8
1.0
1.2
Y=0.43X-0.0008
R2=0.999967
Abs
orba
nce
(A)
NaOL concentration (10-4 mol/L)
Figure 4. Standard curve of NaOL.
Figure 3. UV spectra of NaOL solution as a function of pH (NaOL: 2 × 10⁻⁴ mol/L).
Minerals 2017, 7, 108 5 of 18
25 °C for 10 min. After the adsorption, the suspension was centrifuged at 9000 rpm for 15 min, then the solution was immediately gathered to analyze the concentration of NaOL by a direct method using an UV-Visible spectrophotometer (UV-5500). To detect the characteristic peak, the absorbances of NaOL solutions with the concentration of 2 × 10⁻⁴ mol/L at various pH were determined by full spectrum scan (0.5 nm/s), and the spectra shown in Figure 3 indicated that one characteristic peak was observed for each solution sample in the range of 228.5 to 236 nm. It was seen from the spectra that there was a slight difference between the two maximum values of the characteristic peaks at pH 6 and 8; meanwhile, the two peaks were observed in the range of 228.5 to 232.5 nm. As a result, the wavelength at 230 nm was selected as the optimal wavelength for absorbance tests, and the centrifuged solution was adjusted to pH 8 to prevent the negative effects of various forms of NaOL on the absorbance. The concentrations of the standard solution samples used for the standard curve shown in Figure 4 were 0, 0.5, 1, 1.5, 2, and 2.5 × 10⁻⁴ mol/L, respectively.
200 300 400 500 600 700 800 900 1000 1100-0.25
0.00
0.25
0.50
0.75
1.00
1.25
1.50
1.75
2.00
Abs
orba
nce
Wavelength (nm)
pH=4 pH=6 pH=8 pH=10 pH=12
Figure 3. UV spectra of NaOL solution as a function of pH (NaOL: 2 × 10⁻⁴ mol/L).
0.0 0.5 1.0 1.5 2.0 2.5
0.0
0.2
0.4
0.6
0.8
1.0
1.2
Y=0.43X-0.0008
R2=0.999967
Abs
orba
nce
(A)
NaOL concentration (10-4 mol/L)
Figure 4. Standard curve of NaOL.
Figure 4. Standard curve of NaOL.

Minerals 2017, 7, 108 6 of 18
2.5. Zeta Potential Measurements
Zeta potentials were measured using a Malvern Zetasizer Zeta-Nano (Malvern Instruments,Malvern, Worcestershire, UK). All measurements were conducted in a 0.1 × 10⁻³ mol/L NaClbackground electrolyte solution. Purified mineral samples were ground to a particle size less than 5 µm.The fine particles (0.1 g) were placed into a 50 mL beaker containing distilled water (45 mL), and thesuspension was stirred magnetically, followed by pH adjustment using HCl and NaOH solutions. ThenFe3+ and/or NaOL was added at various pH levels, respectively. Each reagent was stirred for 2 min.Subsequently, the zeta potentials of the resultant suspensions were determined. The measurementswere performed at 25 ◦C.
2.6. FTIR Spectroscopy Measurements
The FTIR spectra were obtained using a Nicolet 6700 spectrophotometer from Thermo Scientific(Waltham, MA, USA) to characterize the nature of the interaction between the collector and the minerals,and revealed the effect of Fe3+ on the interaction. Approximately 1% (mass fraction) of the solid samplewas mixed with spectroscopic grade potassium bromide (KBr). The wavenumber range of the spectrawas 400–4000 cm−1.
To prepare the samples for FTIR analyses, pure particles ground by porcelain mill were wet-sieved,and the fraction (−0.044 mm) was then dried and selected. The conditioning procedure was similarto that used for the flotation tests. After the conditioning, the samples were centrifuged and thesupernatant decanted, followed by three repeated rinses to remove residual or physically adsorbedcollectors, using distilled water at the same pH adjusted by the prepared HCl or NaOH aqueoussolutions. Finally, the wet solid samples were allowed to dry prior to FTIR analyses.
3. Results and Discussion
3.1. Flotation Performance of Single Minerals
The objective of this study was to investigate the underlying mechanism of a NaOL collector inthe preferential flotation of zircon from a mixture of zircon and cassiterite minerals. As a result, theflotation behaviors of zircon and cassiterite using NaOL as a collector with and without Fe3+ wereinvestigated by single mineral flotation tests. Figure 5 shows the flotation responses of zircon andcassiterite using NaOL at pH 8.
Minerals 2017, 7, 108 6 of 18
2.5. Zeta Potential Measurements
Zeta potentials were measured using a Malvern Zetasizer Zeta-Nano (Malvern Instruments, Malvern, Worcestershire, UK). All measurements were conducted in a 0.1 × 10⁻³ mol/L NaCl background electrolyte solution. Purified mineral samples were ground to a particle size less than 5 μm. The fine particles (0.1 g) were placed into a 50 mL beaker containing distilled water (45 mL), and the suspension was stirred magnetically, followed by pH adjustment using HCl and NaOH solutions. Then Fe3+ and/or NaOL was added at various pH levels, respectively. Each reagent was stirred for 2 min. Subsequently, the zeta potentials of the resultant suspensions were determined. The measurements were performed at 25 °C.
2.6. FTIR Spectroscopy Measurements
The FTIR spectra were obtained using a Nicolet 6700 spectrophotometer from Thermo Scientific (Waltham, MA, USA) to characterize the nature of the interaction between the collector and the minerals, and revealed the effect of Fe3+ on the interaction. Approximately 1% (mass fraction) of the solid sample was mixed with spectroscopic grade potassium bromide (KBr). The wavenumber range of the spectra was 400–4000 cm−1.
To prepare the samples for FTIR analyses, pure particles ground by porcelain mill were wet-sieved, and the fraction (−0.044 mm) was then dried and selected. The conditioning procedure was similar to that used for the flotation tests. After the conditioning, the samples were centrifuged and the supernatant decanted, followed by three repeated rinses to remove residual or physically adsorbed collectors, using distilled water at the same pH adjusted by the prepared HCl or NaOH aqueous solutions. Finally, the wet solid samples were allowed to dry prior to FTIR analyses.
3. Results and Discussion
3.1. Flotation Performance of Single Minerals
The objective of this study was to investigate the underlying mechanism of a NaOL collector in the preferential flotation of zircon from a mixture of zircon and cassiterite minerals. As a result, the flotation behaviors of zircon and cassiterite using NaOL as a collector with and without Fe3+ were investigated by single mineral flotation tests. Figure 5 shows the flotation responses of zircon and cassiterite using NaOL at pH 8.
0 2 4 6 8 10 120
20
40
60
80
100
Rec
over
y (%
)
NaOL concentration (10-4mol/L)
Zircon Cassiterite
Figure 5. Flotation recoveries of zircon and cassiterite as a function of NaOL concentration (pH = 8). Figure 5. Flotation recoveries of zircon and cassiterite as a function of NaOL concentration (pH = 8).

Minerals 2017, 7, 108 7 of 18
The results clearly illustrated that the floatability of zircon and cassiterite improved with theincrease of NaOL concentration. The maximum recoveries of zircon and cassiterite were approximately92% and 91%, respectively, in the condition of NaOL concentration at 1 × 10⁻³ mol/L. The NaOLconcentration had a significant effect on the recoveries of zircon and cassiterite. The recovery ofzircon increased gradually when the NaOL concentration was lower than 2.5 × 10⁻⁴ mol/L, and thenincreased rapidly in the range of 2.5 × 10⁻⁴ to 4 × 10⁻⁴ mol/L. After the rapid increase, the recoveryof zircon continued to increase until reaching a maximum at the concentration of 1 × 10⁻³ mol/L.The recovery of cassiterite, in the whole concentration range of NaOL, had a similar trend to thatof zircon. However, it was a surprise that the recovery of cassiterite was higher than that of zirconwith the NaOL concentration lower than 2.5 × 10⁻⁴ mol/L; as the collector concentration increased,the recovery of zircon became higher than that of cassiterite until their recoveries were relativelysteady. But, the differences in recovery between zircon and cassiterite were not enough to achieve theireffective separation. It can be inferred that the phenomenon might be caused by the weak selectivity ofNaOL [19].
The subsequent flotation tests focused on the responses of single mineral flotation in the presenceof Fe3+ with 4 × 10⁻⁴ mol/L NaOL at pH 8. The results are shown in Figure 6. The recovery ofzircon increased with increasing Fe3+ concentration when the concentration of Fe3+ was lower than8 × 10−5 mol/L; with the continuously increasing concentration, the recovery of zircon decreasedrapidly to around 80%. However, the recovery of cassiterite presented a trend of gradual decrease withincreasing addition of Fe3+ until the Fe3+ concentration reached 9 × 10⁻⁵ mol/L. Meanwhile, Figure 6clearly shows that Fe3+ caused a slight improvement in the flotation of zircon, but a strong depressionto that of cassiterite. As a result, an optimum concentration of Fe3+ can help to achieve the flotationseparation of zircon from cassiterite.
Minerals 2017, 7, 108 7 of 18
The results clearly illustrated that the floatability of zircon and cassiterite improved with the increase of NaOL concentration. The maximum recoveries of zircon and cassiterite were approximately 92% and 91%, respectively, in the condition of NaOL concentration at 1 × 10⁻³ mol/L. The NaOL concentration had a significant effect on the recoveries of zircon and cassiterite. The recovery of zircon increased gradually when the NaOL concentration was lower than 2.5 × 10⁻⁴ mol/L, and then increased rapidly in the range of 2.5 × 10⁻⁴ to 4 × 10⁻⁴ mol/L. After the rapid increase, the recovery of zircon continued to increase until reaching a maximum at the concentration of 1 × 10⁻³ mol/L. The recovery of cassiterite, in the whole concentration range of NaOL, had a similar trend to that of zircon. However, it was a surprise that the recovery of cassiterite was higher than that of zircon with the NaOL concentration lower than 2.5 × 10⁻⁴ mol/L; as the collector concentration increased, the recovery of zircon became higher than that of cassiterite until their recoveries were relatively steady. But, the differences in recovery between zircon and cassiterite were not enough to achieve their effective separation. It can be inferred that the phenomenon might be caused by the weak selectivity of NaOL [19].
The subsequent flotation tests focused on the responses of single mineral flotation in the presence of Fe3+ with 4 × 10⁻⁴ mol/L NaOL at pH 8. The results are shown in Figure 6. The recovery of zircon increased with increasing Fe3+ concentration when the concentration of Fe3+ was lower than 8 × 10⁻⁵ mol/L; with the continuously increasing concentration, the recovery of zircon decreased rapidly to around 80%. However, the recovery of cassiterite presented a trend of gradual decrease with increasing addition of Fe3+ until the Fe3+ concentration reached 9 × 10⁻⁵ mol/L. Meanwhile, Figure 6 clearly shows that Fe3+ caused a slight improvement in the flotation of zircon, but a strong depression to that of cassiterite. As a result, an optimum concentration of Fe3+ can help to achieve the flotation separation of zircon from cassiterite.
0 2 4 6 8 1040
50
60
70
80
90
100
Rec
over
y (%
)
Fe3+ concentration (10-4 mol/L)
Zircon Cassiterite
Figure 6. Flotation recoveries of zircon and cassiterite as a function of Fe3+ concentration (NaOL: 4.0 × 10⁻⁴ mol/L; pH = 8).
The flotation responses of zircon and cassiterite throughout the pH range using 4 × 10⁻⁴ mol/L NaOL with and without 8 × 10⁻⁵ mol/L of Fe3+ are presented in Figures 7 and 8, respectively. Figure 7 shows that the recovery of zircon increased until reaching a relatively high recovery around 80% in the pH range of 7 to 9, and then decreased rapidly to approximately 40% when NaOL was added alone. With the addition of NaOL and Fe3+, the recovery of zircon increased gradually before reaching pH 8 where a maximum recovery of 93% was obtained. Subsequently, the recovery of zircon began to decrease rapidly with the increase of pH. The results indicated that Fe3+ slightly aided the flotation of zircon when using NaOL as a collector. The maximum recovery increased from 85.68% without
Figure 6. Flotation recoveries of zircon and cassiterite as a function of Fe3+ concentration (NaOL:4.0 × 10⁻⁴ mol/L; pH = 8).
The flotation responses of zircon and cassiterite throughout the pH range using 4 × 10⁻⁴ mol/LNaOL with and without 8× 10⁻⁵ mol/L of Fe3+ are presented in Figures 7 and 8, respectively. Figure 7shows that the recovery of zircon increased until reaching a relatively high recovery around 80% in thepH range of 7 to 9, and then decreased rapidly to approximately 40% when NaOL was added alone.With the addition of NaOL and Fe3+, the recovery of zircon increased gradually before reaching pH

Minerals 2017, 7, 108 8 of 18
8 where a maximum recovery of 93% was obtained. Subsequently, the recovery of zircon began todecrease rapidly with the increase of pH. The results indicated that Fe3+ slightly aided the flotationof zircon when using NaOL as a collector. The maximum recovery increased from 85.68% withoutFe3+ at pH 9 to 93.26% with Fe3+ at pH 8. Figure 8 shows that the recovery of cassiterite in the NaOLsystem without Fe3+ increased gradually with the increase of pH before reaching pH 8, after whicha decreasing recovery of cassiterite was observed. When the flotation of cassiterite was conducted ina NaOL system with Fe3+, the results indicated that the flotation was strongly decreased. In addition,increasing the pH of the suspension caused an even greater decrease in flotation.
Minerals 2017, 7, 108 8 of 18
Fe3+ at pH 9 to 93.26% with Fe3+ at pH 8. Figure 8 shows that the recovery of cassiterite in the NaOL system without Fe3+ increased gradually with the increase of pH before reaching pH 8, after which a decreasing recovery of cassiterite was observed. When the flotation of cassiterite was conducted in a NaOL system with Fe3+, the results indicated that the flotation was strongly decreased. In addition, increasing the pH of the suspension caused an even greater decrease in flotation.
2 4 6 8 10 120
20
40
60
80
100
Rec
over
y (%
)
pH
Zircon+NaOL
Zircon+NaOL+Fe3+
Figure 7. Flotation recovery of zircon as a function of pH with and without Fe3+ (Fe3+: 8 × 10⁻⁵ mol/L; NaOL: 4 × 10⁻⁴ mol/L).
2 4 6 8 10 120
20
40
60
80
100
Rec
over
y (%
)
pH
Cassiterite+NaOL
Cassiterite+NaOL+Fe3+
Figure 8. Flotation recovery of cassiterite as a function of pH with and without Fe3+ (Fe3+: 8 × 10⁻⁵ mol/L; NaOL: 4 × 10⁻⁴ mol/L).
3.2. Adsorption Tests
In adsorption tests, the adsorption density results were plotted as a function of pH with and without Fe3+ to reveal the effect of Fe3+ on the flotation of zircon and cassiterite minerals. The initial concentration of NaOL was kept at 4 × 10⁻⁴ mol/L, and that of Fe3+ was 8 × 10⁻⁴ mol/L if it needed to be used, throughout the adsorption tests. The concentrations of NaOL left in the solution samples were measured by a direct spectrophotometric quantification method at a wavelength of 230nm.
The adsorption test responses of zircon with and without Fe3+ are shown in Figure 9. When NaOL was used as the collector without the addition of Fe3+, the adsorption density of NaOL steadily
Figure 7. Flotation recovery of zircon as a function of pH with and without Fe3+ (Fe3+: 8× 10⁻⁵ mol/L;NaOL: 4 × 10⁻⁴ mol/L).
Minerals 2017, 7, 108 8 of 18
Fe3+ at pH 9 to 93.26% with Fe3+ at pH 8. Figure 8 shows that the recovery of cassiterite in the NaOL system without Fe3+ increased gradually with the increase of pH before reaching pH 8, after which a decreasing recovery of cassiterite was observed. When the flotation of cassiterite was conducted in a NaOL system with Fe3+, the results indicated that the flotation was strongly decreased. In addition, increasing the pH of the suspension caused an even greater decrease in flotation.
2 4 6 8 10 120
20
40
60
80
100
Rec
over
y (%
)
pH
Zircon+NaOL
Zircon+NaOL+Fe3+
Figure 7. Flotation recovery of zircon as a function of pH with and without Fe3+ (Fe3+: 8 × 10⁻⁵ mol/L; NaOL: 4 × 10⁻⁴ mol/L).
2 4 6 8 10 120
20
40
60
80
100
Rec
over
y (%
)
pH
Cassiterite+NaOL
Cassiterite+NaOL+Fe3+
Figure 8. Flotation recovery of cassiterite as a function of pH with and without Fe3+ (Fe3+: 8 × 10⁻⁵ mol/L; NaOL: 4 × 10⁻⁴ mol/L).
3.2. Adsorption Tests
In adsorption tests, the adsorption density results were plotted as a function of pH with and without Fe3+ to reveal the effect of Fe3+ on the flotation of zircon and cassiterite minerals. The initial concentration of NaOL was kept at 4 × 10⁻⁴ mol/L, and that of Fe3+ was 8 × 10⁻⁴ mol/L if it needed to be used, throughout the adsorption tests. The concentrations of NaOL left in the solution samples were measured by a direct spectrophotometric quantification method at a wavelength of 230nm.
The adsorption test responses of zircon with and without Fe3+ are shown in Figure 9. When NaOL was used as the collector without the addition of Fe3+, the adsorption density of NaOL steadily
Figure 8. Flotation recovery of cassiterite as a function of pH with and without Fe3+ (Fe3+:8 × 10⁻⁵ mol/L; NaOL: 4 × 10⁻⁴ mol/L).

Minerals 2017, 7, 108 9 of 18
3.2. Adsorption Tests
In adsorption tests, the adsorption density results were plotted as a function of pH with andwithout Fe3+ to reveal the effect of Fe3+ on the flotation of zircon and cassiterite minerals. The initialconcentration of NaOL was kept at 4 × 10⁻⁴ mol/L, and that of Fe3+ was 8 × 10⁻⁴ mol/L if it neededto be used, throughout the adsorption tests. The concentrations of NaOL left in the solution sampleswere measured by a direct spectrophotometric quantification method at a wavelength of 230 nm.
The adsorption test responses of zircon with and without Fe3+ are shown in Figure 9. WhenNaOL was used as the collector without the addition of Fe3+, the adsorption density of NaOL steadilyincreased with increasing pH from 4 to 6, and then kept a relatively high adsorption density beforereaching pH 10, after which it decreased rapidly. When ferric chloride was added into the flotationsystem, there was an increase in the adsorption density with increasing pH from 3 to 10, and thereafterdecreased rapidly until the adsorption was lower than that in the flotation without Fe3+. It is interestingto note that a higher adsorption density with the addition of Fe3+ and NaOL was observed at pH 6–9and the highest adsorption density around 9 × 10⁻⁶ mol/g was obtained at pH 9. The adsorptionof NaOL onto zircon surfaces in the presence of Fe3+ was higher than that without Fe3+ at pH3–10, where the results were consistent with the flotation tests. However, the adsorption with andwithout the addition of Fe3+ at pH 2, where the adsorption was abnormally high, did not match theflotation tests. Figure 7 shows the recovery of zircon was slightly improved by the addition of Fe3+;meanwhile, Figure 9 shows that Fe3+ can enhance the adsorption of the collector onto zircon surfaces.As a result, it can be inferred that the activation of Fe3+ in zircon flotation was achieved by enhancingthe adsorption of NaOL.
Minerals 2017, 7, 108 9 of 18
increased with increasing pH from 4 to 6, and then kept a relatively high adsorption density before reaching pH 10, after which it decreased rapidly. When ferric chloride was added into the flotation system, there was an increase in the adsorption density with increasing pH from 3 to 10, and thereafter decreased rapidly until the adsorption was lower than that in the flotation without Fe3+. It is interesting to note that a higher adsorption density with the addition of Fe3+ and NaOL was observed at pH 6–9 and the highest adsorption density around 9 × 10⁻⁶ mol/g was obtained at pH 9. The adsorption of NaOL onto zircon surfaces in the presence of Fe3+ was higher than that without Fe3+ at pH 3–10, where the results were consistent with the flotation tests. However, the adsorption with and without the addition of Fe3+ at pH 2, where the adsorption was abnormally high, did not match the flotation tests. Figure 7 shows the recovery of zircon was slightly improved by the addition of Fe3+; meanwhile, Figure 9 shows that Fe3+ can enhance the adsorption of the collector onto zircon surfaces. As a result, it can be inferred that the activation of Fe3+ in zircon flotation was achieved by enhancing the adsorption of NaOL.
1 2 3 4 5 6 7 8 9 10 11 12 135.5
6.0
6.5
7.0
7.5
8.0
8.5
9.0
9.5
10.0
Ads
orpt
ion
(10-6
mol
/g)
pH
Zircon+NaOL
Zircon+NaOL+Fe3+
Figure 9. Adsorption of NaOL on zircon as a function of pH with and without Fe3+ (Fe3+: 8 × 10⁻⁵ mol/L; NaOL: 4 × 10⁻⁴ mol/L).
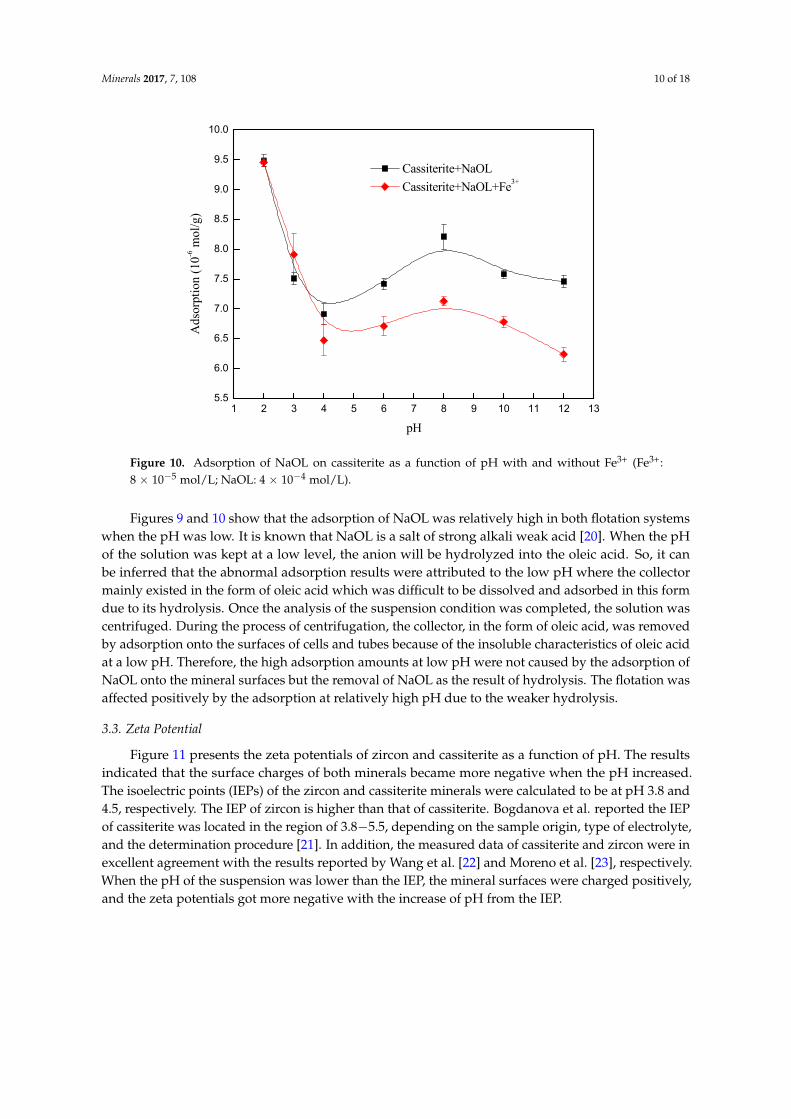
Figure 10 shows that the adsorption of NaOL on cassiterite surfaces in a NaOL system without Fe3+ decreased rapidly before reaching pH 4, followed by an increase at pH 4−8, finally, adsorption decreased gradually. The trend of cassiterite in a NaOL system with Fe3+ was similar to that without Fe3+, while a maximum adsorption density was obtained at pH 8. At pH 4−12, the adsorption of NaOL on cassiterite surfaces was decreased to a certain extent, and the adsorption density decreased by 1.08 × 10⁻⁶ mol/g at pH 8. The trend of the adsorption was consistent with the flotation tests at pH 4−12, but did not match the flotation tests at pH 2−3.
Figure 9. Adsorption of NaOL on zircon as a function of pH with and without Fe3+ (Fe3+:8 × 10⁻⁵ mol/L; NaOL: 4 × 10⁻⁴ mol/L).
Figure 10 shows that the adsorption of NaOL on cassiterite surfaces in a NaOL system withoutFe3+ decreased rapidly before reaching pH 4, followed by an increase at pH 4−8, finally, adsorptiondecreased gradually. The trend of cassiterite in a NaOL system with Fe3+ was similar to that withoutFe3+, while a maximum adsorption density was obtained at pH 8. At pH 4−12, the adsorption ofNaOL on cassiterite surfaces was decreased to a certain extent, and the adsorption density decreasedby 1.08 × 10⁻⁶ mol/g at pH 8. The trend of the adsorption was consistent with the flotation tests atpH 4−12, but did not match the flotation tests at pH 2−3.
Minerals 2017, 7, 108 10 of 18Minerals 2017, 7, 108 10 of 18
1 2 3 4 5 6 7 8 9 10 11 12 135.5
6.0
6.5
7.0
7.5
8.0
8.5
9.0
9.5
10.0
Ads
orpt
ion
(10-6
mol
/g)
pH
Cassiterite+NaOL
Cassiterite+NaOL+Fe3+
Figure 10. Adsorption of NaOL on cassiterite as a function of pH with and without Fe3+ (Fe3+: 8 × 10⁻⁵ mol/L; NaOL: 4 × 10⁻⁴ mol/L).
Figures 9 and 10 show that the adsorption of NaOL was relatively high in both flotation systems when the pH was low. It is known that NaOL is a salt of strong alkali weak acid [20]. When the pH of the solution was kept at a low level, the anion will be hydrolyzed into the oleic acid. So, it can be inferred that the abnormal adsorption results were attributed to the low pH where the collector mainly existed in the form of oleic acid which was difficult to be dissolved and adsorbed in this form due to its hydrolysis. Once the analysis of the suspension condition was completed, the solution was centrifuged. During the process of centrifugation, the collector, in the form of oleic acid, was removed by adsorption onto the surfaces of cells and tubes because of the insoluble characteristics of oleic acid at a low pH. Therefore, the high adsorption amounts at low pH were not caused by the adsorption of NaOL onto the mineral surfaces but the removal of NaOL as the result of hydrolysis. The flotation was affected positively by the adsorption at relatively high pH due to the weaker hydrolysis.
3.3. Zeta Potential
Figure 11 presents the zeta potentials of zircon and cassiterite as a function of pH. The results indicated that the surface charges of both minerals became more negative when the pH increased. The isoelectric points (IEPs) of the zircon and cassiterite minerals were calculated to be at pH 3.8 and 4.5, respectively. The IEP of zircon is higher than that of cassiterite. Bogdanova et al. reported the IEP of cassiterite was located in the region of 3.8−5.5, depending on the sample origin, type of electrolyte, and the determination procedure [21]. In addition, the measured data of cassiterite and zircon were in excellent agreement with the results reported by Wang et al. [22] and Moreno et al. [23], respectively. When the pH of the suspension was lower than the IEP, the mineral surfaces were charged positively, and the zeta potentials got more negative with the increase of pH from the IEP.
Figure 10. Adsorption of NaOL on cassiterite as a function of pH with and without Fe3+ (Fe3+:8 × 10⁻⁵ mol/L; NaOL: 4 × 10⁻⁴ mol/L).
Figures 9 and 10 show that the adsorption of NaOL was relatively high in both flotation systemswhen the pH was low. It is known that NaOL is a salt of strong alkali weak acid [20]. When the pHof the solution was kept at a low level, the anion will be hydrolyzed into the oleic acid. So, it canbe inferred that the abnormal adsorption results were attributed to the low pH where the collectormainly existed in the form of oleic acid which was difficult to be dissolved and adsorbed in this formdue to its hydrolysis. Once the analysis of the suspension condition was completed, the solution wascentrifuged. During the process of centrifugation, the collector, in the form of oleic acid, was removedby adsorption onto the surfaces of cells and tubes because of the insoluble characteristics of oleic acidat a low pH. Therefore, the high adsorption amounts at low pH were not caused by the adsorption ofNaOL onto the mineral surfaces but the removal of NaOL as the result of hydrolysis. The flotation wasaffected positively by the adsorption at relatively high pH due to the weaker hydrolysis.
3.3. Zeta Potential
Figure 11 presents the zeta potentials of zircon and cassiterite as a function of pH. The resultsindicated that the surface charges of both minerals became more negative when the pH increased.The isoelectric points (IEPs) of the zircon and cassiterite minerals were calculated to be at pH 3.8 and4.5, respectively. The IEP of zircon is higher than that of cassiterite. Bogdanova et al. reported the IEPof cassiterite was located in the region of 3.8−5.5, depending on the sample origin, type of electrolyte,and the determination procedure [21]. In addition, the measured data of cassiterite and zircon were inexcellent agreement with the results reported by Wang et al. [22] and Moreno et al. [23], respectively.When the pH of the suspension was lower than the IEP, the mineral surfaces were charged positively,and the zeta potentials got more negative with the increase of pH from the IEP.

Minerals 2017, 7, 108 11 of 18
Minerals 2017, 7, 108 11 of 18
1 2 3 4 5 6 7 8 9 10 11 12 13-60
-50
-40
-30
-20
-10
0
10
20
30
Zet
a po
tent
ial (
mV
)
pH
Zircon Cassiterite
Figure 11. Zeta potentials of zircon and cassiterite as a function of pH.
The zeta potentials of zircon and cassiterite minerals in the presence of Fe3+ and/or NaOL as a function of pH are shown in Figures 12 and 13, respectively. Fe3+ had a strong influence on the zeta potentials of both minerals. The minerals acquired an increasingly positive charge at approximately pH 4−5, and after reaching that highest value, the zeta potentials of the minerals decreased, with a charge reversal occurring at pH 7−8. The behaviors of zeta potentials can be inferred to be caused by the adsorption/precipitation of Fe3+ onto the negatively charged mineral surfaces through electrostatic interactions. The concentration of NaOL had a slight effect on the zeta potentials of the minerals in the whole pH range. The NaOL collector decreased the negative charges of zircon and cassiterite at acidic pH. The zeta potentials of the minerals were more positive in the presence of NaOL and Fe3+, compared to NaOL alone. However, the zeta potentials between the two minerals had differences in the presence of Fe3+ alone. The charges of the zircon surfaces were more positive than that of cassiterite below pH 7.
1 2 3 4 5 6 7 8 9 10 11 12 13
-60
-40
-20
0
20
40
60
Zet
a po
tent
ial (
mV
)
pH
Zircon+Fe3+
Zircon+NaOL
Zircon+Fe3++NaOL
Figure 12. Zeta potential of zircon as a function of pH in the presence of Fe3+ and/or NaOL (Fe3+: 8 × 10⁻⁵ mol/L; NaOL: 4 × 10⁻⁴ mol/L).
Figure 11. Zeta potentials of zircon and cassiterite as a function of pH.
The zeta potentials of zircon and cassiterite minerals in the presence of Fe3+ and/or NaOL asa function of pH are shown in Figures 12 and 13, respectively. Fe3+ had a strong influence on the zetapotentials of both minerals. The minerals acquired an increasingly positive charge at approximatelypH 4−5, and after reaching that highest value, the zeta potentials of the minerals decreased, witha charge reversal occurring at pH 7−8. The behaviors of zeta potentials can be inferred to be caused bythe adsorption/precipitation of Fe3+ onto the negatively charged mineral surfaces through electrostaticinteractions. The concentration of NaOL had a slight effect on the zeta potentials of the minerals inthe whole pH range. The NaOL collector decreased the negative charges of zircon and cassiterite atacidic pH. The zeta potentials of the minerals were more positive in the presence of NaOL and Fe3+,compared to NaOL alone. However, the zeta potentials between the two minerals had differences inthe presence of Fe3+ alone. The charges of the zircon surfaces were more positive than that of cassiteritebelow pH 7.
Minerals 2017, 7, 108 11 of 18
1 2 3 4 5 6 7 8 9 10 11 12 13-60
-50
-40
-30
-20
-10
0
10
20
30
Zet
a po
tent
ial (
mV
)
pH
Zircon Cassiterite
Figure 11. Zeta potentials of zircon and cassiterite as a function of pH.
The zeta potentials of zircon and cassiterite minerals in the presence of Fe3+ and/or NaOL as a function of pH are shown in Figures 12 and 13, respectively. Fe3+ had a strong influence on the zeta potentials of both minerals. The minerals acquired an increasingly positive charge at approximately pH 4−5, and after reaching that highest value, the zeta potentials of the minerals decreased, with a charge reversal occurring at pH 7−8. The behaviors of zeta potentials can be inferred to be caused by the adsorption/precipitation of Fe3+ onto the negatively charged mineral surfaces through electrostatic interactions. The concentration of NaOL had a slight effect on the zeta potentials of the minerals in the whole pH range. The NaOL collector decreased the negative charges of zircon and cassiterite at acidic pH. The zeta potentials of the minerals were more positive in the presence of NaOL and Fe3+, compared to NaOL alone. However, the zeta potentials between the two minerals had differences in the presence of Fe3+ alone. The charges of the zircon surfaces were more positive than that of cassiterite below pH 7.
1 2 3 4 5 6 7 8 9 10 11 12 13
-60
-40
-20
0
20
40
60
Zet
a po
tent
ial (
mV
)
pH
Zircon+Fe3+
Zircon+NaOL
Zircon+Fe3++NaOL
Figure 12. Zeta potential of zircon as a function of pH in the presence of Fe3+ and/or NaOL (Fe3+: 8 × 10⁻⁵ mol/L; NaOL: 4 × 10⁻⁴ mol/L). Figure 12. Zeta potential of zircon as a function of pH in the presence of Fe3+ and/or NaOL (Fe3+:8 × 10⁻⁵ mol/L; NaOL: 4 × 10⁻⁴ mol/L).
Minerals 2017, 7, 108 12 of 18
Minerals 2017, 7, 108 12 of 18
1 2 3 4 5 6 7 8 9 10 11 12 13-60
-40
-20
0
20
40
Zet
a po
tent
ial (
mV
)
pH
Cassiterite+Fe3+
Cassiterite+NaOL
Cassiterite+Fe3++NaOL
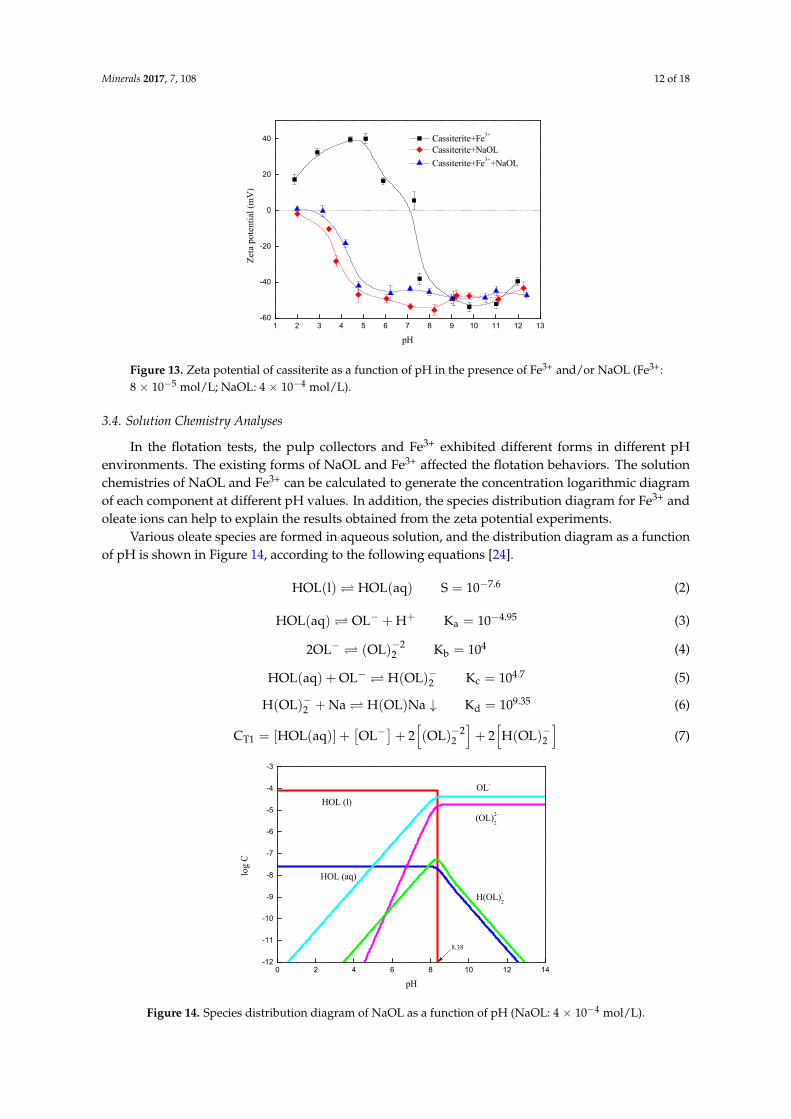
Figure 13. Zeta potential of cassiterite as a function of pH in the presence of Fe3+ and/or NaOL (Fe3+: 8 × 10⁻⁵ mol/L; NaOL: 4 × 10⁻⁴ mol/L).
3.4. Solution Chemistry Analyses
In the flotation tests, the pulp collectors and Fe3+ exhibited different forms in different pH environments. The existing forms of NaOL and Fe3+ affected the flotation behaviors. The solution chemistries of NaOL and Fe3+ can be calculated to generate the concentration logarithmic diagram of each component at different pH values. In addition, the species distribution diagram for Fe3+ and oleate ions can help to explain the results obtained from the zeta potential experiments.
Various oleate species are formed in aqueous solution, and the distribution diagram as a function of pH is shown in Figure 14, according to the following equations [24]. HOL(l) ⇌ HOL(aq) S = 10 .
(2) HOL(aq) ⇌ OL + H K = 10 . (3) 2OL ⇌ (OL) K = 10 (4) HOL(aq) + OL ⇌ H(OL) K = 10 . (5) H(OL) + Na ⇌ H(OL)Na ↓ K = 10 . (6) C = [HOL(aq)] + [OL ] + 2[(OL) ] + 2[H(OL) ] (7)
0 2 4 6 8 10 12 14-12
-11
-10
-9
-8
-7
-6
-5
-4
-3
HOL (l)
HOL (aq)
OL-
(OL)2-
2
log
C
pH
H(OL)-
2
8.38
Figure 14. Species distribution diagram of NaOL as a function of pH (NaOL: 4 × 10⁻⁴ mol/L).
Figure 13. Zeta potential of cassiterite as a function of pH in the presence of Fe3+ and/or NaOL (Fe3+:8 × 10⁻⁵ mol/L; NaOL: 4 × 10⁻⁴ mol/L).
3.4. Solution Chemistry Analyses
In the flotation tests, the pulp collectors and Fe3+ exhibited different forms in different pHenvironments. The existing forms of NaOL and Fe3+ affected the flotation behaviors. The solutionchemistries of NaOL and Fe3+ can be calculated to generate the concentration logarithmic diagramof each component at different pH values. In addition, the species distribution diagram for Fe3+ andoleate ions can help to explain the results obtained from the zeta potential experiments.
Various oleate species are formed in aqueous solution, and the distribution diagram as a functionof pH is shown in Figure 14, according to the following equations [24].
HOL(l) HOL(aq) S = 10−7.6 (2)
HOL(aq) OL− + H+ Ka = 10−4.95 (3)
2OL− (OL)−22 Kb = 104 (4)
HOL(aq) + OL− H(OL)−2 Kc = 104.7 (5)
H(OL)−2 + Na H(OL)Na ↓ Kd = 109.35 (6)
CT1 = [HOL(aq)] +[OL−
]+ 2[(OL)−2
2
]+ 2[H(OL)−2
](7)
Minerals 2017, 7, 108 12 of 18
1 2 3 4 5 6 7 8 9 10 11 12 13-60
-40
-20
0
20
40
Zet
a po
tent
ial (
mV
)
pH
Cassiterite+Fe3+
Cassiterite+NaOL
Cassiterite+Fe3++NaOL
Figure 13. Zeta potential of cassiterite as a function of pH in the presence of Fe3+ and/or NaOL (Fe3+: 8 × 10⁻⁵ mol/L; NaOL: 4 × 10⁻⁴ mol/L).
3.4. Solution Chemistry Analyses
In the flotation tests, the pulp collectors and Fe3+ exhibited different forms in different pH environments. The existing forms of NaOL and Fe3+ affected the flotation behaviors. The solution chemistries of NaOL and Fe3+ can be calculated to generate the concentration logarithmic diagram of each component at different pH values. In addition, the species distribution diagram for Fe3+ and oleate ions can help to explain the results obtained from the zeta potential experiments.
Various oleate species are formed in aqueous solution, and the distribution diagram as a function of pH is shown in Figure 14, according to the following equations [24]. HOL(l) ⇌ HOL(aq) S = 10 .
(2) HOL(aq) ⇌ OL + H K = 10 . (3) 2OL ⇌ (OL) K = 10 (4) HOL(aq) + OL ⇌ H(OL) K = 10 . (5) H(OL) + Na ⇌ H(OL)Na ↓ K = 10 . (6) C = [HOL(aq)] + [OL ] + 2[(OL) ] + 2[H(OL) ] (7)
0 2 4 6 8 10 12 14-12
-11
-10
-9
-8
-7
-6
-5
-4
-3
HOL (l)
HOL (aq)
OL-
(OL)2-
2
log
C
pH
H(OL)-
2
8.38
Figure 14. Species distribution diagram of NaOL as a function of pH (NaOL: 4 × 10⁻⁴ mol/L). Figure 14. Species distribution diagram of NaOL as a function of pH (NaOL: 4 × 10⁻⁴ mol/L).

Minerals 2017, 7, 108 13 of 18
Similarly, the species distribution of Fe3+ was calculated according to the equations listedbelow [25], and the diagram is shown in Figure 15.
Fe3+ + OH− Fe(OH)2+ βa = 1011.8 (8)
Fe3+ + 2OH− Fe(OH)+2 βb = 1022.3 (9)
Fe3+ + 3OH− Fe(OH)3(aq) βc = 1032.05 (10)
Fe3+ + 4OH− Fe(OH)−4 βd = 1034.3 (11)
Fe(OH)3(s) Fe3+ + 3OH− KSP = 10−38.8 (12)
Minerals 2017, 7, 108 13 of 18
Similarly, the species distribution of Fe3+ was calculated according to the equations listed below [25], and the diagram is shown in Figure 15. Fe + OH ⇌ Fe(OH) β = 10 . (8) Fe + 2OH ⇌ Fe(OH) β = 10 . (9) Fe + 3OH ⇌ Fe(OH) (aq) β = 10 . (10) Fe + 4OH ⇌ Fe(OH) β = 10 . (11) Fe(OH) (s) ⇌ Fe +3OH K = 10 . (12)
0 1 2 3 4 5 6 7 8 9 10 11 12 13 14-26
-24
-22
-20
-18
-16
-14
-12
-10
-8
-6
-4
-2
0
Fe(OH)-
4
Fe(OH)3(s)
Fe(OH)3(aq)
Fe(OH)+
2
Fe(OH)2+
log
C
pH
2.43
Fe3+
Figure 15. Species distribution diagram of Fe3+ as a function of pH (Fe3+: 8 × 10⁻⁵ mol/L).
Figure 14 shows that all the species of the NaOL collector had a negative charge at pH > 8.38, thereby promoting the electrostatic interactions between the minerals and collector. The negatively charged oleate ions and dimers existed in the basic pH region and below pH 8.38, where NaOL was in the form of non-dissociated oleic acid. The recoveries of zircon and cassiterite (Figures 7 and 8) had a trend of being the same as that of H(OL)− 2 , existing at pH 4–14, increasing at the beginning and then decreasing. As a result, H(OL)− 2 was confirmed as the predominant species which significantly affected the flotation behaviors. NaOL decreased the negative charges of the zircon at acidic pH, indicating that the negatively charged species of NaOL in solution were adsorbed onto the mineral surfaces. Figure 15 shows the positively charged Fe3+, Fe(OH)2+, and Fe(OH)+
2 species all existed across the acidic pH region, and above pH 8, the main species were molecular Fe(OH)3 and Fe(OH)− 4
. Fe3+ was the main species below pH 3, which interacted with OL−, generating the precipitation of Fe(OL)3 which decreased the concentration of NaOL. Hence, there was an abnormal adsorption of NaOL and the flotation of both minerals was inhibited. The zeta potential tests (Figures 12 and 13) show that the addition of Fe3+ changed the surface charges of zircon and cassiterite to positive from negative at acidic pH, which indicated that the species of Fe3+ were expected to adsorb on the zircon and cassiterite mineral surfaces in this pH region. According to the theory of electrostatic attraction, a positive surface can attract the negatively charged species. In theory, the flotation of both zircon and cassiterite should be enhanced in the presence of Fe3+. In contrast, the flotation of cassiterite was decreased, which can be inferred to be due to the adsorption of Fe(OH)3(s) on cassiterite surfaces, while Fe(OH)3(s) had the similar zeta potentials to that of cassiterite measured with Fe3+ alone [26]. This also indicated that the surface of the cassiterite was covered with Fe(OH)3(s) and that a hydrophilic film formed which prevented the adsorption of NaOL to inhibit the flotation. The reason that the zeta potentials of zircon were further below pH 7 than that of cassiterite, was that the
Figure 15. Species distribution diagram of Fe3+ as a function of pH (Fe3+: 8 × 10⁻⁵ mol/L).
Figure 14 shows that all the species of the NaOL collector had a negative charge at pH > 8.38,thereby promoting the electrostatic interactions between the minerals and collector. The negativelycharged oleate ions and dimers existed in the basic pH region and below pH 8.38, where NaOL wasin the form of non-dissociated oleic acid. The recoveries of zircon and cassiterite (Figures 7 and 8)had a trend of being the same as that of H(OL)−2 , existing at pH 4–14, increasing at the beginning andthen decreasing. As a result, H(OL)−2 was confirmed as the predominant species which significantlyaffected the flotation behaviors. NaOL decreased the negative charges of the zircon at acidic pH,indicating that the negatively charged species of NaOL in solution were adsorbed onto the mineralsurfaces. Figure 15 shows the positively charged Fe3+, Fe(OH)2+, and Fe(OH)+2 species all existedacross the acidic pH region, and above pH 8, the main species were molecular Fe(OH)3 and Fe(OH)−4 .Fe3+ was the main species below pH 3, which interacted with OL−, generating the precipitation ofFe(OL)3 which decreased the concentration of NaOL. Hence, there was an abnormal adsorption ofNaOL and the flotation of both minerals was inhibited. The zeta potential tests (Figures 12 and 13)show that the addition of Fe3+ changed the surface charges of zircon and cassiterite to positive fromnegative at acidic pH, which indicated that the species of Fe3+ were expected to adsorb on the zirconand cassiterite mineral surfaces in this pH region. According to the theory of electrostatic attraction,a positive surface can attract the negatively charged species. In theory, the flotation of both zirconand cassiterite should be enhanced in the presence of Fe3+. In contrast, the flotation of cassiterite wasdecreased, which can be inferred to be due to the adsorption of Fe(OH)3(s) on cassiterite surfaces, whileFe(OH)3(s) had the similar zeta potentials to that of cassiterite measured with Fe3+ alone [26]. Thisalso indicated that the surface of the cassiterite was covered with Fe(OH)3(s) and that a hydrophilicfilm formed which prevented the adsorption of NaOL to inhibit the flotation. The reason that the zeta
Minerals 2017, 7, 108 14 of 18
potentials of zircon were further below pH 7 than that of cassiterite, was that the adsorption of thepositively charged species, including Fe3+, Fe(OH)2+ and Fe(OH)+2 , enhanced the adsorption of NaOL,thus promoting flotation.
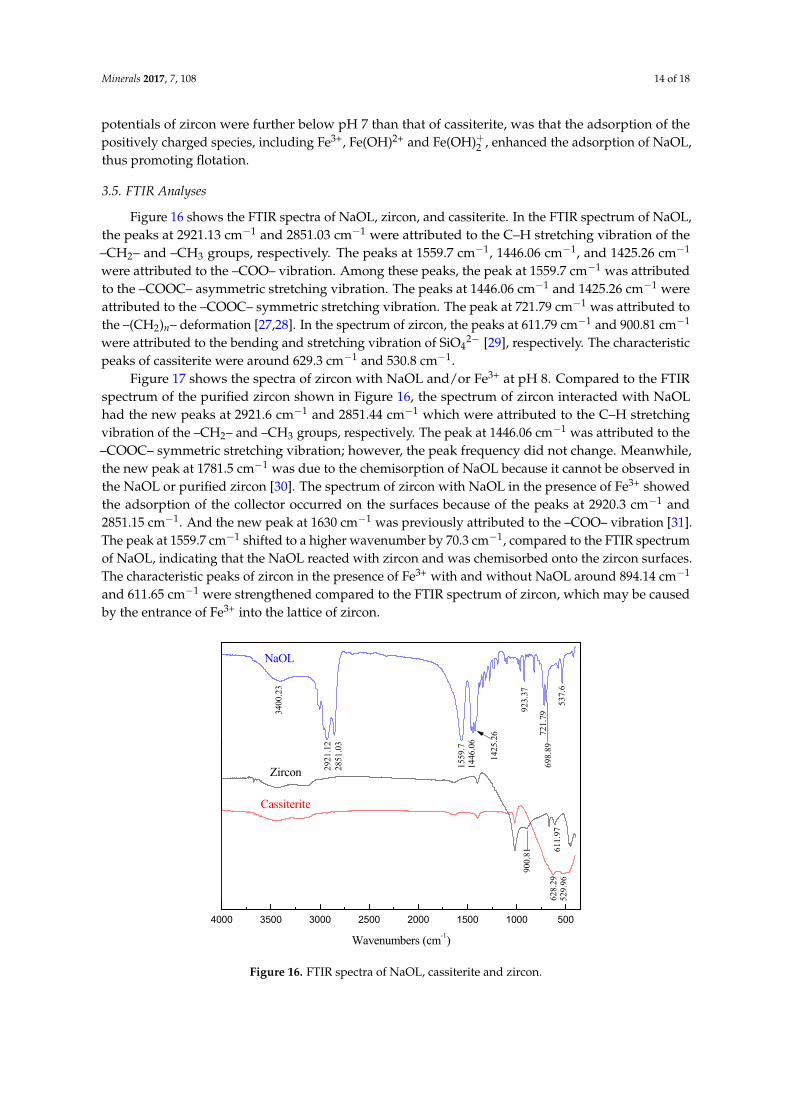
3.5. FTIR Analyses
Figure 16 shows the FTIR spectra of NaOL, zircon, and cassiterite. In the FTIR spectrum of NaOL,the peaks at 2921.13 cm−1 and 2851.03 cm−1 were attributed to the C–H stretching vibration of the–CH2– and –CH3 groups, respectively. The peaks at 1559.7 cm−1, 1446.06 cm−1, and 1425.26 cm−1
were attributed to the –COO– vibration. Among these peaks, the peak at 1559.7 cm−1 was attributedto the –COOC– asymmetric stretching vibration. The peaks at 1446.06 cm−1 and 1425.26 cm−1 wereattributed to the –COOC– symmetric stretching vibration. The peak at 721.79 cm−1 was attributed tothe –(CH2)n– deformation [27,28]. In the spectrum of zircon, the peaks at 611.79 cm−1 and 900.81 cm−1
were attributed to the bending and stretching vibration of SiO42− [29], respectively. The characteristic
peaks of cassiterite were around 629.3 cm−1 and 530.8 cm−1.Figure 17 shows the spectra of zircon with NaOL and/or Fe3+ at pH 8. Compared to the FTIR
spectrum of the purified zircon shown in Figure 16, the spectrum of zircon interacted with NaOLhad the new peaks at 2921.6 cm−1 and 2851.44 cm−1 which were attributed to the C–H stretchingvibration of the –CH2– and –CH3 groups, respectively. The peak at 1446.06 cm−1 was attributed to the–COOC– symmetric stretching vibration; however, the peak frequency did not change. Meanwhile,the new peak at 1781.5 cm−1 was due to the chemisorption of NaOL because it cannot be observed inthe NaOL or purified zircon [30]. The spectrum of zircon with NaOL in the presence of Fe3+ showedthe adsorption of the collector occurred on the surfaces because of the peaks at 2920.3 cm−1 and2851.15 cm−1. And the new peak at 1630 cm−1 was previously attributed to the –COO– vibration [31].The peak at 1559.7 cm−1 shifted to a higher wavenumber by 70.3 cm−1, compared to the FTIR spectrumof NaOL, indicating that the NaOL reacted with zircon and was chemisorbed onto the zircon surfaces.The characteristic peaks of zircon in the presence of Fe3+ with and without NaOL around 894.14 cm−1
and 611.65 cm−1 were strengthened compared to the FTIR spectrum of zircon, which may be causedby the entrance of Fe3+ into the lattice of zircon.
Minerals 2017, 7, 108 14 of 18
adsorption of the positively charged species, including Fe3+, Fe(OH)2+ and Fe(OH)+ 2 , enhanced the
adsorption of NaOL, thus promoting flotation.
3.5. FTIR Analyses
Figure 16 shows the FTIR spectra of NaOL, zircon, and cassiterite. In the FTIR spectrum of NaOL, the peaks at 2921.13 cm−1 and 2851.03 cm−1 were attributed to the C–H stretching vibration of the –CH2– and –CH3 groups, respectively. The peaks at 1559.7 cm−1, 1446.06 cm−1, and 1425.26 cm−1 were attributed to the –COO– vibration. Among these peaks, the peak at 1559.7 cm−1 was attributed to the –COOC– asymmetric stretching vibration. The peaks at 1446.06 cm−1 and 1425.26 cm−1 were attributed to the –COOC– symmetric stretching vibration. The peak at 721.79 cm−1 was attributed to the –(CH2)n– deformation [27,28]. In the spectrum of zircon, the peaks at 611.79 cm−1 and 900.81 cm−1 were attributed to the bending and stretching vibration of SiO42− [29], respectively. The characteristic peaks of cassiterite were around 629.3 cm−1 and 530.8 cm−1.
Figure 17 shows the spectra of zircon with NaOL and/or Fe3+ at pH 8. Compared to the FTIR spectrum of the purified zircon shown in Figure 16, the spectrum of zircon interacted with NaOL had the new peaks at 2921.6 cm−1 and 2851.44 cm−1 which were attributed to the C–H stretching vibration of the –CH2– and –CH3 groups, respectively. The peak at 1446.06 cm−1 was attributed to the –COOC– symmetric stretching vibration; however, the peak frequency did not change. Meanwhile, the new peak at 1781.5 cm−1 was due to the chemisorption of NaOL because it cannot be observed in the NaOL or purified zircon [30]. The spectrum of zircon with NaOL in the presence of Fe3+ showed the adsorption of the collector occurred on the surfaces because of the peaks at 2920.3 cm−1 and 2851.15 cm−1. And the new peak at 1630 cm−1 was previously attributed to the –COO– vibration [31]. The peak at 1559.7 cm−1 shifted to a higher wavenumber by 70.3 cm−1, compared to the FTIR spectrum of NaOL, indicating that the NaOL reacted with zircon and was chemisorbed onto the zircon surfaces. The characteristic peaks of zircon in the presence of Fe3+ with and without NaOL around 894.14 cm−1 and 611.65 cm−1 were strengthened compared to the FTIR spectrum of zircon, which may be caused by the entrance of Fe3+ into the lattice of zircon.
4000 3500 3000 2500 2000 1500 1000 500
529.
9662
8.29
537.
6
698.
8972
1.79
923.
37
1425
.26
1446
.06
1559
.7
2851
.03
2921
.12
3400
.23
611.
97
900.
81
NaOL
Cassiterite
Wavenumbers (cm-1)
Zircon
Figure 16. FTIR spectra of NaOL, cassiterite and zircon. Figure 16. FTIR spectra of NaOL, cassiterite and zircon.

Minerals 2017, 7, 108 15 of 18Minerals 2017, 7, 108 15 of 18
4000 3500 3000 2500 2000 1500 1000 500
Zircon + NaOL+Fe3+
1633
1788
.74
1633
1788
.74
611.
65
894.
14
2851
.15
2920
.39
1444
.93
1787
.5
2851
.44
2921
.6
611.
86
891.
8
611.
8
Zircon +Fe3+
Zircon + NaOL+Fe3+
Zircon + NaOL
Wavenumbers (cm-1)
1850 1800 1750 1700 1650 1600 155092
93
94
95
96
97
98
A
Figure 17. FTIR spectra of Zircon with NaOL and/or Fe3+ at pH 8 (NaOL: 4 × 10⁻⁴ mol/L; Fe3+: 8 × 10⁻⁵
mol/L).
Figure 18 shows the spectra of cassiterite with NaOL and/or Fe3+ at pH 8. The new peaks at 2922.11 cm−1 and 2852.85 cm−1 were also attributed to the C–H stretching vibration of the –CH2– and –CH3 groups, respectively. The frequency did not change. The new peak at 1638.5 cm−1 was previously attributed to the –COO– vibration. The peak at 1538.5 cm−1 shifted to a lower wavenumber by 21.2 cm−1, compared to the FTIR spectrum of NaOL, and the new peak at 1020.49 cm−1 indicated that a chemical reaction occurred [32]. The spectrum of cassiterite with NaOL in the presence of Fe3+ shows a weaker peak at 2923.7 cm−1, and the peaks at 1538.5 cm−1 and 1020.49 cm−1 disappeared. The results illustrated that the addition of Fe3+ weakened both the physical and chemical adsorption of NaOL onto the cassiterite surfaces. As a result, the flotation was decreased after adding Fe3+.
4000 3500 3000 2500 2000 1500 1000 500
1538
.5
Cassiterite + NaOL
530.
6163
9.4
531.
663
2.4
2923
.7
1538
.5
531
632.
6
1020
.49
2852
.85
Cassiterite +Fe3+
Cassiterite + NaOL+Fe3+
Wavenumbers (cm-1)
Cassiterite + NaOL
2922
.11
1600155015001450140095.095.295.495.695.896.096.2
Wavenumbers (cm-1)
Figure 18. FTIR spectra of cassiterite with NaOL and/or Fe3+ at pH 8 (NaOL: 4 × 10⁻⁴ mol/L; Fe3+: 8 × 10⁻⁵ mol/L).
Figure 17. FTIR spectra of Zircon with NaOL and/or Fe3+ at pH 8 (NaOL: 4 × 10⁻⁴ mol/L; Fe3+:8 × 10⁻⁵ mol/L).
Figure 18 shows the spectra of cassiterite with NaOL and/or Fe3+ at pH 8. The new peaks at2922.11 cm−1 and 2852.85 cm−1 were also attributed to the C–H stretching vibration of the –CH2–and –CH3 groups, respectively. The frequency did not change. The new peak at 1638.5 cm−1 waspreviously attributed to the –COO– vibration. The peak at 1538.5 cm−1 shifted to a lower wavenumberby 21.2 cm−1, compared to the FTIR spectrum of NaOL, and the new peak at 1020.49 cm−1 indicatedthat a chemical reaction occurred [32]. The spectrum of cassiterite with NaOL in the presence of Fe3+
shows a weaker peak at 2923.7 cm−1, and the peaks at 1538.5 cm−1 and 1020.49 cm−1 disappeared.The results illustrated that the addition of Fe3+ weakened both the physical and chemical adsorptionof NaOL onto the cassiterite surfaces. As a result, the flotation was decreased after adding Fe3+.
Minerals 2017, 7, 108 15 of 18
4000 3500 3000 2500 2000 1500 1000 500
Zircon + NaOL+Fe3+16
33
1788
.74
1633
1788
.74
611.
65
894.
14
2851
.15
2920
.39
1444
.93
1787
.5
2851
.44
2921
.6
611.
86
891.
8
611.
8
Zircon +Fe3+
Zircon + NaOL+Fe3+
Zircon + NaOL
Wavenumbers (cm-1)
1850 1800 1750 1700 1650 1600 155092
93
94
95
96
97
98
A
Figure 17. FTIR spectra of Zircon with NaOL and/or Fe3+ at pH 8 (NaOL: 4 × 10⁻⁴ mol/L; Fe3+: 8 × 10⁻⁵
mol/L).
Figure 18 shows the spectra of cassiterite with NaOL and/or Fe3+ at pH 8. The new peaks at 2922.11 cm−1 and 2852.85 cm−1 were also attributed to the C–H stretching vibration of the –CH2– and –CH3 groups, respectively. The frequency did not change. The new peak at 1638.5 cm−1 was previously attributed to the –COO– vibration. The peak at 1538.5 cm−1 shifted to a lower wavenumber by 21.2 cm−1, compared to the FTIR spectrum of NaOL, and the new peak at 1020.49 cm−1 indicated that a chemical reaction occurred [32]. The spectrum of cassiterite with NaOL in the presence of Fe3+ shows a weaker peak at 2923.7 cm−1, and the peaks at 1538.5 cm−1 and 1020.49 cm−1 disappeared. The results illustrated that the addition of Fe3+ weakened both the physical and chemical adsorption of NaOL onto the cassiterite surfaces. As a result, the flotation was decreased after adding Fe3+.
4000 3500 3000 2500 2000 1500 1000 500
1538
.5
Cassiterite + NaOL
530.
6163
9.4
531.
663
2.4
2923
.7
1538
.5
531
632.
6
1020
.49
2852
.85
Cassiterite +Fe3+
Cassiterite + NaOL+Fe3+
Wavenumbers (cm-1)
Cassiterite + NaOL
2922
.11
1600155015001450140095.095.295.495.695.896.096.2
Wavenumbers (cm-1)
Figure 18. FTIR spectra of cassiterite with NaOL and/or Fe3+ at pH 8 (NaOL: 4 × 10⁻⁴ mol/L; Fe3+: 8 × 10⁻⁵ mol/L).
Figure 18. FTIR spectra of cassiterite with NaOL and/or Fe3+ at pH 8 (NaOL: 4 × 10⁻⁴ mol/L; Fe3+:8 × 10⁻⁵ mol/L).

Minerals 2017, 7, 108 16 of 18
4. Conclusions
(1) The single mineral flotation of zircon and cassiterite using sodium oleate (NaOL) as an anioniccollector with and without Fe3+ was conducted. The results indicated that NaOL performed badlyin the zircon flotation separation from cassiterite without Fe3+, due to the strong collecting powerand weak selectivity of NaOL. The recoveries of both zircon and cassiterite, being restricted by thehydrophobic surfaces of flotation cells made up with organic glass, reached around 90% when theconcentration of NaOL was 4 × 10⁻⁴ mol/L. The flotation of zircon using 4 × 10⁻⁴ mol/L NaOL with8 × 10−5 mol/L Fe3+ at pH 6−9 was slightly increased and the recovery increased by 5–7%, whilethat of cassiterite was inhibited across the whole pH range and a 30% change was obtained for themaximum decrease of recovery.
(2) Based on the adsorption tests, zeta potential measurements, and solution chemistry analyses,we confirmed that adsorption of NaOL on both zircon and cassiterite surfaces had occurred in theNaOL system. Adsorption tests indicated that the addition of Fe3+ can enhance the adsorption ofthe collector on zircon surfaces while weakening adsorption on cassiterite surfaces. Furthermore, theabnormal adsorption of NaOL was caused by the excessively low pH where the adsorption cannot beachieved effectively. Zeta potential measurements and solution chemistry analyses confirmed H(OL)−2as the predominant species which significantly affected the flotation behaviors. The adsorption ofpositively charged species of Fe3+ caused the negative charges of both minerals to become more positiveat acidic pH, while the positive charges of cassiterite were caused by the adsorption of Fe(OH)3(s), andthen the hydrophilic film formed and the flotation was decreased. Meanwhile, the surface of zirconattracted the positively charged species of Fe3+, which enhanced the adsorption of the negativelycharged species of NaOL, and so the flotation was slightly increased.
(3) FTIR analyses indicated that the adsorption of the collector onto the surfaces of zircon andcassiterite was chemisorption. After the addition of Fe3+ into NaOL flotation system, the peaks ofzircon around 894.14 cm−1 and 611.65 cm−1 were strengthened compared to the FTIR spectrum ofzircon, which was caused by the entrance of Fe3+ into the lattice of zircon. Meanwhile, a new peakwas observed at 1633 cm−1 and was previously attributed to the –COO– vibration, and was causedby chemisorption. As a result, Fe3+ slightly increased the flotation of zircon. In contrast, the additionof Fe3+ caused the peaks of NaOL at 2923.7 cm−1 to weaken, and the peaks at 1538.5 cm−1 and1020.49 cm−1 disappeared. As a result, the flotation of cassiterite was inhibited. The FTIR results werein good agreement with the flotation tests.
Acknowledgments: This project was supported by the Hubei province key laboratory of processing of mineralresources and environment, Wuhan, China.
Author Contributions: W.L. and H.P. conceived and designed the experiments; H.P., D.W. and X.B. performedthe experiments; W.L. and D.W. analyzed the data; Y.L. contributed reagents/materials/analysis tools; W.L. andH.S. wrote the paper.
Conflicts of Interest: The authors declare no conflict of interest.
References
1. Tejankella, M.S.; Chittleborough, D.J.; Fitzpatrick, R.W. Weathering assessment of heavy minerals in agesequences of Australian sandy soils. Soil Sci. Soc. Am. J. 1991, 55, 427–438. [CrossRef]
2. Nduwa-Mushidi, J.; Anderson, C.G. Surface chemistry and flotation behaviors of monazite-apatite-ilmenite-quartz-rutile-zircon with octanohydroxamic acid. J. Sustain. Metall. 2017, 3, 62–72. [CrossRef]
3. Adegoroye, A.; Wang, L.; Omotoso, O.; Xu, Z.; Masliyah, J. Characterization of organic-coated solids isolatedfrom different oil sands. Can. J. Chem. Eng. 2010, 88, 462–470. [CrossRef]
4. Zhang, Y.; Anderson, C. A comparison of sodium silicate and ammonium lignosulfonate effects on xenotimeand selected gangue mineral microflotation. Miner. Eng. 2017, 100, 1–8. [CrossRef]
5. Marshall, G.M.; Patarachao, B.; Moran, K.; Mercier, P.H.J. Zircon mineral solids concentrated from athabascaoil sands froth treatment tailings: Surface chemistry and flotation properties. Miner. Eng. 2014, 65, 79–87.[CrossRef]

Minerals 2017, 7, 108 17 of 18
6. Wei, L.; Sun, M. Numerical studies of the influence of particles’ size distribution characteristics on the gravityseparation performance of liquid-solid fluidized bed separator. Int. J. Miner. Process. 2016, 157, 111–119.[CrossRef]
7. Prinsloo, A. The formation of chemical precipitates in the hal process and its impact on electrostatic separationof zircon and rutile minerals. J. Clim. 2005, 21, 3601–3611.
8. Gül, A. Flotation behaviours of microlite and zircon. Miner. Eng. 2004, 17, 561–563. [CrossRef]9. Bulatovic, S.M. 25-flotation of titanium minerals. In Handbook of Flotation Reagents: Chemistry, Theory and
Practice; Elsevier: Amsterdam, The Netherlands, 2010; pp. 175–207.10. Pavez, O.; Peres, A.E.C. Effect of sodium metasilicate and sodium sulphide on the floatability of
monazite-zircon-rutile with oleate and hydroxamates. Miner. Eng. 1993, 6, 69–78. [CrossRef]11. Abeidu, A.M. The separation of monazite from zircon by flotation. J. Less Common Met. 1972, 29, 113–119.
[CrossRef]12. Xia, L.; Hart, B.; Loshusan, B. A tof-sims analysis of the effect of lead nitrate on rare earth flotation. Miner. Eng.
2015, 70, 119–129. [CrossRef]13. Bulatovic, S.; Silvio, E.D. Process development for impurity removal from a tin gravity concentrate.
Miner. Eng. 2000, 13, 871–879. [CrossRef]14. Petermann, T.; Seifert, T. Trace element-rich cassiterite (‘wood tin’) from central saxony, germany. Int. J.
Manuf. Res. 2011, 6, 110–121.15. Ejtemaei, M.; Irannajad, M.; Gharabaghi, M. Role of dissolved mineral species in selective flotation of
smithsonite from quartz using oleate as collector. Int. J. Miner. Process. 2012, 114, 40–47. [CrossRef]16. El-Salmawy, M.S.; Nakahiro, Y.; Wakamatsu, T. The role of alkaline earth cations in flotation separation of
quartz from feldspar. Miner. Eng. 1993, 6, 1231–1243. [CrossRef]17. Zhang, J.; Wang, W.; Liu, J.; Huang, Y.; Feng, Q.; Zhao, H. Fe(III) as an activator for the flotation of spodumene,
albite, and quartz minerals. Miner. Eng. 2014, 61, 16–22.18. Qin, W.Q.; Ren, L.Y.; Xu, Y.B.; Wang, P.P.; Ma, X.H. Adsorption mechanism of mixed salicylhydroxamic acid
and tributyl phosphate collectors in fine cassiterite electro-flotation system. J. Cent. South Univ. 2012, 19,1711–1717. [CrossRef]
19. Salmawy, M.S.E.; Abdelaal, A.M.; Abdelrahman, A.A.; Gommaa, E.E. Effect of sodium lignin sulfonate,polyoxyethylene glycol and carbonate alkalinity on oleate flotation of zircon, ilmenite and rutile.In Proceedings of the XXIV International Mineral Processing Congress, Beijing, China, 24–24 September 2008.
20. Liu, C.; Feng, Q.; Zhang, G.; Ma, W.; Meng, Q.; Chen, Y. Effects of lead ions on the flotation of hemimorphiteusing sodium oleate. Miner. Eng. 2016, 89, 163–167. [CrossRef]
21. Bogdanova, N.F.; Klebanov, A.V.; Ermakova, L.E.; Sidorova, M.P.; Aleksandrov, D.A. Adsorption of ions onthe surface of tin dioxide and its electrokinetic characteristics in 1 : 1 electrolyte solutions. Colloid J. 2004, 66,409–417. [CrossRef]
22. Wang, P.P.; Qin, W.Q.; Ren, L.Y.; Wei, Q.; Liu, R.Z.; Yang, C.R.; Zhong, S.P. Solution chemistry and utilizationof alkyl hydroxamic acid in flotation of fine cassiterite. Trans. Nonferrous Met. Soc. China 2013, 23, 1789–1796.[CrossRef]
23. Moreno, R.; Moya, J.S.; Requena, J. Slip casting of zircon by using an organic surfactant. Ceram. Int. 1991, 17,37–40. [CrossRef]
24. Shibata, J.; Fuerstenau, D.W. Flocculation and flotation characteristics of fine hematite with sodium oleate.Int. J. Miner. Process. 2003, 72, 25–32. [CrossRef]
25. Ou, L.M.; Huang, S.J.; Zhu, Y.G. Influence of metal ions on floatability of quartz in flotation of sulfide ores.Zhongnan Daxue Xuebao 2012, 43, 407–411. (In Chinese).
26. Feng, Q.M.; Liu, G.S.; Yu, Z.J.; Lu, Y.P.; Ou, L.M.; Zhang, G.F. Influence and mechanism of ferric and ferrousions on flotation of talc. J. Cent. South Univ. 2006, 37, 476–480. (In Chinese).
27. Nájera, J.J. Phase transition behaviour of sodium oleate aerosol particles. Atmos. Environ. 2007, 41, 1041–1052.[CrossRef]
28. Tandon, P.; Raudenkolb, S.; Neubert, R.H.H.; Rettig, W.; Wartewig, S. X-ray diffraction and spectroscopicstudies of oleic acid–sodium oleate. Chem. Phys. Lipids 2001, 109, 37–45. [CrossRef]
29. Wen, W.L.; Zhang, Z.; Huang, J. The Infrared Spectroscopy of Minerals; Chongqing University Press: Chongqing,China, 1988; pp. 72–73. (In Chinese)

Minerals 2017, 7, 108 18 of 18
30. Liu, W.; Zhang, S.; Wang, W.; Zhang, J.; Yan, W.; Deng, J.; Feng, Q.; Huang, Y. The effects of Ca(II) and Mg(II)ions on the flotation of spodumene using NaOL. Miner. Eng. 2015, 79, 40–46. [CrossRef]
31. Liu, W.; Zhang, J.; Wang, W.; Deng, J.; Chen, B.; Yan, W.; Xiong, S.; Huang, Y.; Liu, J. Flotation behaviors ofilmenite, titanaugite, and forsterite using sodium oleate as the collector. Miner. Eng. 2015, 72, 1–9. [CrossRef]
32. Xu, W.; Qin, W. Surface analysis of cassiterite with sodium oleate in aqueous solution. Sep. Sci. Technol.2012, 47, 502–506. [CrossRef]
© 2017 by the authors. Licensee MDPI, Basel, Switzerland. This article is an open accessarticle distributed under the terms and conditions of the Creative Commons Attribution(CC BY) license (http://creativecommons.org/licenses/by/4.0/).

![Zircon geochronology and ca. 400 Ma exhumation of ...hacker.faculty.geol.ucsb.edu/...Zircon...Norwegian.pdf · single zircon 238U/206Pb ages from Krogh et al. [15] define two stages](https://static.fdocuments.net/doc/165x107/5f78b0a55661600ea6216daf/zircon-geochronology-and-ca-400-ma-exhumation-of-single-zircon-238u206pb-ages.jpg)