Study on the determination of optimal parameters for the ... · were performed according to NBR...
16
Study on the determination of optimal parameters for the simulation of the forming process of thick sheets Ibson Ivan Harter; João Henrique Corrêa de Souza Bruning Tecnometal Ltda, Brazil [email protected] ; [email protected] Arjaan Buijk; Zach Pursell Simufact-Americas LLC, Plymouth, Michigan, USA [email protected] ; [email protected] Summary A special meshing technology was implemented in Simufact.forming to create an optimized HEX mesh for thick sheets. This innovative technology enabled efficient non-linear finite element simulations of large, industrial sheet metal forming processes using 3D Solid elements. To validate for what type of processes it is beneficial to use 3D Solid elements, and to determine the optimal modeling parameters, a detailed study was performed at Bruning Tecnometal Ltda., to compare the different simulation methodologies with experimental data. The test samples included: Bending of a “V”-shape from a 31.5 mm thick steel plate Bending of a “U”-shape from an 8 mm thick steel plate Stamping of a complex shape, from a 12 mm thick steel plate It is demonstrated that 3D Solid elements are able to accurately predict the shape after spring-back, the force during forming, the calibration force and the local bending effects due to bulk forging. Keywords: Simulation; Thick Sheet Metal Forming
Transcript of Study on the determination of optimal parameters for the ... · were performed according to NBR...

Study on the determination of optimal parameters for the simulation of the forming process of thick sheets
Ibson Ivan Harter; João Henrique Corrêa de Souza
Bruning Tecnometal Ltda, Brazil
[email protected] ; [email protected]
Arjaan Buijk; Zach Pursell Simufact-Americas LLC, Plymouth, Michigan, USA
[email protected] ; [email protected]
Summary
A special meshing technology was implemented in Simufact.forming to create an optimized HEX mesh for thick sheets. This innovative technology enabled efficient non-linear finite element simulations of large, industrial sheet metal forming processes using 3D Solid elements.
To validate for what type of processes it is beneficial to use 3D Solid elements, and to determine the optimal modeling parameters, a detailed study was performed at Bruning Tecnometal Ltda., to compare the different simulation methodologies with experimental data.
The test samples included:
Bending of a “V”-shape from a 31.5 mm thick steel plate
Bending of a “U”-shape from an 8 mm thick steel plate
Stamping of a complex shape, from a 12 mm thick steel plate
It is demonstrated that 3D Solid elements are able to accurately predict the shape after spring-back, the force during forming, the calibration force and the local bending effects due to bulk forging.
Keywords: Simulation; Thick Sheet Metal Forming

4ª Conferência Internacional de Conformação de Chapas / 1º BrDDRG / 8-10 Oct, 2014 – Porto Alegre, RS – Brasil
1. Introduction
Besides many progress has been made with the new advanced high strength steels, allowing for considerable reduction in structure weight of utilitarian vehicles, several parts still are produced using thick sheets and plates, the most of them for agricultural, freight and civil construction. Analytical methods [1, 2] lack in accuracy and can only be used for very simple geometries [3, 4].
Finite element simulations with Shell elements are well suited to predict stamping processes where the dominant deformation mode is in-plane stretching. Shell elements become in-accurate when the material deformation includes local bulk deformation, and for those cases it is required to use 3D Solid elements. For example, an extreme situation is shown in Figure 1, where sever local bulk deformation occurs that can only be captured by using 3D Solid elements.
Figure 1. Example of sheet metal forming process with local bulk deformation.
Several terminologies are used for these type of processes [5]:
Thick Sheet Metal Forming
Bulk Sheet Metal Forming
Sheet Metal Forging
…
For the purpose of this paper, we will use the name Thick Sheet Metal Forming, because it is a good differentiator for the steel parts under consideration, with a thickness range of 8 to 31.5 mm.
2. Numerical Simulation Approach
2.1 Sheet Meshing with Hex Elements.
As described in [6, 7], a special meshing technique for thick sheets is used. The mesh creation algorithm automatically detects the in-plane vs the thickness direction of a solid geometry, and then generates an efficient mesh to fit that solid geometry. The user can specify the number of HEX elements through the thickness, and the software will recommend the best in-plane element size. The ability to use HEX elements in the simulation is important to provide the most accurate results possible. The HEX elements used are eight node, isoparametric, hexahedral elements. A modified interpolation function is used to improve the shear behavior of the elements. During the simulation, the mesh is automatically updated (re-meshed) when required to enable tracking of the large deformations.
The example shown in Figure 2 shows a mesh with 3 elements through the thickness. One of the objectives of the study presented in this paper is to determine the minimum number of elements through the thickness that are required to get accurate results.

4ª Conferência Internacional de Conformação de Chapas / 1º BrDDRG / 8-10 Oct, 2014 – Porto Alegre, RS – Brasil
Figure 2. Example of an initial and deformed (automatically re-meshed) 3D Solid Mesh
2.2 Elastic-Plastic Material, with Strain hardening and in-plane anisotropy.
The simulations with the 3D Solid elements are all done using a material model that includes an anisotropic, elastic-plastic behavior with strain hardening.
For most metallic alloys, if the stress is below the material yield strength, the material behaves elastically and the stress is proportional to the strain. In this elastic region, the linear stress-strain relation follows Hooke’s Law. When the stress in the material exceeds the yield stress, the material no longer exhibits linear elastic behavior, and the stress-strain relationship becomes nonlinear. Uniaxial material (tensile) test data is used to determine the nonlinear stress-strain behavior of the material.
To correlate the uniaxial tensile test data to the actual part, in which a 3D state of stress exists, a von yield function is utilized. The von Mises yield criteria is commonly used for ductile materials. This criteria states that yielding occurs when the effective or equivalent stress equals the yield stress as measured in the uniaxial test. For sheet metal forming, the material yield stress can be dependent on the rolling direction of the raw material. In such cases the material will have unique mechanical properties in the rolling, transverse and potentially the thickness directions. For this condition, Simufact uses the Hill anisotropic yield function.
Beyond the initial yield stress of the material, the stress-strain relationship is defined by the work or strain hardening of the material. An isotropic hardening law is used that assumes the shape of the yield surface remains the same, but expands due to the material work hardening.
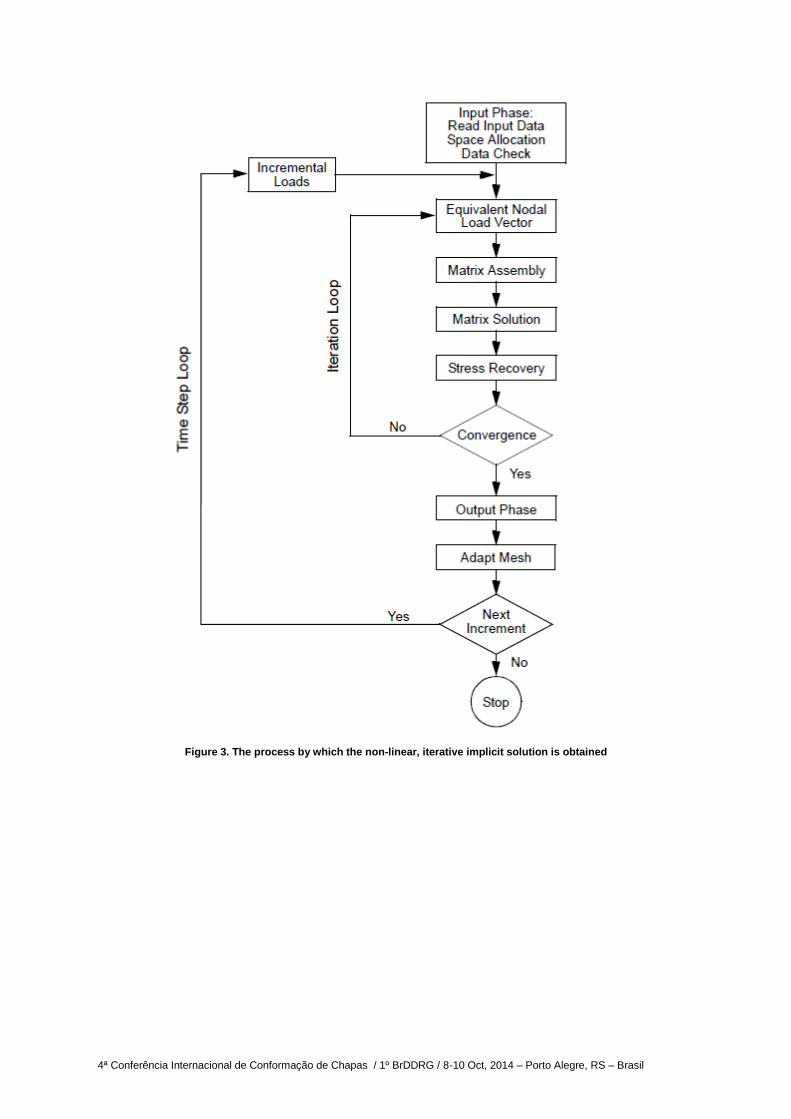
2.3 Implicit Time Integration.
The time integration is implicit. To solve a non-linear problem, including contact, elastic-plastic material and re-meshing, with the implicit time integration method, an iterative approach is used, as depicted in Figure 3.
4ª Conferência Internacional de Conformação de Chapas / 1º BrDDRG / 8-10 Oct, 2014 – Porto Alegre, RS – Brasil
Figure 3. The process by which the non-linear, iterative implicit solution is obtained

4ª Conferência Internacional de Conformação de Chapas / 1º BrDDRG / 8-10 Oct, 2014 – Porto Alegre, RS – Brasil
3 Preparation of Tests
3.1 Material Characterization
All the mechanical properties of the materials were experimentally determined. For each material, test samples were prepared according to standard NBR 8164 (preparation of a test sample), and tests were performed according to NBR 6673 (Determining strain hardening coefficient and anisotropy).
The material properties found are listed in Table 1.
Table 1. Mechanical properties of materials, determined by tests
Property ASTM A572 GR50 DIN EN10149 S420 MC DIN EN10149 S315 MC
Modulus of elasticity 210 GPa 210 GPa 210 GPa
Poisson's ratio 0.3 0.3 0.3
Yield strength 394 MPa 485 MPa 382 MPa
Ultimate strength 486 MPa 538 MPa 480 MPa
Strain hardening coefficient 0.111 0.1745 0.126
In-plane anisotropy 0.995 0.8638 0.911
3.2 Tool and Part Geometry
The geometries of all the tools and parts were designed in a 3D CAD system, and manufactured at the company Bruning Tecnometal Ltda. Figure 4 shows the tooling layout and the final part shape for the three test cases:
Bending of a “V”-shape ; 31.5 mm thick plate ; Material = ASTM A572 GR50
Bending of a “U”-shape ; 8 mm thick plate ; Material = DIN S315 EN10149-2
Complex shape ; 2 mm thick plate ; Material = DIN EN10149 S315 MC

4ª Conferência Internacional de Conformação de Chapas / 1º BrDDRG / 8-10 Oct, 2014 – Porto Alegre, RS – Brasil
Figure 4 – Geometry of the tooling & final shapes for "V", “U” and Complex part (dimensions in mm)

4ª Conferência Internacional de Conformação de Chapas / 1º BrDDRG / 8-10 Oct, 2014 – Porto Alegre, RS – Brasil
3.3 Experimental Data Acquisition
By using instrumented tooling, the actual force values during the forming process were obtained. The tooling is equipped with sensors for measuring both forces and displacement. The tooling, mounted on the press, is shown in Figure 5, together with the acquisition system. A system based on LabView controls, stores the measurements, and allows viewing of these test results [8].
Figure 5 - Tooling instrumented with data acquisition system, loaded in press
Signal acquisition hardware
Computer/software for data acquisition

4ª Conferência Internacional de Conformação de Chapas / 1º BrDDRG / 8-10 Oct, 2014 – Porto Alegre, RS – Brasil
4 SIMULATION & CORRELATION
4.1 Customized method for accurate prediction of calibration force
Accurately predicting this calibration force with simulation required the use of a modified load increment procedure. This peak force occurs at the very end of the forming process, once the material is in full contact with the punch and binder. Normal incremental loading of the press can easily overshoot this maximum value if the steps are too large at the end of the punch stroke, as shown in Figure 6. A customized load stepping procedure was developed to allow for very small incremental steps once the punch reaches 99% of the total stroke. Using this method, the punch step sizes are reduced in the last 1% of the stroke, thus accurately capture this calibration force as seen in Figure 7.
Figure 6 – Calibration force overshoot using normal press loading method.

4ª Conferência Internacional de Conformação de Chapas / 1º BrDDRG / 8-10 Oct, 2014 – Porto Alegre, RS – Brasil
Figure 7 – Calibration force with no overshoot using modified press loading method.
4.2 Study on “V”-shape
A first study was performed on the “V” bending process to determine the best element type and the required element size to get accurate results of force and shape after springback.
The experimental measurements for the V-forming process are shown in Figure 8.
Forming Force
Nominal Dimension after spring back
27 ton 358 mm
Figure 8 – Experimental measurements for the V forming process

4ª Conferência Internacional de Conformação de Chapas / 1º BrDDRG / 8-10 Oct, 2014 – Porto Alegre, RS – Brasil
Figure 9 shows the designed shape in CAD on the left, compared with the simulated shape using 3D solid elements in Simufact.forming on the right. It can be seen that the part is not following the punch curvature, but creates a significant gap. These type of effects are realistic and were not captured by simulations using shell elements.
Figure 9 – CAD design of V bending (left) vs. simulation of V bending process (right).
Several simulation models were created with the 3D Solid elements, varying the number of elements through the thickness and the element size. Figure 10 shows the finite element meshes for 3 studies, using 1, 3 and 5 elements through the thickness respectively. The in-plane element size for each case was automatically determined by the software.
Figure 10 - Finite element meshes for V-shape with one, three and five element through the thickness
Table 2 summarizes the comparison of measured forming force and nominal distance with simulations using shell elements and 3D solid elements with different mesh settings. It was found that the optimal simulation parameters for most accurate results are with 3D Solid elements, using 3 elements through the thickness and an in plane element size of 10.5 mm, which was automatically determined by simufact.forming.

4ª Conferência Internacional de Conformação de Chapas / 1º BrDDRG / 8-10 Oct, 2014 – Porto Alegre, RS – Brasil
Table 2. Comparison of different simulation approach with Experimental data for “V” bending
What Element Type
# Elements through Thickness
In Plane elements size
Forming Force
Nominal Dimension after spring back
Experiment N/A N/A N/A 27.0 ton 353.0 mm
Simulation 3D Solids 1 1 x Thickness 27.4 ton 361.9 mm
Simulation 3D Solids 3 1/3 x Thickness 34.9 ton 357.2 mm
Simulation 3D Solids 3 1 x Thickness 54.5 ton 357.9 mm
Simulation 3D Solids 3 2 x Thickness 26.8 ton 380.3 mm
Simulation 3D Solids 3 Automatic 26.4 ton 354.3 mm
Simulation 3D Solids 4 Automatic 26 ton 357.9 mm
Simulation 3D Solids 5 Automatic 24 ton 358.0 mm
Simulation Shells N/A Automatic 41 ton 385.7 mm
OPTIMAL SIMULATION PARAMETERS
Element Type 3D Solid
# Elements through Thickness 3
In plane element size 10.5 mm
In addition to correctly capturing the nominal dimensions after spring-back, it was found that also the local bulk deformation effects were correctly predicted by the simulations with 3D Solid elements. This can be seen in Figure 11.
Figure 11 - Numerical simulation (left) compared to experiment (right), showing accurate prediction of local
bulk deformations.

4ª Conferência Internacional de Conformação de Chapas / 1º BrDDRG / 8-10 Oct, 2014 – Porto Alegre, RS – Brasil
4.3 Study on “U” shape
Using the optimal simulation parameters determined during the previous step, a similar simulation model was created for the “U” shape parts, as shown in Figure 12.
Element Type 3D Solid
# Elements through Thickness 3
In plane element size 2.66 mm
Figure 12 – Finite Element Model for “U” Shape
The experimental force curve for the U-bending process is shown in Figure 13. It can be seen that there are two peaks (FD and FCAL). FD represents the forces during the bending process itself and FCAL is the peak force that occurs at the end of the process. This peak force at the end of the process is called the calibration force. The dotted lines represent the mean path strength. The oscillations are due to the cushion of the press system.
Figure 13 - Force vs displacement for U bending process, showing two peaks: Bending Force (FD) and Calibration
Force (FCAL) [8]
FCAL

4ª Conferência Internacional de Conformação de Chapas / 1º BrDDRG / 8-10 Oct, 2014 – Porto Alegre, RS – Brasil
For this U bending process, a comparison for simulated shape prediction, bending force and calibration force was made against the experimental data. It is summarized in Table 3. It can again be seen that the simulations with 3D Solids are more accurate as with shell elements.
Table 3. Comparison of different simulation approach with Experimental data for “V” bending
What Element Type Bending Force (FD)
Calibration Force (FCAL)
Nominal Dimension after spring back
Experiment N/A 14 ton 48.0 ton 111.5 mm
Simulation 3D Solids 15 ton 48.0 ton 111.9 mm
Simulation Shells 16 ton 35.5 ton 112.7 mm
4.4 Study on “Complex” shape
Using the optimal simulation parameters determined during the previous steps, a similar simulation model was created for the “Complex” shape parts, as shown in Figure 14.
Element Type 3D Solid
# Elements through Thickness 3
In plane element size 4.0 mm
Figure 14 – Finite Element Models for “Complex” part
The force curve for this complex geometry has only one maximum point at the end of the stroke, which corresponds to the calibration force (FCAL) (Figure 15).
FCAL
Figure 15 - Numerical Simulation results of Force vs displacement for Complex Geometry forming process, showing one peak: Calibration Force (FCAL)

4ª Conferência Internacional de Conformação de Chapas / 1º BrDDRG / 8-10 Oct, 2014 – Porto Alegre, RS – Brasil
To evaluate the effects of this calibration, it was necessary to find out what would be the value of the force calibration. From numerical simulation we found that the value for calibration would be 850 tons as seen in the graph.
To study the effect of different calibration forces on the spring-back, a comparison was made for the reference dimension shown in Figure 16, for different levels of calibration force. The comparisons are listed in Table 4. It can be seen that the influence of calibration force on the spring-back is accurately captured.
Figure 16 - Reference dimension for study on spring-back for different calibration forces
Table 4. Comparison of simulation results with Experimental data for Complex shape
Calibration Force Experiment Simulation w. 3D Solids
300 ton 54.50 mm 54.70 mm
480 ton 54.75 mm 54.90 mm
850 ton 54.85 mm 55.10 mm
5. Conclusions
In this paper a study was presented to determine the optimal choice for the modeling parameters for simulation with the Simufact.Forming software of thick sheet metal forming using 3D Solid elements. The study included the development of several simulation models of three real parts.
The results of the 3D Solid element simulations were validated against experimental results, and also, the simulation results were compared to analytical equations and to equivalent models using Shell elements.
From this study, we conclude that:
• The methodology allowed us to assess the influence of the different parameters in the simulation of processes of stamping with good efficiency.
• In the simulation of thick sheet metal forming, it is possible to obtain good results with simulation models that use 3D solid elements, while simulation models using membrane or shell elements become less and less accurate as the plate thickness increases.
• Results of simulated springback with 3D solid elements are more accurate than with
membrane of shell elements.
• It was observed in the experimental tests that there is a variability in the springback, when using the exact same process parameters and the same sample plate (all with the same direction of rolling and made the same way). It is suspected that this variability may occur due to the variation of mechanical properties of the raw material.

4ª Conferência Internacional de Conformação de Chapas / 1º BrDDRG / 8-10 Oct, 2014 – Porto Alegre, RS – Brasil
• The calibration force is high, because there is a volumetric compression of the material at the end of the process. It was also observed that the calibration directly influences the result of the springback. To accurately simulate this calibration phase, it is necessary to use smaller increments at the end of the process.
• In some cases, it is not needed to calibrate the part at the end of the stamping process with
high forces, because it is possible to alter the geometry of the tool to compensate for the springback.
• The use of a numerical simulation software for sheet metal forming is very important for new product development, because it enables a fast and reliable evaluation of various operational parameters of the stamping process.
• Each simulation approach has its field of application. When working with thin sheets it is recommended to use Shell elements or Membrane elements in the simulation, as they are fast and efficient. In the case of thick plates, using 3D solid elements is required for precise accuracy.

4ª Conferência Internacional de Conformação de Chapas / 1º BrDDRG / 8-10 Oct, 2014 – Porto Alegre, RS – Brasil
5. References
[1] SCHULER, Metal Forming Handbook, Springer-Verlag. Berlin Heidelberg. 1998
[2] PROVENZA, F.:Protec – Estampos III. Editora Protec
[3] BOLJANOVIC, V.:Sheet Metal Forming Processes and Die Design, New York, 2004.
[4] RODRIGUES, J.; MARTINS, P.:Tecnologia Mecânica – Tecnologia da deformação plástica Vol
II Aplicações Industriais. Editora Escolar, 2005.
[5] XU, H.J.; ZHONG, W.; LIU, Y.Q.:Three-dimensional finite element simulation of medium thick
plate metal forming and springback. Finite Elements in Analysis and Design, Volume 51, April
2012, Pages 49-58
[6] BUIJK, A.J. An Innovative Approach to Sheet Metal Forming Simulation for Higher Accuracy,
Using 3D Solid Elements in Simufact.forming. SENAFOR, Porto Alegre, Brazil, 2009.
[7] Schafstall, H. Simulating Manufacturing Processes of Thick Blanks, Applied to a Torque
Converter Cover. Presented at a Kolloquium of the European Research Association for Sheet Metal
Working (EFB), 2006
[8] DE SOUZA, J.H.C.: Métodos para análise do processo na estampagem de peças fabricadas a
partir de chapas grossas. 32ª SENAFOR, 22 e 24 de Outubro de 2012, Porto Alegre, Brasil