Study on Interoperability of LNG Facilities and Interchangeability of ...
103
Study on Interoperability of LNG Facilities and Interchangeability of Gas and Advice on the Opportunity to Set-up an Action Plan for the Promotion of LNG Chain Investments FINAL REPORT May 2008 Courtesy of ENAGAS DG TREN Framework Contract: TREN/CC/05-2005, lot 3 Technical Assistance in the Fields of Energy and Transport Contract Awarded to MVV Consulting under the Contract number S07.78755 Contract duration from 02/01/2008 to 30/04/2008
Transcript of Study on Interoperability of LNG Facilities and Interchangeability of ...
Study on Interoperability of LNG Facilities and Interchangeability of Gas and Advice
on the Opportunity to Set-up an Action Plan for the Promotion of LNG Chain Investments
FINAL REPORT May 2008
Courtesy of ENAGAS
DG TREN Framework Contract: TREN/CC/05-2005, lot 3 Technical Assistance in the Fields of Energy and Transport
Contract Awarded to MVV Consulting under the Contract number S07.78755
Contract duration from 02/01/2008 to 30/04/2008

GENERAL CONTENT
PART I
Study on Interoperability of LNG Facilities and Interchangeability of Gas and Advice on the Opportunity to Set-up an Action Plan for the Promotion of LNG Chain Investments. Authors: Manfred Hafner, Jean Vermeire, Pedro Moraleda PART II TASK A: The Geopolitics of EU Gas Supply Author: Mrs. Coby van der Linde
TASK B: Environmental and Sustainability Perspective Author: Professor Peter D. Cameron TASK C: Economic, Market and Financial Point of View Author: Prof. Dr. Christian von Hirschhausen TASK D: Synthesis of Part II Reports, Global Conclusion and Suggestions Author: Mr. Pedro Moraleda
PART I
Study on Interoperability of LNG Facilities and Interchangeability
of Gas and Advice on the Opportunity to Set-up
an Action Plan for the Promotion of LNG Chain Investments
Authors: Manfred Hafner, Jean Vermeire, Pedro Moraleda
Study on Interoperability of LNG
1
INTRODUCTION ..................................................................................4
1. THE LNG INDUSTRY ....................................................................................... 6
1.1. Likelihood that the gas chain can meet the expected growth of LNG demand for the period 2010-2030 ......................................................... 6
1.1.1. European gas demand outlook and potential for LNG................................. 6 1.1.2. Current LNG supply and LNG export potential ............................................ 9 1.1.3. Liquefaction plants..................................................................................... 12 1.1.4. LNG transport means ................................................................................ 15 1.1.5. Regasification and storage capacities at import terminals......................... 18
1.2. Dynamics of LNG trade in the Atlantic Basin ................................................. 24
1.2.1. Development of contracting strategies and structural changes in the LNG industry .................................................................... 24
1.2.2. LNG flows: outlook for spot and short-term destinations .......................... 25 1.2.3. Price setting mechanisms.......................................................................... 28 1.2.4. Arbitrage opportunities .............................................................................. 29 1.2.5. Future possible convergence of LNG markets in the Atlantic Basin.......... 31 1.2.6. Business models: types of operators in the LNG trade ............................. 32
1.3. Technical innovations ....................................................................................... 33
1.3.1. Liquefaction plants..................................................................................... 33 1.3.2. Methane tankers ....................................................................................... 34 1.3.3. Regasification terminals and LNG storage ................................................ 35
2. INTERCHANGEABILITY OF PRODUCTS ................................................................. 36 2.1. Quality of LNG produced .................................................................................. 36
2.1.1. Parameters taken into consideration ......................................................... 36 2.1.2. Range of variation of these parameters .................................................... 37 2.1.3. EASEE-gas quality standards ................................................................... 39
2.2. Quality requirements of importing countries compared
with EASEE-gas’ CBP ........................................................................................ 40
2.3. Technical and economic reasons underlying quality requirements ............. 47
2.3.1. Limiting factors at receiving terminals ....................................................... 47 2.3.2. Characteristics and requisites of appliances ............................................. 49 2.3.3. Other quality issues ................................................................................... 50

Study on Interoperability of LNG
2
2.4. Impact of LNG quality variations on the interchangeability and cost-benefit analysis of standardization .................................................. 50
2.4.1. Procedures to adjust LNG quality at receiving terminals ........................... 51 2.4.2. Necessary investment and running costs for derichment of LNG.............. 53 2.4.3. Problems and solutions for markets receiving different gas qualities ....... 54 2.4.4. Prospects for swaps .................................................................................. 55
3. INTEROPERABILITY OF FACILITIES ............................................................56
3.1. National regulatory approaches ...................................................................... 56
3.1.1. Access conditions to LNG import terminals ............................................... 56 3.1.2. Legal and functional status of LSOs ......................................................... 59 3.1.3. Actual practice of access to LNG terminals ............................................... 61 3.1.4. Obstacles to the construction of new LNG terminals................................. 66
3.2. Different national operational procedures ....................................................... 68
3.2.1. Capacity allocation..................................................................................... 68 3.2.2. Congestion management........................................................................... 71 3.2.3. Secondary markets rules ........................................................................... 74 3.2.4. UIOLI ......................................................................................................... 76 3.2.5. Tariffs and tariffs establishing mechanisms............................................... 78
3.3 Vessel certification ............................................................................................. 84
3.3.1 International regulation applicable to vessel certification........................... 84 3.3.2 National rules and docking limiting factors ................................................ 84 3.3.3 Potential constraints for the development
of the fleet and international maritime transport ........................................ 87
4. OTHER STRATEGIC ISSUES ........................................................................ 88 4.1. Contribution of LNG to security of supply, competition
and liquidity in the internal market ................................................................... 88
4.1.1. Security of supply ...................................................................................... 88 4.1.2. Prices......................................................................................................... 89 4.1.3. Liquidity...................................................................................................... 89 4.1.4. Competition................................................................................................ 90
4.2. LNG competition with pipeline gas .................................................................. 90 4.3. LNG storage and underground gas storage: technical
and cost differences .......................................................................................... 92
CONCLUSIONS FROM PART I..................................................................95 LIST OF TABLES Table 1 – Gas supply potential to Europe-34 by exporting country projections to 2030 ..... 8 Table 2 – Tariffs terms at the French LNG Terminals ....................................................... 79 Table 3 – Tariffs at the Revithoussa LNG Terminal .......................................................... 79

Study on Interoperability of LNG
3
LIST OF FIGURES AND GRAPHICS Long Term Gas Demand Projections for EU....................................................................... 6 Import Requirements of the EU........................................................................................... 7 Gas Export Potential to Europe........................................................................................... 9 Worldwide LNG Trade……………………………………………………………………………10 Trade movements 2006-liquefied natural gas ................................................................... 10 Share of LNG in gas consumption .................................................................................... 12 Planned capacities between now and 2012 ...................................................................... 13 Annual liquefaction capacity additions ............................................................................. 14 LNG Supply outlook .......................................................................................................... 15 Development of the LNG Fleet – Cumulative number of ships delivered.......................... 15 Development of the LNG Fleet – Cumulative capacity additions ...................................... 16 Number of Orders Book/Fleet/% age ................................................................................ 16 LNG Fleet – By ship size................................................................................................... 17 Shipping Capacity by Company ........................................................................................ 17 LNG regasification terminals in North America ................................................................. 22 LNG gasification terminals in Europe; existing plants and projects................................... 23 Source of Spot and Short Term LNG imports over the last ten years ............................... 25 Spot and Short Term LNG exports over the last ten years ............................................... 26 Capacity holders (non incumbents)................................................................................... 27 LNG Supply Chain: typical costs and returns.................................................................... 28 Typical Wobbe Number for LNG Sources ......................................................................... 37 Wobbe Number requirements at EU LNG Import Terminals............................................. 38 Approved parameters, values and ranges ........................................................................ 39 Gas Quality Specifications – Belgium ............................................................................... 40 Gas Quality Specifications – France ................................................................................. 41 Gas Quality Specifications – Greece................................................................................. 42 Gas Quality Specifications – Italy...................................................................................... 43 Gas Quality Specifications – Portugal ............................................................................... 44 Gas Quality Specifications – Spain ................................................................................... 45 Terminal Specifications – Wobbe Index ............................................................................ 46 Terminal Specifications – EASEE-gas CBP proposal…….………………………………….46 Flame Lift/Flashback ......................................................................................................... 48 LPG Extraction Compared to Nitrogen Injection ............................................................... 52 Capacity reserved at Zeebrugge LNG Terminal................................................................ 63 The send out volumes by Operator since 2001................................................................. 64 LNG imports by Shippers in Spain 1999 to 2007 .............................................................. 65 Secondary market for capacity at the Zeebrugge LNG Terminal ...................................... 75 LNG Chain Costs ............................................................................................................. 91 Cost Comparison of Storage Costs by Working Volume................................................... 93 Cost Comparison of Storage Costs by Deliverability......................................................... 94 LIST OF ANNEXES Annex I – Inventory of LNG import terminals in the European Union................................ 19 Annex II – Utilization of LNG Terminals in Europe ............................................................ 62

Study on Interoperability of LNG
4
INTRODUCTION THE CONTEXT The increase of gas demand in Europe, the growing gap between consumption and indigenous supply and the need to bring in additional gas volumes from diversified sources provide LNG with an excellent opportunity to play a relevant role in the gas supply to Europe. A well developed LNG market will foster liquidity and competition as it is now the most suitable way for new market players to have access to gas sources, to control their own logistics and to enter into the European market. In this context, the European Commission was interested to analyze how the LNG potential could be fully realized; how LNG could be cost-effectively brought into Europe to complement traditional pipeline gas supplies and, thus, contribute to security and flexibility of supply. The European Commission contacted the firm MVV Consulting to carry out a study on the above mentioned topic. MVV Consulting set up a team of experts to perform this task within a time period of 4 months following the signature of the relevant contract. The members of this team are cited below. They all have a high level of expertise and widespread knowledge of the LNG industry, and they are not currently involved in the management or part of the staff of any specific gas company. THE OBJECTIVES OF THE STUDY According to the Task Specifications provided by the Commission, the Study had a dual objective and has been divided in two parts: 1. Part I: Factors that can hamper the emergence of LNG as a valid contribution to the
integration of the European gas market, to the development of fair competition across Europe and to security of gas supply;
2. Part II: The appropriateness of an LNG action plan at EU level. THE SCOPE OF THE WORK The Tasks Specifications for Part I of the Study asked for the collection of information and in depth analysis of the issues regarding interoperability of LNG facilities and the interchangeability of LNG services. Topics to specifically address were LNG quality and requirements of import terminals, vessels certification and compatibility with docking facilities, capacity and economics of liquefaction and regasification plants, regulatory barriers to market integration and competition including the impact of TPA exemptions, technical innovations in the LNG chain and possible future markets convergence and arbitrage opportunities. An important section of Part I has been dedicated to the availability of LNG, “flexible LNG” and, in particular, to the tightness of global gas supplies as the authors considered this constitutes an important hindrance to the development of the LNG market. The geographical scope included all Member States with existing or planned LNG terminals, competing terminals in the Atlantic Basin and liquefaction facilities in an economically

Study on Interoperability of LNG
5
favourable position to supply the EU market. However, the characteristics of the LNG market required the authors to take a more global approach. THE TEAM OF EXPERTS Three experts have been involved in Part I: - Manfred Hafner: PhD in Energy Sciences and Economics and former Scientific Director
of OME - Jean Vermeire: President of the GIIGNL and former Director General of Distrigaz - Pedro Moraleda: Chairman of IGU’s Committee on Strategy, Economics and
Regulation, former Director of International Relations in Gas Natural and Chairman of the Eurogas LNG Task Force. He has been fully dedicated to the Study as overall coordinator and contact person with the Commission officers.
Three experts were involved in Part II: - For task A on security of supply and world energy geopolitics: Mrs. Coby van der Linde,
Director of the Clingendael International Energy Programme; - For task B on environmental and sustainability issues: Mr. Peter D. Cameron,
Professor at the Centre for Energy, Petroleum and Mineral Law and Policy of the University of Dundee;
- For task C on economic, financial and market aspects: Dr. Christian von Hirschhausen, Professor at the Dresden University of Technology and Chair of Energy Economics and Public Sector Management;
- For task D, a synthesis of previous reports, global conclusions and set of suggestions to the Commission: Mr. Pedro Moraleda.
METHODOLOGY OF THE STUDY The approach followed in Part I was that of a classic study and based on: - the analysis and synthesis of all relevant and up to date information; - legislation and regulation in force and in preparation and reactions from stakeholders to
legislative or regulatory proposals; - information published by the main international associations and organizations related
to the LNG industry: GIIGNL, IGU, GIE-LNG, IEA, Eurogas; - reports of reputable consultants as well as other contacts with these consultants in a
privileged context: CERA, Wood MacKenzie, Ernst & Young, Poten & Partners, Cedigaz, OGP, NERA, Jensen, Waterborne Energy, etc.;
- data gathered from experts’ presentations at seminars and congresses, mainly the documents of the last LNG 15 Congress held in Barcelona in April 2007;
- personal interviews with individual LSOs, terminal users, regulatory authorities and representatives of engineering companies;
- the wide expertise of the senior consultants involved in the Study.

Study on Interoperability of LNG
6
1. THE LNG INDUSTRY
1.1. Likelihood That The Gas Chain Can Meet The Expected Growth of LNG Demand for the Period 2010-2030
1.1.1. European gas demand outlook and potential for LNG
Of a total EU-27 gas demand in 2006 of some 545 bcm, 310 bcm (or 57%) have been imported. Of the imports, 130 bcm (or 42%) came from Russia, 84 bcm (27%) from Norway, 56 bcm from Algeria (18%), 11 bcm from Nigeria, about 8.5 bcm respectively each from Egypt and Libya and 6 bcm from the Gulf countries, mainly Qatar. There is a large uncertainty about future gas demand. The following figure presents different scenarios of future EU gas demand projections up to 2030. The most optimistic projection is the reference scenario of the IEA, and the most pessimistic scenarios are the WETO Carbon Constraint scenario and the DG-TREN soaring oil and gas price scenario. The DG-TREN reference scenario represents an intermediate projection.
Figure 1. Long term gas demand projections for EU
300
350
400
450
500
550
600
650
700
750
2000 2010 2020 2030
Bcm
WETO (reference) WETO (carbon constraint) DG-TREN (reference)DG-TREN (soaring price) IEA (reference) IEA (low carbon)
187 bcm
Sources: DG TREN, IEA, WETO
In fact, in the latest DG TREN reference scenario1 published in 2006, the EU natural gas demand is forecast to grow by 24% (from 537 bcm to 666 bcm) between 2005 and 2030. Gas for power generation is particularly sensitive to the relative value of gas compared to coal and nuclear. This can be seen in the DG TREN soaring oil and gas
1 European Commission – Directorate-General for Energy and Transport, “European Energy and Transport, Trends to 2030 – Update 2005”, May 2006 and OME.

Study on Interoperability of LNG
7
prices scenario where for the EU the difference with the reference scenario amounts to 90 bcm by 2030. Moreover, the IEA low carbon and both WETO scenarios demonstrate the important sensitivity of gas demand on government policies addressing the climate change issue. In addition to uncertainties concerning future European demand, there also exists a great level of uncertainty concerning future domestic gas production forecasts. The biggest question mark is the rate of decline of the UK gas production. For example, the EC Primes estimate used for the DG-TREN scenarios assesses UK gas production in 2020 at 88 bcm, whereas the UK Department of Trade and Industry estimates it below 20 bcm. A level between these two figures seems reasonable, but this illustrates the level of uncertainty associated to future gas import requirements. Figure 2 shows future natural gas import projections using, for demand evolution, two EC DG TREN scenarios (“reference” and “soaring oil and gas prices”) and, for domestic EU production, also two scenarios (the EC DG TREN scenario and the slightly more pessimistic OME scenario).
Figure 2. Import requirements of the EU
Import requirements are thus expected to increase from 300 bcm in 2005 to somewhere between 480 and 600 bcm in 2030, equivalent to an increase in the next 25 years between 60% and 100%. The following graph (Figure 3) shows the supply potential expected to be available to European markets in 2010, 2020 and 2030. As can be seen by comparing supply potential (fig 3) and supply requirements (fig 2), there should be no shortage of gas provided the necessary investments are carried out in time.
2005 2010 2015 2020 2025 2030
0
100
200
300
400
500
600
700bcm
EU domestic production (OME outlook)
EU demand (soaring gas prices)
EU demand (reference)
EU domestic production (DG TREN outlook)60
0 bc
m
480
bcm
300
bcm

Study on Interoperability of LNG
8
Table 1. Gas supply potential to Europe-34 by exporting country, projections to 2030
2005 2010 2020 2030 Production Exports …to
Europe Production Exports …to
Europe Production Exports …to
EuropeProduction Exports …to
Europe Norway 87 81 81 105 98 94 114 125 115 140 130 120 North Africa 143 78 67 214 131 116 293 179 163 353 203 181 Algeria 91 65 57 123 91 81 160 119 110 176 125 115 Egypt 41 8 5 68 26 23 93 33 28 122 38 28 Libya 11 5 5 23 14 12 40 27 25 55 40 38 West Africa 22 12 11 54 38 21 136 105 38 171 130 45 Angola 1 0 0 8 7 0 9 7 2 17 14 4 Nigeria 21 12 11 46 31 21 127 98 36 154 116 41 Russia 641 223 139 690 265 166 776 369 196 890 446 207 Caspian 147 52 0 240 136 0 297 167 13 344 192 13 Azerbaijan 6 0 0 18 7 0 35 20 13 38 20 13 Kazakhstan 22 6 0 46 27 0 68 40 0 87 50 0 Turkmenistán 62 46 0 106 90 0 122 100 0 147 120 0 Uzbekistán 58 0 0 70 12 0 72 7 0 72 2 0 Arabian-Persian Gulf 203 49 7 394 177 44 711 340 108 901 405 143 Iran 101 4 0 165 43 0 298 106 35 358 114 35 Iraq 2 0 0 7 2 0 25 12 5 50 25 20 Oman 18 11 2 23 14 2 27 14 2 32 14 2 Qatar 44 27 5 142 102 36 278 188 60 355 232 80 UAE 40 7 0 47 8 0 69 12 0 86 12 0 Yemen 0 0 0 10 8 6 14 8 6 20 8 6 Latin America 56 14 1 86 38 6 123 63 6 134 68 6 Trinidad and Tobago 28 14 1 35 23 6 47 37 6 43 37 6 Venezuela 28 0 0 51 15 0 76 26 0 91 31 0 Total 1300 509 305 1783 883 447 2450 1348 639 2933 1574 715 (1) Russia exports in 2005 include 4 bcm from former FSU Republics. (2) The assumption made in this study is that Kazakhstan, Turkmenistan and Uzbekistan will not be able to sell their gas directly to European markets but rather to Russia which could resell part of it of Europe. Central Asian gas exports have therefore been accounted for in the Russian export potential. Source: CEDIGAZ (2005 figures) and OME (projections)

Study on Interoperability of LNG
9
Fig 3. Gas export potential to Europe
1.1.1.. Current LNG supply and LNG export potential Source:OME
It is obvious that not all the possibilities presented in Fig 3 will be realised nor, most probably, needed. To achieve this potential would require that some decisions (political, financial, institutional and industrial) be taken in due time, and/or that the resulting actions be launched at the correct time and at the necessary scale. While Algeria, Norway and Russia are expected to keep their dominant role as far as supply potential is concerned, there appears to be a spectacular progression of supply potential from Middle East and from Nigeria, Libya and Egypt. That means that Europe will need both means of supply: new pipeline and LNG infrastructure. LNG represents a third of the estimated total supply potential outside Europe in 2030. Such an evolution would make advisable to continue the development of the European regasification capacity. The LNG supply potential is assessed at 227 bcm/year in 2030, to be compared to an actual supply of 51 bcm in 2006.
1.1.2. Current LNG supply and LNG export potential LNG industry and trade have experienced a very strong growth rates during the last decades and in particular during the last years.
LIBYAEGYPT
IRAN
TURKMENISTAN
ALGERIA
RUSSIA196
166
139
100 95 94 81
57 81 110 1155 12 25 38 5 23 28 28
5 20 3535
7 44 68 88
1313
11213845
W. A
FRICA
NORWAY
QATAR/ UAE/ OMAN/ YEMEN
207
AZERB.
304 bcm
447 bcm
619 bcm
695 bcm
2005
2010
2020
2030
IRAQ
1666
T&T + VENEZ.
LIBYAEGYPT
IRAN
TURKMENISTAN
ALGERIA
RUSSIA and Central Asia196
166
139
100 95 94 81
57 81 110 1155 12 25 38 5 23 28 28
5 20 3535
7 44 68 88
1313
11213845
W. A
FRICA
NORWAY
QATAR/ UAE/ OMAN/ YEMEN
207
AZERB.
304 bcm
447 bcm
619 bcm
695 bcm
2005
2010
2020
2030
304 bcm
447 bcm
619 bcm
695 bcm
2005
2010
2020
2030
IRAQ
1666
T&T + VENEZ.
LIBYAEGYPT
IRAN
TURKMENISTAN
ALGERIA
RUSSIA196
166
139
100 95 94 81
57 81 110 1155 12 25 38 5 23 28 28
5 20 3535
7 44 68 88
1313
11213845
W. A
FRICA
NORWAY
QATAR/ UAE/ OMAN/ YEMEN
207
AZERB.
304 bcm
447 bcm
619 bcm
695 bcm
2005
2010
2020
2030
IRAQ
1666
T&T + VENEZ.
LIBYAEGYPT
IRAN
TURKMENISTAN
ALGERIA
RUSSIA196
166
139
100 95 94 81
57 81 110 1155 12 25 38 5 23 28 28
5 20 3535
7 44 68 88
1313
11213845
W. A
FRICA
NORWAY
QATAR/ UAE/ OMAN/ YEMEN
207
AZERB.
304 bcm
447 bcm
619 bcm
695 bcm
2005
2010
2020
2030
IRAQ
1666
T&T + VENEZ.
LIBYAEGYPT
IRAN
TURKMENISTAN
ALGERIA
RUSSIA and Central Asia196
166
139
100 95 94 81
57 81 110 1155 12 25 38 5 23 28 28
5 20 3535
7 44 68 88
1313
11213845
W. A
FRICA
NORWAY
QATAR/ UAE/ OMAN/ YEMEN
207
AZERB.
304 bcm
447 bcm
619 bcm
695 bcm
2005
2010
2020
2030
304 bcm
447 bcm
619 bcm
695 bcm
2005
2010
2020
2030
IRAQ
1666
T&T + VENEZ.

Study on Interoperability of LNG
10
Fig 4. Worldwide LNG Trade
In 2006, of a total of 748 bcm of gas traded internationally, LNG accounted for some 28%. The share of LNG in the gas trade has continuously increased during the past decades. In 2006, LNG trade accounted for 211 bcm, an increase of 22 bcm compared to the previous year. This corresponds to a growth rate of 12%, the highest rate ever recorded over the last decade. The following table shows the LNG trade movements in 2006 from producing countries to importing countries.
Importers:
- Japan remained by far the world's largest LNG importer with 81,9 bcm, or 39% of all
imports, followed by Korea with 34 bcm (16%) and Spain with 24 bcm (12%), markedly higher than the U.S.A. ranking fourth with 16,6 bcm (7.8%). Seventeen countries were involved in LNG imports with the addition of China and Mexico in 2006.

Study on Interoperability of LNG
11
- The growth rate of European imports remained stable at 21%, above the global growth
rate of 12%, resulting in a market share for Europe of 27% of total LNG trade and demonstrating the dynamism of this region. With a 12% market share in worldwide trade, Spain maintained its position as Europe's largest LNG market.
- The US market suffered most from the shortage in LNG production after substantial
increases during the early part of this decade. Price arbitrage also prompted some shippers to divert spot LNG away from the US market.
However, as US importers begin to bring in large volumes of LNG under other than spot or very short-term arrangements, imports are projected to expand in the coming two years. EIA projections are calling for LNG imports into the country to increase by 34,5% and 38,5% for 2007 and 2008 respectively. LNG imports in 2007 are estimated around 770bn cu ft (21,8 bcm) as consignments from Nigeria and from Trinidad and Tobago increased with the availability of more feed- stock gas. The figure is expected to reach 1,080bn cu ft (30,6 bcm)next year with the expected arrival of supplies from the Snohvit LNG project in Norway through a contract with Statoil.
- The Asian market kept on growing steadily by 10% with imports to the region rising from 122 bcm in 2005 to 135 bcm in 2006 or an increase of 13 bcm, mainly due to the continued rise of Indian imports with a 4% market share, and the emergence of China on the LNG scene. Japanese imports steadily rose to 82 bcm. Korea also enjoyed a significant growth by 12% to 34 bcm.
Exporters: Indonesia lost its leading position and Qatar became the world's largest LNG producer with 15% of all exports. There are three first league exporters with export volumes of some thirty bcm each: Qatar (31 bcm), Indonesia (29,6 bcm) and Malaysia (28 bcm). Follow Algeria (24,7 bcm), Nigeria (17,6 bcm), Trinidad & Tobago (16,3 bcm), Egypt (15 bcm), Oman (11,5 bcm), Brunei (10 bcm) and Abu-Dhabi (7 bcm). The country with the biggest increase in 2006 was Egypt which added 8 bcm and thus more than doubled its export volumes. The LNG in Europe In Europe, LNG represents today on average some 10% of total gas demand. As the following graph shows, the situation is however very different from one country to the other. In 2006, the share of LNG in total gas consumption was 69% in Spain, but much lower in the few other LNG import countries.

Study on Interoperability of LNG
12
Worldwide, the spot and short-term imports (based on importing contracts whose duration is equal to or less than 4 years) amounted in 2006 to 33 bcm (438 cargoes), which represents 16% of the world LNG trade and an increase of 40% compared to the previous year.
1.1.3. Liquefaction plants There were 18 sites of liquefaction plants in operation at the end of 2006 with the start-up of the Darwin LNG plant in Australia. Two new trains were commissioned in 2006: one at Bonny Island in Nigeria and one at Darwin in Australia. The total capacity of all liquefaction plants amounted to about 188 Mt for 78 liquefaction trains. Average utilization almost reached 85%. The total storage capacity amounted to approximately 6 Mm3 of LNG for 66 storage tanks, representing almost six days of production. 2007 has seen the commissioning of 16 Mt/y of new liquefaction capacity: - Rasgas II – Train 5 (Qatar): 4,7 Mt/y for Belgium, South Korea and China - NLNG – Train 6 (Nigeria): 4 Mt/y for the US and Spain - EGLNG – Train 1 (Equatorial Guinea): 3,4 Mt/y initially mainly for the North American
market - Snohvit LNG – Train 1 (Norway): 4 Mt/yr for US and Europe
End of 2007, total liquefaction capacity was thus 204 Mt/y.

Study on Interoperability of LNG
13
Planned capacities between now and 2012
Year Capacity addition (Mt/y)
Plant/Train
2008 +31,4 - Qatargas II (15,6 Mt/y) - Qatar - Rasgas III Train 6 (7,8 Mt/y) - Qatar - Tangguh (8 Mt/y) – Indonesia
2009 +36,3 - Qatargas III (7,8 Mt/y) - Qatar - Rasgas III Train 7 (7,8 Mt/y) - Qatar - NWS Train 5 (4 Mt/y) - Australia - Sakhalin II (10 Mt/y) - Russia - Yemen LNG (6,7 Mt/y) – Yemen
2010 +12,2 - Qatargas IV (7,8 Mt/y) – Qatar - Peru LNG (4,4 Mt/y)- Peru
2011 +14,5 +36,6*
- Pluto LNG (5 Mt/y) – Australia - Skikda LNG (4,5 Mt/y) – Algeria - Angola LNG Soyo (5 Mt/y) – Angola - Gorgon LNG* (10 Mt/y) – Australia - Segas LNG Train 2* (4,9 Mt/y) – Egypt - Olokola LNG* (22 Mt/y) – Nigeria
2012 +46,2* - Snohvit Train 2* (4 Mt/y) – Norway - Persian LNG* (16,2 Mt/y) – Iran - ELNG Train 3* (3,6 Mt/y) – Egypt - EGLNG Train 2* (4,4 Mt/y) – Equatorial Guinea - NLNG Train 7* (8 Mt/y) – Nigeria - Brass LNG* (10 Mt/y) – Nigeria
* FID not yet signed By 2010, a total liquefaction capacity of 284 Mt/y should be available worldwide. This includes all current existing plants and all projects in construction and planned to be operational by that date. Assuming that the FID of several projects expected to go online in 2011 and 2012 were signed soon, at the end of 2012 there should be a worldwide liquefaction capacity of some 380 Mt/y, nearly twice the capacity available in 2007. However, as many analysts point out and as it is explained below this forecast may not be realistic. Not a single project reached FID in 2006 and not as many as expected in 2007.

Study on Interoperability of LNG
14
Annual liquefaction capacity additions
Technical bottlenecks on LNG development The dramatic increase of activity in the hydrocarbon sector as well as the increases in steel price have translated into delays in the commissioning of liquefaction plants and into an unexpected scarcity of LNG in the world. In fact, the world is confronted by huge cost inflation due to escalating prices of raw materials and the scarcity of companies capable of building liquefaction plants. The investment cost has jumped from an average of $300 (by 2005) to an estimated average of $800 for 1 ton of export capacity for the future projects (plants to be commissioned after 2010). In addition, the limited number of companies able to build LNG terminals means that projects take longer to build, four years instead of three, according to Petroleum Economist. All the LNG exporting countries are now concerned by these burdens, and many are confronted to lack of upstream investment and could prefer using their gas on their domestic market rather than exporting. These facts have caused project delays and cancellations as can be seen in the next graph produced by CERA.

Study on Interoperability of LNG
15
LNG supply outlook
1.1.4. LNG Transport means The following charts from Wood Mackenzie show the evolution of the LNG fleet since 1965 and the expansion that will take place in the next years. There were 242 ships in operation in September 2007 and 140 on order and to be delivered until 2011.

Study on Interoperability of LNG
16
As shown in the next chart, the number of ships on order at the beginning of October 2007 represented 78% of the existing fleet in terms of cargo capacity.
From October 1992 to September 2007 the LNG fleet has expanded by an average of about 10% per annum on volume basis while the average rate of expansion between October 2007 and September 2010 is expected to be 20% assuming no further orders are placed or ships are scrapped or lost. However, the pace of new LNGCs ordering has fallen recently as shown below due to several reasons as increase in capital costs, technical expertise and resources not matching the pace of demand, delay in approval of new supply projects, etc. Number of Orders Order Book / Fleet Age

Study on Interoperability of LNG
17
The next chart helps to clarify the standard size of an LNG ship. Over the last 10 years the majority of ships delivered was in the range of 130.000 t0 145.000 m3. Around two-thirds of the ships under construction now are in the range of 150.000 to 180.000 m3 and, probably, the 170.000 t0 180.000 m3 range is the optimal size for a four-tank configuration.
Regarding the containment system, 65% of the ships in existence or on order feature membrane systems while 30% feature spherical Moss system. The latter system seem to be in decline due mainly to technological innovations, port charges and Suez Canal tolls. The following chart shows the number of ships the major LNG players have and their position towards owning or chartering these ships.
Study on Interoperability of LNG
18
1.1.5. Regasification and storage capacity at import terminals End of 2006, there were 57 regasification plants in the world. Six terminals went on stream in 2006: Sagunto in Spain, Aliaga in Turkey (completed in 2002), Altamira in Mexico, Guangdong Dapeng in China and Mizushima and Sakai in Japan. The total send-out capacity of the facilities in operation amounted to 516 bcm/y of natural gas and their storage capacity to 25,8 Mm3 of LNG with 283 storage tanks. In 2007 there were 13 LNG regasification terminals in 7 EU countries with a total send out capacity of 96 bcm per year. There is much speculation about future regasification plants in Europe, as well as in the western shore of the Atlantic Basin, and it is not easy to make an estimation of future send-out capacity additions. After consultation with diverse sources we have come to estimate that another 7 import regasification terminals could be operative in Europe before the end of the current decade adding a new market to the number of LNG users now, and some additional 57 bcm of send-out capacity per year. Out of the large number of projects announced, we have selected five projects as of most likely construction taking into account the ownership structure and capacity commitments their sponsors have already settled. Finally, we mention another 22 projects whose sponsors indicate they will go ahead in a near future though we can not provide further details. However, and due to the high degree of speculation mentioned, we do not dare to exclude other developments that could get green line and be commissioned before any some project of our list. Attached is a chart (ANNEX I) with the available information, useful for the purpose our Study, on the existing and planned regasification capacity in Europe.

Study on Interoperability of LNG
19
ANNEX I Inventory of LNG import terminals in the European
Union
Terminal
Location
Nom. Capac. (bcm/y)
Opera- tional
Max. size
cargoes (m3 LNG)
Storage capacity (m3 LNG)
To be
enlarged
In operation Zeebrugge LNG Belgium 9 1987 140.000 240.000
Grain LNG U. K 4 2005 205.000 200.000 Yes Montoir France 10 1980 200.000 360.000 Yes
Fos Tonkin France 7 1972 75.000 150.000 No Sines LNG Portugal 6 2004 165.000 240.000 Yes Barcelona Spain 15 1969 140.000 540.000 Yes
Huelva Spain 12 1988 140.000 460.000 Yes Cartagena Spain 11 1989 140.000 290.000 Yes
Bilbao Spain 7 2003 145.000 300.000 Yes Sagunto Spain 7 2006 145.000 300.000 Yes
Mugardos Spain 4 2007 145.000 300.000 Yes Panigaglia Italy 3 1969 70.000 100.000 Yes
Revithoussa Greece 2 2000 165.000 240.000
In construction Gate LNG Netherlands 9 2011 250.000 360.000
South Hook LNG U. K 11 2008 250.000 465.000
Dragon LNG U. K 6 2008 336.000 GrainLNG 2 U. K 9 2009 570.000 Fos Cavou France 8 2008 200.000 330.000 El Museo Spain 7 2009 140.000 300.000
Adriatic LNG Offsfh. Italy 8 2008 152.000 250.000
Planned
Eemshaven LNG Netherlands 12 2010
LionGas Netherlands 9 2010 495.000 Gran Canaria Spain 1 2009 140.000 150.000
Tenerife Spain 1 2010 140.000 150.000 Livorno
Offshore Italy 4 140.000 137.500
Other Planned 11 in Italy + 5 in France + 2 in UK + Germany + Poland + Croatia + Cyprus
In Italy: Livorno Offshore, Monfalcone, Muggia, South Adriatic, Taranto, Montalto di Castro, Gioia Tauro, Sicily, Ligurian, Rosignano, Vado Ligure.
Source: GIE and own information

Study on Interoperability of LNG
20
ANNEX I (Cont’d)
Owners
LSO
Legal Status
of LSO
TPA Accessregime
Fluxys LNG Fluxys LNG Legally unbundled rTPA National Grid National Grid
Grain LNG Ownership unbundled Exempt
Gaz de France Gaz de France Vertically integrated rTPA Gaz de France Gaz de France Vertically integrated rTPA REN Atlântico REN Ownership unbundled rTPA
Enagas Enagas Ownership unbundled rTPA Enagas Enagas Ownership unbundled rTPA Enagas Enagas Ownership unbundled rTPA
25% BP / Iberdrola / EVE / Repsol YPC
BBG Legally unbundled rTPA
42,5% U.Fenosa / 30% Iberdrola 20% Endesa / 7,5% Oman Oil Co. Saggas Legally unbundled rTPA
21% Endesa & U.Fenosa / 18% Tojeiro / 10%Sonatrach& Xunta& Caixa G. / 5% two financial instit.
Reganosa Legally unbundled rTPA
GNL Italy GNL Italy Partial ownership unbundled rTPA
DESFA DESFA Legally unbundled rTPA
Vopak / Gasunie / 5% Essent Ownership unbundled Exempt 67,5% Qatar / 24,15% ExxonMobil /
8,35 Total South Hook LNG Legally unbundled Exempt
50% BG / 30% Petronas / 20% 4GAS Legally unbundled Exempt
National Gris NGGLNG Ownership unbundled Exempt 70% Gaz de France / 30% TOTAL STMFC Legally unbundled rTPA
ENAGAS Enagas Ownership unbundled rTPA 45% Qatar / 45%ExxonMobil / 10%
Edison Adriatic LNG Legally unbundled 80% Exempt
50 %Essent / 25% Vopak / 25% Gasunie Exempt
4Gas Exempt Gascan Ownership unbundled rTPA Gascan Ownership unbundled rTPA
38% Endesa / 23% Irde Mercato 17% OLT Energy / 22% Others

Study on Interoperability of LNG
21
ANNEX I (Cont’d)
Capacity holders
Years of
Exemp.
Obliged
to offer
short-term cap.
Av. load factor
2006-2007
Second-market
50% Qatar Petroleum & ExxonMobil 28% Distrigaz / 22% Suez - 0% Yes
50% BP / 50% Sonatrach 20 0% Yes Gaz de France & others - 0% Yes Gaz de France & others - 0% Yes
Galp Gas Natural - No High contractual flexibility makes
capacity holding variable: several users - 25% 40% Yes
High contractual flexibility makes capacity holding variable: several users - 25% 42% Yes
High contractual flexibility makes capacity holding variable: several users - 25% 30% Yes
High contractual flexibility makes capacity holding variable: several users - 25% 55% Yes
High contractual flexibility makes capacity holding variable: several users - 25% 73% Yes
High contractual flexibility makes capacity holding variable: several users - 25% 30% Yes
ENI / Enel / Others - 0% Yes Depa - 0% No
Dong Energy / EconGas / Essent 20 0% ExxonMobil 25 0%
Petronas / BG 25 0% Centrica / Gaz de France / Sonatrach 20 0%
90% Gaz de France & Total / 10% EDF - 0% - 25%
Edison 25 0%
50% BG / 50% ENEL 25% 25% 0%

Study on Interoperability of LNG
22
The chart also shows that current storage capacity at LNG import plants is of 3.720.000 m3 of LNG (1 million m3 of LNG = 0,593 bcm of gas). Some additional 2.600.000 m3 could be available within the next 3 years. The existing storage capacity at LNG tanks hardly represents 5% of the LNG imported into Europe in 2007 what indicates that storage is being used thus far for operational purposes only. In North America there are also plenty of projects to build up regasification facilities and so making an accurate estimation of future capacities is rather difficult. Operational import terminals and in construction are shown below.
LNG regasification terminals in North America
Terminal Nominal Capacity (bcm/Y)
Capacity holders
Operational Everett 7 Suez LNG NA Cove Point 11 BP/Statoil/Shell Elba Islan 6 BG/Marathon/Shell Lake Charles 12 BG
In construction Canaport (Can.) 10 Irving/Repsol Freeport 15 ConocoPhilips/Dow/Cheniere Sabine Pass 28 TOTAL/Chevron/Cheniere Cameron 15 Sempra/ENI Golden Pass 21 ExxonMobil/ConocoPhilips/Qater P. Altamira (Mex.) 5 Shell/TOTAL
As it happens in Europe, regasification capacity in North America is expanding faster than available global LNG supply and well above the forecast increase of LNG imports. It seems, therefore, that physical regasification capacity will not be a barrier for the development of the LNG trade in the Atlantic or Mediterranean Basins. All capacity holders are resource holders or integrated players (see chapter 1.2.6 for type of operators).

Study on Interoperability of LNG
23
LNG gasification terminals in Europe: existing plants and projects
(Source: OME)
Cyprus
Turk
Bulgaria
RomaniaHungary
Slovakia
Austria
Czech.Rep.
Denmark
Spain
Greece
Lithuania
Estonia
Finland
UKPoland
Italy
Switz.
Turkey
Romania
Bulgaria
Czech.RepSlovakia
HungarySlovenia
Latvia
Estonia
Lithuania
Serbia
Lux.
Malta
Croatia
Bosnia
Albania FYROM
Norway
France• Fos-sur-Mer• Montoir*
Greece• Revithoussa*
Italy• Panigaglia*
Spain• Barcelona*• Bilbao• Cartagena*• Huelva*• Sagunto*
Belgium• Zeebrugge*
Portugal• Sines*
United Kingdom• Isle of Grain*• Teeside GasPort
• Dragon• South Hook
Turkey• Aliaga*• Marmara Ereglisi
• Brindisi• Livorno• Rovigo
Under construction
Existing & Expansion *
Planned
• Gateway• Canvey• Angelesey• Norsea LNG
Ireland• Shannon
Cyprus• Vassiliko
Netherlands• LionGas• Gate LNG Poland
• SwinoujscieGermany• Wilhelmshaven
• LeVerdon• Dunkirk
Sweden• Oxelosund
Croatia• Krk
• Fos Cavaou• El Ferrol
• El Musel
• PortoEmpedocle• Taranto• Trieste• Livorno• Monfalcone• Priolo• Gioia Tauro• San Ferdinando Cyprus
Turk
Bulgaria
RomaniaHungary
Slovakia
Austria
Czech.Rep.
Denmark
Spain
Greece
Lithuania
Estonia
Finland
UKPoland
Italy
Switz.
Turkey
Romania
Bulgaria
Czech.RepSlovakia
HungarySlovenia
Latvia
Estonia
Lithuania
Serbia
Lux.
Malta
Croatia
Bosnia
Albania FYROM
Norway
France• Fos-sur-Mer• Montoir*
Greece• Revithoussa*
Italy• Panigaglia*
Spain• Barcelona*• Bilbao• Cartagena*• Huelva*• Sagunto*
Belgium• Zeebrugge*
Portugal• Sines*
United Kingdom• Isle of Grain*• Teeside GasPort
• Dragon• South Hook
Turkey• Aliaga*• Marmara Ereglisi
• Brindisi• Livorno• Rovigo
Under construction
Existing & Expansion *
Planned
• Gateway• Canvey• Angelesey• Norsea LNG
Ireland• Shannon
Cyprus• Vassiliko
Netherlands• LionGas• Gate LNG Poland
• SwinoujscieGermany• Wilhelmshaven
• LeVerdon• Dunkirk
Sweden• Oxelosund
Croatia• Krk
• Fos Cavaou• El Ferrol
• El Musel
• PortoEmpedocle• Taranto• Trieste• Livorno• Monfalcone• Priolo• Gioia Tauro• San Ferdinando

Study on Interoperability of LNG
- 24 -
1.2. Dynamics of LNG Trade in the Atlantic Basin 1.2.1. Development of contracting strategies and structural changes in the LNG industry For the first three decades of its existence the LNG industry in the Atlantic Basin has been
based on bi-lateral trade and dedicated contracts, typically concluded for 20 years with rigid off-take obligations
Increased gas demand in all major world markets, higher prices and high price expectations,
development of new LNG supply sources, the search for supply diversifications and the cost-reducing effects in shipping and liquefaction (in a recent past) are some of the key reasons for the substantial growth in LNG trade.
Not surprisingly such major expansion in LNG trade has been accompanied by major
structural changes in the industry, for which the US has functioned as a major catalyst of change in the Atlantic Basin.
The structural effect of the US market – expected to become the largest LNG import market in
the world – will only grow further, because of its significant demand pull on cargoes, its deep liquid market with a transparent price setting mechanism.
In Europe the transition from dedicated LNG flow under long-term bilateral contracts to
flexible short-term trading of (spot) cargoes has been evolving gradually, mainly on the strength of additional or early cargoes associated with contracted production or deviations of contracted volumes.
The expected continuation of the current sellers' market for LNG cargoes for the next (up to)
10 years in all major LNG markets – which are more and more interacting – is driving producers towards shorter term contracts and destination control. Their financial muscle gained from high oil prices underpins these policies. (Recent declarations by the Algerian Minister of Energy that Sonatrach would not contract LNG beyond five years and even prefer to sell cargoes in the spot market on a "cargo-by-cargo" basis to the highest bidder is a good illustration).
The relatively recent phenomenon of "self-contracting" by producers (i.e. writing supply contracts with own marketing affiliates rather than with third-party importers) is another form of the demise of the long-term supply commitments to unrelated importing gas merchants. Motivations for this new form of contracting can be several ; e.g. a keen desire of the producers to control destination changes, to capture arbitrage margins, to sell their LNG further downstream because of a lack of confidence in the off-take capabilities of established importers being under pressure from regulatory authorities (security of demand concerns).
It goes without saying that the dominance of LNG producers (many of whom are NOC's) and their growing control over the LNG chain is not always conducive to the security of supply from an importer/consumer point of view.
As the assurances obtainable from producers in long-term contractual supply undertakings is
generally weakening, operators wishing to secure LNG for their European markets will only attract the required volumes by outbidding other parties in a globalizing LNG market. This will further contribute to the increasing price volatility in a supply constrained European market.
As a final note, it should be mentioned that changes in contracting philosophies in the
globalizing LNG market also start to impact pipeline contracts, although their logistic rigidity

Study on Interoperability of LNG
- 25 -
provides a better "safeguard" for volumes to stay in the intended market (security of supply concerns).
1.2.2. LNG flows : outlook for spot and short-term destinations
Recent statistics of spot2 and short-term3 LNG imports (Fig. 1) and exports (Fig. 2) for the last 10 years show an annual growth rate of over 15 %, compared with a growth of 8 % p.a. for all LNG trade.
Fig. 1
Source : GIIGNL
2 The pure spot market for LNG cargoes (tenders of separate cargoes) is relatively small and the bulk of the spot volumes consists of diverted cargoes that are part of term contracts with destination flexibility. 3 Contracts of 4 years or less.

Study on Interoperability of LNG
- 26 -
Fig. 2
Source : GIIGNL The growth of the spot market appears entirely conditioned by that of "flexible supplies". LNG
supply is considered "flexible" in this context if there is total discretion (freedom) about the cargo destination.
Cedigaz reports that in 2006 approximately 15 % of all LNG trade was spot or short-term and
expects this percentage to double in a decade. The consultants CERA estimate that presently some 13 % of global LNG supply capacity is
"flexible" and that by the end of 2009 this share can grow to 21 %. Of the new supplies becoming operational worldwide in 2008-2009, nearly 40 % can be considered as "flexible", more than half of which is situated in the Middle East and with easy access to all LNG markets.
Global flows of spot LNG are increasingly determined solely by price signals which either
redirect cargoes away from "target" markets in term contracts or steer cargoes sold on short-term tenders. Such redirections are obviously helped by the existence of spare regas and shipping capacity.
Under conditions of adequate supplies, the competition among LNG suppliers for the highest
value market should help the consumer; under conditions of supply constraints however the downstream buyer who wants to attract incremental volumes has to outbid the competition from the area with the highest spot prices that still has spare regasification capacity.
Hence, where the balance of power lies will not surprisingly be dependent upon the outlook for LNG supply versus demand (an analysis of the latter topic is provided in this report).
The increased demand in the Pacific Basin since mid-2007 is an illustration of how price signals have diverted away virtually all flexible cargoes from the USA (except for some
Study on Interoperability of LNG
- 27 -
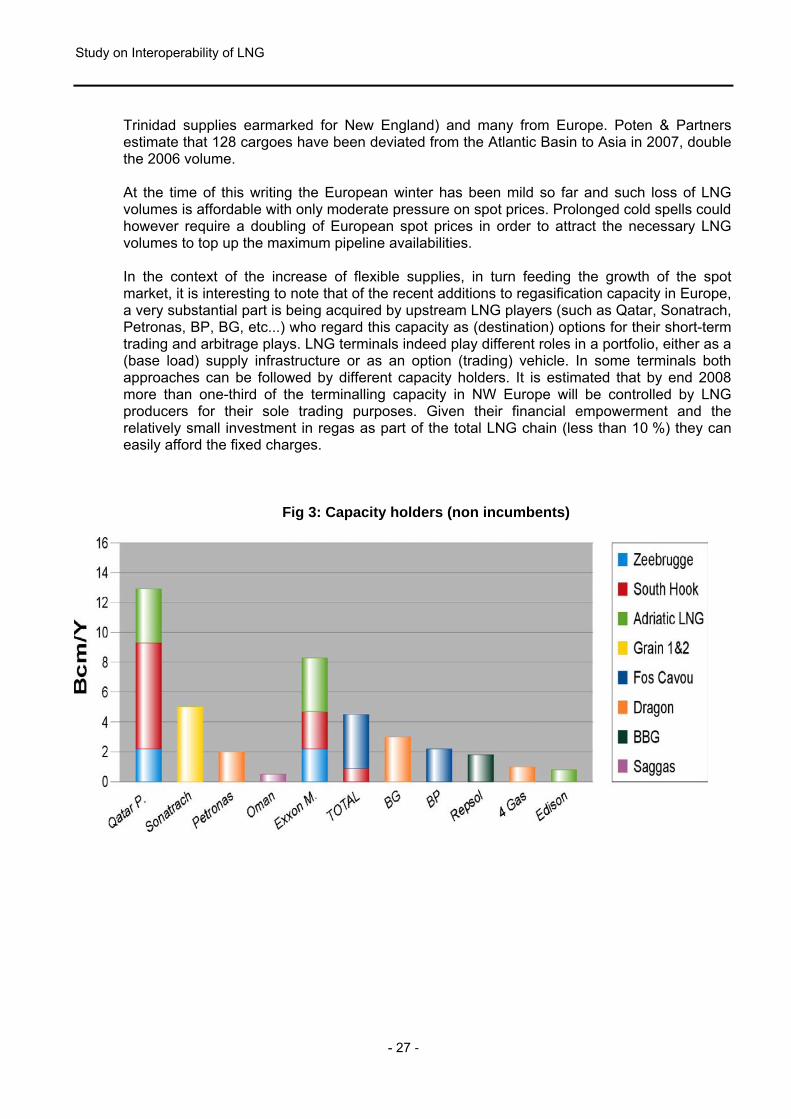
Trinidad supplies earmarked for New England) and many from Europe. Poten & Partners estimate that 128 cargoes have been deviated from the Atlantic Basin to Asia in 2007, double the 2006 volume. At the time of this writing the European winter has been mild so far and such loss of LNG volumes is affordable with only moderate pressure on spot prices. Prolonged cold spells could however require a doubling of European spot prices in order to attract the necessary LNG volumes to top up the maximum pipeline availabilities. In the context of the increase of flexible supplies, in turn feeding the growth of the spot market, it is interesting to note that of the recent additions to regasification capacity in Europe, a very substantial part is being acquired by upstream LNG players (such as Qatar, Sonatrach, Petronas, BP, BG, etc...) who regard this capacity as (destination) options for their short-term trading and arbitrage plays. LNG terminals indeed play different roles in a portfolio, either as a (base load) supply infrastructure or as an option (trading) vehicle. In some terminals both approaches can be followed by different capacity holders. It is estimated that by end 2008 more than one-third of the terminalling capacity in NW Europe will be controlled by LNG producers for their sole trading purposes. Given their financial empowerment and the relatively small investment in regas as part of the total LNG chain (less than 10 %) they can easily afford the fixed charges.
Fig 3: Capacity holders (non incumbents)

Study on Interoperability of LNG
- 28 -
Fig. 4
1.2.3. Price setting mechanisms
It is well known that the cost per energy unit of moving natural gas over long distances (as LNG) is approx. 7 times higher than for oil. This explains why natural gas trade and pricing has so far been largely structured on a regional basis. As a result, gas prices vary between regions and price movements can even go in different directions. One can distinguish three different pricing concepts for gas: (1) Traded markets
Supply/demand set a clearing price, which can be used in spot or short-term transactions only or also as a marker in long-term contracts
(examples: Henry Hub, NBP).
(2) Bi-lateral contract markets Contract pricing formulae use a benchmark (usually, but not exclusively, oil) for the periodic price (re)calculations (examples: continental European and Asian long-term supply contracts).
(3) Administered prices

Study on Interoperability of LNG
- 29 -
Set by governments for an (isolated) market, very often below international price levels to subsidise local economic activity (example: most gas-rich countries like Russia, Middle East).
Europe currently has a dual price setting mechanism for spot and long-term contract transactions. Oil indexation is the most-frequently occurring marker for long(er) term contracts on the Continent, has so far been the preferred choice of both sellers and buyers. The rationale for this choice from a buyers' point of view has been inter-fuel competition; it is gradually shifting towards the better hedgeability of oil (particularly Brent) and the lower volatility and lesser risk of oil index manipulation than for a gas index. Sellers, and particularly LNG sellers, have traditionally been more comfortable with oil indexation as well as they tend to be large oil producers. For short(er) term contracts however an indexation to a spot marker (either NBP or one of the more liquid Continental indices) has become the norm. The dual pricing mechanism in Europe is the topic of heated debate, but it can be expected that a vast majority share of the European supply portfolio will continue to be priced on a bilateral contract basis, using oil as the marker. Long-term contract prices therefore rarely match the market-clearing spot prices at any particular point in time: at times of supply pressures in the market (e.g. winter) spot prices tend to be the higher, at times of supply overhang the opposite occurs. In view of the relatively small number of LNG operators in Europe and the limited – but growing – volumes of non-committed LNG one cannot claim that LNG trade has provided substantial liquidity so far to the gas market. Europe and North America, with their own specific supply/demand balances, have been separated markets so far with different clearing prices. As physical LNG trade linking both markets grows, the issue whether a price convergence can be expected will be discussed in a next paragraph.
1.2.4. Arbitrage opportunities
The liberalisation of gas markets has enabled operators to exploit the physical destination flexibility of LNG deliveries and capture arbitrage opportunities. Other necessary conditions for arbitrage are:
- contractual destination flexibility - surplus shipping and terminalling capacity - price swings between the various LNG markets.
The attractiveness of arbitrage margins has resulted in a contest between sellers (producers) and buyers (traders and importers) for the control of destination flexibility, and hence of arbitrage play. As contractual hurdles, such as destination clauses, have been banned (but only in Europe), the producers are striving more and more for DES or even ex-terminal sales under new term contracts. This provides them a permitted logistic reason for destination control and their greater financial strength enables them to carry the shipping or even terminalling commitments. The condition of surplus shipping capacity is expected to be satisfied for the foreseeable future. CERA calculates a "redundancy" rate for LNG vessels in the order of 33 % for 2008,
Study on Interoperability of LNG
- 30 -
which is expected to continue at a volatile but only slightly reduced rate well beyond 2010. Wood Mackenzie figures, as shown in chapter 1.1.4, also support this estimation. The surplus is even more prevalent with regard to regas capacity. Utilization rates of receiving LNG terminals are expected to dip below 50 % on an annual average basis in North America as well as in Europe, until the growth in liquefaction capacity may outpace that of terminalling investment (unlikely in the next 5 to 10 years). Speculative contracting of terminalling capacity by hopeful LNG purchasers and by equity-LNG holders (cfr. paragraph 1.2.2.) to support LNG trading and provide diversion options are underlying reasons for this surplus. The destination of "flexible LNG" will be determined by the most attractive netback for such cargoes, assuming that adequate surplus shipping and regas capacity will continue to allow for diversions to "the market of choice". The price signals for such "redirection" of cargoes can be caused by various supply and demand events; such as short-term supply disruptions (Indonesian under-deliveries), demand surges (nuclear outages in Japan, drought in Spain), seasonal storage shortage (Korea), etc... The US market has taken on the role of swing market in recent years because of its high summer demand in the Southern States, its adequate seasonal storage and its overhang in regas capacity. It can counterbalance the winter demand of the Asian markets. Flexible LNG and arbitrage plays allow Asian buyers, with limited storage capacity and no alternatives in the form of pipeline gas, to meet seasonal demand swings and cover short-term supply gaps. In Europe, the market most approaching the aforementioned situation and using LNG arbitrage as a critical swing source is Spain. Other markets have more much more storage capacity (though seasonal storage is expected to become short) and rely on pipe gas as the dominant supply source (close to 90 %). As more and more LNG will be required as base load to cover the emerging supply gap, Europe as a whole might become more vulnerable to "losses" of flexible LNG supplies. Currently, in the global LNG trade the huge US market with its deep liquidity, transparent pricing and surplus regas capacity has become the market of last resort for flexible cargoes or spot tenders. For any market needing (more) short-term cargoes the US market constitutes a floor to the offer price, so that the producer at least breaks even versus sending the cargo to the USA. The growing import requirements for LNG of the US market are set to increase global supply competition and raise this floor. Another uncertainty arising from the future growth in LNG imports in the US (and their future role as base load supply) is whether the US will be able to continue to provide counter swing to other markets (in particular Asia, but possibly also Europe). Considering that LNG production investment has to operate with a high load factor for economic reasons, the off-take on a global basis has necessarily to match such stable production at any time throughout the year, also when LNG supply and demand reach an equilibrium.
Finally, it should be stressed that by far the most critical factor which limits –currently and in the medium term – the arbitrage play and the growth of the LNG spot market is the shortage of LNG supply (due to liquefaction investment lagging demand).

Study on Interoperability of LNG
- 31 -
1.2.5. Future possible convergence of LNG markets in the Atlantic Basin
"Convergence" is understood here as the operation of a single price mechanism in the traded (spot) market. At issue is whether the LNG volumes exchanged between Europe and North America will cause the respective traded markets to move in harmony, and in a further stage, affect or even undo the European long-term contract pricing. According to CERA a number of conditions need to be fulfilled for markets to converge in pricing terms. Below are the more critical ones:
(1) Existence of sufficient supply that can move between markets (i.e. "flexible" LNG without
a contractual destination obligation) in response to price signals. Although the share of flexible supplies out of total LNG is growing, in absolute terms availability is still short of demand and small in comparison to total market size.
(2) Availability of surplus shipping capacity, so that cargo diversions to more distant
destinations do not affect production.
On average ample capacity is expected to be available although incidental tightness can occur at times of sudden flow shifts. The introduction of larger ships (in excess of 200.000 cm) may reduce options for some destination changes for that part of the fleet.
(3) Availability of accessible surplus regasification capacity, so that significant quantities of
LNG can switch between markets without physical, commercial or regulatory constraints. Physical capacity limits are expected to hinder switchability only at the very (winter) peaks, (and when price volatility is highest). On the commercial and regulatory side, it should be noted that even with stringent UIOLI measures, the complexities of terminal operations, cargo scheduling and berthing as well as gas quality compatibility (mainly in US East Coast terminals) may frequently hinder arbitrage and cargo diversions.
(4) Balance between supply and demand in the respective markets.
As long as markets have a substantial overhang of pipeline supply and storage send-out capacity, the relatively modest LNG swings (in percentage of market supply) will not greatly impact prices. If supplies are tight then LNG arbitrage in or out of a market can shift prices, and the more so as the share of LNG in market supply is higher (which is the case in Europe compared to the USA). Such price sensitivity to LNG swings will increase in Europe as the LNG share is set to grow from 10 to 20 % over the next decade. On the other hand, the development of large new pipeline projects from Russia, Algeria, the Caspian Region could dampen such price sensitivity. Not only would these new projects provide "destination-secure" base load supplies, they would ensure back-up cover for LNG diversions and hence underpin market liquidity in Europe.
A general conclusion may be that the liquid American market will at times exercise a growing influence in European spot prices, but that various arbitrage constraints and time lags will limit such influence in time and in extent.

Study on Interoperability of LNG
- 32 -
As far as the contract market is concerned, the reluctance of European importers (as well as of the Asians) to enter into long-term off-take commitments priced at the Henry Hub is evident given the disconnection of the two markets and their general lack of understanding of the US market. Even if a dual pricing in Europe would cease – which is most unlikely in the foreseeable future – and the long-term contract market would massively move from oil to spot gas indexation, a true price convergence in the Atlantic Basin still seems most doubtful. Moreover, such convergence would not necessarily be in the European consumer's interest given his closer proximity to the world's largest gas reserves and his access to large pipeline supplies as compared to the American market.
1.2.6. Business models : Types of operators in the LNG trade
Traditionally each LNG project was operated through a chain of separate but integrated functions (production, liquefaction, shipping, terminalling) which were interconnected by long-term contractual relationships for the commodity transaction as well as for the dedication of infrastructure. The title transfer between the resource companies, as seller/producer, and market companies, as buyer/importer, occurred either at the loading terminal (FOB sales) or at the unloading terminal (DES sales). The demarcation lines between the two parties have become blurred with the vertical integration of the LNG business, initially in the Atlantic Basin only but now spreading to the Pacific region. One can essentially distinguish three types of positions or strategies in the LNG supply chain:
(a) Resource holders:
Companies focussing mainly on production and liquefaction and its high producer's rent but also risks. Include many NOC's and some IOC's.
(b) Marketers and gas traders:
Companies focussing mainly on the lower margin but increasingly risky trading, import of LNG and on-selling of regasified LNG to a consumer portfolio.
(c) Integrated (portfolio) players:
Companies which span the entire LNG chain, or a large part of it, and this possibly for a portfolio of projects. They integrate markets and resource; they control a substantial portion of the operation of the chain, extract business value from arbitrage and the flexibility of matching various destinations and sources.
Several of the companies which used to fall in the (a) and (b) categories are integrating by moving up or down the chain to mitigate risk (security of supply as well as of demand) and enhance margins. Non-integrated players will certainly feel a strong competitive challenge in terms of margins and business risk. Operators that are solely in the mid-stream (like LNG traders and wholesalers) without either a resource base or end-consumer portfolio are likely to be
Study on Interoperability of LNG
- 33 -
squeezed out, particularly by the push for integration of the (upstream) resource-holders. Needless to remind that in a supply constrained LNG market the latter hold the trump cards. Such integration cuts out players and could reduce market liquidity. The only "niche operators" in the LNG chain that should in principle withstand the integration drive are shipping and terminal developers/operators, as they are protected by specialized business expertise and regulatory measures. If they are independent standalone owners of capacity their major challenge will however be the overcapacity in case they had made speculative investments for which they seek to trade the capacity on a merchant basis.
1.3. Technical Innovations
1.3.1. Liquefaction plants
The size of liquefaction facilities has evolved from the 0,3 Mtpa capacity of the liquefaction train built in Arzew (Algeria) in 1964 to the 5,1 Mtpa put into operation in Trinidad & Tobago at the end of 2006 always seeking for economies of scale. Currently there are several trains of 5 Mtpa under construction in Egypt, Nigeria, Angola… but the major development are the 6 liquefaction trains of 7,8 Mtpa being built in Qatar. Projects for similar capacity trains in resource-rich countries as Nigeria and Iran indicate the trends in this stage of the LNG chain. Developers estimate that these large trains could render production efficiencies of around 15% over the 4 to 5 Mtpa trains as well as investment savings. A more precise estimation of efficiencies and cost savings is impossible to obtain since only the specialized engineering companies possess this information and large variations can occur depending on several factors such as location, port facilities, local permits and manpower availability, etc. that could make for a similar size project to nearly double the investment requirements. However, the potential economies of scale are now offset by the escalating costs of components but mainly by bottlenecks in specialized engineering companies and contractors. There are 4 recognized engineering companies: - Air Products: carrying out the largest trains in Qatar - ConocoPhillips: proprietor of the Cascade technology - Linde / Statoil: Snohvit project - Shell: using the DMR process only in its facilities. The list of recognized contractors is not much larger: KBG/JGC, Chiyoda, Bechtel, Technip, Linde, Foster Wheeler, CB&I. Some experts consider this increasing costs trend will reverse if liquefaction projects continue to be postponed and because the effective increase in the costs of components does not explain the overall increase in investment budgets. Also with regard to large liquefaction capacities it is worth mentioning the train design for the production of 11 Mtpa of LNG recently presented by Shell Global Solutions. It is fully scalable from 6 to 11 MTPA and based on Shell’s Parallel Mixed Refrigerant Process (PMR).
Study on Interoperability of LNG
- 34 -
Important economies of scale with respect to capital as well as to operational costs are anticipated although we are not aware of specific projects using this new technology yet. From the management and commercial perspective the development to watch is the so called Common LNG Facility in Qatar. This is a model to optimize the overall Qatar LNG supply chain by means of the agreement among five JVs associated to store and load their LNG exports through a single integrated facility instead of different standalone facilities.
1.3.2. Methane tankers Major innovations taking place in the transport link of the LNG chain could be summarized in the following points: - Cargo capacity: The advent of computers performing detailed calculations together with
the experience with existing LNG carriers has enabled an increase in cargo capacity in both Moss and Membrane type of vessels. The traditional spherical Moss tanks have been elongated and are now "egg shaped" bringing the past 138.000 m3 capacities up to about 155.000 m3 or more. The membrane tanks can now be made bigger and a vessel with 4 tanks of 138.000 m3 capacities can now reach 177.000 m3. Adding a 5th tank provides for a Q-Flex type vessel and a 6th tank provides for a Q-Max type vessel. Cargo capacities can now be adjusted to the requirements of the rotation of a fleet for a certain distance and quantity, looking at getting the highest cargo capacity for the highest vessel occupancy rate.
- Propulsion: Manufacturers of medium speed engines have developed the capability of
burning boil-off gas, diesel or fuel-oil. This dual-fuel flexibility was only provided previously by steam turbine propulsion. Now the same flexibility is provided by a more efficient, less consuming propulsion plant with the further benefit of being more compact in size (allowing for higher cargo capacity for the same vessel).
- The increase in cargo capacity together with a decrease in fuel consumption makes for a
lower unit cost of transport which in turn makes shipping more competitive.
- The Qatar project has been the major breakthrough in LNG shipping philosophy. It has introduced much bigger vessels (Q-Max at 265.000 m3 capacity and Q-Flex at 216.000 m3 capacity) slow speed engines with no boil-off burning capabilities and re-liquefaction plants to deal with the boil-off and maintain the cargo level constant in theory.
This is a specific approach to LNG shipping that follows a Qatari business model but has not been replicated in the industry so far. The longer voyage distances required to reach the US market had forced Qatargas to order vessels of a much larger capacity than was offered by the existing fleet. Besides, the re-liquefaction plant on board will result in 99% reduction in boil-off gas loss, accomplishing the Qatari's objective of "sell what you load". The first full-scale shipboard reliquefaction plant has been developed and delivered by Hamworthy and approved and certified by Det Norske Veritas. The first order for a plant incorporating Hamworthy's latest low energy technology was announced last August. The deal involves three Q-Flex tankers of 215,000 cu m, to be built by Hyundai for the Qatargas III train. In theory, the larger vessels could offer an 11% reduction in capital expenditure and 23% in operating costs.

Study on Interoperability of LNG
- 35 -
To some experts, however, the economics of this design are not clear since fuel-oil is at record high prices and utilization of these vessels can be limited in terms in compatibility with terminals on a worldwide basis due to their size. Though, on the other hand, these vessels allow for extra long periods of floating storage4, which may be of interest when the cargo can not be consumed or when searching for better market opportunities. On the other side of the size scale developments to watch are the Compressed Natural Gas (CNG) and Pressurised Natural Gas (PNG) carriers. These new technologies are looking at competing fully with coast to coast pipelines. These vessels will carry about 1/3 of the capacity of an equivalent LNGC and will release gas directly to the grid without the requirement of LNG storage tanks. The economics for this alternative transport seems interesting in the shorter distances where pipelines can compete with LNG. For longer distances LNG is still more economic in principle.
1.3.3. Regasification terminals and LNG storage Not many technical innovations can be mentioned on the regasification side other than the on-board regasification based on Excelerate Energy’s proprietary Energy Bridge shipboard regasification technology. This new technology is already in service in vessels of 138.000m3 capacity with a peak send-out rate of 450 MMcf/d. A second generation of vessels of 151.000 m3 is expected to be in service in March with a send-out rate of 600 MMcf/d. Regarding LNG storage, Cyrotank (Statoil & NCC) has built up all concrete cryogenic tanks in Snohvit and has been awarded the construction of three 190.000 m3 tanks in Grain 2. This type of storage tanks, initially thought for extreme cold weather conditions, has the potential of reaching 250.000 m3 capacity, shorter construction times and, according to the sponsors, 10% to 20% lower investment due to reduced material costs (steel) and reduced man hours.
4 The term “floating storage” is used to describe systems where surplus ship capacity is purposely acquired to act as supplemental storage.

Study on Interoperability of LNG
- 36 -
2. INTERCHANGEABILITY OF PRODUCTS 2.1. Quality of LNG Produced 2.1.1. Parameters taken into consideration
Gas quality issues have recently drawn increased attention due to: - gas imports into the UK via Interconnector and LNG: some Norwegian gas and most LNG
exceed the upper limits for Wobbe Index in UK, which have been set at low level to protect older household appliances;
- LNG imports in USA have higher heat content and higher Wobbe Index than domestic
pipe gas and fall outside gas quality standards of local utilities and pipelines; - different gas quality standards throughout Europe are seen as a potential barrier for
interchangeability and hence for the creation of efficient European gas market. A useful definition of interchangeability could be the one provided by the NGC+ group5: “The ability to substitute one gaseous fuel for another in a combustion application without materially changing operational safety, efficiency, performance or materially increasing air pollutant emissions“. To set a certain range of values for gas specifications has always been considered as a target that will significantly contribute to the interchangeability in the internal market. The issue when trying to set the upper and lower limits of this range is to be sure that, while covering the specifications of LNG available in the market, these values were also adequate to achieve the following objectives: - ensuring safe combustion - avoiding damage to pipeline systems and related installations - preventing damage to customer gas utilization equipment - allowing interchangeability of gases (and cross-border trade) There are four major categories of gas quality standards and their objectives:
5 A technical working group set up by some US industry stakeholders to address gas interoperability issues:

Study on Interoperability of LNG
- 37 -
Wobbe Index (or Wobbe Number) is the most critical measure of interchangeability for LNG given the nature of the liquefaction process which already removes most "impurities"
2.1.2. Range of variation of these parameters
Figure 1
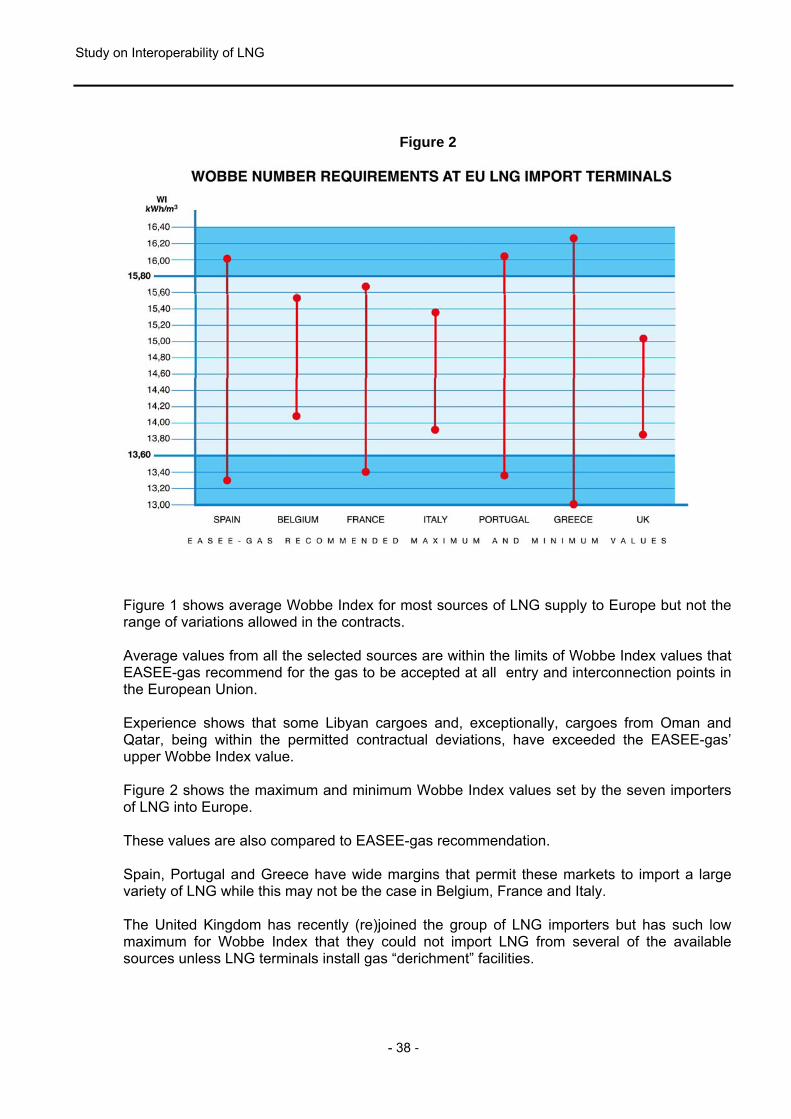
Study on Interoperability of LNG
- 38 -
Figure 2
Figure 1 shows average Wobbe Index for most sources of LNG supply to Europe but not the range of variations allowed in the contracts. Average values from all the selected sources are within the limits of Wobbe Index values that EASEE-gas recommend for the gas to be accepted at all entry and interconnection points in the European Union. Experience shows that some Libyan cargoes and, exceptionally, cargoes from Oman and Qatar, being within the permitted contractual deviations, have exceeded the EASEE-gas’ upper Wobbe Index value. Figure 2 shows the maximum and minimum Wobbe Index values set by the seven importers of LNG into Europe. These values are also compared to EASEE-gas recommendation. Spain, Portugal and Greece have wide margins that permit these markets to import a large variety of LNG while this may not be the case in Belgium, France and Italy. The United Kingdom has recently (re)joined the group of LNG importers but has such low maximum for Wobbe Index that they could not import LNG from several of the available sources unless LNG terminals install gas “derichment” facilities.

Study on Interoperability of LNG
- 39 -
2.1.3. EASEE-gas quality standards
The Forum of Energy Regulators (Madrid Forum) identified in 2002 the need for removing technical obstacles for interoperability of different natural gas qualities and asked Gas Transmission Europe (GTE) for a plan. EASEE-gas undertook this responsibility and set up a specific working group on gas quality. After 19 meetings over a 2 year period attended by representatives of 14 countries, 6 industry associations and 37 companies, EASEE-gas approved a Common Business Practice (CBP) on February 2005 recommending the values tabled hereunder:
EASEE-GAS THE GAS QUALITY HARMONISATION COMMON BUSINESS PRACTICE
Approved parameters, values and ranges
Parameter Unit Min Max Recommended
implementation date WI kWh/m3 [13.60] 15.81 1/10/2010 d m3/m3 0.555 0.700 1/10/2010 Total S mg/m3 - 30 1/10/2006 H2S + COS (as S) mg/m3 - 5 1/10/2006 RSH (as S) mg/m3 - 6 1/10/2006 O2 mol % - [0.01] 1/10/2010 CO2 mol % - 2.5 1/10/2006 H2O DP ºC at 70 bar (a) - -8 HC DP ºC at 1-70 bar (a) - -2 1/10/2006
Where: WI - Gross (Superior) Wobbe Index d - relative density S - Total Sulphur H2S + COS - Hydrogen sulphide + Carbonyl sulphide RSH - Mercaptans O2 - Oxygen CO2 - Carbon dioxide H2O DP - Water dew point HC DP - Hydrocarbon dew point The energy unit is kWh with a combustion reference temperature of 25 °C, and the volume unit is m3
at a reference condition of 0°C and 1.01325 bar(a).
EASEE-gas standards are derived from EN437 norm but have subtracted a safety margin to account for ageing and maintenance of gas appliance. EASEE-gas recommended the implementation of the parameters by 1 October 1st, 2006 but admitted that implementation related to combustion properties (WI, d) and oxygen would not be reasonably feasible before October 1st 2010.
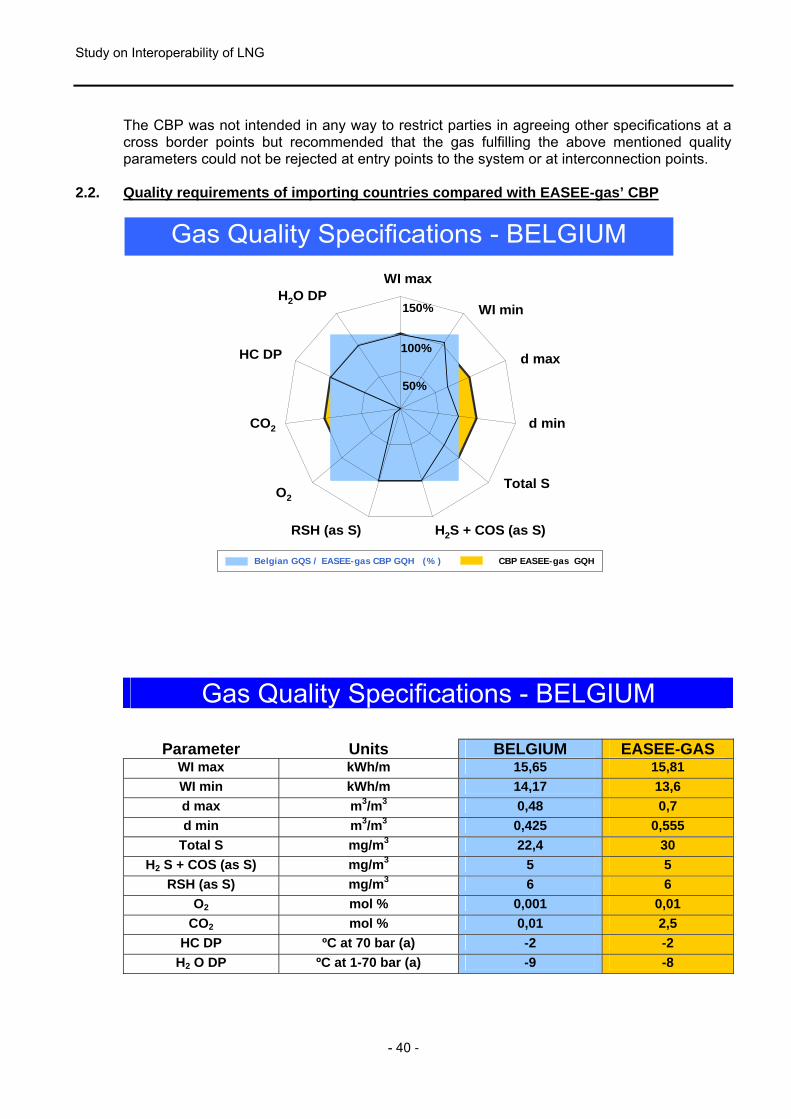
Study on Interoperability of LNG
- 40 -
The CBP was not intended in any way to restrict parties in agreeing other specifications at a cross border points but recommended that the gas fulfilling the above mentioned quality parameters could not be rejected at entry points to the system or at interconnection points.
2.2. Quality requirements of importing countries compared with EASEE-gas’ CBP
Gas Quality Specifications - BELGIUM
50%
100%
150%
WI max
WI min
d max
d min
Total S
H2S + COS (as S) RSH (as S)
O2
CO2
H2O DP
HC DP
CBP EASEE-gas GQHBelgian GQS / EASEE-gas CBP GQH (%)
Gas Quality Specifications - BELGIUM
Parameter Units BELGIUM EASEE-GAS WI max kWh/m 15,65 15,81 WI min kWh/m 14,17 13,6 d max m3/m3 0,48 0,7 d min m3/m3 0,425 0,555
Total S mg/m3 22,4 30 H2 S + COS (as S) mg/m3 5 5
RSH (as S) mg/m3 6 6 O2 mol % 0,001 0,01
CO2 mol % 0,01 2,5 HC DP ºC at 70 bar (a) -2 -2
H2 O DP ºC at 1-70 bar (a) -9 -8

Study on Interoperability of LNG
- 41 -
50%
100%
150%
WI max
WI min
(no data) d max
(no data) d min
Total S
H2S + COS (as S) RSH (as S)
O2
CO2 (no data)
H2O DP (no data)
HC DP (no data)
Gas Quality Specifications - FRANCE
CBP EASEE-gas GQHFrench GQS / EASEE-gas CBP GQH (%)
Gas Quality Specifications - FRANCE
Parameter Units FRANCE EASEE-GAS WI max kWh/m 15,65 15,81 WI min kWh/m 13,4 13,6 d max m3/m3 0,7 d min m3/m3 0,555
Total S mg/m3 30 30 H2 S + COS (as S) mg/m3 5 5
RSH (as S) mg/m3 6 6 O2 mol % 0,01 0,01
CO2 mol % 2,5 H2 O DP ºC at 70 bar (a) -8 HC DP ºC at 1-70 bar (a) -2

Study on Interoperability of LNG
- 42 -
Gas Quality Specifications - GREECE
100%
200%
300%
WI maxWI min
d max
d min
Total S
H2S + COS (as S) RSH (as S)
O2 (2000%)
CO2
H2O DP
HC DP
CBP EASEE-gas GQHGreek GQS / EASEE-gas CBP GQH (%)
Gas Quality Specifications - GREECE
Parameter Units GREECE EASEE-GAS WI max kWh/m 16,23 15,81 WI min kWh/m 15,6 13,6 d max m3/m3 0,56 0,7 d min m3/m3 0,71 0,555
Total S mg/m3 80 30 H2 S + COS (as S) mg/m3 5,4 5
RSH (as S) mg/m3 0 6 O2 mol % 0,2 0,01
CO2 mol % 3 2,5 HC DP ºC at 1-70 bar (a) 0 -2
H2 O DP ºC at 70 bar (a) -5 -8

Study on Interoperability of LNG
- 43 -
100%
200%
300%
WI max
WI min
d max
d min
(527%) Total S
H2S + COS (as S) RSH (as S)
O2 (6000%)
CO2
H2O DP
HC DP
Gas Quality Specifications - ITALY
CBP EASEE-gas GQHItalian GQS / EASEE-gas CBP GQH (%)
Gas Quality Specifications - ITALY
Parameter Units ITALY EASEE-GAS WI max kWh/m 15,28 15,81 WI min kWh/m 13,86 13,6 d max m3/m3 0,47 0,7 d min m3/m3 0,43 0,555
Total S mg/m3 158,23 30 H2 S + COS (as S) mg/m3 6,32 5
RSH (as S) mg/m3 15,82 6 O2 mol % 0,6 0,01
CO2 mol % 3 2,5 HC DP (*) ºC at 70 bar (a) 0 -2
H2 O DP (*) ºC at 1-70 bar (a) -5 -8 (*) Cero reference, -15ºC

Study on Interoperability of LNG
- 44 -
Gas Quality Specifications - PORTUGAL
100%
200%
300%
WI max
WI min
d max
d min
Total S
H2S + COS (as S) RSH (as S)
CO2 (no data)
H2O DP
HC DP
O2 (no data)
(no data)
(no data)
CBP EASEE-gas GQHPortuguese GQS / EASEE-gas CBP GQH (%)
Gas Quality Specifications - PORTUGAL
Parameter Units PORTUGAL EASEE-GAS WI max kWh/m 16,01 15,81 WI min kWh/m 13,38 13,6 d max m3/m3 0,7 0,7 d min m3/m3 0,555 0,555
Total S mg/m3 50 30 H2 S + COS (as S) mg/m3 5 5
RSH (as S) mg/m3 6 O2 mol % 0,01
CO2 mol % 2,5 H2 O DP (*) ºC at 70 bar (a) -5 -8
HC DP ºC at 1-70 bar (a) -2 (*) cero reference, -15ºC

Study on Interoperability of LNG
- 45 -
Gas Quality Specifications - SPAINWI max
WI min
d max
d min
Total S
H2S + COS (as S)RSH (as S)
O2
CO2
H2O DP
HC DP
CBP EASEE-gas GQHSpanish GQS / EASEE-gas CBP GQH (%)
Gas Quality Specifications - SPAIN
Parameter Units SPAIN EASEE-GAS WI max kWh/m 16,016 15,81 WI min kWh/m 13,368 13,6 d max m3/m3 0,7 0,7 d min m3/m3 0,555 0,555
Total S mg/m3 50 30 H2 S + COS (as S) mg/m3 15 5
RSH (as S) mg/m3 17 6 O2 mol % 0,01 0,01
CO2 mol % 2,5 2,5 HC DP (*) ºC at 70 bar (a) 5 -2
H2 O DP (*) ºC at 1-70 bar (a) 2 -8 (*) cero reference, -15ºC

Study on Interoperability of LNG
- 46 -
United Kingdom Isle of Grain does not offer information on gas quality requirements. Grain LNG has installed, at the request of its current customers, a Nitrogen injection facility to bring a defined quality of LNG within GSMR specifications.
1
Terminal specifications – Wobbe indexWobbe Index Specification
48 49 50 51 52 53 54 55 56 57 58 59 60
Future European standard
Spain
France
United Kingdom
Japan (example 1)
Japan (example 2)
MJ/m3(n)
Group:JapanUKEurope
Nigeria / Indonesia
Qatar / Malaysia
Oman / Australia
Brunei / Abu Dhabi
Trinidad & Tobago
Alaska
Algeria (2 plants)
Algeria (2 plants)
Problem with UK specification
Courtesy of Total AS
Terminal specifications - EASEE-gas CBP proposal
Source: Enagas

Study on Interoperability of LNG
- 47 -
The charts depicted above show that: - the receiving terminals of all but one of the countries currently importing LNG accept LNG
Wobbe Index values which are within the range recommended by EASEE-gas; - EASEE-gas upper limit of Wobbe Index is adequate to cover that value of most LNG
available in the market; - only exceptionally an LNG cargo may exceed this upper limit but to a degree that could
be adjusted at the import terminal by blending in the tanks or at the grid entry point, without requiring specific facilities for gas lowering WI;
- the largest LNG market today, Japan, (as well as other Asian markets not shown here) demands LNG of high heat content and the WI required there is compatible with most current sources of LNG;
- Wobbe Index value range required in the UK is narrower than the range recommended by EASEE-gas and used in the other EU markets, and not in line with the WI values of most LNGs offered in the market;
- figures in the charts are in MJ/m3 as it is in the source and charts only try to represent relative position of LNG terminal specifications towards LNG produced and EASEE gas Wobbe Index proposal.
2.3. Technical and Economic Reasons Underlying Quality Requirements 2.3.1. Limiting factors at receiving terminals
Unlike the liquefaction process, the regasification process itself is not imposing any restrictive quality requirements on LNG, at least not more restrictive than the requirements of the pipeline grid and the consumers downstream. In comparison to the supply of pipeline gas, supply of LNG to a market usually can comply "effortless" with basically all non-combustion parameters of quality, because of the very demanding requirements of the complex liquefaction process or the ease of correcting parameters like CO2, H2S, COS, dew points, etc...during liquefaction. Constraints on non-combustion parameters for the regasified LNG may only arise in a secondary stage, when inerts or air are injected at the receiving terminals to meet combustion parameter limits of the grid. The greatest challenge for landing LNG is presented by the combustion parameters, which ensure a safe combustion for humans and the environment. By far the most critical parameter among those is the Wobbe Index, although consideration is also given to calorific value (primarily in USA) and the Soothing Index and Incomplete Combustion Factor (the latter two in the UK only). There is close interdependence between all these parameters and the Wobbe Index is most frequently used and generally sufficiently accurate to predict the behaviour of burners for various gases.

Study on Interoperability of LNG
- 48 -
The chart above shows the acceptable range of the Wobbe Index in relation to the increasing content of higher non-methane components. It also shows the consequences of combustion outside the acceptable region. The reason for the focus on combustion safety – and hence on the Wobbe Index – for LNG imports is that in some markets (and in particular the UK and the US) domestic supplies are in decline and being replaced by LNG imports which have a higher WI due to the larger presence of higher hydrocarbons than the indigenous supplies. The lower WI limit which protects again unstable flame and flashback is generally much less of an issue in gas quality for Europe (unless in the most unlikely event that large quantities of low calorific Dutch gas would be injected in the high-cal grid). In this chapter the sole focus is however on gas quality management of high calorific gas, handled in a separate grid from Dutch low-cal gas. As mentioned, among the Wobbe Index reducing solutions (see par. 2.4.) some can cause the limits of other (non-combustion) parameters to be reached, in particular when injecting nitrogen or air. Whereas injection of air is generally excluded because it pushes the oxygen content above the allowable limit, the quantities of injected N2 may not cause the allowable nitrogen limit to be exceeded. Note : The Wobbe Index represents a measure of the heat released when a gas is burned at a constant pressure. WI = Gross Calorific Value / √ relative density gas over air The higher the WI for a gas the more oxygen has to be supplied to the burner orifice to ensure complete combustion.

Study on Interoperability of LNG
- 49 -
2.3.2. Characteristics and requisites of appliances In this specific context of (and limited to) LNG quality management the crucial parameters for safe and efficient operation of consumer installations are the upper limit and the width of the permitted Wobbe Index range. - Upper limit:
Gas fuel with a WI that exceeds the permitted upper limit for the burner causes incomplete combustion with the formation of CO and soot.
- Range width:
The wider the permitted WI range accommodated for the design of a burner, the lower the efficiency and the higher the NOx emissions resulting from the combustion.
Whereas for reasons of wide interchangeability of gas sources and hence of security of supply a broad operating range of WI for burners is advantageous, a price has to be paid in terms of efficiency and NOx emissions. Although emissions and air quality are important, the overriding policy objective is the safety of complete combustion and hence of avoiding the burning of gas with a WI that exceeds the upper limit for the burner. A distinction in terms of burner adaptation and safety risks has to be made for the following installations (listed in order of increasing criticality): - Gas turbine:
Manufacturer's guarantees are tied to relatively constant fuel quality (GCV) and composition.
- Feed stock uses of gas:
A constant calorific value is required for efficiency reasons; if variations can be notified or detected in advance (upstream in the grid) burner adjustments can be made to remedy. The presence of higher hydrocarbons can increase the risk of soot formation in some processes which reform methane.
- Industrial and commercial appliances:
Settings have to be adjusted of the air to fuel ratio and burner pressure in case of large variations in GCV and WI of the gas fuel. By means of monitoring equipment adjustments can be even made automatically and continuously for smaller variations of GCV and WI.
- Domestic appliances:
In many countries the modern appliances are adapted to a wider range of the allowable WI and can thus cope with the richer gas originating from LNG sources. Older household appliances may however constitute a severe safety risk if the permitted upper limit of the gas fuel would be raised. A manual intervention to change of the burner setting then becomes necessary. This entails a door-to-door action with a high cost and a significant residual risk if some appliances are missed.

Study on Interoperability of LNG
- 50 -
The first three categories can much more easily cope with a change in WI limits (due to the technical expertise on hand on the site, automated controls and smaller number of installations in a market). However, there is a very high cost, high manpower need and high safety risk barrier for the fourth category. This situation particularly applies to the UK in Europe which has approx. 45 million domestic appliances in 22 million householders and many appliances which are not capable of safely burning high WI gas. The European Commission has given a mandate in January 2007 to CEN to draw up standards for gas quality parameters for high cal gas that are "as broad as possible within reasonable costs". This analysis is meant to underpin or modify the assessment which was made by EASEE-gas when proposing their CBP. The mandate is to be undertaken within a "five years plus" timeframe and is still in its very initial stage. A conclusion is therefore not expected before 2013.
2.3.3. Other quality issues Quality issues might also be conditioned by other considerations than safety, damage avoidance of transportation and combustion equipment, emissions and various technical/operational concerns. Producers with rich feed gas have indeed to make quality choices on whether or not to extract LPG (and eventually ethane) according to following considerations: - LPG netbacks to the producer might have a higher value as separate LPG products as
opposed to leaving the LPG in and part of the LNG sales.
- Exports to Asia (Japan, Korea) require a richer composition (higher content of heavier hydrocarbons - and thus also higher WI) which is achieved by leaving more LPG in the LNG stream; if on the other hand US and UK markets are targeted, then WI compliance might induce to extract LPG at the source - certainly if the content is sufficient to reach economies of scale for necessary investment and separate commercialization (i.e. compensating the cost of making LNG "lean").
At the liquefaction end LPG and ethane extraction are by and large the only discretionary quality decisions to be made. At the terminal end other options may be open for quality management (see par. 2.4.1.)
As the LNG market becomes global – and it is unlikely that the different markets will reach an agreement in a foreseeable future on a uniform standard worldwide – gas interchangeability has become a crucial issue for a (LNG) producer wishing to access different markets and for an LNG importer wishing to access a wide range of sources.
2.4. Impact of LNG Quality Variations on the Interchangeability and Cost-Benefit Analysis of Standardization
2.4.1. Procedures to adjust LNG quality at receiving terminals

Study on Interoperability of LNG
- 51 -
As mentioned before, the major – and generally only – adjustment of LNG quality required at receiving terminals relates to the WI, i.e. derichment in the Atlantic Basin (lowering the WI) and enrichment in the Pacific Basin (increasing the WI). Quality measures at the liquefaction end and the enrichment at the receiving end are not discussed hereafter as we focus solely on treatment options for WI reduction for the Atlantic Basin. The following techniques are available: 1. Blending with lower WI gas (pipe gas or LNG) at the grid entry point or at a "compliance
location" further downstream.
The adequate availability of the blending source on location and at all times has to be guaranteed. As this is usually not the case, the blending service is therefore often provided on an interruptible basis only. A rare exception is the Lake Charles terminal in the Gulf of Mexico. The same applies to blending different LNG cargo qualities in the terminal tanks, but the utmost care should be taken to avoid stratification and possible roll-over.
2. Ballasting with nitrogen (N2)
Nitrogen addition is very effective as a means for WI reduction; it is technically reliable but requires investment. It is by far the most frequently used ballasting treatment. Effects on combustion properties of the gas and on NOx emission are negligible; special care might be required for feedstock uses of gas but any problems are surmountable. Usually the amount of nitrogen necessary to reduce the richest LNG to within the grid specification (up to 4 % of N2 on a molar basis) does not breach the maximum allowed nitrogen (e.g. 5 mol % in UK). Should this be the case however (as may happen in some parts of the USA where only 3 mol % are allowed), then LPG has to be removed at the terminal. Injecting 4% of N2 at peak send out of approx. 1000 tonnes/day of nitrogen would require 50 road tankers per day. It is clear that if more than 100 to 150 tonnes per day are needed on-site production is required. For large quantities of N2, cryogenic air separation plants are most suitable for cost and capacity reasons. For smaller ballasting needs with no high purity requirements membrane units could be competitive if power prices stay reasonable.
3. Ballasting with CO2
CO2 as an inert behaves in a similar manner to nitrogen except that it adds to greenhouse gas emissions. It is therefore not retained as a solution.
4. Ballasting with air
Although applied in some specific cases for minor derichment the quantity of air required usually pushes the O2 content over the allowable limit.
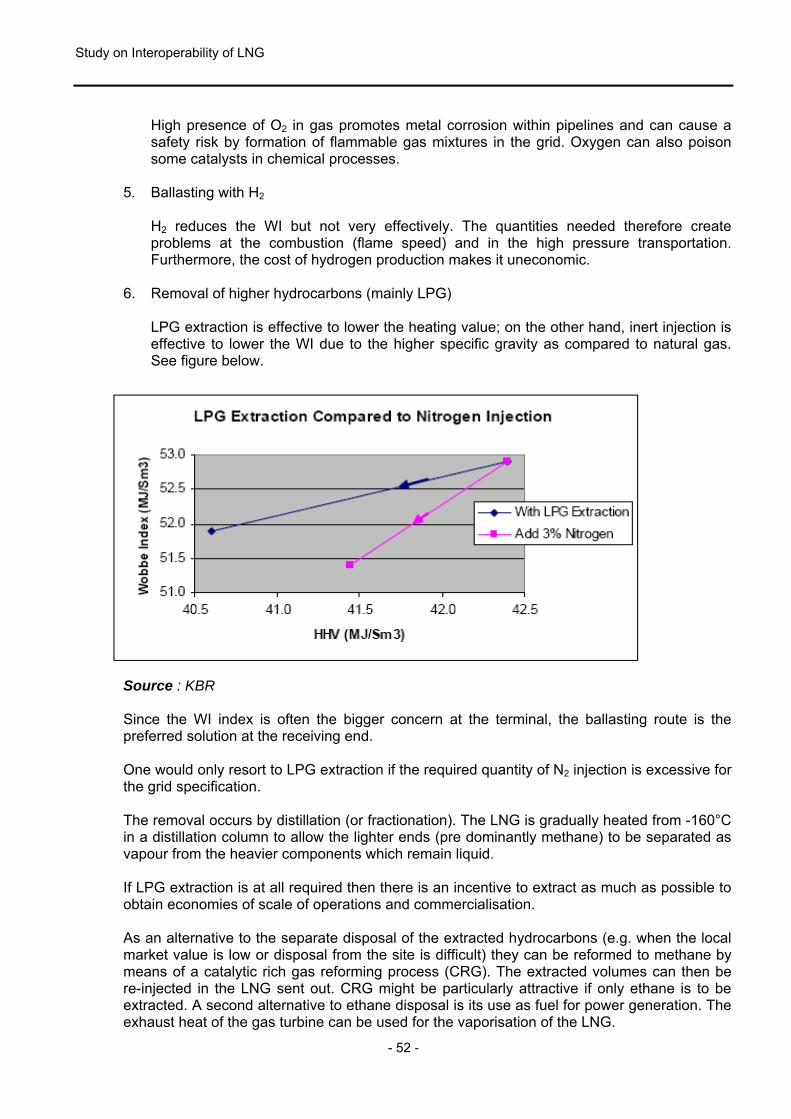
Study on Interoperability of LNG
- 52 -
High presence of O2 in gas promotes metal corrosion within pipelines and can cause a safety risk by formation of flammable gas mixtures in the grid. Oxygen can also poison some catalysts in chemical processes.
5. Ballasting with H2
H2 reduces the WI but not very effectively. The quantities needed therefore create problems at the combustion (flame speed) and in the high pressure transportation. Furthermore, the cost of hydrogen production makes it uneconomic.
6. Removal of higher hydrocarbons (mainly LPG) LPG extraction is effective to lower the heating value; on the other hand, inert injection is effective to lower the WI due to the higher specific gravity as compared to natural gas. See figure below.
Source : KBR Since the WI index is often the bigger concern at the terminal, the ballasting route is the preferred solution at the receiving end. One would only resort to LPG extraction if the required quantity of N2 injection is excessive for the grid specification. The removal occurs by distillation (or fractionation). The LNG is gradually heated from -160°C in a distillation column to allow the lighter ends (pre dominantly methane) to be separated as vapour from the heavier components which remain liquid. If LPG extraction is at all required then there is an incentive to extract as much as possible to obtain economies of scale of operations and commercialisation. As an alternative to the separate disposal of the extracted hydrocarbons (e.g. when the local market value is low or disposal from the site is difficult) they can be reformed to methane by means of a catalytic rich gas reforming process (CRG). The extracted volumes can then be re-injected in the LNG sent out. CRG might be particularly attractive if only ethane is to be extracted. A second alternative to ethane disposal is its use as fuel for power generation. The exhaust heat of the gas turbine can be used for the vaporisation of the LNG.

Study on Interoperability of LNG
- 53 -
2.4.2. Necessary investments and running costs for derichment of LNG
In the vast majority of cases one or more of the following means is used to adjust the WI of LNG downwards: - ballasting with nitrogen - LPG extraction - blending. The investment and operating costs of each are briefly discussed hereunder (all cost data in 2006 values). (a) Ballasting with nitrogen
For large terminals with important ballasting load cryogenic air separation units are most suitable from an economic and reliability point of view. High purity nitrogen is produced in gaseous form at low pressure and injected into the boil-off stream of the LNG in the recondensor (and before the high pressure pumps). To account for maintenance some redundancy in investment is needed. For a typical 20 million m3/day send out terminal (approx.7 bcm/year) in which the WI needs to be reduced by 2,5 MJ/m3 (in the order of 5 %) some 1.000 Ton of nitrogen per day are required. Capital outlay would be in the order of € 15 million and annual operating cost € 5 million.
(b) LPG extraction
A fractionation plant for the same terminal send-out and same WI reduction capacity would require the significantly higher capital expenditure of around € 25 million, but lower annual operating cost of some € 3 million. This does not include the cost of storing and shipping out the extracted higher hydrocarbons which very much depends on local conditions. The alternative of a CRG reforming installation requires a significant additional investment and annual operating cost, € 60 million and € 12 million respectively, but avoids the investment in infrastructure for LPG disposal.
(c) Blending
Capital outlay for in-tank blending or blending send-out with pipeline gas is likely to require the lowest investment cost, but the amount will very much depend upon specific circumstances. It is however rather exceptional that the availability of the adequate type and volume of blend stock is available at all times in order to provide a firm service. Cost comparisons are therefore not meaningful. If these treatment economics are to be compared with changing the downstream pipeline specifications to accommodate for the higher WI send out of the LNG terminal, then the key is whether or not there is a large population of domestic appliances involved. If this is not the case – like for the high calorific grid in the Netherlands, that currently has a narrow and relatively low WI band and only supplies industrials – then the change of the grid specs is likely to be the more economic solution.
Study on Interoperability of LNG
- 54 -
If however there are a large number of appliances being supplied by the send-out of the LNG terminal – as in the case of the USA and the UK – then safety concerns compounded by the cost issues will push for the treatment solution of the LNG or gas at the grid entry point(s). Maintaining the grid specification unchanged – at least until the population of older appliances is nearly extinct – is usually cheaper and certainly safer. The (former) DTI in the UK had calculated that the “no change” option would have a NPV advantage in the order of GBP 8 billion (best estimate in 2005 values) over changing the grid specification.
2.4.3. Problems and solutions for markets receiving different gas qualities It is obvious that in the interest of security of supply, interoperability and unconstrained trading the widest possible range for all quality parameters that are acceptable from a technical and safety point of view, should be chosen. Historic choices made in some markets which were developed on the basis of local production are however costly, complex and even risky to amend. European wide quality standards are an ideal but in practice difficult to achieve, certainly in a near to medium term. A pan-European gas market is not being designed from scratch! The situation in the USA is rather similar as no national standards exist and gas composition and interchangeability issues are all addressed in a pragmatic way and specifications are set on a regional or even pipeline-by-pipeline basis. Either the supply portfolio has to be chosen to comply with these specs or the LNG is treated accordingly. Each national or regional area receiving a "new" and richer gas source is in the best position to judge whether to widen specifications within its market or maintain its (stricter) specifications. Safety and cost/benefit issues usually determine the preference to maintain the local market specifications. For the former criteria it is the population of domestic appliances that is crucial, for the latter it is the quality of expected imports and the necessary investments to treat such imports versus the cost to adjust local installations and appliances (because in the case of LNG imports the WI is by and large the only critical issue). An area or market – regional or national – that retains its local specifications for its grid should then not be allowed to refuse entry to gas that complies with widely accepted standards. The development of such "no-refusable" standards has been the objective of the EASEE-gas effort, the final implementation of which has now been postponed beyond the initial target date of October 2010. The regional or national grid operator can of course select the optimal quality adjustment method for his specific circumstances as well as their optimum location. In this respect "the point of compliance" to the local specifications can be important and its specific placement in the grid may allow some discretion and optimization. Moving such location in the grid may open blending opportunities or reduce investment costs. In the case of LNG, which is the focus here, the cost of constructing and operating quality treatment facilities is generally small compared to the cost of the import infrastructure and of the commodity itself. A contentions issue however is sometimes who pays for it and where the facilities should be located along the chain. The ball can easily be kicked around between importer/consumer-TSO-exporter/supplier and market forces do not always lead to a clear, unequivocal choice. In general one can conclude that gas markets can cope with LNG sources of different qualities and that the efforts to be incurred therefore are not insurmountable. Moreover, the

Study on Interoperability of LNG
- 55 -
industry has shown it is capable of solving any such LNG quality issues in a technically and commercially acceptable way, without requiring regulatory intervention. There are many example in Europe of markets which are successfully handling LNG receipts of different origin and hence qualities. The prime example is Spain, but there is also France and more recently Belgium.
2.4.4. Prospects for swaps
Quality compatibility issues at terminals might be "solved" by swaps. This frequently occurs in the US where rich cargoes are directed to Lake Charles (which possesses a wide range of means to tackle quality issues) in exchange for leaner cargoes to the East Coast terminals which have a relatively low GCV limit and do not (yet) all have the facilities to ballast with nitrogen. Swaps within Continental European terminals are not required – at least not for quality reasons – and UK terminal(s) can overcome their low WI requirements by nitrogen injection. Interesting prospects could open up between two LNG sources in the Pacific Basin targeting both a lean LNG market (e.g. American West Coast) and a rich LNG market (e.g. Japan or Korea). There would be an incentive for both sources to have each focus on one single market and so minimize investment and operating costs and possible shipping distances as well. As is generally the case in natural gas swap prospects, supply as well as market diversification is only effectively achieved if the means (i.e. investments) are put in place to ensure that gas can physically flow from each source to each destination. Once however these fixed costs have been incurred then the swap savings are limited to the variable operating or transportation costs. Savings then become occasional and not structural and of a lesser magnitude. It is evident however that the investment for an export LNG project to supply both a high WI and a low WI market might be too onerous for smaller projects which will have to choose one or other market type as destination. An interesting development could however be the creation of LNG storage hubs like the one contemplated in Dubai. Its central location between the Atlantic and Pacific markets could provide a wide range of services, such as quality blending, destination changes, parking, back-up, seasonal swing and shipping optimization. The economics are however most unclear.

Study on Interoperability of LNG
- 56 -
3. INTEROPERABILITY OF FACILITIES
3.1. National Regulatory Approaches 3.1.1. Access conditions to LNG import terminals
Belgium The only LNG terminal in Belgium is Zeebrugge LNG operated by Fluxys LNG. The business model of the terminal has changed recently. The capacity has been expanded and access conditions have been revised. In 2003, an open season was launched for the booking of capacities as from 1st April 2007. As a result, Fluxys LNG signed 3 long-term capacity subscription agreements and invested in doubling the LNG terminal’s send-out capacity. The single shipper business model was modified and most of the services offered at the LNG terminal are now of a new type. The current business model, designed for a multi-shipper context, is primarily based on the “slot” concept, as described in the following sections. The services provided by the Zeebrugge LNG terminal are described at the “Terminalling Code”, as well as on the websites of Fluxys LNG and the CREG. The standard capacity service is based upon the “Slot” concept. According to the access rules in force, a Slot is a service which consists of: Receiving and unloading of an LNG ship within a window of 3 consecutive high tides. Basic storage, equal to 140.000m3 LNG, linearly decreasing over 20 high tides.6 Basic send-out capacity, equal to 4.200 MWh/h during 20 high tides.
Other types of services that can be contracted: Send-out capacities:
- Additional send-out capacity services allocated through an open- season process; - Additional send-out capacity entitlements (pooling); - Daily send-out capacity requested 1 month ahead and allocated one day-ahead; - Send-out capacity for unsubscribed slots; - Day ahead interruptible send-out capacity.
Storage:
- Additional storage: these services are allocated during an open-season process; - Daily storage: daily capacities are requested 1 month ahead and are allocated day-
ahead; - Storage for an unsubscribed slot.
LNG truck loading capacity.
6 20 hide tides ≈ 250 hours, according to Fluxys LNG.
Study on Interoperability of LNG
- 57 -
Under the “expanded regime”, the LNG terminal will have the following technical capacities: The total technical send-out capacity amounts to 21.415 MWh/h (≈ 1.850.000 m3(n)/h),
of which:
- 16.800 MWh/h is available for slots. - 2.870 MWh/h is available for additional send-out capacity (of which Fluxys NV has
booked 1,163 MWh/h LNG for operational purposes). - 1.745 MWh/h is available, on interruptible basis only, for Fluxys LNG and Fluxys NV
for operational purposes.
The total technical storage of the terminal amounts to 380.000 m3 LNG, of which:
- 350.000 m3 LNG is available for slots. - 30.000 m3 LNG is available for additional storage (of which Fluxys NV has booked
6.000 m3 LNG for operational purposes).
Through the contract period, terminal users are entitled to schedule truck loading. Under the lending service, Fluxys LNG may lend the terminal user a quantity of LNG for send-out subject to the subsequent redelivery of such loaned quantities by the terminal user form its nominated cargo of LNG. The lending service may be available in the following circumstances: If the master of the LNG carrier has advised that the “Estimated Time of Arrival” of the
LNG carrier will be after its scheduled slot but within the first priority to berth; If a queuing event occurs; If Fluxys LNG reasonably expects that a queuing event will occur.
France There are two LNG terminals in France whose owner is Gaz de France. The LNG terminal at Montoir-de-Bretagne is France's largest natural gas regasification facility and receives more than 15% of all the gas imported into France. The LNG terminal at Fos-sur-Mer (Fos Tonkin) mainly supplies the south of France. A third terminal (Fos Cavaou), co-owned by Gaz de France (70%) and Total (30%) is being built at Fos-sur-Mer and is due to come on stream in 2008. There is a regulated Third Party Access system to LNG terminals based on the First Come/First Served principle, and with the provision of bails and UIOLI mechanisms. Although an access code for LNG terminals has not been developed, access rules are published in different documents available on GDF’s website, including the LNG terminal access contracts, together with the detailed appendixes. Additional documents available at Gaz de France Infrastructures website describe the access rules. Shippers have the possibility of exchanging quantities LNG at a virtual point known as the LNG exchange point in each terminal.

Study on Interoperability of LNG
- 58 -
Three types of regasification services are provided: Continuous service: reserved for shippers unloading at least one cargo a month on
average over the year. Uniform service: reserved for shippers unloading at most one cargo a month on average
over the year. Spot service: reserved for cargoes unloaded during a given month M, taken after the 20th
day of month M-1. The assignment is made on the basis of vacant slots in the monthly schedule at the date of nominations.
Greece TPA access rules to the LNG terminal were recently set. Third party will follow the terms and provisions of Ministerial Decision No 1227 (Official Gazette Β΄ 135 / 05.02.2007). TPA tariffs have been set by Ministerial Decision 4955/2006 following a proposal by RAE. All the above-mentioned information is available at RAE website. Third Party Access to LNG terminal capacity is allocated on a First Come/First Served basis. The Agreement form for access is under preparation. The temporary LNG storage at the LNG terminal, after LNG discharge and until regasification and injection, is considered an ancillary service. Italy The access rules to the LNG terminal in Italy are contained in the Regasification Code (Codice de Rigassificazione) that was approved by L’Autorità per l’Energia Electtrica e il Gas (AEEG) on May 2007 and entered into force last October. There is a regulated access system to Panigaglia. A terminal under construction, Adriatic LNG, has got a 25-year TPA exemption for 80% of the terminal capacity; the remaining 20% will be subject to rTPA. According to this practice it could be expected that new LNG terminals will follow the same rule: 80% of capacity exempt / 20% of capacity subject to rTPA. Portugal The Regasification Code is still under revision and should be approved by ERSE and the LSO together with procedures for capacity calculation and allocation. The rules issued by ERSE establish the public disclosure of maximum available capacity, ship discharge capacity, truck loading capacity and regasification capacity. The capacity should be allocated according to the supply contracts already signed and, in case of congestion, an auction should be carried out. All the available capacity now has been assigned to the only terminal user, who signed a supply contract before Directive 2003/55/EC entered into force.

Study on Interoperability of LNG
- 59 -
Spain All LNG terminals in Spain are subject to regulated Third Party Access based on the First Come/First Served principle. There is a network code (Normas de Gestión Técnica del Sistema) approved by the Energy Ministry in November 2005 and a number of “Detailed Procedures” that set rules and procedures of access to all “basic” infrastructures. The users of LNG terminals can contract the different regasification services separately or jointly. Other additional services can also be contracted: storage capacity; ship cooling, loading of ships with LNG, transference of LNG between ships. United Kingdom OFGEM granted the Isle of Grain LNG terminal an exemption from TPA on the condition that National Grid Grain LNG ltd. had in place effective “Use It or Lose It” arrangements so that other companies could import gas through the facility if the primary capacity holders, BP and Sonatrach, were not using the facility. OFGEM retained the right to amend or revoke this exemption in case the UIOLI arrangements were not satisfactory.
3.1.2. Legal and functional status of LSOs All LNG terminals in operation in the European Union, with the exception of Grain LNG and the last three terminals commissioned in Spain, were built and operated by the gas companies supplying each market. The new legal framework and sometimes the more strict national regulations are reducing the level of involvement of incumbent suppliers in the operation of LNG terminals. The status of the operators of the LNG terminals (LSOs) could be grouped in three categories according to the degree of dependency of the LSO from the dominant gas supply company: 1. Full ownership unbundling: the LSO is a legal entity where the supply company does not
have a controlling shareholding or any shareholding at all.
- Grain LNG owned by National Grid - Sines LNG, owned by REN Atlantico (majority State owned) - Huelva, Cartagena and Barcelona, owned by Enagas - In future: Grain LNG 2, El Musel, Gran Canaria and Tenerife
2. Legal unbundling: the LSO is a legal entity whose shareholders are supply companies;
these shareholders are former incumbent suppliers or new suppliers
- Fluxys LNG, majority owned by Suez-Tractebel (through Fluxys) - BBG, Saggas and Reganosa, owned by new suppliers - GNL Italy, majority owned by ENI (through Snam Rete Gas) - DESFA, fully owned by DEPA

Study on Interoperability of LNG
- 60 -
- In future: Gate LNG, South Hook LNG, Dragon LNG, Fos Cavou, Adriatic LNG, Eemshaven, Lion Gas and Livorno Offshore.
3. Functional unbundling: the supply company maintains the full property and operation of the import terminal but creates a “business unit” responsible for the operation of the LNG terminal and implements the compliance programme set by the gas Directive.
- Montoir and Fos Tonkin
This attempt to group all terminals in three categories should not hide the following: - Grain LNG is the only TPA exempt terminal operative in Europe now: an exemption for
20 years and for the entire capacity of the terminal; there are no records of other shippers accessing to Grain LNG though the implementation of effective UIOLI rules was a precondition for the exemption.
- REN Atlàntico gives access priority to contracts signed before the Directive
2003/55/EC was approved; Portugal was exempted from some of the gas Directive’s obligations as an emerging gas market; no other shipper than Galp has yet used the terminal of Sines.
- The Spanish LSO, Enagas, operates the 3 LNG terminals of its property and is
responsible for the coordination of the operation of the 3 other terminals commissioned in the current decade which are owned and operated by electricity utilities and oil and gas companies, as well as for the connection of all terminals to the transmission grid for. Even the terminals owned by supply companies are subject to an rTPA regime and have the obligation to reserve a minimum 25% of their capacity for short-term (less than 2 years) contracts.
There is no a straight forward answer to the question of the impact of the LSO legal and functional status on the access and interoperability of LNG import terminals because factors as the availability of LNG and the number of shippers requesting access should also to be taken into consideration. However, experience of terminal users, or applicants for access, indicates that effective separation of LSOs from supply / commercial businesses facilitates the access to LNG terminals and the coordination with the transmission grid, and minimizes discrimination, or suspicion of discrimination. Besides, full unbundling of the LSO does not make necessary complex regulation nor the strong regulatory oversight required in case of functional or legal unbundling. The case of Spain is an example where the transition from legal to ownership unbundling of the LSO effectively triggered the emergence of a good number of shippers and the development of a strong LNG market. The generalisation of TPA exemptions could be an obstacle to future access and interoperability in the LNG market. Five out of the seven LNG terminals under construction considered in this Study have already got granted TPA exemption for the full capacity and for 20 or 25 years; Adriatic LNG that has to keep 20% of the capacity open to rTPA,. The 2 terminals not exempted are Fos Cavou, which does not fulfil the requisite to apply for exemption since it is 70% owned by Gaz de France, and Mugardos, which did not apply

Study on Interoperability of LNG
- 61 -
because exemptions are contrary to the Spanish policy of providing universal access service to all essential infrastructures. Among the planned LNG terminals, the Dutch terminals have got TPA exemption for their full capacity and for 25 years; Livorno is expected to get similar conditions than Adriatic LNG; no exemptions are anticipated for the sponsors of the two small LNG terminals in the Canary Islands. In relation to these exemptions it will be convenient to strike a balance between their contribution to the market and the discrimination versus non-exempt terminals. Exemptions have got the effect of driving investment and have opened the market to new suppliers. The challenge is to implement the capacity allocation mechanisms that lead to optimize the level of utilization of exempt terminals by facilitating the access to not firmly committed capacity holders without undermining the “option value” of primary capacity holders.
3.1.3. Actual practices of access to LNG terminals Information on access conditions to LNG terminals is, in general terms, easy to find but this is not the case for information of cargoes off loaded and available or non used capacities. Sources for this information have to be found in public declarations from representatives of gas companies, reports from specialized consultants and trade publications. Attached is a chart (ANNEX II) based on information provided by Waterborne Energy that shows the LNG volumes received in the European LNG terminals in 2007. The chart details the number of cargos and volumes unloaded by month since October 2007 until January 2008. The chart also indicates the shippers who have used regasification services in this period. Load factor figures are taken on annual basis and are approximate. Volumes are indicated in metric tons as in the source and the equivalence taken is 1 million metric tons = 1,346 bcm.

Study on Interoperability of LNG
- 62 -
ANNEX II Utilization of LNG terminals in Europe
Terminal
2007 Full Year
000 mt
Approx.
load factor
Oct. 07
Cargoes received
000
metric tons LNG
Nov. 07 Cargoes received
000metric tons LNG
Terminal
Dec. 07 Cargoes received
000
metric tons LNG
Jan. 08
Cargoes received (1)
000
metric tons LNG
Shippers
Zeebrugge 2.022 30% (2) 3 186 3 183 Zeebrugge 4 244 3 186 All Qatar P./ 1 Suez LNG
Grain 1.133 34% 2 128 3 180 Grain 3 177 4 230 BP & Sonatrach
Montoir 9 540 10 580 Montoir 10 605 5 252 All GdF/1Satoil-EdF/1 BG
Fos sur Mer 8 277 10 308 Fos sur Mer 13 363 7 193 All Gaz de France Total France
9.866 78% Total France
Sines 2.114 51% 4 245 3 191 Sines 3 189 1 63 All Transgas/Galp
Mugardos 2 117 1 54 Mugardos 1 63 2 120 Gas Natural, Repsol
BBG 5 289 4 244 BBG 5 276 6 362 Unión Fenosa, NLNG
Huelva 8 320 8 271 Huelva 9 357 10 425 Iberdrola, Qatargas Cartagena 2 125 6 261 Cartagena 9 320 6 311 Gaz de France, BG
Sagunto 10 345 9 403 Sagunto 8 393 9 439 Sonatrach, BP, Suez:
Barcelona 9 447 13 501 Barcelona 11 497 14 603 not specific terminals
Total Spain 18.897 49%
Panigaglia 2.133 85% 9 222 9 225 Panigaglia 9 225 3 74 All Snam/1 Gaz de
France
Revithoussa 702 45% 3 39 4 160 Revithoussa 2 50 1 33 All DEPA/2 Gaz de
France (1) 1st half of January. Full month only Spain and UK 1 million metric tons = 1,346 bcm (2) Zeebrugge average load factor is higher because capacity were increased along 2007 Source: Waterborne Energy
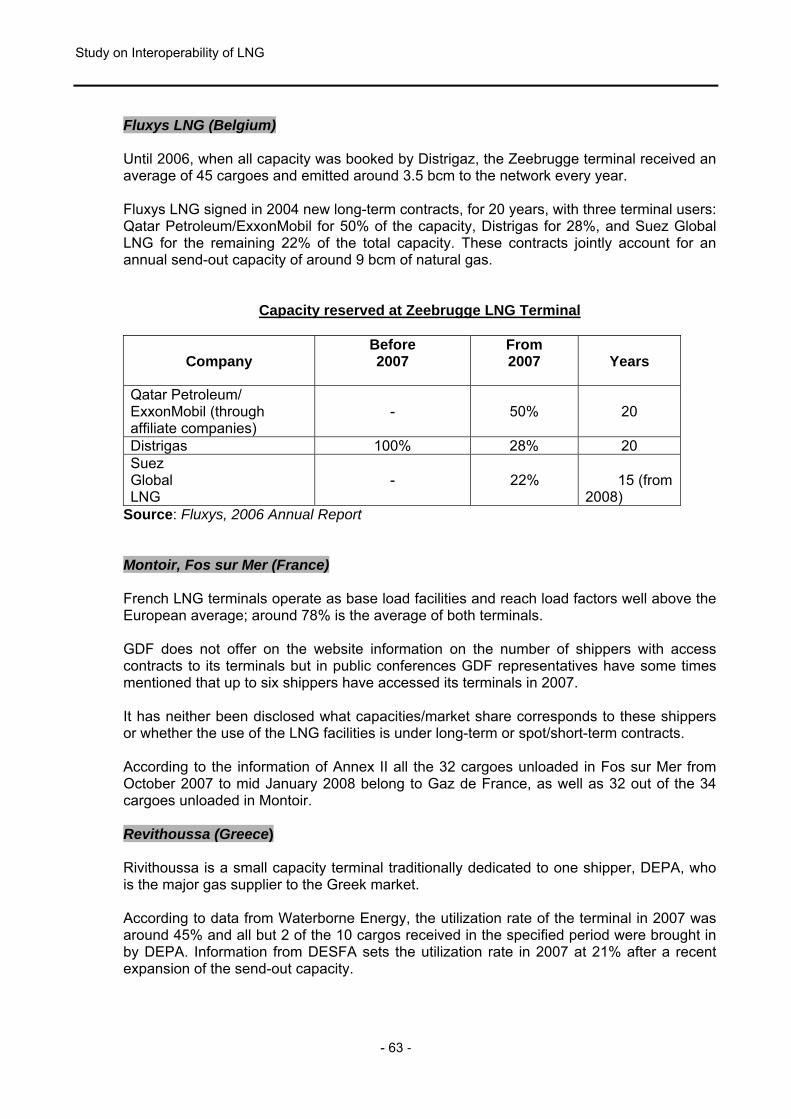
Study on Interoperability of LNG
- 63 -
Fluxys LNG (Belgium) Until 2006, when all capacity was booked by Distrigaz, the Zeebrugge terminal received an average of 45 cargoes and emitted around 3.5 bcm to the network every year. Fluxys LNG signed in 2004 new long-term contracts, for 20 years, with three terminal users: Qatar Petroleum/ExxonMobil for 50% of the capacity, Distrigas for 28%, and Suez Global LNG for the remaining 22% of the total capacity. These contracts jointly account for an annual send-out capacity of around 9 bcm of natural gas.
Capacity reserved at Zeebrugge LNG Terminal
Company
Before 2007
From 2007
Years
Qatar Petroleum/ ExxonMobil (through affiliate companies)
-
50%
20
Distrigas 100% 28% 20 Suez Global LNG
-
22%
15 (from 2008)
Source: Fluxys, 2006 Annual Report
Montoir, Fos sur Mer (France) French LNG terminals operate as base load facilities and reach load factors well above the European average; around 78% is the average of both terminals. GDF does not offer on the website information on the number of shippers with access contracts to its terminals but in public conferences GDF representatives have some times mentioned that up to six shippers have accessed its terminals in 2007. It has neither been disclosed what capacities/market share corresponds to these shippers or whether the use of the LNG facilities is under long-term or spot/short-term contracts. According to the information of Annex II all the 32 cargoes unloaded in Fos sur Mer from October 2007 to mid January 2008 belong to Gaz de France, as well as 32 out of the 34 cargoes unloaded in Montoir. Revithoussa (Greece) Rivithoussa is a small capacity terminal traditionally dedicated to one shipper, DEPA, who is the major gas supplier to the Greek market. According to data from Waterborne Energy, the utilization rate of the terminal in 2007 was around 45% and all but 2 of the 10 cargos received in the specified period were brought in by DEPA. Information from DESFA sets the utilization rate in 2007 at 21% after a recent expansion of the send-out capacity.

Study on Interoperability of LNG
- 64 -
Panigaglia (Italy) Snam Rete Gas offers complete information on effective access to the Panigaglia LNG terminal. The terminal has been traditionally accessed by ENI under a long-term contract. Other Italian companies, Enel and Edison Gas, have got access since 1999, what has permitted reaching the highest utilization rates in Europe for the last two years. Other players have used the terminal on the basis of spot agreements when re-gasification capacity was available. The following table shows the send out volumes by operator since 2001
Volumes
regasified (bcm)
20017 2002 2003 2004 2005 2006
Eni 0.79 3.26 3.00 1.62 0.73 1.50 Enel 0.67 0.16 1.34 1.49 Gas Natural 0.24 0.26 0.02 Others8 0.209 0.31 0.46 0.05 0.16 0.12 TOTAL 1.66 3.57 3.46 2.07 2.49 3.13
Source: Snam Rete Gas, Annual Reports 2001-2006. According to our sources, Snam was the only shipper in recent months with the exception of one cargo brought in by Gaz de France. Sines (Portugal) The only user of the LNG terminal is Galp Gas Natural, exclusive supplier to the Portuguese market. The utilization rate of the plant was in line with the European average in 2007. Grain LNG (United Kingdom) BP and Sonatrach have booked all the capacity of Grain LNG for 20 years and they are the only shippers using the import terminal. Although there is procedure to opt for the capacity that primary shippers do not plan to use, no other shipper has used that capacity yet. Grain LNG is one of the European LNG terminals with lower utilization ratio probably due to current market conditions, which recommend diverting LNG cargoes to other destinations
7 Snam Rete Gas was set up in November 2000 and took on Snam S.p.A.’s natural gas transmission and LNG re-
gasification activities on 1 July 2001. These volumes of LNG were regasified from July 1st 2001 to December 31st 2001.
8 In years 2002 and 2003 no information about the companies which had accessed Panigaglia LNG terminal is available; due to this reason the mentioned value can include Enel and Gas Natural volumes.
9 This LNG volume has been regasified by Edison Gas.

Study on Interoperability of LNG
- 65 -
as the capacity holders of the only exempt LNG terminal in Europe follow an “option value” strategy. On the basis of the available information about LNG cargoes received in European LNG terminals we could conclude that, so far, access of third parties to terminals takes place very occasionally. Exceptions to this general observation could be Belgium, where a new shipper got granted 50% of Zeebrugge LNG capacity for 20 years from 2007 and, to a lesser extent due to the limited capacity of Panigaglia, Italy, where Snam Rete Gas has reported regular access by the major local power generation company. The case of Spanish LNG terminals is highlighted here below. Enagas, BBG, Saggas, Reganosa (Spain) The case of the Spanish LNG market is a relevant exception from the perspective of effective third party access to the terminals and because is the largest and, perhaps, the only liquid LNG market existing in Europe. The LSO was legally unbundled from the supply company and it was functionally unbundled in 2000 and ownership unbundled in 2002. The following chart shows the evolution of LNG imports into Spain and import shares for the TPA market.
1
New entrantsIncumbent
LNG supplies to TPA market
20070
50
1999 2000 2001 2002 2003 2004 2005 2006
100
150
200
250
300
TWh
33%
66 %
28%
72%
LNG Imports by Shippers in Spain: 1999 to 2007
Source: Enagas Other features to highlight from this market: - significant LNG import volumes: 24 bcm in 2007, what meant 51% of total imports into
Europe; - large and diversified number of supply sources: 10 different countries in 2007; - no barriers to access due to LNG quality: specification requirements fit all LNG offered
in the market;

Study on Interoperability of LNG
- 66 -
- several LNG terminals in operation (6), all of them working under a regulated third party access regime;
- three terminals (older) operated by an LSO fully independent from any supply interest (ownership unbundled);
- three terminals (new) operated by LSOs legally unbundled from the owners of the terminals, which are integrated supply companies, though their operation is coordinated by the main system operator;
- many shippers effectively using the LNG terminals: 11 different companies last year; - the former incumbent has no longer a dominant position in LNG trade: its share of total
LNG imports shrunk to 28%; - ample information on actual access to the LNG facilities in the LSO (Enagas) and the
NRA (Comisión Nacional de la Energía) websites; - the LSO publishes aggregated data on LNG off loaded in each terminal; there is not
specific information about LNG cargoes received by shippers but matching the above sets of information permits to know the volumes off loaded by each shipper: this level of transparency has triggered a large number of commodity exchanges between shippers at the receiving terminals;
- despite the fact that the Spanish legislature has never granted TPA exemptions, there are ambitious plans to expand the existing LNG receiving capacity and to build new terminals.
Though LSOs are all legally unbundled in Spain, the different use and utilization rate of terminals owned by suppliers or by the independent system operator invites to the analysis: in 2007 Saggas, a legally unbundled terminal, was only used by its owners and reached a utilization rate of 72% while the nearby Cartagena, ownership unbundled terminal, only attained a 32% utilization rate.
3.1.4. Obstacles to the construction of new LNG terminals
The most relevant obstacle to the construction of LNG terminals in Europe is the delay or deny of construction permits by local authorities. The so called NIMBY syndrome can be defined as a phenomenon whereby population of a certain location recognize the need for a particular facility or infrastructure but are against to them being sited in their neighbourhood. The main reason for this opposition being that the perceived benefits from the facility (availability of energy, job creation) are not enough to compensate for the perceived risks (environmental, safety and health risks) NIMBY activism has reached different degrees in Europe. Italy There is a strong activism in Italy, where two projects at an advanced stage of development and supported by national energy authorities, Montalto di Castro and Monfalcone, had to be abandoned under the pressure and by the veto of local municipalities. Since year 2000, in parallel with the start-up of the gas market opening in Italy, the Government agreed on the importance, for the Country’s energy supply system, of having LNG terminals in addition to the only one, old and limited in capacity, already in operation (Panigaglia – 3,5 Bcm/y). LNG imports needed the construction of new plants whose realization is subject to State and local authorization with a procedure that is uncertain in time and outcome.
Study on Interoperability of LNG
- 67 -
To this aim, and in the light of the previous negative experiences (Monfalcone 1 of Snam, Montalto di Castro of Enel and Monfalcone 2 of Snam and Enel), the Government introduced a Law (n. 340/00 – Art. 8) by which a number of simplified steps were established for speeding up the authorization process, in particular as far as the environmental and engineering issues were concerned. This Law stimulated the potential development of several LNG regasification terminals both on-shore and off-shore: however out of 10 different projects only two have been authorized (Brindisi and Rovigo (off-shore) by the Ministries of Productive Activities and of Environment through the envisaged Concession for the construction and the operation. Notwithstanding said Concessions had already been granted the Brindisi project is still suffering of same problems and difficulties. One of the key points to be taken into account is, in fact, the role of the local Authorities (Region-Province and Municipality) that enjoy a very high degree of freedom in the final decision and that consider the authorization process a bottom-up procedure and not vice versa. Accordingly, the local Authorities have to be considered as important counter parts with whom the proposed LNG project has to be discussed openly and in full transparency, explaining the relevant advantages/disadvantages, trying to remove the historical prejudice against this form of energy, not well known yet in Italy. Italian Authority has already determined that LNG should play a role in Italy’s future and it has passed legislation to fast-track authorization and permitting procedures for import terminals. But local and regional consent is required before such projects can proceed and these remain as significant hurdles. United Kingdom There has been limited NIMBY activism from local communities against LNG terminals in the UK until now. The two projects located in Wales, South Hook and Dragon LNG, got planning permission on time and the UK Government was supportive of these projects in order to ensure security of supply and protect the competitiveness of UK industry. It seems, however, that local activism is up surging now and questioning the permits. Spain In Spain there have neither been significant planning problems nor NIMBY activism against LNG projects, what is one of the reasons why half of the LNG facilities operating in Europe are located in Spain. Only an initiative to build a terminal in Majorca was abandoned before becoming a project for environmental reasons. When a significant need for new infrastructure was detected in 2002 a new Regulatory Framework was designed to facilitate its development. The main principles of this Framework were:

Study on Interoperability of LNG
- 68 -
The development Infrastructure (regasification terminal, basic pipeline network and strategic storage) is compulsory for system operators and it is carried out after a thorough planning exercise;
All infrastructures considered essential are a regulated business; Non discriminatory third party access is granted and tariffs are cost reflective.
Also in 2002, a Mandatory Planning was approved for the development of necessary infrastructure to bring LNG into the Spanish market. A consensus was reached and this Plan got the support of regional authorities and main industrial players. The Plan includes gas demand projections and is updated by the Government every two years. As an overall conclusion it could be said that a facilitating regulatory framework and the choice of site are key elements to overcome the NIMBY syndrome. Experience shows the need to search for sites that minimise the total impact of a project even if these sites are not the best from a technical and operational point of view.
Other useful advices to overcome NIMBY Syndrome: • Place the receiving terminal at an industrial site • Divulge its positive effects on local development and employment • Manage risks: risk of uncertainty, public perception of risk • Count on the commitment of national and local authorities • Choose an area where availability of energy / security of supply is an issue • Integrate local partners / energy consumers in the project.
3.2. Different National Operation Procedures
3.2.1. Capacity allocation
Belgium The capacity allocation procedures are detailed at the “Main Conditions for accessing the LNG terminal of Fluxys LNG” and at the “Terminalling Code” available at Fluxys LNG website. Capacity booking procedure Fluxys LNG is developing an automatic reservation system (ARS) through which any terminal user who signed the Terminalling Code can check the availability of capacity and book available capacity. Fluxys LNG provides LNG terminal users with the facility to automatically reserve a selection of standard services using an electronic platform. The ARS user can reserve certain services on line using a secure Web application. The user will be able to start to use the services that have been reserved as soon as it has subscribed to these services and as soon as Fluxys LNG has confirmed this subscription. This ARS is available 24 hours a day, 7 days a week.

Study on Interoperability of LNG
- 69 -
To be able to use the ARS, the terminal user signs an ARS Access Form in accordance with the terms that it commits itself to, in particular, to comply with the conditions of use of the ARS. The ARS forms part of Fluxys LNG's Extranet application, which provides online services to users of the ARS. This application provides access to a variety of data, information and service platforms. Allocation of long term capacities on the primary market:
The allocation of capacity at Fluxys JNG is primarily based on Open Season procedures and, in second place, on the rule of "First Committed / First Served". The following types of capacities can be allocated on the primary market: slot, additional send-out capacity and additional storage capacity. Allocation of free slots on the primary market:
The free slots are slots, which have not been allocated during Open Season or are identified as available, are allocated observing the following priority order: To the user who has notified Fluxys LNG its effective or probable lack of capacity to
use the subscribed slot during the contract year; To the user which has Make-up capacity; To any LNG terminal user or potential terminal user based upon the rule of First
Committed/First Served from the time at which this slot was scheduled. There are also detailed procedures for the allocation of: unused send-out capacity (pooling), daily storage and send-out capacities, send-out on the Day Ahead market, unsubscribed capacities for slots, truck loading, capacities on the secondary market, capacities released by the regulator in case of congestion. There is no legal obligation to reserve capacity for short term contracts. Fluxys LNG website provides ample information about the three current long-term contracts signed by Fluxys LNG that cope with all the LNG terminal capacity up to 20 years from 2007. The Terminalling Code also describes in detail the nomination procedures applied by Fluxys LNG and its responsibility for checking and matching the nominations reported by the terminal users. France All the capacity is allocated under the First Come/First Served principle by the LSO. A shipper can request the LSO to resell any capacity that it does not plan to use. This capacity is sold by the LSO to suppliers that have made such a request for the period considered, in accordance with the First Come/First Served principle and on the basis of the access tariff in force. The minimum payment obligation is transferred to the new shipper, if any.

Study on Interoperability of LNG
- 70 -
However, since April 1st 2007 until the end of an Open Season process, the First Come/First Served principle will not apply for the reservation capacities from 2011 until 2021 (see note on “Open Season process” below). Montoir-de-Bretagne LNG terminal is now planning to expand its current capacity. Due to this project, an Open Season has been launched by Gaz de France Infrastructures prior to the development of any new capacity. There is no obligation to reserve capacity for short term capacity contracts at the existing LNG terminals. There is a standard contract variable in terms of duration: Infra-annual (short term contract): less than 12 months. Annual or supra-annual (long term) contract: with a term of 12 months or greater,
without the term necessarily being a whole number of periods of twelve months. Any reservation request must be supported by a LNG supply contract consistent with the request. Greece Capacity is allocated on a First Come/First Served basis. The standard contract is mentioned at the Draft System Code, it is called LNG Facility Usage Agreement (LNG Agreement) but it is not available on RAE’s website. According to the Draft System Code Article 83, the minimum duration of LNG Agreements shall be one year and the maximum duration shall be fifteen years. Italy The capacity allocation procedures are detailed in the regasification code “Codice de Rigassificazione, Chapters 5 and 9. There is a standard contract available at GNL Italia website. According to the standard contract two types of capacities that can be contracted: Pluri-annual: for a maximum period of five years and never above the maximum
duration of the contract. Annual: for the following thermal year.
Portugal Contracts duration is for one gas year period. Every year, the TSO and the Technical System Operator elaborate and submit to the LSO an Annual Transport Forecast stating the gas quantities to be delivered every month at the Natural Gas Supply Point. Spain Capacity allocation procedures are based on the First Come/First Served principle.
Study on Interoperability of LNG
- 71 -
Under the existing Mandatory Planning for basic gas infrastructures, LNG terminals have being designed to allow for a capacity margin over the forecast peak demand. Therefore, no major physical congestion problems are expected in the near future. There is legal obligation to reserve 25% of total regasification capacity for short term contracts, with duration under 2 years. These contracts cannot be extended. The owners of the LNG terminals are required to publish every three months contracted and available capacity at each LNG terminal, distinguishing between short term contracts and long term contracts. The contracts with duration superior to two years can include an extension agreed by the parties but the advance advice for the extension of the contract cannot exceed six months. Short-term contracts can be signed for periods as short as 1 day and there are no limits to the length of long-term contracts. Standard request application form and standard access contract of regasification facilities are available at Enagas and CNE websites. United Kingdom All primary capacity at the terminal has been auctioned through open season processes and is fully contracted under twenty-years contracts. The contractual arrangements allow the primary capacity holders to sell importation capacity (berthing slots, space or deliverability) to secondary users. Parties interested in obtaining secondary capacity therefore need to contact the primary capacity holders in first instance. There are no requirements to reserve capacity for neither short term contracts nor standard contracts.
3.2.2. Congestion management Belgium To prevent congestion situations Fluxys LNG has certain obligations such as: Promoting capacity transfers between the users of the LNG terminal, maintaining a register of the unused capacity, suggesting conversion from firm capacity to interruptible, etc. If these pro-active measures do not meet the requirements of an applicant, the following procedure, made up of four stages, will be applied. Stage 1: Fluxys LNG informs CREG about a congestion situation;
Stage 2: Aapplicants of capacity must provide CREG proof of the actual use of the requested capacity. The applicant is thus authorized to invoke any delivery contracts.

Study on Interoperability of LNG
- 72 -
If the applicant is already a user of the LNG terminal, the level of its unused capacity shall be taken into consideration. Fluxys LNG shall use the allocated capacity register to proceed with a preliminary analysis.
Stage 3: On the basis of the information gathered during the course of stages 1 and 2,
CREG will take the necessary action to release partially or totally the unused allocated capacity up to the requested capacity. To do so, CREG shall use the allocated capacity register to calculate the capacity that is to be released.
Stage 4: 45 days after CREG has notified its request to release the required capacity, Fluxys LNG shall free the capacity unused by the users of the LNG terminal. Then, Fluxys LNG shall impose a capacity interruption tariff according to its regulated tariffs.
If congestion persists, Fluxys LNG shall revise the current capacity allocation rules considering the following points: Market demand, Long term contracts, Approved projects to expand the LNG terminal.
Any revision of the capacity allocation rules shall be carried out in collaboration with the users of the LNG terminal. The proposals shall be submitted to CREG and, in case of approval, shall result in the Main Conditions of access to the LNG terminal being update. France The LSO establishes the monthly nomination program for all the users of the LNG terminal. This program can be modified on request from the shippers. A penalty for late cancellation of a scheduled operation has been set. This penalty contributes to relieve congestion in LNG terminal. Also, an specific UIOLI mechanism is going to be set up to prevent congestion. If a shipper under-utilises its capacities, refuses to sell them on the secondary market and cannot justify the need to retain these capacities, the user will lose the under-utilised capacities for the period considered. The LSO can impose penalties to users for late cancellation of scheduled unloading operations and can set minimum payment obligations to refund the costs, charges and operating losses incurred by the LSO as a result of the vessel occupying the LNG terminal berth for a period in excess of the total guaranteed unloading time, for a reason beyond the LSO's control. The terminal user shall provide the LSO with a guarantee of its payment obligations under the contract, the amount of which is calculated before each billing period, in accordance with a pre-determined formula. Greece Congestion management procedures carried out at the Revithoussa LNG terminal are detailed at the Draft System Code Art. 93.
Study on Interoperability of LNG
- 73 -
When the overall booked capacity exceeds two thirds of the total LNG entry point capacity, the LSO should immediately notify RAE and all users of the LNG terminal. This notice should be accompanied with LSO’s proposal to RAE regarding congestion management in terms of: Increasing the available capacity by building new infrastructure. Offering terminal users the option of signing for interruptible capacity. Conducting a public tendering.
RAE decides on the method to be adopted. If the last option is adopted the LSO would require existing long term capacity holders to release their booked capacity so that the total send-out capacity can be reallocated through the auction. The TSO would have to reimburse the terminal users for the released capacity that would have already been paid for via tariffs. According to the Draft System Code, Art. 91, if the LNG terminal user exceeds the scheduled time for unloading reasons other than Force Majeure, a penalty shall be paid. On the other hand, if the LSO does not allow the beginning of an unloading within two hours from the receipt of the statement of readiness submitted by the LNG terminal user, the LSO should also pay a penalty. Both penalties are fixed at 0.0025 €/h for each hour of delay. There are also penalties for cancellation of a delivery. Italy Shippers shall provide the LSO with a guarantee of their payment obligations under the regasification contract that depends on the quantity the user plans to unload, regasify and send-out and on the nature of the service required, continuous or spot. Portugal The method for calculating usable, available and unused capacities is under revision process by ERSE. Spain To prevent contractual congestion and capacity hoarding terminal users have to secure a bail for an amount equivalent to 12 times the fixed term of the tariff applied to 85% of the capacity they have booked. The terminal user would loose the bail and the capacity rights in case of infra-utilisation of this capacity. The CNE is now developing a “Detailed Procedure” for managing congestion as result of the physical congestion that arose at the transmission network when a new LNG terminal (Saggas), not far from an existing terminal (Cartagena), entered into operation. The LSO publishes on its website monthly bulletins containing data related to the capacities of the gas system: number of cargoes unloaded by terminal (including the six terminals of the Spanish system), volume of send out gas, LNG stored in tanks and utilization rate for each LNG terminal.

Study on Interoperability of LNG
- 74 -
Penalties are paid in case of LNG stored in excess at LNG terminal, regasification below 85% or over 105% of the daily booked capacity, delays in the unloading of LNG carriers and imbalances. The result of the auctions organized by the LSO to acquire the gas volume required to amend a situation of “negative gas stock” is taken as the “reference market” price. In absence of such quotation, the “reference market” price would be the lower of the Henry Hub and the National Balancing Point gas prices. Under no circumstances the LSO shall accept offers with a price above 150% of the lower gas price at Henry Hub and at the NBP seven days before the auction date. United Kingdom There are no published procedures as Grain LNG is a TPA exempted import terminal.
3.2.3. Secondary markets rules Belgium Precise information about the operational rules on the secondary market is described in the Terminalling Code. Available slots for the secondary market are published at Fluxys LNG website. The secondary market works as follows: i. More than twenty days before the start date of the slot, the user of the LNG terminal
can only sell slots on the secondary market in the form of full slots From twenty days before the start date of the slot, the user of the LNG terminal may sell the various services that constitute the slot separately on the second market.
ii. Before the 20th day of month M-3, the user of the LNG terminal programmes the
number of slots that it is scheduling for the month M. Before the 20th day of month M-2, the user of the LNG terminal notifies the dates of slots that it has programmed.
iii. At latest on the first day of month M-2, the user of the LNG terminal must notify
Fluxys LNG of the slots that it does not intent to use and authorises Fluxys LNG to sell, on his behalf, the slot in question.
iv. Fluxys LNG sells the slots that it has been notified of. These slots are published on
Fluxys LNG’s website and are sold at the regulated tariff as complete slots up to ten days before the start date of the slot. They are allocated on the basis of the principle First Come/First Served.
Ten days before the start date of the slot, the capacities that constitute the slot are marketed by Fluxys LNG in a dissociated way at the regulated tariff. As soon as the slot or the constituent capacity has been allocated Fluxys LNG will notify the user of the LNG terminal and adapt the website.
v. Without prejudice to points (iii) and (iv), the user of the LNG terminal still retains the
possibility of selling the slots at a negotiated price on the secondary market, and from twenty days before the start date of the slot the user of the LNG terminal can sell the services making up this slot on the secondary market at a negotiated price. If the user of the LNG terminal has sold a slot, or the capacities constituting a slot, that has been subject of a notification in accordance with point (iii), then the user of

Study on Interoperability of LNG
- 75 -
the LNG terminal will notify Fluxys LNG who will interrupt the sale of the slot in question and actualise its website. If the user of the LNG terminal has sold capacity in a dissociated way, the possible residual capacity not sold ten days before the start date of the slot will be marketed by Fluxys LNG according to point (iv).
vi. Regarding to point (ii), Fluxys LNG will take into account any slot nominated by the
user of the LNG terminal but not used, provided that this slot was no subject of a notification pursuant to point (iii) of this article.
Figure 1: Secondary market for capacity at the Zeebrugge LNG terminal.
Source: Terminalling Code – Appendix J France The user of an LNG terminal may transfer all or part of its rights and obligations to a third party under the conditions laid down in the LNG terminal access contract. Each of the parties involved in the exchange sign an LNG terminal access contract (or an additional clause thereto). To facilitate the secondary market and ensure market transparency, Gaz de France publishes the list of the interested shippers. There is a Bulletin Board, which is a web place designed to promote exchanges of gasification capacities on the secondary market between customers (or future customers) of the LNG terminal. This Bulletin allows any company, customer or future customer to put an offer for transfer or acquisition of terminal capacity in order to find an interested counterpart. Within the framework of the Bulletin Board, Gaz de France's role is limited to publishing the transfer/acquisition offers it receives and, if needed, forwarding replies. Gaz de France

Study on Interoperability of LNG
- 76 -
cannot be held liable for the content of the information published or the outcome of the transactions initialised by the offers. Greece No secondary market exists yet. Portugal Secondary markets rules are not yet implemented. Spain The secondary market capacity has not been developed yet. However, a recently approved Law 12/2007, establishes the need to develop a new regulatory framework for secondary market capacity. United Kingdom The primary capacity holders can sell capacity to secondary users when they do not intend to use it. The secondary capacity at the LNG terminal is accessible to potential shippers through arrangements with BP/Sonatrach (primary capacity holders) or through interruptible capacity made available at National Grid Grain by the LSO. Additionally a bulletin board, published at the National Grid Grain website, is available for parties to express interest in buying or selling capacity at the LNG terminal. On July, 2006, the primary shippers announced that the existing arrangements would be complemented by a new "Secondary Capacity Mechanism", which had been developed by BP/Sonatrach after extensive consultation with industry players. At the time of finalising the definitive legal documentation to support these arrangements a number of complex issues appeared and the Secondary Capacity Mechanism is not yet available.
3.2.4. UIOLI Belgium The “Terminalling Code – Appendix J and Appendix C, Art. 9”, available at Fluxys LNG website sets UIOLI (use-it-or-loose-it) rules, which establish the criteria to ensure that unused capacity is released and sold on the secondary market. The capacity is considered to have being sold in the secondary market even when Fluxys LNG sells it on behalf of the terminal user. If two months before the service start date the use of any slot has not been confirmed, the terminal user is obliged to notify Fluxys LNG of the slots that it does not intend to use. Through this notification, the terminal user authorises Fluxys LNG to sell the capacity of the unused slot, on behalf of this terminal user and at the regulated tariff. The terminal user may sell it at a negotiated price or assign any of its subscribed slots directly to a third party, without using Fluxys LNG’s assistance. The terminal user shall

Study on Interoperability of LNG
- 77 -
notify Fluxys LNG of such sale or assignment in order to allow Fluxys LNG to withdraw the sale offer from its website. France A shipper will lose the capacity he is not being using for a considered period of time if the following three circumstances coincide: A significant under-use of its access capacity on a terminal for which all the commercial
capacities are subscribed; The refusal by the shipper to sell the capacity not used on the secondary market at a
price equal to or higher than the access tariff in force; The shipper's impossibility to justify the need to retain its complete capacity over the
period considered. The unused capacity is then sold by the LSO to suppliers that have made such a request for the period considered, in accordance with the First Come/First Served principle and on the basis of the access tariff in force. The minimum payment obligation is transferred to the new shipper, if any. In order to guarantee the use of the booked capacity the shippers will have to pay at the end of a billing period a minimum of 90% of the contracted services and quantities to unload even if they have not used such percentage of their contracts. Greece When the user of the LNG terminal does not use for at least one year all or part of the capacity booked, the LSO notifies in written both the LNG terminal user and the RAE of its intention to release the unused capacity of that user. If the user justifies why he has not used this capacity, the LSO cannot proceed with the release of such capacity unless RAE notifies the opposite. In case of partial release of unused capacity during two consecutive natural years the LSO, considering all circumstances, may release the entire amount of contracted capacity with immediate termination of the LNG Agreement. The release of booked production capacity is considered as a sale to the LSO, who shall pay to the terminal user a price equal to 80% of the applicable LNG tariff formerly paid by the user to the LSO. Spain To grant that booked capacity is used, applicants for new capacity have to present a bail for an amount equal to twelve months of the fixed term of the access tariff applied to 85% of the capacity booked. This bail will be returned to the user one year after the beginning of the supply. Capacity rights and the bail are lost if capacity utilisation does not reach 80% of booked capacity during the first six months of the contract. The terminal user loses a percentage of the bail and of the capacity rights proportional to the decrease in the utilization rate.

Study on Interoperability of LNG
- 78 -
In case the LSO realizes there is, or could be, a continued under utilisation of booked capacity and that this situation could result on the refusal of access to other users due to lack of available capacity, the LSO will reduce the capacity booked by the shipper who would lose capacity rights equal to the capacity not being used and the proportional part of the bail. The LSO publishes and monthly updates on its website extensive data on the number of cargoes unloaded by terminal, volume of gas regasified, LNG stored in tanks, and utilization rate for each one of the six import terminals operative in Spain LNG terminal. United Kingdom OFGEM granted Grain LNG an exemption from TPA to the terminal, according to article 22 of Directive 2003/55CE, on the condition that National Grid Grain LNG Ltd. had in place effective UIOLI arrangements so that other companies could import gas through this terminal in case BP and Sonatrach were not using the available capacities.
3.2.5. Tariffs and tariffs establishing mechanisms Belgium TPA tariffs are available at Fluxys LNG website. The “Slot” is the basic tariff but there are specific tariffs for additional storage, additional send-out volumes, trucks loading and commercialization of unused capacities by Fluxys LNG at the secondary market. In addition to these tariffs, it must be taken into account that: In case an LNG carrier fails to arrive on time for a rescheduled slot, the terminal user
shall pay a rescheduling fee; In the event that the shipper’s LNG carrier exceeds the allowed lay time, the shipper
shall pay demurrage actually incurred for the next LNG ship due to berth at the LNG terminal.
Updated tariffs are not published on the website but there is a formula to calculate the monthly indexes. France The same tariffs are applied to both LNG terminals, Fos-sur-Mer and Montoir-de-Bretagne. The basic tariff structure includes six terms: Number of cargoes Unloaded quantity Regasification capacity Reception capacity (average size of a cargo expressed in MWh (0°C) and calculated
as the quotient of the unloaded quantity over a year by the number of cargoes unloaded over this same year)
Regularity (the difference between the quantities of LNG unloaded in the winter and the quantities unloaded in the summer
Gas kind, which covers the consumptions of gas needed by the import terminal to treat the cargo.
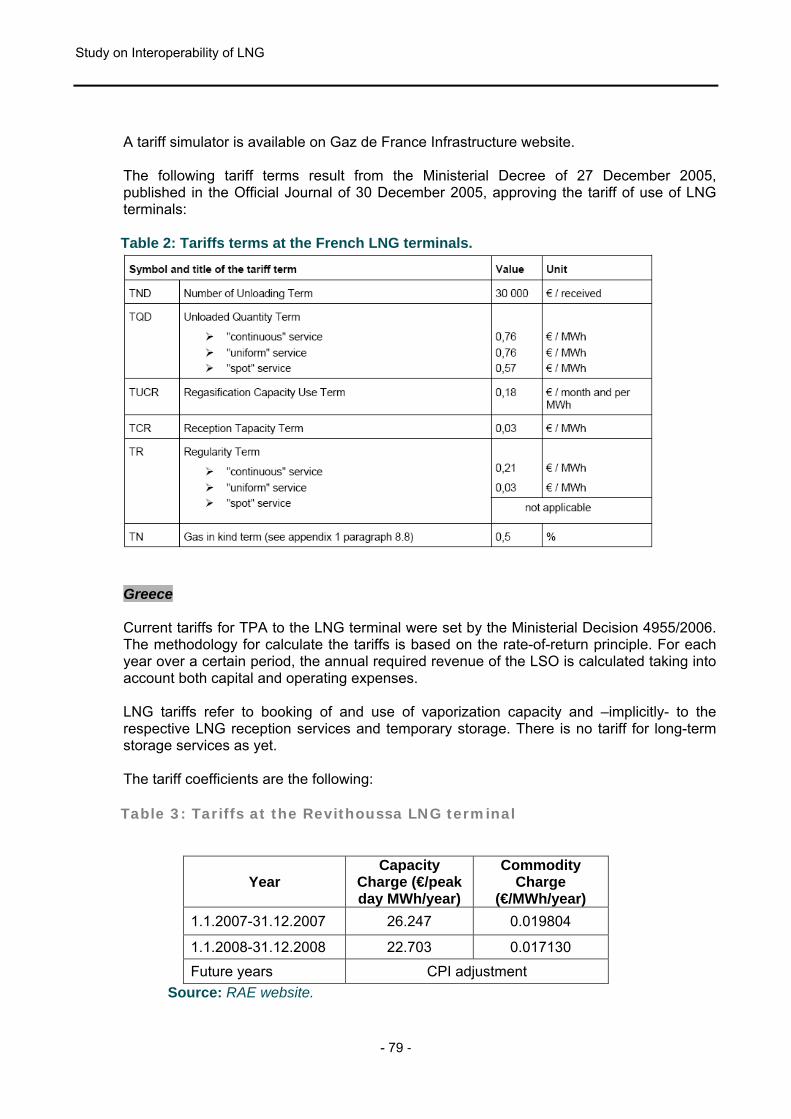
Study on Interoperability of LNG
- 79 -
A tariff simulator is available on Gaz de France Infrastructure website. The following tariff terms result from the Ministerial Decree of 27 December 2005, published in the Official Journal of 30 December 2005, approving the tariff of use of LNG terminals: Table 2: Tariffs terms at the French LNG terminals.
Greece Current tariffs for TPA to the LNG terminal were set by the Ministerial Decision 4955/2006. The methodology for calculate the tariffs is based on the rate-of-return principle. For each year over a certain period, the annual required revenue of the LSO is calculated taking into account both capital and operating expenses. LNG tariffs refer to booking of and use of vaporization capacity and –implicitly- to the respective LNG reception services and temporary storage. There is no tariff for long-term storage services as yet. The tariff coefficients are the following: Table 3: Tariffs at the Revithoussa LNG terminal
Year Capacity
Charge (€/peak day MWh/year)
Commodity Charge
(€/MWh/year) 1.1.2007-31.12.2007 26.247 0.019804
1.1.2008-31.12.2008 22.703 0.017130 Future years CPI adjustment
Source: RAE website.

Study on Interoperability of LNG
- 80 -
The capacity charge is applied to the maximum daily booked send-out capacity during the respective year, while the commodity charge is applied to each MWh of LNG vaporized during the year. If the difference between booked and actually used capacity is outside specific tolerance limits, extra charges are imposed. Italy The TPA tariff is calculated according to a predetermined formula that is available at the GNL Italia website. The tariff for spot service includes a corrective coefficient which is applied to the contractual quantities. Portugal Unloading:0,00022937 EUR/KWh Storage:0,00005151 EUR/KWh/day Regasification:0,00009041 EUR/KWh of LNG regasified 0,003209 EUR/KWh/month of regasification used capacity
Truck Loading:130 EUR per truck. Spain Access tariffs are set by Ministerial Orders and published. There are specific tariffs for: unloading carriers, regasification, truck loading, loading of LNG carriers and cooling of tankers and storage. The storage tariff only applies when the LNG stored exceeds the “operative storage time” of 10 days is included in the regasification tariff. All tariffs include a fixed term and a variable or commodity term, with the exception of the storage tariff. Different seasonal, monthly and daily coefficients apply to the fixed-terms of the TPA tariffs for contracts of less than twelve months extent. United Kingdom There is no published information as Grain LNG is a TPA exempt terminal. An attempt to TPA tariffs comparison One year ago the Spanish LSO, Enagas, made a survey of access tariffs applied in Europe for the GIIGNL and tried to compare the tariffs applicable in 2006 by the different LSOs. Enagas concluded, after a thorough exercise with the cooperation of other LSOs, that the comparison exercise was very difficult and not very relevant. Difficult for a number of reasons, which include the different size of LNG vessels unloading at each terminal, different send-out requirements, different flexibility margins included into TPA tariffs, different configurations of terminals according to downstream needs, different

Study on Interoperability of LNG
- 81 -
gas qualities, how to make a sensible valuation of gas in kind (which is the main cost component in some terminals and should be included), etc. Not relevant because a rational shipper would never apply for those services or would find alternative ways of reducing the tariff (e.g. through the trading of gas at LNG tanks where possible). However, in order to make the comparisons as useful as possible, the following assumptions have been applied, resulting on a matrix of 16 standard cases for each country.10 The main hypothesis behind the assumptions is that the TU has to supply a certain volume of gas on a regular basis to a end-user. The frequency of off loadings is completely regular, and the interval between them depends both on the volumes supplied and on the LNG vessels capacity. LNG terminals are accessed under annual or multi-annual contracts (>year). Four different net annual volumes have been considered: 2,0, 1,0, 0,5 and 0,1 bcm/yr
(volumes delivered to the LNG terminal equal the net volumes plus gas in kind). Four different LNG vessels capacity have been considered: 125.000, 80.000, 60.000
and 40.000 LNG cm. The load factor applied is approximately equal to 90% (where applicable). Gas is
regasified at the contractual rate until the gas is exhausted, making use of the flexibilities built into tariff, in order to minimize LNG storage payments and avoid any other balance penalties.
Shippers do not share LNG vessels or trade their excess gas in LNG tanks in the secondary market, but pay the regulated rate (where applicable).
Gas in kind is valued at 20.0 €/MWh. The results observed in the 16 standard cases highlight differences in the LNG charges applied by TSOs. The differences could be attributable, amongst other factors, to the following parameters: Infrastructure: no. of LNG tanks and vaporizers, capacity of unloading facilities,
geographic location, age of assets (the latter is particularly relevant not only because depreciation but because of the changes in the price of certain elements.
Natural gas markets: e.g. regasified volumes, gas share of total energy consumption,
population and industrial densities, patterns of demand, maturity of the market. Government/Regulatory frameworks: e.g. Regulatory Asset Base definition rules, asset
life and depreciation assumptions, allowances/incentive mechanisms for funding investment and maintenance, taxation regime.
Levels of service: e.g. balancing flexibility offered with regasification contract, overrun
tolerances, booked capacity period. Tariff structure/methodologies: e.g. allocation of costs (capacity/commodity split,
treatment of gas losses and fuel gas, potential cross-subsidies between different gas infrastructures).
Simple comparisons of regasification volume, LNG vessels size, level of usage of LNG
10 In Italy, due to the physical limitation on the size of LNG vessels that can unload at the LNG terminal in Panigaglia, only 8 cases have been considered.

Study on Interoperability of LNG
- 82 -
tanks, etc, could be made but the resulting differences between tariff levels require a detailed examination of the historical, geographical, physical and economic drivers behind tariff determination, which implies that it would not be appropriate to align TO tariff levels. Given the real usage of the considered LNG terminals, Enagas found out that the following figure could probably represent a more precise comparison of effective access fees:
0.00
0.20
0.40
0.60
0.80
1.00
1.20
Spain France Belgium Italy
€/M
Wh
Spanish LNG terminals offered during 2006 the lowest absolute rates for large volumes under annual contracts (0,72-0,75 €/MWh). This was particularly true when flexibility was required (for example, for irregular send out requirements), given that terminals are designed to meet downstream requirements. For lower volumes, theoretical rates are higher (particularly when large LNG vessels are unloaded) because the LNG storage fees are applied to excess gas over 5 days. In practice, it is observed that shippers avoid paying this fee by entering in multiple gas exchanges in LNG tanks, and rates remain at around the same level (≈0,72-0,75 €/MWh). Moreover, given the large capacity of the LNG terminals in Spain, and the wide range of LNG vessels effectively discharged, in practice any player can have access to the market at these competitive fees. France offered in 2006 rates around 1,00 €/MWh for large volumes under annual contracts (0,97-1,00 €/MWh). Shippers are heavily penalised if they deviate from the number of contractual unloadings or if unloadings do not occur regularly (e.g. if there are seasonal variations), or even if the period between unloadings is long. This is probably reflecting that irregular unloadings imply a higher usage of LNG tanks. But, unlike in other terminals, it is not clear whether these payments can be avoided through gas exchanges in LNG tanks, since there is not a specific (unbundled) LNG storage rate.
Study on Interoperability of LNG
- 83 -
Slightly higher rates (between 1,08 and 1,12 €/MWh) are applied to (a) lower volumes and (b) smaller ships. This reflects (a) that lower volumes imply a higher use of LNG storage tanks and (b) that gas unloaded by smaller ships pays a higher unit tariff per unloading given that the unloading term is fixed (and equal to 30.000€/unloading). In practice, given the effective usage of LNG terminals in France, the relevant tariff seems to be around 1,00 €/MWh. Belgium offered in 2006 rates around 0,98 €/MWh for large volumes and large vessels under annual contracts. However, prices would be much higher for lower volumes, in part because substantial LNG storage costs –”flexibility storage”- would be incurred. As from 15/04/2006, Fluxys gave the TU the possibility to transfer gas in storage from one TU to another (a charge of 200€ per transaction was applied). However, since Distrigas used to control most of the capacity (including all long-term capacity), this was not a liquid market and it was doubtful whether the “flexibility storage” fee could be avoided.11 Tariffs were designed for 125.000 cm vessels. The typical capacity of vessel unloading at Zeebrugge ranged from 125.000 to 135.000 in 2006. The penalisation for small ships is discouraging and, in practice, no ships smaller than 125.000 cm use the terminal. Given the effective usage of the LNG terminals in Belgium, the relevant tariff seems to be around 1,00 €/MWh. Italy offered in 2006-2007 rates around 0,90 €/MWh regardless of the volumes. However, this rates could be applied only to very limited volumes, given Panigaglia LNG Terminal total and spare capacity, and for vessels of small capacity (<65.000 cm), given the size of the terminal. Slightly higher rates (0,91 instead of 0,89 €/MWh) were applied to 40.000 cm vessels given that the unloading term was fixed (and equal to 17.538,4 €/unloading). Gas in kind (2%) accounted for around 45% of the tariff under the (conservative) assumption of gas valued at 20,0 €/MWh. Therefore, higher gas prices result in a relevant increase of access tariffs to the Paniaglia LNG terminal. As access rules and LNG tariffs have being modified in 2007 for many of the LNG terminals / countries considered, the difficulties to develop an adequate tariff comparison have increased in parallel. The definition of a standard service that suites all the terminals is now more complex. For example: TPA tariffs in Belgium are based on the “slot” concept, and any deviation from the
defined conditions would result in non-representative higher tariffs. A new tariff structure has also been developed for Spanish facilities, including and
unloading term that might differ per terminal. Tariffs and access conditions in Greece and Portugal have recently been published
and a more careful analysis is needed in order to fully understand the potential
11 Note that the business model of the Zeebrugge Terminal has completely changed in 2007 and this is not the case anymore.

Study on Interoperability of LNG
- 84 -
restrictions. For example, in Portugal tariffs are also based on the “slot” concept to some extent.
3.3. Vessel Certification 3.3.1. International regulation applicable to vessel certification
Vessels are designed and certified for world wide trading. Apart from specific ice route certification and specific compatibility issues, it could be said that LNGC’s (LNG Cargoes) usually have world wide trading limits. Vetting and Ship Approval Procedure (SAP): GLE notes that the vetting process is different from a SAP. The aim of vetting is to define if a vessel is suitable for gas transportation (risk evaluation generally executed by the vessel owner), while the SAP relates to a dedicated facility and is limited to defining if a vetted vessel is compatible or not with the facility. According to GLE, the major objective of the ship approval procedure is to check the compatibility of the ship requesting access in terms of mechanical design, communication and safety; it aims at ensuring the safety of the unloading operations pro-actively and sustaining the excellent safety record of the LNG industry Vetting and ship approval procedures vary widely and can be divided into Law Requirements and Commercial Requirements although some requirements may fall under both categories. Each country, import terminal, ship-owner and charterer will have specific requests ranging from Coast Guard requirements to SIRE12 inspection requirements to Conditions of Use acceptances. Some of the latter have been found to be abusive by import terminals requesting ship’s captains to sign exonerations of responsibility to them that may enter into conflict with applicable laws. In practice, ship-owners and charterers are always looking at having their vessels complying with as many vetting and ship approval procedures as possible but in certain situations hurdles after hurdles have to be overcome and the process is not at all homogeneous. For example, SIRE gathers under common guidelines the principles of ship-inspection. However, each SIRE vetting will have different criteria of vessels acceptability of and will use different rules and methods. Some SIRE vettings require to carry out there own inspection. Others rely on reports available on the SIRE database for their assessment. In the end, the process may block short term trading but, if due time is allowed for, vessels are usually made ready for any terminal call (subject to physical compatibility).
3.3.2. National rules and docking limiting factors A specific analysis would have to be carried out to compare national and European rules but in general the principle set above applies; if due time is allowed for, vessels are usually made ready for any terminal call.
12 Ship Inspection Report Programme. It is a large database of up-to-date information introduced by the OCIMF (Oil Companies International Maritime FORUM) about all type of tankers containing technical and operational information.

Study on Interoperability of LNG
- 85 -
As to the physical compatibility, new terminals are being designed for the biggest vessels Atlantic Max (177.000 m3), QFlex (210.000m3) and even QMax (265.000m3). They are in general open to receive any size vessel. Terminals designed for the previous conventional 138.000m3 vessel are being upgraded if possible for bigger vessels. Restrictions may be on the berth occupancy if small vessels are used and on the storage if bigger vessels are used. Certain older terminals, for example Fos (France) or Panigaglia (Italy) are restricted to small vessels but these are exceptions and will slowly be replaced or compensated by new alternative terminals. In general both, terminals and ship operators, join efforts through organisations such as SIGTTO and GIIGNL in order to design a generally compatible fleet. Belgium The Fluxys LNG terminal is able to handle LNG carriers of almost all different types and capacities. The Fluxys LNG terminal has an unloading capacity of up to 12,000 m³ LNG/hour; the jetty consists of four LNG 16" unloading arms and one vapour return arm. Only LNG carriers that have successfully passed the Ship Approval Procedure (5 steps) may dock at the LNG terminal. The Ship Approval Procedure is attached to the terminalling contract and included in the “Terminalling Code”. France The Fos-sur-Mer LNG terminal (Fos Tonkin) can only accommodate LNG carriers with a maximum capacity of 75,000m3. The Montoir-de-Bretagne LNG terminal, whose access is across the channel on the Loire river, can receive the largest LNG carriers currently in operation. Only vessels included in the list of vessels authorized to access the LNG terminal and vessels unloading cargo for the first time within the scope of the authorization procedure, are authorized to unload at the LNG terminal. Such vessels are added to the mentioned list once their authorization is obtained. To be added to the list of vessels authorized, a vessel must have successfully undergone all the stages of an authorization procedure. Throughout the validity period, the LSO reserves the right to check the acceptability of any vessel, in particular through inspections and, if necessary, the LSO conditions its authorization to the implementing of corrective measures, refuse the access or withdraw the authorization. The shipper is liable for the condition, operating conditions and adapting of its equipment to the LNG terminal. It is liable for any damage that may occur from not compliance with the aforementioned conditions, as regards the LSO and third parties. Greece The Revithoussa LNG terminal can accommodate vessels with capacities ranging from 25.000 m3 up to 133.000 m3. The information regarding ships approval procedure can be obtained at the Draft System Code Art. 85.

Study on Interoperability of LNG
- 86 -
The LSO prepares a list containing LNG carriers, which are certified as suitable for unloading the cargo at the LNG terminal (LNG Certified Vessel List), in accordance with that approval procedure. Any LNG terminal user has to submit request to the LSO for certification of LNG carriers which the user of the LNG terminal intends to utilize. Italy The limitation in vessels size is detailed at the regasification code “Codice di Rigassificazione”. The Panigaglia LNG terminal can accommodate LNG carriers with a maximum capacity of 70.000 m3. The regasification code “Codice di Rigassificazione” sets the main steps (6) the Ship Approval Procedure (SAP) shall follow. If a shipper desires to obtain from the LSO the authorization to unload a LNG carrier that it is not yet included in the “Elenco Navi metaniere” (list of vessels authorized to access the Panigaglia terminal, available at GNL Italia website), all necessary information to carry out the technical appraisal shall be submitted to the LSO. In case of positive outcome of the procedure, the LSO shall arrange to carry out an unloading test. The conclusions will be communicated via fax from GNL Italia within and not beyond sixty days from the authorization date. Portugal The maximum vessel size capacity is 165.000 m3 of LNG. All ships need to be approved by the LSO prior their arrival to the LNG terminal. The approval process at Sines LNG Terminal is performed according to the GTE (Gas Transmission Europe) LNG Ship Approval Procedure. Spain All LNG terminals in operation are prepared for dealing with cargoes up to 140.000 m3. Last March, the first Q-Flex vessel (210.000 m3) was off loaded at Cartagena. The LSO website provides a detailed list of the LNG tankers that are compatible with each LNG terminal. The ship approval procedure and stages are explained in detail in a Protocol (PD-06), which is available at the LSO website. United Kingdom The Isle of Grain LNG terminal is able to handle LNG carriers from 70.000m3 up to 205.000m3. The ship approval requirements can be obtained once a confidential agreement with Grain LNG has been fulfilled.

Study on Interoperability of LNG
- 87 -
Isle of Grain does not offer any public information on ship vetting at the LNG terminal. According to the study “Third Party Access to LNG terminals” commissioned by NERA, ships are vetted by a specialist authority as well as by Grain LSO. Procedure could take as little as 4 or 5 days in an urgent case. Shippers using Fluxys LNG (for instance) are advised to pre-vet their vessels to facilitate diversion to Grain LNG at short notice.
3.3.3. Potential constraints to the development of the fleet and international maritime transport Currently there is no shortage of shipbuilding capacity. Capacity has kept up well with extreme scenarios of reduced shipbuilding in Europe and USA combined with the biggest shipping boom of all times (fuelled by China and India amongst others). Historically ships have been made available faster than the liquefaction projects, what confirms that there is no evident constraint for the development of the LNG fleet or international maritime transport. About 40 ships have been delivered in 2007, while new liquefaction capacity could total less than 20m tonnes a year, 2m tonnes below that of 2006. Norwegian shipbroker RS Platou estimates that demand for LNG carriers “grew by a massive 25% in 2006”, with volumes boosted by an increase in arbitrage trading between the Atlantic basin and southeast Asia, and the use of vessels as storage. With around 135 ships on order, and more vessels likely to be contracted for projects integrating the shipping link of the chain, the market needs all the LNG production it can muster. The Panama Canal is a significant restriction to vessel size but it is now being upgraded and will hopefully be ready to receive bigger vessels (any LNGC) by 2015.

Study on Interoperability of LNG
- 88 -
4. OTHER STRATEGIC ISSUES 4.1. Contribution of LNG to security of supply, competition and liquidity in the internal
market
In a situation where 57% of the gas the European Union needs comes from third countries, where this percentage is expected to increase to 78% in 2030 and where three outside suppliers represent nearly 90% of total imports, security of supply becomes a priority issue.
LNG is a realistic option to alleviate this situation because it can make an important contribution to Europe’s need for natural gas and to add new sources of supply.
LNG is currently a marginal source of gas supply to Europe; just last year it reached the record figure of 10% of total gas consumption in Europe but its scope was limited to 7 Member States and only two of them accounted for 75% of total LNG imports.
There is a general agreement among industry experts that pipeline gas will continue to be the main means of gas supply to Europe but there is a similar consensus that LNG could take up to18% to 20% share of total gas demand in 2030.
Although there is a physical limit to the contribution LNG can make to the gas market, the above market share is significant enough to foster liquidity and competition between suppliers and to have an impact on indexation and overall gas price levels in the EU.
4.1.1. Security of supply
Europe is closer to the world’s largest gas reserves and supply sources than any other major regional gas market. Qatar and the Gulf Region have a great export potential but there is also half a dozen important sources at economic distance from Europe capable to meet together its forecast LNG needs. However, there are quite differing opinions about the chances to realize this potential. Rising construction costs and delayed investment decisions make analyst estimate a tight supply situation; not least concerns about the prospects of a gas version of OPEC that may prevent competition at the supply side of the LNG chain without necessarily constraining supply. Producers have the opposite concerns: some fear Europe could have an over-supply of gas in the next five years and others express security of demand concerns due to two coinciding facts as the change in the European legal framework and the measures proposed at Community level to reduce energy demand and promote development of renewable resources. The conclusion is that total LNG supply is expected to fluctuate between being balanced in the long-term and being short of supply in the short to medium-term. If European LNG imports are going to increase from 10% of the total market today to 20% in 2030, demand growth is likely to outstrip supply growth in the Atlantic Basin at least until 2015.

Study on Interoperability of LNG
- 89 -
4.1.2. Prices As explained in Chapter 1.2 contractual practices in the LNG market are changing rapidly, mainly in the Atlantic and Mediterranean Basins where LNG trade tends to mirror oil practices. The global LNG market implies bidding for short-term supplies and this leads to high price volatility which contrasts with the traditional stability of gas prices and with the concerns of large European gas buyers to accept prices set at hubs located outside their market and with which they are not familiar. Important questions in this respect are the impact of a dual pricing mechanism in Europe and how long this dual mechanism may last.
4.1.3. Liquidity
If we understand by liquidity the ability of a market to sustain significant buy and sell transactions without significantly altering the prices, the small number of LNG players in Europe and the limited volumes of non committed LNG have not provided liquidity so far to the gas market. In situations of supply scarcity prices have reached record peak and high volatility on both shores of the Atlantic Basin. Nevertheless we can not discard the potential contribution of LNG to market liquidity once more LNG projects will become operational and new players, as described in Chapter 1.2.6, might enter into the market. More LNG sources, several suppliers and ample LNG shipping and receiving capacity will certainly contribute to liquidity in the gas market, liquidity that will be appropriate to balance supply and demand when the latter becomes more and more variable. Not the least, to satisfy the needs of power generators who have fluctuating consumption patterns and represent a substantial and increasing share of total gas demand.
4.1.4. Competition
Regasification facilities represent today a realistic way for new suppliers to gain access to the European market as pipelines are often physically or contractually congested and their development is commercially complex and slow. Exempt facilities also contribute to enhancing competition as capacity is being reserved for new players. Although the way how capacity of LNG import terminals is marketed has an effect on the chances new players have to get access, the fact is that competition can be boosted in markets where there is sufficient capacity at LNG import terminals, provided cargoes can be contracted. Other than an effective means of access, LNG may offer new players an easier opportunity to contract short-term supply, rather than long-term commitments with higher volume risks, and gain access to supplies with destination flexibility. The potential benefits derived from a developed LNG market could be fully realized provided any barriers to interoperability, to access to terminals and pipeline networks are removed.

Study on Interoperability of LNG
- 90 -
It is important to point out that current and expected tight supply and increasing competition for LNG worldwide requires the European market and legal environment to be an attractive outlet for the LNG with flexible destination.
4.2. LNG Competition with pipeline gas The dramatic growth of LNG demand worldwide has produced human resources and cost pressures akin to those experienced across the whole oil and gas industry. Moreover, LNG’s transformation from a relatively niche and specialized industry to a mainstream one has made the pains of growth even more acute. In addition, these growing pains come at a time when new markets like North America are depending increasingly on LNG. LNG projects are very capital intensive. Typical cost break-down of a LNG chain for a transportation distance of 2000-3000 nautical miles is: 50-55% for liquefaction, 30-35% for shipping, 15% for regasification. Investment costs make up to some 75% for the liquefaction process, some 63% for shipping, and 77% for the regasification process. During the last decades, operators have been improving the entire LNG chain to search for cost reduction opportunities. The primary area of emphasis for cost reduction has been the liquefaction facility, which represents more than half of the overall LNG chain cost. Though unit capital costs of LNG plants vary widely from one site to the other depending on infrastructure requirements and local conditions, average unit capital costs of LNG plants had decreased strongly from some 400$/t in the early 1990s, down to some 200 $/t at the turn of the century (e.g. Malaysia, Oman, Qatar and Trinidad). By 2005, the unit capital cost (EPC awards) for the next generation of large Qatari projects registered around 300 $/t despite benefiting from economies of scale. Industry talk for upcoming projects is more within the 500-800 $/t range. At the top end of the scale, some projects are reporting costs or EPC quotations in the range of 800-1000 $/t (e.g. Algeria, Angola, Iran). It should, however, be noted, that although 800-1000 $/t is regularly cited as the cost of many LNG projects, they should be treated as “asking prices”: no projects have yet been fully sanctioned at anything close to these levels. In addition to a strong cost increase of specialized equipment such as compressors and turbines (around 25% per year), skilled labour (7-8% per year), cost of steel (3-6% per year), there is also a growing risk premium in any lump-sum quotation made by the EPC company to cover growing costs, uncertainty and volatility. The 800-1.000 $/t investment would translate to a cost of service of $3 to $4/MMBtu, which is three times the traditional cost of $1 to $1,5/MMBtu and implies a breakeven price of $5/MMBtu, assuming $1 for feed gas and $1 regasification and shipping.
($/MMBtu) Jensen
AssociatesCenter for Energy Ec.
Own estimation
E&P 0,8 0,6 0,8 Liquefaction 1,02 1,5 1,7 Transport 0,91 0,9 0,75 Regas.& Storage 0,33 0,3 0,45

Study on Interoperability of LNG
- 91 -
LNG Chain Costs ($MMBtu)
0
0,5
1
1,5
2
2,5
3
3,5
4
Jensen Associates
Center for Energy Ec.
Own estimation
Regas.& StorageTransportLiquefactionE&P
In principle LNG is still more competitive than pipeline gas from a certain distance onwards. As a matter of fact, though LNG chain costs have increased in recent years, so have new pipeline construction costs mainly due to increased steel prices and engineering & pipeline laying costs. The following chart shows the estimated costs of different means for transport energy. This is a classic chart but, in general, transport and regasification costs have not changed much in the last years.
Study on Interoperability of LNG
- 92 -
Depending on the situation, the break even point between pipeline transport and maritime transport is at the distance of around 1.000 to 2.000 nautical miles. Beyond 1.700-2.000 nautical miles, the LNG scheme is almost always more convenient than pipeline transportation. We must, however, mention that maritime LNG and land pipeline routes are different and have different lengths, therefore they cannot be compared directly. If we compare submarine pipelines and LNG chains which have the same routes, the break-even distance is much lower and in the order of 1.000 nautical miles.
4.3. LNG storage and underground gas storage: technical and cost differences Gas demand varies over time, across years, seasons, weeks, and different times of the day. Because gas cannot be stored at the point of consumption and because gas production and transport (especially when long distance transportation is involved) tend to be operated at a constant maximum rate (due to their high cost structure), these demand fluctuations have to be met by storage. The storage market is characterized by two important features: - deliverability: the amount of gas per hour that can be produced from a storage facility,
e.g. on a (very) cold day, adding to the base load supply - volume: the amount of gas that can be supplied from storage during a long (cold)
period above base load supply. LNG storage is used when high deliverability is required with a small working volume. This type of storage is typically reserved for a few extremely cold winter days, which may occur only once every so many years. Subsequent refilling of LNG tanks may take a half-year or longer. Storage of a cubic meter of gas in liquid form is very expensive compared to the storage of the same cubic meter of gas in cavern or a depleted gas field. A typical LNG storage would have a volume of 50 Mm3, an output duration of 100 hours, a storage cost of 0.4 €/m3/y and a deliverability cost of 40 €/ m3/y. LNG storage facilities are thus used because of their high send out capacity, making them ideally suited to cover the rare, extreme winter peaks. Gas caverns are facilities created in salt layers. On average they have less working volume than depleted field storage facilities and are mainly used for peak supply. A typical send out period is 10-30 days. The send in period is of similar length. Generally, a gas cavern facility consists of a number of individual salt caverns, each with a working volume of 30-70 million cubic meters and a send out capacity of about 2-4 million m3/day. Gas caverns are mainly used to cover the coldest days in a winter. Because of the relatively high send-in capacity, gas caverns may be (partly) re-filled on winter days with relatively low gas demand. This will increase the total number of send out days. However, it should be mentioned that during a period with a demand above base load (e.g. because of bad weather), there may be insufficient gas on the market to economically re-fill the caverns. In liberalized markets, gas caverns have become very popular. Because of the high send-in and send-out capacities, they are well suited to achieving benefits from temporary price differentials which occur in a spot market. Due to their small scale, cavern storage facilities require less investment and can be built in stages, one after the other, with limited incremental costs for each new cavern. Depleted oil or gas fields and aquifer storage facilities are mainly used to cope with summer-winter seasonal storage. They have large working volumes (typically 2.5 bcm) but relatively little output capacity. They are filled in summer over the curse of typically six months and emptied in winter over a period of two-three months. Because aquifer storage
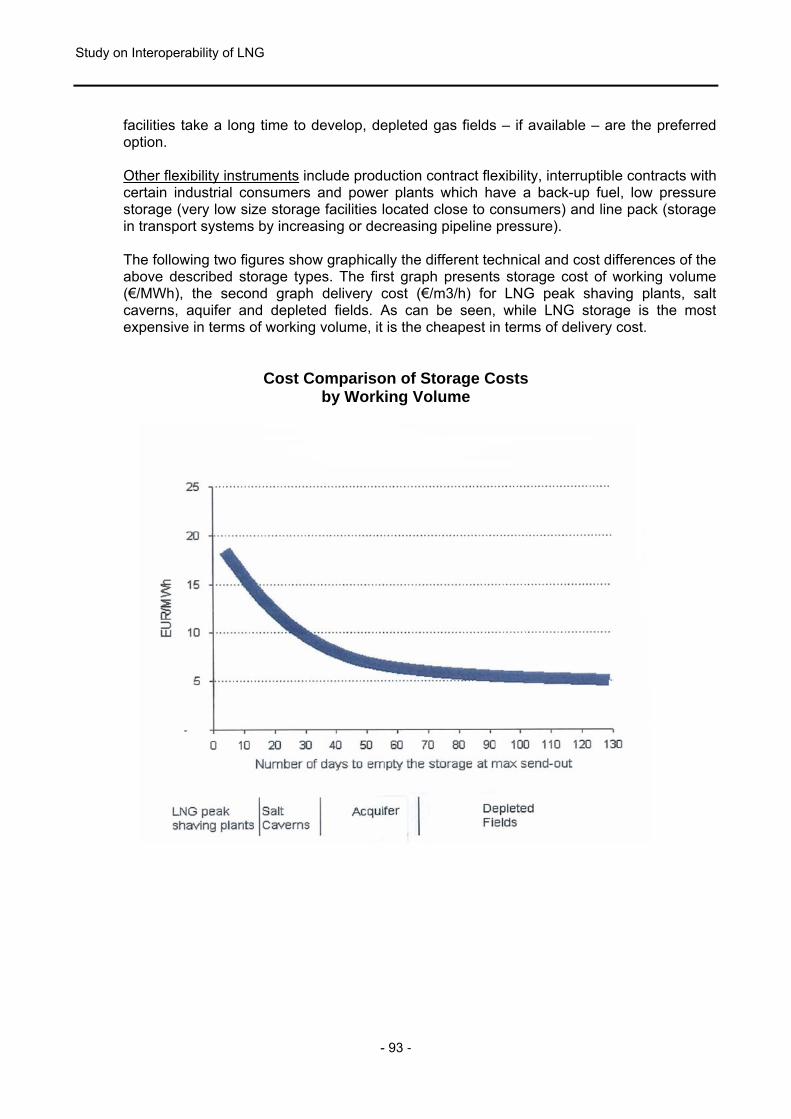
Study on Interoperability of LNG
- 93 -
facilities take a long time to develop, depleted gas fields – if available – are the preferred option. Other flexibility instruments include production contract flexibility, interruptible contracts with certain industrial consumers and power plants which have a back-up fuel, low pressure storage (very low size storage facilities located close to consumers) and line pack (storage in transport systems by increasing or decreasing pipeline pressure). The following two figures show graphically the different technical and cost differences of the above described storage types. The first graph presents storage cost of working volume (€/MWh), the second graph delivery cost (€/m3/h) for LNG peak shaving plants, salt caverns, aquifer and depleted fields. As can be seen, while LNG storage is the most expensive in terms of working volume, it is the cheapest in terms of delivery cost.
Cost Comparison of Storage Costs
by Working Volume

Study on Interoperability of LNG
- 94 -
Cost Comparison of Storage Costs by Deliverability
The above discussion shows that LNG storage is not competing with other storage types but it is a complementary option.

Study on Interoperability of LNG
- 95 -
CONCLUSIONS FROM PART I
The authors of Part I of the “Study on Interoperability of LNG Facilities and Interchangeability of Gas”, after the extensive analysis carried out of the available and up to date information on related issues, have identified a list of factors that could hamper the emergence of LNG as a valid contribution to the integration of the European gas market, to the development of fair competition across Europe and to security of gas supply. These factors are listed below as well as the authors’ opinion on the measures which could be taken to remove them or minimize their impact. It should be stressed, however, that the effectiveness of these measures is limited to the extent than the causes and remedies for many critical hindrances are beyond the control of European Union (EU) authorities and industry downstream operators.
1. Shortage of LNG in international markets
Specific liquefaction investment costs have increased by a factor of five in the few last years: from an average of $200/Mta of installed capacity to $800/Mta - $1.000/Mta. Many liquefaction projects have been delayed resulting in a much lower than expected availability of LNG in the market. This reduction on LNG availability combined with the fact that no efficient alternatives to gas-fired generation are expected to reach the market within the next ten years lead to a tight supply market situation. This situation is more perceptible in LNG than in pipeline gas where a higher proportion of long term commitments with much less destination flexibility constitutes a more secure supply source. A key question is whether the current level of liquefaction capital costs is sustainable: escalating steel and special materials prices and labour costs do not entirely justify the above mentioned investment figures for liquefaction plants. Should investment costs come closer to the real cost increase of components, liquefaction capacity would be expanded again though the effect on availability of LNG will not be felt before the middle of next decade. There is not much room for Community action as all liquefaction capacity is beyond the borders of the European Union other than, for instance, facilitating interconnection of LNG facilities and with underground storage to take advantage of the opportunities the flexible LNG market may offer.
2. International competition for LNG and competitiveness with pipeline gas Long-term commitments to deliver and off take LNG are still essential for the development of new projects but there is a trend towards shorter term agreements led by important and established exporting countries like Algeria and Qatar. The first has the option of exporting pipeline gas and LNG; the second is the world’s largest LNG exporter and the swing supplier to the East or to the West. Price is the factor determining the destination of all LNG cargoes in the spot and short-term market today, as long as there is ample regas and shipping capacity.

Study on Interoperability of LNG
- 96 -
Major Asian markets which do not have alternatives to LNG are used and ready to pay higher prices than European buyers; while North America is a liquid gas market very attractive to LNG exporters as a market of last resort. Europe has the advantage of lower maritime transport costs but when spot LNG is at current levels, transport cost differentials are not a decisive factor. Moreover, actual unit costs of supplying pipeline gas to most European markets are lower than LNG unit supply costs. This represents a competitive advantage pipeline suppliers may use in case they need it to maintain their market shares. For Europe to be an attractive alternative to LNG producers, spot prices would have to be above the current average level of contractual pipe line gas prices in Europe. LNG can play a complementary role to pipeline gas supplies by handling short term demand peaks (for instance, from power generators), by coping with sudden supply interruptions and by giving access to new suppliers but all this at a price. Although the Community can not change the international market patterns there is an opportunity for action by the EU to make Europe a more attractive market for LNG exporters by, for instance, setting a stable and predictable regulatory framework, by explicitly explaining to the energy partners the EU energy policy objectives and by promoting long-term cooperation on the basis of shared rules (some key exporters have complained that Europe wants security of supply but under its own rules).
3. Shipping capacity Shipping capacity does not appear to be a limiting factor now nor in the foreseeable future. There are sufficient means for transporting LNG; orders for new ships are sufficient to meet future LNG transport needs. Contrary to what happens in liquefaction plants, ship building costs have not raised much perhaps because there are an adequate number of shipyards with the expertise and capacity to handle demand. Charter rates may even be declining at times of bursts in overcapacity. There is no need for Community action or the action would be useless in this field.
4. Ships not matching port requirements Each port authority / LSO establishes their own Ship Approval Procedure. Complying with these procedures and with vetting conditions is usually just a time consuming issue. There is little chance for Community action to harmonize these rules because they have their grounds on international maritime legislation and on locally required safety measures. However, NRAs should be sure that these procedures are applied in a non-discriminatory way. A different issue is the port capability to receive large size ships. This is purely a commercial matter where nothing can be done at regulatory level and which has not been a serious barrier to interoperability thus far.

Study on Interoperability of LNG
- 97 -
5. LNG quality variations Gas quality is an issue but not an impediment. The European industry reached an agreement in principle on gas specifications in 2005: the EASEE-gas Common Business Practice on Gas Quality. On the basis of this agreement, the gas fulfilling these specifications should not be rejected at the entry or interconnection points of the gas transport systems. One market in Europe can not accept these specifications due to the age and characteristics of local appliances but LSO operators there have implemented, or are planning to do so, the means to deal with LNG that exceeds the agreed specs. The Community action should support the industry agreement on quality specifications and leave up to national authorities, regulators and LSOs to deal with the specific requirements derived from the characteristics of local appliances.
6. Receiving capacity at European LNG terminals LNG receiving terminals are key entry points to some markets and an alternative to be considered in others with limited entry capacity because LNG terminals are infrastructures of relatively low cost in absolute terms and in relation to other components of the gas tariff. Existing capacity is around 100 bcm per year while LNG imports reached the figure of 50 bcm in 2006. A prudent review of plans for construction of additional receiving capacity leads to the conclusion that there will be more than sufficient capacity to meet optimistic forecasts of LNG imports for the coming decade. Nevertheless, the existing and planned capacity is unevenly distributed regionally: only 7 out of the 27 Members of the UE dispose of LNG import terminals. The Netherlands is committed to join the group of LNG importers soon and 2 other markets, Germany and Poland, have the intention but less concrete plans to do it. Receiving LNG capacity is not an issue now in Europe and it is not expected to be in the foreseeable future as the number of projects to expand or build new facilities exceeds demand.
7. Permits for the construction of new LNG receiving capacity in Europe
Construction of new LNG facilities has never been an easy task. Problems usually arise at local level where population is opposed to the construction of any new large industrial facility, the so called “Not In My Back Yard” syndrome. The level of opposition is different in every country and even in different regions of the same country. The objection to these terminals has the legal grounds on the extensive and complex regulation on environmental protection in Europe but it is not specific against LNG terminals but against every large industrial facility. Although all the sponsors of regasification facilities would welcome any kind of Community action aiming at speeding up the permitting process, it is quite doubtful that Community measures could be effective on a matter where Member States’ initiative has often failed to overcome the obstacles arising from local communities.

Study on Interoperability of LNG
- 98 -
8. Need for investment in new or expansions of existing capacity Article 22 of Directive 2003/55/EC has proved to be a driver for investment. Exempting LNG facilities from third party access deviates from the general principle of opening essential infrastructures to all potential users but has been useful to bring in new suppliers. It has to be pointed out, however, that new capacities are also being developed without TPA exemption. In fact there are alternative means to exemptions in order to induce investment such as infrastructure planning and tendering process linked to attractive rates of return.
9. Physical congestion at LNG receiving terminals There are significant variations in the level of utilization of European LNG import terminals; the average utilization factor was around 50% last year. This rate of utilization should not automatically lead to the conclusion that existing regas capacity is redundant because an ample buffer margin is necessary in order to be able to meet demand at high consumption periods or to cope with sudden demand peaks from, for instance, gas-fired power stations. Provided a wide capacity margin is maintained and effective transparency rules for access to terminals are applied, physical congestion should not be a barrier to interoperability.
10. Contractual congestion at LNG receiving terminals There are also significant differences between terminals in terms of the degree of contractually committed capacity but it can be said that, in general terms, existing long-term LNG supply contracts do not fill the total capacity existing at LNG facilities. When contractual congestion takes place at high demand peaks, the legislation in force provide the tools for the LSO to accommodate the request of shippers, to seek for the cooperation of other LSO where feasible or to propose the expansion of the terminal capacity. Although most markets have implemented the congestion management legal requests, this fact does not always guarantee relieve of contractual congestion problems because of insufficient transparency, mix of interests or both. The practices of Italy and Spain to mitigate congestion are worth considering. In the first case, the practice is to reserve 20% of the total capacity for TPA access when an exemption is granted. In Spain, 25% of plant capacity has to be kept for short term contracts (less than two years contracts).
11. Capacity hoarding at LNG receiving terminals As LNG and LNG receiving facilities play different roles in various European markets the concept of capacity hoarding has to be considered in a different way than for pipelines: a. two markets are quite dependent on LNG (base load role)

Study on Interoperability of LNG
- 99 -
b. others, look at LNG as the way to get supplementary supplies through the diversification of sources (base load / option value role).
c. for others, LNG is an opportunity to balance temporary supply gaps and to take
advantage of market opportunities (option value role). Effective use of the contracted and booked capacity is viewed as an option not an obligation for LNG suppliers as they operate in a competitive global market with large price fluctuations that may render uneconomic the unloading of a cargo at a specific LNG terminal at a given point in time.
12. Discriminatory access terms Notwithstanding the merits of exemptions on specific cases or in justified circumstances, a clear separation of the interests of LSOs from those of supply companies is important in order to set a level playing field among market players and to prevent that integrated companies benefit from a clear information advantage.
13. Opaque access conditions
Information on LNG flows, capacity data, tariffs and conditions of access on existing terminals will not only be used by (new) entrants interested in the secondary market for spot cargoes but will also improve the market understanding of potential new investors when assessing future location and capacity developments The enforcement of secondary trading rules for existing and new terminals will also contribute to the efficient utilization of the infrastructure.
14. Limited access to transport grids Lack of interconnections or restrictions in the send out capacity of LNG terminals to the transmission networks would confine the valuable effect of LNG imports to concrete market areas. Adequate connections of LNG terminals with the transmission grid are essential for LNG to become a real alternative of supply and connections with underground storage are very important and for market players to take advantage of the opportunities the LNG market offers.
Specific recommendations: There are not many actions the Community can take in relation to the potential hindrances listed in points 1 to 7 other than those suggested above because either they are out of Community remit or their effectiveness is highly uncertain. Further regulatory measures to those proposed in the “Third Package” would add complexity and could hardly anticipate or deal with the operational obstacles which may appear in the complex process of access to LNG terminals while more regulation could harm the flexibility of EU players in the already competitive global LNG market and render the EU market less attractive.

Study on Interoperability of LNG
- 100 -
However, there are some specific recommendations which will contribute to remove or alleviate the hindrances listed in points 8 to 14:
a. As the mitigation or removal of the potential obstacles mentioned above very much
depend on the LSOs actual operating practices, the legislation should concentrate on the separation of LSOs interests. For consistency in the way infrastructures subject to rTPA are managed, the legislation should require for LSOs similar unbundling conditions as for transmission system operators (TSOs);
b. The proposed European Association of Transmission System Operators of Gas and an
Agency for the Cooperation of Energy Regulators with a clear mandate for the internal market have to strengthen the cooperation between LSOs and TSOs and facilitate the interoperability of LNG facilities and their connection to the grid;
c. The two models for the operation of LNG terminals should be kept open: exempt and
regulated access facilities as, in different ways, both contribute to enhance the market; d. National energy regulators and EU energy authorities should coordinate the criteria for
interpretation of Article 22 of the Gas Directive to ensure that exemptions encourage competition and that their extent does not exceed what is needed in each case;
e. Transparency and release of unused capacity rules should be applicable to all LNG
terminals but should be set before TPA exemptions are granted;
f. Rules applicable in case of systematic underutilization or capacity hoarding have to be specifically designed for LNG facilities in order to protect the option value of capacity holders: the NRAs should apply the rules after open dialogue with primary capacity holders to know the conditions that prevented the use of booked capacity;
g. Harmonization of access rules to LNG terminals is highly desirable for the purpose of
interoperability but, for the moment, LNG regulation has to take account of national needs, market particularities and the role LNG plays in each market.
In conclusion, the overall recommendation for the Commission from Part I of the Study is to take on a light handed regulatory approach to LNG issues but focused on two main objectives: transparency and separation of interests.