Study of urban traffic flow
34
A CASE STUDY ON PERFORMANCE OF TRAFFIC SIGNAL A PROJECT REPORT submitted by SUKHDEEP SINGH JAT (U12CE117) Under the Guidance of – Dr. V. Thamizharasan
-
Upload
sukhdeep-jat -
Category
Engineering
-
view
622 -
download
1
Transcript of Study of urban traffic flow
A CASE STUDY ON PERFORMANCE OF TRAFFIC SIGNAL
A PROJECT REPORT
submitted by
SUKHDEEP SINGH JAT (U12CE117)
Under the Guidance of –Dr. V. Thamizharasan

Introduction The use of traffic signals for control of conflicting streams ofvehicular and pedestrian traffic is extensive in most of towns andcities.
The first traffic signal is reported to have been used in Londonas early as in 1868.
The urban traffic system is a very complex system whichinvolves many entities and relationship among them and aremore complicated.
Thus, to setup the system for an area the traffic volume needs tobe studied before setting it up.
The study reported here is concerned with the detailed study ofa traffic signal to assess its functional efficiency and to proposecorrective measures , if required.

Objectives :-
To study the geometric and signal setting features of typicaltraffic signal.
To study the traffic flow pattern through the signal.
To evaluate the performance of the signal
To prepare corrective measures to improve the performance ofthe traffic signal.
Data CollectionStudy Intersection
Intersection for the case study - Rajkilpakkam Junction is locatedon Velachery Tambaram road in the southern part of Chennai city.As per the need of the case study at the junction data on thefollowing aspects were collected.
•Signal Cycle Timing.
•Volume of different category of vehicles moving throughintersection.
•Composition of all the types of vehicles per hour as per the videocaptured data.

The layout of the intersection is shown in Fig.1. The traffic flow details during the different phases of the signal.
Fig.1.(layout of the intersection)
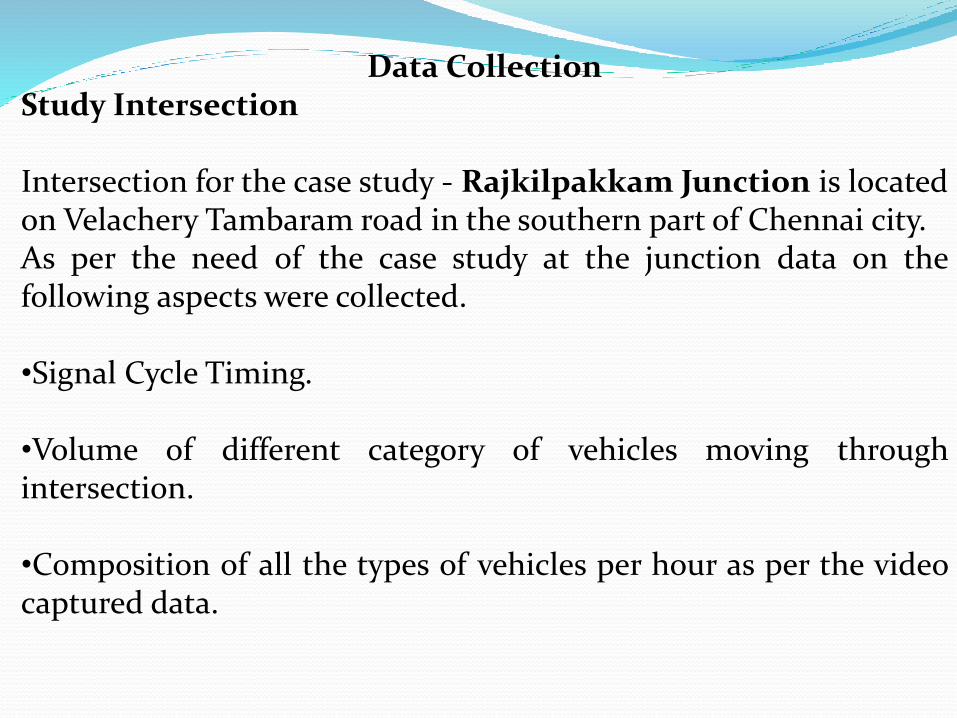
Flow Diagram
Fig.2. (a) Traffic flow in Phase I
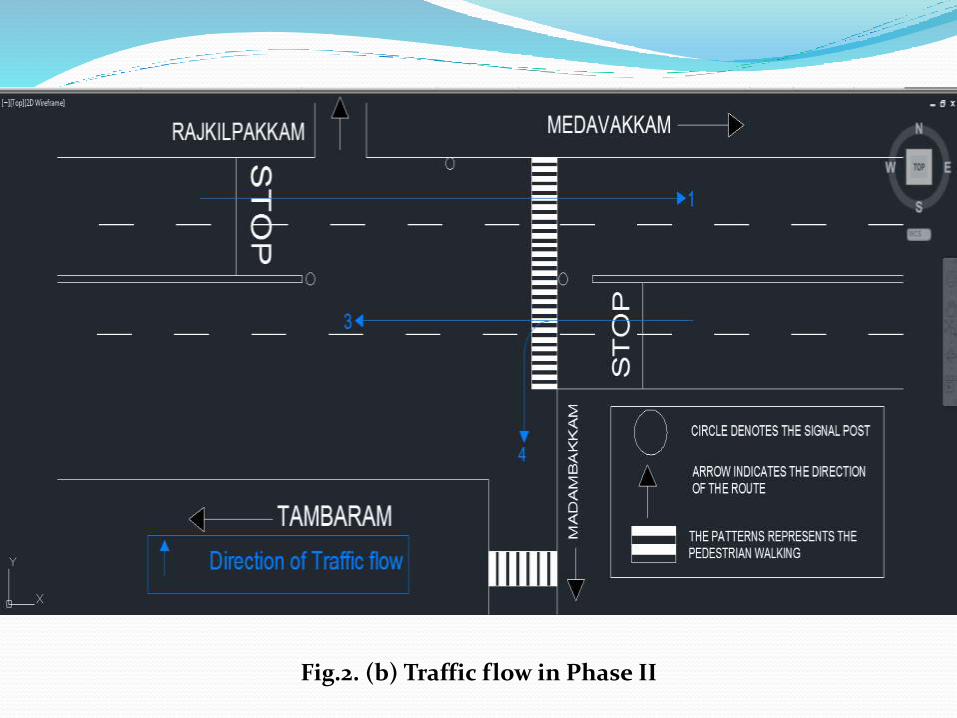
Fig.2. (b) Traffic flow in Phase II
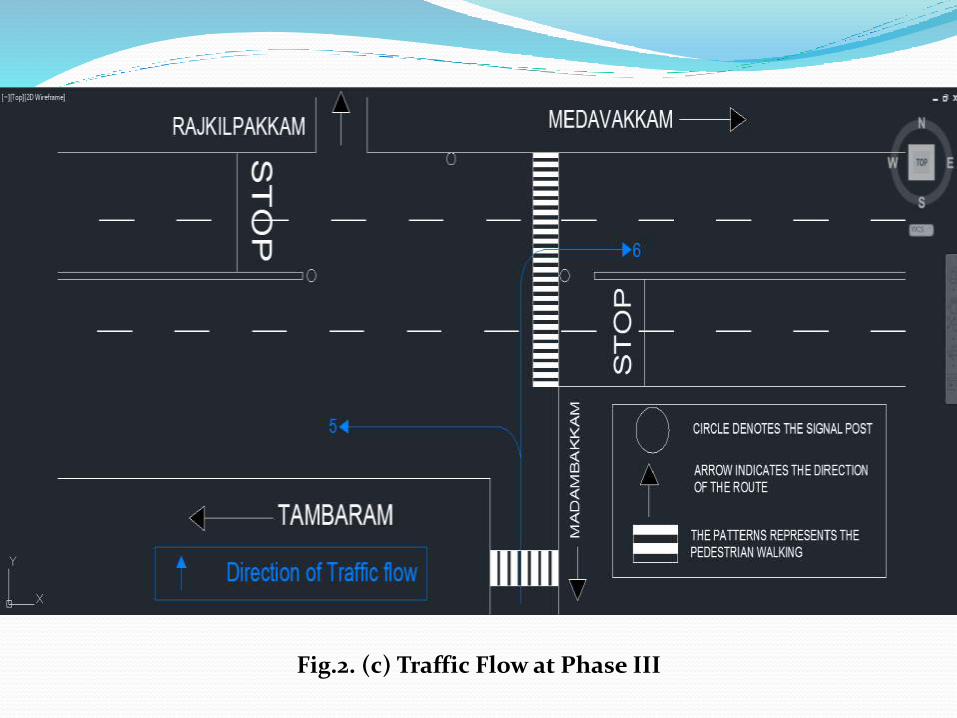
Fig.2. (c) Traffic Flow at Phase III
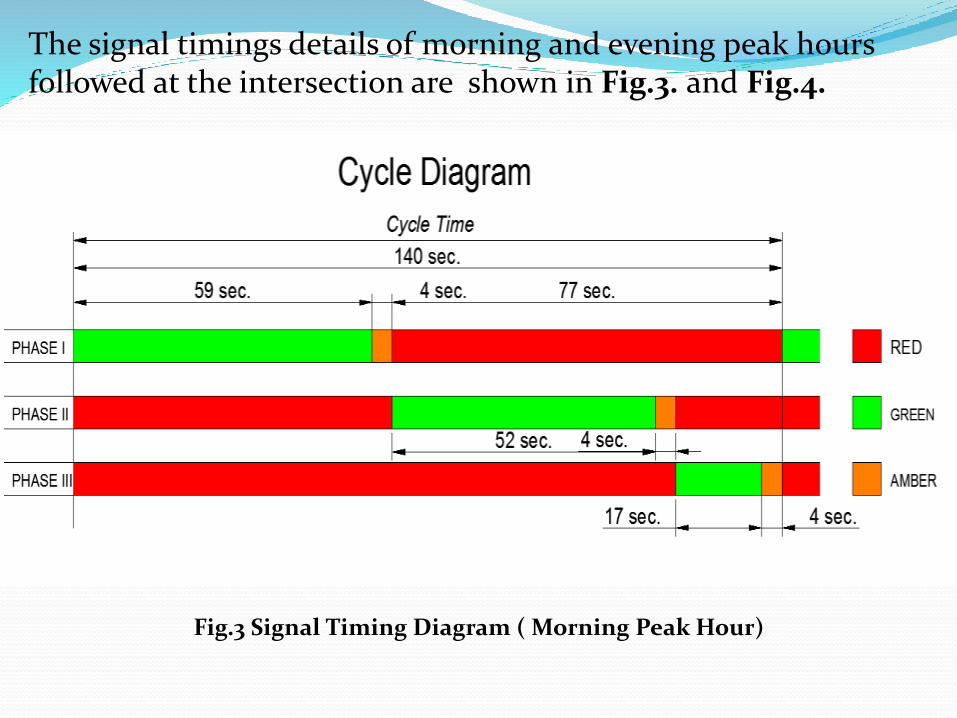
The signal timings details of morning and evening peak hours followed at the intersection are shown in Fig.3. and Fig.4.
Fig.3 Signal Timing Diagram ( Morning Peak Hour)
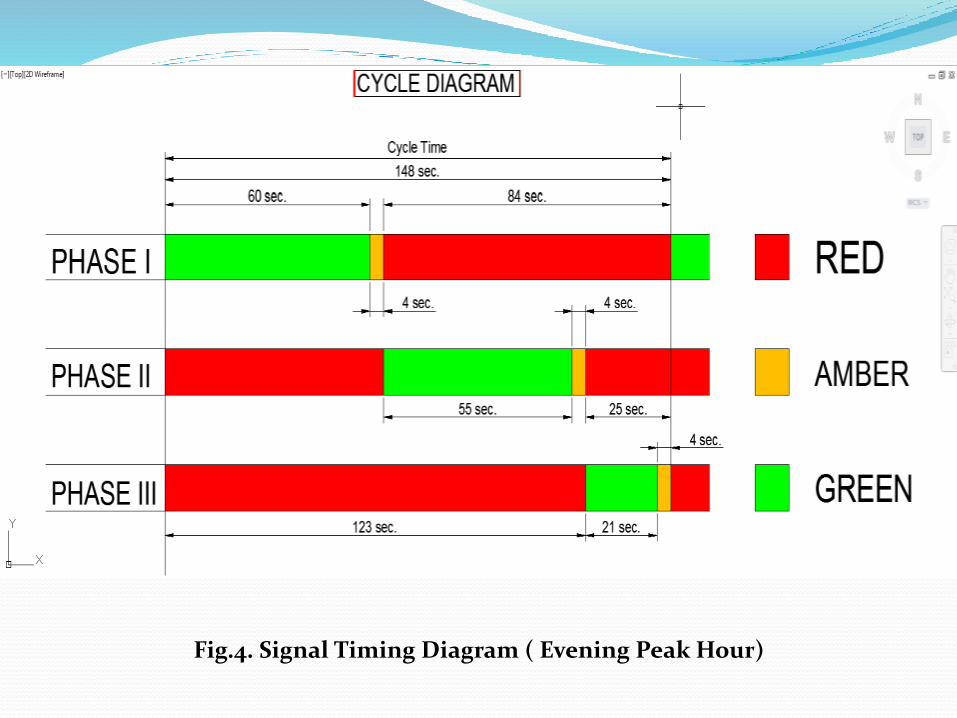
Fig.4. Signal Timing Diagram ( Evening Peak Hour)
Traffic Volume Data
The traffic data of the study intersection was collected during themorning and evening peak hours by video capturing the trafficflow. The video captured traffic data was then transferred tocomputer for classified count of vehicles. Since the traffic onIndian road is heterogeneous it is necessary to count the differenttypes of vehicles into equivalent Passenger Car Unit (PCU).
•The PCU values used to convert the different types of vehicles aregiven in Table 1.The PCU vales of the different types of vehicles adopted for thesurvey are shown in Table 1.
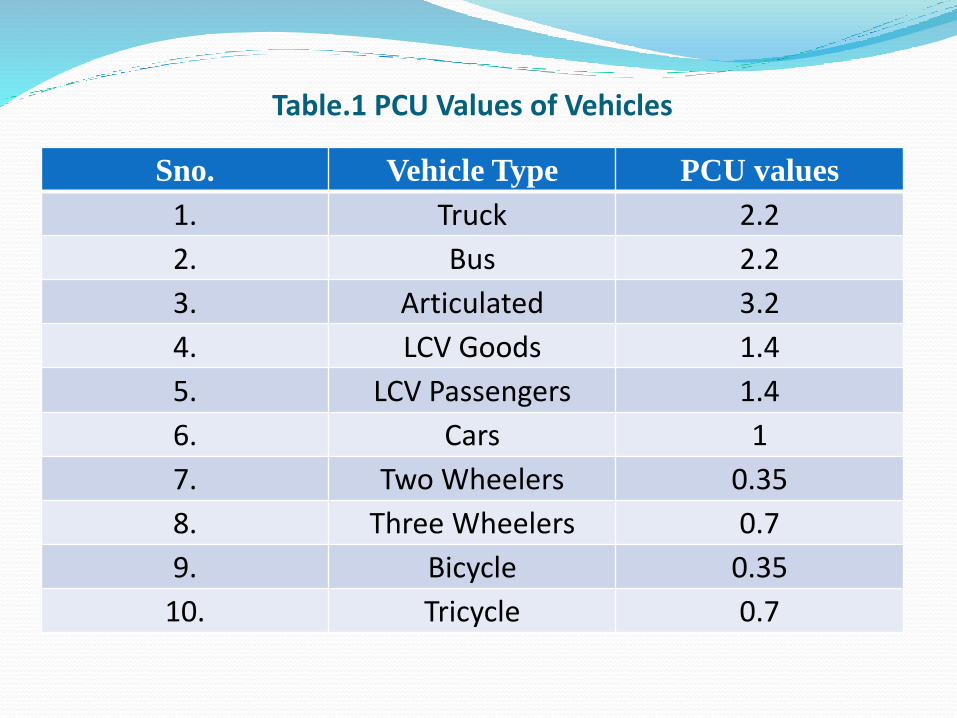
Table.1 PCU Values of Vehicles
Sno. Vehicle Type PCU values
1. Truck 2.2
2. Bus 2.2
3. Articulated 3.2
4. LCV Goods 1.4
5. LCV Passengers 1.4
6. Cars 1
7. Two Wheelers 0.35
8. Three Wheelers 0.7
9. Bicycle 0.35
10. Tricycle 0.7
• The traffic volume data of the intersection was collected byconducting field survey using video camera.
•The data of the traffic volume composition of morning andevening peak period shown in Tables 2 and 3 respectively.

Table 2 Traffic Data of Morning Peak Period

Table 3 Traffic Data of Evening Peak Period
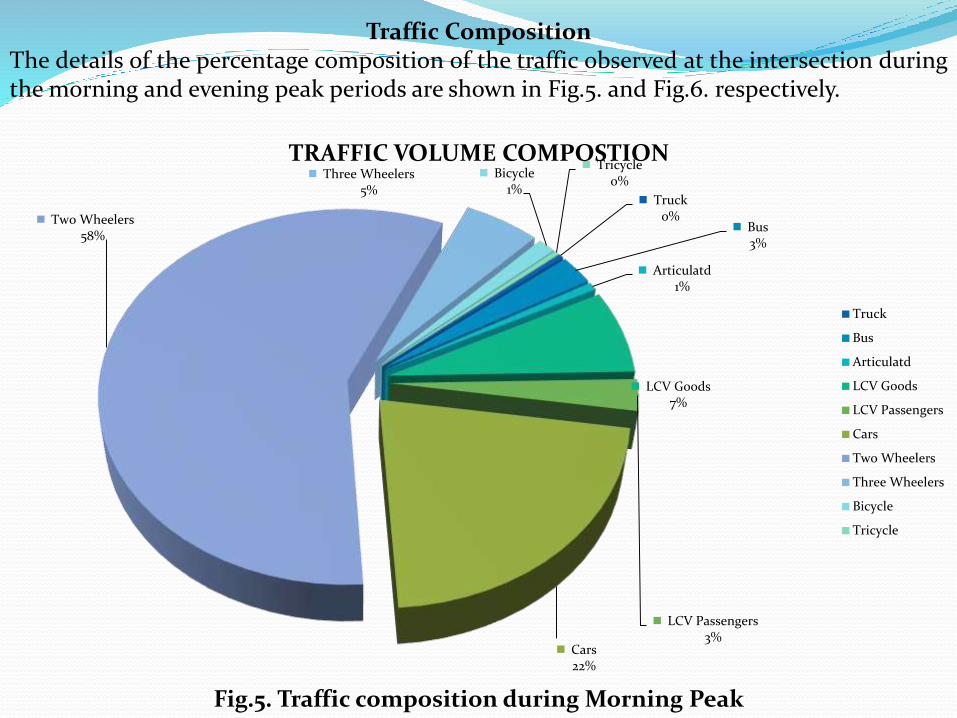
Traffic CompositionThe details of the percentage composition of the traffic observed at the intersection duringthe morning and evening peak periods are shown in Fig.5. and Fig.6. respectively.
Truck0%
Bus3%
Articulatd1%
LCV Goods7%
LCV Passengers3%
Cars22%
Two Wheelers58%
Three Wheelers5%
Bicycle 1%
Tricycle0%
TRAFFIC VOLUME COMPOSTION
Truck
Bus
Articulatd
LCV Goods
LCV Passengers
Cars
Two Wheelers
Three Wheelers
Bicycle
Tricycle
Fig.5. Traffic composition during Morning Peak
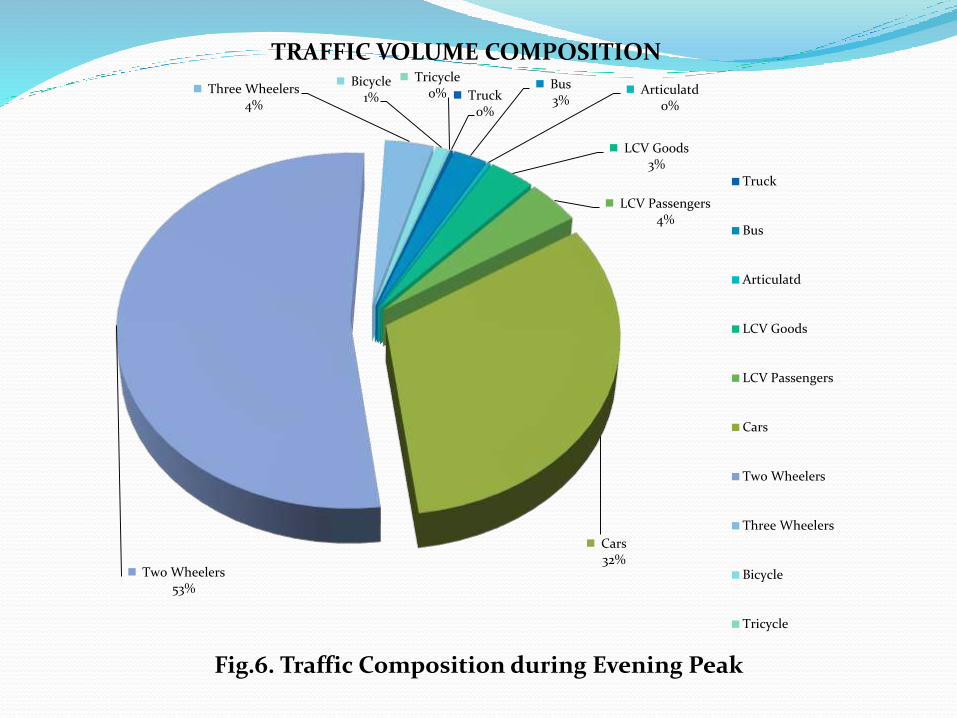
Truck0%
Bus 3%
Articulatd0%
LCV Goods3%
LCV Passengers4%
Cars32%
Two Wheelers53%
Three Wheelers4%
Bicycle1%
Tricycle0%
TRAFFIC VOLUME COMPOSITION
Truck
Bus
Articulatd
LCV Goods
LCV Passengers
Cars
Two Wheelers
Three Wheelers
Bicycle
Tricycle
Fig.6. Traffic Composition during Evening Peak

Analysis and Results
Theory
The subject of determination of Optimum Cycle Length and SignalSettings for an Intersection with Time Signals was studied in theRoad Research Laboratory (U.K.) by means of computer simulationof flow at traffic signals. The result used in determining thecompromise cycle time that would suit variations in flow duringthe day.By differentiating the equation for the total delay for intersectionwith respect to cycle time, the following equation for the optimumcycle time has been obtained :
...... ...................................(1)where
Co = optimum cycle timeL = lost time per cycle ( in seconds)Y = y1+y2+................+yn
and y1,y2........,yn are the maximum ratios of flow to saturation flow . for phases 1,2......n ( i.e., q/s where q is the flow and s is the saturation flow ).

The lost time L in the formula can be understood with reference to Fig.7 , indicating therate of flow against time.
Fig.7. Rate of flow against time

Saturation Flow. In determining the y value , the saturation flowshould be measured rather than estimated value . The method ofmeasuring the saturation flow is described in an RRL publication .For designing new signal installations , the following simple formuladevised by the Road Research Laboratory U.K. can be used :
s = 525 w PCU/hour .............................(4)where, s = saturation flow
w = width of approach road in metres measured kerb to inside of pedestrian refuge or centre line, whichever is nearer , or to the inside of the central reserve in case of a dual carriageway
The above formula is valid for widths of from 5.5 to 8 m. For lesser with the values may be obtained from table 4.
Width w in
metres
3.0 3.5 4.0 4.5 5.0 5.5
S
(PCU/hour)
1850 1890 1950 2250 2250 2900
Table.4 Saturation Flow for Widths 3 to 5.5
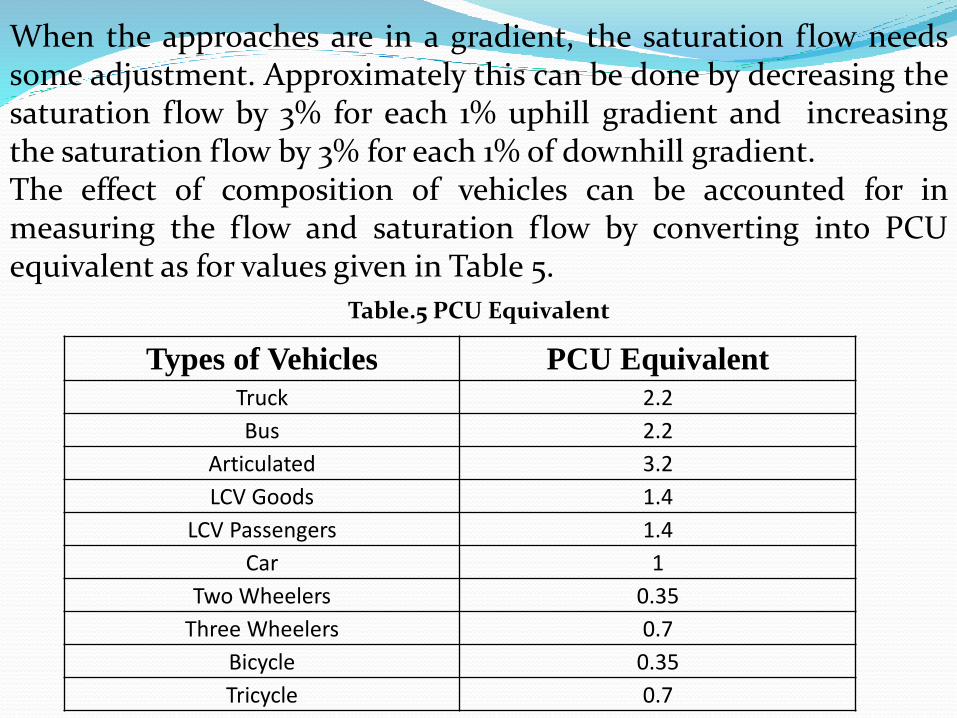
When the approaches are in a gradient, the saturation flow needssome adjustment. Approximately this can be done by decreasing thesaturation flow by 3% for each 1% uphill gradient and increasingthe saturation flow by 3% for each 1% of downhill gradient.The effect of composition of vehicles can be accounted for inmeasuring the flow and saturation flow by converting into PCUequivalent as for values given in Table 5.
Table.5 PCU Equivalent
Types of Vehicles PCU Equivalent
Truck 2.2
Bus 2.2
Articulated 3.2
LCV Goods 1.4
LCV Passengers 1.4
Car 1
Two Wheelers 0.35
Three Wheelers 0.7
Bicycle 0.35
Tricycle 0.7
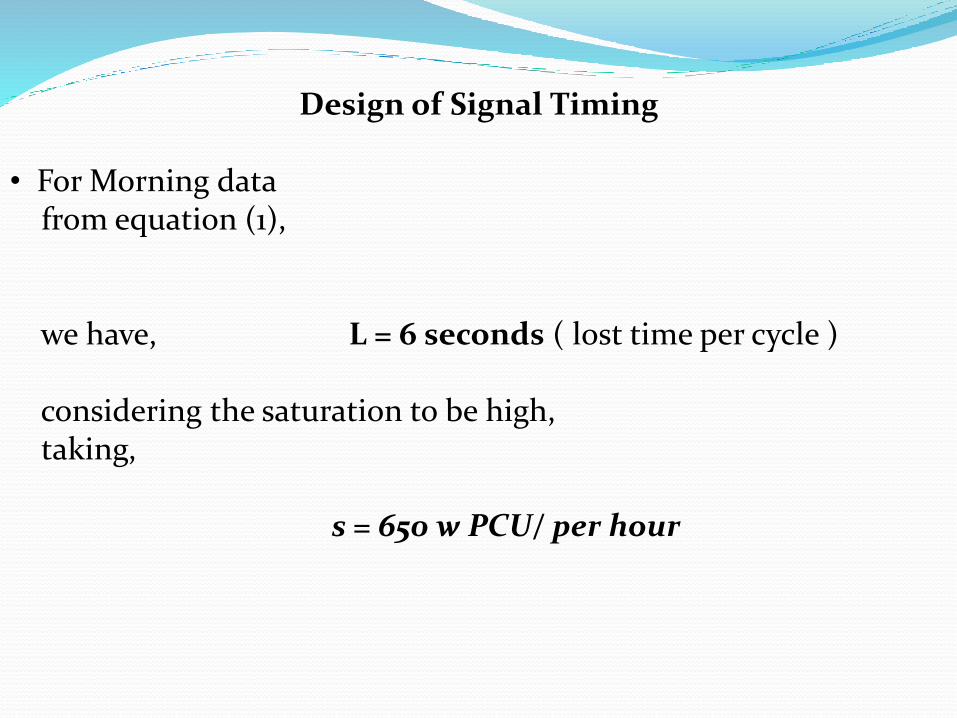
Design of Signal Timing
• For Morning datafrom equation (1),
we have, L = 6 seconds ( lost time per cycle )
considering the saturation to be high,taking,
s = 650 w PCU/ per hour
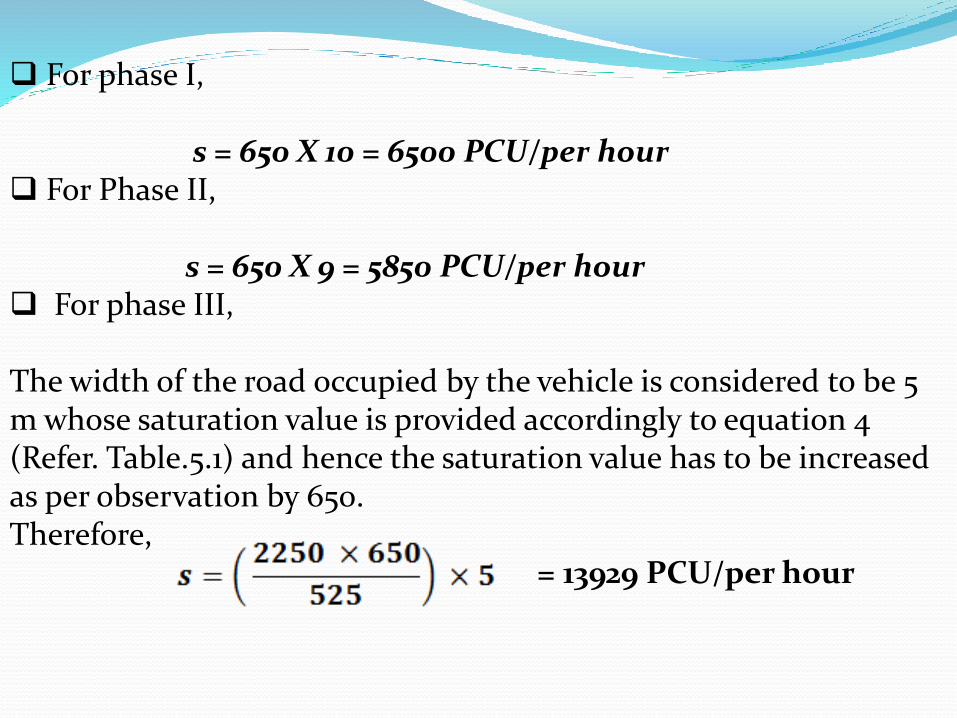
For phase I,
s = 650 X 10 = 6500 PCU/per hour For Phase II,
s = 650 X 9 = 5850 PCU/per hour For phase III,
The width of the road occupied by the vehicle is considered to be 5 m whose saturation value is provided accordingly to equation 4 (Refer. Table.5.1) and hence the saturation value has to be increased as per observation by 650.Therefore,
= 13929 PCU/per hour
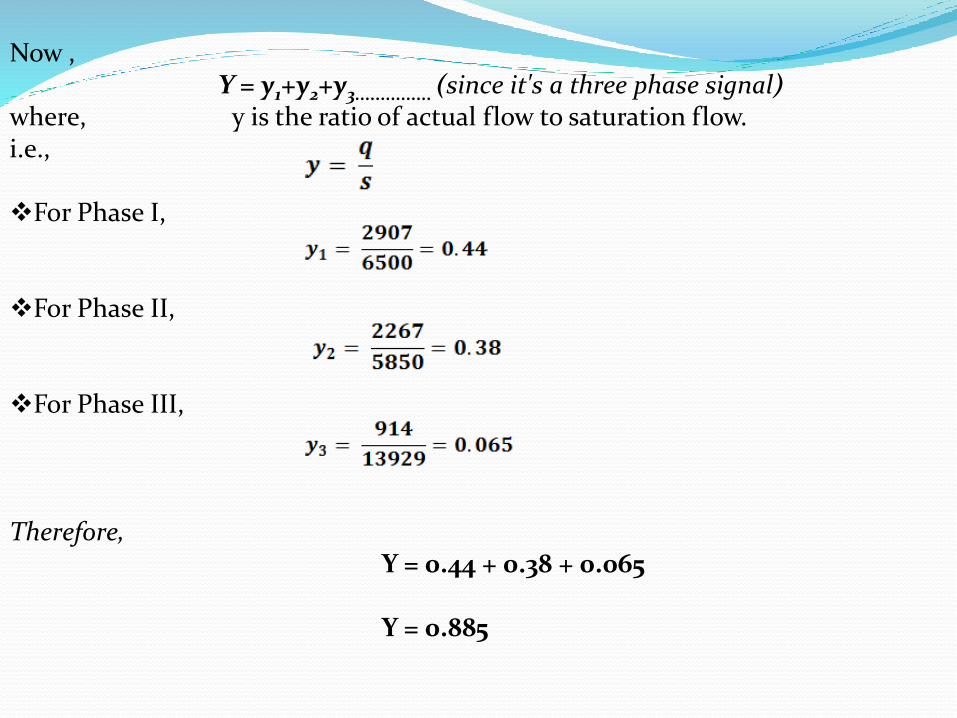
Now , Y = y1+y2+y3............... (since it's a three phase signal)
where, y is the ratio of actual flow to saturation flow.i.e.,
For Phase I,
For Phase II,
For Phase III,
Therefore, Y = 0.44 + 0.38 + 0.065
Y = 0.885
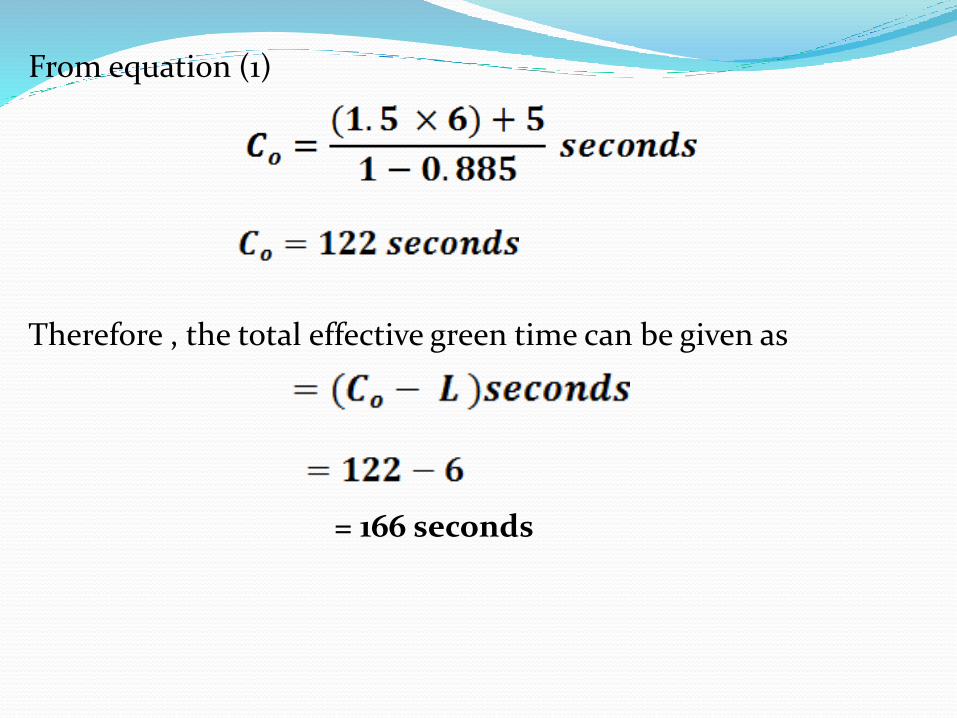
From equation (1)
Therefore , the total effective green time can be given as
= 166 seconds
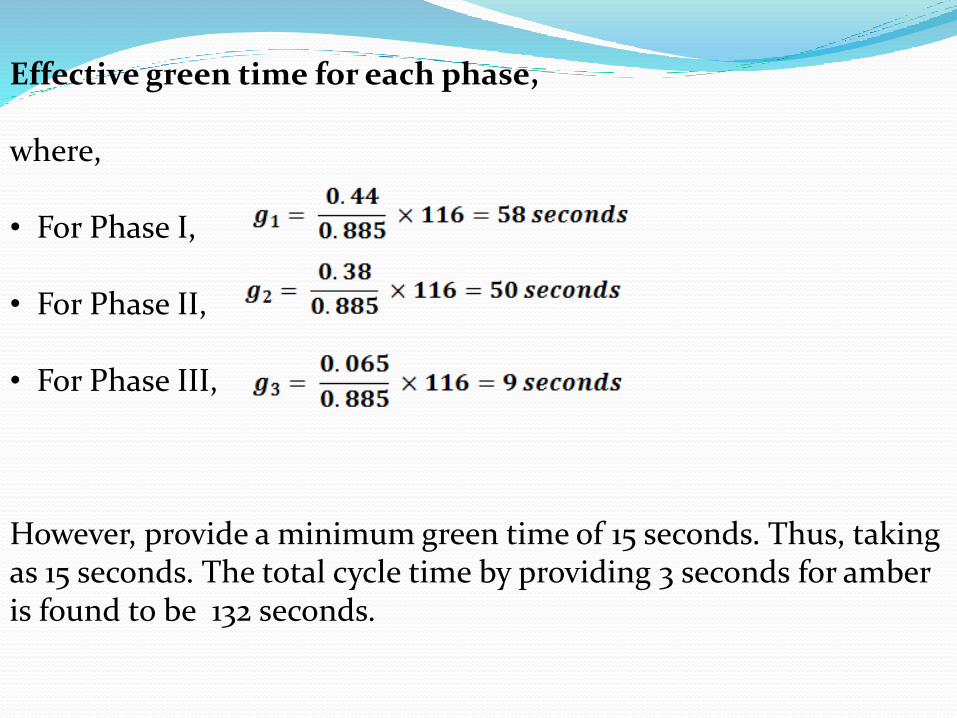
Effective green time for each phase,
where,
• For Phase I,
• For Phase II,
• For Phase III,
However, provide a minimum green time of 15 seconds. Thus, taking as 15 seconds. The total cycle time by providing 3 seconds for amber is found to be 132 seconds.
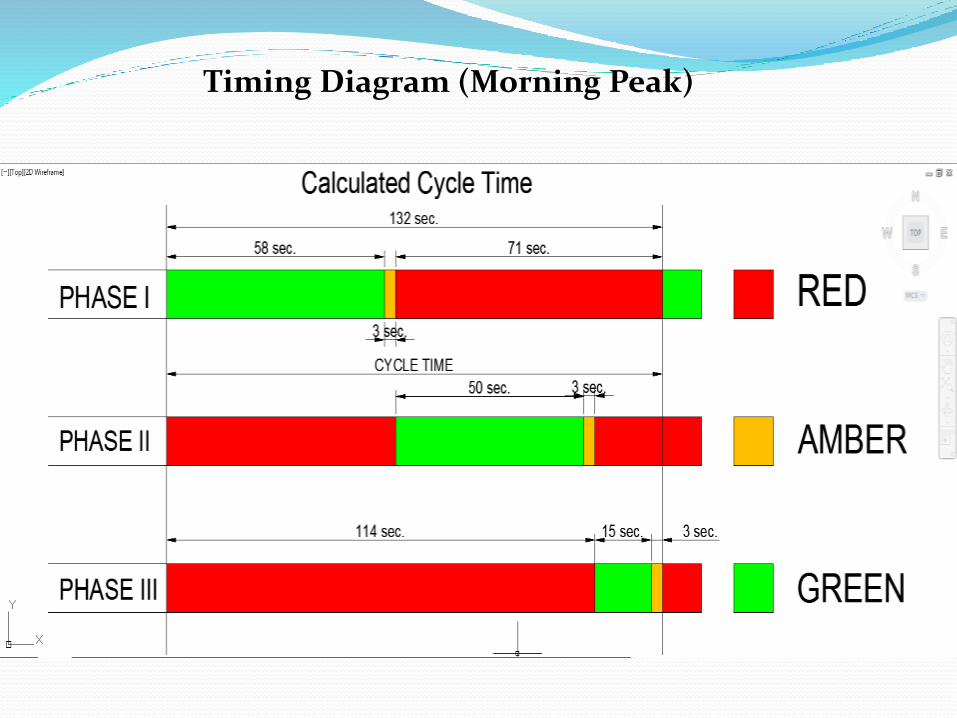
Timing Diagram (Morning Peak)
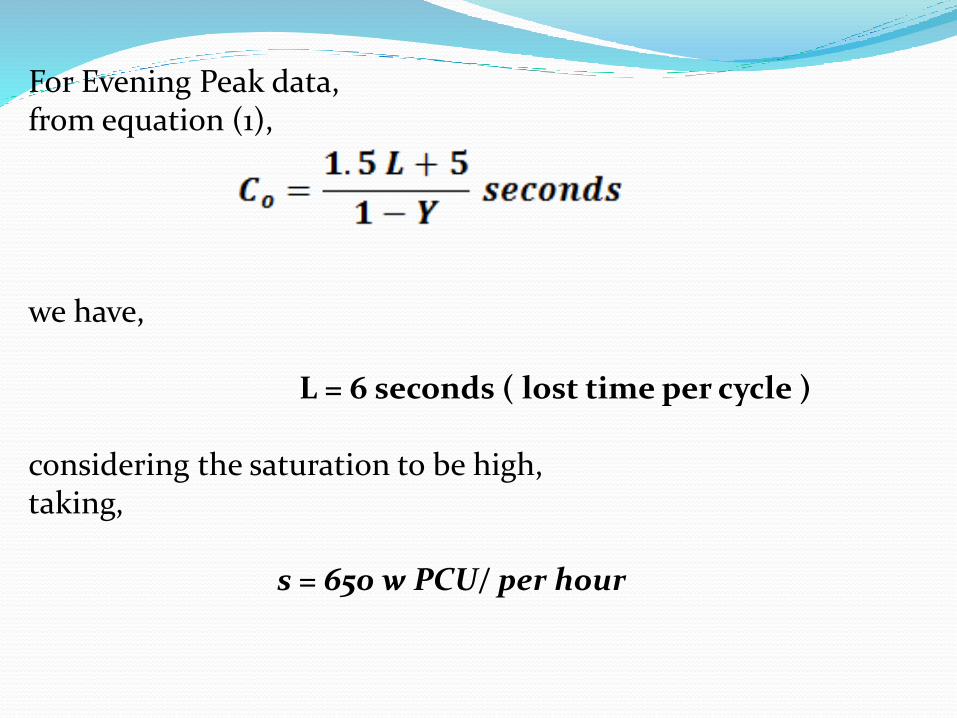
For Evening Peak data,from equation (1),
we have,
L = 6 seconds ( lost time per cycle )
considering the saturation to be high,taking,
s = 650 w PCU/ per hour
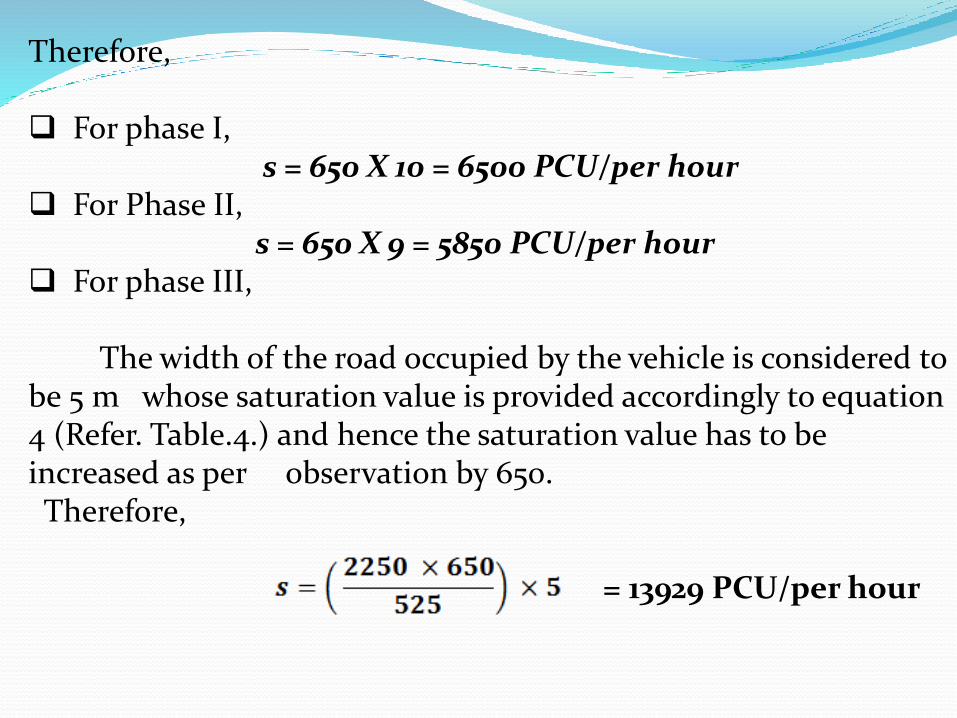
Therefore,
For phase I,s = 650 X 10 = 6500 PCU/per hour
For Phase II,s = 650 X 9 = 5850 PCU/per hour
For phase III,
The width of the road occupied by the vehicle is considered to be 5 m whose saturation value is provided accordingly to equation 4 (Refer. Table.4.) and hence the saturation value has to be increased as per observation by 650.Therefore,
= 13929 PCU/per hour
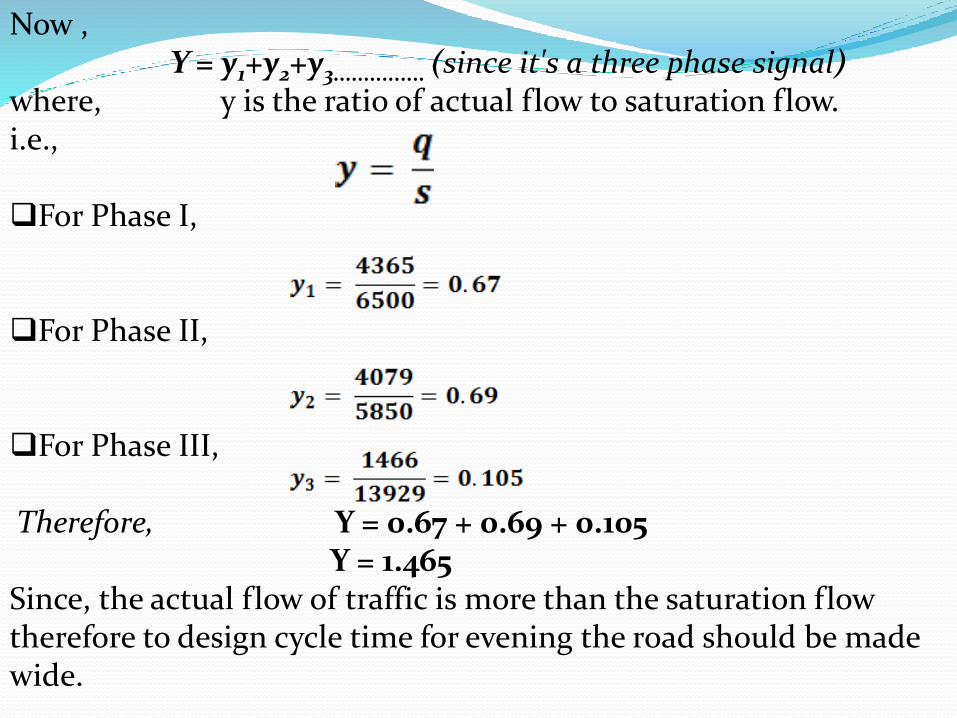
Now , Y = y1+y2+y3............... (since it's a three phase signal)
where, y is the ratio of actual flow to saturation flow.i.e.,
For Phase I,
For Phase II,
For Phase III,
Therefore, Y = 0.67 + 0.69 + 0.105 Y = 1.465
Since, the actual flow of traffic is more than the saturation flow therefore to design cycle time for evening the road should be made wide.
Conclusions
The following are the important and corrections of the study :
The traffic at the study intersection is highly heterogeneouswith a mix of vehicles with wide ranging and dynamiccharacteristics.The current signal timing during the morning peak has a cyclelength of 140 seconds.The present signal timing for the evening peak period has a cyclelength of 148 seconds.The redesign of the signal time for the morning peak has resultedin a cycle time of 132 seconds - 8 seconds less than the fieldobserved time of 140 seconds.The present cycle time for the evening peak results in long queueof vehicles at the traffic takes more one cycle to draw theintersection. Hence, it is necessary to widen the approach to theroad to improve the performance of the signal.
REFERENCES:Liqiang Fan, ( Department of Information and technology ),Langfang Teachers University, China, " Coordinated Control ofTraffic Signals for Multiple Intersections". (Published on 1 June2014)
Tolu Isaac Atomode, Department of Geography, Faculty ofArts and Social Sciences, Federal University Lokoja, P.M.B 1154,Lokoja, Kogi State, Nigeria, Volume 12, Issue 4 (Jul. - Aug. 2013),PP 06-16.
Kazuhiro Tobita, Yuichi Naito, Takashi Nagatani (Department of Mechanical Engineering, Division of ThermalSpace, Shizouka University , Hamamatsu, Japan(2012).(Published on 27 June 2012)

Dr. Santosh A.JALIHAL(Scientist, E-1) , Dr.T.S. Reddy(Director Grade Scientist) , KAYITHA Ravinder (DoctoralStudent) ,Traffic Transportation Planning And EngineeringCentral Road Reaserch Institute , New Delhi , Proceedings of theEastern Asia Society for Transportation Studies, Vol. 5, pp. 1009 -1024, 2005.
Johnnie Ben-Edigbe and Iffazun bt Mohd Ibrahim ,Department of Geotechnic and Transportation, UniversitiTeknologi Malaysia, ISSN 1819-6608, VOL. 5, NO. 1, JANUARY2010
Kishor Bambode, Vishal Gajghate , G. H. Raisoni College ofEngineering, Nagpur (India), (ISSN 2250-2459, ISO 9001:2008Certified Journal, Volume 4, Issue 2, February 2014).
L.R. Kadiyal , Traffic Engineering and Transport Planning, Khanna Publications.