Study of the SA-SC* phase transition by a dielectric method file787 Study of the SA-SC* phase...
13
HAL Id: jpa-00212409 https://hal.archives-ouvertes.fr/jpa-00212409 Submitted on 1 Jan 1990 HAL is a multi-disciplinary open access archive for the deposit and dissemination of sci- entific research documents, whether they are pub- lished or not. The documents may come from teaching and research institutions in France or abroad, or from public or private research centers. L’archive ouverte pluridisciplinaire HAL, est destinée au dépôt et à la diffusion de documents scientifiques de niveau recherche, publiés ou non, émanant des établissements d’enseignement et de recherche français ou étrangers, des laboratoires publics ou privés. Study of the SA-SC* phase transition by a dielectric method C. Legrand, J.P. Parneix To cite this version: C. Legrand, J.P. Parneix. Study of the SA-SC* phase transition by a dielectric method. Journal de Physique, 1990, 51 (8), pp.787-798. <10.1051/jphys:01990005108078700>. <jpa-00212409>
-
Upload
nguyenkiet -
Category
Documents
-
view
216 -
download
0
Transcript of Study of the SA-SC* phase transition by a dielectric method file787 Study of the SA-SC* phase...
HAL Id: jpa-00212409https://hal.archives-ouvertes.fr/jpa-00212409
Submitted on 1 Jan 1990
HAL is a multi-disciplinary open accessarchive for the deposit and dissemination of sci-entific research documents, whether they are pub-lished or not. The documents may come fromteaching and research institutions in France orabroad, or from public or private research centers.
L’archive ouverte pluridisciplinaire HAL, estdestinée au dépôt et à la diffusion de documentsscientifiques de niveau recherche, publiés ou non,émanant des établissements d’enseignement et derecherche français ou étrangers, des laboratoirespublics ou privés.
Study of the SA-SC* phase transition by a dielectricmethod
C. Legrand, J.P. Parneix
To cite this version:C. Legrand, J.P. Parneix. Study of the SA-SC* phase transition by a dielectric method. Journal dePhysique, 1990, 51 (8), pp.787-798. <10.1051/jphys:01990005108078700>. <jpa-00212409>
787
Study of the SA-SC* phase transition by a dielectric method
C. Legrand and J. P. Parneix (*)
Centre Hyperfréquences et Semiconducteurs (**), Bât. P4, Université de Lille-Flandres-Artois,59655 Villeneuve d’Ascq Cedex, France
(Reçu le 3 août 1989, révisé le 5 janvier 1990, accepté le 8 janvier 1990)
Résumé. 2014 L’utilisation d’un dispositif expérimental précédemment publié nous a permis deréaliser l’étude diélectrique à large bande de fréquences d’un cristal liquide ferroélectriqueorienté dans la géométrie planaire (c’est-à-dire axe de l’hélice perpendiculaire au champélectrique de mesure). En plus des mécanismes de relaxation classiques observés dans les cristauxliquides, les données expérimentales montrent l’existence de deux modes de relaxation (mode deGoldstone et mode « mou ») caractéristiques de la transition de phase SA-SC*. L’amplitude et lafréquence critique des mécanismes de relaxation liés à ces deux modes ont été obtenus dans toutela gamme de température étudiée. Dans le cas du mode « mou », ceci a été possible dans la phaseSC* grâce à la forte polarisation du matériau et en superposant au champ électrique de mesure unchamp électrique continu suffisamment élevé pour d6rouler l’hélice. Les résultats expérimentauxsont discutés à l’aide d’un modèle théorique basé sur un développement de type Landau de lavariation de la densité d’énergie libre à la transition SA-SC*. Les principaux désaccords entre lesdonnées expérimentales et les données théoriques sont liés au fait que le modèle théorique neprédit pas l’évolution en température du pas de l’hélice. Des évaluations quantitatives descoefficients de friction ont été déduits de ces mesures diélectriques.
Abstract. 2014 A previously described experimental procedure has been used to perform the largefrequency range dielectric study of a ferroelectric liquid crystal oriented in planar geometry (i.e.helix axis perpendicular to the measurement electric field). In addition to the usual relaxationmechanisms observed in liquid crystals, the experimental data show the existence of tworelaxation modes (Goldstone mode and soft mode) characteristic of the SA-SC* phase transition.The dielectric strength and the critical frequency of the relaxation mechanisms connected withthese two modes were obtained throughout the measurement temperature domain. In the case ofthe soft mode, this was possible in the SC* phase thanks to the high polarization of the sample andthe superimposition on the measurement electric field of a DC electric field high enough tounwind the helix. The experimental data are discussed in terms of a theoretical model based on aLandau-type expansion of the free energy density variation at the SA-SC* phase transition. Themain disagreements between the theoretical and the experimental data are connected with thefact that the theoretical model fails in predicting the temperature dependence of the helix pitch.Quantitative evaluations of the friction coefficients were deduced from the data.
J. Phys. France 51 (1990) 787-798 15 AVRIL 1990,
Classification
Physics Abstracts77.20 - 77.40 2013 77.80
(*) Permanent address : Ecole Nationale Supérieure de Chimie Physique, 351 cours de la Libération,33405 Talence Cedex, France.
(**) U.A. C.N.R.S. 287.
Article published online by EDP Sciences and available at http://dx.doi.org/10.1051/jphys:01990005108078700

788
1. Introduction.
The study of the physical properties of ferroelectric liquid crystals has caused a great amountof interest since the discovery of their potential applications in the field of high speedvisualisation [1]. The characteristic parameters (dielectric strength and critical frequency) ofthe relaxation mechanisms connected with the existence of the SA-Sé phase transition arestrongly dependent on important physical parameters such as the macroscopic polarization,the viscosity of the sample and the helix pitch. The dielectric method is expected to be ofparticular interest in studying this phase transition [2-7]. The experimental data also representa good tool to discuss the validity of theoretical models [8-10]. In this work, we performed alarge frequency range dielectric study of a ferroelectric liquid crystal [11] whose chemicalformulae and phase sequence are given in figure 1. The sample was oriented in planargeometry (i.e. helix axis perpendicular to the measurement electric field) in order to measurethe perpendicular dielectric constant s1. The main interest of this compound for a dielectricstudy is to have a high macroscopic polarization in the St phase (P 50 nCb /cm 2T = Tc - 10 °C).
Fig. 1. - Chemical formulae and phase sequence of the investigated compound.
2. Experimental.
The complex dielectric permittivity (ê * = ê’ - j ê" ) is obtained from the measurement of theimpedance of an experimental dielectric cell filled with the sample to be characterized. Weused a previously described experimental procedure [12].
2.1 IMPEDANCE MEASUREMENTS. - The impedance measurements can be made in thefrequency range 10-1 Hz-109 Hz by using a low frequency system (10-1 Hz-102 Hz) and twoimpedance analyzers (5 Hz-109 Hz). The whole system is automatically driven by a computer.This allows real time analysis of the complex permittivity on a printer or on a plotter and datamay be stored on a floppy disk for further treatments. A DC electric field may be
superimposed on the AC measurement electric field.
2.2 EXPERIMENTAL CELL. - The experimental cell is equivalent to a capacity filled with thesample in the isotropic phase (capillarity filling). The main characteristics of this cell are thefollowing :- in-situ checking of the sample orientation by using a polarizing microscope ;- control of the cell thickness by an electronic calibrating translation stage (0.1 um
resolution).
This has been possible by using glass electrodes coated with transparent conductive I.T.O.(RD - 50 n). The sample is oriented in planar geometry by surface treatments of the two

789
electrodes consisting in P.V.A. coating and rubbing. A microstrip-line is achieved on eachslide by using a technological process to avoid effects on the measured value of orientationdefects and to connect easily the cell with the impedancemeter via a standard SMA connector.The temperature of the cell is maintained constant within 0.05 °C in the temperature range20 °C-200 °C by using an electronic temperature regulation stage, heating resistors and athermal probe fixed on the cell. A possible temperature gradient is reduced with anticalorificfilters. A limiting high frequency appears connected with the conductive coating resistance.This limiting frequency is high enough (= 106 Hz) to observe clearly all the relaxationmechanisms connected with the existence of ferroelectricity. The cell thickness was about75 um to obtain a planar wounded geometry in the Sc* phase. The measurement electric fieldwas chosen as small as possible to slightly perturbe the helix structure in the St phase(E 1.5 mV /J.Lm).
3. Theoretical model.
In this section, the main results of the theoretical model [9, 10] used to discuss our data, arepresented. This model is based on a Landau-type expansion of the free energy densityvariation at the SA-St phase transition. The order parameters are the tilt angle and thespontaneous polarization. The applied electric field is assumed to be uniform, of smallamplitude and parallel to the smectic planes of the sample. The complex dielectric constant isfound to be the sum of the different contributions of the normal modes of the system. Twonormal modes are expected in the SA phase : the « soft mode » and the « hard mode »
connected, respectively, with « in phase » and « out of phase » fluctuations of the orderparameters [8]. These two modes degenerate in four modes in the St phase : the « softmode » of the SA phase degenerate in the Goldstone mode (« in phase » orientationfluctuations of the order parameters) and in the « soft mode » (« in phase » amplitudefluctuations of the order parameters) ; the « hard mode » degenerate in two « out of phase »modes. In the case of a time-dependent electric field, a purely damped regime is assumed forthe normal modes and each mode is translated into the expression of the dielectric constant bya Debye type relaxation mechanism whose characteristic parameters (dielectric strength andrelaxation frequency) are numerically calculated. The dielectric strength of the relaxationmechanisms connected with the « out of phase » modes are found to be much smaller than the« in phase » ones [10]. Then, later in this section we will be concerned only with theGoldstone and the soft modes.The dielectric permittivity as a function of the frequency F reduces to :
where eoo is the dielectric permittivity considered at frequencies much higher than therelaxation frequencies of the ferroelectric relaxation mechanisins and much lower than therelaxation frequencies of the classical dipolar relaxation mechanisms (i.e. rotation around thelong axis of the molecules [13]) ; ( £G, FG ) and (ÈS, Fs) denote the dielectric strength and therelaxation frequencies of the Goldstone and of the soft modes, respectively. The evolution ofthese parameters as a function of the reduced temperature (A/Q2) is given in figures 2 and 3.

790
Fig. 2. - Dielectric strength of the sôft mode and of the Goldstone mode and static permittivity versusreduced temperature A / Q 2.
Fig. 3. - Relaxation frequencies of the soft mode and of the Goldstone mode versus reduced
temperature A/Q2.
Q 2= Kq2/X00 C 2 represent the relative twist to piezo-energy parameter and A is given by :
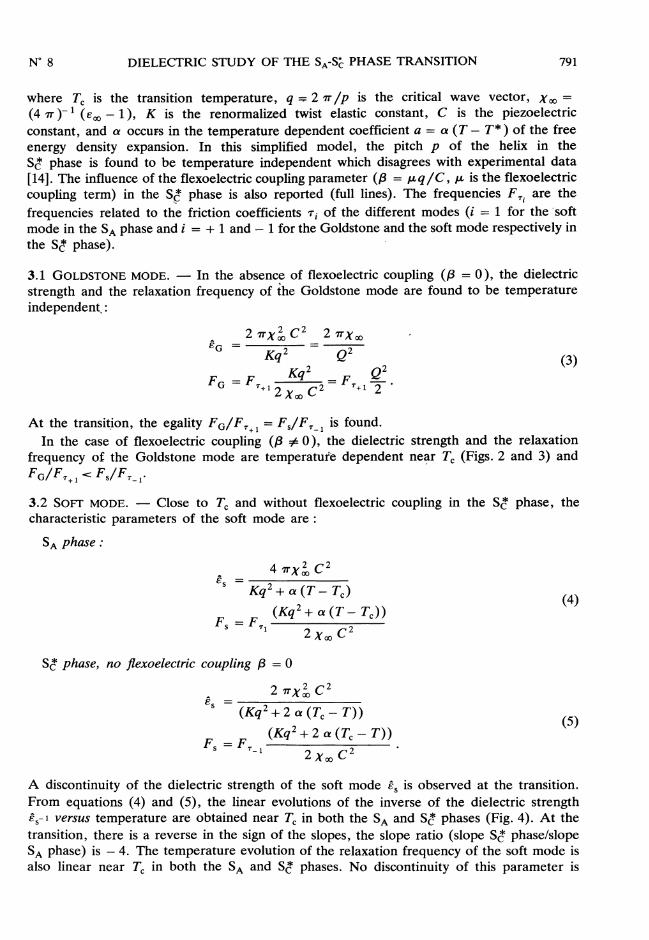
791
where 7c is the transition temperature, q= 2 ir/p is the critical wave vector, Xoo =
(4 -ff )-’ 1 (E 00 - 1), K is the renormalized twist elastic constant, C is the piezoelectricconstant, and a occurs in the temperature dependent coefficient a = a (T - T*) of the freeenergy density expansion. In this simplified model, the pitch p of the helix in the
St phase is found to be temperature independent which disagrees with experimental data[14]. The influence of the flexoelectric coupling parameter (8 = ILq/C,u is the flexoelectriccoupling term) in the S/Î phase is also reported (full lines). The frequencies FTi are thefrequencies related to the friction coefficients ri of the different modes (i = 1 for the ’softmode in the SA phase and i = + 1 and - 1 for the Goldstone and the soft mode respectively inthe St phase).
-
3.1 GOLDSTONE MODE. - In the absence of flexoelectric coupling ({3 = 0), the dielectricstrength and the relaxation frequency of the Goldstone mode are found to be temperatureindependent, :
At the transition, the egality F al F T + 1 = F si F T -1 1 is found.
In the case of flexoelectric coupling (13 #= 0), the dielectric strength and the relaxationfrequency of the Goldstone mode are température dependent near Tc (Figs. 2 and 3) and
FalFT : FslFT .3.2 SOFT MODE. - Close to 7c and without flexoelectric coupling in the St phase, thecharacteristic parameters of the soft mode are :
SA phase :
Sc* phase, no flexoelectric coupling f3 = 0
A discontinuity of the dielectric strength of the soft mode ËS is observed at the transition.From equations (4) and (5), the linear evolutions of the inverse of the dielectric strengthÊs-1 i versus temperature are obtained near T, in both the SA and Sc* phases (Fig. 4). At thetransition, there is a reverse in the sign of the slopes, the slope ratio (slope St phase/slopeSA phase) is - 4. The temperature evolution of the relaxation frequency of the soft mode isalso linear near 7c in both the SA and St phases. No discontinuity of this parameter is
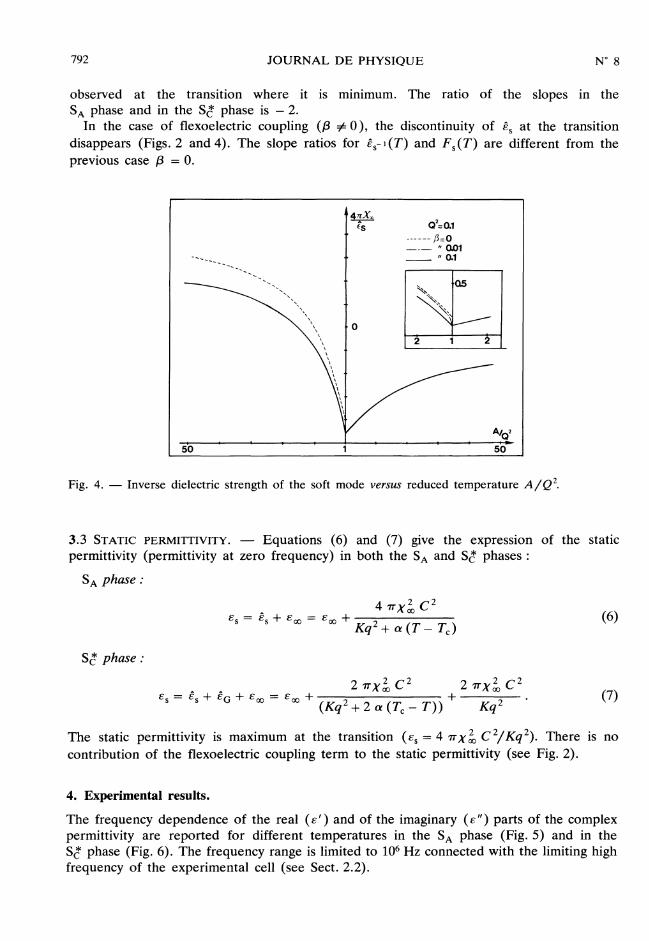
792
observed at the transition where it is minimum. The ratio of the slopes in the
SA phase and in the St phase is - 2.In the case of flexoelectric coupling (0 =F 0), the discontinuity of ÉS at the transition
disappears (Figs. 2 and 4). The slope ratios for Ês-l(T) and Fs(T) are different from theprevious case /3 = 0.
Fig. 4. - Inverse dielectric strength of the soft mode versus reduced temperature A / Q2.
3.3 STATIC PERMITTIVITY. 2013 Equations (6) and (7) give the expression of the static
permittivity (permittivity at zero frequency) in both the SA and SC* phases :
SA phase :
Sc* phase :
The static permittivity is maximum at the transition (£s = 4 -ux 2 c 21K q 2) . There is no
contribution of the flexoelectric coupling term to the static permittivity (see Fig. 2).
4. Experimental results.
The frequency dependence of the real (e’) and of the imaginary ( e") parts of the complexpermittivity are reported for different temperatures in the SA phase (Fig. 5) and in theSt phase (Fig. 6). The frequency range is limited to 106 Hz connected with the limiting highfrequency of the experimental cell (see Sect. 2.2).

793
Fig. 5. - Real part E’ and imaginary part e " of the complex permittivity versus frequency in theSA phase (curve 1 : T - T, = 0.9 °C, 2 : 1.4 °C, 3 : 2.2°C, 4 : 4.4 °C).
Fig. 6. - Real part e’ and imaginary part e" of the complex permittivity versus frequency in theSc* phase (curve 1 : T - Tc = - 0.2 °C, 2 : - 3.5 °C, 3 : - 13.5 °C).
SA phaseIn the SA phase, the data show the existence of one relaxation mechanism whose relaxation
frequency is in the HF range (= 104 Hz ).
St phaseIn the Sc* phase, the HF relaxation mechanism still exists ; a second relaxation process
appears whose relaxation frequency is much lower than the previous one (= 102 Hz). As thetemperature decreases, the dielectric strength of this BF relaxation mechanism increasesstrongly to mask the other one completely. For this reason, the characteristic parameters ofthe HF relaxation process were not obtained in the Sc* phase. The temperature dependence ofthe dielectric strength of the HF relaxation process in the SA phase and of the BF relaxationprocess (in the St phase) are given in figure 7. This parameter was deduced from thedifference between the static and the infinite permittivities (curve E’ (F ) or Cole-Colediagram c"(c’)). An accurate determination of the dielectric strength of the BF relaxationprocess is difficult : near T,, the contributions of the two relaxation mechanisms need to beseparated and, at lower temperatures, the Cole-Cole diagrams were extrapolated because thedielectric spectra are incomplete (for F 10 Hz). In figure 7, we also reported twice themaximum value of the dielectric losses (the value of 8" at the relaxation frequency). Thisparameter represent the dielectric strength only in the case of a Debye-type relaxation processand the difference between the two curves shows that the dielectric spectra are distributed in
794
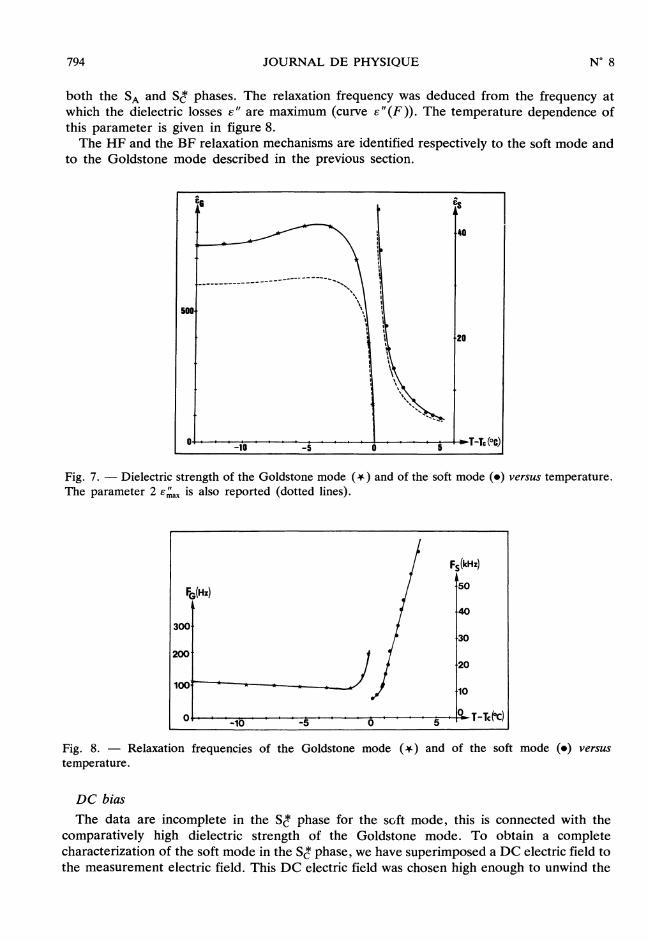
both the SA and St phases. The relaxation frequency was deduced from the frequency atwhich the dielectric losses 6" are maximum (curve 6"(F)). The temperature dependence ofthis parameter is given in figure 8.The HF and the BF relaxation mechanisms are identified respectively to the soft mode and
to the Goldstone mode described in the previous section.
Fig. 7. - Dielectric strength of the Goldstone mode (*) and of the soft mode (e) versus temperature.The parameter 2 e"max is also reported (dotted lines).
Fig. 8. - Relaxation frequencies of the Goldstone mode (*) and of the soft mode (0) versus
temperature.
DC bias
The data are incomplete in the Sé phase for the soft mode, this is connected with the
comparatively high dielectric strength of the Goldstone mode. To obtain a completecharacterization of the soft mode in the Sé phase, we have superimposed a DC electric field tothe measurement electric field. This DC electric field was chosen high enough to unwind the
795
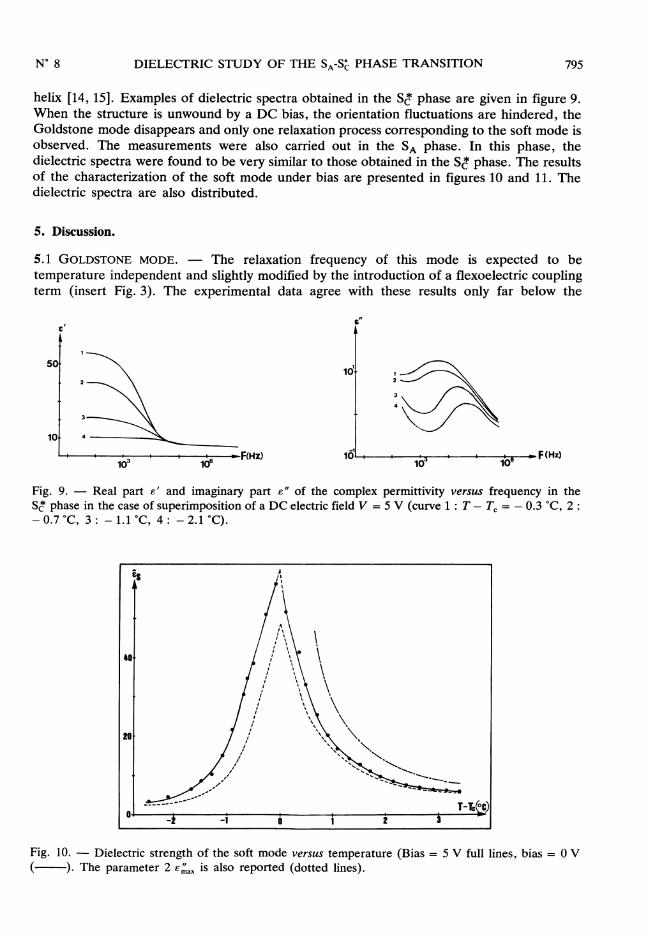
helix [14, 15]. Examples of dielectric spectra obtained in the Sê phase are given in figure 9.When the structure is unwound by a DC bias, the orientation fluctuations are hindered, theGoldstone mode disappears and only one relaxation process corresponding to the soft mode isobserved. The measurements were also carried out in the SA phase. In this phase, thedielectric spectra were found to be very similar to those obtained in the St phase. The resultsof the characterization of the soft mode under bias are presented in figures 10 and 11. Thedielectric spectra are also distributed.
5. Discussion.
5.1 GOLDSTONE MODE. - The relaxation frequency of this mode is expected to be
temperature independent and slightly modified by the introduction of a flexoelectric couplingterm (insert Fig. 3). The experimental data agree with these results only far below the
Fig. 9. - Real part E’ and imaginary part e" of the complex permittivity versus frequency in theSc* phase in the case of superimposition of a DC electric field V = 5 V (curve 1 : T - Tc = - 0.3 °C, 2 :- 0.7 °C, 3 : - 1.1 °C, 4 : - 2.1 °C).
Fig. 10. - Dielectric strength of the soft mode versus temperature (Bias = 5 V full lines, bias = 0 V(201320132013). The parameter 2"emax is also reported (dotted lines).
796
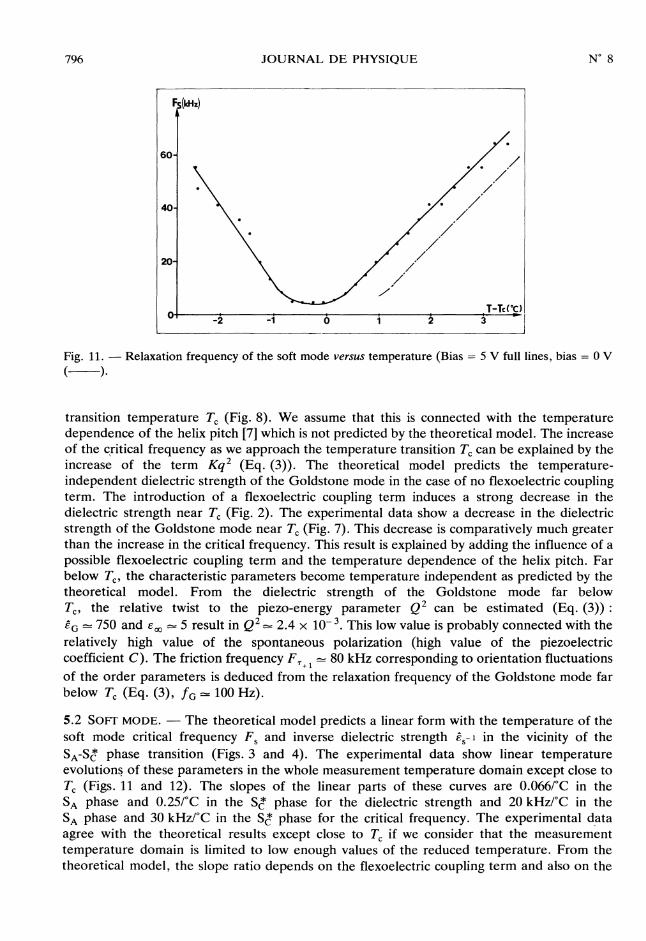
Fig. 11. - Relaxation frequency of the soft mode versus temperature (Bias = 5 V full lines, bias = 0 V(-)
transition temperature Tc (Fig. 8). We assume that this is connected with the temperaturedependence of the helix pitch [7] which is not predicted by the theoretical model. The increaseof the çritical frequency as we approach the temperature transition Tc can be explained by theincrease of the term Kq2 (Eq. (3)). The theoretical model predicts the temperature-independent dielectric strength of the Goldstone mode in the case of no flexoelectric couplingterm. The introduction of a flexoelectric coupling term induces a strong decrease in thedielectric strength near 7c (Fig. 2). The experimental data show a decrease in the dielectricstrength of the Goldstone mode near 7c (Fig. 7). This decrease is comparatively much greaterthan the increase in the critical frequency. This result is explained by adding the influence of apossible flexoelectric coupling term and the temperature dependence of the helix pitch. Farbelow Tc, the characteristic parameters become temperature independent as predicted by thetheoretical model. From the dielectric strength of the Goldstone mode far below
Te, the relative twist to the piezo-energy parameter Q2 can be estimated (Eq. (3)) :êG ~ 750 and £00 = 5 result in Q2 ~ 2.4 x 10- 3. This low value is probably connected with therelatively high value of the spontaneous polarization (high value of the piezoelectriccoefficient C). The friction frequency F T +1 = 80 kHz corresponding to orientation fluctuationsof the order parameters is deduced from the relaxation frequency of the Goldstone mode farbelow Tc (Eq. (3), fG ~ 100 Hz).
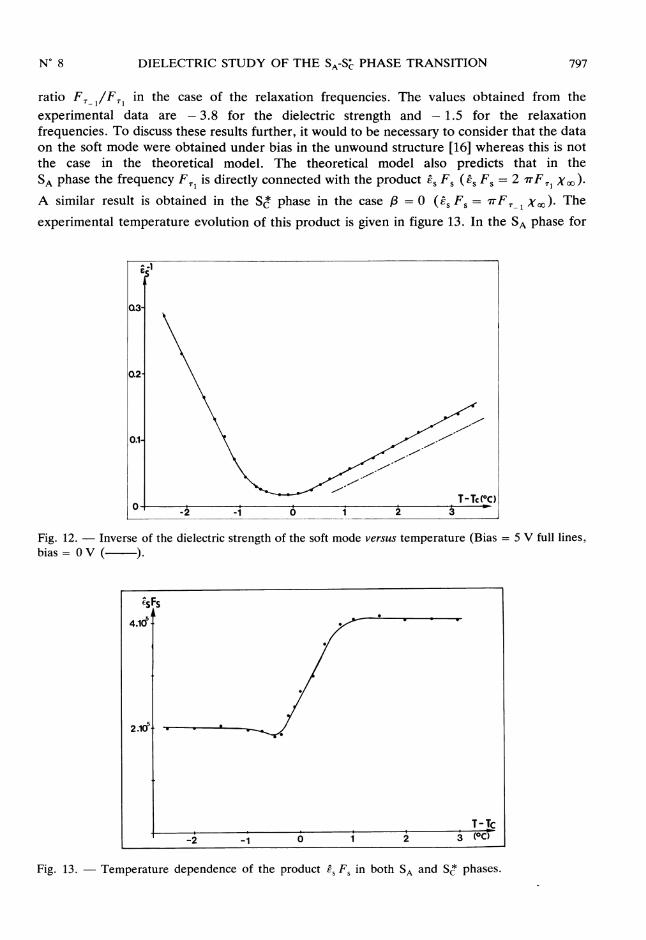
5.2 SOFT MODE. - The theoretical model predicts a linear form with the temperature of thesoft mode critical frequency FS s and inverse dielectric strength ê,- i in the vicinity of theSA-St phase transition (Figs. 3 and 4). The experimental data show linear temperatureévolutions of these parameters in the whole measurement temperature domain except close toTe (Figs. 11 and 12). The slopes of the linear parts of these curves are 0.066/°C in theSA phase and 0.25/°C in the Sc* phase for the dielectric strength and 20 kHz/°C in the
SA phase and 30 kHz/°C in the St phase for the critical frequency. The experimental dataagree with the theoretical results except close to Tc if we consider that the measurement
temperature domain is limited to low enough values of the reduced temperature. From thetheoretical model, the slope ratio depends on the flexoelectric coupling term and also on the
797
ratio F T -II F Tl in the case of the relaxation frequencies. The values obtained from the
experimental data are - 3.8 for the dielectric strength and - 1.5 for the relaxation
frequencies. To discuss these results further, it would to be necessary to consider that the dataon the soft mode were obtained under bias in the unwound structure [16] whereas this is notthe case in the theoretical model. The theoretical model also predicts that in the
SA phase the frequency F Tl is directly connected with the product Ês FS s (Ês F s = 2 TT F Tl X (0).A similar result is obtained in the S* phase in the case 8 = 0 (ÊS FS = TT F T - 1 X (0). Theexperimental temperature evolution of this product is given in figure 13. In the SA phase for
Fig. 12. - Inverse of the dielectric strength of the soft mode versus temperature (Bias = 5 V full lines,bias = 0 V (-).
Fig. 13. - Temperature dependence of the product Ês F in both SA and Sc* phases.

798
T> Zc + 1, this parameter is found to be temperature-independent (Ês Fg = 400 x 103) andthe friction frequency FT1 = 200 kHz far below 7c is deduced fromi the data. In the
Sé phase with the hypothesis of no flexoelectric coupling, we obtain the same valueFT -1 = 200 kHz for T Tc - 1 with Fs = 200 x 103. As expected, this frequency corre-
sponding to amplitude fluctuations of the order parameters is found to be higher than thefrequency F T + 1.
6. Conclusion.
We performed the complete characterization of the Goldstone and of the soft modes of aferroelectric liquid crystal. This was possible for the soft mode in the St phase thanks tosuperimposition to the measurement electric field of a DC electric field high enough tounwind the helix. The experimental data agree with the theoretical model if we consider thatthe model fails in predicting the temperature variation of the helix pitch. On the basis of thismodel, quantitative evaluations of the different friction coefficients were obtained from theexperimental data. The dielectric method seems to be useful to study ferroelectric liquidcrystals and further experiments on other compounds are in progress to complete theseresults.
References
[1] CLARK N. A., LAGERWALL S. T., Appl. Phys. Lett. 36 (1980) 899-901.[2] PARMAR D. S., MARTINOT-LAGARDE P., Ann. Phys. 3 (1978) 275-282.[3] LEVSTIK A., ZEKS B., LEVSTIK I., BLINC R., FILIPIC C., J. Phys. Colloq. France 40 (1979) C3-303.[4] BENGUIGUI L., J. Phys. France 43 (1982) 915-920.[5] GLOGAROVA M., PAVEL J., FOUSEK J., Ferroelectrics 55 (1984) 117-120.[6] LEVSTIK A., CARLSSON T., FILIPIC C., LEVSTIK I., ZEKS B., Phys. Rev. A 35 (1987) 3527-3533.[7] LEGRAND C., PARNEIX J. P., M’KADMI A., TINH N. H., DESTRADE C., SALLENEUVE C., ISAERT
N., Ferroelectrics 84 (1988) 241-248.[8] BLINC R., ZEKS B., Phys. Rev. A 18 (1978) 740-745.[9] MARTINOT-LAGARDE P., DURAND G., J. Phys. Lett. France 41 (1980) L43-45.
[10] MARTINOT-LAGARDE P., DURAND G., J. Phys. France 42 (1981) 269-275.[11] TINH N. H., SALLENEUVE C., DESTRADE C., Ferroelectrics 85 (1988) 435-437.[12] PARNEIX J. P., LEGRAND C., Ferroelectrics 84 (1988) 199-207.[13] NJEUMO N. R., PARNEIX J. P., LEGRAND C., TINH N. H., DESTRADE C., J. Phys. France 47 (1986)
903-908.
[14] In order to obtain a better agreement with the experimental data and also the polarization and theheat capacity, it would be necessary to use an extended model. The following terms are thenadded to the free energy density expansion :
c/6 (03B803B8*)3+ jd/2 (03B803B403B8*/03B4z- 03B8*03B403B8/03B4z)(03B803B8*)-j03A9/4(P03B8* - P* 03B8)2 + ~/4 (PP*)2.
CARLSSON T., ZEKS B., LEVSTIK A., FILIPIC C., LEVSTIK I., BLINC R., Phys. Rev. A 36 (1987)1484-1488.
[15] GLOGAROVA M., Ferroelectrics 84 (1988) 209-221.[16] PAVEL J., GLOGAROVA M., Ferroelectrics 84 (1988) 209-221.[17] GOUDA F., ANDERSSON G., CARLSSON, T., LAGERWALL S. T., SKARP K., STEBLER B., FILIPIC C.,
ZEKS B., LEVSTIK, A., Proceedings of the 12th Int. Liq. Cryst. Conf., Freiburg (August 1988).[18] BLINOV L. M., Electro-optical and magneto-optical properties of liquid crystals (J. Wiley) 1983.