STUDY OF STRUCTURAL AND MAGNETIC CHARACTERISTICS …. thesis.pdf · Study of Structural and...
167
1 STUDY OF STRUCTURAL AND MAGNETIC CHARACTERISTICS OF Cr SUBSTITUTED Fe-BASED NANOCRYSTALLINE ALLOYS (Ph.D. research works have been performed under sandwich program with Uppsala University, Sweden) Ph. D. Thesis By MD. SULTAN MAHMUD DEPARTMENT OF PHYSICS KHULNA UNIVERSITY OF ENGINEERING AND TECHNOLOGY KHULNA-9203, BANGLADESH APRIL-2008
Transcript of STUDY OF STRUCTURAL AND MAGNETIC CHARACTERISTICS …. thesis.pdf · Study of Structural and...

1
STUDY OF STRUCTURAL AND MAGNETIC
CHARACTERISTICS OF Cr SUBSTITUTED
Fe-BASED NANOCRYSTALLINE ALLOYS
(Ph.D. research works have been performed under
sandwich program with Uppsala University, Sweden)
Ph. D. Thesis
By
MD. SULTAN MAHMUD
DEPARTMENT OF PHYSICS
KHULNA UNIVERSITY OF ENGINEERING AND TECHNOLOGY
KHULNA-9203, BANGLADESH APRIL-2008

2
Study of Structural and Magnetic Characteristics of Cr
Substituted Fe-based Nanocrystalline Alloys
BY
MD.SULTAN MAHMUD
Roll No: 0155701 Session: 2001-2002
A THESIS SUBMITED TO THE DEPARTMENT OF PHYSICS, KHULNA UNIVERSITY OF ENGINEERING & TECHNOLOGY, KHULNA-9203 IN PARTIAL FULFILMENT OF THE REQUIREMENT FOR THE DEGREE OF
DOCTOR OF PHILOSOPHY
DEPARTMENT OF PHYSICS
KHULNA UNIVERSITY OF ENGINEERING & TECHNOLOGY KHULNA-9203, BANGLADESH
APRIL-2008

3
DECLARATION
This is to certify that the thesis work entitled as “Study of Structural and Magnetic
Characteristics of Cr Substituted Fe-based Nanocrystalline Alloys” has been carried out in partial fulfillment of the requirement for Ph.D. degree in the department of Physics, Khulna University of Engineering & Technology, Khulna-9203, Bangladesh. The above research work or any part of this work has not been submitted anywhere for the award of any degree or diploma. No other person’s work has been used without due acknowledgement.
1. Supervisor Candidate ---------------------------------- --------------------------------- Prof. Dr. S. S. Sikder (Md. Sultan Mahmud)
2. Joint-Supervisor
--------------------------------------------- Dr. A.K.M. Abdul Hakim
External Examiners:
1. Professor Dr. Per Nordblad
Department of Engineering Sciences Uppsala University, Uppsala, Sweden 2. Professor Dr. G. M. Bhuiyan Department of Physics University of Dhaka

4
AcknowlAcknowlAcknowlAcknowledgementsedgementsedgementsedgements
I have had a lot of help with this thesis work from many individuals in various selfless
ways. I take this opportunity here to express my gratitude.
It is a great pleasure to express my deepest sense of gratitude and sincere appreciation
to my reverend supervisors Dr. S. S. Sikder, Professor of Physics, Khulna University of
Engineering & Technology, Khulna and Dr. A. K. M. Abdul Hakim, Chief Engineer,
Materials Science Division, Atomic Energy Centre, Dhaka for their scholastic
supervision, erudite discussion, invaluable suggestions and constructive guidance
through the progress of this research work. They were always ready to provide a lucid
explanation of the different concepts involved. Their critical reading of the script and
subsequent corrections are much appreciated. Any mistakes that remain are of course
mine.
I am indebted to Dr. M. Ali Asgar,Professor, Rashid Chair (Ex.),BUET, Dr. Md.
Mahbub Alam, Professor, Department of Physics, KUET, Dr. Fouzia Rahman,
Professor, Department of Mathematics, KUET and Dr. Feroz Alam Khan, Professor,
Department of Physics, BUET for their help, suggestion and inspiration.
I am really grateful to the International Programme for Physical Sciences (IPPS),
Uppsala University, Sweden for their financial support and giving me facilities to do my
research works in the Angstrom laboratory, Sweden. My thanks are due to Prof. Peter,
Svedlindh and other researchers, Engineering Physics Department, Angstrom
Laboratory, Uppsala University, Sweden for their sincere help and cooperation for
using SQUID magnetometer for low temperature measurements of my research works.
I would like to thank Prof. Chau, Centre for Materials Science (CMS), Vietnam
National University, Hanoi for his valuable suggestions when I worked in his
laboratory. My special thanks are for Mr. The, Mr. Tho, Mr. Hoa and many other
research fellows of the Vietnam National University for their help for preparing my
samples and also for doing experimental works in their laboratory. I would like to
extend my thanks to Dr. N. H. Dan, Vietnam National Research institute for his help for
performing high temperature measurements with VSM in the laboratory.
I am very much grateful to the Director of Atomic Energy Centre, Dhaka (AECD) for
his kind permission to do experimental works at the laboratory of Materials Science

5
Division, Atomic Energy Centre, Dhaka. My heartiest thanks are for Dr. Dilip Kumar
Saha, Ms.Shireen Akhter, Principal Scientific Officer, Materials Science Division,
Atomic Energy Centre (AEC), Dhaka for their suggestions and encouragement when I
worked in the Materials Science Division’s laboratory.
I am extremely grateful to Ms. Sk. Manjura Hoque, Senior Scientific Officer, Materials
Science Division, (AEC), Dhaka for her tireless help during the experimental work and
preparing the thesis manuscript.
My thanks are also for Mr. Md. Nazrul Islam Khan, Scientific Officer, Materials
Science Division (AEC), Dhaka for his help and support when I was writing my thesis.
I am grateful to Mr. Md. Manjurul Hoque, Ph.D. student and Associate Professor,
Islamic University of Kushtia and Engr. Asit Kumar Gain for their assistance and
interaction at the time of preparing this thesis. I would like to give thanks to Ms.
Alhamra Parveen, Ms. Anjuman Ara Begum, Ms. Nazmunnahar Begum, Mr. Mohsin,
Mr. Mostafizur Rahman, Mr. Ferozur Rahman and Ms. Halima Sadia for their help
during my experimental works at the Materials Science laboratory of AEC.
I would like to extend my special thanks to the Vice-Chancellor, Pro-Vice-Chancellor
and the Registrar, the University of Asia Pacific (UAP), Dhanmondi R/A, Dhaka for
having given me permission and granting me leave to pursue my research at home and
abroad. I am very grateful to my respected teacher Prof. Sadruddin Ahmed Chaudhury,
Vice-Chancellor, Sylhet International University, Sylhet for his blessings and
encouragement to do my research works. My thanks are due to Dr. A.A.Ziauddin
Ahamad, Visiting Professor of Physics, BRAC University, Dhaka for his
encouragement and interest in my research works. I would like to give thanks to Dr.Abu
Hasan Bhuiyan and Dr.Jiban Podder, Professors of Physics, BUET, for their inspiration
in doing my research works. My special thanks are for Prof. Minufar Chaudhury,
Coordinator, Interdepartmental courses, the University of Asia Pacific, Dhanmondi
R/A, Dhaka for her encouragement to finish my research works timely. My thanks are
for my colleagues Mr.Sanjit Kumar Paul, Ms.Tahmina Akhter, Ms. Nafisa Sultana,
Mr.Takad Ahmed Chawdhury and Dr.Dinak Shohani Kabir for their inspiration when I
was doing my research works. I would like to give very special thanks to Dr.Iftekhar
Anam, Associate Professor, Department of Civil Engineering, the University of Asia

6
Pacific for his keen interest and encouragement in my research works. My thanks are
for Mr. Shahriar Anam, Head, Department of Business Administration, UAP for his
inspiration. I would like to thank to Dr.Fayyaz Khan, Head of the Department of
Computer Science & Engineering, UAP for his encouragement in my research work.
My thanks are for Dr. Mir Shamsur Rahman, Head, Department of Law and Human
Rights, UAP for his moral support and encouragement in my thesis works.
Finally I record my sincerest gratitude to Khulna University of Engineering &
Technology, Khulna for providing with the financial assistance during the period of the
research work. My thanks are also for Mr. Abdullah Elias Akhter, Mrs. Jolly Sultana
Md. Kamrul Hasan Reza, Md. Mahbubur Rahman, Assistant Professors, Enamul Hoque
Bhuiyan, Md. Asaduzzaman, Lecturers, Department of Physics, KUET for their moral
support. My thanks are also for Saroat Noor, Mr.Zakir Hossain, Pritish Kumar Roy,
Sumon Kumar Nath, and Siba pada Mondal Research fellows and other staffs of the
Department of Physics, KUET, for their corporation.
My special thanks are for Nandita Boudi and Mrs Mahfuza Hakim, who inspired me a
lot during the period of my research works.
I am very much grateful to my parents, father in law and mother in law for their support
during the period when I was doing research in Sweden and Vietnam.
There are numerous people who could not be mentioned individually but their
interesting discussions have prompted much thought on various aspects, I would also
like to thank them.
I would like to mention the name of my wife Shahnaj Parvin whose constant and
volatile inspiration has inspired me a lot to undergo this thesis work. I posses an
everlasting soft corner for my loving daughter, Faria Mahmud, who has been deprived
of my company during the research period.
Md. Sultan MahmudMd. Sultan MahmudMd. Sultan MahmudMd. Sultan Mahmud

7
To
My Beloved Daughter
Faria Mahmud Nova
8
CONTENTS
Page no.
CHAPTER 1
INTRODUCTION 1
CHAPTER 2
LITERATURE REVIEW 5
2.1 Introduction to Metallic Glass. 5
2.2 Nanocrystalline Soft Magnetic Alloys 7
2.2.1 Introduction 7
2.2.2 Classification of Soft Nanocrystalline Alloys 8
2.2.3 Technical Requirement for Soft Nanocrystalline Alloys 10
2.3 Review of the Properties of Finemet Type of Soft Nanocrystalline Alloys 13
2.3.1 Nanocrystallization of Finemet Type of Soft Magnetic Alloys 13
2.3.2 Effect of Substitution and Addition of Various Elements on
the Properties of Finemet Alloys 17
2.3.3 Low temperature Magnetization of Finemet Alloys 23 2.3.4 Application of Amorphous Magnetic Alloys 24 CHAPTER 3
THEORETICAL ASPECTS 25
3.1 Nature and Formation of Amorphous Alloys 25
3.2 The Glass Transition Temperature 27 3.3 Stability of the Amorphous Phase 29
3.4 Crystallization of the Amorphous State 30
3.5 Theory of Magnetism 33
3.5.1 Introduction to Magnetic Ordering 33
9
3.5.2 Ferromagnetism and Magnetic Domain 34
3.5.3 Random Anisotropy Model (RAM) and Strongly Exchanged Coupled
Nanocrystalline alloys 39
3.5.4 AC Magnetic Response to the Soft Magnetic Materials 42
3.5.5 Temperature Dependence of Magnetization 44
3.6 Initial Permeability of Nanocrystalline Alloys 47
3.6.1 Theories of Permeability 47
CHAPTER 4
EXPERIMENTAL 50
4.1 Sample Preparation
4.1.1 Master alloy preparation 50
4.1.2 Preparation of ribbon by rapid quenching 51
4.1.3 Thermal Treatment of the Amorphous Ribbons
53
4.2 Differential Scanning Calorimetry 53
4.3 X-ray Diffraction 57
4.3.1 Introduction 57
4.3.2 Electromagnetic Radiation 57
4.3.3 Production of X-ray 58
4.3.4 X-ray Diffractometer 59
4.3.5 Determination of Nanometric Grain Size by X-ray Diffraction 63
4.4 Magnetization Measurement Techniques 65
4.4.1 Vibrating Sample Magnetometer (VSM) 65
4.4.2 SQUID magnetometer 68
4.5 Components of Complex Permeability Measurements 72
4.6 Preparation of the samples for complex permeability measurement 75

10
CHAPTER 5
RESULTS AND DISCUSSION 76
5.1 Crystallization behavior of Fe 73.5-xCr xCu1Nb3Si13.5B9 alloys 76 5.1.1 Study of Crystallization Behavior of Amorphous Fe73.5-xCrxCu1Nb3Si13.5B9 Alloys 76
5.1.2 Determination of Crystallization Products and Grain Size 83
5.2 Magnetization Measurements 87
5.2.1 Saturation Magnetization 87
5.2.2 Curie Temperature 90
5.2.3 Temperature Dependence of Magnetization 101
5.2.4 Variation of Magnetization M(0) and Tc with Cr Concentration for the 106 Fe73.5-xCrxCu1Nb3Si13.5B9 Alloys 5.2.5 Field Cooled and Zero Field Cooled Magnetization Behavior of Higher Cr Content Amorphous Alloys 108
5.2.6 Low Temperature Magnetic Behavior of the Amorphous Alloys 111
5.2.7 Variation of Magnetization and Curie temperature with Isothermal 118
Annealing of Higher Cr Content Amorphous Alloys
5.3 Permeability Measurements on Amorphous and Annealed Samples 131 of Fe73.5-xCrxCu1Nb3Si13.5B9 Alloys
CHAPTER 6
CONCLUSION 138
CHAPTER 7
BIBLIOGRAPHY 143

11
LIST OF THE SYMBOLS USEDLIST OF THE SYMBOLS USEDLIST OF THE SYMBOLS USEDLIST OF THE SYMBOLS USED
A Exchange constant
a Lattice constant
ASS Anti scatter slit
ABK Arrot-Belov-Kouvel
Aex Exchange stiffness constant
APFIM Atom prove field ion microscope
B Flux density
B0 Magnetic induction in free space
BMGS Bulk metallic glasses
c Lattice parameter
CMS Centre for materials science
Dg Grain size
d Average diameter
D Spin-wave stiffness constant
Ds Shape dependent demagnetization
DSC Differential scanning calorimetry
DTA Differential thermal analysis
E Activation energy
EXAFS Extended X-ray absorption fine structure
FWHM Full width half maximum
FC Field-cooled
ZFC Zero-field-cooled
GMI Giant magneto impedance
H Magnetic field
Hc Coercivity
H0 Magnetic field in free space
HRTEM High-resolution transmission electron microscope

12
Ha Applied magnetic field
Hi Internal field
Hac AC driving field
H∆ Enthalpy of transition
I X-ray beam intensity
Jij Exchange coupling constant
Jj Average saturation magnetization of the material
k Magnetic hardness parameter
Keff Effective magnetic anisotropy constant
L Self inductance of the sample core
L0 Inductance of the winding coil without sample
Lex Ferromagnetic exchange length
Ms Saturation magnetization
Mr Remanent magnetization
M Magnetization
M(0) Saturation magnetization at 0 K
MPMS Magnetic properties measurement system
MFC Field-cooled magnetization
MZFC Zero-field-cooled magnetization
m Moment
nm nano meter
NM Nobel metal
N Number of planes
Bn Bohr magnetic moment
Bµ Magnetic moment in Bohr magneton
mµ Micrometer
PDS Paramagnetic divergent slit
PRS Paramagnetic receiving slit
Q Quality factor
R Resistance / Gas constant
RF Radio frequency

13
RAM Random anisotropy model
RH Hall coefficient
Rc Critical cooling rate
>< 2r Mean square value of the range of exchange interaction
ar Atomic radius
S Cross sectional area
SRO Short-range order
SQUID Super conducting quantum interference device
SEM Scanning electron microscopy
TE Rarely transition metal
TEM Transmission electron microscope
TMA Thermo magnetic analysis
TTT Temperature, time & transformation
TL Ferromagnetic transition metal
Tc Curie temperature
Ta Annealing temperature
Tg Glass transition temperature
Tx Crystallization temperature
1xT Primary crystallization temperature
2xT Secondary crystallization temperature
0gT Ideal glass transition temperature
Tm Melting point
0t Time constant
t Characteristic time
Top Optimization of annealing temperature
pT Crystallization peak temperature
1pT Primary crystallization peak temperature
2pT Secondary crystallization peak temperature
VSM Vibrating sample magnetometer

14
Vx Volume fraction
XRD X-ray diffraction
X Reactance
Z Complex impedance
λ Wave length
sλ Saturation magnetostriction
µ Permeability
0µ Vacuum magnetic permeability
iµ Initial permeability
µ/ Real part of the complex permeability
µ// Imaginary part of the complex permeability
tanδ Loss factor or loss tangent
wδ Bloch domain wall thickness
/acχ ac susceptibility
iχ Initial susceptibility
ω Frequency
ρ Resistivity
β Heating rate
θ Scattering angle
σ Effective stress
λ Wave length
γ Domain wall energy density
kγ Anisotropy energy per unit area

15
Abstract
This thesis focuses on the experimental investigations of the structural, crystallization
and magnetic behavior of Fe73.5-xCrxCu1Nb3Si13.5B9 (x = 0, 1, 2, 3, 4, 5, 6, 7, 8, 9, 10,
12.5, 15 & 17.5) alloys in the amorphous and annealed states. The samples are initially
prepared in the amorphous state in the form of thin ribbons by rapid-quenching
technique and subsequently annealed. The Characterization of the samples is performed
by X-ray diffraction. The crystallization behavior has been studied by Differential
Scanning Calorimetry (DSC). Magnetic properties have been measured using
Superconducting Quantum Interference Device (SQUID) magnetometer, Vibrating
Sample Magnetometer (VSM), Permagraph and LCR meter.
Fe73.5-xCrxCu1Nb3Si13.5B9 amorphous alloys upon annealing undergoes phase
transformation due to primary crystallization of bcc-Fe(Si) and secondary
crystallization of Fe-B phases respectively revealed by DSC and confirmed by X-ray
diffraction. The primary crystallization temperature shifts to higher temperature with Cr
content implying the enhancement of thermal stability of the amorphous alloys against
crystallization due to increasing amount of Cr. The average grain size of the Fe(Si)
phase decreases under identical annealing condition as the Cr content is increased. The
saturation magnetization and the Curie temperature of the amorphous alloys decrease
linearly with the increase of Cr content for the entire composition range due to dilution
of Fe magnetic moment and weakening of exchange interaction between magnetic
atoms. The critical concentration for the onset of ferromagnetism of the studied system
has been found to be 24±1 at.% Cr by linear extrapolation of saturation magnetization
and Curie temperature to zero as a function of Cr concentration. A decrease of magnetic
moment of 0.055 Bµ and Curie temperature of 26°C per atomic percent of Cr
substitution are determined. Higher Cr content amorphous alloys show magnetic
hardening at low temperature with the manifestation of divergence between field-cooled
and zero field-cooled magnetization, which increases with decreasing temperature as

16
well as with the increase of Cr content. Temperature dependence of magnetization of
the amorphous alloys in the temperature range 8.00 ≤≤cT
T, follow the Bloch’s spin-
wave theory. The spin-wave stiffness constant, D decreases monotonically together with
the Tc with the increase of Cr content having a constant value of 18.0≈cT
D in whole
concentration range .The smaller value of D in the studied system compared with the
crystalline ferromagnet indicates that the range of exchange interaction is shorter in
these amorphous alloys as expected. Magnetization and Curie temperature of
amorphous alloys increase with annealing temperature well below the crystallization
temperature due to irreversible structural relaxation. However the depression of Tc is
observed for the sample annealed at temperature close to the crystallization temperature.
Initial permeability strongly depends on the annealing temperature, which sharply
increases with the nanocrystallization of bcc-Fe(Si) phase. An enhancement of initial
permeability by two orders of magnitude and a subsequent decrease of relative loss
factor /
tan
µ
δ have been observed for the optimum annealed samples. This occurs
because randomly oriented anisotropy is averaged out by exchange interaction between
Fe(Si) nanograins mediated by thin intergranular ferromagnetic amorphous layer.
17
INTRODUCTION
1.1 Introduction
The present state of development of new materials and their understanding on a
smaller and smaller length scale is at the root of progress in many areas of materials
science. As the size reduces into the nanometer range, the materials exhibit peculiar and
interesting physical, chemical, mechanical, magnetic and electrical properties compared
to conventional coarse-grained counterparts [1.1]. This is particularly true in the
development of new magnetic materials for a variety of important technological
application [1.2, 1.3]. Nanomaterials are experiencing a rapid development in recent
years due to their existing and/or potential applications in a wide variety of
technological areas such as electronics, catalysis, ceramics, magnetic data storage,
structural components etc. To meet the technological demands in these areas, the size of
the materials should be reduced to the nanometer scale. For example, the
miniaturization of functional electronic devices like transistor, diodes, inductors and
sensors demand the placement or assembly of nanometer scale components into well-
defined structures [1.4]. This new field based on nanomaterials has been named as
nanotechnology and emerged as a new branch of science and technology, which is quite
diverse and incorporates fields ranging from microelectronics to molecular biology
[1.5]. The nanotechnology has its roots date back to a 1959 talk given by Richard
Feynman (http:/nano.xerox.com/nanotech/feynman.html) in which he said, “The
principles of Physics, as far as I can see, do not speak against the possibility of
maneuvering things atom by atom. It is not an attempt to violate any laws; it is
something in principle, that can be done; but in practice it has not been done because we
are too big”. But with the tremendous advancement of science and technology for the
last two decades the idea that we should be able to economically arrange atoms in most
of the ways permitted by physical law has gained fairly general acceptance. The recent
advances in materials synthesis, characterization techniques and methods of advance

18
measurement facilities on the nanometer scale have greatly assisted the expansion of
nanotechnology.
Nanomaterials can be classified into nanocrystalline materials and nanoparticles. The
former are polycrystalline bulk materials devitrified from the previously synthesized
amorphous precursor through appropriate thermal treatment with grain sizes in the
nanometer range (less than 100 nm) while the later refers to ultra fine dispersive
particles with diameters below 100 nm.
Magnetism is a discipline, which is stimulated by both basic and practical motivations
for the study of different nanostructures. Those nanostructured materials are
distinguished from conventional polycrystalline materials by the size of the crystallites
that compose them. Defined broadly the term nanostructured is used to describe
materials characterized by structural features in the range of ≈ 1-100 nm corresponding
typically to ≈ 50-5×10⁷ atoms respectively.
Nanoparticles are interesting from the fundamental point of view due to their extremely
small size. The increasing surface to volume ratio with decreasing size results in an
increased significance of the grain boundaries (i.e. surface energies) especially in the
“real” nanometer range (≤ 10 nm).
Magnetic nanoparticles show a variety of unusual magnetic behaviors when compared
to the bulk materials mostly due to the surface / interface effects including symmetry
breaking, electronic environment / charge transfer and magnetic interactions.
Nanocomposite / nanocrystalline magnetic materials have been developed through
appropriate heat treatment of the initial amorphous precursors of the Fe-Si-B and Co-Si-
B based alloys for the ultra-soft magnetic properties with extraordinary high
permeability and Fe-Nd-B based alloys for the spring exchange hard magnets with high
energy product. These technically important materials have enormous applications such
as transformers, sensors for the soft and motors, actuators or generators for the hard
nanocomposite magnetic materials have already been envisaged [1.6]

19
There are various methods of preparing nanoparticles and / or nanostructured materials
which include: (i) plasma processing [1.7, 1.8] (ii) deposition technique [1.9, 1.10] and
(iii) rapid quenching and subsequently crystallized to nanometric grains embedded in a
still amorphous matrix [1.11].
In the present thesis work we are dealing with the third variant for the processing of
nanocrystalline magnetic materials. In this method an amorphous precursor in the form
of ribbons typically 20-30 µm thick (metallic glass) is first obtained from the melt of the
parent ingot with appropriate composition using a melt-spinning machine by rapid
solidification technique. Since amorphous state is metastable, upon controlled
crystallization above the crystallization temperature develops nanocrystalline grains
dispersed in a residual amorphous matrix. Magnetic nanocomposites composed of nano-
sized magnetic crystals of 10-15 nm embedded in an amorphous matrix have been
shown to display excellent soft magnetic properties and found their applications in
transformers inductive devices etc. [1.12, 1.13].
Amorphous materials are characterized by a lack of long-range atomic order, similar to
that of liquid state. The lack of crystallinity causes amorphous materials to have a very
low anisotropy based on random anisotropy model [1.14]. The lower anisotropy of the
soft magnetic atoms allows that ferromagnetic exchange length to become larger. This
enables a larger volume to be considered for randomizing anisotropy. In magnetic
materials the ferromagnetic exchange length expresses the characteristic distance over
which a magnetic atom influences its environment and the exchange energy starts to
dominate over the anisotropy energy. This characteristic distance is on the order of 100
nm. Thus if the magnetic materials have microstructure with grain diameters smaller
than the ferromagnetic exchange length, it becomes possible to “average’’ the
anisotropy of the grains to a very low bulk value by random walk consideration. Such a
material then realizes the high saturation magnetization of the crystalline state, low
coercivity and high permeability due to randomized anisotropy. In the case of
nanocrystalline soft magnetic materials with trade name FINEMET obtained from the
careful control of crystallization of their amorphous precursor, it has been determined

20
that an important averaging of the magnetocrystalline anisotropy over many grains with
structural feature 10-15 nm coupled within an exchange length is the root of magnetic
softening [1.12, 1.13]. The fact that the ferromagnetic exchange length of this
nanometric grain is typically ≈ 35 nm, which illustrates the underlying importance of
this length scale in this magnetic system.
The aim of the present work was to study in detail the effect of Cr substitution for an
extended range for Fe in the Fe73.5-xCrxCu1Nb3Si13.5B9 (x = 0, 1, 2, 3, 4, 5, 6, 7, 8, 9, 10,
12.5, 15 & 17.5) alloys on the crystallization behavior, structural and magnetic
properties especially on the low temperature range. Although few reports are available
on the effect of Cr substitution for Fe in a limited range, low temperature magnetization
and higher Cr content Finemet alloys have not been done in much detail. In the present
work a detail study of the low temperature magnetization including the evolution of
magnetic properties of higher Cr content alloys, which are normally paramagnetic in the
as-cast state would be performed.

21
Literature Review
This chapter explains the development of amorphous alloys and some metallic
system termed as metallic glass as well as the properties of metallic glass. It presents in
detail a novel type of material known as Finemet prepared from Fe-Si-B based metallic
glass with the addition of Cu and Nb exhibiting ultrasoft magnetic properties after
partial crystallization. An extensive literature review of the FINEMET type of alloys
with wide range of composition, additions and substitutions with various elements and
their effects on the overall microstructural and magnetic properties is presented here. In
the present thesis the term metallic glass and amorphous alloys will be used
interchangeably.
2.1 Introduction to Metallic glass
Amorphous alloys are interesting because they do not have any long-range
atomic order. As a result these materials have high resistivities, low magnetocrystalline
anisotropy and no microstructural inhomogeneities. The formation of the first metallic
glass of Au75Si25 was reported by Duwez at Caltech, USA, in 1960 [2.1]. They
developed the rapid quenching techniques for chilling metallic liquids at very high rates
of 105-106 K/s. Their work showed that the process of nucleation and growth of
crystalline phase could be kinetically bypassed in some alloy melts to yield a frozen
liquid configuration, that is, metallic glass. The significance of Duwez’s work was that
their method permits large quantities of an alloy to be made into glassy state comparing
to other methods, for instance, vapor condensation. Formation, structure and property
investigations of metallic glasses have attracted increasing attention because of their
fundamental scientific importance and engineering application potential [2.2-2.5]. The
techniques of melt quenching have been extensively developed and elaborated for the
purpose of producing a wide variety of metallic glasses.

22
The research on metallic glasses gained more momentum in the early 1970s and 1980s
when the continuous casting process for commercial manufacture of metallic glasses
ribbons, lines and sheets [2.5] was developed. An expression of academic and industrial
research has resulted in that period. However, the high cooling rate limited the
amorphous alloys geometry to thin sheets and lines, which are unlikely to find wide
applications.
Accordingly, the work of Turnbull and Coworker had made crucial contribution to the
discipline. They illustrated the similarities between metallic glasses and other non-
metallic glasses such as silicates, ceramic glasses and polymers. It was shown in their
work that, a glass transition manifested in conventional glass-forming melts could also
be observed in rapid quenched metallic glasses [2.6, 2.7]. The glass transition was
found to occur at a rather well defined temperature, which varied only slightly as the
heating rate was changed [2.8]. Turnbull predicted that a ratio, referred to as the
reduced glass transition temperature m
g
rgT
TT = , of the glass transition temperature Tg to
the melting point, or liquidus temperature Tm of alloy, can be used as a criterion for
determining the glass forming ability (GFA) of an alloy [2.9]. According to Turnbull’s
criterion [2.10], a liquid with 3
2=
m
g
T
T becomes very sluggish in crystallization within
laboratory time scale and can only crystallize within a very narrow temperature range.
Such liquid can thus be easily undercooled at a low cooling rate into the glassy state. Up
to now, the Turnbull criterion for the suppression of crystallization in undercooled melts
remains one of the best “rule of thumb” for producing the GFA of any liquid [2.11]. It
has played a key role in the development of various metallic glasses including bulk
metallic glasses (BMGS) [2.12].
There is no doubt that metallic glasses (amorphous metallic alloys), discovered in the
1970s, are arguably the most important development in magnetic materials in that
decade. Besides the significant contribution to the technological progress, which has
been made by metallic glasses, they have also widened the knowledge of basic
magnetism [2.13].

23
2.2 Nanocrystalline Soft Magnetic Alloys
2.2.1 Introduction
The present thesis focuses on the detail study of magnetic properties of
nanocrystalline alloys of composition Fe73.5-xCrxCu1Nb3Si13.5B9 prepared from Fe-Si-B
based alloy with addition and substitution of Cu, Nb and Cr respectively. The
development of Fe-Si-B soft magnetic metallic glasses made it possible to discover in
the late 1980s a new class of magnetic materials termed as nanocrystalline soft magnets
having excellent soft magnetic properties. In 1988 Yoshizawa et al. [2.14] discovered
that excellent soft magnetic properties are obtained when the grain size is reduced to a
nanometer scale by crystallizing Fe-Si-B-Cu-Nb amorphous alloys. The alloy
composition originally proposed and subsequently has extensively been studied is
Fe73.5Cu1Nb3Si13.5B9 with the trade name FINEMET. The alloy has been developed by
Hitachi Metals Company, Japan. The enormous interest in this novel material is driven
due to promising technological applications as well as for studying basic magnetic
phenomena. The proposed alloy by Yoshizawa is a typical Fe-Si-B metallic glass
composition with the addition of Cu and Nb. It has been subsequently demonstrated that
the composition Fe-Cu-M-Si-B (M = Cr, V, Mo, Ta, Nb & W) where M elements can
be substituted with group V and VI metals for effective improvement of soft magnetic
properties [2.15]. These alloys are rapidly quenched from the liquid state into ribbons of
20-30 µm thickness and solidify in the amorphous state. An appropriate heat treatment
(annealing) at temperature range of 500oC and 600oC produces a homogeneous ultrafine
grain structure of bcc-Fe(Si) with grain sizes of Dg = 10-15 nm embedded in the
residual amorphous matrix. The formation of the nanocrystalline microstructure is
ascribed to the combined addition of Cu and Nb and their low solubility in bcc-Fe(Si).
Copper is thought to enhance the nucleation of bcc grains while Nb act as grain refiner.
Nb that segregates to the grain boundaries acts as a diffusion barrier preventing grain
growth. Thus Cu and Nb play an important role in nanocrystallization process in these
alloys through nucleation and growth mechanism [2.16]. The best soft magnetic
properties i.e. low coercivity and high permeability are achieved when grain sizes are
between 10-12 nm [2.16-2.18].

24
2.2.2 Classification of Soft Nanocrystalline Alloys
Choice of soft magnetic materials for applications has been guided by recent
developments in the field of soft magnetic materials. Amorphous and nanocrystalline
magnetic materials, in terms of combined induction and permeabilities are now
competitive with Fe-Si bulk alloys and the Fe-Co alloys. In Fig.2.1 [2.19], figures of
merit for Fe-based amorphous alloys, Co-based amorphous alloys and nanocrystalline
alloys are summarized. Co-based amorphous alloys, Fe-based amorphous alloys and
nanocrystalline alloys have evolved over the past decades with soft magnetic properties
which now exceed those of the bulk alloys based on Fe, Co and Fe-Co.
Fig. 2.1 Phase diagram of various types of materials
Nanocrystalline alloys can be described in general as xx NMMTETL )(1 −−− , where TL
denotes a late (ferromagnetic) transition metal element, TE is an rarely transition metal
element, M is a metalloid, and NM is a noble metal. This composition usually has x <
0.20 i.e. with as much late ferromagnetic transition metals (TL of Co, Ni, or Fe) as
possible. The remaining early transition metals (TE = Zr, Nb, Hf, Ta, etc.) and

25
metalloids (M = B, P, Si etc.) are added to promote glass formation in the precursor.
The noble metal elements (NM = Cu, Ag, Au, etc.) serve as nucleating agents for the
ferromagnetic nanocrystalline phase. The compositions are limited by where glass
formation can occur prior to the naocrystallization route. These alloys may be single
phase (Type1) but are generally two-phase materials with a nanocrystalline
ferromagnetic phase and a residual amorphous phase at the grain boundaries (Type II).
The Type II nanocrystalline alloys might have general properties (i) relatively high
resistivity (50-80 µΩ cm) (ii) low magnetocrystalline anisotropy (iii) increased
mechanical strength. With properties such as these, nanocrystalline alloys have great
potential as soft magnetic materials.
Nanocrystalline Fe-Si-B-Nb-Cu alloys have been patented under trade name Finemet
and have been mentioned above and will continue in the rest of the thesis.
In 1990 Suzuki et al. [2.20] reported the development of the Fe88Zr7B4Cu1 alloy, which
was named NANOPERMTM. Zr and B act as glass forming agents in this alloy and the
microstructure consists of α-Fe grains embedded in an amorphous matrix. By
eliminating Si, higher saturation induction is achieved than FINEMET, but the Hc are
also higher. The amorphous intergranular phase in both FINEMET and NANOPERM
has Curie temperatures lower than that of the nanocrystalline grains.
In 1998 Willard et al. [2.21] reported the development of HITPERM, an alloy based on
the composition Fe44Co44Zr7B4Cu1. The key distinction is the substitution of Co for Fe.
HITPERM forms α-FeCo grains in a Co enriched amorphous matrix has a Curie
temperature higher than the primary crystallization temperature of the alloy. This allows
the α-FeCo grains to remain exchange coupled at high operating temperatures. Due to
the presence of Co, HITPERM alloy has an Ms higher than FINEMET or NANOPERM
as well as a higher Hc.

26
2.2.3 Technical Requirement for Soft Nanocrystalline Alloys
Magnetic hysteresis is a useful attribute of permanent magnet material in which
we wish to store a large metastable magnetization. On the other hand, a large class of
applications requires small hysteresis losses per cycle.
Fig.2.2(a) Hysteresis curve for a soft Fig.2.2 (b) Grain size (D) vs. coercivity (Hc ) curve
Magnetic materials
These include applications as inductors, low and high frequency transformers,
alternating current machines, motors, generators and magnetic amplifiers. The desired
technical properties of interest for soft magnetic materials include [Fig. 2.1(a)].
(i) High permeability: Permeability: ( )χµ +== 1H
B, is the material’s
parameter which describes the flux density (B), produced by a given applied field (H).

27
In high permeability materials, we can produce very large changes in magnetic flux
density in very small fields.
(ii) Low hysteresis loss: Hysteresis loss is the energy consumed in cycling a
material between a field H and –H and then back again. The energy consumed in one
cycle is MdBWh φ= or the area inside the hysteresis loop. The power loss of AC device
includes a term equal to the frequency multiplied by the hysteretic loss per cycle. Also
of concern at high frequencies are eddy current losses that are intimately related to the
material’s resistivity (ρ).
(iii) Large saturation and remanant magnetizations: A large saturation
magnetization (Ms), induction (Bs) and small remanant magnetization (Mr) are desirable
in applications of soft magnetic materials.
(iv) High Curie temperature: The ability to use soft magnetic materials at
elevated temperatures is intimately dependent on the Curie temperature or magnetic
ordering temperature of the material.
Conventional physical metallurgy approaches to improving soft ferromagnetic
properties involve tailoring the chemistry and optimizing the microstructure. Significant
in the optimizing of the microstructure is recognition of the fact that a measure of the
magnetic hardness (coercivity, Hc) is roughly inversely proportional to the grain size
(Dg) for grain sizes exceeding ~ 0.1-1 µm (where the grain size exceeds the Bloch
domain wall thickness ( wδ ). In such cases grain boundaries act as impediments to
domain wall motion, and thus fine-grained materials are usually magnetically harder
than large grain materials. Significant recent developments in the understanding of
magnetic coercivity mechanisms have lead to the realization that for very small grain
sizes D < ~100 nm [2.17, 2.18, 2.22-2.25], Hc decreases rapidly with decreasing grain
size shown in Fig. 2.2 (b). This can be understood by the fact that the domain wall,
whose thickness δw, exceeds the grain size, now samples several (or many) grains so
that fluctuations in magnetic anisotropy on the grain size length scale are irrelevant to
domain wall pinning. This important concept suggests that nanocrystalline and
amorphous alloys have significant potential as soft magnetic materials. Soft magnetic
properties require that nanocrystalline grains be exchange coupled and therefore any of

28
the processing routes yielding free standing nanoparticles must include a compaction
method [2.28-2.30] in which the magnetic nanoparticles end up exchange coupled.
Similar ideas have been stated for so called spring exchange hard magnetic materials
[2.26-2.28].
The issues, which are pertinent to the general understanding of the magnetic properties
of amorphous and nanocrystalline materials, are explored here along with the recent
developments. The development of soft magnetic materials for applications requires
attention to a variety of intrinsic magnetic properties (some of them ancillary) as well as
development of extrinsic magnetic properties through an appropriate optimization of the
microstructure. As intrinsic properties we take to mean microstructure insensitive
properties. Among the fundamental intrinsic properties (which depend on alloy
chemistry and crystal structure) the saturation magnetization, Curie temperature,
magnetocrystalline anisotropy and the magnetostrictive coefficients are all important. In
a broader sense, magnetic anisotropy and magnetostriction can be considered as
extrinsic in that for a two–phase material (in aggregate) they depend on the
microstructure. The desire for large magnetic inductions typically limits choices to
alloys of Fe and Co (the elemental transition metal magnets with the largest atomic
dipole moments). Curie temperatures are also largest for elemental Fe (770°C) and Co
(1100°C), suggesting the use of Fe or Co (or Fe-Co) alloys especially in high
temperature applications. Magnetocrystalline anisotropy and magnetostriction, which
are determining factors in the ease in which the magnetization vector can be rotated into
the direction of the applied field, are also sensitivity dependent on alloy chemistry.
Many important soft magnetic alloy systems have zero crossings of the
magnetocrystalline anisotropy, or magnetostriction coefficients, which can be exploited
in the development of soft magnetic materials. The development of advanced and newer
magnetic materials with enhanced properties is closely related to the fundamental
understanding and exploitation of influence of microstructures on the extrinsic magnetic
properties.

29
Important microstructural features include grain size, shape and orientation, defect
concentrations, compositional inhomogeneitics, magnetic domains and domain walls.
The interaction of magnetic domain walls with microstructural impediments to their
motion is of particular importance to the understanding of soft magnetic properties.
Extrinsic magnetic properties, which are important in soft magnetic materials, include
the magnetic permeability and the coercivity, which typically have an inverse
relationship. Remanant magnetization, squarness of the hysteresis loop and magnetic
anisotropy (crystalline, shape or stress related) are also important in determining
magnetic softness.
2.3 Review of the Properties of Finemet Type of Soft Nanocrystalline
Alloys
2.3.1 Nanocrystallization of Finemet Type of Soft Magnetic Alloys
The crystallization of amorphous solids into nano-meter sized polycrystalline phases
generally less than 100 nm is referred as nanocrystallization. Synthesis of nano-
crystalline materials can be done by variety of techniques such as rapid solidification
from the liquid state and subsequent controlled crystallization, mechanical alloying,
plasma processing and vapor deposition [2.29]. But the microstructure necessary for the
soft magnetic properties cannot be obtained by the later two processes mentioned above
[2.30-2.31]. It has been established that controlled crystallization of the amorphous
alloys in the form of thin ribbons prepared by rapid solidification technique using melt-
spinning machine appeared to be the most suitable method available until now to
synthesize nanocrystalline alloys with attractive soft magnetic properties. The basic
principle for the crystallization method from amorphous solids is to control the
crystallization kinetics by optimizing the heat treatment conditions such as annealing
temperature and time, heating rate, etc. so that the amorphous phase crystallizes
completely into a polycrystalline material with ultra-fine crystallites.
Nanocrystallization can be realized upon either isothermal or anisothermal annealing in
various amorphous metallic alloys in the form of ribbons. Controlled crystallization of
FINEMET type of Fe-Cu-Nb-Si-B alloys can be used to obtain partially crystallized
materials with nano-meter size crystallites embedded in residual amorphous matrix.
This special nano-crystal / amorphous composite structure with appropriate
30
compositions allow the material to exhibit extraordinary soft magnetic properties [2.14-
2.18]. FINEMET alloys crystallized at temperatures above their primary crystallization
temperature but below the secondary crystallization temperature can yield
nanocrystalline grains with average grain size 10-50 nm as a result of primary
crystallization of α-Fe(Si) phase embedded in a still remaining amorphous matrix. The
excellent soft magnetic properties only occur when the grain size of the primary
crystallization product of α-Fe(Si) is limited to 10-15 nm. Also the secondary
crystallization phase like Fe-B should be completely avoided. This is to note that to
obtain an appropriate nanoscale microstructure necessitates very high nucleation rate
and very slow growth of the crystalline precipitates simultaneously. It has long been
established that when the conventional metallic glasses based on Fe-Si-B are
crystallized for the optimization of soft magnetic properties, it has been found that
relatively coarse grain microstructure having various crystalline phases have been
evolved that dramatically deteriorated the soft magnetic properties. Therefore, in the
FINEMET composition Fe-Cu-Nb-Si-B, the important role of Cu and Nb in the
formation of nanometric grain size of 10-15 nm is well understood. It has been
established that Cu acts as nucleating agent for the nanograins formation while Nb acts
as retarding agent for the growth of nanograins. Nb also inhibits the formation of
detrimental intermetallic phase like Fe-B. This iron-boride phase is the product of
secondary crystallization generally takes place at relatively higher temperature that
deteriorates soft magnetic properties drastically.
The nanocrystalline state is achieved by annealing Finemet alloys at temperatures
typically between about 5000C and 5800C, which leads to primary crystallization of bcc
Fe. The resulting microstructure is characterized by randomly oriented, ultrafine grains
of bcc Fe-Si (20 at.%) with typical grain sizes of 10-15 nm embedded in a residual
amorphous matrix which occupies about 20-30% of the volume and separates the
crystallites at a distance of about 1-2 nm. These features are the basis for the excellent
soft magnetic properties indicated by the high values of the initial permeability of about
105 and corresponding low coercivities of less than 1 A/m.

31
Fig.2.3 Microstructure of different phases of nanocrystalline alloys
A characteristic feature is that the nanocrystalline microstructure and accompanying
soft magnetic properties are rather insensitive to the precise annealing conditions within
a wide range of annealing temperatures, Ta, about ∆Ta ≈ 50-1000C. They develop in a
relatively short period of time (about 10-15 min) and does not much alter even after
prolonged heat treatment of several hours [2.32]. A typical heat treatment like 1h at
5400C in most cases yields a nanocrystalline microstructure close to the quasi-
equilibrium state
Only annealing at more elevated temperatures above about 6000C leads to the
precipitation of small fractions of boride compounds like Fe2B or Fe3B with typical
dimensions of 50 nm to 100 nm, while the ultrafine grain structure of b.c.c Fe-Si still
persists. Further increases of the annealing temperature above about 7000C, finally

32
yields grain coarsening. Both the formation of Fe borides and grain coarsening
deteriorates the soft magnetic properties significantly. The evolution of microstructure
during annealing is depicted schematically in Fig.2.3 and summarized as follows
according to Hono et.al [2.33, 2.34].
In the as-quenched state the alloy Fe73.5Cu1Nb3Si13.5B9 has been found both structurally
and chemically homogeneous amorphous solid solution as confirmed by the combined
use of atom probe field ion microscope (APFIM) and high-resolution transmission
electron microscope (HRTEM). At the initial stage of the annealing, Cu rich clusters are
formed by either a spinodal process or nucleation in the amorphous state. Each cluster
formation causes a concentration fluctuation of iron also, since Cu substitutes for iron.
Because of this concentration fluctuation, the density for the nuclei of the bcc
crystalline phase is increased significantly although the evidence of concentration
fluctuation in the fully amorphous state has not been observed because the investigators
[2.34] observed the Cu clusters and bcc phase simultaneously at the early stage of the
nanocrystallization. Annealing slightly at higher temperature at the initial stage of
crystallization α–Fe(Si) phase forms. At this stage Nb and B are excluded from α–
Fe(Si) and are enriched in the remaining amorphous phase, because they are insoluble
in the α–Fe(Si) phase. This happens when the annealing treatment is carried out at
around 550°C when Cu clusters are formed with a few nanometer diameters. Thus the
regions in between the Cu rich clusters provide a significantly increased density of
nucleation sites for the crystallization of bcc Fe. The consequence is an extremely fine
nucleation of bcc Fe-Si crystallites at a high rate, which subsequently grow in a
diffusion-controlled process as the annealing proceeds further [2.35]. As annealing goes
on the grain size of the α–Fe(Si) increases. At the same time the Si content of this phase
keeps increasing since Si tends to be partitioned to the bcc α–Fe(Si) phase. Since the Nb
and B enrichment in the amorphous phase stabilizes the remaining the amorphous
phase, the grain growth of the bcc phase eventually stops. The presence of Nb at the
same time inhibits the formation of Fe-B compounds. The Cu concentration of the
clusters also increases as the crystallization proceeds. They will go to around 5 nm and
the concentration of Cu increases to 60 at.%. This phase should eventually loose

33
ferromagnetism at room temperature and becomes the paramagnetic phase. However,
since the size is too small compared to the domain wall width, the precipitation of such
a paramagnetic phase does not adversely affect the soft magnetic properties.
At the optimum stage, three distinct phases are present based on the chemical
compositions. One phase is the Fe-Si bcc solid solution containing approximately 20
at.% Si with virtually no Nb and Cu partitioning with average grain size 10-15 nm. A
few percent of B is, however contained in this phase. The second phase is the residual
amorphous phase containing approximately 10-15 at.% of Nb and B. In this amorphous
phase, approximately 5 at.% of Si is partitioned but virtually no Cu is contained. The
third phase is significantly enriched in Cu (~ 60 at.%) with less than 5 at.% of each Si,
B and Nb. As a result, the content of Fe in this phase is only 30 at.%. The size of this
Cu rich particle is approximately 5 nm.
2.3.2 Effect of Substitution and Addition of Various Elements on the
Properties of Finemet Alloys
It has been well established by the time through extensive research work that the
addition of Cu and Nb simultaneously with Fe-Si-B based amorphous alloys is the
necessary condition for the extraordinary soft magnetic properties of the Finemet alloy.
This addition extends the temperature range between the primary crystallization α-
Fe(Si) temperature, Tx1 and secondary crystallization Fe-B temperature Tx2 premiere for
achieving superior magnetic properties [2.36]. It should be stressed again that good soft
magnetic properties require not only a small grain size but at the same time the absence
of boron compounds. The separation between the primary crystallization of bcc Fe and
the precipitation of Fe-B compounds not only is determined by the Cu and Nb additions
but, decrease with increasing boron content. This puts a further constraint on the alloy
composition namely that the boron content should be kept at a low or moderate level in
order to obtain an optimum nanoscaled structure.

34
In summary, the behavior of the onset of crystallization temperature and composition
shows that a basic condition for the formation of typical nanocrystalline structure is
given by a primary crystallization process before stable or meta-stable intermetallic
phases are formed. Obviously, this can be attained by (i) alloying additions which lead
clearly separated stages of crystallization at Tx1 and Tx2 and (ii) by annealing at Tx1 < Ta
< Tx2 such that only the phase forming at and above Tx1 is crystallizing. Murillo et al.
[2.37] studied the influence of Cu/Nb content and annealing conditions on the
microstructure and the magnetic properties of FINEMET alloys. Grain size, phase
composition and transition temperatures were observed to depend on the ratio of Cu/Nb
content. The magnetic properties are strongly correlated to the microstructural features.
Numerous research works have been carried out to improve the properties of
Fe73.5Cu1Nb3Si13.5B9 FINEMET alloy by investigating the effects of substitution and
addition of various elements.
Kwapulinski et al.[2.38] have studied the effect of Cr, Mo, Zr substituted for Nb of Fe-
Cu-X-Si13B9 (X = Cr, Mo & Zr) amorphous alloys on the optimization of annealing
temperature (Top,) corresponding to the maximum permeability and found that it varies
linearly with the atomic radius (ra,) of the substituted elements in the order of Top = Zr >
Mo > Cr. This result to a certain extent reflects the dependence of the crystallization
temperature (Tx) on the atomic radius [2.39]. Niobium can be substituted by other group
V or VI refractory elements, like Cr, V, Mo, W or Ta which act similarly on the
crystallization process and on the magnetic properties [2.15]. Like for Nb, the atomic
volumes of these refractory elements are larger than that of Fe, which reduces the
diffusion coefficients and, thus stabilizes the amorphous matrix and slows down the
kinetics of grain coarsening [2.40]. Accordingly the efficiency of these elements for
grain size refinement increases in the order of their atomic volumes, i.e., Cr < V < Mo
≈ W < Nb ≈ Ta. Thus, finest grain structures and superior magnetic properties in
practice require at least a certain amount of the elements Nb or Ta.
Zhi et al. [2.41] studied the influence of the silicon and boron contents on the structure
and magnetic properties of Fe73.5Cu1Nb3SixB22.5-x (at. %) nanocrystalline alloys, with x
= 9.5-17.5. The results show that the lattice constants and Curie temperatures of the

35
nanocrystalline alloys decreases linearly with increasing x. The saturation
magnetostriction ( sλ ), values of the alloys decrease with increasing Si content for the
nanocrystalline state, but increase for the as-quenched state. For the alloys annealed at a
certain temperature, the volume fraction (Vx) of nanoscale grains is related to the Si and
B contents of the alloys. Vx increases with increasing x as well as decreasing B content.
Within the range of compositions studied, the nanocrystalline alloy has the optimum
soft magnetic properties when x = 14.
The saturation magnetization in the Fe74.5Cu1Nb3SixB22.5-x (at.%) system indeed
increases up to about 1.6T if boron is substituted for silicon. However, this benefit is
accompanied by a severe degradation of the soft magnetic properties due to high boron
content, which favors the formation of boron compounds that deteriorate the soft
magnetic properties. Therefore boron content is kept at a moderate level below 10 at.%.
However, a corresponding reduction of the boron content at low Si contents, for the
sake of glass forming ability, is only possible if other good glass forming elements are
added simultaneously. Such elements, which extend the glass forming range at low Si
and B elements, are group IVa to VIa transition metals [2.42]. The glass forming range
is the widest for Hf containing alloys and decreases in the order of Zr > Nb ≈ Ta > Mo
≈ W > V > Cr. The most stable amorphous phase is, thus, obtained in alloys containing
refractory metals with large atoms and low d-electron concentrations, i.e., particularly
Zr, Hf, Nb & Ta. The effect of substitution of Co for Fe in FINEMET Fe73.5-
xCoxNb3Si13.5Cu1B9 alloys has been studied in detail on the magnetic properties [2.43-
2.49]. Chau et al. [2.43] found that Curie temperature (Tc) of the amorphous and the
crystalline phases increase gradually with the increase of Co concentration while the
primary crystallization temperature decreases with Co. Crystallization activation energy
of α-Fe (Si) increases as the Co content is increased. It has been shown by the authors
that the grain size, Dg and the Curie temperature of the Fe-Si phase increase with the
increase of Co content. Ohnuma et al. [2.44] studied the effect of Co replacement up to
high concentration for Fe on the magnetic properties of Fe73.5-xCoxNb3Si13.5Cu1B9
nanocrystalline alloys and found that the permeability decreases and the coercivity
increases with Co content x, because of increase of the grain size. It was also found that

36
high Co content enables the alloys for their applications to much higher frequency range
than conventional FINEMET alloy. Zbroszcyk et al. [2.45-2.47] have examined the
influence of small Co additions to FINEMET alloy on microsturctural and magnetic
properties. They compared Fe73.5Cu1Nb3Si13.5B9 and Fe66.5Co7 Cu1Nb3Si13.5B9 alloys. It
was concluded that Co accelerated the crystallization process, though the
nanocrystalline phase remains as the bcc α-Fe(Si). Generally improved magnetic
properties were noted with Co additions. Effect of galvanomagnetic and magnetoelastic
behavior of amorphous and nanocrystalline Fe73.5-xCox Cu1Nb3Si13.5B9 (x = 0-3) alloys
have been studied by Maria et al. [2.48]. An improvement of Hall coefficient (RH) and a
substantial decrease of saturation magnetostriction (λs) is observed with Co addition in
the amorphous as well as in the nanocrystalline state.
Partial substitution of Al for Fe in Fe73.5-xAlx Cu1Nb3Si13.5B9 has been studied with wide
range of Al concentration to see the effect on the structural, magnetic and other
properties [2.50-2.54]. Todd et al. [2.50] studied the effect of Al from 0-6 at.% and
observed that 2 at.% Al substitution showed the best magnetic properties corresponding
to highest permeability, lowest coercivity and magnetostriction as compared with the
conventional FINEMET. Higher substitution of Al for Fe leads to a deterioration of
permeability as a result of saturation magnetization. Phan et al. [2.51] found that small
addition of Al in the Fe73-xAlxSi14B8.5Cu1Nb3.5 (x = 0, 2) alloys leads to an improved
magnetic softness and hence the giant magnetoimpedence (GMI) effect as well as its
field sensitivity when compared to the Al-free nanocomposite. This finding is beneficial
for developing high performance GMI sensors. However, very small amount of Al
substitution for Fe up to 1 at.% is found to increase the permeability and decreases the
coercivity with the manifestation of better magnetic properties corresponding to 0.1
at.% of Al along with a slight sacrifice of magnetic induction [2.52]. It has also been
demonstrated by the authors that the crystallization temperature related to the formation
of the α-Fe(Si) solid solution phase is decreased while that related to the formation of
the Fe-boride is increased with Al addition. Zorkovska et al. [2.53] studied the Al
substitution up to 7 at.% in the FINEMET alloy Fe73.5-xAlx Nb3 Cu1Si13.5B9 (x = 0, 1, 2,
3, 5 & 7). In as-quenched state Al decreased linearly the magnetization, but up to 3 at.

37
% enhanced the Curie temperature of the alloy. The Curie temperature of the crystalline
phase and the magnetization in annealed samples abruptly decreased, when there was
more than 5 at.% of Al in the alloy due to the ordered DO3 like structure (Fe3Si) leading
to paramagnetic behavior.
Tate et al. [2.54] have examined the influence of Al additions on nanostructure and soft
magnetic properties of FINEMET alloys. They studied Fe73.5-xAlxSi13.5B9Cu1Nb3 alloys
with 100 ≤≤ x . A reduction in the (bulk-line) magnetocrystalline anisotropy for α-
Fe(Si) was used to explain a reduced coercivity in alloys with .82 ≤≤ x A nearly linear
reduction in the induction was observed from 1.5 T (x = 0) to 0.9 T (x = 10) with Al
addition.
Vojtanik et al. [2.55, 2.56] have investigated the influence of Ni substitution for Fe on
the intrinsic magnetic properties in FINEMET alloys. Fe73.5-xNixSi13.5B9Cu1Nb3 (x = 0,
5, 10, 15, 20 & 25 at.%) amorphous and nanocrystalline alloys were studied by X-ray
diffraction, Mössbauer spectroscopy and thermodynamic analysis. Small additions of Ni
were shown to increase the Curie temperature and the room temperature saturation
magnetization of amorphous samples. Ni caused a suppression of the secondary
crystallization temperature (Tx2). A nanocrystalline structure was observed after
crystallizing the x = 0, 5, 10 & 15 alloys but not for the x = 20 & 25 at.% alloys. The 5
at.% Ni addition increase the room temperature Bs from 1.19 to 1.39T and Tc of the
amorphous phase from 3320C to 3370C. Both quantities decrease for higher Ni
concentrations. Magnetic and structural properties of FINEMET alloy and with the
substitution of Nb by Ta, Mo, Cr, W have been studied by several investigators [2.57-
2.59]. Results show that FINEMET composition with Nb and Ta show similar soft
magnetic characteristics while alloy with substitution of Nb and Cr, Mo and W display
somewhat lower soft magnetic properties. Hakim et al. [2.57] found with the Ta
substituted alloy superparamagnetic and superferromagnetic behavior depending upon
the volume fraction of the nanocrystallites from the temperature dependence of
permeability of the samples annealed in the temperature range 500-5750C. Similar
behavior of superparamagnetic/superparamagnetic has been observed in the FINEMET

38
alloy with higher content of Cr substituted for Fe [2.60, 2.61]. Magnetic properties of
partial substitution of Fe by Cr have been studied by several investigators with a limited
concentration of Cr between 1 & 5 at.% substituted for Fe in the FINEMET alloy [2.62-
2.64]. The authors found that Cr enhances the crystallization temperature, controls the
volume fraction and particle size of α-Fe(Si) phase and reduces the Curie temperature.
The giant magnetocaloric effect has been observed in the studied samples [2.63]. The
influence of Cr content with higher percentage of Cr on the magnetization behavior of
Fe73.5-xCrxCu1Nb3Si13.5B9 alloys have been studied [2.65]. It has been found that
magnetic moment and the Curie temperature decreases linearly with Cr concentration.
The onset of ferromagnetism for the alloy system studied has been claimed to be Cr <
27 at.% and the alloys have been found to follow the Bloch’s T3/2 law in their
temperature dependence of magnetization. Investigations have been carried out on the
effect of substitution of Au and Ag for Cu in the Finemet on the crystallization behavior
and magnetic properties [2.66-2.69]. It has been found that Au behaves similarly as Cu
on the crystallization behavior and magnetic properties while Ag shows slightly inferior
properties.
Magnetic properties and magnetoimpedence effects have been studied of Mn
substitution for Fe in the Finemet alloy Fe73.5-xMnxCu1Nb3Si13.5B9 in the amorphous and
nanocrystalline state [2.70, 2.71]. Gomez-Polo et al. [2.70] showed that the partial
substitution of Fe by Mn in FINEMET alloys plays an important role in the evolution of
magnetic properties of the alloy. This has been manifested through the enhancement of
magnetic hardening of the nanocrystalline state attributed to the migration of the Mn
atoms to the grain boundary region, which reduces the exchange coupling between the
crystalline and residual amorphous phases. Tho et al. [2.71] found a decrease of Curie
temperature (Tc) and saturation magnetization (Ms) due to the substitution of Fe by Mn
in the FINEMET composition Fe73.5-xMnxCu1Nb3Si13.5B9 (x = 1, 3 & 5). The authors
found that the presence of Mn affects the shape of the magnetic hysteresis loops causing
a decrease in coercivity and maximum magnetization in the amorphous and annealed
samples. The frequency dependence of magnetoimpedence (MI) as a function of
frequency has been measured. The correlation between MI effect and soft magnetic

39
properties has been sought in which the giant magnetoimpedence effect corresponding
to the ultrasoft magnetic properties has been well established.
2.4 Low temperature Magnetization of Finemet Alloys
Low temperature magnetization behavior as a function of field and temperature
is important to understand the magnetization mechanism at the ground state. Although
much not detailed, some low temperature measurement on amorphous and
nanocrystalline alloys has been reported. Holtzer et al. [2.72] have measured low
temperature behavior of magnetic properties such as coercivity, magnetization and
magnetostriction of original FINEMET Fe73.5Cu1Nb3Si13.5B9 samples at different stages
of crystallization and have been compared to the amorphous counterpart. The authors
found that the temperature dependence of magnetization in the low temperature range
for the amorphous and annealed samples follows the well-known Bloch’s T3/2 law. The
saturation magnetization (Ms) at 5 K decreases continuously with the increase of
annealing temperature, which contradicts the results of Lovas et al. [2.73]. The Ms value
measured at 12 K by ref. [2.73] has been found to increase until the initial stage of
crystallization (5250C/4min) attaining maximum value of Ms and thereafter decreases
gradually as the annealing time and/or temperature increases. However the room
temperature Ms values show the similar trend in agreement with the Ms value of Holzer
et al. [2.72] and have been interpreted as due to structural relaxation. It has also been
depicted that the Curie temperature (Tcam) of the amorphous phase increases
continuously with annealing temperature up to the beginning of nanocrystallization due
to irreversible structural relaxation.
According to Holtzer [2.72] the spin-wave stiffness constant (D) and the exchange
constant (A) increase with increasing of annealing temperature. The temperature
dependence of magnetostriction (λs) in the low temperature range has been
approximately described by T3/2 behavior in the light of temperature dependence of
magnetization by Bloch’s law. Ponpandian et al. [2.74] also studied the low temperature
magnetization of original FINEMET composition and found that the M(T) in the low

40
temperature region follows the spin-wave theory. The authors also concluded that the
range of exchange interaction <r2> is shorter in the amorphous state in comparison with
that of the crystalline state. A low temperature magnetization study of amorphous
Fe73Cu1Mo3Si13.5-xAlxB9 alloys by Prabhu et al. [2.75] revealed a linear fit with T3/2 law.
The calculated value of the exchange stiffness constant (D) decreased from 116 meVÅ2
for 0 at% Al to 107 meVÅ2 for 5% Al, which is typical for amorphous solids and is in
good agreement with the reported literature values [2.76, 2.77].
2.5 Application of Amorphous Magnetic Alloys
Some of the attractive technical characteristics of amorphous alloys and their
nanocrystalline composites are as follows:
Amorphous magnetic alloys exhibit high electrical resistivities due to electron
scattering from the atomic disorder. High resistivity results in reduced eddy currents.
These alloys theoretically posses zero macroscopic magnetocrystalline anisotropy,
which implies reduced anisotropy field.
They have no microstructural discontinuities such as dislocations, grain boundaries or
precipitates. This significantly reduces the possible pinning sites for domain walls,
reducing the coercivity.
The highly elastic behavior of these alloys makes them less prone to degradation
during handling.
The absence of microstructural discontinuities resulted in improved corrosion
resistance. The general presence of elements such as B, Si and C also improves the
corrosion resistance.

41
Theoretical aspects
3.1 Natures and Formation of Amorphous Alloys
The term “amorphous” defines a non-crystalline body while a “glass” refers to a
molten mass that is cooled rapidly to prevent crystallization. By analogy, the term
“metallic glass” usually refers to a metallic alloy rapidly quenched in order to “freeze”
its structure from the liquid state.
The expression “glass” in its original sense refers to an amorphous or nanocrystalline
solid formed by continuous cooling of a liquid while a solid is defined somewhat
arbitrary as object having a viscosity grater than 1014 Pa.s [3.1]. A glass lacks three-
dimensional atomic periodicity beyond a few atomic distances. It is characterized by
limited number of diffuse halos in X-ray, electron and neutron diffraction and no sharp
diffraction contrast in high-resolution electron microscopy. Glasses have been found in
every category of materials and of various bond types: covalent, ionic, Van der Walls,
hydrogen and metallic. The glass-forming tendency varies widely. Some oxide mixtures
form a glass at normal slow cooling rates of ~1 K/min while monoatomic metals with
possible incorporation of impurities require rates as high as ~1010 K/s [3.2].
During the solidification no essential change in spatial atomic configuration occurs. A
glass may be considered as a solid with frozen-in liquid structure. It is in general not in
an internal equilibrium state and thus relaxes structurally to a more stable equilibrium
state whenever atoms attain an appropriate mobility. Furthermore, a glass is metastable
with respect to crystalline phase(s) and transform to the latter through nucleation and
growth. On heating, a glass would transform to the liquid phase provided that the rates
of crystallization are sluggish enough.
Glasses are generally formed if upon cooling of a melt crystal nucleation and/or growth
are avoided. At a temperature called glass transition temperature (Tg,) the liquid freezes
to a rigid solid, however without crystalline order. Thus, glasses and amorphous solids
in general are structurally characterized by the absence of long-range translational

42
order. But a short-range order is still present and may be similar to that found in the
crystalline counterpart.
Synthesizing amorphous alloys requires rapid solidification, in order to by-pass the
crystallization [3.3]. The metastable structure thus achieved nevertheless may possess a
short-range order (SRO) that resembles the equilibrium crystal structure [3.4]. This
indicates that the thermodynamic forces that drive crystallization in metals are
extremely strong and in most cases, overpowering. Thus the search for alloy systems
that allow formation of amorphous structures is of keen technological importance.
Fig. 3.1 shows schematically, the time taken for a small amount of crystalline phase to
form in an undercooled liquid as a function of temperature. The Temperature-Time-
Transformation (TTT) diagram shows a characteristic C curve behavior. At the
temperature close to melting point Tm there is little driving force for crystallization, so
that the crystal nucleation and growth rates are small, and the crystallization onset time
to is large. As the temperature decreases, the crystallization onset time reaches a
minimum value ∗
0t at a temperature Tn, and then increases again as the thermal energy
becomes insufficient for atomic motion. Close to the glass transition temperature (Tg,)
atomic motion is completely suppressed and the amorphous structure is frozen in, so
that the crystallization onset time to becomes large. Therefore, critical cooling rate Rc to
avoid crystallization is given below:
*
0t
TTR nm
c
−= (3.1)

43
Fig.3.1 Schematic TTT diagram for the onset of crystallization
The absence of long-range order is easily determined using X-ray diffraction (XRD) or
transmission electron microscopy (TEM). In XRD for example, broad diffuse halo
peaks are observed (2 θ ~100) broadness with Cu-Kα, instead of the sharp Bragg peaks
shown by crystalline phase.
3.2 The Glass Transition Temperature
Apart from the lack of LRO, an important characteristic of any amorphous
structure is the glass transition temperature )( gT . The glass transition is the phenomenon
in which a glass exhibits a more or less abrupt change in derivative thermodynamic
modulus from crystal-like to liquid-like values with change of temperature. When a
liquid is cooled, one of the following two events may occur; either crystallization may
take place at the melting point Tm or the liquid will become supercooled below Tm. If
the liquid is supercooled sufficiently, its density gradually falls and its viscosity
gradually rises. Thus macroscopic flow of the liquid becomes progressively more
difficult. These changes can be observed by monitoring the volume of the supercooled
liquid as a function of temperature and a typical result is shown schematically in fig.3.2
[3.5].

44
The crystallization process is manifested by an abrupt change in volume at Tm, where
glass formation is characterized by a gradual break in slope. The region over which the
change of slope occurs is termed the glass transition temperature Tg.
Fig. 3.2 Volume-Temperature relationship in solid, liquid and glassy state
The glass transition temperature is the point at which the alloy finally solidifies with
frozen-in amorphous atomic structure. Freezing the amorphous structure at the glass
transition temperature is a kinetic rather than a thermodynamic transition. Decreasing
the cooling rate gives more time for atomic motion, allowing the liquid to maintain its
equilibrium structure to lower glass transition temperature, with a denser, lower entropy
structure. The temperature of the glass transition is not a constant of the material, but is
a function of experimental conditions. The volume (∆V) and entropy (∆S) difference
between the liquid and the crystal decrease progressively as the temperature falls, and
approach zero at a temperature called the ideal glass transition temperature o
gT .
Kauzmann [3.6] was the first to point out that an amorphous structure with higher
density and lower entropy than the corresponding crystal is impossible, so T0g. is the

45
natural lower limit of the range of possible glass transition temperatures, corresponding
to a condition of an infinitely slow cooling rate. In general the glass transition
temperature, Tg is defined as the temperature at which an amorphous solid, such as glass
or a polymer, becomes brittle on cooling, or soft on heating. More specifically, it
defines a pseudo second order phase transition in which a supercooled melt yields, on
cooling, a glassy structure and properties similar to those of crystalline materials e.g. of
an isotropic solid material [3.7]. The glass transition temperature can be measured by
using differential scanning calorimetry (DSC)
3.3 Stability of the amorphous phase
Amorphous materials are always in a metastable state, which tend to transform
into more stable crystalline phases. There are three kinds of stability of significance for
amorphous magnetic alloys: their resistance to the initiation of crystallization, structural
relaxation effects and the relaxation or reorientation of directional order. At temperature
below the crystallization temperature, structural relaxation takes place due to atomic
rearrangement. The formation and resultant stability of amorphous alloys are important
topics both theoretically and technologically. The theoretical analysis of the factors
controlling the ease of formation and the stability of the resultant amorphous alloys
have been extensively reviewed [3.8-3.10] From the thermodynamic view point [3.9-
3.10], the ability of an alloy to be quenched into the glassy state is generally measured
by the magnitude of the quantity.
=∆ gTgm TT − , (3.2)
where mT and gT are the melting and glass transition temperature respectively. In a
similar manner the stability of the glass after formation is generally measured by the
magnitude of the quantity.
=∆ xT gx TT − (3.3)
where XT is the temperature for the onset of crystallization. As the temperature
decreases from mT the rate of crystallization will increase rapidly and then fall rapidly as
the temperature decreases below gT . Thus if one quenched a molten alloy rapidly

46
enough to temperature below gT a quasi-equilibrium amorphous phase is obtained.
There is no direct relation between the ease of formation and the resultant stability of an
amorphous alloy.
3.4 Crystallization of the amorphous state
The basic principle for the crystallization method from amorphous solids is to
control the crystallizations kinetics by optimizing the heat treatment conditions
(annealing temperature and time, heating rate, etc) so that the amorphous phase
crystallizes completely into a polycrystalline material with ultrafine crystallites.
Crystallization of amorphous alloy solid has been successfully applied in producing
nanometer –sized polycrystalline materials in various alloy systems, e.g. in Fe-, Ni-, and
Co- based alloys [3.11-3.15]. The complete crystallization of amorphous solids is being
established as a promising method for synthesis of nanocrystalline materials because it
possesses some unique advantages:
(i) It is very simple and convenient to control in preparation procedures. Conventional
annealing can realize the nanocrystallization in most alloy and element systems
provided they are formed into grain sizes with a wide size range (from a few
nanometers to submicrometers) can be easily obtained in the as-crystallized
nanocrystalline specimens by simply modifying the heat treatment conditions [3.16];
(ii) The complete crystallization method is an efficient way to produce porosity-free
nanocrystalline materials [3.17]. As no artificial consolidation process is involved and
the nanometer-crystallites and their boundaries are formed via a solid-state phase
transformation, the nanocrystalline samples are dense and clean in the internal
interfaces;
(iii) The nanocrystallization itself provides us with a unique chance to study the
interface formation process from the amorphous state experimentally. The
nanocrystallization kinetics and thermodynamics of the amorphous solids are strongly
affected by the presence of plenty interfaces in the crystallization products [3.18, 3.19].

47
Consequently, it is possible to reveal some fundamental features of the interfaces in the
nanocrystalline materials from the transformation kinetic and thermodynamic signals
[3.20].
The crystallization is associated with nucleation and growth process. The kinetics of
loss of metastability of the amorphous state (disordered system) above the glass
transition, i.e. under far from equilibrium conditions, is a key subject since it provides
new opportunities for structure control by innovative alloy design and processing
strategies. Several examples include soft and hard magnets and high strength materials
[3.21-3.22]. Most studies focus on the crystallization onset as a measure of kinetic
stability under heat treatment and recognize the product phase selection involved in
nucleation and the role of competitive growth kinetics in the evolution of different
microstructural morphologies [3.23]. The transition to the crystalline state is
accompanied by an exothermic heat effect-giving rise to a sharp peak in the temperature
dependence of the exothermic heat. Therefore, differential scanning calorimetry (DSC)
is a widely used technique to study thermally induced transformations in amorphous
alloys and to determine the crystallization temperature (Tx). The magnitude of Tx is very
different for amorphous materials and depends strongly on composition. The activation
energy ranges typically between 2 and 6 eV. Calorimetric measurements are, however,
integral techniques, which give no information about the microstructural development.
DSC measurement under continuous heating is quite straightforward; where as
isothermal measurements are time consuming and can be performed only in a limited
temperature range because of the thermally activated nature of the process. The
continuous heating calorimetric signal shows a significant increase in the maximum
value of the exothermic heat flux with increasing heating rate. Such a behavior is
typical of a thermally activated process.
Activation energy is one of the important parameters describing the transformation
kinetics. The activation energy for the isothermal nanocrystallization is usually
determined according to the Arrhenius relation:

48
=
RT
Ett exp0 , (3.4)
where t is a characteristic time, t0 is a time constant, R is the gas constant and E is the
activation energy for the transformation [3.19]. For the anisothermal nanocrystallization
process, where the heating rate dependence of DSC thermogram is recorded the
Kissinger relation is frequently used for determination of activation energy, which is
expressed as: [3.24]
+−=
β
RT
E
Tln
2Constant (3.5)
where β is the heating rate and T is a characteristic temperature corresponding to peak
temperature. By plotting
2
lnT
β against
T
1 one can derive the value of E from the
slope of the straight line. Using the characteristic temperatures measured from the DSC,
one can make Kissinger plots according to the above equation. It was also found that the
value of E is smaller in the beginning of the transformation (about 225 KJ mol-1) than
that in the later stages (about 260 KJmol-1)[3.25]. Although the values of activation
energy for the nanocrystallization process determined from the Arrhenius plot and from
the Kissinger plot are different, a common behavior of the variation in activation energy
at different stages is obtained.
The activation energy for the crystallization is also found to be related to the nature of
the amorphous state and temperature as well. A decrease of the degree of amorphism in
the original amorphous state will reduce the value of E. E values are found to be larger
at higher temperatures in crystallization. These features probably originate from the
crystallization micromechanism [3.26]

49
3.5 Theory of Magnetism
3.5.1 Introduction to Magnetic Ordering
The basic criteria for the onset of magnetic order in solids are (i) individual
atoms should have magnetic moments (spins) and (ii) exchange interactions must exist
between the atoms that couple them together. Exchange coupling originates from the
overlapping of the electronic wave functions with those of neighboring atoms. The
exchange interactions depend sensitively upon the interatomic distance and the nature
of the chemical bonds, particularly of nearest neighbor atoms.
A system is characterized by its energy in order to describe the magnetic configuration
of a system as proposed by Heisenberg according to the following Hamiltonian [27].
jH = -→→
∑ jij,i
ij S.SJ , (3.6)
where Jij is the exchange-coupling constant between the spins →
iS and →
jS distributed on
a regular lattice. Only nearest neighbors are included in the summation. The magnetic
property of the system is thus dependent on the sign and strength of the interaction
between the spins. If Jij = J > 0, parallel orientation of the spins is favored and at low
temperatures all spins will be aligned ferromagnetically. At high temperatures the
entropy dominates the interaction energy and the spins will fluctuate independently with
the manifestation of paramagnetic phase, while at lower temperatures the interaction
energy dominates and the system will order at the critical temperature (Tc,) with all the
spins pointing in the same direction with the appearance of ferromagnetic phase.
For if Jij = J < 0, the low temperature phase is antiferromagnetic with the spins aligned
antiparallel to their neighbors below a characteristic temperature TN, called the Neel
temperature. Above TN the material exhibit paramagnetic behavior. In the simplest case,
the lattice of an antiferromagnet is divided into two sublattices with the magnetic
moments of these in antiparallel alignment. This gives rise to zero net magnetization. A

50
special case of antiferromagnetism is ferrimagnetism. In ferrimagnetism there are also
two sublattices with magnetic moments in opposite directions, but the magnetization of
the sublattices are of unequal strength resulting in a non–zero magnetization and
therefore has net spontaneous magnetization. At the macroscopic level of domain
structures, ferromagnetic and ferrimagnetic materials are therefore similar. The Curie
and Neel temperatures characterize a phase transition between the magnetically ordered
and disordered (paramagnetic) states.
Fig.3.3 Examples of different types of magnetic order using a linear array of localized moments, including paramagnet
If Jij = J = 0, the Hamiltonian describes a system being paramagnetic at all temperatures
with all the spins pointed at random resulting in zero magnetic moment. Besides these
common type of magnetic ordering, various other type of magnetic structures such as
canted, helical and conical spin arrangements may exist which are shown in the above
fig. 3.3

51
3.5.2 Ferromagnetism and Magnetic domain
At a first glance the coexistence of long-range ferromagnetic ordering with a
structurally disordered material seems to be incompatible. However, the very short-
range ordered structure in the glassy state does not differ significantly from that in the
corresponding crystalline material. The ferromagnetism is supposed to arise from
interactions between neighboring atomic moments, which make them to align parallel.
In 1928 Heisenburg [3.27] described the quantum mechanical origin of ferromagnetism,
by considering the interaction between electronic spins. The spins of the neighboring
electrons are coupled and in this way all the spins are oriented in the same direction.
This parallel alignment of the spins gives rise to a macroscopic magnetic moment. The
coupling can be expressed as shown in equation (3.6).
In the demagnetized state, ferromagnets show no net magnetization. But they are
spontaneously decomposed in small regions named magnetic domains within which the
magnetic moments are ordered. The magnitude of magnetization in all domains is the
same but the direction varies from one domain to the other. Thus, a demagnetized state
with zero net magnetization is possible fig.3.4 (a)
Fig. 3.4(a) Magnetic domains in a ferromagnetic material in the demagnetized state
A ferromagnetic body has magnetostatic energy. The magnetic domains are generated
spontaneously in order to minimize this energy until the energy consumed for the
formation of a new domain is higher than the corresponding lowering of the
magnetostatic energy. The directions of the magnetic moments are not changed

52
suddenly from one domain to another but rotate gradually within the domain walls as
shown in fig.3.4 (b) [3.28].
Fig.3.4 (b) Rotation of magnetic moments within a domain wall
The domain wall width can be even of the order of 100 nm. The vectorial sum of all
moments →
m relative to the entire volume of the ferromagnetic body is called volume
magnetization Mv. In the demagnetized state, the magnetic moments are randomly
oriented. The vectorial sum of the magnetic moments is zero and therefore, the total
magnetization is zero [3.28].
In the magnetic domains, atomic magnetic moments are aligned due to the internal
Weiss field or alternatively the ferromagnetic exchange interaction. The magnetization
process involves the growth of domains that are favorably oriented with the applied
magnetic field at the expense of those that are not.
Having more than one domain requires an interfacial region between domains called a
domain wall. Associated with this interface is positive domain wall energy. A balance
between the volume, magnetostatic and interfacial domain wall energies determines the
ultimate number and size, of magnetic domains in a sample. In soft materials, which
have been optimized to have very low rotational energy barriers, the major determinant
of the shape of the magnetization curve is domain wall motion.
We will find it useful to describe several length scales that are associated with domains
and domain walls. These are expressed through consideration of domain wall energetic.

53
The energy per unit area in the wall can be expressed as a sum of exchange and
anisotropy energy terms:
kexwall γ+γ=γ , (3.7)
where Aw is area of the domain wall, δw is domain wall width, the anisotropy energy per
unit volume, K, is multiplied by volume contained in a domain wall, Awδw, and divided
by cross-sectional area to arrive at an anisotropy energy per unit area:
)aN(KKA
AK p1w1
w
ww1k =δ=
δ=γ , (3.8)
where δw= Na ( a is the lattice constant in the direction of rotation and N is the number
of planes over which the rotation takes place) is the thickness of the wall.
Thus γwall can be expressed:
aNKN
SJp12
p
2ex
2
wall +π
=γ , (3.9)
where the first term considers the cost in exchange energy in rotating magnetic dipole
moments in a 180° domain wall as illustrated in the above fig. 3.4 (b). To determine the
optimal wall thickness we differentiate γw with respect to δw
p
wall
Na
1
∂
γ∂ = 0=
22p
2ex
2
aN
SJπ+K1 (3.10)
yielding:
eqN = 3
1
2ex
2
aK
SJπ (3.11)
For Fe, Neq ∼ 300 and the equilibrium thickness, teq = Neq a ∼ 50 nm. Expressed in terms
of thr exchange stiffness, Aex, the domain wall width, δw is:
δw = 1
ex
K
Aπ (3.12)

54
Another important length scale is the distance over which the perturbations due to the
switching of a single spin decays in a soft material. This length is called the
ferromagnetic exchange length (Lex ) and can be expressed:
Lex = 2
s0
ex
M
A
µ (3.13)
The ferromagnetic exchange length is ∼3nm for ferromagnetic iron or cobalt-based
alloys. The ratio of the exchange length to π
δw is a dimensionless parameter (k) called
the magnetic hardness parameter:
K = w
exL
δ
π =
s2
0
1
M
K
µ (3.14)
For hard magnetic materials k is in the order of unity and thus there is little difference
between the ferromagnetic exchange length and the domain wall width. On the other
hand, for good soft magnetic materials, where K1 approaches zero, can deviate
substantially from unity.
Structure sensitive magnetic properties may depend on defect concentration (point, line
and planar defects), atomic order, impurities, second phases, thermal history, etc. In
multi-domain materials, the domain wall energy density,
( ) ( )xAK γγ == 2
1
14 (3.15)
is spatially varying as a result of local variations in properties due to chemical
variation, defects, etc. A domain wall will prefer to locate itself in regions where the
magnetic order parameter is suppressed, i.e. pinning sites. Since changes in induction in
high-permeability materials occur by domain wall motion, it is desirable to limit
variation of γ(x) (pinning). This is one of the key design issues in developing soft
magnetic materials.

55
3.5.3 Random Anisotropy Model (RAM) and Strongly Exchanged
Coupled Nanocrystalline Alloys
In a discussion of the benefits of nanocrystalline alloys for soft magnetic
applications the extrinsic properties the coercivity and the permeability need to be
considered. Reductions of coercivity increase in permeability are both desirable
properties that can be considered in selecting amorphous and nanocrystalline alloys.
The concept of a magnetic exchange length and its relationship to the domain wall
width and monodomain size is important in the consideration of magnetic anisotropy in
nanocrystalline soft magnetic materials [3.29]. As described above, these can be defined
by appealing to a Helmholz free energy function as described by Coey [3.30]. These
length scales are:
,Κ
Α= πδ w and Lex= 2
sM4
A
π (3.16)
Fig.3.5 Schematic representation of the random anisotropy model. The arrows indicate
the randomly fluctuating magnetocrystalline anisotropies
The extension of the random anisotropy model (RAM) by Herzer [3.31-3.35] to nano
crystalline alloys has also been used as the premise for explaining the soft magnetic

56
properties of these materials. RAM has been originally developed by Alben et al.(3.36)
in order to explain the soft magnetic properties of amorphous ferromagnets. The Herzer
argument for effective anisotropies in nanocrystalline materials builds on the arguments
of the random anisotropy model presented for amorphous alloys presented above.
Herzer considers a characteristic volume, whose linear dimension is the magnetic
exchange length, ~Lex
2/1
1K
A
as shown in fig. 3.5.
Given the discussion above the unstated constant of proportionality should be k/π,
which for materials with very small k can in fact be quite large. Ignoring this constant
of proportionality, the Herzer arguments consider N grains, with random easy axes,
within a volume of L3ex to be exchange coupled. Since the easy axes are randomly
oriented, a random wall over all N grains will yield and effective anisotropy, which is
reduced by a factor of 2
p )N(
1from the value k1 for any one grain, thus
2
1
)( p
eff
N
KK = .
Now the number of grains in this exchange-coupled volume is just
3
=
g
ex
D
LN , where
Dg is the average diameter in individual grains. Treating the anisotropy self–
consistently, then:
3
641~A
DKK
g
eff (3.17)
Since the coercivity can be taken as proportional to the effective anisotropy, this
analysis leads to Herzer’s prediction that he effective anisotropy and therefore the
coercivity should grow as the 6th power of the grain size:
6~~ gkc DHH (3.18)
For such a reduction in the coercivity to be realized, Herzer noted that the
nanocrystalline grains must be exchange coupled.

57
The most significant feature predicted by the random anisotropy model is the strong
variation of Keff with the sixth power of the grain size. Thus 3
0LD ≈ i.e., grain sizes in
the order of 10-15 nm, the magneto-crystalline anisotropy is reduced by three orders of
magnitude towards a few J/m3, i.e., small enough to enable superior soft magnetic
behavior. Correspondingly the renormalized exchange length (Lex), expands into the
µm-regime and thus, is almost two orders of magnitude larger than the natural exchange
length L0. High-resolution Kerr effect studies of nanocrystalline Fe73.5Cu1Nb3Si13.5B9
indeed reveal very wide domain walls of about 2 µm in thickness indicative of the low
effective anisotropy of the material [3.37]
If there are no other anisotropies, coercivity and initial permeability are closely related
to Keff by
s
effcc J
Kp=Η (3.19)
eff
si
K
Jp
0
2
µµ µ= (3.20)
where Js is the average saturation magnetization of the material, pc and pµ are
dimensionless pre-factors close to unity. These relations, obvious for coherent
magnetization rotation, in the regime D << Lex , also apply for domain wall
displacements [3.32], on the scale of the 10 nm small grains the magnetization vector
appears to rotate coherently if a 2 µm ( << Lex,) wide domain wall passes by. Besides
very low or vanishing magnetocrystalline anisotropy, another major requirement for
superior soft magnetic properties is that the saturation magnetostriction ( sλ ) should be
very low to avoid magnetoelastic anisotropies arising from internal mechanical stresses.
The low magnetostriction of nanostructured materials can be understood from the
balance of the magnetostriction between the α-Fe(Si) crystallites with negative and
amorphous matrix with positive value and usually given by [3.38]:
( )ssiFe
siFe
sSiFe
nano
s VV λλλ )()(
)( 1−+= (3.21)

58
where )(SiFe
sλ and am
sλ stands for the magnetostriction constants of the α -Fe-Si grains
and the residual amorphous matrix, respectively. The higher permeability of the
nanocrystalline samples in the first approximation can be expressed in terms of effective
magnetic anisotropy constant <Keff> and magneto-elastic energy according to Stoklosa
et al. [3.39].
+><
=
2
32 0
2
σλµ
µs
eff
si
K
M (3.22)
where, Ms is the saturation magnetization, µ0 is the vacuum magnetic permeability, σ is
the effective stress.
The analysis of the experimental data of Yoshizawa et al. [3.40] and Herzer [3.32-3.34]
show λsamor = 20 x 10-6
(for as cast), λs Fe(Si) = -6X10⁻⁶ for conventional polycrystalline
α-Fe(Si) and λsnano= 2 x 10⁻⁶ for nanocrystallized samples at 550oC, Thus λs for annealed
sample is about one order of magnitude lower. Moreover, the effective stress (σ) is
substantially reduced if not completely eliminated by heat treatment. Thus the increase
of initial permeability on the formation of the nanocrystalline state is closely related to a
simultaneous decrease of sλ . However, the best soft magnetic properties are not
necessarily to be found on the sλ = 0 line but for compositions where the total amount
of magnetoelastic and effective magnetic anisotropy is minimized.
59
3.5.4 AC Magnetic Response to the Soft Magnetic Materials
Soft magnetic material’s magnetic loss mechanisms include: (i)
hysteresis loss due to irreversible domain wall motion and rotational out of easy axes
loss mechanism, (ii) eddy current losses and (iii) anomalous losses. The energy loss per
cycle is given by ∫BdH and for linear response the power loss is µ2
2Bf ×
, where f is
the frequency. In real materials (which are nonlinear) we express the hysteresis power
loss as:
max~ n
hh fBCP (3.23)
where Ch may vary with the material, and a typical exponent n is ∼ 1.6. Eddy current
loss results from the fact that dt
dφ induces voltages in the core material with consequent
RV2
power loss appearing as heat. This power loss can be reduced by decreasing V and
increasing R. Since V∼ƒ Bmax then the power loss due to eddy currents is proportional to
max2Bf i.e:
Pe=Ceƒ2B2
max (3.24)
To reduce the eddy current loss in sheet transformers, they are often laminated so as to
reduce the length scale of eddy current loops. In designing transformers the total power
loss:
Ptot = Ph+Pe = Ch ƒ Bnmax+ Ce ƒ
2 B2max (3.25)
must be minimized.
The important physical parameters, which can be altered to minimize alternating current
(AC) losses are those influencing the hysteresis loss as described above and those,
which influence the eddy current losses. By and large the most important physical

60
parameter, which influences the eddy current losses and therefore the high frequency
losses, is the electrical resistivity (ρ). Large electrical resistivities are essential for
reducing AC losses. Electrical resistivities in amorphous alloys can be several hundred
µΩ-cm and for nanocrystalline alloys ~ 50 µΩ cm, which in both cases offer significant
advantage over crystalline metallic magnetic materials (~1-10 µΩ cm).
3.5.5 Temperature dependence of magnetization
The mean-field theories do not account for local magnetic excitations and thus
cannot provide an accurate description of the low temperature behavior of the magnetic
properties. This problem can be solved by the spin-wave theory. In the quasicrystalline
approximation and the long-wavelength limit, the spin-wave energy can be expressed
by[3.41].
...........FkDkEE 420k +++= , (3.26)
where k is the wave vector of the spin wave and D and F are the spin-wave stiffness
constants.
It has been well established that amorphous metallic alloys exhibit well-defined spin
wave excitation. A number of experiments performed by Mӧssbaur [3.42], inelastic
neutron scattering [3.43] and magnetization measurements [3.44-3.45]. It has been
shown that as in crystalline ferromagnets the long wavelength magnetic excitation in
amorphous ferromagnets are also spin waves. At low temperature spontaneous
magnetization varies with temperature. Usually the magnetization at low temperatures
is found to decreases with increasing temperature in accordance with the predictions of
an isotropic nearest- neighbor Heisenberg model shown in equation (3.27) below and it
vanishes at a temperature, called Curie temperature, Tc. The Curie temperature separates
the disordered paramagnetic state at T > Tc from the ordered magnetic state at T < Tc.
The presence of spin-waves gives rise to a reduction of the average magnetization
leading to a temperature dependence of the form [3.46]:

61
−−= 2
5
2
3
1)0()( CTBTMTM (3.27)
2
5
2
3
)0(
)()0(
)0(CTBT
M
TMM
M
M+=
−=
∆ (3.28)
In the above equation M(0) is the saturation magnetization at 0 K and can be obtained
by extrapolation of the low temperature magnetization data, M(T) to zero Kelvin .
Generally, the low temperature behavior of the saturation magnetization of crystalline
ferromagnetic materials can be described within reasonable errors by the first term of
equation (3.27) and known as Bloch’s T3/2 law covering a narrow range of temperature
i.e. 0.2 Tc.
The coefficients B and C are related to the spin-wave stiffness constant D by
( )
2
5
402
3
=
D
k
M
gB B
s
B
π
µζ (3.29)
and
( )
2
5
2
402
5
4
3
⟩⟨=
D
k
M
grC B
s
B
π
µζπ (3.30)
ζ
2
3= 2.612 and ζ
2
5=1.341 are the Reiman zeta functions and the mean-square
value of the range of exchange interaction ⟩⟨ 2r was calculated by using the relation
⟩⟨ 2r =
ζ
ζ
B
CD
)2/5(
)2/3(
k3
16
B (3.31)
The general variation of the reduced magnetization)0(
)(
M
TM versus the reduced
temperature cT
T is shown in fig. 3.6.

62
Fig. 3.6 Reduced magnetization )0(
)(
M
TM versus reduced temperature
cT
T curve
In many cases [3.47] considering the higher temperature term T5/2 the equation (3.28)
fits the experimental data from very low temperatures up to a temperature close to 0.6
Tc to 0.8 Tc. When the temperature is higher approaching towards Tc, the experimental
behavior can be described well by the following equation [3.48, 3.34]
β
−=
cT
T1)0(M)T(M (3.32)
with the exponent β close to the Heisenberg value β = 0.36
Bhagat et al. [3.47] from the experimental results of temperature dependence of
magnetization in amorphous alloys showed that if ⟩⟨ 2r values are rather high, the
constant B from equation (3.27) can no more be treated as a constant since the stiffness
constant D is also temperature dependent by the equation
vTDTD )1)(0()( −= (3.33)
with 2≤≤≤≤ν≥3 according to Handrich et al [3.46 ].

63
3.5.6 Initial permeability of Nanocrystalline alloys
3.5.6.1 Theories of Permeability
The primary requirement for the soft magnetic materials is the highest possible
permeability, together with low losses in the frequency range of interest. The initial
permeability (µI) is defined as the derivative of induction B with respect to the initial
field H in the demagnetization state.
0,0, →→= BHdH
dBiµ (3.34)
At microwave frequency, and also in low anisotropic amorphous materials, dB and dH
may be in different directions, the permeability thus a tensor character. In the case of
amorphous materials containing a large number of randomly oriented magnetic atoms
the permeability will be scalar. As we have
( )MHB += 0µ (3.35)
and susceptibility,
( )11
00
−=
−== µ
µµχ H
B
dH
d
dH
dM (3.36)
The magnetic energy density
∫= dBHE .1
0µ (3.37)
For time harmonic fields tHH ωsin= , the dissipation can be described by a phase
difference δ between H and B. In the case of permeability, defined as the proportional
constant between the magnetic field induction B and applied intensity H;
B = µH (3.38)

64
This naive definition needs further sophistication. If a magnetic material is subjected to
an ac magnetic field as we get,
tieHH
ω0= (3.39)
Then it is observed that the magnetic flux density B experiences a delay with respect to
applied AC field, Hac. This is caused due to the presence of various losses and is thus
expressed as,
( )δω −= tieBB 0 (3.40)
where δ is the phase angle and marks the delay of B with respect to H, the permeability
is then given by
H
B=µ
( )
ti
ti
eH
eBω
δω
0
0−
=
0
0
H
eBiδ−
=
δδ sincos0
0
0
0
H
Bi
H
B−=
µµµ ′′−′= i , (3.41)
where δµ cos0
0
H
B=′ (3.42)
and δµ sin0
0
H
B=′′ (3.43)
The real part µ′ of complex permeability µ as expressed in equation (3.41) represents
the component of B, which is in phase with H, so it corresponds to the normal
permeability. If there are no losses, we should have µµ ′= . The imaginary part µ ′′
corresponds to that part of B, which is delayed by phase δ from H. The presence of
such a component requires a supply of energy to maintain the alternation magnetization,
regardless of the origin of delay. It is useful to introduce the loss factor or loss tangent
( )δtan . The ratio of µ ′′ to µ′ , as is evident from equation gives.

65
δδ
δ
µ
µtan
cos
sin
0
0
0
0
==′
′′
H
B
H
B
(3.44)
This δtan is called the loss factor. The Q-factor or quality factor, which is called the
merit of the material, is defined as the reciprocal of this loss factor i.e.
δtan
1=Q (3.45)
and the relative quality factor =δ
µ
tan
′. The behavior of µ′ and µ ′′ versus frequency is
called the permeability spectrum. The initial permeability of a ferromagnetic substance
is the combined effect of the wall permeability and rotational permeability mechanism.

66
Experimental
4.1 Sample Preparation
4.1.1 Master alloy preparation
A series of amorphous ribbons with composition of Fe73.5-xCrxCu1Nb3Si13.5B9
alloys with x =1, 2, 3, 4, 5, 6, 7, 8, 9, 10, 12.5, 15 & 17.5 were prepared in an arc
furnace on a water-cooled copper hearth under an atmosphere of pure Ar. Their purity
and origin of the constituent elements were Fe (99.98%), Cu (99+%), B (99.5%), Si
(99.9%), Nb (99.8%) and Cr (99.99%) as obtained from Johnson Mathey (Alfa Aesar
Inc.). The required amounts of constituent elements were taken from pure metal bars or
flakes weighed carefully with a sensitive electronic balance and placed on the copper
hearth inside the arc furnace. Before melting the furnace chamber was evacuated (10-4
torr) and flashed with Ar gas. The process was repeated several times to get rid of
residual air and finally the furnace chamber was kept in an Ar atmosphere.
Fig.4.1 Vacuum arc melting machine
A substantial amount of pure Titanium getter, placed inside of the chamber on the side
of the copper hearth was melted first in order to absorb any oxygen present in the
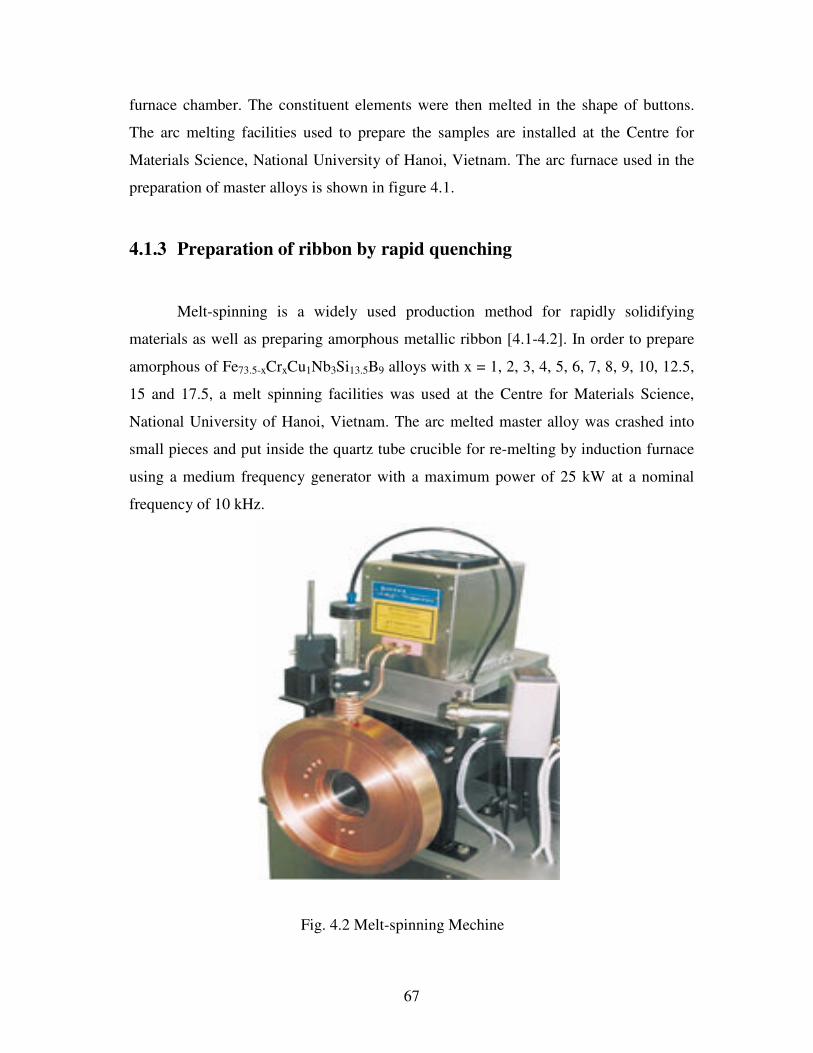
67
furnace chamber. The constituent elements were then melted in the shape of buttons.
The arc melting facilities used to prepare the samples are installed at the Centre for
Materials Science, National University of Hanoi, Vietnam. The arc furnace used in the
preparation of master alloys is shown in figure 4.1.
4.1.3 Preparation of ribbon by rapid quenching
Melt-spinning is a widely used production method for rapidly solidifying
materials as well as preparing amorphous metallic ribbon [4.1-4.2]. In order to prepare
amorphous of Fe73.5-xCrxCu1Nb3Si13.5B9 alloys with x = 1, 2, 3, 4, 5, 6, 7, 8, 9, 10, 12.5,
15 and 17.5, a melt spinning facilities was used at the Centre for Materials Science,
National University of Hanoi, Vietnam. The arc melted master alloy was crashed into
small pieces and put inside the quartz tube crucible for re-melting by induction furnace
using a medium frequency generator with a maximum power of 25 kW at a nominal
frequency of 10 kHz.
Fig. 4.2 Melt-spinning Mechine
68
Fig. 4.2 shows the pictorial view of the melt-spinning mechine. The quartz crucible has
in its bottom part a rectangular nozzle tip of 8 mm length and 0.7 mm width. The
position of the nozzle tip can be adjusted with respect to the copper wheel surface, so
that the molten alloy was perpendicularly ejected onto the wheel surface from a distance
of about 0.3 mm. The small pieces of the master alloy samples were inductively
remelted inside the quartz tube crucible followed by ejecting the molten metal with an
over pressure of 250 mbar of 99.9% pure Ar supplied from an external reservior
through a nozzle onto a rotating copper wheel with surface velocity of 30 m/sec. The
temperature was monitored by an external pyrometer from the upper surface of the
molten alloy through a quartz window. The metal alloys were ejected at a temperature
of about 150-250 K above the melting point of the alloy. The resulting ribbon samples
had thickness of about 20-25 µm and width of ~6 mm. Processing parameters such as
the thermal conductivity of the rotating quench wheel, wheel speed, ejection pressure,
thermal history of the melt before ejection, distance between nozzle of quartz tube and
rotating wheel, as well as processing atmosphere have influenced on the microstructure
and properties of melt-spun ribbons [4.3-4.7].
Therefore, all the above mentioned parameters were very precisely controled.There
were numerous studies concerned with the effect of processing parameters on the
microstructure and properties of amorphous ribbon [4.8]. While these studies give
direction to the control of the microstructure of melt-spun ribbon, the effect of
atmosphere on the microstructure during melt spinning was studied [4.9]. It has been
established that helium atmosphere enhances the quench-ability of the ribbon over
argon and vacuum. But inspite of that considering the cost effectiveness of the
production argon atmosphere is very frequently used. The lower pressure of 250 mbar
as mentioned above stabilizes the turbulence between melt pull and rotating copper
wheel enhancing the heat transfer resulting in a more uniform quenching. As a result a
more uniform ribbon microstructure can be obtained at relatively low wheel speed.
With increasing wheel speeds for a given ejection rate, the increasing extraction rate
results in thinner ribbons.

69
4.1.3 Thermal Treatment of the Amorphous Ribbons
In order to study nanocrystallization behavior by X-ray diffraction and magnetic
properties upon evolution of nanocrystalline phase on amorphous matrix thermal
treatment i.e. annealing is required to perform. For X-ray diffraction, as prepared
amorphous ribbons were cut into small pieces of about 2 cm length and for magnetic
measurement such as permeability toroidal core were wound for annealing treatment. A
microprocessor controlled tubular furnace was used for the annealing treatment. A
laboratory built vacuum system made by quartz tube capable of evaluating up to 10-5
torr was used for this purpose. The samples were put into the quartz tube and evacuated
(10-5 torr) before it had been put inside the tubular furnace heated to a preset
temperature and kept for the time required to complete the annealing. In this way all the
isothermal annealing as a function of time were performed.
4.2 Differential Scanning Calorimetry
Differential scanning calorimetry (DSC) is a technique in which the difference
in the amount of heat required to increase the temperature of a sample and reference are
measured as a function of temperature. In the present study Perkin Elmer, DSC7 was
used, which had a temprtature scanning range from room temperature to ~900°C. DSC
measurement was used to identify the phase transformation such as glass transition and
crystallization. The sample was put in a Pt pan and placed on a Pt holder. An empty pan
was placed in the other Pt holder for a reference. The sample pans were designed to
have a very high thermal conductivity. In the present investigation the amount of each
sample was 10 mg. Fig. 4.3 shows a schematic diagram of a DSC system.

70
Fig.4.3 Schematic diagram of differential scanning calorimetry (DSC).
The instrument cells are often airtight to shield the sample and reference from external
thermal perturbations. This also allows experiments to be performed under variable
pressures and atmospheres. The whole system was purged with high purity Ar gas to
minimize sample oxidation. The heating rates for non-isothermal scans were 10 to
50K/min with a step of 10K. The temperature and enthalpy were calibrated using pure
In and Zn standards. In isothermal mode, the temperature of the referance and the
sample was raised to the pre-setting temperature and kept isothermally. In our
experiment non-isothermal DSC were used to study the phase transformation kinetics.
Whether more or less heat must flow to the sample depends on whether the process is
exothermic or endothermic. For example, as a solid sample melts to a liquid it will
require more heat flowing to the sample to increase its temperature at the same rate as
the reference. This is due to the absorption of heat by the sample as it undergoes the
endothermic phase transition from solid to liquid. By observing the difference in heat
flow between the sample and reference, differential scanning calorimeters are able to
measure the amount of heat absorbed or released during such transitions. DSC may also
be used to observe more subtle phase changes, such as glass transitions. DSC is widely
used in industrial settings as a quality control instrument due to its applicability in
evaluating sample purity and for studying polymer curing.

71
Fig. 4.4 Differential Scanning Calorimeter (TA Instruments Q100).
A typical differential scanning calorimeter consists of two sealed pans: a sample pan
and a reference pan which is generally an empty sample pan. These pans are often
covered by or composed of aluminum, which acts as a radiation shield. The two pans
are heated, or cooled, uniformly while the heat flow difference between the two is
monitored. This can be done at a constant temperature, but is more commonly done by
changing the temperature at a constant rate, a mode of operation also called temperature
scanning. Fig. 4.4 shows a pictorial view of a DSC setup of Thermal Analysis, U.S.A.,
model Q100.
During the determination, the instrument detects differences in the heat flow between
the sample and reference. This information is sent to an output device, most often a
computer, resulting in a plot of the differential heat flow between the reference and
sample cell as a function of temperature. When there are no thermodynamic physical or
chemical processes occurring, the heat flow difference between the sample and
reference varies only slightly with temperature, and shows up as a flat, or very shallow
base line on the plot. However, an exothermic or endothermic process within the sample

72
results in a significant deviation in the difference between the two heat flows. The result
is a peak in the DSC curve. Generally, the differential heat flow is calculated by
subtracting the sample heat flow from the reference heat flow. When following this
convention, exothermic processes will show up as positive peaks above the baseline
while peaks resulting from endothermic processes are negative below the baseline.
The result of a DSC experiment is a heating or cooling curve. This curve can be used to
calculate enthalpies of transitions. This is done by integrating the peak corresponding to
a given transition. It can be shown that the enthalpy of transition can be expressed using
the following equation:
∆H = KA (4.1)
where ∆H is the enthalpy of transition, K is the calorimetric constant, and A is the area
under the curve. The calometric constant will vary instrument to instrument, and can be
determined by analyzing a well-characterized sample with known enthalpies of
transition[4.10]. An arbitrary DSC thermogram is displayed in fig. 4.5 showing various
transformations.
Fig. 4.7 DSC curve
Fig. 4.5 Heat flow as a function of Temperature of DSC curve.
Fig. 4.5 Heat flow as function of temperature of DSC Curve

73
As the temperature increases, an amorphous solid will become less viscous. At some
point the molecules may obtain enough freedom of motion to spontaneously arrange
themselves into a crystalline form. This is known as the crystallization temperature (Tc).
This transition from amorphous solid to crystalline solid is an exothermic process, and
results in a peak in the DSC signal. As the temperature increases the sample eventually
reaches its melting temperature (Tm). The melting process results in an endothermic
peak in the DSC curve. The ability to determine transition temperatures and enthalpies
makes DSC an invaluable tool in producing phase diagrams for various chemical
systems [4.11].
4.3 X-ray Diffraction
4.3.1 Introduction
The German Physicist Wilhelm Roentgen discovered X-rays in 1885. X-rays are
electromagnetic waves of short wavelengths in the range of 10-2 to 102 Å. Unlike
ordinary light, these rays are invisible, but they travel in straight lines and affect
photographic film in the same way as light. On the other hand, they were much more
penetrating than light and could easily pass through the human body, wood, quite thick
pieces of metal and other “opaque” objects.
4.3.2 Electromagnetic Radiation
X-rays are electromagnetic radiation of exactly the same nature as light but of
very much shorter wavelength. The unit of measurement of wavelength in the X-ray
region is the Angstrom (Å), equal to 10-10 m and X-ray used in diffraction have
wavelengths lying approximately in the range 0.5 to 2.5 Å, whereas the wavelength of
visible light is of the order of 6000 Å.

74
X-ray therefore occupies the region between gamma and ultraviolet rays in the complete
electromagnetic spectrum as shown in fig: 4.6.
Fig. 4.6 Electromagnetic spectrum.
The approved SI unit for wavelength in the X-ray region is nanometer:
1 nanometer = 10-9m = 10 Å.
4.3.3 Production of X-ray
We have seen that X-rays are produced whenever high-speed electrons collide with a
metal target. Any X-ray tube must therefore contain (i) a source of electrons, (ii) a high
accelerating voltage and (iii) a metal target. Furthermore since most of the kinetic
energy of the electron is converted into heat, the latter is almost always water-cooled to
prevent its melting.
All X-ray tubes contain two electrodes, an anode (the metal target) maintained, few
exceptions, at ground potential, on a cathode maintained at a high negative potential,
normally of the order of 30000 to 50000 volt for diffraction work. X-ray tubes may be
divided into two basic types, according to the way in which sections are produced by

75
the ionization of small quantity of gas (residual) air in a partly evacuated tube and
filament tubes, in which the source of the electrons is a hot filament.
4.3.4 X-ray Diffractometer
Thin sheets of the samples were prepared from the alloy ingot by rolling the
ingot. Sharp strip like samples were cut from the thin sheet for Debye-Scherrer
experiment.
Fig. 4.7 Block diagram of the PHILIPS PW 3040 X’Pert PRO XRD system.
After heat treatment of the samples separately to remove strain the lattice parameter of
the quenched specimen in the disordered state were measured by Debye-Scherrer
method using Cu radiation. In the present case a special technique was used to

76
determine the lattice parameter using Debye-Scherrer method. The shape of the sample
was used as the same of Debye-Scherrer method sample. But in the conventional
Debye-Scherrer experiment, sharp strip sample rotates and X-ray tube and camera
remain fixed. In the present case, sample was kept fixed and X-ray tube and detector
were moved to the θ and 2 θ ranges respectively. Instead of the film, digital data was
recovered for the whole 2 θ range.
After the pattern is obtained the value of 2 θ is calculated for each diffraction line; set of
2 θ values is the raw data for the determination of the lattice parameters of the unit cell.
Fig. 4.7 shows the block diagram of Phillips PW3040 X’ Pert PRO X-ray
diffractometer.
A PHILIPS PW 3040 X’Pert PRO X-ray diffractometer was used for the lattice
parameter determination in the Materials Science Division, Atomic Energy Center,
Dhaka. Fig. 4.8 shows the inside view of the X’Pert PRO XRD system.

77
Fig.4.8 A PHILIPS PW3040 X’Pert PRO X-ray diffractometer.
The X’Pert PRO XRD system contains the following parts:
(i).“Cu-Tube” with maximum, input power of 60 kV and 55 mA
(ii). “Ni-Filter” to remove the CuKα component.
(iii). “ Programmable Divergent Slit” (PDS) to reduce divergence of beam and control
irradiated beam area.
(iv).”Mask” to get desired beam area.
(v). “Sample holder” for powder sample.
(vi). “Anti Scatter Slit” (ASS) to reduce air scattering background.
(vii). “Programmable Receiving slit “ (PRS) to control the diffracted beam intensity.
(viii). “Soller Slit”to stop scattered beam and pass parallel diffracted beam.
A PHILIPS PW3040 X’pert PRO X-ray diffractometer was used to study the crystalline
phases of the prepared samples in the Materials Science division, Atomic Energy
Centre, Dhaka. The powder diffraction technique was used with a primary beam power

78
of 40 kV and 30 mA for Cu radiation. A nickel filter was used to reduce CuKβ radiation
and finally Cu-Kα radiation was only used as the primary beam. A 2θ scan was taken
from 30o to 90o to get possible fundamental peaks with the sampling pitch of 0.02o and
time for each step data collection was 1.0 sec. After that data of the samples were
analyzed by computer software.
Fig.4.9 Schematic diagram of X-ray.
The aim of the present study was to determine the grain size of Fe73.5-
xCrxCu1Nb3Si13.5B9 (x = 0,1,2,3,4,5,6,7,8,9,10,12.5,15&17.5) alloys. The grain size of
the prepared samples were determined from the strongest peak of each XRD patterns
using Scherrer’s formula,
θβ
λ
cos9.0
=gD (4.2)
where, Dg is the average grain size, λ is the wavelength of the radiation used as the
primary beam of Cu-Kα (λ = 1.54178 Å), θ is the angle of incidence in degree and β is
the full width at half maximum (FWHM) of the strongest reflection (110) in radian,
which was determined experimentally after correction of instrumental broadening (in
the present case it is 0.07o).
The peaks in an X-ray diffraction pattern are directly related to the atomic distance. Let
us consider an incident X-ray beam interacting with the atoms arranged in a periodic

79
manner as shown in fig. 4.10. The atoms represented as block spheres in the figure, can
be viewed as forming different sets if planes in the crystal.
Fig. 4.10 Bragg’s diffraction pattern.
For a given set of lattice plane with an inter planner distance of d, the condition for a
diffraction to occur can simply written as
2dh k l sinθ = nλ (4.3)
which is known as Bragg’s law. Where, λ is the wavelength of the X-ray, θ is the
scattering angle and n is an integer representing the order of the diffraction.
4.3.5 Determination of Nanometric Grain Size by X-ray Diffraction
Nanocrystalline alloys are above all crystalline and because of their crystallinity
exhibit Bragg scattering peaks in X-ray diffraction experiments. However, due to their
small size, significant fine particle broadening is observed in the Bragg peaks. The
condition for constructive interference, reinforcement of X-ray scattering from a
crystalline solid is given by Bragg’s law:
θλ sin2dn = (4.4)

80
This equates the path difference of X-rays scattered from parallel crystalline planes
spaced d = dhkl apart to an integral (n) number of X-ray wavelengths λ. Here θ is the X-
ray angle of incidence (and of diffraction) measured with respect to the crystalline
planes. For an infinite crystal Bragg scattering occurs at discrete values of 2θ satisfying
the Bragg condition, i.e. Bragg peaks are δ-functions. For finite sized crystals the peaks
are broadened over a range of angles as shown in fig. 4.11
Fig.-4.11 Effect of fine particle size on diffraction curves (schematic).
Scattering angle,θθθθ
Fig. 4.11 Effect of fine particle size on diffraction curves (schematic)
To better understand the phenomenon of fine particle broadening following argument of
Cullity, [13] we consider a finite crystal of thickness, mdD = , where m is an integer,
and d is the distance between crystalline planes, i.e., there are m planes in D .
Considering Fig.-3.3, if the broadened Brag peak begins at an angle 22θ and ends at
12θ , the breadth of the peak or full width at half maximum is given as:
( ) 2121 222
1θθθθβ −=−= (4.5)
Now consider the path differences for each of the two angles 1θ and 2θ , for X-rays
traveling the full thickness of the crystal. The width β is usually measured in radians.

81
We now write path difference equations for these two angles, related to the entire
thickness of the crystal rather to the distance between adjacent planes.
( )λ+=θ 1msinD2 1 (4.6)
( )λ−=θ 1msinD2 2 (4.7)
By subtraction we find:
( ) λ=θ−θ 21 sinsinD (4.8)
λ=
θ−θ
θ+θ
2sin
2cos2D 2121 (4.9)
But θ1 and θ2 are both very nearly equal to θ, so that θθθ 221 ≈+ and
−≈
−
22sin 2121 θθθθ
so that equation (4.9) can be written as:
λ=
θ−θθ
2.cosD2 21 (4.10)
From equation (4.5) and equation (4.10) we get:
λ=θβ cosD. (4.11)
θβ
λ=
cosD (4.12)
A more exact empirical treatment yields:
θβ
λ=
cos
9.0D , (4.13)
which is known as the Scherrer’s formula. It is used to estimate the particle size of very
small crystals from the measured width of their diffraction curves.

82
4.4 Magnetization Measurement Techniques
There are various means of measuring magnetization of a substance. The
magnetization of a substance is usually determined by measuring its magnetic moment
divided by the volume or mass of the substance. In the present study magnetization has
been performed using a Vibrating Sample Magnetometer (VSM) and a Superconducting
Quantum Interface Device (SQUID) magnetometer
4.4.1 Vibrating Sample Magnetometer (VSM)
Vibrating Sample Magnetometer developed by S. Foner [4.14, 4.15] is a
versatile and sensitive method of measuring magnetic properties and is based on the
flux change in a coil when the sample is vibrated near it. The Vibrating Sample
Magnetometer (VSM) is an instrument designed to continuously measure the magnetic
properties of materials as a function of temperature and field. In this type of
magnetometer, the sample is vibrated up and down in a region surrounded by several
pickup coils. The magnetic sample is thus acting as a time-changing magnetic flux,
varying inside a particular region of fixed area. From Maxwell’s law it is known that a
time varying magnetic flux is accompanied by an electric field and the field induces a
voltage in pickup coils. This alternating voltage signal is processed by a control unit
system, in order to increase the signal to noise ratio. The result is a measure of the
magnetization of the sample. Schematic diagram of the vibrating sample magnetometer
is shown in fig. 4.12.
In the present thesis work we used two different VSMs’ at two different institutes for
the measurements. One of them is digital measurement system (DMS 880 VSM, USA)
situated at the center for materials science (CMS), National University of Hanoi,
Vietnam. It is a computer controlled commercial type VSM and capable to take
program measurement. The field can be varied 0 and 13 KOe with a field resolution of
10-2 Oe. Field can be controlled in stepped mode, which gives better accuracy of field
measurement. For a high temperature measurement the sample is put inside an oven
made of quartz glass and the temperature is controlled with the precision controller, in

83
which the temperature can be increased with different heating rates according to the
desired rate. Isothermal magnetization measurement as a function of field can also be
performed by this VSM. Another laboratory built sensitive VSM installed at the
Institute of Materials Science, Vietnamese Academy of Science and Technology; Hanoi
has also been used to measure the magnetization of the samples as a function of field
and temperature. In these VSM the maximum field used in our experiment is 10KOe.
Where the temperature was varied from room temperature to 1000 K. In this VSM
temperature scan was continuous in which the magnetization data were recorded after a
regular interval of time. Therefore an enormous number of data were recorded which
gives more precision measurement for an accurate determination of phase transition
temperature as well as the onset of crystallization temperature. Above room temperature
and high temperature oven with a PID temperature controller was used. Thermocouple
placed adjacent to the sample and continuous flow of helium exchange gas was
maintained. The sensitivity of the both VSM used in the present investigation is ≈ 10-5
emu and all of them have the same working principle with slight deviation in their
constructions. The applied magnetic field can be varied between 0 and 13 KOe.
Fig.4.12 Vibrating Sample Magnetometer (VSM)

84
4.4.2 SQUID magnetometer
In the present work a Superconducting Quantum Interface Device (SQUID)
magnetometer MPMS XL, USA was used for a detail study of the magnetic properties
at the Department of Engineering Sciences, Angstrom Laboratory, Uppsala University,
Sweden. The magnetic properties measurement system MPMS XL is a sophisticated
analytical instrument configured specially for the study of the magnetic properties of
small samples over a broad range of temperature from 4.2 K to 400 K and magnetic
fields from –50 KOe to +50 KOe. This standard system made by Quantum Design Inc.
USA can measure the magnetic moment of solid powder and liquid samples with a
differential sensitivity of 10-9 emu and can handle a maximum signal size of 0.5 emu. A
general view of the MPMS XL with its system components is shown in fig. 5.13. The
most sensitive available device for measuring magnetic fields, based on this sensitive
device the so-called ‘SQUID magnetometers’ have been developed. SQUID
magnetometers are used to characterize materials when the highest detection sensitivity
over a broad temperature range and using applied magnetic fields up to several Tesla is
needed. Nowadays, this instrument is widely used worldwide in research laboratories.
The system is designed to measure the magnetic moment of a sample, from which the
magnetization and magnetic susceptibility can be obtained. Therefore, SQUID
magnetometers are versatile instruments that perform both, DC and AC magnetic
moment measurement.

85
Fig. 4.13 SQUID Magnetometer.
The major components of a SQUID magnetometer are: superconducting magnet,
superconducting detection coil, a SQUID connected to the detection coil,
superconducting magnetic shield. Superconducting magnets are solenoid made of
superconducting wire which must be kept at liquid helium dewar. The uniform
magnetic field is produced along the axial cylindrical bore of the coil. The
superconducting pick-up coil system, which is configured as a second order gradiometer
is placed in the uniform magnetic field region of the solenoidal superconducting
magnet. The SQUID device is usually a thin film that functions as an extremely
sensitive current to voltage converter. Measurements are done in this equipment by
moving the samples through the second order gradiometer. Hence, the magnetic
moment of the sample induces an electric current in the pick-up coil system.
Superconducting magnetic shield is used to shield the SQUID sensor from the
fluctuations of the ambient magnetic field of the place where the magnetometer is
located and from the large magnetic field produced by the superconducting magnet.

86
Using this kind of equipment we can measure the real and imaginary components of AC
magnetic susceptibility as a function of frequency, temperature, AC magnetic field
amplitude and DC magnetic field, and time. Using a specially designed sample holder
the magnetic moment as a function of angle can also be measured.
It is an important feature of the instrument that one can change the magnetic field either
by “oscillate mode” or “no overshoot mode”. The oscillate mode is used to minimize
the remanent field of the magnet, whenever an accurate value of magnetic field is
needed, e.g. in case of zero field cooling. In the hysteresis measurement the no
overshoot mode has been selected, in which the field is changed directly from one value
to another, and the magnet is returned to its persistent mode.
The MPMS XL features the new reciprocating sample measurement system. Unlike DC
measurements where the sample is moved through the coils in discrete steps the RSO
measurements are performed using a servomotor, which rapidly oscillates the sample is
shown in fig. 4.14.
A shaft encoder on the servomotor records the position of the sample synchronous with
the SQUID signal. The data received is fitted to an ideal dipole moment response. To
ensure this assumption is applicable samples need to be small: the calibration sample is
a cylinder of 3 mm diameter and 3mm height. Sample of this size or smaller than an
ideal point dipole to an accuracy of approximately 0.1%.

87
Figure 4.14: Illustration of an RSO measurement with small amplitude. (a) the ideal SQUID response for a dipole and (b) the movement of the sample within the SQUID pickup coils.
RSO measurements can be made in one of two configurations: Centre or maximum
slope. Centre scans use large oscillations (2 or 3 cm) around the centre point of the
pickup coils. These scans take a long time but the sample always remains properly
located and a large number of measurements are recorded. These give the most accurate
readings.
The maximum slope method oscillates the sample over a small region (0.2cm) at the
most linear part of the SQUID response. The smaller amplitude makes measurements
quicker and prevents the sample being subjected to significant magnetic field variation;
however it also makes the measurement less accurate and susceptible to drift in the
sample position.
The MPMS XL features significant improvements in the temperature control system.
Utilizing a new design for the helium flow impedance, the MPMS XL has capability to

88
operate continuously at temperatures below 4.2 K for indefinite periods of time-
completely removing time limitations for making measurements in this temperature
regime.
The new MPMS XL eliminates the operations associated with filling and recycling the
He reservoir. Thus, the system solves the traditional problems of temperature instability
and hysteresis associated with rapid boil off of liquid helium when warming through
4.2K. The results are smooth monotonic transitions across 4.2 K during both warming
and cooling temperature sweeps. All these capabilities are fully automated for precise
systems control and user-friendly operation.
The addition to a redesigned impedance system, the MPMS XL uses a new thermometer
design for improved temperature accuracy and precise thermal control. The new
thermometry, designed a developed at Quantum Design, is installed in close proximity
to the sample within the sensitive coil detection region. The improved design is
combined with new temperature control capabilities to provide more accurate
measurements of the sample chamber, even under extreme temperature changes.
The new temperature sweep mode of operation provides MPMS XL users with the
ability to take magnetic measurements while sweeping the system temperature at a
controlled rate, automatically with no manual intervention. This mode provides a
controlled, monotonic change in temperature during a measurement sequence at rates up
to 10 K/min. Measurements of temperature dependence over large temperature ranges,
which previously required time consuming temperature stabilization, can now be made
quickly and precisely using temperature sweep mode.
4.5 Components of Complex Permeability Measurements
Determinations of permeability normally involve the measurements of the
change in self-inductance of a coil in the presence of magnetic core. Methods of
measurement those are commonly used are:

89
(i) The LCR bridge method
(ii) Resonance circuits and
(iii) The standing wave method
In this thesis work complex permeability was measured by the LCR bridge method. The
behavior of a self-inductance can now be described as follows. If we have an ideal
lossless air coil of inductance 0L , on insertion of magnetic core with permeability µ ,
the inductance became 0Lµ . The complex impendence Z of this coil can then be
expressed as
µω 0LiiXRZ =+=
( )µµω ′′−′= iLi 0 ,
µωµω ′+′′= 00 LiL (4.14)
where the resistive part
µω ′′= 0LR (4.15)
and the reactive part is
µω ′= 0LX (4.16)
The r.f permeability can be calculated from the complex impendence of a coil using eqn
(4.14). The core is made in the form of torpid to avoid demagnetizing effects.
The real ( µ /) and imaginary ( µ //) part of the complex permeability of the as-cast and
annealed ribbons were measured as a function of frequency and temperature using
Wayne Kerr 3255 B inductance meter and HP 4192 A impedance analyzer in
conjunction with a laboratory built tubular furnace with continuous heating rate of
≈ 50C/min with a very low ac driving field of ≈ 10-3 Oe. From the temperature
dependence of permeability measurement, Curie temperature, Tc of the amorphous
ribbons was determined. From the frequency dependence of complex permeability,
evolution of permeability and magnetic loss component at different stages of
nanocrystallization as affected by thermal treatment at different temperatures was

90
determined using toroids prepared from the ribbons wound with insulating Cu wire. The
Wayne Kerr 3255 B inductance and HP 4192 A impedance analyzer directly measure
the value of inductance, L and loss factor,
D = tan δ (4.17)
From inductance the value of real part of complex permeability, µ / can be obtained by
using the relation,
0L
L=µ′ (4.18)
Here, L is the inductance of the toroid and L0 is the inductance of the coil in the free
space. L0 is determined by using the relation
d
SNL
20
0π
µ= (4.19)
where d
mS
πρ= , µ 0 is the permeability of the vacuum, m is mass of the sample, N is
the number of turns, S is the cross-sectional area of the toroid, d is the average diameter
and ρ is the density of the material. The imaginary part of complex initial permeability
can be determined by using the relation,
'
''tan
µ
µ=δ (4.20)
and the relative loss factor is calculated with the relation /
tan
µ
δ.
The frequency characteristics of the amorphous ribbon samples i.e the permeability
spectra, were investigated using an impedance analyzer (LCR bridge), Wayne Kerr
3255B model, at Materials Science Division, Atomic energy Centre, Dhaka. The
measurements of inductances were taken in the frequency range 1 kHz to 500 kHz. The
values of measured parameters are obtained as a function of frequency and the real and
imaginary parts of permeability and the loss factor µ' was calculated by using above
formulas.

91
4.6 Preparation of the samples for complex permeability
measurement
The amorphous ribbons were wound into toroidal shape having outer and inner
diameters 13 to 15 mm and with the ratio of outer and inner diameters always kept less
than 1.2 in order to improve the homogeneity of the applied field, as also to reduce the
possibility of an inhomogeneous inductance response. Toroids were wound with 10
turns around to apply AC magnetic fields over a wide range of amplitude. While
measuring the permeability of the amorphous ribbon cores at high frequency, the high
electric resistance of these materials generally precludes the trouble some skin effect
found in ribbons. However, the cross section of the amorphous ribbon core to be
measured may have to be kept small in order to avoid dimensional resonance
phenomena. To avoid an increase in resistance owing to skin effect, braided copper wire
is used at frequencies higher than 100 KHz. At higher frequencies the capacitance
arising from winding gives inaccurate values of R and L. It is therefore necessary, to
keep the capacitance of the winding as low as possible. Frequency response
characteristics were then investigated on these ring shaped specimens as a function of
frequency.
92
Results and Discussion
5.1 Crystallization behavior of Fe 73.5-xCr xCu1Nb3Si13.5B9 alloys
5.1.1 Study of Crystallization Behavior of Amorphous Fe73.5-
xCrxCu1Nb3Si13.5B9 Alloys
The understanding of the crystallization kinetics of magnetic amorphous/
nanocrystalline alloys has enormous scientific and technological interest because of the
enhancement as well as deterioration of magnetic properties extremely depends on the
degree of crystallization. Crystallization kinetics is often determined from Differential
Scanning Calorimetry (DSC), Differential Thermal Analysis (DTA) and in magnetic
materials from thermomagnetic analysis (TMA) [5.1-5.3]. Crystallization kinetics have
also been studied by a variety of techniques including high resolution transmission
electron microscope (HRTEM), in-situ XRD, extended X-ray absorption fine structure
(EXAFS) measurements and resistance measurements.
Differential Scanning Calorimetry (DSC) is an important experimental tool to study the
crystallization kinetics of amorphous materials through which the onset of
crystallization, the temperature of primary and secondary crystallization phenomena can
be revealed. Fig.5.1 (a) and fig.5.1 (b) displays the DSC thermogram measured with a
heating rate of 200C/min, where the primary crystallization and secondary
crystallization peak temperatures are well demonstrated for the entire series of Fe73.5-
xCrxCu1Nb3Si13.5B9 (x = 0, 1, 2, 3, 4, 5, 6, 7, 8, 9, 10, 12.5, 15 & 17.5) amorphous alloys
in the form of ribbons, prepared by melt spinning technique. Two well-defined
exothermic peaks corresponding to two different crystallization products are
manifested. Unfortunately the identification and composition of the phases cannot be
ascertained through the DSC measurement.
X-ray diffraction technique confirmed these two phases as bcc-Fe(Si) corresponding to
the first peak while Fe-B to the second peak on the amorphous matrix. This has been
proved by several earlier studies by XRD [5.4-5.8]. It is observed from fig.5.1 (a) and
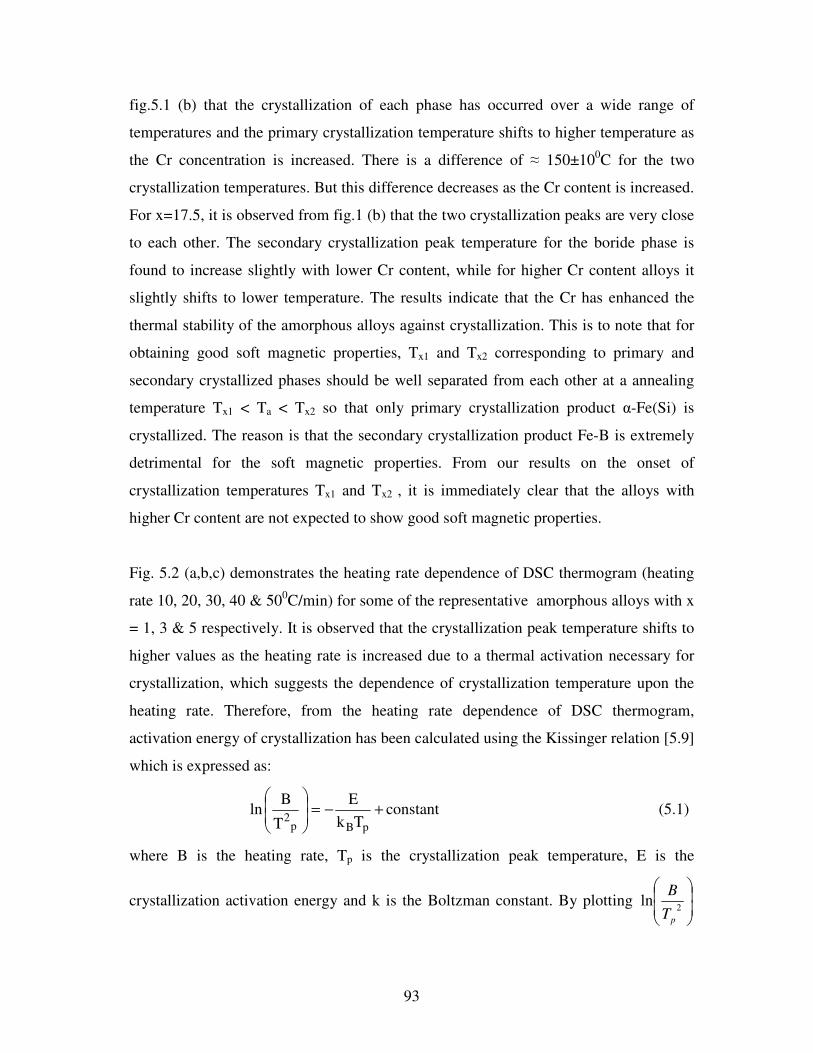
93
fig.5.1 (b) that the crystallization of each phase has occurred over a wide range of
temperatures and the primary crystallization temperature shifts to higher temperature as
the Cr concentration is increased. There is a difference of ≈ 150±100C for the two
crystallization temperatures. But this difference decreases as the Cr content is increased.
For x=17.5, it is observed from fig.1 (b) that the two crystallization peaks are very close
to each other. The secondary crystallization peak temperature for the boride phase is
found to increase slightly with lower Cr content, while for higher Cr content alloys it
slightly shifts to lower temperature. The results indicate that the Cr has enhanced the
thermal stability of the amorphous alloys against crystallization. This is to note that for
obtaining good soft magnetic properties, Tx1 and Tx2 corresponding to primary and
secondary crystallized phases should be well separated from each other at a annealing
temperature Tx1 < Ta < Tx2 so that only primary crystallization product α-Fe(Si) is
crystallized. The reason is that the secondary crystallization product Fe-B is extremely
detrimental for the soft magnetic properties. From our results on the onset of
crystallization temperatures Tx1 and Tx2 , it is immediately clear that the alloys with
higher Cr content are not expected to show good soft magnetic properties.
Fig. 5.2 (a,b,c) demonstrates the heating rate dependence of DSC thermogram (heating
rate 10, 20, 30, 40 & 500C/min) for some of the representative amorphous alloys with x
= 1, 3 & 5 respectively. It is observed that the crystallization peak temperature shifts to
higher values as the heating rate is increased due to a thermal activation necessary for
crystallization, which suggests the dependence of crystallization temperature upon the
heating rate. Therefore, from the heating rate dependence of DSC thermogram,
activation energy of crystallization has been calculated using the Kissinger relation [5.9]
which is expressed as:
ln +−=
pBp2 Tk
E
T
Bconstant (5.1)
where B is the heating rate, Tp is the crystallization peak temperature, E is the
crystallization activation energy and k is the Boltzman constant. By plotting
2ln
pT
B

94
against pT
1, one can derive the value of E from the slope of the straight line which is
depicted in fig. 5.2 (d) for the sample x = 3.The determined values of activation energy
for the crystallization of primary crystallization product bcc-Fe(Si) and secondary
crystallization product Fe-B are E1 = 3.18 and E2 = 4.62 eV respectively. Our results
are comparable with the published literature values [5.10, 5.11].
Table-5.1 shows the crystallization onset temperature, peak temperature for the primary
and secondary crystallization measured with a heating rate 200C/min together with their
corresponding activation energies of crystallization. It is observed from the table-5.1
that the crystallization onset temperature (Tx1) and the peak temperature (Tp1) for the
primary crystallization increase continuously with the increase of Cr substitution for Fe
in the Fe73.5-xCrxCu1Nb3Si13.5B9 alloys. Similar is the situation with the secondary
crystallization temperature Tx2 and Tp2 with the exception that for very high Cr content
in which Tx2 and Tp2 slightly decreases toward the value corresponding to zero Cr
content alloy. The activation energies of crystallization for the α-Fe(Si) and Fe-B phases
are found to increase gradually with increase of Cr content in the alloy system with
slight deviation of few alloys probably due to experimental uncertainty. Rosales-Rivera
et al. [5.12] found similar enhancement of Tx1 and the activation energy with the
increase of Cr concentration in their studied Fe73.5-xCrxCu1Nb3Si13.5B9 system. Primary
crystallization onset temperature (Tx1) in our experiment varies from 5220C for Cr = 1
at.% to 5800C for Cr = 15 at.%. This implies that higher Cr content alloys weaken the
diffusion process to form the crystallization phases since Cr has a melting temperature
(18570C) higher than that of Fe (15360C). From our experimental findings it is clearly
understood that the partial substitution of Fe by Cr enhances thermal stability of
amorphous alloys against crystallization.
The opposite scenario has been observed when the substitution of Co for Fe in the
FINEMET Fe73.5-xCoxCu1Nb3Si13.5B9 alloys is made [5.10]. The crystallization peak
temperature (Tp1) and the activation energy for the primary crystallization E1 decreases
gradually with Co content. This result indicates that the role of Co is to facilitate the

95
formation of crystalline α-Fe(Si) phase. This is to note that the onset of crystallization
temperature has been taken as the temperature at which the exothermic peak starts
rising. The understanding of the crystallization onset, crystallization peak temperature
and the end of crystallization temperature is essential for the determination of
appropriate annealing temperature for nanocrystallization. Temperature and time of
annealing is crucial for controlling the size and volume fraction of nanocrystals, which
ultimately controls the magnetic properties of the FINEMET type of amorphous soft
magnetic alloys.

96
Table-5.1 Crystallization states and activation energy of different phases of
nanocrystalline amorphous ribbons with composition Fe73.5-xCrxCu1Nb3Si13.5B9 alloys
Cr content
x at.%
Primary crystallization temperature, Tx1 in oC
Primary peak temperature, Tp1 in oC
Secondary crystallization temperature, Tx2 in oC
Secondary peak temperature, Tp2 in oC
Activation
energy of
Fe(Si) phase Ea1 in eV
Activation energy of Fe-B phase Ea2 in eV
1 522 542 675
690
3.2 3.6
2 526
557
680
702
3.6 4.2
3 552
569
723
732
3.2 4.6
4 541
561
691
710
3.6 3.5
5 555
573
737
744
2.3 4.5
6 574 579 718 712
8 564
581
696
703
9 543 566 688 704
10 535
559
691
710
12.5 566
575
691
703
15
614
632
677
693
17.5 630 656 671
685

97
Fig. 5. 1(a). DSC thermograms of amorphous ribbons of Fe73.5-xCrxCu1Nb3Si13.5B9 [x = Fig. 1, 2, 3, 4, 5 & 6 ] (b) Fe73.5-xCrxCu1Nb3Si13.5B9 [x = 8, 9, 10, 12.5, 15 & 17.5] alloys.
100 200 300 400 500 600 700 800
(a)
557 0C702 0C
573 0C
579 0C
542 0C
712 0C
569 0C
744 0C
710 0C561 0C
732 0C
690 0C
x = 6
x = 5
x = 4
x = 3
x = 2
x = 1
Hea
t flo
w (a
.u.)
T (°C)
100 200 300 400 500 600 700
(b)
703 0C
632 0C 693 0C
656 0C
575 0C
559 0C710 0C
685 0C
703 0C
566 0C704 0C
581 0C
x = 17.5
x = 15
x = 12.5
x = 10
x = 9
x = 8
Hea
t flo
w (a
.u.)
T (°C)
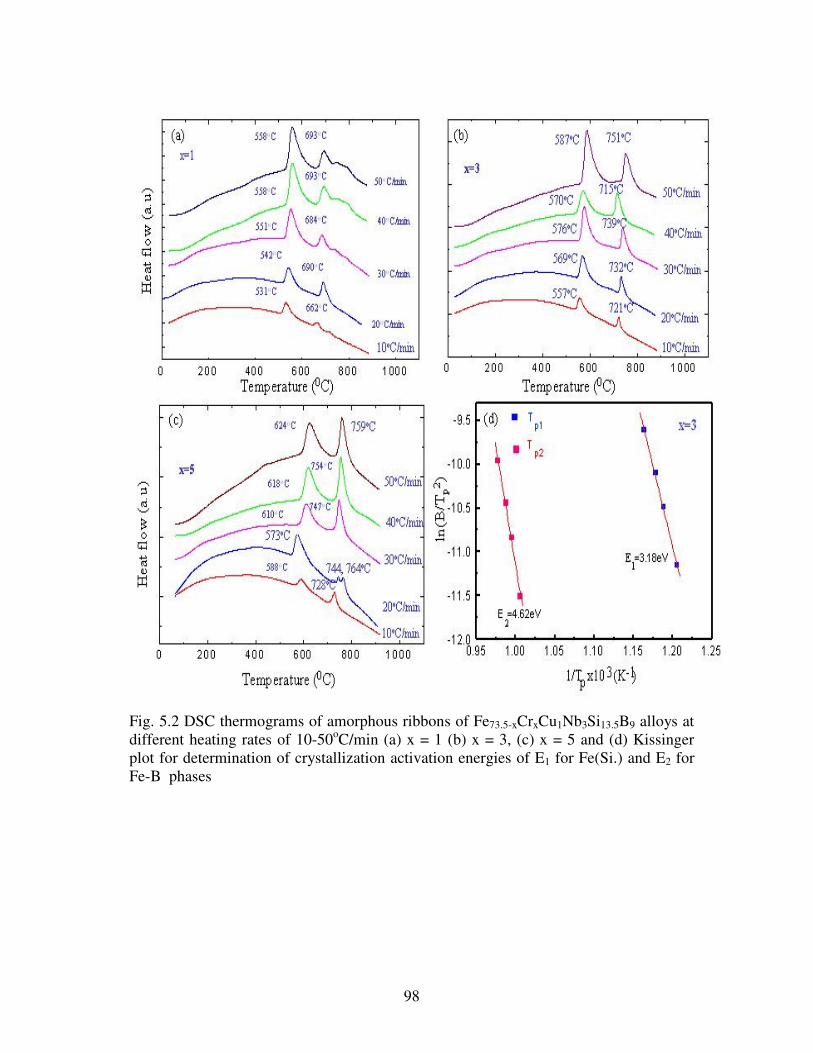
98
Fig. 5.2 DSC thermograms of amorphous ribbons of Fe73.5-xCrxCu1Nb3Si13.5B9 alloys at different heating rates of 10-50oC/min (a) x = 1 (b) x = 3, (c) x = 5 and (d) Kissinger plot for determination of crystallization activation energies of E1 for Fe(Si.) and E2 for Fe-B phases

99
5.1.2 Determination of Crystallization Products and Grain Size
X-ray diffraction is generally used for the identification of various phases while
the grain size is estimated by high-resolution transmission electron microscope
(HRTEM) and/or by X-ray diffraction. Nanocrystalline alloys are above all crystalline
and because of their crystallinity they exhibit Bragg Scattering peaks in X-ray
diffraction experiments. However, due to their small size, significant fine particle
broadening is observed in the Bragg peaks. For 50 nm particles, a broadening of 0.2° at
half width of the peak is expected which can easily be measured. Using Scherrer’s
formula of line broadening, particle size between 5 and 60 nm can be measured using
XRD.
In the present study X-ray diffraction technique has been used to identify the
crystallized phases as well as the grain size of the nanocrystallites that develops due to
annealing of the amorphous precursor. Fig.5.3 (a, b) show the XRD patterns for all the
samples in the amorphous state. It clearly shows the amorphous nature of all the
samples since no sharp peak corresponding to any crystalline peaks is observed, rather a
broad defused halo peaks covering 2θ = 100 is observed. This hump type broad peak is
generally observed for amorphous alloys of FINEMET type composition centering at
450, which corresponds to fundamental peak at (110) plane with 100% intensity of their
crystalline bcc-Fe (Si) phase. The origin of this hump is short range atomic ordering.
Fig. 5.4 (a-f) demonstrates the X-ray diffraction patterns of five samples with x = 1, 3,
10, 12, 15 & 17.5 annealed at various temperatures. It is observed from fig. 5.4 (a, b)
that the broad defuse hump at 2θ = 450 become sharper and the peak intensity increases
as the annealing temperature Ta, increases to Ta = 5400C. In addition another peak
centering around 650 develops corresponding to (200) plane of bcc-Fe (Si). After
analysis of these peaks using computer software (high score) and comparing with the
standard value of bcc-Fe(Si) phase, it has been confirmed that the newly evolved phase
in the amorphous matrix is bcc-Fe(Si). The XRD pattern of x = 10, 12.5, 15 & 17.5
annealed 520, 540, 560 & 6000C are shown in fig. 5.4 (c-f). For the sample with x =

100
12.5 crystallization seems to start at Ta = 5400C while for x = 15 & 17.5 no evidence of
crystallization is observed even at Ta = 5600C & 5800C respectively. Only at Ta = 6000C
crystallization seems to start for the sample x = 17.5. Since the onset of crystallization
temperature for the sample with x = 15 is 5800C (see table-5.1), it is quite obvious that
crystallization cannot take place at Ta = 5600C. The grain size Dg, of the crystallites
have been calculated from the line broadening of the fundamental peak (110) using
Scherrer’s formula
θβ
λ
cos9.0
=gD , (5.2)
where Dg is the grain size, β is the full width at half maximum (FWHM) and λ is the
wave length of Cu-Kα radiation.
It has been observed that the grain size decreases with the increase of Cr content. Grain
size is found to be 9.0, 8.6, 8.0, 7.0, 6.5 nm for Cr content x = 1, 2, 3, 4, 5 annealed at
5400C for 30 min. respectively. It again confirms that the Cr enhances the thermal
stability against crystallization as well as controls the grain growth. Marvin et al. [5.13]
found a grain size of 4 nm for the FINEMET alloy with Fe substituted by 10 at.% Cr
annealed at 818 K which increases to 15 nm at Ta = 873 K. The authors found a
satisfactory agreement of this XRD grain size with the TEM result. The evolution of
grain size with annealing temperature has been determined on FINEMET composition
with Ta substituted for Nb and Au for Cu [5.14, 5.15]. It was observed that grain size
increased from 5 nm for the sample annealed at 5000C for 30 min. to a limiting value of
12-14 nm between annealing temperature of 5250 and 6500C.

101
Fig. 5.3 XRD patterns of amorphous ribbons of Fe73.5xCrxCu1Nb3Si13.5B9 alloys in
the as cast condition: (a) x = 0, 1, 2, 3, 4, 5 & 8 (b) x = 10, 12.5, 15 & 17.5
Fig. 5.4 XRD patterns of Fe73.5xCrxCu1Nb3Si13.5B9 alloys in the as cast condition
and annealed at different temperatures: (a) x = 1 (b) x = 3

102
Fig. 5.4 XRD patterns of Fe73.5xCrxCu1Nb3Si13.5B9 alloys in the as cast condition
and annealed at different temperatures: (c) x = 10 (d) x = 12.5 (e) x = 15 (f) x = 17.5
Inte
nsity
Inte
nsity
10 20 30 40 50 60 70
x = 10
(200
)
(110
)
T a = 560°C
T a = 540°C
T a = 520°C
as-cast
20 30 40 50 60 70
x = 12.5
(110
)
Ta = 560°C
Ta = 540°C
T a = 520°C
as-cast
20 30 40 50 60 70
x = 15
T a = 560°C
T a = 540°C
T a = 520°C
as-cast
Inte
nsity
2 θ (degree)
(c) (d)
(e)
2 θ (degree)
2 θ (degree)
Inte
nsity
0
20
40
60
80
100
120
140
160
20 30 40 50 60 70
2θ (deg.)
Inte
nsity
(a.u.
)
0
5
1 0
1 5
2 0 2 5 3 0 3 5 4 0 4 5 5 0 5 5 6 0 6 5 7 0
0
1 0
2 0
3 0
2 0 2 5 3 0 3 5 4 0 4 5 5 0 5 5 6 0 6 5 7 0
0
5
1 0
1 5
2 0 2 5 3 0 3 5 4 0 4 5 5 0 5 5 6 0 6 5 7 0
0
5
1 0
1 5
2 0 2 5 3 0 3 5 4 0 4 5 5 0 5 5 6 0 6 5 7 0
0
2
4
6
8
1 0
1 2
1 4
2 0 2 5 3 0 3 5 4 0 4 5 5 0 5 5 6 0 6 5 7 0
0
2
4
6
8
1 0
1 2
1 4
1 6
1 8
2 0
2 0 3 0 4 0 5 0 6 0 7 0
as-cast Ta=520°C
Ta=540°C Ta=560°C Ta=580°C
Ta=600°C
x=17.5
103
5.2 Magnetization Measurements
5.2.1 Saturation Magnetization
Saturation magnetization (Ms) a basic quantity of magnetic materials has been
measured using a SQUID magnetometer. Fig. 5.5 (a) and 5.5 (b) shows magnetization
curves at 5K and 300K respectively. It is evident from the curves that the magnetization
is saturated for all the studied samples with x = 0 to 17.5 measured at 5K. This implies
that all the studied samples are ferromagnetic at 5 K. In contrast, magnetization
measured at 300K, the samples with x = 0 to 10 are saturated with an applied field of 8
kOe. The samples with Cr content x ≥ 12.5 do not show any sign of ferromagnetic
nature, rather a very small value of magnetization is observed which increases almost
linearly up to the field of H = 8 kOe. The M ~ H curves of these samples show typical
characteristics of paramagnets at room temperature. But they are ferromagnetic at T = 5
K as shown in fig.5.5 (a).
The saturation magnetization values of all the studied samples at 5K and 300K are
shown in table-5.2. It is evident from the results that the Ms decreases as the Cr contents
increase. This may be attributed to the dilution of Fe magnetic moment by the
substitution of non magnetic Cr. Saturation magnetization value of Ms = 160 emu/gm
and 137 emu/gm measured at 5 K and 300 K respectively for the x = 0 which
decreases monotonically with the successive substitution of Fe by Cr and attains a value
of Ms = 52.2 emu/gm at 5K for x = 17.5. The saturation magnetization value Ms for the
original FINEMET alloy i.e. x = 0 was found to be comparable within an experimental
error of ±5% by several investigators [5.16-5.18].

104
Table-5.2 Curie temperature and magnetic parameters (5K & 300K) of nanocrystalline Fe73.5-xCrxCu1Nb3Si13.5B9 alloys
Cr content x (at.%)
Curie temperature, Tc in K
Saturation magnetization, M0 in emu/g at 0K
Saturation magnetization, Ms in emu/g at 5K
Saturation magnetization, Ms in emu/g at 300K
Magnetic moment, nB in Bohr magneton at 5K
Magnetic moment, nB in Bohr magneton at 300K
0 596 160.3 160 137 1.41 1.21 1 566 155.3 155 130 1.37 1.15 2 540 147.6 147 115 1.29 1.01 3 517 133.4 133 111 1.17 0.98 4 490 127.8 127 99 1.12 0.87 5 466 122.9 122 89 1.07 0.78 6 435 119.7 119 87 1.04 0.76 7 412 111.2 111 72 0.97 0.63 8 390 107.8 107.6 65.2 0.94 0.58 9 371 103.1 101 56.2 0.88 0.5 10 364 92.8 92.5 48.18 0.81 0.42 12.5 247 72.6 72.5 3.33* 0.63 0.03 15 196 67.2 67 2.42* 0.58 0.02 17.5 143.5 52.8 52.2 2.14* 0.45 0.02
* Not saturation magnetization, Ms
; it defines magnetization value at H=1 Tesla.

105
Fig.5.5 Field dependence of magnetization of amorphous Fe73.5xCrxCu1Nb3Si13.5B9
ribbons with x = 0, 1, 2, 3, 4, 5, 6, 7, 8, 9, 10, 12.5, 15 & 17.5 alloys at (a) 5K and (b) 300K
0
20
40
60
80
100
120
140
160
0 2000 4000 6000 8000 10000 12000
H (Oe)
M (
emu/
g)
Cr-0
Cr-1
Cr-2
Cr-3
Cr-5
Cr-6
Cr-7
Cr-8
Cr-9
Cr-10
Cr-12.5
Cr-15
Cr-17.5
Cr-4
Fe73.5-xCrxCu1Nb3Si13.5B9
T = 300 K
0
20
40
60
80
100
120
140
160
180
0 2500 5000 7500 10000 12500H (Oe)
M (
emu/
g)Cr-0
Cr-1
Cr-2
Cr-3
Cr-4
Cr-5
Cr-6
Cr-7
Cr-8
Cr-9
Cr-12.5
Cr-15
Cr-17.5
Cr-10Fe73.5-xCrxCu1Nb3Si13.5B9
T = 5 K
(a)
(b)

106
5.2.2 Curie Temperature
Curie temperature is a primary intrinsic property of magnetic materials. A
material is ferromagnetic if it possesses regions of finite magnetization where the
external magnetic field intensity H = 0. The temperature at which ferromagnetism
occurs is called the Curie temperature (Tc) and depends on the strength of exchange
interaction which arises from the overlapping of the electronic wave functions of the
interacting magnetic atoms. It is more appropriate from the fundamental point of view
to find out the Tc from the appearance of spontaneous magnetization on decreasing the
temperature (cooling) than the vanishing of spontaneous magnetization as the
temperature is increased (warning) because of many complexities of the co-operative
phenomena, in particular domain wall motion. In general determination of Tc is not that
straight forward as it seems to be from the first principle and the unique value of Tc
can be determined without ambiguity only when the material under study is perfectly
homogeneous, single phase, defect free and of high purity.
The Curie temperature of the studied samples has been determined by various methods
such as temperature dependence of high and low field dc magnetization, low field ac
susceptibility and initial permeability (H = 10-3 Oe), Arrott plots etc. Fig. 5.6 shows
the temperature dependence of permeability (µ) of some representative curves of the
samples with x = 1, 3, 5 & 8 measured by an inductance meter in conjunction with a
tubular furnace. Curie temperature has been taken as that temperature where the Tδ
δµ
attains its maximum value.
It is observed that the Curie temperature decreases with increase of Cr content and may
be attributed to the reduction of exchange interaction between Fe magnetic moment. A
gradual decrease of permeability below Tc is a manifestation of the Hopkinson effect,
according to which the initial permeability as a function of temperature increases to a
maximum value just below Tc and then drops off to a small value [5.19]. This is
attributed to the temperature dependence of intrinsic magnetic anisotropy and domain

107
wall mobility. This is to note that the samples with x ≥ 5 at.% Cr, the decrease of
permeability below the Hopkinson peak is faster than those of low Cr content samples.
This implies that the magnetic hardening occurs in those higher Cr content alloys,
which increases with the Cr content as well as with the decreasing temperature
originating from the increase of the magnetic anisotropy and thermal activation. Similar
magnetic hardening of higher content amorphous alloys has been observed in the
temperature dependence of ac susceptibility and field-cooled dc magnetization
measurements, which would be discussed later on in the relevant section.
Fig. 5.7 shows the temperature dependence of saturation magnetization measured with
an applied field of 10 kOe in the temperature range 5-700K for the sample with x = 1, 2,
3, 6 & 8 in the as cast condition. All the samples of this studied system have been
measured, but the representative curves of the above-mentioned samples are shown for
clarity. From these curves Curie temperature (Tc) has been determined as the
temperature corresponding to the inflexion point where the rate of change of
magnetization with respect to temperature is maximum. The Curie temperature
determined in this method varies from 596 K for x = 0 to 142 K for x = 17 at.% Cr
within an experimental uncertainty of ±2K since magnetization was recorded at an
interval of 2K.
It is clearly observed from the curves of Fig. 5.7 that the saturation magnetization of
the samples at low temperature decreases gradually with the increase of Cr content.
Similarly, Curie temperature decreases gradually as the Cr content is increased. It is
also noticed that the magnetization at low temperature decreases slowly with the
increase of temperature and falls faster near the Curie temperature. Fig.8 shows the low
field (H = 20 Oe) M ~ T curves for the samples with Cr content x = 10, 12.5, 15 & 17.5
from which Tc values has been determined as the inflexion point. This is note that low
field dc magnetization is a unique method of determining the magnetic phase transition
temperature known as the “kinkpoint” method originally pioneered by L. Neel at
strassbourg (France) in the school of magnetism in the early thirties of the last century
[5.20]. It was later named as “kink point Locus” by Wojtowicz et al. [5.21]. According
to this method

108
magnetization is observed fairly constant until the appearance of a “kink point” beyond
which magnetization sharply falls to zero. The temperature corresponding to the “kink
point” is considered as the ferromagnetic Curie temperature (Tc). The reason for the
temperature independent part of magnetization below Tc is due to demagnetizing field
Fig. 5.6 Temperature dependence of permeability of amorphous ribbons with composition Fe73.5-xCrxCu1Nb3Si13.5B9[ x = 1, 3,5 & 8] alloys

109
Fig. 5.7 Temperature dependence of magnetization of amorphous ribbons with composition Fe73.5-xCrxCu1Nb3Si13.5B9 [x = 1, 2, 3, 6 & 8]
that limits the magnetization to a value s
a
D
HM = (where Ha is the applied magnetic
field and Ds is the shape- dependent demagnetization factor), producing a magnetization
that is temperature independent below the “kink point”. But, in fig. 5.8 the “kink” has
not been observed so distinctly and the magnetization is not observed independent of
temperature with an applied field of H = 20 Oe, rather a smearing effect is observed. It
is possibly due to high value of applied field (H = 20 Oe), which is higher than the
demagnetizing field (Hk). Therefore temperature corresponding to maxima of dT
dM has
been taken as the Cuire temperature. The Curie temperatures determined by low field
(20 Oe) dc magnetization measurements are found to be Tc = 364, 245, 195 & 149 K for
x = 10, 12.5, 15 & 17.5 at.% Cr respectively. These values are within ±2K with high
field M(T) and µ(T) measurements. M vs.T measurements have been performed with H
= 1 Oe to see the effect of still lower field which will be discussed later on.
H=10 kOe

110
Ac susceptibility is a powerful tool to discern the Curie temperature. Temperature
dependence of real part of ac susceptibility χ/ac at frequencies 1.7, 17 & 170 Hz with an
applied ac driving field Hac = 2 Oe is depicted in Fig. 5..9 for the x = 12.5 sample. It is
found that the χ/ac measured at all three frequencies are superimposed. The
susceptibility χ/ac fall rapidly toward zero just above the Curie temperature. The Tc has
been taken as the temperature corresponding to the maxima of dT
d/χ
as proposed by
Maartense et al. [5.22] and found to be Tc = 245 ±1K. This value has good coincidence
with the Tc = 245K determined by low field dc magnetization as shown in Fig. 5.8. Fig.
5.10(a) 5.10(b) show the χ/ac vs T curves for the samples x = 15 & 17.5, where
susceptibility values measured at different frequencies are superimposed, i.e χ/ac is
independent of frequency. A sharp fall of susceptibility at the Curie temperature Tc =
194K and 142K for the sample x = 15 & 17.5 respectively, signifies the homogeneity of
the sample. From the χ/ac vs. T curves, it is clearly observed that χ/
ac decreases gradually
with the decrease of temperature for all the samples with sudden drop of χ/ac for the
sample x = 17.5. This is due to the magnetic hardening effect of higher Cr content
alloys resulting from the increase of anisotropy energy as the temperature is lowered.

111
Fig.5.8. Temperature dependence low field dc magnetization (H = 20 Oe) of amorphous ribbons with composition Fe73.5-xCrxCu1Nb3Si13.5B9 [x = 10, 12.5, 15 & 17.5] alloys
Fig. 5.9 Temperature dependence of ac susceptibility (real χ/) with ac driving field of Hac= 2 Oe for the amorphous ribbon with composition Fe61Cr12.5Cu1Nb3Si13.5B9 atbdifferent frequencies
112
The Curie temperatures determined by both dc and ac techniques are well correlated.
More over Curie temperature (Tc) of the samples with x = 10, 12.5, 15 & 17.5 have also
been determined from the magnetic isotherm taken around the Tc with an interval of 1-
2K using the ABK (Arrot-Belov-Kouvel) plot [5.23-5.25]. A standard procedure for
determining Tc in ferromagnetic materials is based on symmetry principle. Arrott [5.10]
have pioneered the use of a classical form of expression for magnetization and field
near a ferromagnetic phase transition and showed that internal field, Hi, should be an
odd power of magnetization M, and is given by
( ) 53ci CTMBTMMTTAH ++−= (5.3)
where A, B, C are constants.
Since M << Ms, the saturation magnetization around Tc, the terms involving M5 and
higher can be neglected, so that the equation can be written as
( ) 3ci BTMMTTAH +−= (5.4)
( ) 2c
i BTMTTAM
H+−= (5.5)
At T = Tc ; 2MBT
M
HC
i = (5.6)
An approach to Tc is characterized by vanishing of the parameter A. B is the
temperature dependent parameter. Therefore, a value of Tc may be determined from the
magnetic isothermals by plotting at fixed temperatures 2.MvsM
H i . According to equation
(5.4) these plots should yield straight lines for each value of T and Tc corresponds to
that straight line which passes through the origin for a low enough fields, Hi. These
plots are called Arrott-Belov-Kouvel (ABK) plots and sometime shortly called Arrott
plots. Arrot plots not only determine Tc, but also give spontaneous magnetization M02
( 0=M
H) from the intercepts on M2 axis for T < Tc and reciprocal of initial
susceptibility0
1
χ (H→0) from the intercepts on the
M
H i axis for T > Tc.

113
Fig. 5.11(a) and 5.11(b) shows the representative curves of the magnetic isotherms
measured around the Tc of the samples with x = 12.5 & 17.5. From these magnetic
isotherms calculations are made for M2 and H/M to draw the ABK plots considering
low field data which are demonstrated in fig. 5.12 (a, b, c, d). The estimated Tc values
for x = 10, 12.5, 15 & 17.5 are 362, 247, 197 and 143.5 K respectively, which is quite
compatible with other methods of measurements. The Tc values of all the studied
samples are depicted in table-5.2. It is observed that the Tc decreases monotonically as
in the case of Ms with the increase of Cr content. The reduction of Tc with the
substitution of nonmagnetic Cr may be attributed to the simultaneous weakening of the
strength of exchange interaction between the Fe magnetic moments. For x = 0, the Curie
temperature, Tc = 596K which decreases to Tc = 143.5K for x = 17.5. However the Tc
values depicted in table-5.2 are average over all types of measurements. The absolute
values of all these Tc are within ±2K. In spite of careful determination of Tc of the
amorphous alloys by various methods ambiguity of Tc values still remains a open
question specially for the amorphous alloys because amorphous glassy metal alloys are
basically metastable materials. It has been demonstrated by numerous experimental
evidences that when the materials with the same compositions are produced with
different quenching rate, magnetic properties, in particular the Curie temperature can
vary substantially. This fact prevents a reliable comparison between results obtained by
different laboratories [5.26]. The Tc of original FINEMET has been found to vary from
590K to 630K. Therefore the initial amorphous state should be taken into account.

114
Fig. 5.10. Temperature dependence of the real part of ac susceptibility (χ’) with driving field of Hac= 2 Oe for the composition (a) Fe58.5Cr15Cu1Nb3Si13.5B9 and (b) Fe56Cr17.5Cu1Nb3Si13.5B9 at different frequencies
′

115
Fig. 5.11. Field dependence of magnetic isotherms (M vs. H) at different temperatures of the amorphous ribbons with composition (a) Fe61Cr12.5Cu1Nb3Si13.5B9 and (b) Fe56Cr17.5Cu1Nb3Si13.5B9 alloy.
x=17.5
x=12
M (
emu/
g)2
TC=247K
TC=143.5K

116
Fig. 5.12 (a,b,c,d). Arrot plots (M2 vs. H/M) from the magnetic isotherms with composition Fe73.5-xCrxCu1Nb3Si13.5B9 (x = 10, 12.5, 15 & 17.5) alloys
Cr-10
0
50
100
150
200
250
300
350
400
0 10 20 30 40 50
H/M (g.Oe/emu)
359K
361K
363K
365K
367K
(a)
M2 (
emu/
g)2
Cr-12.5
0
50
100
150
200
250
300
350
400
0 20 40 60
H/M (g.Oe/em u)
240 K
242 K
244 K
246 K
248 K250 K
252 K
(b)
M2 (
emu/
g)2
Cr-15
0
50
100
150
200
250
0 20 40 60 80
H/M (g.Oe/emu)
192 K
194 K
196 K
198 K
200 K
202 K
(c)
M2 (
emu/
g)2
Cr-17.5
0
20
40
60
80
100
120
140
160
180
200
0 20 40 60H/M (g.Oe/emu)
140 K141 K142 K
143 K
144 K145 K
147 K
(d)
M2 (
emu/
g)2

117
5.2.3 Temperature Dependence of Magnetization
The variation of saturation magnetization (Ms) as a function of temperature in
the range T = 5K-1000K measured with an applied field of 10 kOe in the amorphous
state for the samples with x = 1, 2, 5, 6, 8 and x = 12.5, 15, 17.5 are shown in fig. 5.13
(a) & 5. 13 (b) respectively. During the magnetization measurements, the heating rate
was always kept constant (20°C/min). The magnetization of all the samples decreases
gradually with increasing temperature since the thermal energy is acting on opposition
to the magnetic coupling or exchange energy between neighboring atoms. As the
temperature approaches to the Curie temperature, magnetization falls more rapidly
toward zero as the thermal energy exceeds the magnetic ordering or the exchange
energy. As a result the sample undergoes a ferro-paramagnetic phase transition at T = Tc
in the amorphous state. It is observed that the magnetization and the Tc of all the
amorphous samples both decreases as the Cr content increase implying the effect of Cr
on the dilution of magnetic moment as well as the weakening of exchange interaction
between Fe magnetic moments respectively. In fig.5.13 (a) it is evidenced that from the
temperature above Tcam until 800K, magnetization value of the studied samples (x = 1,
2, 5, 6, 8) is nearly zero since they are paramagnetic in this temperature range. At
T=800K and above the crystallization behavior of the amorphous samples has been well
demonstrated as the temperature continues to rise further.
The sharp rise of magnetization of all the amorphous samples in their paramagnetic
state is connected to the onset of crystallization of α-Fe(Si) ferromagnetic phase in the
remaining amorphous matrix. The onset of primary crystallization temperature
corresponds well with that of DSC thermogram measured with the same heating rate.
The magnetization of this newly evolved ferromagnetic phase rises fast with the
increase of temperature due to enhanced volume fraction of crystallized α-Fe(Si) phase
and passes through a maximum, beyond which it decreases to a very low value. It is
clearly observed from the thermomagnetic curves shown in fig.5.13 (a) that the height
of the peak related to the crystallization process of α-Fe(Si) phase decreases remarkably
with increasing Cr content indicating the stabilization effect of Cr against primary
crystallization together with the reduction of magnetization of the nanograins. Similar
118
effect of substitution of Fe by Al in FINEMET has been observed by Zorkovska et al.
[5.27]. The decrease of magnetization M after passing through the maximum is
connected to the temperature dependence of magnetization of Fe(Si) crystalline phase
which undergoes a FM-PM phase transition at T ≈ 600°C. This is to note that the onset
of crystallization temperature Tx1 and the peak temperature Tp1 of Fe(Si) phase shifts to
higher temperature as the Cr content of the alloys increases. These features suggest that
the Cr addition enhances the thermal stability of the studied alloys against
crystallization of α-Fe(Si) phase. The values of Tx1 and Tp1 are comparable with values
obtained by DSC measurements in the present work. It is also noticed in the Ms vs. T
curves as shown in fig. 5.13 (b) that the alloys with X ≥ 15, no crystallization events are
observed until T = 1000K. It indicates that the crystallization of Fe(Si) phase is
completely suppressed for higher Cr content alloys which has also been confirmed in
the DSC thermogram and explained earlier.
Fig. 5.13 (b) also shows the M (T) cooling curve of x =12.5, 15 & 17 which correspond
to the fully crystallized samples. During cooling the magnetization rises sharply
indicating a magnetic phase transition from paramagnetic-ferromagnetic. This phase
transition corresponds to crystalline Fe(Si) that vary in their composition due to the
thermal stability against crystallization as affected by Cr content. This shows a
distribution of Curie temperatures of this phase between 825K and 900K. Fig. 5.14
shows the M (T) curve for x = 5 during heating and cooling. The cooling curve M (T)
clearly demonstrates two-phase character. The high temperature phase transition of
Fe(Si) crystalline phase takes place at around T ≈ 875K in both the heating and cooling
cycle. But at lower temperature around 500K another magnetic phase transition
(smeared and diffused) takes place during cooling which corresponds to the remaining
amorphous phase after high temperature crystallization of Fe(Si), while during heating a
well-defined Curie temperature Tc = 466K has been determined for the amorphous state.
From the above measurements it has been elucidated that the thermomagnetic
measurement is a powerful technique to analyze the crystallization behavior of
amorphous ferromagnetic materials provided the crystallization products are
ferromagnetic and the Tc of the amorphous alloys lie below the crystallization

119
temperature. From the temperature dependence of magnetization, the saturation
magnetization, Ms(0) value at 0 K has been determined by extrapolating the low-
temperature magnetization data and are shown in table 5.2.

120
Fig. 5.13 (a) Thermomagnetic curves with an applied field of H=1Tesla of amorphous Fe73.5-xCrxCu1Nb3Si13.5B9 ribbons measured at the heating rate of 20oC/min [x = 1, 2, 5, 6 & 8].
Fig. 5.13 (b) Thermomagnetic curves with an applied field of H=1Tesla of amorphous ribbon with composition Fe73.5-xCrxCu1Nb3Si13.5B9 measured at the heating rate of 20oC/min [x = 12.5, 15 & 17.5] including the cooling curves

121
Fig. 5.14. Temperature dependence of saturation magnetization amorphous ribbon with composition Fe73.5-xCrxCu1Nb3Si13.5B9 with an applied field of H = 1Tesla during heating and cooling with x = 5

122
5.2.4 Variation of Magnetization M(0) and Tc with Cr Concentration
for the Fe73.5-xCrxCu1Nb3Si13.5B9 Alloys
The saturation magnetization M(0), M(5K), M(300K) and Tc with Cr content are
shown in Table-5.2. The magnetic moment in Bohr magneton nB has been calculated
using the formula
B
B N
)0(AMn
µ= (5.7)
where A = molecular weight of alloy composition and M = Magnetization (emu/g) at 0
K.
The results are shown in table-5. 2. The dependence of magnetic moment nB and Tc on
Cr content in the studied alloy system Fe73.5-xCrxCu1Nb3Si13.5B9 are demonstrated in fig.
5.15 (a, b) respectively. The variation of the magnetic moment of the amorphous alloys
can be approximated by a straight line of the form nB =1.3748-0.0552x.

123
Fig. 5.15 Variation of (a) magnetic moment and (b) Curie temperature with the x content of amorphous Fe73.5-xCrxCu1Nb3Si13.5B9 ribbons

124
Magnetic moment for the entire composition range has been found to decrease linearly
with the increase of Cr concentration. The decrease of magnetic moment is 0.055µB for
each atomic percent of Cr substitution. Compare with the Curie temperatures (Tc) is also
found to depend linearly with the increasing Cr concentration. A least-square fitting of
the experimentally determined Tc values against Cr concentration give a linear equation
of the form Tc = 596.76 - 26.337x from which a decrease of Tc by about 26°C per
atomic percentage of Cr substitution has been determined. Kovac et al. [5.28] studied
the dependence of magnetic moment and Curie temperature of Finemet alloys where Fe
has been substituted for Cr with Cr = 4, 8, 11, 14, 17, 25). The authors found a linear
decrease of magnetic moment at the rate of 0.047µB / Cr atom, while Tc decreased 25K
per atomic percent of Cr. Our results are comparable with the result of Krishnan et al.
[5.29] in their study of magnetic properties of Fe40-x/2Nix/2 Crx Si10Mo2B8 alloys (0 ≤ x
≤ 5), found that decrease of magnetic moment is 0.053 µB / at.% Cr while that of Tc is
40K / at.% Cr. The rate of decrease of Tc is much higher than our results while
compatible with results of Inomata et al. [5.30].
The critical concentration for the onset of ferromagnetism in this alloy system has been
estimated to be xc = 24±1 at % Cr by linear exploration of nB = 0 and Tc = 0 as a
function of Cr concentration. This value is in reasonable agreement with the value of xc
= 26±1 at % Cr reported by Kovac et al.[5.28].
5.2.5 Field Cooled and Zero Field Cooled Magnetization Behavior of
Higher Cr Content Amorphous Alloys
Effect of magnetic field on a ferromagnetic material is dependent on the state
of ordering of magnetization. Zero-field-cooled magnetization curves as a function of
field and temperature MZFC (H, T) of a magnetic material are the reflection of the
domain structure of the individual material. When an ordered magnetic material is
cooled in a zero external dc magnetic field from above its Curie temperature (Tc) and
magnetization is measured during heating the sample with the application of low dc
magnetic field, zero-field-cooled magnetization (MZFC) is obtained. In zero-field-cooled
situation magnetic specimens are spontaneously magnetized under the influence of
125
internal molecular field and associated competition between exchange energy,
anisotropy energy etc. which determines the formation of domains. So, MZFC (T) gives
the temperature dependence of virgin domain magnetization. In the field-cooled
magnetization (MFC), the sample is cooled through the Curie temperature with the
application of a magnetic field and the magnetization is measured during cooling it to
the desired temperature keeping the magnetic field applied throughout the
measurement. In the case of field-cooled magnetization (MFC) the external magnetic
field greatly influences the domain formation since the magnetic moments are loosely
coupled to each other above Tc. Therefore the virgin domain magnetization as effected
by exchange and anisotropy energies is smeared out. It has been well demonstrated that
MZFC curve below the Curie temperature is mainly determined by the magnetic
anisotropy of the specific materials [5.31, 5.32] Therefore, it is expected that
magnetically ordered materials will show divergence (MFC ≠ MZFC) below the Curie
temperature between FC and ZFC magnetization when measured with a magnetic field
less than the anisotropy field (Hk) associated with the specific material. This is
associated with a corresponding change in the temperature dependence of coercivity,
which in turn is proportional to the temperature dependence of anisotropy field.
MZFC and MFC have been measured with an applied magnetic field of H = 1Oe for the
samples x = 10, 12.5, 15 & 17.5. Fig. 5.16 (a) and 5.16 (b) shows the representative
curves for x = 15 & 17.5. The divergence between the MZFC and MFC just below the Tc
is observed for all the studied alloys, which increases with the decrease of temperature
and also with the increase of Cr content. This phenomenon may be attributed to the
increase of coercivity at low temperature, which is controlled by the magnetic
anisotropy energy. It is noticed that the divergence between MFC and MZFC at low
enough temperature for x = 17.5 is higher than that of x = 15. From these
measurements, the sharp fall of magnetization at T = Tc is well demonstrated implying
good homogeneity of the prepared samples. At the Curie temperature and above, the
divergence between MFC and MZFC is eliminated due to the vanishing of the magnetic
anisotropy at T = Tc.

126
Fig. 5.16(a). Field-cooled (FC) and Zero Field-cooled (ZFC) magnetization curves with an applied field of 1 Oe for the amorphous ribbon with composition Fe58.5Cr15Cu1Nb3Si13.5B9
Fig. 5.16(b). Field-cooled (FC) and Zero Field-cooled (ZFC) magnetization curves with an applied field of 1 Oe for the amorphous ribbon with composition Fe56Cr17.5Cu1Nb3Si13.5B9
0.0
0.5
1.0
1.5
2.0
2.5
3.0
3.5
4.0
4.5
0 50 100 150 200 250
T (K)
M (
emu/
g)
FCZFC
H = 1 Oe
Fe58.5Cr15Cu1Nb3Si13.5B9
as-cast
(a)
0.00
0.50
1.00
1.50
2.00
2.50
3.00
0 25 50 75 100 125 150 175 200
T (K)
M (
emu/
g)
FCZFC
H = 1 Oe
Fe56Cr17.5Cu1Nb3Si13.5B9
as-cast
(b)

127
5.2.6 Low Temperature Magnetic Behavior of the Amorphous Alloys
It is well known that metallic glasses (amorphous) exhibit spin wave excitation
[5.33-5.35]. The alloys under study are FINEMET type of amorphous alloys with
composition Fe73.5-xCrxCu1Nb3Si13.5B9 (x = 0, 1, 2, 3, 4, 5, 6, 7, 8, 9, 10, 12.5, 15 & 17.5) in the
as-prepared condition. In order to verify whether these alloys also exhibit spin wave
excitation, the low temperature magnetization measurement as a function of
temperature from 5K to 300K with an applied magnetic field of 1 Tesla has been carried
out. The experimental behavior of the saturation magnetization at low temperature was
found to follow the Bloch’s spin-wave theory according to the following equation [5.36,
5.37]:
)1()( 2
5
2
3
0 CTBTMTM −−= (5.8)
where M0 is the saturation magnetization extrapolated at 0 K, B & C are the constants.
Generally, the low temperature behavior of the saturation magnetization of crystalline
ferromagnetic materials can be described within reasonable errors by the first two terms
of equation (5.8) covering narrow range of temperature i.e. 0.2 Tc.
Fig. 5.17 (a, b) shows the temperature dependence of magnetization from 5K to 300K
for all the samples. It is observed that the magnetization relaxes gradually with the
increase of the Cr content and temperature.
Fig. 5.18 (a, b) demonstrates reduced magnetization 2
3
.)0(
)(Tvs
M
TM in the temperature
range of 5K to 200 K. It is observed that Bloch’s 2
3
T law is generally obeyed by all the
compositions and the temperature range of the fitting has been extended to much higher
temperature (0.6 Tc to 0.8 Tc) than found in conventional crystalline ferromagnet. The
data were fitted with a straight line by a linear regression. The slop of the line gives the
constant B which was used to calculate D from the equation (3.29).

128
Fig. 5.17 Temperature dependence of magnetization of amorphous Fe73.5-
xCrxCu1Nb3Si13.5B9 ribbons with an applied field 1 Tesla for (a) 0 ≤ x ≤ 9 and (b) 10 ≤ x ≤ 17.5
0
20
40
60
80
100
120
0 100 200 300 400T (K)
Cr-12.5 (1 Tesla)
Cr-15 (1 Tesla)
Cr-17.5 (1 Tesla)
Cr-10 (1 Tesla)
(b)
M (
emu/
g)
0
20
40
60
80
100
120
140
160
180
0 50 100 150 200 250 300
T (K)
Cr-0
Cr-1
Cr-2
Cr-3
Cr-4
Cr-5
Cr-6
Cr-7
Cr-8
Cr-9
Fe73.5-xCrxCu1Nb3Si13.5B9
(a)M
(em
u/g)

129
However, inclusion of higher temperature term 2
5
T of the equation (5.8) an attempt has
been taken to fit the experimental data of M(T) up to 8.06.0 ≤≤cT
T for all the samples
which show also quite good fitting as shown in Fig. 5.19 (a, b) using the relation
2
5
2
3
0
0
0
)(CTBT
M
TMM
M
M+=
−=
∆ (5.9)
This indicates that the contribution to magnetization in this temperature range is from
low and high-energy spin density waves.
The values of the coefficients B determined from the curves in fig. 5.18 have been used
to fit the nonlinear curves in fig.19 (a, b) considering the high temperature term T5/2 by
adjusting the value of B and C for best fitting. The spin wave stiffness constant D and
the mean square value of the range of exchange interaction <r2> was calculated by using
equation (3.31) [5.35].
The values of the coefficient B, C, spin-wave stiffness constant D, the mean square
value of the range of exchange interactions <r2>, B
C ratio and M0 are shown in table-
5.3 together with the value of crystalline Fe.

130
Fig. 5.18 The dependence of reduced magnetization )(
)(
OM
TM as a function of 2
3
T of
amorphous ribbons with composition Fe73.5-xCrxCu1Nb3Si13.5B9 (a) x = 0, 1, 2, 3, 4, 5, 6,
7, 8 & 9 and (b) x = 10, 12.5, 15 & 17.5 Symbol: Experimental data and full line fitted
with the equation (5.8)

131
Fig. 5.19 Fitting of the low temperature magnetization data with the equation (7) in the temperature range (a) (5-300K) for 0 ≤ x ≤ 8 and (b) 5-250K for 10 ≤ x ≤ 17.5 for the amorphous Fe73.5-xCrxCu1Nb3Si13.5B9 ribbons
Fig. 5.20 Spin wave stiffness constant (D) as a function of Curie temperature (TC)
Table-5.3 parameters describing the temperature dependence of magnetization of the
amorphous ribbons with composition Fe73.5-xCrxCu1Nb3Si13.5B9
0 50 100 150 200 250 300-0.05
0.00
0.05
0.10
0.15
0.20
0.25
0.30
0.35
0.40
∆M
/M(0
)
T (K)
x = 0
x = 1
x = 2
x = 4
x = 5
x = 7
x = 8
0 25 50 75 100 125 1500.00
0.05
0.10
0.15
0.20
0.25
0.30
∆M
/M(0
)
T (K)
x = 10
x = 12.5
x = 15
x = 17.5
y = 0.1805x + 0.039
R2 = 0.9997
0
20
40
60
80
100
120
0 100 200 300 400 500 600 700Tc (K)
D (
meV
/Å2 )
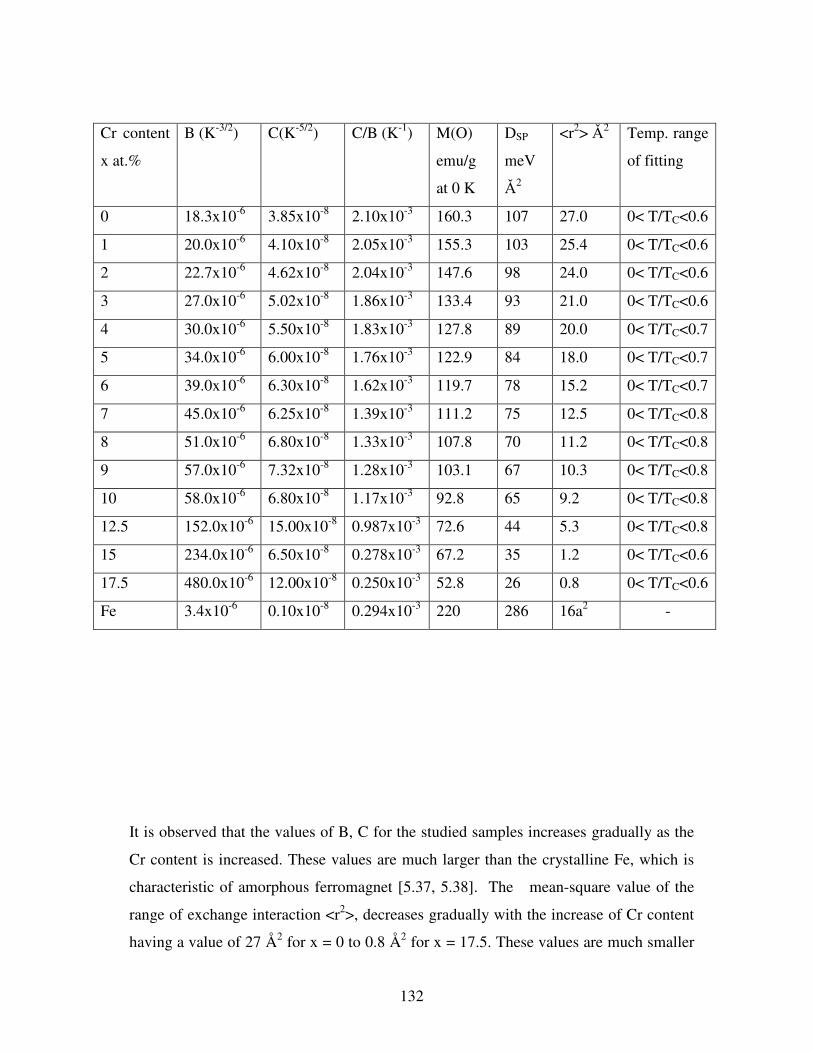
132
Cr content
x at.%
B (K-3/2) C(K-5/2) C/B (K-1) M(O)
emu/g
at 0 K
DSP
meV
Ǎ2
<r2> Ǎ2 Temp. range
of fitting
0 18.3x10⁻⁶ 3.85x10⁻⁸ 2.10x10⁻³ 160.3 107 27.0 0< T/TC<0.6
1 20.0x10⁻⁶ 4.10x10⁻⁸ 2.05x10⁻³ 155.3 103 25.4 0< T/TC<0.6
2 22.7x10⁻⁶ 4.62x10⁻⁸ 2.04x10⁻³ 147.6 98 24.0 0< T/TC<0.6
3 27.0x10⁻⁶ 5.02x10⁻⁸ 1.86x10⁻³ 133.4 93 21.0 0< T/TC<0.6
4 30.0x10⁻⁶ 5.50x10⁻⁸ 1.83x10⁻³ 127.8 89 20.0 0< T/TC<0.7
5 34.0x10⁻⁶ 6.00x10⁻⁸ 1.76x10⁻³ 122.9 84 18.0 0< T/TC<0.7
6 39.0x10⁻⁶ 6.30x10⁻⁸ 1.62x10⁻³ 119.7 78 15.2 0< T/TC<0.7
7 45.0x10⁻⁶ 6.25x10⁻⁸ 1.39x10⁻³ 111.2 75 12.5 0< T/TC<0.8
8 51.0x10⁻⁶ 6.80x10⁻⁸ 1.33x10⁻³ 107.8 70 11.2 0< T/TC<0.8
9 57.0x10⁻⁶ 7.32x10⁻⁸ 1.28x10⁻³ 103.1 67 10.3 0< T/TC<0.8
10 58.0x10⁻⁶ 6.80x10⁻⁸ 1.17x10⁻³ 92.8 65 9.2 0< T/TC<0.8
12.5 152.0x10⁻⁶ 15.00x10⁻⁸ 0.987x10⁻³ 72.6 44 5.3 0< T/TC<0.8
15 234.0x10⁻⁶ 6.50x10⁻⁸ 0.278x10⁻³ 67.2 35 1.2 0< T/TC<0.6
17.5 480.0x10⁻⁶ 12.00x10⁻⁸ 0.250x10⁻³ 52.8 26 0.8 0< T/TC<0.6
Fe 3.4x10⁻⁶ 0.10x10⁻⁸ 0.294x10⁻³ 220 286 16a2 -
It is observed that the values of B, C for the studied samples increases gradually as the
Cr content is increased. These values are much larger than the crystalline Fe, which is
characteristic of amorphous ferromagnet [5.37, 5.38]. The mean-square value of the
range of exchange interaction <r2>, decreases gradually with the increase of Cr content
having a value of 27 Å2 for x = 0 to 0.8 Å2 for x = 17.5. These values are much smaller

133
than that of crystalline ferromagnet. The low value of <r2> as compared with the Fe
indicates that the range of exchange interaction is shorter in the Finemet type of
amorphous alloys in comparison with that in crystalline ferromagnets in agreement with
the previously published reports [5.36, 5.38]. The values of spin-wave stiffness constant
(D) decreases monotonically from 107 meV Å2 for x = 0 to 26 meV Å2 for the sample x
= 17.5. These values are much lower than crystalline Fe, which is 286 meV Å2. The
smaller values of spin-wave stiffness constant (D) in the studied system is an indication
of the softening of the exchange interaction according to Varga et al. [5.39]. Our
experimental values of D are very typical for amorphous materials and agree reasonably
well with the values reported earlier in the literature [5.29,5.37, 5.38, 5.40 -5.43]. The
cT
D for the amorphous ferromagnets is generally smaller in comparison to the value of
0.27 for crystalline Fe which is indicative of the short-range nature of interactions in our
studied system [5.37, 5.39, 5.41]. Our experimental cT
D= 0.18 for the whole series of
alloys which corresponds well with the value of cT
D= 0.21 [5.29], 0.18 [5.41] for the
amorphous alloys. The reduction in the value of D with the substitution of Fe by Cr may
be interpreted as due to an increase in the distance between Fe atoms. This leads to the
weakening of exchange interaction between Fe atoms resulting in the lowering of Curie
temperature. Fig. 5.20 shows the exchange stiffness constant D, as a function of Tc. A
linear dependence of D with Tc is observed for the entire composition range, which
passes through the origin. The value of cT
D= 0.18 remains constant (table-5.3) for all the
compositions studied which indicates that the range of exchange interaction is not
modified when Fe is substituted by Cr.
5.2.7 Variation of Magnetization and Curie temperature with
Isothermal Annealing of Higher Cr Content Amorphous Alloys

134
This is well known that amorphous state is metastable. Metastability of
amorphous or glassy metal alloys offers the possibility of phase separation diffusion of
various species and structural relaxation even though the alloys remains amorphous
when they are annealed at temperature well below the crystallization temperature. All
these changes have effect on the intrinsic magnetic properties such as Curie temperature
(Tc) saturation magnetization (Ms) and magnetostriction. It has been demonstrated that
saturation magnetization, Ms and Curie temperature (Tc) of FINEMET alloys in the
amorphous state increase on annealing up to the annealing temperature (Ta)
corresponding to the early stage of crystallization, beyond which Ms and Tc both
decrease [5.14, 5.16, 5.44].
The FINEMET is ferromagnetic at room temperature. It is observed in the present
investigation that the amorphous alloys Fe73.5-xCrxCuNb3Si13.5B9 with x = 10, 12.5, 15 &
17.5, which are paramagnetic (except x = 10) at room temperature show an increase of
M at room temperature when annealed below the onset of crystallization temperature.
Fig. 21 (a, b) and 5.22 (a, b) clearly demonstrates an increase of magnetization upon
annealing temperature (Ta) for all these four samples. For sample x = 17.5, M increases
substantially only at Ta = 600°C which is close to the onset of crystallization
temperature Tx1 = 6200C for this alloy according to DSC data of table-5.1. This increase
of M with Ta up to 5800C is connected to the structural relaxation and varying degrees
of chemical disorder concomitant with the previous published results on typical
FINEMET alloy [5.16 - 5.18]. Similar increase in Ms due to structural relaxation has
been detected in Fe-based metallic glass [5.44]. With reference to the enhancement of
magnetization of annealed samples, DSC thermograms have been taken on samples
annealed at Ta = 5200C, 5400C, 5600C along with as cast samples and depicted Fig.
5.23. It is seen in fig 5.23 (a, b, c, d) that the area under the first crystallization event
Fe(Si) phase slightly diminishes for x = 10 and 12.5 implying that initiation of
crystallization seems to take place and accordingly M vs. H curves sharply rises and
looks like ferromagnetic for x = 12.5 which is paramagnetic in the amorphous condition
with Tc = 247 K. This increase of magnetization for the sample x = 12.5 is due to the
evolution of ferromagnetic Fe(Si) crystallites. This has also been confirmed by X-ray

135
diffraction pattern as shown in fig. 5.4 (d) with the appearance of Fe. Note that x = 10
is ferromagnetic at room temperature. For x = 15 up to Ta = 560°C, M increases only
due to structural relaxation, while for x = 17.5 at Ta = 600°C a sharp rise of M
correspond to initiation of crystallization of Fe(Si) phase and has been detected in XRD
pattern shown in fig. 5.4 (f). The influence of partial substitution of Fe by Cr on the soft
magnetic properties of Fe73.5-xCrxCu1Nb3Si13.5B9 (x = 1, 2, 3, 4 & 5) have been studied
through the measurement of magnetic hysteresis loops of amorphous and annealed
samples at room temperature. Fig 24 (a, b, c, d) shows low field (≈ 1.5 Oe) hysteresis
loop for the samples x = 1, 3, 4, 5. It is clearly observed that the as cast amorphous
samples have low magnetic induction Bmax value for all the samples which increases
substantially on annealing at 540°C for 30 min. This annealing temperature is close to
the onset of crystallization temperature.
Therefore an increase in magnetization M at room temperature is expected on annealed
samples according to ref. [5.14, 5.16, 5.18, 5.45]. With the increase of magnetic
induction on annealing, a subsequent decrease of coercive force (Hc) is noticed for all
the samples implying magnetic softening of these alloys upon annealing. Amorphous
alloys clearly show rectangular shaped hysteresis loops, the origin of which may be
related to the magnetoelastic anisotropy contribution as a result of stress induced during
rapid quenching process. But after annealing the shape of the hysteresis loops changes
to normal form with the manifestation of enhanced soft magnetic properties i.e. high
magnetic induction and low coercivity. Table-5.4 shows the value of Bmax and Hc for the
samples annealed at 540°C for 30 min and as cast condition. The data shows that Hc
decreases substantially on annealing and the maximum magnetic induction Bmax , at H
≈ 1.5 Oe also increases rapidly for all the annealed samples as compared with the
amorphous precursor. Similar low field hysteresis behavior has been observed in Cr
substituted FINEMET with Au instead of Cu [5.46]. The observed improvement of soft
magnetic characteristic of the annealed samples at Ta = 540°C for 30 min is likely due
to the formation of α-Fe(Si) phase with optimum nanometric grains, their appropriate
volume fraction and strong exchange coupling among them.

136
Fig. 5.21 field dependence of magnetization curves of ribbons Fe73.5-xCrxCu1Nb3Si13.5B9 with (a) x = 10 (b) x = 12.5 in the ascast and annealed at different frequencies

137
Fig. 5.22 Field dependence of magnetization curves of ribbons Fe73.5xCrxCu1Nb3Si13.5B9 with (a) x = 15 (b) x = 17.5 in the as cast and annealed at different temperatures
(a)
(b)

138
Fig. 5.23 DSC curves of the ribbons with composition Fe73.5-xCrxCu1Nb3Si13.5B9 (a) x = 10 (b) x = 12.5 (c) x = 15 (d) x = 17.5 in the as cast and annealed at different temperatures

139
Fig. 5.24 Hysteresis loops of amorphous ribbon with composition Fe73.5-
xCrxCu1Nb3Si13.5B9 ribbons with x = 1, 3, 4 & 5 in the as-cast (curve 1) and annealed
(curve 2) at 540oC for 30 min.

140
Fig. 5.25 Dependence of Curie temperature on annealing temperature of the amorphous
ribbons with composition (a) Fe61Cr12.5Cu1Nb3Si13.5B9 (b) Fe58.5Cr15Cu1Nb3Si13.5B9
(a)
(b)
Ma
gn
etza
tio
n (
a.u
.)

141
Fig. 5.26 (a) FC and ZFC magnetization curve with an applied field 1Oe and (b)
dependence of Curie temperature on annealing temperature with composition
Fe56Cr17.5Cu1Nb3Si13.5B9
(b)
0.0
0.5
1.0
1.5
2.0
2.5
3.0
3.5
4.0
4.5
5.0
0 50 100 150 200T (K)
FC
ZFC
Fe56Cr17.5Cu1Nb3Si13.5B9
Annealed at 540°C
H = 1 Oe
(a)
Mag
netiz
atio
n (a
.u.)
M
agne
tizat
ion
(a.u
.)
(b)

142
Table-5.4 Maximum magnetic induction Bmax and coercivity Hc for the as cast and
annealed samples measured at H = 1 Oe of the amorphous ribbon with composition
Fe73.5-xCrxCu1Nb3Si13.5B9 alloys
Table-5.5 Effect of annealing on the Curie temperature of the amorphous ribbon with
composition Fe73.5-xCrxCu1Nb3Si13.5B9 (x = 12.5, 15 & 17.5)
Cr content x at.% Annealed condition Curie temperature,Tc (K)
As-cast 247
5200C (30 min) 250
5400C (30 min) ≈ 198
12.5
5600C (30 min) ≈ 180
As-cast 196
5400C (30 min) 204
5600C (30 min) 208
15
6200C (30 min) ≈ 102
As-cast 143.5
5400C (30 min) 147
5600C (30 min) 152
5800C (30 min) 150
17.5
6000C (30 min) ≈ 92
As Cast Annealed at 540°C for 30 min Cr content x at.% Bmax (KG) Hc (Oe) Bmax (KG) Hc (Oe) 1 2.0 0.35 10.8 0.069 3 2.3 0.23 5.8 0.080 4 4.5 0.20 10.2 0.054 5 4.2 0.14 7.7 0.057

143
It has been well understood from our discussions above that Curie temperature (Tc) of
FINEMET alloys in the amorphous state changes with the annealing temperature (Ta)
dependent on the state of crystallization. In the forthcoming discussion it will be
demonstrated how the Curie temperatures of higher Cr content alloys, Fe73.5-
xCrxCuNb3Si13.5B9 with x = 12.5, 15 & 17.5 are affected on annealing temperature Ta.
The Curie temperatures of these alloys are below room temperature. The samples were
annealed between between 5200C and 6200C. Fig. 5.25 (a, b) and 5.26 (b) shows the
low field (10 Oe) dc magnetization of annealed samples with x = 12.5, 15 & 17.5 as a
function of temperature from 10 K to above the Curie temperature of individual
samples. While fig. 5.26 (a) demonstrates the Field-cooled (FC) and Zero Field-cooled
(ZFC) magnetization of sample x = 17.5 annealed at 5400C. The Curie temperature of
the sample x = 12.5 in the amorphous state is Tc = 247 K which increases to 250 K
when annealed at 5200C for 30 minutes. However, annealing at higher temperature i.e.
Ta = 5400C and 5600C for 30 minutes, Tc decreases to 198 K and 180 K respectively.
For the sample x = 15, Tc increases from 196 K in the as-cast state to a maximum value
of Tc = 208 K corresponding to annealing at Ta= 5600C (30 min) which again decreases
to Tc≈ 102 K at Ta=6200C (30 min). The Tc of the sample x = 17.5 increases from 143.5
K in the as-cast state to a maximum value of Tc=152 K at Ta= 5600C (30 min) and
thereafter to Tc= 92 K for annealing at Ta= 6000C. From the measurement of ZFC/FC
magnetization with H = 1 Oe shown in fig. 26 (a), Curie temperature Tc = 147 K has
been revealed for the sample x = 17.5 when annealing has been performed for 30
minutes at Ta = 5400C. This value of Tc is slightly higher than that of the amorphous
counterpart. The variation of Tc of the amorphous precursors with annealing
temperature Ta is demonstrated in table-5.5. From the measurement it is clear that the
effect of annealing on the Tc of higher Cr content in the FINEMET alloys behave
similarly as found in the Finemet composition reported by previous investigators [5.2,
5.14, 5.16, 5.45]. The increase of Tc during the annealing of the amorphous precursor at
a temperature well below the initiation of crystallization temperature is caused by the
irreversible relaxation of microstructural quantities like long-range internal stress,
topological and chemical short-range order.

144
All these microstructural effects bring about a change in the interatomic distances which
affect directly the strength of the exchange interaction resulting in a change of Curie
temperature, Tc. Blachowicz et al. [5.47] found from the analysis of the Mossbaur
spectra for the quenched and annealed samples of Fe74Cu1Nb3Si12B10 below Tx1 (at
4000C) that the packing density of atoms has been increased in the case of annealed
samples as compared with the amorphous one. The authors observed the enhancement
of Tc dependent on annealing temperature as well as time. It is observed from the
present investigation that the fall of magnetization at T=Tc is reasonably sharp when
annealed at lower temperature and in particular when magnetization is measured with
very low field as shown in fig. 5.26 (a). The annealing temperature (Ta) corresponding
to which enhancement of Tc takes place for the samples x =12.5, 15, 17.5, no XRD
peaks related crystallization have been detected in our experiments (see Fig. 5.4 (d, e, f)
which again confirms that the enhancement of Tcam of the amorphous precursor is
connected with the structural relaxation. With the increase of Ta close to onset of
crystallization temperature and above Curie temperature (Tc) decreases for all the
samples in agreement with the previous published reports. The reason for the decrease
of Tc of the amorphous phase with annealing at higher temperature, i.e. around Tx1 and
above is probably connected with the depletion of Fe and subsequent increase of Nb and
Cr in the amorphous (Fe-Nb-Cr)2B matrix. This causes a weaker exchange interaction
among the Fe magnetic moments resulting in a decrease of Curie temperature.
This happens because with the increase in annealing temperature results mainly in an
increase of the volume fraction of α-Fe(Si) crystallites. This is worthwhile to note that
the decrease of magnetization with temperature for the samples annealed at higher Ta is
relatively smeared out as shown in fig.5.25 (a, b) and 5.26 (b). It is very difficult to find
out an unique value of Tc from such diffused M vs. T measurements. The more diffuse
character of the ferro-paramagnetic transition in the residual amorphous matrix for the
samples annealed at higher temperature is attributed to the higher degree of
compositional and structural disorder in the residual amorphous phase [5.48, 5.49].
Varga et al. [5.50] have interpreted this type of reduction of Tc in FINEMET alloys

145
after annealing at higher temperature as due to compositional gradients within the
remaining amorphous phase. Within the inhomogeneous amorphous phase there is
basically no longer a unique Curie temperature, but a distribution of Tc. As a
consequence instead of a single M(T) curve, the combination of a family of curves with
distribution of Curie temperature is obtained. Therefore the Tc values mentioned in the
present study related to the samples annealed at relatively high temperatures should be
taken with cautious. However, the decrease of Tc shown in the table-5.5 is a general
trend of the alloys under investigation since dT
dM has been taken to estimate the Tc
from these measurements.

146
5.3 Permeability Measurements on Amorphous and Annealed
Samples of Fe73.5-xCrxCu1Nb3Si13.5B9 Alloys
Permeability and coercivity are the most important parameters for the
evaluation of soft magnetic materials. The criteria for the softest magnetic materials
demand very high permeability and / or extremely low coercivity and these properties
necessitate the anisotropy energy and the magnetoelastic energy tend towards zero.
These unique demands are fulfilled when the FINEMET type of nanocrystalline
materials are thermally treated around there primary crystallization temperature which
facilitates the evolution of nanometric size of the Fe(Si) grains (10-12 nm) that are
exchanged couple through the remaining thin residual amorphous interface.
In order to correlate the microstructural features with soft magnetic properties of the
alloys under study, initial permeability of the toroidal shaped samples annealed at
different temperatures are measured at room temperature with an applied ac field of
10-3 Oe.
Fig 5.27 (a, b) shows the variation of initial permeability as a function of frequency
from 1kHz-500kHz for the samples Fe73.5-xCrxCu1Nb3Si13.5B9 with x = 1 & 3 in the as
cast and annealed at various temperatures up to 625°C. The magnetic properties of the
soft magnetic materials are mainly determined by the domain wall mobility especially
in the range of reversible magnetization. It is observed that µ ′ increases with the
increase of annealing temperature Ta for both the sample x = 1 & 3 attaining a
maximum value of µ ′ at Ta = 545 and 565o C respectively, when Ta is increased beyond
these temperatures, µ ′ rapidly decrease to a very low value as indicated by both the
samples. It is also observed that µ ′ decrease slowly with the increase of frequency
initially and then decrease rapidly due to the increase of loss component µ ′′attains its’
maximum value at a certain frequency at which µ ′ falls to half of its value at f = 1kHz
(not shown in fig.5.27 (a, b) for clarity). With the increase of annealing temperature, Ta,
µ ′ increase rapidly in the low frequency region and also falls faster with simultaneous
shift of the maxima of µ ′′ forwards lower frequency side. These effects are the typical

147
Fig. 5.27 Variation of initial permeability with frequency of the amorphous ribbon with
composition Fe56Cr17.5Cu1Nb3Si13.5B9 with x = 1and x = 3 alloys
0
5000
10000
15000
20000
25000
1 100
f(kHz)
initia
l perm
eabili
ty, µ'
as cast
475°C
500°C
525°C
565°C
600°C
625°C
X=3
1 10 1000
5000
10000
15000
20000
x=1
f ( kHz)
As cast
400K
450K
500K
545K
565K
580K
600K
Initi
al p
erm
eabi
lity

148
features of domain wall relaxation dispersion. This signifies that the high permeability
nanocrystalline materials are suitable for low frequency applications. All other samples
show the similar frequency characteristics. The results show that the initial permeability
of the amorphous sample has been enhanced by two order of magnitude at low
frequency when appropriately annealed.
The values initial permeability and the relative loss factor as function of Ta measured at
1 kHz are collected and shown in fig. 5.28 (a, b), 5.29 (a, b), and 5.30 (a, b) for the
samples with composition Fe73.5-xCrxCu1Nb3Si13.5B9 where x = 1, 2, 3, 4, 5 & 8. A
remarkable dependence of initial permeability and the relative loss factor on Ta is
observed. For all the studied samples the initial permeability increases up to a certain
annealing temperature attaining a maximum value and thereafter sharply decreases to a
very low value. The temperature of annealing corresponding to the maximum value of
the permeability may be considered as the optimum annealing temperature for the
evolution of the appropriate size of nano grains and their volume fractions. The increase
of permeability up to the annealing temperature, Ta=3250C is comparatively small and
may be attributed to irreversible structural relaxation of the amorphous state. While the
annealing temperature exceeds 3250C a sharp increase of initial permeability takes
place, which is associated with the nanocrystallization of α-Fe(Si) phase. These
nanograins are strongly coupled via exchange interaction with the increase of volume
fraction of α-Fe(Si) nano grains as the annealing temperature increases resulting in a
sharp reduction of average anisotropy energy. As a consequence steep increase of initial
permeability is manifested. An enhancement of initial permeability by two orders of
magnitude compared with its amorphous precursors is observed for the sample annealed
at optimum annealing temperature. A drastic decrease of permeability above the
optimum temperature for all the samples is evidenced which is associated with the
evolution of Fe-B phase. This detrimental boride phase increases the
magnetocrytalline anisotropy, which reduces the exchange correlation length weakening
the magnetic coupling between the Fe(Si) nanograins resulting in magnetic hardening. It
is clearly evidenced from the curves are shown in fig. 5.28 (a, b), fig. 5.29 (a, b) and fig.
5.30 (a, b) that the relative loss factor decreases with Ta attaining a minimum value at a

149
particular temperature of annealing at which µ ′ attains its maximum value. This is really
what is required for soft magnetic materials from its application point of view i.e. high
permeability and simultaneous low losses.
Fig. 5.28 (a, b) Annealing temperature (Ta ) dependence of initial permeability (µ ′) and relative loss factor, tanδ/µ ′ for samples of Fe73.5-xCrxCu1Nb3Si13.5B9 with (a) x = 1 (b) x = 2
0
5000
10000
15000
20000
25000
0 100 200 300 400 500 600 700Annealing Temperature, Ta (°C)
µ'
0
0.00001
0.00002
0.00003
0.00004
0.00005
0.00006
0.00007
0.00008
0.00009
tan
δ / µ
'
Initial permeability
Relative loss factor
x = 2
0
2000
4000
6000
8000
10000
12000
14000
16000
18000
20000
0 100 200 300 400 500 600 700
Annealing temperature, Ta (°C)
µ'
0.00000
0.00005
0.00010
0.00015
0.00020
0.00025
0.00030
0.00035
0.00040
0.00045
tan
δ /
µ'
initial permeability
relative loss factor
x = 1

150
Fig. 5.29 (a, b) Annealing temperature (Ta) dependence of initial permeability (µ ′) and
relative loss factor µ′
δtan for samples of Fe73.5-xCrxCu1Nb3Si13.5B9 with (a) x = 3 (b) x = 4
0
5000
10000
15000
20000
25000
0 100 200 300 400 500 600 700
Annealing Temperature, Ta (°C)
µ'
-0.0000050
0.0000050
0.0000150
0.0000250
0.0000350
0.0000450
0.0000550
0.0000650
0.0000750
tan
δ / µ
'
Initial permeability
Relative loss factor
x = 3
0
2000
4000
6000
8000
10000
12000
14000
0 100 200 300 400 500 600 700
annealing temperature, Ta (°C)
µ'
0
0.001
0.002
0.003
0.004
0.005
0.006
0.007
tan
δ / µ
'
initial permeability
relative loss factor
x = 4

151
Fig. 5.30 (a, b) Annealing temperature (Ta) dependence of initial permeability (µ ′) and
relative loss factorµ
δ
′
tan for samples of Fe73.5-xCrxCu1Nb3Si13.5B9 with (a) x = 5 (b) x = 8
0
5000
10000
15000
20000
25000
0 100 200 300 400 500 600 700
annealing temperature, Ta (°C)
µ'
0
0.0005
0.001
0.0015
0.002
0.0025
tan
δ / µ
'
initial permeability
relative loss factor
x = 5
0
2000
4000
6000
8000
10000
12000
14000
0 100 200 300 400 500 600 700annealing temperature, Ta (°C)
µ'
0.00000
0.00005
0.00010
0.00015
0.00020
0.00025
0.00030
0.00035
tan
δ / µ
'
initial permeability
relative loss factor
x = 8

152
Conclusions
A series of amorphous ribbons with the nominal composition Fe73.5-xCrxCu1Nb3Si13.5B9
(x = 0, 1, 2, 3, 4, 5, 6, 7, 8, 9, 10, 12.5, 15 & 17.5) were prepared by melt-spinning
technique and heat treated at various temperatures; below and above the crystallization
temperatures. The crystallization behaviour of the samples was investigated by DSC. The
amorphous and annealed samples were examined by X-ray diffractometer. Magnetization
measurement as a function of temperature and field were performed by SQUID
magnetometer, VSM, Permagraph and LCR meter. From the systematic investigation on
the crystallization, structural and magnetic properties of the present system the following
conclusions can be outlined.
From the DSC thermogram with continuous heating, two well-defined exothermic peaks
corresponding to different crystallization products have been revealed. From the
thermogram, the onset and peak temperature corresponding to primary and secondary
crystallization phenomena have been estimated. The primary crystallization temperature
depends sensitively on Cr concentration which shifts to high temperature as the Cr
concentration is increased. However, for higher Cr content alloys, the two crystallization
temperatures are almost merged with each other since the secondary crystallization
temperature of higher Cr content alloys are hardly affected by Cr content. The activation
energy of crystallization has been determined from the heating rate dependence of DSC
thermogram using Kissinger method, which slightly increases with Cr content. From
these experimental findings, it can be concluded that substitution of Fe by Cr enhances
the thermal stability of the amorphous alloys against crystallization. The knowledge of
the crystallization temperatures is important to determine the appropriate annealing
temperature for nanocrystallization, which finally controls the magnetic properties of the
Finemet type of alloys.
X-ray diffraction confirmed the amorphous state of all the as prepared ribbons. The
evolution of primary phase on annealed samples has been confirmed as bcc-Fe(Si) from
XRD pattern. The temperature corresponding to the onset of crystallization obtained from

153
the XRD pattern is slightly lower than that of DSC data. The reason might be the two
different methods of measurements. X-ray diffraction (XRD) measurement has been
carried out on isothermal annealed samples while that of DSC on anisothermal. The grain
size calculated from the line broadening of X-ray peak is found to decrease from 9 nm for
x = 1 to 6.5 nm for x = 5 when annealed at 540°C for 30 minutes. The higher Cr content
alloys do not show any sign of crystallization in their XRD pattern even at an annealing
temperature of 580°C for 30 min. This is quite reasonable since their crystallization onset
temperature is 600°C and higher.
Magnetic moment µ in Bohr magneton of the amorphous alloys calculated from the
saturation magnetization data at 5 K is found to decrease linearly with the increase of Cr
concentration throughout the whole concentration range having a value of 1.41 Bµ and
0.45 Bµ for x = 0 and x = 17.5 respectively. From the least-square fitting of the
magnetization as a function of Cr concentration, a decrease of magnetic moment of
0.055µβ for each atomic percent of Cr substitution has been determined.
The Curie temperatures of all the amorphous alloys have been determined by various
methods like temperature dependence of low and high field dc magnetization,
temperature dependence of permeability, ac susceptibility and Arrott plots from magnetic
isotherm around Tc. The determined Curie temperatures by various methods are in good
agreement within ± 2 K. The Curie temperature of the sample x = 0 has been determined
to be Tc = 596 K which decreases to Tc = 143.5 K for x = 17.5. A least-square fitting of
the experimentally determined Tc values against Cr concentration shows a linear
dependence, which decreases 26°C per atomic percentage of Cr substitution. The critical
concentration for the onset of ferromagnetism in this alloy system has been estimated to
be xc = 24± 1 at.% Cr by linear extrapolation of magnetic moment nB = 0 and Tc = 0 as a
function of Cr concentration.
The field-cooled (MFC) and zero-field-cooled (MZFC) magnetization is a function of
temperature for higher Cr content alloys, shows divergence below Tc. The divergence

154
increases with the decrease of temperature and with the increase of Cr content in the
amorphous alloys. This effect is associated with the increase of coercivity as the
temperature is decreased and controlled by the temperature dependence of magnetic
anisotropy energy.
The temperature dependence of magnetization of all the amorphous
Fe73.5-xCrxCu1Nb3Si13.5B9 (0 ≤x ≤17.5) alloys apparently follows the predictions of
Bloch's Spin-wave theory including T5/2 term in the temperature range 0.6 ≤ cT
T ≤ 0.8.
The mean-square value of the range of exchange interaction <r2> and the values of spin-
wave stiffness constant (D) decreases monotonically with the increase of Cr content. The
values of <r2> are much smaller than that of crystalline ferromagnet implying that the
range of exchange interaction is shorter in amorphous alloys. The smaller values of D in
the studied system indicate weakening of the exchange interaction due to an increase in
the distance between Fe atoms as the substitution of Fe by Cr occurs.
A linear dependence of D with Tc is observed for the entire composition range, which
passes through the origin. The cT
D= 0.18 has been determined from the slope of the
straight line which is much smaller than the crystalline Fe
= 27.0
cT
D and gives further
indication regarding the short range nature of interaction in our studied amorphous
system as expected.
The metastable nature of amorphous alloys provide the possibility of relaxation of some
intrinsic properties like magnetization (M) and Curie temperature (Tc) when heat treated.
The magnetization (M) of the amorphous alloys increase with the increase of annealing
temperature corresponding to the early stage of crystallization due to irreversible
structural relaxation. The room temperature M values for the high Cr content alloys (x =
12.5, 15 & 17.5), which are paramagnetic at room temperature are found to increase
substantially when annealed below the crystallization onset temperatures. The Curie

155
temperatures Tc of the amorphous phase of the high Cr content alloys increase with the
increase of annealing temperature (Ta) initially and thereafter decrease when annealed at
higher temperature close to the crystallization temperature and above. The initial rise of
the Tc with Ta is related to the irreversible relaxation of microstructural quantities like
long-range internal stress and chemical short-range order. The reduction of Tc values are
due to compositional gradients and high degree of chemical disorder with the remaining
amorphous phase which is depleted with Fe and subsequent increase of nonmagnetic Nb
and Cr in the amorphous (Fe-Nb-Cr)2B matrix resulting from the initiation of Fe(Si)
nanocrystallites. This is to note that the ferro-paramagnetic transition of the samples
annealed at higher Ta is more diffused and smeared out from which a unique value of Tc
is difficult to estimate. Therefore these Tc values are a rough estimation and should be
taken with cautions.
Strong dependence of initial permeability (µ ′) and relative loss factor µ
δ
′
tan as a function
of annealing temperature (Ta) and Cr concentration is evidenced in the present study. The
increase of initial permeability measured at f =1 kHz at room temperature is very sluggish
up to an annealing temperature, Ta, corresponding to the temperature below the initiation
of crystallization. A sharp increase of µ ′ is observed when the Ta is close to onset of
crystallization temperature and above. The µ ′ passes through a maximum corresponding
to the optimum Ta, beyond which µ ′ sharply falls to a very low value. The relative loss
factor
′µ
δtan behave in a reverse way having its minimum value corresponding to
maximum value of µ ′. All the alloys show similar behavior with the manifestation of
good soft magnetic properties i.e. high µ ′and low µ
δ
′
tancorresponding to low Cr content
alloys up to x = 5 at.% Cr.
An enhancement of initial permeability by two orders of magnitude and a subsequent
decrease of relative loss factor have been observed for the optimum annealed samples.
This outstanding soft magnetic properties of the studied samples have been achieved due

156
to averaging out of the magnetic anisotropy energy by exchange interaction between the
nanometric Fe(Si) grains with appropriate volume fraction transmitted through thin
intergranular amorphous layer. Nanocrystalline FINEMET type of alloys offer the unique
opportunity for tailoring ultrasoft magnetic properties that can be technologically
exploited for the potential applications in many electronic and electrical devices.

157
Bibliography: CHAPTER 1
1.1 H. Gleiter, Progress in Materials Science, 33, 223 (1989)
1.2 M.E.Mc Henry, S.A. Majetich, De Graef, M. Artman, J.O. and S.W.Staley, Phys.
Rev. B, 49, 11358 (1994)
1.3 M.E.Mc Henry, M.A. Willard, H.Iwanabe, R.A. Sutton, Z.Turgut, A. Hsiao and
D.E.Laughlin, Bull. Mater. Sci., 22, 495 (1999)
1.4 D.Appell, “Nanotechnology: Wired for success,” Nature (2002)
1.5 Judit Kopniczky, “ Nanostructures studied by atomic force microscopy”, Ph. D
Thesis Uppsala University, Sweden (2003)
1.6 R.C. O’Handley, Modern Magnetic Materials: Principles and Applications, John
Wiley and Sons, New York (2000)
1.7 Z. Turgut, M. Q. Huang, K. Gallagher, S. A. Mayelich and M. E. Mc Henry, J.
Appl. Phys., 81, 4039 (1997)
1.8 Z. Turgut, N. T. Nuhfer, H. R. Piehler and M. E. Mc Henry, J. Appl. Phys., 85,
4406 (1999)
1.9 F. W. A. Dirne and M. Brouha, IEEE Trans. Magn, MAG-24, 1862 (1988)
1.10 H. J. de Wit, J. Magn. Magn. Mat., 79, 167 (1989)
1.11 Y. Yoshizawa, S. Oguma and K. Yamauchi, J. Appl. Phys., 64, 6044 (1988)
1.12 Y. Yoshizawa, and K. Yamanchi, Materials Transaction, JIM, Vol. 31, No. 4,
307-314 (1990)
1.13 G. Herzer, J. Magn. Magn. Mat., 157/158 , 133-136, (1996)
1.14 R. Alben, J. J. Becker and M. C. Chi, J. Appl. Phys. 49, 1653-1658 (1978)

158
CHAPTER 2
2.1 W.Klement, R.H.Willens, P.Duwes, Nature 187, 869 (1960)
2.2 A.L.Greer, Science, 267, 1947 (1995)
2.3 W.L.Johnson, Prog. Mater. Sci. 30, 81 (1986)
2.4 H.A.Daveis, in: F.E.Lubrosky (Ed.), Amorphous Metallic Alloys, Butterworths,
London, P.8. (1983)
2.5 S.Kavesh, in: J.J.Gillman, H.L. Leamy (Eds.) Metallic Glasses, ASM
International, Metals Park, OH, chapter 2 (1978)
2.6 D.Turnbull, Trans. AIME 221, 422 (1961)
2.7 H.S.Chen, D.Turnbull, J.Chem.Phys. 48, 2560 (1964)
2.8 H.S.Chen, D.Turnbull, Acta Metall, 17, 1021 (1969)
2.9 D.Turnbull, J.C. Fisher, J.Chen. Phys. 17, 71 (1949)
2.10 D.Turnbull, Contemp.Phys.10, 437 (1969)
2.11 W.L.Johnson, MRS Bull. 24(10), 42 (1999)
2.12 T.D.Shen, R.B.Schwarz: “Bulk ferromagnetic glasses prepared by flux melting
and water quenching” Appl.Phys.Lett. 75, 49 (1999)
2.13 R.C.O’Handley, “Physics of ferromagnetic amorphous alloys,” J.Appl.Phys. 62,
R15-R49 (1987)
2.14 Y.Yoshizawa, Ogma, S. and Yamauchi, K. New Fe-based soft magnetic alloys
composed of ultrafine grain structure, J. Appl. Phys. 64, 6044-6046 (1988)
2.15 Y. Yoshizawa and K-Yamauchi; Mat.Sci. and Engg. A133, 176-179 (1991)
2.16 Y.Yoshizawa, and K-Yamauchi, Materials Transaction, JIM, Vol.31, No.4, 307-
314 (1990)
2.17 G. Herzer, IEEE Trans.Mag. 26, 1397 (1990)
2.18 G.Herzer, H.Warlimont, Nanostructured materials, 1, 263-268 (1992)
2.19 A. Makino, A. Inoue, T. Masumoto, Mat. Trans. JIM, 36, 924 (1995)
2.20 Suzuki, K.Kataoka, N., Inoue, A. and Masumoto, T. High Saturation
Magnetization and soft magnetic properties of bcc Fe-Zr-B alloys with ultrafine
grain structure, Mater.Trans. JIM 31, 743-746 (1990)

159
2.21 Willard, M.A., Laughlin, D.E., McHenry, M.E., Thoma, D., Sickafus, K., Cross,
24. J.O.et al. Structure and magnetic properties of (Fe0.5Co0.5)88Zr7B4Cu1
nanocrystalline alloys, J. Appl. Phys. 84 (12), 6773-6777 (1998)
2.22 G. Herzer, HR. Hilzinger, J. Mag. Mag. Mat. 62, 143 (1986)
2.23 G. Herzer, HR. Hilzinger, Physica, Seripta, 39. 639 (1989)
2.24 G. Herzer, IEEE Trans. Mag, 25, 3327 (1989)
2.25 G. Herzer, J. Mag. Mag. Mat., 112, 258 (1992)
2.26 JMD. Coey, Rare earth iron permanent magnets, Oxford Science publications,
clarendon press (1996)
2.27 EF. Kneller, Hawing. R. IEEE Trans. Mag, 27, 3588 (1991)
2.28 R. Skomski, JMD. Coey, Phys. Rev. B, 48, 15812 (1993)
2.29 C.Suryanarayana, C.Int.Mater Rev. 40, 41 (1995)
2.30 C.Kuhrt, and L. Schultz, J.Appl.Phys. 73, 6588-6590,(1993)
2.31 R.Birringer, H.Gletier, Encyclopedia of Materials Science and Engineering, ed.
W.Cahn (Pergamon Press) Suppl.1 p.339 (1998)
2.32 Yoshizawa and K. Yamauchi, Mat. Res. Soc. Symp. Proc. 232, 183 (1991)
2.33 K. Hono and T. Sakurai, Appl. Surf. Sci., 87-88, 166 (1995)
2.34 K. Hono, K. Hiraga, Q. Wang, A. Inoue and T. Sakurai, Acta Metall. Mater, 40,
2137 (1992)
2.35 U. Köster, U. Schönemann, M. Blank-Bewersdorff, S. Brauer, M. Sutton and G.
B. Stephenson, Mat. Sci. Eng. A 133, 611(1991)
2.36 G. Herzer, In: Buschow KHJ, editor, Handbook of magnetic materials,
Amsterdam: Elsevier Science,10, 415 (1997)
2.37 N. Murillo, J. Gonzalez, JM Blanco, JM Gonzalez, J. Appl. phys. 79, 5465 (1996)
2.38 P. Kwapulinsli, J. Rasek, Z. Stoklosa, G. Haneezok, J. Magn. Magn. Mat., 136,
79(1994)
2.39 M. MÜller, N. Mattern, U. KÜhn, J. Magn. Magn. Mat. , 157-158, 209 (1996)
2.40 M. MÜller, N. Mattern, J. Magn. Magn. Mat., 36, 79 (1994)
2.41 Zhi Jing, He Kai-yuan, Li-Zhi Cheng, Yu-jun Fu, J. Magn. Magn. Mat., 153, 315-
319 (1996)

160
2.42 A. Inoue, K. Kobayashi, J. Kaneira and T. Masumoto, Sci. Rep.Inst. Tohoku
Univ. A 29, 331 (1981)
2.43 N. Chau, N. X. Chien, N.Q. Hoa, P.Q Niem, N. H. Luong, N.D. Tho, V. V. Hiep,
J. Magn. Magn. Mat., 282 174-179 (2004)
2.44 M. Ohnuma, D. H. Ping, T. Abe, H. Onodera, K. Hono and Y. Yoshizaqa, J.
Appl. Phys. 93, 9186 (2003)
2.45 J. Zbroszceyk, H. Fukanaga, J. Olszewski, WH. Ciurzynska, A. Hasiak, J. Magn.
Magn. Mat., 160, 277 (1996)
2.46 J. Zbroszceyk, K. Narita, J. Olszewski, WH. Ciurzynska, W. Lijun, B. Wyslocki,
et al. J. Magn. Magn. Mat.,160, 281 (1996)
2.47 J. Zbroszceyk, LK. Varga, J. Olszewski, W. Ciurzynska, B. Wyslocki, S.
Szymura, et al. J. Magn. Magn. Mat., 160, 279 (1996)
2.48 Maria Neagu, H. Chiriac, M. Lozovan, Sensors and Actuators A 106, 73-75
(2003)
2.49 S. C. Yu, K.S. Kim, Y. S. Cho, T. K. Kim, IEEE Trans. Magn. 28, 2421 (1992)
2.50 Todd, H. A. Davies, M. R. J. Gibbs, D. Kendall and R. V. Major, Materials
Research Society Symposium Proceedings, 577, 492 (1999)
2.51 Manh- Huong, Hua-Xin peng, and Michael R. Wisnom, J. Appl. Phys. 98, 014316
(1-6) (2005)
2.52 S.H. Lim, W. K. Pi, T. H. Noh, H. J. Kim and I. K. Kang, J. Appl. Phys., 73, 6591
(1993)
2.53 A. Zorkovska, J. Kovac, P. Sovak, P. Petrovic, M. Konc, J. Magn. Magn. Mat. ,
215-216, 492-494 (2000)
2.54 BJ. Tate, BS. Parmar, I Todd, H. A. Davies, MRJ. Gibbs, RV. Mayor, J. Appl.
Phys., 83, 6335 (1998)
2.55 X-Y Xiong, K-Y Ho, J. Appl. Phys. 77, 2094 (1995)
2.56 AR Yavari, PJ Desre. Mat. Sci. Forum, 88-90, 43 (1992)
2.57 M.A.Hakim, S.Manjura Hoque, J.Magn.Magn.Mat.,284, 395-402 (2004)
2.58 Pritish Kumar Roy, M.Phil.thesis, Khulna University of Engineering &
Technology (KUET), Bangladesh (2007)

161
2.59 Saroat Noor, M.Phil.thesis, Khulna University of Engineering & Technology
(KUET), Bangladesh (2005)
2.60 A.Slawska-Waniewska,M.Gutowski,H.Lachowicz,T.Kulik,H.Matyia.,Phys.Rev.B
46, 14594 (1992)
2.61 H.K.Lachowicz, A.Slawska-Waniewska, J. Magn. Magn. Mat., 133, 238 (1994)
2.62 Md.Sultan Mahmud,S.S.Sikder and M.A.Hakim, Journal of Science & Arts, 1, 33
(2004)
2.63 N.Chau, P.Q.Thanh, N.Q.Hoa, N.D.The, J. Magn. Magn. Mat.,304, 36-40 (2006)
2.64 N.Q.Hoa, N.Chau, H.D.Anh, N.H.Luong, M.A.Asgar, S.S.Sikder, Md.Sultan
Mahmud, Proceedings of the seventh Vietnamese-German Seminar on Physics
and Engineering,Halong City, from March 28 to April 5 (2004)
2.65 J.Kovac, O.Dusa, M.Konc, T.Svec, P.Sovak, J. Magn. Magn. Mat., 157/158, 197-
198(1996)
2.66 D.K.Saha and M.A.Hakim, J. Bangladesh Academy of Sciences, 30, 177-187
(2006)
2.67 N.D.Tho, N.Chau, S.C.Yu,H.B.Lee, L.N.D.The, N.Q.Hoa, J. Magn. Magn. Mat.,
304, c871-c873 (2006)
2.68 N.Chau, N.Q.Hoa,N.H.LuongThe, J.Magn.Magn.Mat., 290-294, 1547 (2005)
2.69 F.A.Khan,Suprya Choudhury,M.A.Hakim,S.Manjura Hoque,Nuclear Science and
Application,15,58 (2006)
2.70 C.Gomez-Polo, J.I.Perez-Landazabal, V.Recarte, P.Mendoza. Zelis,Y.F.Li and
M.Vazquez, J.Magn.Magn.Mat., 290-291, 1517-1519 (2005)
2.71 N.D.Tho, N.Chau, S.C.Yu, H.B.Lee,L.A. Tuan, N.Q.Hoa, J. Magn. Magn. Mat.,
304, c868-c870 (2005)
2.72 D.Holzer, I.Perez de Albeniz, R.Grossinger, H.Sassik, J. Magn. Magn. Mat., 203,
82-84 (1999)
2.73 A.Lovas, L.F.Kiss, I.Balogh, J. Magn. Magn. Mat., 215-216, 463-465 (2000)
2.74 N.Ponpandian, A.Narayanassamy, K.Chattopadhyay, M.ManivelRaja, K.Ganesan,
C.N. Chinnasammy and B.Jeyadevan, J.Appl.Phys., 93, 6182 (2003)
2.75 D.Prabhu,A.Narayanassamy,K.Chattopadhyay,Journal of Non-cryatalline solids,
353, 1577-1581 (2007)

162
2.76 S.M.Bhagat, M.L.Spano, K.V.Rao, J.Appl.Phys., 50, 1580 (1979)
2.77 E.Pulido, P.Crespo,A. Hernando, IEEE Trans.Magn.28, 3189 (1992)
CHAPTER 3
3.1 D.Turnbull, Contemp.Phys.10, 473 (1969)
3.2 H.A.Davies,J.Aucote,J.B.Hull,Nature Phys.Sci., 246, 13 (1973)
3.3 W.L.Johnson, progress in materials science 30, pp.81-134 (1986)
3.4 D.Louca, K.Ahn,V.Ponnambalam and S.J. Poon, Mat.Res.Soc.Proc.Vol.754,
pp.CC7.7.1-CC7.7.6.(2003)
3.5 J.W.,Martin,R.D.Doherty,B.Canter,stability of microstructure in metallic systems,
Cambridge, UK (1997)
3.6 W.Kauzmann, Chem.Rev.,vol.43,pp.219-256 (1948)
3.7 The IUPAC Compendium of Chemical Terminology, 66, 583 (1997)
3.8 H.Jones Rep.Prog.Phys.36, 1425 (1973)
3.9 D.Turnbull, J.de Physique, 35, C4-1 (1974)
3.10 S.Takayama,J.Materials Sci.11,164 (1976)
3.11 K. Lu, J.T. Wang and W. D. Wei, J. Appl. Phys., 69, 522, (1991)
3.12 H. Y. Tong, J. T. Wang, B. Z. Ding, H. G. Jiang and K. Lu, J. Non-Cryst. Solids,
150, 444, (1992)
3.13 X. D. Liu, J. T. Wang and B. Z. Ding, Scr. Metall. Mater., 28, 59, (1993)
3.14 X. D. Liu and J. T. Wang, Nanostruct. Mater., 2, 63, (1993)
3.15 N. Zarubova, N. Moser and H. Cronmuller, Mater. Sci. Eng. A, 151,205 (1992)
3.16 K. Lu, W. D. Wei and J. T. Wang, Scr. Metall. Mater., 22, 2319, (1990)
3.17 M. L. Sui, L.Y. Xiong, W. Deng, K. Lu, S. Patu and Y.Z. He, J. Appl. Phys., 69,
4451 (1991)
3.18 K. Lu, R. Luck and B. Predel, J. Alloys Comp., 201, 229 (1993)

163
3.19 K. Lu, R. Luck and B. Predel, Acta. Metall. Mater., 42,2303, (1994)
3.20 K. Lu, R. Luck and B. Predel, Scr. Metall. Mater., 28, 1387, (1993)
3.21 A.Inoue, A.Takeuchi, A.Makino, Sci Rep RITU, A42, 143-56 (1996)
3.22 XH Lin,WL Johnson,WK Rhim, Mater Trans JIM, 38, 473-7 (1997)
3.23 R Trivedi, Mater Sci Eng, A178, 129-35 (1994)
3.24 H.E.Kissinger, Anal.Chem., 29, 1702 (1957)
3.25 R.Luck,K.Lu and W.Frantz,Scrip.Metall.Mater., 28, 1071 (1993)
3.26 K.Lu.andJ.T.Wang,Sci.China A ,35,1266 (1992)
3.27 W. Heisenburg, Z. Phys. 619 (1928)
3.28 S. Chikazumi, Phyics of ferromagnetism-second eddition, Clarendon Press,
Oxford (1997)
3.29 G. Bertotti, E. Ferrara, F. Fiorillo, P. Tiberto, Mat. Sci. Eng. A, 226-228, 603
(1997)
3.30 JMD Coey, Rare earth iron permanent magnets, Oxford: Oxford science
publications, Clearendon Press, (1996)
3.31 G.Herzer,HR.Hilzinger,Physica Scripta, 39, 639 (1989)
3.32 G.Herzer,IEEE Trans Mag, 26, 1397 (1990)
3.33 G.Herzer, Mat.Sci.Eng A 133, 1 (1991)
3.34 G.Herzer,IEEE Trans Mag, 25, 3327 (1989)
3.35 G.Herzer, Scripta.Metall.Mater, 33, 1741 (1995)
3.36 R.,Alben,J.J.Becker and M.C.Chi,J.Appl.Phys. 49, 1653 (1978)
3.37 R.,Schafer,A.Hubert and G.Herzer, J.Appl.Phys., 69, 5325 (1991)
3.38 G. Herzer, “Nanocrystalline soft magnetic alloy” in Hand book of Magnetic
Materials, chap. 3 vol.8, ed, K.H.J Buschow (Elsevier Science B. V. pp 417-483,
(1997)
3.39 Z. Stoklosa, P. Kwapulinski, G. Haneczok, J. Rasek, J. Phys. IV 8, pp 51, (1998)
3.40 Y. Yoshizawa, S. Oguma and K. Yamauchi, J. Appl. Phys. 64 6044, 6047, (1988)
3.41 F.Keffer,in:Ferromagnetism,ed.H.PJ.Wijn(Springer,Berlin),Vol.XVIII,2,p.1
(1966)
3.42 C.L.Chien and R.Hasegawa, Phys.Rev.B16, 2115 (1977)
3.43 R.W.Cochrane and G.S.Cargill, III, Phys.Rev.Lett.32, 476 (1974)
164
3.44 S Ramasamy,Leif Lundgren,K Ganesan and Narayanasamy,J.Phys.F:Met.Phys.,
17, 753-765 (1987)
3.45 N.Ponpandian, A.Narayanasamy, K.Chattopadhyay, M.Manivel Raja, K.Ganesan,
C.N. Chinnasamy and B.Jeyadevan, 93, 6182 (2003)
3.46 K. Handrich, S. Kobe: Amorphe Ferro-und Ferrimagnetica, Akademie-Verlag
Berlin, Germany (1980)
3.47 S.M.Bhagat, M.L.Spano and K.V.Rao, J.Appl.Phys.50 (3), 1580 (1979)
3.48 S.N.Kaul, J. Magn. Magn. Mat., 53, 5 (1985)
CHAPTER 4
4.1 JMD Coey and H Sun, J. Mang. Magn. Mater., 87, L251 (1991)
4.2 K Schnitzke, L Schultz,J Wecker and M Katter, Appl. Phys. Lett., 57, 2853 (1990)
4.3 M Endoh,M Iwata and M Tokunaga, J.Appl.Phys.Lett.,70, 6030 (1991)
4.4 M Katter, J Wecker and L Schultz, J.Appl.Phys., 70, 3188 (1991)
4.5 C N Christodoulou and T Takeshita,J.Alloys &Comp., 196, 161 (1993)
4.6 PJ McGuiness, XJ Zhang, H Forsyth and IR Harris, J.Less-Common Met.,162,
379 (1990)
4.7 B Gebel, M Kubis and K-H Muller, J.Magn.Magn.Mat., 174, L1-L4 (1997)
4.8 MQ Huang, LY Zhang, BM Ma, Y Zbeng, JM Elbicki, WE Wallace and SG
Sankar, J.Appl. Phys., 70, 6027 (1991)
4.9 T Takeshita and R Nakayama,Proc.11th Int. W’shop on RE Magnets & their
Appl., 49 (1991)
4.10 Pungor, Erno. A Practical Guide to Instrumental Analysis. Boca Raton, Florida.
pp. 181–191 (1995)
4.11 Dean, John A. The Analytical Chemistry Handbook. New York. McGraw Hill,
Inc. pp. 15.1-15.5 (1995)
4.12 Skoog, Douglas A., F. James Holler and Timothy Nieman. Principles of
Instrumental Analysis. Fifth Edition. New York. pp. 905–908 (1998)

165
4.13 B.D. Cullity, Elements of X-ray diffraction, Reading, MA:Addision-
Wesley,(1972)
4.14 Foner, S., Rev. Sci. Instr., 30, 548 (1959)
4.15 Foner, S., Rev. Sci. Instr., 27, 578 (1955)
CHAPTER 5
5.1 M.E. McHenry, M. A. Willard and D. E. Laughlin, Prog. Mat. Sci. 44, 29-
433 (1999)
5.2 S. Manjura Hoque, M.A Hakim, F.A. Khan, N. Chau, Mat. Chem. Phys. 101, 112-
117 (2007)
5.3 D. K. Saha & M. A. Hakim, Jornal of Bangladesh Academy of Sciences, vol. 30,
no. 2, 177-187 (2006)
5.4 Y.Yoshizawa and K.Yamauchi, Mat. Res. Soc .Symp. Proc., 183 (1991)
5.5 Manifred.Muller,N.Mattem and L.Illgen,Z.Metallkde, 82, 895 (1991)
5.6 Tadeusz.Kulik,Mater.Sci.Eng. A 159, 95 (1992)
5.7 K.Hono, K.Hiraga, Q.Wang, A.Inoue and T.Sakurai,Acta Metall.Mater, 40, 2137
(1992)
5.8 P.Gorria, V.M.Prida, M.Tejedor, B.Hanando, M.L.Sanchez,Physica B 299, 215-
224 (2001)
5.9 H.Kissinger, Anal.Chem., 29, 1702-1706 (1957)
5.10 N. Chau, N. X. Chein, N. Q. Hoa, P. Q. Niew, N. H. Luong, N. D. Tho, V. V.
Hiep, JMM 282, 174-179 (2004)
5.11 A. M. Tonejc, N. Ramsak, A. Prodan, A. Tonejc, A Khalladi, S. Surinach, M. D.
Baro, Nanostructureed Materials, 12,677-680 (1990)
5.12 A.Rosales-Rivera, V.H.Valencia, D.L.Quintero, P.Pineda-Gomez, M.Gomez,
Physica B 384,169-171 (2006)
5.13 P.Marin, M.Lopes, Hernando, Y.Iqbal,M.A.Davies, M.R.J.gobs., J.Appl. Phys.,
92, 374 (2002)

166
5.14 M.A.Hakim, S.Manjura Haque, J. Magn. Magn. Mat. 284, 395-402 (2004)
5.15 D.K.Saha, M.A.Hakim, J.Bangladesh Academy of Science, 30, 177-187 (2006)
5.16 A.Lovas, L.F.Kiss, I.Balogh, J. Magn. Magn. Mat. 215-216,463-465 (2000)
5.17 D.Holzer, I.Perez de Albeniz,R.Grossinger,H.Sassik, J. Magn. Magn. Mat. 203,
82-84 (1999)
5.18 M.A.Hakim. Nuclear Science and Application, 13, 36-43 (2004)
5.19 S. Chikazumi, Physics of Magnetism, New work: Willey P. 273 (1964)
5.20 L. Neel, Ann. Phys. (Paris), 18, 1 (1932)
5.21 P. J. Wojtwicz and M. Rayl, Phys. Rev. Lett: 20, 1489 (1968)
5.22 I.Maartense and G.Williams, J.Phys.F:Metal Phys.6L 121-6, 2363 (1976)
5.23 A. Arrott Phys. Rev., 108, 1394 (1957)
5.24 K.P.Belov, Magnetic transitions, Consultants Bureau, New York (1961)
5.25 J.S, Kouvel and M.E.Fisher, Phys.Rev.,136 A, P.1626 (1964)
5.26 K.Knobel, J.P.Sinnecker, R.Sato Turteli, N.R.Rechenberg, R.Grossinger, J. Appl.
Phys., 73, 6603-6605 (1993)
5.27 A. Zorkovska, J. Kovac, P. Sovak, P. Petrovic, M. Konc, J. Magn. Magn. Mat. ,
215-216, 492-494 (2000)
5.28 J.Kovac, O.Dusa, M.Konc, T.Svec, P.Sovak., J. Magn. Magn. Mat. , 157/158,
197-198 (1996)
5.29 R.Krishnan, M.Dancygier, M.Tarhouni., J.Appl.Phys.,63,7768 (1982)
5.30 K.Inomata, M.Hasegawa,S.Shimanuki,IEEE.Trans.on Mag.Mag.17,3076
(1981)
5.31 P.S.A. Kumar, P.A. Joy, S.K. Date, J. Phys. Condens. Matter, 10, L 487 (13)
(1998)
5.32 P.S.A. Kumar, P.A. Joy, S.K. Date, Bull. Mater Sci. 23, 101 (2000)
5.33 C. L. Chien, and R. Hasegawa, Phys. Rev. B16, 2115 (1977)
5.34 K. Handrich, S. Kobe, Amorphe Ferro and Ferrimagnetica, Akademie- Verlag
Berlin, Germany (1980)
5.35 N. Ponpandian, A. Narayanasamy, K. Chattopadhyay and M. Manivel Raja, J.
Appl. Phys. 93, No. 10, 6182 (2003)
5.36 S. M. Bhagat, M. L. Spano and K. V. Rao, J. Appl. Phys. 50(3), 1580 (1979)

167
5.37 S. N. Kaul, Phus. Rev. B 24(11), 6550 (1981)
5.38 S. Ramasamy, Leif Lundgren, K Ganesan and A Narayanasamy, J. Phys. F: Met
. Phys. 17, 753-765 (1987)
5.39 L. K. Varga, F. Mazaleyrat, J. Kovac, and A. Kakay, Mat. Sci. Engg. A, 304-306,
946 (2000)
5.40 E. Pulido, P. Crespo and Hernando, IEEE Transactions on Magnetics, 28, 3189
(1992)
5.41 D. Prabhu, A. Narayanasamy, K. Chattopadhay, Journal of Non-Crystalline
Solids, 353, 1577-1581 (2007)
5.42 Kyeong-Sup Kim, Seong-Cho Yu, Suhk-Kum Oh, Yong-Soocho, Taik-Kee Kim,
JMMM 133, 283-286 (1994)
5.43 K. S. Kim, S. C. Yu, K. Y. Kim, T. H. Noh and I. K. Kang, IEEE Trans. Magn.
29, 2679 (1993)
5.44 A. E. Berkowitz, J. L. Walter, K. F. Wall, Phys. Rev. Lett. 46, 1484-1487 (1981)
5.45 J. Bigot, N. Lecaude, J. C. Perron, C. Milan, C. Ramiarinjaona, J. F. Rialland., J.
MMM, 133, 299-302 (1994)
5.46 Anh-Tuan Le,Chong-Oh Kim, N.Chau,N.D.Cuong, N.D.Tho, N.Q.Hoa,Heebok
Lee, J.Magn.Magn.Mat., 2007 (in press)
5.47 A. Blachowicz, J. Zbroszczyk, J. Olszewski, W. H. Ciurzynska, H. Fukanaga, K.
Narita, B. Wyslocki, M. Hasiak, J. Magn. Magn. Mat., 215-216, 422-424 (2000)
5.48 I. Skorvanek, J. Kovac, J. Kotzler, Phys. Stat. Solidi (b) 236, 303-309 (2003)
5.49 I. Skorvanek, J.Kovac, J. M. Greneche, J. Phys. Condens. Matter, 12, 9085 (2000)
5.50 L. K. Varga, K. V. Rao, NanoStructured Materials., 12, 1157-1160 (1999)