
STUDY OF SPONTANEOUS FISSION OF 252CF:...
133
STUDY OF SPONTANEOUS FISSION OF 252 CF: STRUCTURE OF NEUTRON-RICH NUCLEI, GAMMA-RAY ANGULAR CORRELATION AND G-FACTOR MEASUREMENTS By Ke Li Dissertation Submitted to the Faculty of the Graduate School of Vanderbilt University in partial fulfillment of the requirements for the degree of DOCTOR OF PHILOSOPHY in Physics May, 2008 Nashville, Tennessee Approved: Joseph H. Hamilton Akunuri V. Ramayya Charles F. Maguire Ronald R. Price Sait A. Umar
-
Upload
trannguyet -
Category
Documents
-
view
220 -
download
0
Transcript of STUDY OF SPONTANEOUS FISSION OF 252CF:...

STUDY OF SPONTANEOUS FISSION OF252CF: STRUCTURE OF NEUTRON-RICH
NUCLEI, GAMMA-RAY ANGULAR CORRELATION AND G-FACTOR
MEASUREMENTS
By
Ke Li
Dissertation
Submitted to the Faculty of
the Graduate School of Vanderbilt University
in partial fulfillment of the requirements
for the degree of
DOCTOR OF PHILOSOPHY
in
Physics
May, 2008
Nashville, Tennessee
Approved:
Joseph H. Hamilton
Akunuri V. Ramayya
Charles F. Maguire
Ronald R. Price
Sait A. Umar

To my wife
Zhige Meng

ACKNOWLEDGEMENTS
First of all, I would like to acknowledge the wonderful environment provided by the
Department of Physics and Astronomy, Vanderbilt University for making the time I spent
in Vanderbilt a stimulating, enjoyable and memorable experience. This thesis would not
have been possible without the invaluable assistance and support of my advisors, Professors
Joseph Hamilton and Akunuri Ramayya. Being always patient and supportive, they guided
me through this journey for the past five years. The rest of my committee members, Dr.
Umar, Dr. Maguire and Dr. Price, have my deepest thanks for their encouragement and
support.
Thanks must be extended to Dr. J.K. Hwang, Dr. A.V. Daniel, Dr. Y.X. Luo, Prof.
S.J. Zhu, and Dr. N. J. Stone for providing very experienced and enthusiastic advice on
my research. Also, I’d like to thank Carol Soren for providing a lot of assistance helping
me get through my studies. During my graduate studies, I was able to spend part of my
time at Oak Ridge National Laboratory to gain hands-on experience. I want to thank Dr.
K. Rykaczewski for helping me with this. Other people at ORNL who were very helpful
to me were J. Batchelder, R. Grzywacz, C. Mazzocchi among many others. Chris Goodin,
has been a great friend, and I enjoyed the time we spent together on research.
Special thanks are due to my parents and brothers for their strong support and en-
couragement. Most importantly, my lovely wife, Zhige Meng has always been supportive.
None of this could have been possible without all of them.
The work at Vanderbilt was supported in part by the U.S. Department of Energy
under Grant No. DE-FG05-88ER40407. The Joint Institute for Heavy Ion Research at
ORNL is supported by the University of Tennessee, Vanderbilt University, ORNL, and the
U.S. DOE under Contract No. DE-FG05-87ER40311.
i

TABLE OF CONTENTS
Page
ACKNOWLEDGEMENTS . . . . . . . . . . . . . . . . . . . . . . . . . . . . . . i
LIST OF TABLES . . . . . . . . . . . . . . . . . . . . . . . . . . . . . . . . . . . iv
LIST OF FIGURES . . . . . . . . . . . . . . . . . . . . . . . . . . . . . . . . . . v
Chapter
I. INTRODUCTION . . . . . . . . . . . . . . . . . . . . . . . . . . . . . . . . 1
Spontaneous Fission of252Cf . . . . . . . . . . . . . . . . . . . . . . . . . 1
Nuclear Magnetic Moment . . . . . . . . . . . . . . . . . . . . . . . . . . 6
II. EXPERIMENTAL TECHNIQUES . . . . . . . . . . . . . . . . . . . . . . . 9
Gamma-Ray Detection systems . . . . . . . . . . . . . . . . . . . . . . . . 9
Gamma-ray Detection Principles . . . . . . . . . . . . . . . . . . . . . 9
High Purity Germanium Detectors and BGO suppression . . . . . . . . 11
The Gammasphere Array . . . . . . . . . . . . . . . . . . . . . . . . . 13
Gammasphere Calibration . . . . . . . . . . . . . . . . . . . . . . . . 14
Triple coincidentγ-ray measurements . . . . . . . . . . . . . . . . . . . . . 18
Triple coincident technique . . . . . . . . . . . . . . . . . . . . . . . . 18
Level Scheme Construction . . . . . . . . . . . . . . . . . . . . . . . . 19
Experimental Details . . . . . . . . . . . . . . . . . . . . . . . . . . . . . . 22
1995 Binary Fission . . . . . . . . . . . . . . . . . . . . . . . . . . . 22
2000 Binary Fission . . . . . . . . . . . . . . . . . . . . . . . . . . . 22
2005 Binary and Ternary Fission . . . . . . . . . . . . . . . . . . . . . 23
III. STUDY OF STRUCTURE OF NEUTRON-RICH NUCLEI . . . . . . . . . . 2488−94Kr . . . . . . . . . . . . . . . . . . . . . . . . . . . . . . . . . . . . . 25
88Kr . . . . . . . . . . . . . . . . . . . . . . . . . . . . . . . . . . . . 2790Kr . . . . . . . . . . . . . . . . . . . . . . . . . . . . . . . . . . . . 2792Kr . . . . . . . . . . . . . . . . . . . . . . . . . . . . . . . . . . . . 3394Kr . . . . . . . . . . . . . . . . . . . . . . . . . . . . . . . . . . . . 33
Discussion . . . . . . . . . . . . . . . . . . . . . . . . . . . . . . . . 34102Zr . . . . . . . . . . . . . . . . . . . . . . . . . . . . . . . . . . . . . . 36
Experimental results . . . . . . . . . . . . . . . . . . . . . . . . . . . 38
ii

Discussion . . . . . . . . . . . . . . . . . . . . . . . . . . . . . . . . 41114Ru . . . . . . . . . . . . . . . . . . . . . . . . . . . . . . . . . . . . . . 46
Experimental Results . . . . . . . . . . . . . . . . . . . . . . . . . . . 46
Discussion . . . . . . . . . . . . . . . . . . . . . . . . . . . . . . . . 47137,138Cs . . . . . . . . . . . . . . . . . . . . . . . . . . . . . . . . . . . . 54
Identification of Transitions in137,138Cs . . . . . . . . . . . . . . . . . 54
Shell-model calculations . . . . . . . . . . . . . . . . . . . . . . . . . 58
Discussion . . . . . . . . . . . . . . . . . . . . . . . . . . . . . . . . 64
Conclusions . . . . . . . . . . . . . . . . . . . . . . . . . . . . . . . . . . 66
IV. GAMMA-RAY ANGULAR CORRELATION AND G-FACTOR MEASURE-MENTS . . . . . . . . . . . . . . . . . . . . . . . . . . . . . . . . . . . . . 68
Theoretical Predictions ofg-factors . . . . . . . . . . . . . . . . . . . . . . 68
The Nuclear Shell Model . . . . . . . . . . . . . . . . . . . . . . . . . 68
The Collective Model . . . . . . . . . . . . . . . . . . . . . . . . . . . 72
The Interacting Boson Models . . . . . . . . . . . . . . . . . . . . . . 74
Gamma-Ray Angular Correlation . . . . . . . . . . . . . . . . . . . . . . . 76
Perturbed Angular Correlation . . . . . . . . . . . . . . . . . . . . . . . . . 78
Perturbation From a Static Magnetic Field . . . . . . . . . . . . . . . . 78
Perturbation From Randomly Oriented Magnetic Field . . . . . . . . . 80
Analytical Techniques . . . . . . . . . . . . . . . . . . . . . . . . . . . . . 84
Angular Properties of Gammasphere . . . . . . . . . . . . . . . . . . . 84
Solid Angle Correction and Response Function . . . . . . . . . . . . . 85
Data Sorting and Fragment Identification . . . . . . . . . . . . . . . . 88
Relative Efficiency Correction . . . . . . . . . . . . . . . . . . . . . . 91
Fitting Procedure . . . . . . . . . . . . . . . . . . . . . . . . . . . . . 93
Prompt Angular Correlations Measurements . . . . . . . . . . . . . . . . . 96
Theg-factor Measurements . . . . . . . . . . . . . . . . . . . . . . . . . . 100
Discussion . . . . . . . . . . . . . . . . . . . . . . . . . . . . . . . . . . . 109
Zr isotopes . . . . . . . . . . . . . . . . . . . . . . . . . . . . . . . . 109
Mo isotopes . . . . . . . . . . . . . . . . . . . . . . . . . . . . . . . . 109
Ru isotopes . . . . . . . . . . . . . . . . . . . . . . . . . . . . . . . . 110
Ba isotopes . . . . . . . . . . . . . . . . . . . . . . . . . . . . . . . . 112
Ce isotopes . . . . . . . . . . . . . . . . . . . . . . . . . . . . . . . . 113
Conclusion . . . . . . . . . . . . . . . . . . . . . . . . . . . . . . . . . . . 114
V. SUMMARY . . . . . . . . . . . . . . . . . . . . . . . . . . . . . . . . . . . 115
BIBLIOGRAPHY . . . . . . . . . . . . . . . . . . . . . . . . . . . . . . . . . . . 117
iii

LIST OF TABLES
Table Page
1 Fit coefficients for the 3rd order polynomial energy calibration of the Ge de-tectors from ADC channel space to energy in keV. . . . . . . . . . . . . . . . . 17
2 Fit coefficients of efficiency calibration of Gammasphere array. . . . . . . . . . 17
3 Relative intensities (Iγ) of γ-ray transitions (keV) in102Zr. Intensity errorsrange between 5% for the strong transitions and 30% for the weak transitions. 39
4 Relative intensities ofγ-rays in 114Ru. The doublet 265.2- and 265.5-keVtransitions are estimated with error of 20%. . . . . . . . . . . . . . . . . . . . 49
5 Comparison of the experimental level energies of137Cs with those calculatedby the shell-model. Deviations between the theory and experiment are shownin the table. Energies are in MeV. . . . . . . . . . . . . . . . . . . . . . . . . 62
6 Comparison of the experimental level energies of138Cs with those calculatedby the shell-model. Both experimental and calculated energies are relativeto the 6− state. Deviations between the theory and experiment are shown.Energies are in MeV. . . . . . . . . . . . . . . . . . . . . . . . . . . . . . . . 63
7 Angle bins in Gammasphere. (101 detectors). . . . . . . . . . . . . . . . . . . 84
8 List of cascades and gating gamma-rays to measureg-factor values. . . . . . . 101
9 Measuredg-factors of excited states in neutron-rich nuclei produced fromspontaneous fission of252Cf. . . . . . . . . . . . . . . . . . . . . . . . . . . . 108
iv

LIST OF FIGURES
Figure Page
1 Nuclear landscape. Magic shell closures are highlighted in red. The greenregion is enclosed by proton and neutron drop lines. The yellow ones areknown nuclei, while black dots are stable nuclei. . . . . . . . . . . . . . . . . 2
2 Relative, potential-energy barrier widths for the processes of spontaneous fis-sion andα decay in252Cf. . . . . . . . . . . . . . . . . . . . . . . . . . . . . 3
3 Spontaneous fission scheme of252Cf . . . . . . . . . . . . . . . . . . . . . . . 4
4 The relative yields of secondary fragments from the spontaneous fission of252Cf as a function of proton number Z and mass number A [Wah88]. . . . . . 5
5 Spectrum produced from double-gating on 151.8- and 326.5-keV transitionsin 102Zr. Transitions are labeled by their neutron multiplicities for102Zr corre-sponding to the complementary fission fragments. . . . . . . . . . . . . . . . 5
6 Schematic band diagrams for an insulator, a semiconductor, and a metal. . . . . 10
7 A scheme of possible modes of interaction between the incidentγ radiationand the detector crystal. . . . . . . . . . . . . . . . . . . . . . . . . . . . . . . 11
8 A spectrum which shows the reduction in Compton scattering backgroundfrom shielding a HPGe detector with BGO crystals. The spectrum originatesfrom 60Co decay which releases gamma-rays at 1.173 MeV and 1.332 MeV. . 12
9 Gammasphere closed and ready for beam. The array is split vertically down themiddle so that the system can be pulled apart for access to the source chamberat the center of the sphere. . . . . . . . . . . . . . . . . . . . . . . . . . . . . 14
10 A schematic diagram of a Gammasphere detector module showing the Ge crys-tal (∼10cm long), the BGO/photomultiplier suppression system, the housingfor the electronic control system and also the liquid-nitrogen dewars used tocool the Ge crystal in order to suppress random thermal signals. . . . . . . . . 15
11 Calibration spectrum in detector 95 for152Eu source measurement. . . . . . . . 16
v

12 Gammasphere efficiency curve in arbitrary units. . . . . . . . . . . . . . . . . 17
13 Partial ground state band of102Zr. Energies are in keV. . . . . . . . . . . . . . 19
14 Triple coincidence gating series in102Zr . . . . . . . . . . . . . . . . . . . . . 20
15 E-∆E detector array used in Jan. 2005 ANL experiment . . . . . . . . . . . . 23
16 Level Schemes of88−94Kr reported in [RU00]. . . . . . . . . . . . . . . . . . . 26
17 Level Scheme of88Kr. Energies are in keV. . . . . . . . . . . . . . . . . . . . 28
18 A spectrum double-gating on 775.5- and 868.6-keV transitions in88Kr. Lowenergy and high energy transitions are shown in (a) and (b). . . . . . . . . . . 29
19 A comparison of level structures ofN = 52 isotopes,86Se [Jon06],88Kr, and90Sr [Ste01]. Three new levels and four new transitions have been identified in86Se in this work and now3− is assigned to the 2073-keV level. . . . . . . . . 30
20 Level Scheme of90Kr. Energies are in keV. . . . . . . . . . . . . . . . . . . . 31
21 Angular correlation measurement of 707.6-799.1 keV cascade in90Kr. . . . . . 32
22 Level Scheme of92Kr. Energies are in keV. . . . . . . . . . . . . . . . . . . . 33
23 Level Scheme of94Kr. Energies are in keV. . . . . . . . . . . . . . . . . . . . 34
24 Energies of2+ state in ground bands of even-even Kr, Sr, and Zr isotopes. . . . 35
25 Energies of first3− state in even-even Kr, Sr, and Zr isotopes. . . . . . . . . . 35
26 Level Scheme of102Zr constructed in this work. Energies are in keV. The27.5-keV transition from the 1820.8- to the 1793.3-keV state is not drawn. . . . 37
27 Coincidence spectra with double gates set on (a) 151.8- and 326.5-keV transi-tions and (b) 326.5- and 486.6-keV transitions in102Zr. . . . . . . . . . . . . . 40
28 Coincidence spectra with double gates set on (a) 486.6- and 1961.5-keV and(b) 1961.5- and 257.2-keV transitions in102Zr. . . . . . . . . . . . . . . . . . 40
vi

29 Plot ofJ (1) vs rotational frequencies for rotational bands in102Zr. . . . . . . . 41
30 Angular correlation of the 697.0-486.6 keV cascade in102Zr. . . . . . . . . . . 42
31 Angular correlation of the 967.4-486.6 keV cascade in102Zr. . . . . . . . . . . 43
32 Angular correlation of the 908.0-326.5 keV cascade in102Zr. . . . . . . . . . . 44
33 Angular correlation of the 1090.4-151.8 keV cascade in102Zr. . . . . . . . . . 45
34 Angular correlation of the 1090.4-578.6 keV cascade in102Zr. . . . . . . . . . 45
35 Level Scheme of114Ru. Energies are in keV. . . . . . . . . . . . . . . . . . . . 47
36 Spectrum double gated on (a) 443.2- and 709.3-keV transitions, (b) 265.2- and298.1-keV transitions, and (c) 265.2- and 530.5-keV transitions in114Ru. . . . 48
37 Plot ofJ (1) vs rotational frequencies for ground-state bands in108,110,112,114Ru. 51
38 Polar coordinate plots of total Routhian surface (TRS) calculated for114Ru:(a) ~ω = 0.0 MeV,β2 = 0.23,γ = -59.4◦, β4= -0.049, (b)~ω = 0.3 MeV,β2 =0.24,γ = -49.1◦, β4 = -0.041, (c)~ω = 0.5 MeV,β2 = 0.23,γ = -52.9◦, β4 =-0.035. . . . . . . . . . . . . . . . . . . . . . . . . . . . . . . . . . . . . . . . 51
39 The calculated Routhians for quasi-protons(a) and quasi-neutrons(b) vs rota-tional frequency~ω in 114Ru. Solid line: (+,+); Dotted lines: (+,-); Dot-dashlines: (-,+); Dash lines: (-,-). . . . . . . . . . . . . . . . . . . . . . . . . . . . 52
40 Plot of∆E vs spin of lower energy level forγ-bands in108,110,112,114Ru. . . . . 53
41 Plot of first excited state energies of one-phononγ-bands and two-phononγ-bands in108,110,112,114Ru. . . . . . . . . . . . . . . . . . . . . . . . . . . . . . 53
42 Fission yield ratios of138Cs and137Cs in109,110,111Tc gates,144Ba and143Ba in103,104,105Mo gates [TA97]. . . . . . . . . . . . . . . . . . . . . . . . . . . . . 55
43 (a) Spectrum gating on the 1156.9-keV transition in138Cs and the 137.3-keVtransition in109Tc, (b) spectrum gating on the 1156.9- and 174.5-keV transi-tions in138Cs. . . . . . . . . . . . . . . . . . . . . . . . . . . . . . . . . . . . 56
vii

44 Level Scheme of138Cs. Energies are in keV. . . . . . . . . . . . . . . . . . . . 57
45 Spectra gating on the 1184.7 keV and 487.1 keV transitions in137Cs (a) thelow energy region, (b) the high energy region. . . . . . . . . . . . . . . . . . . 59
46 Level Scheme of137Cs. Energies are in keV. . . . . . . . . . . . . . . . . . . . 60
47 Yrast states of Cs isotopes. . . . . . . . . . . . . . . . . . . . . . . . . . . . 64
48 Yrast states ofN = 82 andN = 83 isotones. . . . . . . . . . . . . . . . . . . 65
49 Variations of excitation energies of the11/2+ states in the even-N Cs isotopesversus the excitations of the first2+ state in the corresponding even-even Xecore. The9− state energy in138Cs is also shown. . . . . . . . . . . . . . . . . 66
50 The orbitals generated by the simple Harmonic Oscillator, simple Wood-Saxonand corrected Wood-Saxon potentials. The split induced by the spin-orbit cor-rection is necessary to generate the appropriate shell-model magic numbers. . . 70
51 E(4+):E(2+) ratios of ground state rotational bands in neutron rich Zr, Mo andRu nuclei. . . . . . . . . . . . . . . . . . . . . . . . . . . . . . . . . . . . . . 73
52 A gamma-ray cascade. . . . . . . . . . . . . . . . . . . . . . . . . . . . . . . 77
53 A geometry used in discussion of perturbed angular correlations. . . . . . . . . 79
54 A scheme of experimental setup of our 2000 binary fission experiment. The252Cf source was sandwiched between two Fe foils. . . . . . . . . . . . . . . . 81
55 Calculated impurity hyperfine field for isotopes in Fe lattice [Rao79]. . . . . . 82
56 Dependence of G2,4 and| dG2,4
dφ| on the precession angleφ. . . . . . . . . . . . 83
57 The polar (θi) and azimuthal (φi) positions of each detector within the Gam-masphere array. . . . . . . . . . . . . . . . . . . . . . . . . . . . . . . . . . . 86
58 The response functions of five of the 64 angle bins. . . . . . . . . . . . . . . . 87
viii

59 Coincidence peak of 171.8- and 350.8-keV transitions in106Mo in angle binnumber 1 (top) and 61 (bottom). . . . . . . . . . . . . . . . . . . . . . . . . . 89
60 Partial ground bands of104,108Mo. . . . . . . . . . . . . . . . . . . . . . . . . 90
61 In the full matrix, the correlation peaks of 192.4–368.6 keV in104Mo and192.7–371.0 keV in108Mo overlap. . . . . . . . . . . . . . . . . . . . . . . . 91
62 (Top)Correlation peak 192.4–368.6 keV cascade in104Mo gated by 519.4 and641.5 keV transitions. (Bottom)Correlation peak of 192.7–371.0 keV cascadein 108Mo gated by 527.0 and 662.1 keV transitions. . . . . . . . . . . . . . . . 92
63 Relative efficiencies of detectors 5 and 57. . . . . . . . . . . . . . . . . . . . . 93
64 The response functions of the 17 groups in the ideal case when all 110 detectorsare present and have the same efficiency. . . . . . . . . . . . . . . . . . . . . . 94
65 Angular correlation curve of 486.6 and 326.5 keV transitions in the ground-state band of102Zr. . . . . . . . . . . . . . . . . . . . . . . . . . . . . . . . . 97
66 Partial level scheme of106Mo to show the decay patterns of chiral bands intoγ andγγ bands. . . . . . . . . . . . . . . . . . . . . . . . . . . . . . . . . . . 97
67 Angular correlations of 517.5 and 724.4 keV transitions in106Mo. . . . . . . . 98
68 Angular correlations of 339.5 and 1051.2 keV transitions in106Mo. . . . . . . 99
69 Angular correlations of 352.0-212.6 keV cascade in100Zr. . . . . . . . . . . . 102
70 Angular correlations of 326.5- and 151.8-keV transitions in102Zr. . . . . . . . 102
71 Angular correlations of 368.6- and 192.4-keV transitions in104Mo. . . . . . . . 103
72 Angular correlations of 350.8- and 171.8-keV transitions in106Mo. . . . . . . . 103
73 Angular correlations of 371.0- and 192.7-keV transitions in108Mo. . . . . . . . 104
74 Angular correlations of 422.3- and 242.1-keV transitions in108Ru. . . . . . . . 104
ix

75 Angular correlations of 422.2- and 240.7-keV transitions in110Ru. . . . . . . . 105
76 Angular correlations of 408.4- and 226.6-keV transitions in112Ru. . . . . . . . 105
77 Angular correlations of 330.8- and 199.0-keV transitions in144Ba. . . . . . . . 106
78 Angular correlations of 332.6- and 181.3-keV transitions in146Ba. . . . . . . . 106
79 Angular correlations of 409.6- and 258.3-keV transitions in146Ce. . . . . . . . 107
80 Angular correlations of 294.5- and 158.5-keV transitions in148Ce. . . . . . . . 107
81 Measuredg(2+) in Zr nuclei in this experiment, with comparison of previousdata andZ/A. . . . . . . . . . . . . . . . . . . . . . . . . . . . . . . . . . . . 110
82 Measuredg(2+) in Mo nuclei in this experiment, with comparison of previousdata andZ/A. . . . . . . . . . . . . . . . . . . . . . . . . . . . . . . . . . . . 111
83 Measuredg(2+) in Ru nuclei in this experiment, with comparison of previousdata andZ/A. . . . . . . . . . . . . . . . . . . . . . . . . . . . . . . . . . . . 111
84 Measuredg(2+) in Ba nuclei in this experiment, with comparison of previousdata andZ/A. . . . . . . . . . . . . . . . . . . . . . . . . . . . . . . . . . . . 112
85 Measuredg(2+) in Ce nuclei in this experiment, with comparison of previousdata andZ/A. . . . . . . . . . . . . . . . . . . . . . . . . . . . . . . . . . . . 113
x

CHAPTER I
INTRODUCTION
With the development of more sophisticated facilities and experimental techniques,
the research of nuclear structure have been moving towards more and more exotic regions,
with a great excess of protons or neutrons than found in the stable isotopes. Today, around
115 different species of nuclei have been identified. Figure 1 shows all the known nuclei
arranged according to their proton numberZ and neutron numberN . Most of the stable
nuclei have unequalZ andN and exhibit a significant neutron excess, in order to com-
pensate for the repulsive trend caused by the positive charges of the protons. Properties of
nuclei can vary enormously from nucleus to nucleus. A special character, known as “Magic
Numbers”, is exhibited by nuclei with certain number of protons and neutrons.
For the study of neutron-rich nuclei, it is hard to produce them by using normal
heavy-ion reactions. One practical method is to study the fission of heavy elements, such
as induced fission or spontaneous fission. In a fission process, a heavy nucleus breaks apart,
produces nuclei with much higher ratios of neutrons to protons than the stable isotopes in
that mass region. Thus, studies of nuclei produced from fission provide a major source of
information on the structure of neutron-rich nuclei. In this dissertation, experimental data
from the spontaneous fission of252Cf will be investigated.
Spontaneous Fission of252Cf
Spontaneous fission is a process in which a single heavy nucleus splits into two
or more smaller fragments without any external influence. The process occurs mainly in
heavy nuclei and is the direct result of competition between the attractive nuclear force,
which holds nucleons in the nuclei, and the Coulomb repulsion which drive the protons
apart. For light nuclei, the strong nuclear force is easily able to overcome the Coulomb
1

Figure 1: Nuclear landscape. Magic shell closures are highlighted in red. The green region
is enclosed by proton and neutron drop lines. The yellow ones are known nuclei, while
black dots are stable nuclei.
force. However, since the Coulomb force is repulsive, with more and more protons inside,
the nucleus becomes more instable.
The energy to hold a25298 Cf nucleus together, thebinding energy, is approximately
the difference between the measured mass of252Cf and the total mass of 98 protons and
154 neutrons, which is approximately 1800 MeV. The binary fission of252Cf is able to
liberate∼200 MeV of nuclear energy and is therefore an energetically feasible means of
de-excitation. Despite spontaneous fission,α decay is the predominately-favored decay
mechanism for most heavy nuclei. Theα decay process liberates≈ 6 MeV of internal
energy. Alpha decay is favored because the Coulomb barrier opposing the binary fission of
252Cf into two 126In nuclei is around
V (SF ) =1
4πǫ0
Z1Z2e2
(R1 + R2)≈ 275MeV (1)
assuming that the nuclear radiusR = 1.25A1/3 fm, whereas the Coulomb barrier for the
2

alpha
decay~30MeV
Spontaneous
Fission~275MeV
Coulomb Barrier
Tunneling Distance
Figure 2: Relative, potential-energy barrier widths for theprocesses of spontaneous fission
andα decay in252Cf.
production of anα particle and a248Cm nucleus is
V (α) ≈ 35MeV. (2)
as shown in Figure 2. The preference forα decay over spontaneous fission manifests
itself in the fact that the half-life forα decay of252Cf into 248Cm is measured to be
τ1/2(α) =2.645(8) yrs while the half-life for spontaneous fission isτ1/2(SF ) =82.89(33)
yrs.
Right after the splitting of the parent nucleus, the primary fission fragments evap-
orate some number of neutrons, on the average of four for spontaneous fission of252Cf
[TA97]. These secondary fragments are usually in very excited states and promptly emit
γ-rays. The first two stages occur very quickly, with most neutrons evaporated in 10−20 to
10−15 seconds. When neutron emission becomes energetically impossible, the process of
γ-ray decay takes over. At this stage, the fragments are referred to as secondary fragments
and theγ rays which they emit are known as promptγ rays. The emission of these prompt
γ-rays eventually leads to a ground-state whose lifetime (∼ second) is far greater than the
time-scale of the fission process and is relatively considered to be stable. The radioactive
3

252Cf
Neutron Emission
γ-rays
Secondary Fragments
Time(s)
Saddle toScission
Promptneutronemission
Promptgammaemission
0
10-20
10-18
10-14
Figure 3: Spontaneous fission scheme of252Cf
secondary fragments subsequently undergo a series ofβ decays and these continue until
the fragments transform themselves into more stable nuclei. A schematic of timescale in
the spontaneous fission of252Cf is shown in Figure 3.
The production region of spontaneous fission consists of two distinct areas either
side of the exceptional stable doubly-magic132Sn nucleus, as shown in Figure 4. Each bi-
nary fission event of252Cf therefore yield complimentary pairs of one heavy and one light
fragment. Since individual protons are not emitted as fission fragments, the same pairs of
isotopes are always produced together:40Zr with 58Ce, 42Mo with 56Ba, 44Ru with 54Xe
etc. Consequently,γ-rays emitted from each pair will be in coincidence with each other.
As an example, Figure 5 shows aγ spectrum produced from one of our experiments on
spontaneous fission of252Cf. The spectrum shows allγ rays recorded in coincidence with
the two lowest energy (highest intensity) transitions in102Zr. As well as other transitions
in 102Zr, the spectrum exhibitsγ rays from a wide range of fission fragments that are co-
incident withγ rays in102Zr. Studies of spontaneous fission have shown that the neutron
4

Figure 4: The relative yields of secondary fragments from the spontaneous fission of252Cf
as a function of proton number Z and mass number A [Wah88].
100 300 500 700E
5000
15000
25000
35000
45000
55000
65000
Cou
nts
per
Cha
nnel
3n
3n4n
3n2n 4n
102 Z
r4n
102 Z
r
5n3n
2n
2n
4n
Gate on 151.8- and 326.5- keV transitions
Figure 5: Spectrum produced from double-gating on 151.8- and 326.5-keV transitions in
102Zr. Transitions are labeled by their neutron multiplicities for102Zr corresponding to the
complementary fission fragments.
5

multiplicities could range from 0 (cold fission) to as high as 10 [TA97]. Other possibili-
ties include ternary fission (0.38% of all spontaneous fission events) in which the parent
nucleus splits into three particles [Fon06] [Goo06].
The disadvantage of using a spontaneous fission source is that many nuclei (> 100)
are populated. Each of the 100 fragments can emit up to 100γ-rays to give us overlapping
energy signals that can obscure the signatures of any nucleus of interest. With the proper
experimental facilities and data analysis techniques, we can sort the signals to identify the
nuclei of interest. At the emergence of the first phase of the Gammasphere detector array,
our 1995 experiment was performed [Ham95]. Five years later, with the second phase of
the Gammasphere, our 2000 experimental run was performed, with 15 times more events
collected [Luo01]. Also, with the new data set and a less compressed cube created, much
information has been discovered. In this dissertation, some new results will be presented
on the study of neutron-rich nuclei.
Nuclear Magnetic Moment
A single, static electric charge creates a static electric field in the space around it.
Similarly, a moving electric charge creates a magnetic field and the magnetic properties of
such a charge can be represented by a quantity referred to as the magnetic dipole moment,
µ. This rule applies to the nucleus where the magnetic effects can be considered as having
origins in both the orbital motion of charged particles as well as in the intrinsic spin that all
nucleons possess. In the classical representation, a single charge,e, of massm, orbiting at
velocity ofv in a uniform circle of radiusr has a magnetic dipole moment given by
µ =e
2ml (3)
wherel = mv × r is the classical angular momentum.
For protons and neutrons moving in nuclei, quantum mechanical considerations
must be taken into account. First, the angular momentum is defined to be the expectation
6

value corresponding to the direction in whichl has maximum projection (+lh). Second, it
is necessary to include an additional term for the intrinsic spin magnetic moment,s, which
each nucleon possesses. This intrinsic moment is due to the intrinsic spin of the particle.
The expression for the magnetic moment becomes
µ = (gll + gss)µN
~(4)
where the proton mass,mp, is used to define the nuclear magneton,
µN =e~
2mp= 3.15245 × 10⁻⁸eV/T (5)
The orbital and intrinsic-sping-factors,gl andgs, are dimensionless quantities which quan-
tify the extent of orbital and intrinsic contributions to the magnetic moment. The measured
values ofgs for free protons (π) and neutrons (ν) are
gs(π) = +5.5856912(22)
gs(ν) = −3.8260837(18) (6)
respectively. The difference from expected values ofgs(π) = +2 andgs(ν) = 0 is taken as
a proof that neither protons nor neutrons are elementary particles.
Therefore, for a nucleus composed ofA = Z + N nucleons, any arbitrary state
with a “spin” quantum number,I has a net angular momentum contributed from orbital
and intrinsic of all the nucleons in the system. The spin,I, is defined as
I =A
∑
i=1
(li + si). (7)
Hence, the magnetic moment of the state is the sum over all nucleons:
µ =A
∑
i=1
(gli li + gsisi)
µN
~. (8)
Equation 8 cannot be solved analytically for any arbitrary excited state in any arbi-
trary nucleus. Interactions between nucleons depend strongly on relative spin orientations.
Therefore, individual intrinsic spins and orbital momenta are not constant but can take
7

on any values that are compatible with the overall spin,I. The solution of Equation 8 is
no more than an estimate made using the most appropriate nuclear model/models for the
specific nucleus under consideration.
The measurement of excited-stateg-factors has long been of experimental signif-
icance, as they play an important role in the understanding of nuclear structure. Exper-
imental g-factor measurements are used to verify the validity and suitability of various
nuclear models. A wide variety of experimental techniques have been developed to mea-
sure excited-stateg-factors. Most methods are accelerator-based and involve the use of a
beam to produce excited states, implantation of products into a hyperfine magnetic field,
and measurements of perturbed angular correlations. Measurements involving the use of
fission fragments can be found, such as in [Smi99] and [Pat02], whereg-factor measure-
ments were made by put spontaneously fissioning source between ferromagnetic materials
with an externally applied magnetic field.
The motivation for us to measure excited-stateg-factors is a new technique to mea-
sure angular correlations perturbed by randomly oriented hyperfine fields [Dan07], by ana-
lyzing a high statistical dataset from our 2000 binary fission experiment with the Gamma-
sphere array. The Gammasphere array has 110 Germanium detectors at full capacity and
they cover 4π angle around the reaction chamber, and provides a large number (5995) of
detector pairs, falling into 64 discrete angle bins, for us to perform angular correlation mea-
surements. In our experiment, the spontaneously fissioning252Cf source was sandwiched
between two iron (Fe) foils. Therefore, angular correlations of delayedγ-ray cascades were
perturbed by the randomly-oriented hyperfine magnetic fields in the Fe foils. The pertur-
bation is reflected in the attenuation of angular correlation coefficients, which are related
to the lifetimes andg-factors of the intermediate states. While for prompt cascades, the
perturbation effects are negligible, which enabled us to extract information on the spins
and parities of the energy levels and the multipole mixing ratios of the transitions.
8

CHAPTER II
EXPERIMENTAL TECHNIQUES
The fission experiments described in this dissertation utilized one of the most ad-
vanced experimental nuclear facilities, Gammasphere, which has high energy resolutions
and efficiencies and enables us to probe more exotic nuclei and discover more detailed
information. Triple coincident technique has been developed and is the key to increase
our ability to identify weak transitions in the nuclei of interest. In this chapter, we will
introduceγ-ray detection techniques, and the Gammasphere array. The triple coincident
technique will be detailed. The details of several fission experiments will be presented as
well.
Gamma-Ray Detection systems
Gamma-ray Detection Principles
Generally, two physical processes lie behind mostγ-ray detection devices. One
process is the interaction between the incidentγ-ray radiation and the atoms of the detecting
material, which free a large number of atomic electrons from their orbits. The other process
is the collection of the liberated charges and transformation into a measurable electrical
voltage with a magnitude proportional to the incidentγ-ray energy.
Therefore, such a detector device must satisfy two criteria: the detective material
must be able to withstand a sufficiently-large-enough electric field to gather the radiation-
liberated electrons without collecting random thermal electrons present in the sample, and
at the same time, the material must also be capable of allowing the incident radiation to
liberate large numbers of atomic electron and to allow these liberated electrons to travel
freely so that they may be counted. The first criterion clearly suggests insulating material
9

Conduction
band
Valance
band
EgEg
Eg~0
Insulator Semiconductor Metal
Figure 6: Schematic band diagrams for an insulator, a semiconductor, and a metal.
and the second seems to support the use of a conductor. Semiconducting materials, like
Ge, satisfy these requirements, in a way best described by the concept of bands.
The electrical properties of a material are defined by the quality and the extent of its
regular and periodic lattice structure, which established allowed energy bands for electrons
that exist within that solid. In simple terms, the lower band, called thevalence band, hosts
those electrons confined to specific lattice sites, while the higher-lyingconduction band
contains those electrons which are free to migrate through the crystal. The two bands are
separated by a finiteband gap, the size of which effectively determines whether the material
is classified as a semi-conductor or as an insulator. For insulators, the band gap energy is
usually 5 eV or more, whereas for semiconductors considerably less, approximately 1 eV.
In the absence of any excitations, in both materials the valence band is completely filled
by the electrons bound to their specific lattice sites. Schematic band diagrams for different
materials are shown in Figure 6.
At any nonzero temperature, electrons in the valence band can gain sufficient energy
to cross the band gap and emigrate into the conduction band, leaving a vacancy (called a
hole) in the valence band. The electron-hole pair becomes then free to move from its point
of origin. The Ge detectors are cooled and operated at liquid Nitrogen temperature, 77K,
to minimize this random thermal motion.
10

Compton Scattering followedby photo−absorption
Single, escaped511−keV radiation
γ
Scattering followed by escape
Electron−positron annihilation
Pair production
Electron−positron annihilation
Pair production
Double, escaped 511−keV radiation
Figure 7: A scheme of possible modes of interaction between the incidentγ radiation and
the detector crystal.
Without thermal excitations, electrons are only liberated by the energy deposited
by the incident radiation. With the application of an electric field to the semiconductor
material, the liberated electrons and holes are forced to move in directions anti-parallel and
parallel to the field, usually to be captured by an electrode at either end of the sample and
detected as an electric signal, which is proportional to the incidentγ-ray energy.
High Purity Germanium Detectors and BGO suppression
High purity germanium (HPGe) crystals are generally the semiconductor of choice
for γ-ray studies. Their advantage include excellent energy resolution and detection ef-
ficiency. Energy resolution is particularly important for experiments which have many
γ-rays emitted with similar energies, as in the case in fission. The energy resolution of a
HPGe crystal, measured by the full width at half maximum (FWHM) of a 1.33-MeVγ-ray,
is about 2 keV. The detection efficiency of a 3”×3” HPGe crystal is about 80% that of a
11

Unsuppressed
Full-energyphoto-peaks
Background fromCompton Scattering
Suppressed
0 200 400 600 800 1000 12000
2000
4000
6000
8000
Energy (keV)
Cou
nts
Figure 8: A spectrum which shows the reduction in Compton scattering background from
shielding a HPGe detector with BGO crystals. The spectrum originates from60Co decay
which releases gamma-rays at 1.173 MeV and 1.332 MeV.
similarly sized and positioned NaI scintillator.
Practically, for the HPGe crystal, several different interaction processes can occur
that create false energy signals and these are shown in Figure 7. Multiple scattering by the
incidentγ ray releases electrons which are collected as part of the energy signal. Theγ ray
can escape from the crystal before imparting all of its energy leaving behind only a partial
energy signal. The random nature of each escape means the partial energy signal is also
random, the result of the Compton continuum. For incidentγ-ray energies greater than
1022 keV, electron-positron pair production can occur followed by positron-annihilation.
If one or both of the annihilationγ rays subsequently escapes, the net result is removal
of exactly 511 or 1022 keV from the energy signal resulting in the corresponding escape
peaks in the energy spectrum.
Any event in which the incident radiation escapes the Ge crystal is undesirable as
the energy reported by the Ge crystal is then false. Such events can be ignored by the
12

use of suppression shields which detect the escaped radiations and thus allow the control
system to deliberately ignore any Ge energy signal that they produce. A material often used
as a suppression shields is the inorganic crystal Bismuth Germanite(Bi4Ge3O12), which is
more commonly knows as BGO. The technique is to shield the 5 sides of the HPGe detector
that are not facing the source with a scintillator that has a very high stopping power. The
photons that escape from the HPGe then have a high probability of being detected by the
surrounding scintillator and events where this occurs are rejected. Since the scintillator is
used only to veto events, it need not have good energy resolution.
The Compton-suppression technique results in an improvement in the peak-to-total
(P/T) ratio for a 1.3-MeVγ ray from about 0.25 for the bare crystal to about 0.6 when
suppressed, as shown in Figure 8. This is an enormously important signal to background
gain, without which high-fold coincidence measurements would not be practical.
The Gammasphere Array
The array of detectors used in our252Cf experiments is called Gammasphere, which
was commissioned in 1995 at the Lawrence Berkeley National Laboratory [Lee97]. It con-
sists of 110 high purity Ge detectors, spreading out spherically around the source chamber.
Each detector is surrounded with a BGO suppression shield. The Ge detectors are kept
cool with an automated liquid nitrogen delivery system, providing energy resolution of less
than 3 keV at 1 MeV. Photopeak efficiency is around 10% at 1 MeV which is quite good
for γ-ray detection. A picture of Gammasphere is shown in Figure 9.
A schematic diagram of a Gammasphere detector module is shown Figure 10. The
Ge crystal was housed within a BGO suppression system comprised of a set of shields and
a backing plug, with a purpose of acting as a detector of escaped radiations. The liquid
nitrogen dewars for each detector was mounted, as usual, on the spherical, outer support
hemisphere of the array. The tapered, heavy-metal collimators on the front face of every
detector exposed a Ge solid angle of 0.418% each, meaning that, with≈ 100 detectors
13

Figure 9: Gammasphere closed and ready for beam. The array is split vertically down the
middle so that the system can be pulled apart for access to the source chamber at the center
of the sphere.
operating, the total Ge coverage is approximately 42% of the complete sphere surrounding
theγ-ray source.
The design of Gammasphere allows for the use of a wide variety of auxiliary detec-
tors. These include external devices, such as a fragment mass analyzer, as well as devices
designed to be placed inside the chamber. In our 2005 Experiment, a∆E-E detector array
was used to identify fragments from binary fission and ternary fission.
Gammasphere Calibration
In order to find out exact energies and relative intensities ofγ-ray transitions, we
have to calibrate the response of the Ge detectors. Some standard sources,56Co, 133Ba and
152Eu sources were used to measure detector energy calibration and efficiency curves. A
γ-ray spectrum from the152Eu detected in detector 95 is shown in Figure 11. A detailed
list of energies and intensities ofγ-rays in those standard sources can be found in [Fir96].
14

γγ
γ
BGO Suppressor Plug
Ge Detector
BGO SuppressorShield
LiquidNitrogenDewar
Detector Electronics
HevimetShield
SupportHemisphere
PMTubes
Gamma-raySource
Figure 10: A schematic diagram of a Gammasphere detector module showing the Ge crys-
tal (∼10cm long), the BGO/photomultiplier suppression system, the housing for the elec-
tronic control system and also the liquid-nitrogen dewars used to cool the Ge crystal in
order to suppress random thermal signals.
15

(ch)γE0 500 1000 1500 2000 2500 3000 3500 4000
Cou
nt P
er C
hann
el
0
2000
4000
6000
8000
10000
344.28
121.78
778.90
1085.84
964.1
244.70
1112.07 1408.01
Figure 11: Calibration spectrum in detector 95 for152Eu source measurement.
The energy calibration for the detector array was fit to a third order polynomial,
E = a + bx + cx2 + dx3 (1)
whereE is the energy in keV,x is the channel number. The fitted coefficients are tabulated
in Table 1.
The efficiency calibration of the Ge detectors was fit to the following equation:
eff = exp[(A + Bx + Cx2)−G + (D + Ey + Fy2)−G]−1/G (2)
wherex = log(E/100), y = log(E/1000) andE is in keV. The quantityeff is a dimen-
sionless multiplicative constant andE is energy in keV. The fit curve is shown in Figure
12. The calculated fit parameters are listed in Table 2.
16

Table 1: Fit coefficients for the 3rd order polynomial energy calibration of the Ge detectors
from ADC channel space to energy in keV.
Fit Coefficient Fit Value
a -6.2734×10⁻¹
b 3.3370×10⁻¹
c -9.0093×10⁻⁸
d 4.7999×10⁻¹²
Figure 12: Gammasphere efficiency curve in arbitrary units.
Table 2: Fit coefficients of efficiency calibration of Gammasphere array.
Fit Coefficient Fit Value Fit Coefficient Fit Value
A 14.1597 B 9.18559
C -2.7907 D 6.36297
E -0.65056 F 0.0
G 2.09765
17

Triple coincidentγ-ray measurements
Triple coincident technique
In the spontaneous fission of252Cf, more than 100 nuclei species are populated, with
more than 3000γ-rays emitted. Thus, the spectra are very complicated and in any single
γ gate, one see not only the transitions in coincidence with thisγ in this nucleus, but also
the transitions from its five to ten different partners, and many other random coincidentγ
transitions. To eliminate most of theγ rays not belonging to a particular isotope of interest
and one partner, the triple-coincidence technique was employed. Triple coincident events
are processed to construct a cube, with energy of each of the threeγ-rays is placed along an
axis of the cube. For example, threeγ-rays of energiesE1, E2 andE3 are detected within
the time window. In the coincidence cube, the count at (E1,E2,E3) is added by 1. Since
each axis is constructed symmetrically, so we have
N(E1, E2, E3) = N(E2, E1, E3) = N(E3, E2, E1)
= N(E1, E3, E2) = N(E2, E3, E1) = N(E3, E1, E2) (3)
and so on. Higher-fold events are unfolded into triple coincidences during this process.
The analysis of the cube data was performed by the Radware software package
[Rad95]. This package provides programs to sort experimental data into histogram matrices
and cubes. Programs to analyze cubes are provided as well, to create coincidence spectra
with given gatingγ-ray energies. During the processing of our 2000 experimental data, we
set the time window to 200 ns to include most prompt coincidences, while filtering out a
vast majority of random events.
To show the effect of the triple coincidence technique, let us look at one example.
A partial ground state band cascade in102Zr is shown in Figure 13. All of these transitions
should be in prompt coincidence, as a nucleus created in a10+ state will cascade through
each of these levels in a very short period of time, emittingγ transitions down to the ground.
Figure 14(a) is the full projection of the cube onto one axis. There are many strong peaks,
18

0 0.02 151.8
4 478.3
6 964.9
8 1595.4
10 2351.9
326.5
486.6
630.5
756.5
151.8
Figure 13: Partial ground state band of102Zr. Energies are in keV.
as well as a high level of background. Stronger peaks can be evaluated, but the weaker
peaks are obscured. Figure 14(b) is with a singleγ-ray gate of 151.8 keV in102Zr. The
counts become lower, with a few peaks more clear and less background. When we apply a
double gate using 151.8- and 326.5- keV gates, as shown in Figure 14(c), the background
has been reduced to very low level. The peaks belonging to102Zr (486.6, 630.5, 756.5
keV) are clearly identified. The transitions from Ce partner isotopes are also clearly present
(146,147,148Ce). With this technique, we are able to resolve weak peaks from the background.
Level Scheme Construction
Using the triple coincidence technique, we are able to identify transitions which be-
long to the nucleus of interest. Once the transitions are ordered with respect to one another,
we can identify important band structures and understand the behavior of the nucleus in
terms of nuclear models.
If we have previous knownγ-rays in a nucleus, such as fromβ− decay, we can set
gates on these transitions and look for a self-consistent set of new transitions that appear
in coincidence with these and each other. The other way to identify new isotopes or new
transitions is to rely on their fission partner. The corresponding fission partner is created
in coincidence with the fragment of interest. In a spectrum gated on transitions in one
19

100 300 500 700E
100
300
500
700
Cou
nts
per
Cha
nnel
(x
105 )
100 300 500 700
50
150
250
350
Cou
nts
per
Cha
nnel
(x
104 )
100 300 500 700
10
30
50
70
90
110
Cou
nts
per
chan
nel (
x 10
^3)
a) Projection
117.
6(14
7 Ce)
158.
5(14
8 Ce)
251.
2(14
7 Ce)
258.
3(14
6 Ce)
283.
4(14
7 Ce)
294.
9(14
8 Ce)
486.
5(10
2 Zr)
409.
6(14
6 Ce)
503.
2(14
6 Ce)
450.
8(14
8 Ce)
630.
5(10
2 Zr)
565.
2(14
6 Ce)
b) Single gate on 151.8 keV transition in 102Zr
c) Double gate on 151.8- and 326.5 keV transition in 102Zr
Figure 14: Triple coincidence gating series in102Zr
20

nucleus, the transitions from the partner nuclei will be visible as well. As shown in Figure
14(c), when we gate on 151.8 and 326.5 keV transitions, we can see various Cerium partner
transitions. By cross-checking the coincidence relationships, we can check the assignment
of transitions to a particular isotope.
The relative intensities ofγ-rays provide us important information about their loca-
tions in the level scheme. As an example, in the above-mentioned102Zr gates, transitions
out of higher spin states in the ground-band of146Ce appear less intense than the ones near
the ground state. This is due to the fact that a nucleus populated with high spin will tran-
sition through all the low spin states on the way to ground. So every nucleus created will
go through the bottom transitions, but only the ones statistically created with high spin will
emit transitions from higher levels.
AssigningJπ to nuclear levels is often a difficult process. Ground state spins and
parities are deduced by using shell structures and regional systematics. From direct mea-
surements of electron conversion coefficients, the multipole nature of nuclear transitions
can be determined. The multipolarity of an electromagnetic transition reflect the spin and
parity of the nuclear levels involved in the transition. The intrinsic spin of the photon is one,
and thus the angular momentum change for aγ-ray transition must be integral. Between
an initial state with a spinJi and a final state with a spinJf , the transition must carry an
angular momentumL whereL obeys theselection rule:
|Ji − Jf | ≤ L ≤ |Ji + Jf |. (4)
This angular momentum transfer defines the multipole order of the transition, which are
called dipole, quadrupole, octupole, ... moments.
If we also examine the parity of the nuclear levels, we can determine the multipole
type. For a parity change of(−1)L, the nuclear couples to the electric field of the photon,
and it is an electric transition. For a parity change of−(−1)L, the nucleus couples to the
magnetic field of the photon, and it is a magnetic transition. For a given pair of nuclear
levels, the lowest order multipole almost always dominates, making the contribution of
21

higher orders very small. For example, consider a transition between a state with aJπ of
4+ and a state with aJπ of 2+, the allowed range ofL for the photon is between 2 and
6. Since there is no parity change, the possible multipole transitions are E2, M3, E4, M5,
and E6. However, since the transitions probabilities of higher order transitions will be so
small, in practice, this will usually be an E2 transition with a possible minor contribution
from an M3. There is one common exception to this rule. In the case of∆I = 1 to 3, eg.
2+ → 2+, where M1, E2, M3, E4 are allowed. Collective effect can enhance the E2 over
the M1 multipole. There are also a few cases that E3 can compete with E1 multipolarities
because of collective effect.
Experimental Details
1995 Binary Fission
In 1995, a binary fission experiment was performed at Lawrence Berkeley National
Laboratory. A 28µ Ci source was sandwiched between two foils of Ni with thickness
11.3 mg/cm2 on either side. In addition, a 13.7 mg/cm2 Al foil was added on both sides.
Gammasphere consisted of 72 Ge detectors. There were 9.8×10⁹ triple or higher fold
events recorded.
2000 Binary Fission
In 2000, a binary fission experiment was performed at Lawrence Berkeley National
Laboratory. A 62µCi source, sandwiched between two Fe foils with thickness 10 mg/cm2
and encased in a 7.62 cm polyethylene ball, was used. This experiment resulted in5.7×1011
triple-fold γ − γ − γ events. This is the largest data set recorded, and was used for most
triple-coincidence studies. Aγ − γ − γ coincident cube was constructed with minimal
compression to maximize the energy resolution in our analysis spectra. 101 detectors were
functional in this experiment. Raw experimental data were copied onto a RAID disk array
22

Figure 15: E-∆E detector array used in Jan. 2005 ANL experiment
for angular correlation andg-factor measurements.
2005 Binary and Ternary Fission
In 2005, another fission experiment was performed at ANL. This experiment was
focused on detecting the primary fission fragments directly. Correspondingly, the source
was left barely covered. The252Cf had a strength of 35µCi deposited on a 1.5µm Ti foil
and covered with another thin 1.5µm layer of Ti. Two double-sided silicon strip detectors
(DSSDs) were placed on either side of the source. The DSSD was 1.85 mm thick, with an
area of 60× 60 mm2 split into 32 strips on each side. In addition, 6∆E-E telescopes were
arranged in a ring perpendicular to the source-DSSD axis. The∆E detectors were about 10
µm thick. The E detectors had a thickness of 1 mm with an area of 20× 20 mm2 split into 4
square sectors for increased granularity. A picture of the detector array is shown in Figure
15. The two DSSDs can be seen flanking the ring array of∆E-E detectors. The source
was placed in the center of the array, so fission fragments travel towards the DSSDs and
the LCPs are ejected orthogonally, towards the∆E-E detectors. The data were recorded
with fragment-fragment-γ-γ coincidence for binary fission and fragment-fragment-LCP-γ
coincidence for ternary fission.
23

CHAPTER III
STUDY OF STRUCTURE OF NEUTRON-RICH NUCLEI
With sophisticated experimental equipments and analytical techniques developed,
we are able to study neutron-rich nuclei produced from the spontaneous fission of252Cf
with greater details. The data used to study the structure of several neutron-rich nuclei
were collected in the 2000252Cf binary fission experiment. The data were sorted into a
less compressed cube for analysis. All four- and higher-fold events were unfolded down to
triple fold events. The Radware software package [Rad95] was used to analyzed the data.
Neutron-rich nuclei in the A∼100 region, where the valence nucleons begin to fill
theg9/2 proton andh11/2 neutron orbitals, exhibit several interesting features. For the Sr
(Z = 38) and Zr (Z = 40) nuclei, a sudden shape transition from spherical to strongly
deformed ground states (β2 ∼ 0.40) at N = 60 has been reported [Urb01] [Lhe01]. The
emergingγ degree of freedom in the Mo-Ru region and the predicted prolate-to-oblate
shape transition in the Pd isotopes have been identified [Che70] [Hot91] [Ham95] [Luo05].
The structures of nuclei in this region are suitable for various theoretical models [Mol95].
We have studied88−94Kr, 102Zr, and114Ru in this region. A number of new transitions,
states, and band structures have been identified. Spin/parity configurations were assigned
by following regional systematics and angular correlation measurements.
Studies of neutron-rich nuclei near theN = 82 closed shell with a few protons
beyond theZ = 50 closed shell are of interest to test nuclear shell model calculations that
utilize effective interactions. Two neutron-rich Cs isotopes,137Cs and138Cs, have been
investigated in this work. Being adjacent to the doubly magic nucleus132Sn, the structure
of these nuclei could provide additional understandings of the proton-neutron and proton-
proton interactions and of the similarities of the structures of nuclei around132Sn and208Pb
[Fir96].
24

88−94Kr
The even-even88−94Kr nuclei lie close to theN = 50 closed shell. Studies of high
spin states in these neutron-rich nuclei can provide new insights into both collective and
quasi-particle excitations in this mass region. Prior to this work, they have been investigated
throughβ-decay [Fir96], spontaneous fission of248Cm [RU00] (shown in Figure 16), and
spontaneous fission of252Cf [Zha01]. But there are some disagreements between the248Cm
work [RU00] and the252Cf work [Zha01]. It’s interesting to investigate these isotopes, by
analyzing our high statistics data from 2000 experiment. The fission partner of Kr isotopes
are Sm isotopes. By cross-checking coincident relationships and relative intensities, we
have identified new transitions in88−94Kr isotopes and expanded their level schemes.
25

0 0+
769.0 2+
769.0
1803.0 4+
1034.0
1446.3 (2+)
677.3
3627.0
455.3
1135.9
591.8
2835.1
1032.1
3594.5
759.43171.7
1368.71106.0
3178.0
1112.3
448.9
2065.7 4
1296.7
2491.1
688.1507.0
1985.0181.1
3035.2
1232.2
3845.2
810.01192.7
2652.5
849.5
4175.0
548.0329.8
4979.5
804.5
Kr9236 56
00+
665.52+
665.5
1518.74+
853.2
2520
1001.3
Kr9436 58
0 0+
707.1 2+
707.1
1362.6 2+
655.6
1362.6
1764.2 4+
401.6
1056.9
2599.7
832.5
3222.7
1458.41392.6
4035.3
812.6
1830.1 4
1123.0
3084.3
1254.2 1320.2
2852.6
1022.5
3896.0
1043.4
5052.3
1156.3
1506.4 3–
799.3
3408.1
662.4 646.2
2745.7
771.4
4003.8
1258.1
1974.3
467.9
2677.9
729.5
1171.5
2761.9
1255.5
4324.7
916.6
Kr9036 54
0 0+
775.3 2+
775.3
1643.9 4+
868.6
2397.4
753.5
3921.1
1523.7 1517.0
2404.1
760.22103.9
460.0
Kr8836 52
Figure 16: Level Schemes of88−94Kr reported in [RU00].
26

88Kr
The level scheme of88Kr built in this work is shown in Figure 17. Transitions
identified in from previous work [RU00] has been confirmed. The level scheme has been
extended up to a 7169.4-keV state, with ten new transitions and eight new states identified.
The sequence of 1517.2- and 760.4-, 1523.7- and 753.9-keV transitions have been firmly
rearranged, by measuring relative intensities. A spectrum double-gating on the 775.5- and
868.6-keV transitions is shown in Figure 18. Transitions identified in high and low energy
regions, including some partner transitions, are clearly identified.
For the spin and parity assignments, we compared88Kr with its neighboringN =
52 isotones,86Se and90Sr. The level scheme of86Se was reported from spontaneous fission
of 252Cf work [Jon06]. The structure of90Sr was studied through82Se(11B, p2n) reaction
and shell-model calculations [Ste01]. We have noticed an extraordinary similarity in level
structure between theseN = 52 isotones, as shown in Figure 19. Note here the level
scheme of86Se has been expanded and the 2073-keV level is assigned as3−, compared
with recent work in [Jon06]. We assigned spins and parities by following the systematics,
with level schemes of neighboring nuclei shown in Figure 19. The 775.5- and 1644.1-keV
states are vibrational2+ and4+ states of a near-spherical nucleus. And3−, 4−, 5−, and6−
were assigned to the 2104.2-, 2856.5-, 3296.7-, and 3906.2-keV states. Spins and parities
of 5− and7− were assigned to the 3161.3- and 3921.7-keV states. Spins and parities of6+,
8+, 10+, and12+ were assigned to the 3167.8-, 5194.0-, 6232.9-, and 7169.4-keV states.
90Kr
The level scheme of90Kr identified in this work is shown in Figure 20. Most tran-
sitions and levels in [RU00] are confirmed. The 1075.8-, 319.9-, 1245.3-, 811.7-, 1200.0-,
673.0-, and 1099.0-keV transitions are newly identified.
We can see a somewhat similar pattern of level schemes for90Kr and88Kr, as well
as for90Kr and 92Sr [Ste02]. From the similarities, the 707.6- and 1506.7-keV states are
27

00.0
2775.5
(4 )1644.1
(3 ) 2104.2
(4 ) 2856.5
(5 )3161.3
(7 )3921.7
(8 )4960.6
(6 ) 3167.8
3553.6
3275.4(5 ) 3296.7
(6 ) 3906.2
(10 )6232.9
(12 )7169.4
775.5
460.1
752.31517.2
868.6
1038.9
760.4
1523.7 1631.31909.5
753.9
440.2
609.5
1328.7
1272.3
1192.5
936.5
(1792.8)
88Kr
(1)
(2)
Figure 17: Level Scheme of88Kr. Energies are in keV.
28

200 400 600 800 1000E
2
6
10
14
Cou
nts
per
Cha
nnel
(x
100)
1100 1300 1500 1700 1900
5
15
25
35
Cou
nts
per
Cha
nnel
(x
10)
333.
8(16
0 Sm
)
162.
0(16
0 Sm
)16
7.5(
158 S
m)
250.
0(16
0 Sm
)25
8.1(
158 S
m)
460.
1(88
Kr)
752.
3+75
3.9(
88K
r)76
0.4(
88K
r)
344.
1158 S
m)
1517
.2(88
Kr)
1523
.7(88
Kr)
1272
.3(88
Kr)
1631
.3(88
Kr)
1909
.5(88
Kr)
(a) Low Energy Region
(b)High Energy Region
440.
2(88
Kr)
609.
5(88
Kr)
1038
.9(88
Kr)
936.
5(88
Kr)
Double gating on 775.5- and 868.6-keV transitions in 88Kr
Figure 18: A spectrum double-gating on 775.5- and 868.6-keV transitions in88Kr. Low
energy and high energy transitions are shown in (a) and (b).
29

00
2776
41644
(5 )3161
(7 )3922
(8 )4961
(6 ) 3168
00
2832
41656
(5 )3144
(7 )3698
(8 )5055
(6 ) 3495
(3 ) 2207
(4 ) 2928
(3 ) 2104
(4 ) 2856
(5 ) 3297
(6 ) 3906
(10 )6233
(12 )7169
(10 )5923
(12 )6794
(5 )
(6 )
00
2704
(4 )1568
(3 ) 2073
(5 )3063(6 ) 3033
(7 )3768
832
824
1488
554
1357
1375
721 1839
1560
776
869
460
75215171524
760754
1039
610
440
1272
936
868
871
274
540
704
864
1495
706
1465
505
989937
1329
(1793)
88Kr 90Sr86Se
Figure 19: A comparison of level structures ofN = 52 isotopes,86Se [Jon06],88Kr, and
90Sr [Ste01]. Three new levels and four new transitions have been identified in86Se in this
work and now3− is assigned to the 2073-keV level.
30

0
2 707.6
(3 ) 1506.7
1975.0
2746.5
4005.5
(4 ) 1830.9
(6 ) 2853.6
(8 ) 3897.0
(10 ) 5053.6
(12 ) 6298.9
5081.3
2762.3
3408.6
2678.8
(8 ) 4325.4
(6 )3085.3
(8 )4285.3
21362.4
(4 )1763.8
(6 )2596.6
(8 )3695.6
(6 )3224.1
(8 )4037.5
707.6
799.1
468.3
1123.3
1022.7
1043.4
1156.6
1245.3
1259.0
771.5
1075.8
1255.6
1254.4
811.7
1200.0
1321.5
1056.2
654.8
401.4
1362.4
832.8
1099.0
813.4
1393.2
916.8
729.8
1172.1
646.3
1460.3
673
662.1
319.9
(1)
(2)
(3)
(4)
90Kr
(5)
Figure 20: Level Scheme of90Kr. Energies are in keV.
31

)θcos(-1 -0.5 0 0.5 1
Rel
ativ
e u
nit
s
11
12
13
14
15
16
17
18
E: 707.6 - 799.1 0.03585±A2 = -0.2137 0.05433±A4 = 0.0095
Figure 21: Angular correlation measurement of 707.6-799.1 keV cascade in90Kr.
likely to be 2+ and4+ vibrational states, as given in [Zha01]. However, in [RU00], the
1506.7-keV state was assigned spin of3−, by angular correlation measurements. In this
work, we carried out angular correlation measurements of the 707.6-799.1 keV cascade,
using a technique developed recently [Dan07], which will be discussed in the next chapter.
The measurement of angular correlation between the 707.6- and 799.1- keV transitions is
shown in Figure 21, withAexp2 = −0.21(4), Aexp
4 = 0.01(5). These values are consis-
tent with the values in [RU00], and agree with theoretical prediction for a3−(D)2+(Q)0+
cascade [Tay71]. For a4+ − 2+ − 0+ cascade, theAthe2 is 0.102. The result supports the
assignment of3− to the 1506.7 keV state. Therefore, we have confirmed that the 799.1-keV
transition is a dipole transition with primarily an E1 character. So forN = 54 isotones, the
level systematics are broken, when we compare the3− state energy in90Kr with its neigh-
boring isotones. Band (4) and (5) are assigned with positive parities tentatively, which is in
agreement with [RU00] and [Zha01]. However, band (5) built on the 1362.4-keV level is
significantly different from band (2) in [Zha01] built on the same level.
32

0 0.0
2 768.6
(4 ) 1803.9
(6 ) 3036.4
(10 ) 4176.4
(12 ) 4980.5
(4 ) 1985.2
(6 ) 2492.3
(8 ) 3626.7
(4 ) 2066.0
(6 ) 3172.1 (6 ) 3178.4
2835.2
3594.5
(6 )2653.22684.02698.9
3073.6
4185.4
4394.9
4123.2
(8 ) 3846.0
768.6
1035.3
1232.5
804.1
507.1
181.3
688.41368.2
1297.4
1374.5
549.7
454.6 448.3
1134.4
590.3
1031.3
759.3
1288.0
849.3 880.1895.0
1269.7
1149.0
1358.5
330.4
809.6
1192.8
1112.41106.1
92Kr
Figure 22: Level Scheme of92Kr. Energies are in keV.
92Kr
The level scheme of92Kr built in this work is shown in Figure 22. Compared
to work in [Zha01] and [RU00], the 1374.5-, 1288.0-, 880.1-, 895.0-, 1269.7-, 1149.0-,
and 1358.5-keV transitions are identified, with six new excited states added to the level
scheme of92Kr. Spins and parities are assigned tentatively, with agreement of assignments
in [RU00].
94Kr
The level scheme of94Kr reported in [RU00] and [Zha01] has been confirmed, as
shown in Figure 23. Due to its low yield, we did not observe any new transitions and states.
33

0 0.0
2 665.5
4 1519.8
(6 ) 2521.4
1001.6
854.3
665.594Kr
Figure 23: Level Scheme of94Kr. Energies are in keV.
Discussion
In Figure 24, energies of2+ state in ground bands of even-even Kr, Sr, and Zr iso-
topes are shown. In Zr isotopes, we can see a well-known subshell closure atN = 56. But
in Kr and Sr, the2+ state energies are not significantly higher than their neighboring iso-
topes. The first3− excitation state energies in even-even Kr, Sr, and Zr isotopes are given
in Figure 25. We have observed a similar trend in Sr and Zr. But for Kr, an extraordinarily
low energy3− state is observed. This was interpreted as due to theν(d5/2h11/2)3− contri-
bution to the octupole phonon [RU00]. Detailed theoretical analysis is required to explain
the above-mentioned results, and to find out the contributions ofπp3/2, πf5/2, νd5/2, νf7/2
orbitals and corresponding to particle-hole excitations, as discussed in [Ste01], [Ste02] and
[RU00].
34

52 54 56 58 60 620
200
400
600
800
1000
1200
1400
1600
1800
2+
Sta
te E
nerg
y
Neutron Number
Kr (Z=36)
Sr (Z=38)
Zr (Z=40)
Figure 24: Energies of2+ state in ground bands of even-even Kr, Sr, and Zr isotopes.
52 53 54 55 561200
1400
1600
1800
2000
2200
2400
3- s
tate
energ
y
Neutron Number
Kr (Z=36)
Sr (Z=38)
Zr (Z=40)
Figure 25: Energies of first3− state in even-even Kr, Sr, and Zr isotopes.
35

102Zr
Studies of the neutron-rich Zr nuclei have shown that in the even-even Zr nuclei,
the deformation parameters increase gradually fromβ2 ∼ 0.1 atN = 56, throughβ2 ∼ 0.2
at N = 58 to β2 ∼ 0.4 at N = 64 [Urb01]. B(E2) value measurements and lifetime
measurements indicate that in98Sr and100Zr, their different shape coexisting bands are
weakly admixed [Hwa06b] [Hwa06a]. The lifetime measurements also indicates that104Zr
has the most deformed2+ state among medium and heavy even-even nuclei, except for
102Sr [Hwa06a]. For102Zr, the transition from2+ state to0+ state in ground band was first
reported by Cheifetzet al. from spontaneous fission of252Cf [Che70]. Transitions from the
ground-band states were observed up to the8+ level and a large deformation was deduced.
In a β-decay work [Hil91], two more postulated0+2 and2+
2 states were identified. From
spontaneous fission of248Cm by Durellet al. [Dur95], the ground band was extended up
to 12+. A new two-quasi-particle state was identified and the pair strengths in neutron-
rich Zr isotopes were calculated. At the same time, from the 1995 experimental data of
our group [Ham95], Durell’s work was confirmed, with one more band identified. In the
recent238U(α, f ) fusion-fission reaction work [Hua04], the deformed ground band has been
firmly established up to 20+, with more states identified in the two rotational bands built
on two-quasi-particle states. With our high statistical data from our 2000 binary fission
experiment, we are going to identify new transitions, states and band structures.
36

2 151.8
4 478.3
6 964.9
8 1595.4
10 2351.9
12 3212.5
51661.9
72093.2
92663.9
113371.2
(4 ) 1820.8(5 ) 1980.7
(6 ) 2174.9
(7 ) 2403.2
(8 ) 2665.8
(9 ) 2962.2
(6 )1652.7
(8 )2184.5
(10 )2825.8
(8 )1932.3
(10 )2465.8
(12 )3133.8
(14 )3925.3
(16 )4828.1
(7 ) 2926.4
(8 ) 3183.6
(9 ) 3475.8
(10 ) 3802.0
(11 ) 4162.0
(12 )3567.5
134205.2
(4 )1386.3
(6 )1829.3
(8 )2373.3
(10 )3013.3
(2 ) 1036.1
(3 ) 1242.2
1793.3
(4 ) 1538.0
0 0.0
14 4153.9
16 5168.5
326.5
486.6
630.5
756.5
860.6
697.0
1183.6
497.8 431.3
570.7
707.3
531.8
641.3
533.5
668.0
791.5
902.8
360.0
326.2
292.2
257.2549.4
618.4
741.7
834.0
443.0
544.0
908.0
864.4
777.91961.5
640.0
1342.51174.4
1219.6
1230.4
967.4
870.4
686.2
687.8
884.31090.4
763.9
1059.7
282.8
578.6
151.8
1036.1
941.4
296.4
262.6
228.3
194.2159.9
354.1
490.9
422.5
559.0
1014.6
1351.0
1408.4
1234.5
551.1757.2
(1)
(2)
(4)
(6)
(7)
(3)(5)
102Zr
(8)
(3,4)
Figure 26: Level Scheme of102Zr constructed in this work. Energies are in keV. The 27.5-keV transition from the 1820.8- to the
1793.3-keV state is not drawn.
37

Experimental results
The fission partner of Zr are Ce isotopes. Double-gating on the knownγ-ray tran-
sitions in102Zr and the Ce partner isotopes, new transitions and excited states have been
identified. The scheme of102Zr has been considerably extended and expanded, as shown
in Figure 26. Note that there is a 27.5-keV transition from the 1820.8-keV state to the
1793.3-keV state. The relative intensities ofγ-ray transitions in102Zr from this work are
listed in Table 3.
The ground band was confirmed up to the14+ state. We did not observe the 1098.1-
and 1184.6-keV transitions in the ground band, the 331.5- and 628.4-keV transitions in
band (2), nor the 955.5 keV transitions in band (3), which were reported in [Hua04]. They
had advantage of correction for Doppler smearing of these transitions, particularly at high
spins, since they measured and corrected for Doppler shift of the fragments in flight. This
enabled them to observe high spin transitions with much lower intensities. In Figure 27,
two spectra are shown, one with double gating on the 151.8- and 326.5-keV transitions, and
the other with double gating on the 326.5- and 486.6-keV transitions. The crossing feeding
transitions from side bands to ground bands are shown. The 908.0-, 1174.4-, 1183.6-keV
transitions are clearly seen in the 151.8- and 326.5-keV gate. The crossing 864.4-, 697.0-,
967.4-, and 1219.6-keV transitions are clearly seen in the 326.5- and 486.6-keV gate.
The two-quasi-particle band, labeled as (2), was reported in [Dur95] [Ham95]
[Hua04]. We confirmed this band, as well as band (3) and band (4). We also confirmed the
states listed in band (8), which were reported in [Dur95].
A new rotational band, labeled as (5), has been identified for the first time. By gat-
ing on the 326.5- and 486.5-keV transitions in102Zr, we identified a 1961.5 keV transition
which belongs to102Zr, as shown in figure 27(b). Figure 28(a) shows a spectrum double
gating on the 486.5- and 1961.5-keV transitions. In this spectrum, we can see the 257.2-,
292.2-, 326.2-, and 360.0- keV transitions of high lying band (5). In Figure 28(b), a spec-
trum gating on 1961.5 and 257.2 keV transitions is shown. The transitions in this band and
38

Table 3: Relative intensities (Iγ) of γ-ray transitions (keV) in102Zr. Intensity errors range
between 5% for the strong transitions and 30% for the weak transitions.
Eγ(keV) Iγ(%) Ei(keV) Eγ(keV) Iγ(%) Ei(keV) Eγ(keV) Iγ(%) Ei(keV)
151.8 100 151.8 159.9 7.7 1980.7 194.2 4.2 2174.9
228.3 3.3 2403.2 257.2 0.9 3183.6 262.6 1.8 2665.8
282.8 8.0 1820.8 292.2 0.9 3475.8 296.4 0.9 2962.2
326.2 0.4 3802.2 326.5 69 478.3 354.1 1.6 2174.9
360.4 0.2 4162.0 422.5 1.5 2403.2 431.3 3.3 2093.2
443.0 3.2 1829.3 486.6 44 964.9 490.9 1.3 2665.8
497.8 2.8 2093.2 531.8 3.1 2184.5 533.5 2.2 2465.8
544.0 2.1 2373.3 549.4 0.6 3475.8 551.1 0.2 1793.3
559.0 1.0 2692.2 570.7 2.1 2663.9 578.6 10.5 1820.8
618.4 0.1 3802.2 630.5 17 1595.4 640.0 1.0 3013.3
641.3 2.0 2825.8 668.0 1.8 3133.8 686.2 0.1 4162.0
687.8 0.9 1652.7 697.0 4.2 1661.9 707.3 1.5 3371.2
741.7 0.9 3567.5 756.5 5.2 2351.9 757.2 3.7 1793.3
763.9 2.2 1242.2 777.9 1.0 2373.3 791.5 1.0 3925.3
834.0 0.8 4205.2 860.6 0.9 3212.5 864.4 2.7 1829.3
870.4 0.9 2465.8 884.3 3.6 1036.1 902.8 0.8 4828.1
908.0 3.7 1386.3 941.4 0.5 4153.9 967.4 3.3 1932.3
1014.6 0.3 5168.5 1036.1 2.8 1036.1 1059.7 2.0 1538.0
1090.4 15 1242.2 1174.4 2.7 1652.7 1183.6 0.7 1661.9
1219.6 1.7 2184.5 1230.4 0.6 2825.8 1234.5 1.6 1386.3
1342.5 0.6 1820.8 1351.0 1.4 1829.3 1408.4 1.1 2373.3
1961.5 1.3 2926.4
39

700 800 900 1000 1100 1200 1300E (keV)
1000
3000
5000
7000
Cou
nts
per
Cha
nnel
700 800 900 1000 1100 1200 1300
500
1500
2500
3500
4500
5500
1945 1955 196550
150250350450550
763.
9 908.
0
1174
.411
83.610
59.7
697.
0
756.
5
864.
4
967.
4
1219
.6
1961.5
870.
4
a) Double gate: 151.8/326.5 keV
b)Double gate: 326.5/486.6 keV
Figure 27: Coincidence spectra with double gates set on (a) 151.8- and 326.5-keV transi-
tions and (b) 326.5- and 486.6-keV transitions in102Zr.
150 250 350 450E (keV)
100
300
500
700
900
Cou
nts
per
Cha
nnel
150 250 350 450
100
300
500
700
900
118.
3(14
7 Ce)
152.
115
8.5(
148 C
e)
251.
5(14
7 Ce)
258.
3(14
6 Ce)
+25
7.2
283.
5(14
7 Ce)
292.
229
5.1(
148 C
e)
326.
5+32
6.2
409.
8(14
6 Ce)
503.
0(14
6 Ce)
118.
3(14
7 Ce)
152.
115
8.5(
148 C
e)
251.
4(14
7 Ce)
258.
4(14
6 Ce)
283.
5(14
7 Ce)
292.
2 326.
5+32
6.2
409.
8(14
6 Ce)
486.
6
360.
036
0.0
503.
0(14
6 Ce)
a)Double gate: 486.6/1961.5 keV
b)Double gate: 1961.5/257.2 keV
Figure 28: Coincidence spectra with double gates set on (a) 486.6- and 1961.5-keV and (b)
1961.5- and 257.2-keV transitions in102Zr.
40

0.1 0.2 0.3 0.4 0.5
20
25
30
35
�ω(MeV)
J(1
) � �2 M
eV
-1�
4
3
7
6
gs
Figure 29: Plot ofJ (1) vs rotational frequencies for rotational bands in102Zr.
transitions from Ce partner isotopes are clearly identified. More detailed examination lead
to the identification of the 549.4-, 618.4- and 686.2-keV transitions in this band.
Two other rotational bands, labeled as (6) and (7), are observed for the first time
as well. The transitions are put in these bands according to their energy relationships and
relative intensities. Several previously discovered states [Dur95], arranged into band (8),
have been confirmed as well.
Discussion
The properties of the ground-state band was discussed in [Hua04] in very details.
Here we present a plot of first kinetic moment of inertia as a function of rotational frequen-
cies of the rotational bands in102Zr, as shown in Figure 29. The upbending behavior is in
agreement with [Hua04], which emerges at about 0.40 MeV. This was explained by align-
ment of twoh11/2 neutrons. Band (2) was proposed as built on two-quasi-particle states
41

)θcos(-1 -0.5 0 0.5 1
Rel
ativ
e u
nit
s
11
12
13
14
15
E: 697.0 - 486.6
0.02656±A2 = -0.1185
0.03957±A4 = -0.0070
Figure 30: Angular correlation of the 697.0-486.6 keV cascade in102Zr.
with a configuration ofν5/2−[532] ⊗ ν3/2+[411] in [Dur95] and confirmed in [Hua04].
Band (3) was assigned with5− to the band-head, 1661.9-keV state in [Dur95] and
[Hua04]. This spin/parity assignment is supported by angular correlation measurements
from this work. We measured the angular correlation between the 697.0- and 486.6-keV
transitions, as shown in Figure 30. The measured angular correlation coefficients are
Aexp2 = −0.12(3) andAexp
4 = −0.00(3). This agrees nicely with a spin configuration
of 5(D)6(Q)4, withAthe2 = −0.11 andAthe
4 = 0.0 at mixing ratio of 0.0. This indicates
that the 697.0-keV transition is a pure dipole transition. Therefore, we assign5− to the
1661.9-keV state. A similar band is also observed in the neighboring104Mo nucleus. This
assignment agrees with previous work.
For band (4), the angular correlation of the 967.4- and 486.6-keV cascade was mea-
sured, as shown in Figure 31. The measured coefficients,Aexp2 = 0.12(4) andAexp
4 =
0.03(6), suggests that this is a quadrupole-quadrupole cascade. However, in [Hua04], the
band head was assigned as6−. If the 1932.3 state has a spin of6−, we should be able
42

)θcos(-1 -0.5 0 0.5 1
Rel
ativ
e u
nit
s
6
7
8
9
10
11 E: 967.0 - 486.6 0.03880±A2 = 0.1252 0.05901±A4 = 0.0341
Figure 31: Angular correlation of the 967.4-486.6 keV cascade in102Zr.
to observe an E1 character for the 967.4 keV transition. From the experimental angular
coefficients measured in this work, we propose a spin assignment of8+ to the band head
state.
For band (6), we measured the angular correlation of the 908.0-326.5 keV cas-
cade, as shown in Figure 32. The measured angular correlation coefficients are:Aexp2 =
−0.073(26) andAexp4 = 0.15(4). These values agree with a spin configuration of 4(1,2)4(2)
at δ = −7.0. Therefore, we assigned4+ to the 1386.3-keV state.
Angular correlations of other strong cascades were measured as well. The results
is shown in Figure 33, withAexp2 = −0.075(16) andAexp
4 = 0.035(24). Note that the
151.8 keV state has a lifetime of 2.76 ns. What we measured is an attenuated corre-
lation. More discussion will be given in the following chapter. The 326.5-151.8 keV
cascade was measured with an attenuation factor of 0.54. So for the 1090.4-151.8 keV
cascade, an attenuation correction is required for the measured angular correlation coef-
ficients. The corrected experimental angular correlation coefficients are calculated to be
43

)θcos(-1 -0.5 0 0.5 1
Rel
ativ
e u
nit
s
14
15
16
17
18
19 E: 908.0 - 326.5 0.02697±A2 = -0.0728 0.04034±A4 = 0.1494
Figure 32: Angular correlation of the 908.0-326.5 keV cascade in102Zr.
Aexp2 (corrected) = −0.139(30) andAexp
4 (corrected) = −0.065(44). These values agrees
with a spin configuration of 3-2-0 at mixing ratioδ ≈ 10.0. We assigned3+ to the 1242.2-
keV state. The measured angular correlation of the 1090.4-578.6 keV cascade is shown
in Figure 34. The experimental angular correlation coefficients,Aexp2 = −0.016(11) and
Aexp4 = −0.034(16), agrees with spin configuration of 4(1,2)3(2)2.
Band (5) is identified for the first time, with one crossing transition to the ground
state band. It has similar energy spacing with band (2). A similar band was also identified
in the neighboring100Zr [Hwa06b]. Therefore, we assume that this band is also a two-
quasi-particle rotational band, by exciting two neutrons. Only one 1961.5 keV crossing
transition is observed. We propose it as an E1 transition and the band head state is assigned
7−. Band (6) and (7) are assigned with positive parities tentatively, because similar bands
have been identified in neighboring even-even Mo nuclei.
44

)θcos(-1 -0.5 0 0.5 1
Rel
ativ
e u
nit
s
25
26
27
28
29
30
31
E: 1090.4 - 151.8
0.01607±A2 = -0.0752
0.02424±A4 = -0.0350
Figure 33: Angular correlation of the 1090.4-151.8 keV cascade in102Zr.
)θcos(-1 -0.5 0 0.5 1
Rel
ativ
e u
nit
s
60
62
64
66
68
E: 1090.4 - 578.6
0.01107±A2 = -0.0159
0.01673±A4 = -0.0341
Figure 34: Angular correlation of the 1090.4-578.6 keV cascade in102Zr.
45

114Ru
Neutron-rich114Ru lies between well-deformed double-magic Sr and Zr nuclei
(Z = 38, 40; N = 60, 62) [Ham89] and spherical double-magic132Sn. Systematic study
of the level structures of the nuclei in this region can provide important insight into the nu-
clear structure characteristics, such as the systematic behavior of nuclear deformation, the
deformation driving effects, and the location and characteristics of the h11/2 unique-parity
intruder configuration. Prior to this work, collective band structures of even-A108,110,112Ru
have been reported [Sha94] [Ham95] [Jia03] [Che04] [Che06] [Zhu08] [Luo08]. The level
scheme of114Ru was first reported by Shannonet al. [Sha94], from spontaneous fission
of 248Cm. By carrying out variation-after-projection calculations, R. Devi and S. K. Khosa
gave a good description of114Ru up to the10+ energy state in the ground band [Dev96].
Here, we report on the observation of new high spin states in114Ru. The ground-state
and the one phononγ-vibration band have been significantly extended. A two-phonon
γ-vibration band is now proposed in114Ru. Cranked shell model calculation has been
performed to describe the properties of these excited states.
Experimental Results
The fission partner of Ru isotopes are Xe. By carefully examining the coincidence
relationships and the transition relative intensities, a new level scheme of114Ru has been
constructed, as shown in Figure 35. All transitions reported in [Sha94] were confirmed
except the 563.3 keV,(2+) → 0+ transition, placed in parenthesis because it is not seen
in the 530.5-631.4 keV gate. The yrast band, labeled (1), is observed with spin up to 14~,
which confirms the previous result reported up to 10~ in [Sha94]. The band (2) based on
the 563.3-keV state was reported as aγ-vibrational band in [Sha94]. Five new transitions
were identified in band (2), which defined 5 new levels, assigned (4+), (6+), (7+), (8+),
(9+), respectively. Figure 36 shows some spectra double-gated on (a) the 443.2- and 709.3-
keV transitions, (b) the 265.2-and 298.1-keV transitions, and (c) the 265.2- and 530.5-keV
46
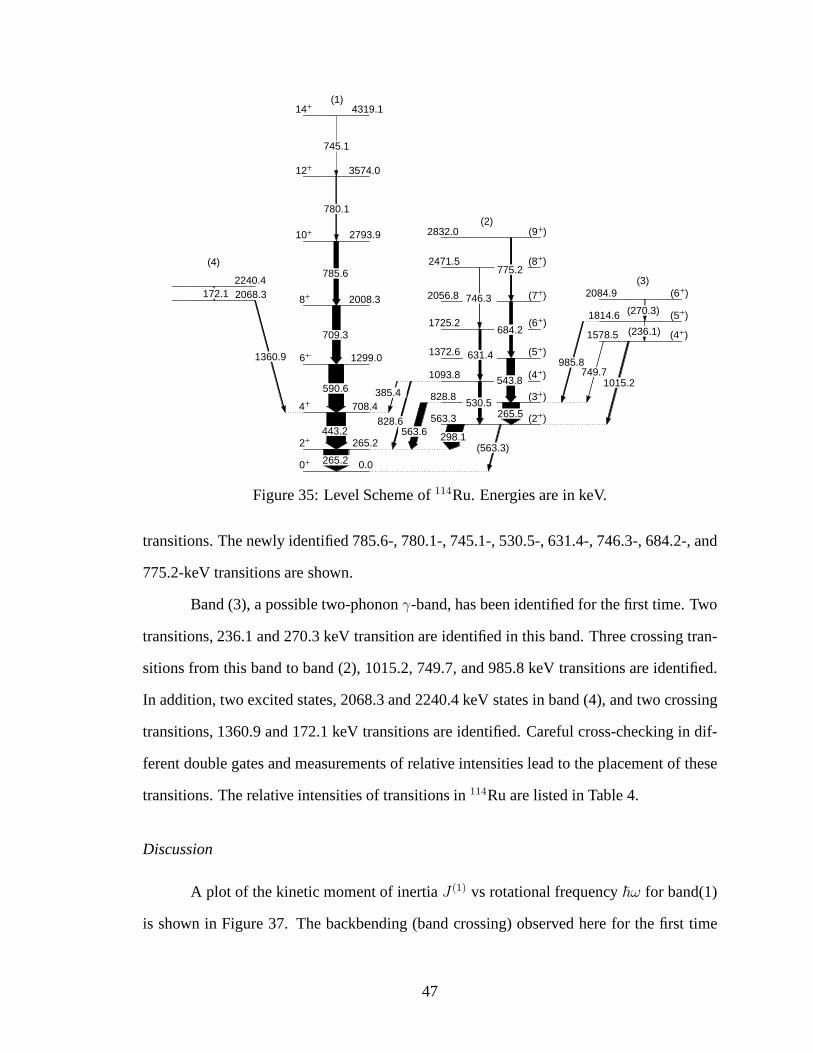
0 0.0
2 265.2
4 708.4
6 1299.0
8 2008.3
10 2793.9
12 3574.0
(2 )563.3
(3 )828.8
(4 )1093.8
(5 )1372.6
(6 )1725.2
(7 )2056.8
(8 )2471.5
(9 )2832.0
(4 )1578.5
(5 )1814.6
(6 )2084.92068.32240.4
14 4319.1
265.2
443.2
590.6
709.3
785.6
780.1
172.1
1360.9
298.1563.6828.6
265.5530.5
543.8
631.4
684.2
746.3
775.2
(236.1)
(270.3)
1015.2749.7
985.8
(563.3)
745.1
385.4
(1)
(2)
(3)
(4)
Figure 35: Level Scheme of114Ru. Energies are in keV.
transitions. The newly identified 785.6-, 780.1-, 745.1-, 530.5-, 631.4-, 746.3-, 684.2-, and
775.2-keV transitions are shown.
Band (3), a possible two-phononγ-band, has been identified for the first time. Two
transitions, 236.1 and 270.3 keV transition are identified in this band. Three crossing tran-
sitions from this band to band (2), 1015.2, 749.7, and 985.8 keV transitions are identified.
In addition, two excited states, 2068.3 and 2240.4 keV states in band (4), and two crossing
transitions, 1360.9 and 172.1 keV transitions are identified. Careful cross-checking in dif-
ferent double gates and measurements of relative intensities lead to the placement of these
transitions. The relative intensities of transitions in114Ru are listed in Table 4.
Discussion
A plot of the kinetic moment of inertiaJ (1) vs rotational frequency~ω for band(1)
is shown in Figure 37. The backbending (band crossing) observed here for the first time
47

560 600 640 680 720 760 800E (keV)
100
300
500
700
900
1100
1300
735 745 755 765 775 785 79550
150250350450
550 650 750
100
300
500
700
900
1100
1300
Cou
nts
Per
Cha
nnel
300 400 500 600 700 800 900
100
300
500
700
900
110059
0.7
* **
745.
1
780.
1 785.
6
530.
5
543.
8
631.
4
775.
2
684.
2
298.
1
631.
4
746.
3
(a) 443.2-709.3 double gate
(b)265.2-298.1 double gate
(c) 265.2-530.5 double gate
Figure 36: Spectrum double gated on (a) 443.2- and 709.3-keV transitions, (b) 265.2- and
298.1-keV transitions, and (c) 265.2- and 530.5-keV transitions in114Ru.
48

Table 4: Relative intensities ofγ-rays in114Ru. The doublet 265.2- and 265.5-keV transi-
tions are estimated with error of 20%.
Eγ (keV) Iγ (%) Band Ei (keV)
172.1 4.6 4 2240.4
236.1 3.2 3 1575.8
265.2 (150) 1 265.2
265.5 (25) 2 828.8
270.3 2.0 3 1814.6
298.1 36.9 2-1 563.3
385.4 2.5 2-1 1093.8
443.2 100 1 708.4
530.5 11.2 2 1093.8
543.8 43.3 2 1372.6
563.6 32.6 2-1 828.8
590.7 68 1 1299.0
631.4 8.4 2 1725.2
684.2 15.9 2 2056.8
709.3 39 1 2008.3
745.1 2.5 1 4319.1
746.3 2.2 2 2471.5
749.7 2.8 3-2 1814.6
775.2 13.0 2 2832.0
780.1 6.8 1 3574.0
785.6 17.5 1 2793.9
828.6 3.1 2-1 1093.8
985.8 8.2 3-2 2084.9
1015.2 6.7 3-2 1578.5
1360.9 6.9 4 2068.3
49

occurs at a rotational frequency~ω ≈ 0.4MeV. This follows the behavior of108Ru and
110Ru, but differs from112Ru, which has only a smooth upbending. We performed CSM
(Cranked Shell Model) calculation to interpret band structures in114Ru. The calculated
results are presented in Figure 38, where the minima in the total Routhian surfaces (TRS)
are found, corresponding toβ2=0.23,γ = -59.4◦, β4 = -0.049 at~ω = 0.0 MeV,β2 = 0.24,
γ = -49.1◦, β4 = -0.041 at~ω = 0.3 MeV, andβ2 = 0.23,γ = -52.9◦, β4 = -0.035 at~ω = 0.5
MeV. Theβ2 is nearly constant across the band crossing whileγ andβ4 are different. The
average values ofβ2 andγ are close to 0.23 and -55.0◦. This indicates that the114Ru has
oblate deformation in the ground state, and possesses triaxial deformation with increasing
rotational frequency. The quasi-particle energies (Routhians) were calculated for114Ru by
using CSM and taking the above calculatedβ2 andγ parameters. The Routhians for114Ru
are shown in Figure 39(a) for protons and Figure 39(b) for neutrons, respectively. The
calculations predict a band crossing caused by the alignment of twog9/2 protons at~ω ≈
0.40MeV, which is in excellent agreement with the experimental data. The band crossing
related to the alignment of twoh11/2 neutrons emerges at~ω ≈ 0.28 MeV or ~ω ≈ 0.48
MeV. Therefore, we believe that theg9/2 protons are responsible for the backbending of
the ground state band in114Ru. Note, that in108,110,112Ru, the backbending in the ground
bands are from alignment of twoh11/2 neutrons. The different contributions of protons
and neutrons in108−114Ru provide new insights into nuclear structure in this region. More
theoretical analysis is required.
Band (2) belongs to a one-phononγ-vibration band. The4+, 6+, 8+ and9+ levels
are added to this band. A plot of∆E vs. lower energy level spin is shown in Figure 40,
as well as those in108,110,112Ru. The114Ru staggering is similar to112Ru. Theoretical
calculations [Che04] [Jia03] [Che06] have shown that the staggering ofγ-bands in even-
even Ru isotopes are from a rigid triaxial shape. This indicates that this may be caused
by triaxial deformation for114Ru. A detailed discussion and comparison can be found in
[Zhu08] and [Luo08].
50

0.15 0.20 0.25 0.30 0.35 0.40 0.45
10
15
20
25
30
35
40
�ω(MeV)
J(1
) ( �
2 M
eV
-1)
108
Ru
110
Ru
112
Ru
114
Ru
Figure 37: Plot ofJ (1) vs rotational frequencies for ground-state bands in108,110,112,114Ru.
0.0 0.1 0.2 0.3 0.4–0.3
–0.2
–0.1
–0.0
0.1
0.2
0.3
Y =
β2s
in(γ
+30
o )
0.0 0.1 0.2 0.3 0.4
X = β2cos(γ+30o)
–0.3
–0.2
–0.1
–0.0
0.1
0.2
0.3γ=30
o
γ=0o
γ=–30o
γ=–60o
0.0 0.1 0.2 0.3 0.4–0.3
–0.2
–0.1
–0.0
0.1
0.2
0.3
Figure 38: Polar coordinate plots of total Routhian surface (TRS) calculated for114Ru: (a)
~ω = 0.0 MeV,β2 = 0.23,γ = -59.4◦, β4= -0.049, (b)~ω = 0.3 MeV,β2 = 0.24,γ = -49.1◦,
β4 = -0.041, (c)~ω = 0.5 MeV,β2 = 0.23,γ = -52.9◦, β4 = -0.035.
51

0.0 0.1 0.2 0.3 0.4 0.5
-2
0
2
Qu
asi-
par
ticl
e en
erg
y (
MeV
)
(MeV)
(a)
0.0 0.1 0.2 0.3 0.4 0.5
-1
0
1
Qu
asi-
par
ticl
e en
erg
y (
MeV
)
(MeV)
(b)
Figure 39: The calculated Routhians for quasi-protons(a) and quasi-neutrons(b) vs rota-
tional frequency~ω in 114Ru. Solid line: (+,+); Dotted lines: (+,-); Dot-dash lines: (-,+);
Dash lines: (-,-).
52

2 3 4 5 6 7 8 9 10 11 12
200
250
300
350
400
450
500
550
600
∆E o
f γ-
ba
nd
(ke
V)
Spin of Lower Energy Level
108
Ru
110
Ru
112
Ru
114
Ru
Figure 40: Plot of∆E vs spin of lower energy level forγ-bands in108,110,112,114Ru.
64 66 68 70
0.5
1.0
1.5
2.0
Energ
y (
MeV
)
Neutron Number
2+ state in γ band
4+ state in γγ band
Figure 41: Plot of first excited state energies of one-phononγ-bands and two-phononγ-
bands in108,110,112,114Ru.
53

Band (3) is identified for the first time. In Figure 41 the band head energies in the
one-phononγ bands and two-phononγ bands in108−112Ru are shown, as well as bands (2)
and (3) in114Ru. Band (3) fits nicely as a two-phononγ-vibration band, with a tentatively
assigned4+ to the band head level at 1578.5 keV. More theoretical work is required to
explain the properties of the ground-state band,γ-band and two-phononγ-band in114Ru.
137,138Cs
Beta-decay, (d, p) and (α, xn) reactions [Pra87], thermal neutron capture, and fis-
sion have been used to populate theN = 83 isotones. Detailed exploration of the high-spin
yrast and near-yrast spectroscopy in this region were not realized until the advent of large
gamma-detector arrays used in fission experiments [Ham95] [Zha96]. Before the present
work, some progress was made at Gammasphere and Eurogam II on theN = 83 isotones
134Sb(Z = 51) [Bha97],135Te (Z = 52) [Bha97] [For01] [Luo01],136I (Z = 53) [Bha97]
[Urb06] , 137Xe (Z = 54) [Dal99], and139Ba (Z = 56) [Luo01]. The ground state and a
number of low-spin states [Car74] and a6− isomeric state [LCC71] in138Cs were reported
from β-decay work. However, nothing has been reported for the high-spin states of138Cs
(Z = 55). The fission partners of138Cs are109Tc (5n), 110Tc (4n) and111Tc (3n). The
level schemes of109,110,111Tc were reported by Y.X. Luoet al. [Luo04] [Luo06] and by W.
Urbanet al. [Urb05].
Identification of Transitions in137,138Cs
With the above-mentioned Tc identifications achieved, we searched for high-spin
states and transitions in138Cs. By gating on known transitions in109,110,111Tc isotopes, we
identified one 1156.9-keV transition which we assigned to138Cs. In109,110,111Tc gates, the
yield ratios of the 1156.9-keV transition in138Cs and the 1184.7-keV transition in137Cs
were measured to be 2.2, 1.1 and 0.3, as shown in Figure 42. The variations of these ratios
follow those of144Ba and143Ba in 103,104,105Mo gates [TA97], to support that the 1156.9-
54

5n/4n 4n/3n 3n/2n0.0
0.5
1.0
1.5
2.0
2.5
3.0
3.5
111Tc
110Tc
109Tc
105Mo
104Mo
Yie
ld R
atio
Mass Gates
I(138
Cs)/I(137
Cs)
I(144
Ba)/I(143
Ba)103Mo
Figure 42: Fission yield ratios of138Cs and137Cs in109,110,111Tc gates,144Ba and143Ba in
103,104,105Mo gates [TA97].
keV transition belongs to138Cs. The fact that the ratios are smaller than those observed
in Ba-Mo pairs also suggests that the 1156.9-keV transition is not directly feeding the
isomeric state nor the ground state.
In order to show how we identified other transitions in138Cs, several triple-coincidence
spectra were generated by gating on the 1156.9-keV transition in138Cs and transitions in its
partner Tc isotopes. A spectrum double gating on the 1156.9-keV transition in138Cs and
the 137.3-keV transition in109Tc is shown in Figure 43(a). The coincidentγ-ray transitions
in both138Cs and109Tc were clearly identified. In Figure 43(b), a spectrum double gating
on the 1156.9- and 174.5-keV transitions in138Cs is shown. The coincident transitions of
138Cs and its Tc partners are indicated. Extensive cross-checking with many other triple-
coincidence spectra led to identifications and placements of the transitions in138Cs. We
have observed a total of fifteen new transitions and placed them into the level scheme with
thirteen new levels, as shown in Figure 44.
The level scheme of138Cs established is shown in Figure 44. Excited levels are
55

50 150 250 350 450 550 650E (keV)
200
600
1000
1400
1800100 300 500 700 900
1000
3000
5000
7000
Cou
nts
per
Cha
nnel 60 100 140 180 220 260
200
600
1000
1400
1800
2200
84.7
(138 C
s)67
.4(11
1 Tc)
+69
.3(10
9 Tc)
185.
5(13
8 Cs)
236.
0(13
8 Cs)
284.
2(11
1 Tc)
357.
3(11
0 Tc)
410.
6(11
1 Tc)
437.
7(10
9 Tc)
447.
5
535.
8
814.
4
895.
590
4.0
69.3
(109 T
c)
84.7
(138 C
s)
139.
6(10
9 Tc)
147.
6(10
9 Tc)
174.
5(13
8 Cs)
185.
5(13
8 Cs)
236.
0(13
8 Cs)
298.
3(10
9 Tc)
437.
7+44
0.0(
109 T
c)
587.
6(10
9 Tc)
53.5
(110 T
c) 84.7
98.9
(110 T
c)10
4.5(
110 T
c)
126.
3(11
0 Tc)
+12
6.5(
111 T
c)
132.
0(11
1 Tc)
137.
6(10
9 Tc)
154.
2(10
8 Tc)
178.
3+17
8.9(
110 T
c) 185.
5
222.
0(11
0 Tc) 23
6.0
a)Double gating on 1156.9 (138Cs)
and 137.3 (109Tc) keV
b) Double gating on 1156.9and 174.5 keV (138Cs)
Figure 43: (a) Spectrum gating on the 1156.9-keV transition in138Cs and the 137.3-keV
transition in109Tc, (b) spectrum gating on the 1156.9- and 174.5-keV transitions in138Cs.
56

3 0.06 79.9
(9 ) 1411.3
(10 ) 1596.8
(12 ) 1917.5
2731.9
3158.3
(11 ) 1832.8
(11 )2813.0
(12 )3260.5
(13 )3348.8
(14 )4164.5
(16 )4626.1
4258.6
(7 ) 254.4
185.5
320.7
426.4
814.4
84.7
236.0421.5
895.5
447.5535.8
904.0
461.6
909.8
1156.9
174.5(2.91min)
138Cs
(33.41min)
Figure 44: Level Scheme of138Cs. Energies are in keV.
observed to be populated up to≈4.63 MeV in 138Cs. The ground state and the6− iso-
meric state in138Cs were reported in references [Car74] and [LCC71], respectively. For
the neighboringN = 83 isotone,136I (Z = 53), W. Urbanet al. reported the1− ground
state and a6− isomeric state [Urb06]. Compared with the level scheme of136I, it is most
likely that the observed yrast cascade of138Cs in the present work is built on the 79.9 keV
6− isomeric state. This is supported by the fact that spontaneous fission populates high spin
states. Based on the decay patterns, the levels are arranged into different bands.
Total internal conversion coefficients (αtotal) were measured to determine the mul-
tipolarities of the low-energy transitions. Theαtotal of low-energy transitions can be deter-
57

mined from the intensity balance in and out of a state by double gating on two transitions in
the same cascade. The total internal conversion of two low-energy transitions, 185.5- and
84.7- keV were measured. For the 185.5-keV transition, theαtotal was measured by dou-
ble gating on the 1156.9- and 84.7- keV transitions. In this gate, the difference in relative
γ-ray intensities of the 185.5- and 236.0-keV transitions is equal to the conversion electron
intensity. Theαtotal of the 84.7-keV transitions was measured by double gating on 185.5-
and 895.5-keV transitions. Their total internal conversion coefficients were determined
as: αtotal(84.7keV ) = 1.39 ± 0.22 andαtotal(185.5keV ) = 0.18 ± 0.04. The theoreti-
cal values were calculated asα(total,E2)(185.5keV ) = 0.22, α(total,M1)(185.5keV ) = 0.16,
α(total,E2)(84.7keV ) = 3.42, andα(total,M1)(84.7keV ) = 1.48. Comparing with the theo-
retical values, their multipolarities were deduced as pure M1 for the 84.7-keV transition,
M1 and/or E2 for the 185.5-keV transition.
The level scheme of137Cs was reported by R. Brodaet al. [Bro99] from a deep in-
elastic one-proton-transfer reaction. From our fission data, we confirmed the level scheme
of 137Cs with more transitions and levels identified. We observed seven new transitions
and placed them into the level scheme with five new levels. An example of the coinci-
dence spectrum for137Cs obtained by double gating on 1184.7- and 487.1-keV transitions
is shown in Figure 45. The transitions in137Cs and its fission partners can be clearly iden-
tified. The level scheme of137Cs constructed in the present work is shown in Figure 46.
Shell-model calculations
The spin, parity and configuration assignments for137Cs and138Cs are essentially
based on comparisons of the experimental level energies and that of shell-model calcula-
tions. The shell-model calculations were performed by Prof. Covello’s group. In these
calculations, it is assumed that132Sn is a closed core and the valence protons occupy the
five single-particle (SP) orbits of the 50-82 shell, while for the neutrons the model space
included the six orbits of the 82-126 shell. A shell-model Hamiltonian was employed with
58

60 100 140 180 220 260 300E (keV)
200
600
1000
1400
1800
2200 1000 1200 1400 1600
10
30
50
70
90
Cou
nts
per
Cha
nnel
53.5
(109 T
c)
67.5
(111 T
c)+
69.3
(109 T
c)
88.1
(110 T
c)
98.9
(110 T
c)10
4.5(
110 T
c)
126.
3(11
0,11
1 Tc)
132.
0(11
1 Tc)
137.
3(10
9 Tc)
178.
3(11
0 Tc)
222.
2(13
7 Cs,
110 T
c)
238.
3(11
0 Tc)
284.
2(11
1 Tc)
298.
1(10
9 Tc)
982.
1(13
7 Cs)
1274
.1(13
7 Cs)
1409
.7(13
7 Cs)
1567
.4(13
7 Cs)
1609
.4(13
7 Cs)
a)Gate on 1184.7 and 487.1 keV(137Cs)
b)Gate on 1184.7 and 487.1 keV(137Cs)
Figure 45: Spectra gating on the 1184.7 keV and 487.1 keV transitions in 137Cs (a) the low
energy region, (b) the high energy region.
59

(7/2 ) 0.0
(11/2 ) 1184.7
(15/2 ) 1671.8
(21/2 ) 2784.2
(19/2 ) 2876.1
(17/2 ) 1894.0
(19/2 ) 3303.6
(23/2 ) 3496.7(21/2 ) 3503.4
(27/2 ) 4409.1
(29/2 ) 5023.9
(31/2 ) 5495.2
(19/2 )3168.1
(23/2 )3465.4
(19/2 )4117.6(21/2 )4291.0
(23/2 )4351.6
(25/2 )4776.9
1184.7
487.1
222.2
890.2
982.1
193.1
1409.6
1609.4
712.5
912.4
614.8
471.3
681.2
1274.12223.6
1567.4
425.3
2397.0
137Cs
Figure 46: Level Scheme of137Cs. Energies are in keV.
60

the single-particle energies taken from experiment and the two-body effective interaction
derived from the CD-Bonn free nucleon-nucleon potential [Mac01]. The same Hamilto-
nian was used in the recent studies of134Sn,134Sb, and135Sb, producing very good results
[Cor05] [Cor06] [Cov07]. The values of the proton and neutron SP energies as well as a
brief discussion of the derivation of the effective interaction can be found in [Cor05]. Com-
parisons of the experimental level energies with the shell-model calculations for137Cs and
138Cs are shown in Table 5 and Table 6, respectively.
The level scheme of138Cs is built on the isomeric state at 79.9 keV which has been
assigned6− [LCC71]. The spins, parities, and dominant configurations are assigned by
comparing the experimental level energies with the calculated ones which are given in Ta-
ble 6. The levels in138Cs can be interpreted by coupling onef7/2 neutron to the levels in
137Cs. Based on the shell-model calculations and the above-mentioned multipolarity deter-
minations of low-energy transitions, (7−), (9−), (10−), (11−) and (12−) are assigned to the
254.4-, 1411.3-, 1596.8-, 1832.8-, and 1917.5-keV levels, respectively. Note that a(7−)
state and a low-energy transition from (7−) to (6−) were also reported in the neighboring
N = 83 isotone,136I, by W. Urbanet al . [Urb06]. In 138Cs, positive parity levels should
occur above the 1917.5-keV (12−) level related to coupling anf7/2 neutron to the proton
g7/2 → h11/2 and(g7/2)2 → d5/2h11/2 negative-parity excitations found in137Cs. By con-
sidering the corresponding couplings, (11+), (12+), (13+), (14+), and (16+) are tentatively
assigned to the 2813.0-, 3260.5-, 3348.8-, 4164.5-, and 4626.1-keV levels, respectively.
The angular correlation coefficientsAexp2 andAexp
4 for the 174.5- and 1156.9-keV
cascade were measured to be -0.07(1) and -0.02(2), as described in [Dan07]. They are
consistent with the theoretical coefficients ofAthe2 = −0.071 andAthe
4 = 0.0 [Tay71], for
pure quadruple and pure dipole transitions and for the proposed spin assignments of (9−)
and (7−) to the 1411.3 and 254.4 keV levels. This measurement also indicates that the
174.5-keV transition has M1 character while the 1156.9-keV transitions has E2 character.
The shell-model calculations indicate an important role played by the coupling of
61

Table 5: Comparison of the experimental level energies of137Cs with those calculated by
the shell-model. Deviations between the theory and experiment are shown in the table.
Energies are in MeV.
Iπ Eexp Ethe ∆ = Ethe − Eexp Leading component
7/2+ 0.00 0.00 0.00 πg57/2
(11/2+) 1.18 1.35 0.17 πg57/2
(15/2+) 1.67 1.68 0.01 πg57/2
(17/2+) 1.89 2.02 0.13 πg47/2d5/2
(21/2+) 2.78 3.01 0.23 πg47/2d5/2
(19/2+) 2.88 3.07 0.19 πg47/2d5/2
(19/2+) 3.17 3.51 0.34 πg37/2d
25/2
(23/2+) 3.47 3.75 0.28 πg37/2d
211/2
(19/2−) 3.30 3.29 -0.01 πg47/2h11/2
(23/2−) 3.50 3.40 -0.10 πg47/2h11/2
(21/2−) 3.50 3.40 -0.10 πg47/2h11/2
(27/2−) 4.41 4.40 -0.01 πg47/2h11/2
(29/2−) 5.02 5.22 0.20 πg37/2d5/2h11/2
(31/2−) 5.50 5.36 -0.14 πg37/2d5/2h11/2
(19/2+) 4.12 πg57/2νf7/2h
−111/2
(21/2+) 4.29 πg57/2νf7/2h
−111/2
(23/2+) 4.35 πg57/2νf7/2h
−111/2
(25/2+) 4.78 πg57/2νf7/2h
−111/2
62

Table 6: Comparison of the experimental level energies of138Cs with those calculated by
the shell-model. Both experimental and calculated energies are relative to the6− state.
Deviations between the theory and experiment are shown. Energies are in MeV.
Iπ Eexp Ethe ∆ = Ethe − Eexp Leading component percentage
6− 0.0 0.0 0 πg57/2νf7/2 46
7− 0.17 0.15 -0.02 πg57/2νf7/2 41
9− 1.33 1.55 0.22 πg57/2νf7/2 51
10− 1.52 1.75 0.23 πg47/2d5/2νf7/2 80
11− 1.75 1.89 0.14 πg47/2d5/2νf7/2 57
12− 1.84 1.98 0.14 πg47/2d5/2νf7/2 77
11+ 2.73 2.79 0.06 πg47/2h11/2νf7/2 61
12+ 3.18 3.25 0.07 πg47/2h11/2νf7/2 61
13+ 3.27 3.33 0.06 πg47/2h11/2νf7/2 63
14+ 4.08 3.80 -0.28 πg37/2d5/2h11/2νf7/2 81
16+ 4.55 4.63 0.08 πg37/2d5/2h11/2νf7/2 79
63

2.0
0
1.0
(7/2+
)
(11/2+
)
7/2+
7/2+
Cs137 139
55
141
Cs Cs55 8482 86
Cs138
55 83
(9-)
Ee
xc (M
eV
)
(11/2+
)
(11/2+
)
(7-)
6-
3-
55
Figure 47: Yrast states of Cs isotopes.
the odd protons outside theZ = 50 closed shell and thef7/2 neutron outside theN =
82 closed shell. It can be also noted in Table 6 that the configuration mixing in138Cs
is extensive. We show only the leading components and their percentages of the total
theoretical wave function.
Discussion
Figure 47 shows the yrast excitations of Cs isotopes near theN = 82 major shell
closure. The level spacings exhibit strong shell effects of theN = 82 neutron major shell.
The level schemes of140,142Cs are not included since the spins and parities of their yrast
states are not available.
Figure 48 shows the yrast excitations of theN = 82 andN = 83 isotones with
a few valence protons outside theZ = 50 major shell closure. A similarity is seen in
the yrast level patterns between137Cs (Z = 55) and its neighboringN = 82 isotone135I
(Z = 53) [Sah01]. For theN = 83 isotones138Cs and136I [Bha97] [Luo02] [Urb06], a
similar cascade pattern is observed. However, one more yrast state, the10− state, is iden-
tified in 138Cs but not reported in136I. For the136I nucleus, the 47s6− isomeric state was
assigned a configuration ofπg27/2d5/2νf7/2 by Urbanet al [Urb06]. The assignment was
supported by shell model calculations of the SMPN(400) set of two-body matrix, in which
64

2.0
0
1.0
3.0
(11/2+
)
7/2+
7/2+
135
55
137
I Cs53 82 82
I136
53 83 55
138
Cs83
(7
-
)
(9-)
Ee
xc
(M
eV
)(11/2
+)
(15/2+
)
(17/2+
)
(21/2+
)
(11-)
(12-)
(9-)
(10-)
(11-)
(12-)
(15/2+)
(17/2+)
(6
-
)
(7
-
)
6
-
-3
-(1 )
Figure 48: Yrast states ofN = 82 andN = 83 isotones.
the position of theπd5/2 orbital was lowered by 400 keV. In our shell-model calculations of
138Cs, we predict a yrast6− state in138Cs arising from theπg57/2νf7/2 configuration while
a second6− state predicted at 185 keV higher is dominated by theπg47/2d5/2νf7/2 config-
uration. When we similarly lower theπd5/2 orbital energy, we observe a reordering of the
two 6− states. However, the level ordering of the9−, 10−, 11−, 12− levels change too,
resulting in significant disagreement between the calculated and experimental level ener-
gies. Based on this disagreement, we assigned the6− state in138Cs with a configuration of
πg57/2νf7/2. Note that the shell-model calculations on136I by the Covello group predict a
sameπg37/2νf7/2 dominant configuration for the lowest6− state and the existence of a10−
state at about the same energy as that calculated for138Cs. Further studies are needed to
verify these predictions.
The variations of the excitation energies of the11/2+ state in even-N Cs isotopes
versus the excitation energies of the first2+ state in the corresponding even-even Xe core
are shown in Figure 49. They change very rapidly in the region ofN = 82 major shell,
with an almost linear relationship. TheN = 83 Cs isotone138Cs is also shown in the figure
by assuming that the9− state can be attributed to the coupling between the lowest yrast
65

0
0.2
0.4
0.6
0.8
1
1.2
1.4
0.1
Excita
tio
ns
of
11
/2+le
ve
lo
fo
dd
-AC
sis
oto
pe
s(M
eV
)
143Cs
141Cs
139Cs
137Cs
142Xe
140Xe
138Xe
136Xe
N=82
N=84
N=86
N=88
0.3 0.5 0.7 0.9 1.1 1.3 1.5
N=83 138Cs
Figure 49: Variations of excitation energies of the11/2+ states in the even-N Cs isotopes
versus the excitations of the first2+ state in the corresponding even-even Xe core. The9−
state energy in138Cs is also shown.
excitation of the even-even core136Xe with oneg7/2 valence proton and onef7/2 valence
neutron. For138Cs, the coupling does not significantly reduce the excitation energy of the
corresponding9− state.
Conclusions
In this chapter, by analyzing our 2000 binary fission data, structure of several
neutron-rich nuclei were studied. The level scheme of88Kr was extended to a 7169.4-keV
state, with spins and parities assigned by the systematics in comparing with its neighboring
N = 52 isotones,86Se and90Sr. The level scheme of90Kr was extended, with several
new transitions and states identified. Angular correlation measurements confirmed the3−
assignment to the 1506.7-keV level in90Kr, in agreement with [RU00]. The lack of system-
atics in theN = 54 isotones,90Kr and92Sr, provides insight into this region and indicates
the requirement of further experimental and theoretical investigation. A few new transi-
tions were observed in92Kr as well. No new transition or state was identified in94Kr, due
66

to its low yield. In 102Zr, three new collective band structures were identified. Angular
correlation measurements were performed to assign spins and parities. In the neutron-rich
114Ru, the ground-state band andγ-band were extended. A new band was identified and
proposed as a two-phononγ-band, by comparing band-head energies with its neighboring
even-even Ru isotopes. Cranked Shell Model calculations indicate that the band-crossing of
the ground-state band in114Ru is from the alignment of twog9/2 protons, instead of align-
ment of twoh11/2 neutrons as found in108−112Ru. The staggering pattern of theγ-band
indicates a rigid triaxial shape in114Ru. The level scheme of138Cs was constructed for
the first time in this work, with that of137Cs extended with several new transitions. Spins,
parities and configurations were assigned to the levels of138Cs based on total internal con-
version coefficient measurements of the low-energy transitions, shell-model calculations,
angular correlation measurements and level systematics. Shell Model calculations were
performed with results in agreement with experimental data. Similarities were observed
for theN = 82 isotones,137Cs and135I as well as theN = 83 isotones,138Cs and136I. The
Shell-Model calculations indicate the important role played by the coupling between the
excitation of the fifth proton outside theZ = 50 major shell and thef7/2 neutron outside
theN = 82 major shell.
67

CHAPTER IV
GAMMA-RAY ANGULAR CORRELATION AND G-FACTOR MEASUREMENTS
Measurement of the angular correlations between successive nuclear de-excitations
can be used to determine certain properties of the nuclear structure. From angular corre-
lations of prompt cascade, one can extract information on the spins of the energy levels
and the multipole mixing ratios of the transitions. Another important property that can be
measured with angular correlations is theg-factor of an excited state, with external applied
magnetic field or hyperfine field. Theg-factors of excited states in even-even nuclei (and
their deviation fromZ/A) give some sense of their degree of collectivity; for odd A nuclei,
theg-factor is related to the purity of the single particle state that characterizes the level.
The analysis ofγ-ray angular correlations andg-factor measurements were based
on our 2000 binary fission data. The252Cf source were sandwiched between two Fe foils,
which were used to stop fission fragments. Angular correlations ofγ-rays in delayed cas-
cade are perturbed, with attenuation factors which are related to the magnetic moments
of the intermediate states. No attenuation would be observed for prompt cascades. The
Gammasphere detector array, consists of 110 detectors at full capacity, supplies a great
opportunity to perform angular correlation measurements andg-factor measurements. A
new technique has been developed to identify transitions in nuclei of interest and measure
angular correlations of prompt and delayed cascades [Dan07].
Theoretical Predictions ofg-factors
The Nuclear Shell Model
The Nuclear Shell Model was introduced in the mid twentieth century by Mayer
and Jensen [May55]. In this model, the particles move in a collective central potential
68

generated by themselves. One of the most realistic potentials is the central Woods-Saxon
potential
V (r) = −V0
1 + exp( r−Ra
), (1)
whereV0 is the depth of the potential well (∼ 50 MeV), R is the mean radius (R =
1.25A1/3fm), r is the radial distance anda the diffusivity parameter (0.524fm). An
alternative description can be obtained by using the harmonic oscillator potential with a
finite boundary at the nuclear radius and with the inclusion of a centrifugal term propor-
tional tol2. Both potentials predict discrete shells holding only a finite number of nucleons,
but to reproduce the shell number inferred from experimental evidence, the inclusion of a
spin-orbit interaction is required, which is in the form of
Vso = −V0(r)l · s, (2)
whereV0 is the central nuclear potential,l is the orbital angular momentum ands is the
spin. The spin-orbit interaction causes the individual energy levels to split in a way that
the nuclear numbers 2, 8, 20, 28, 50, 82, 126, referred to as“magic numbers”, are all
reproduced. Figure 50 shows the standard shell model energy levels and orbitals. Shell
Model has proven very successful in describing the properties of magic nuclei with few
valence nucleons lying outside major shell closures, such as energy levels, electromagnetic
transition probabilities and moments, beta-decay rates and reaction cross sections.
The calculation of magnetic moments in the shell model can be greatly simplified
for certain nuclei. The paring force, which has a tendency to couple pairs of neutrons and
pairs of protons, can be used to described an odd-A nucleus as an inert “core” with one va-
lence nucleon. Therefore, the A-1 nucleons of the core couple into zero-spin combinations
that do not contribute to the magnetic moment. So the magnetic moment of the entire nu-
cleus is given by the single, valence nucleon. The only non-zero contribution comes from
the single valence nucleon. Equation 7 thus is reduced to eitherI = l + 12
or I = l − 12,
to reflect the two available intrinsic-spin states of the unpaired nucleon. Theg-factors for
69

2
3p
4s
3d
2g
1i
2f
1h
3s
2d
1g
2p
1f
2s
1d1d
1p1p
1s
2s1d
1f
2p
1g
3s
2f
1i
2g
3d
3p
1f2p
1g
2d
2d
2f3p
1h
4s
1i1j2g3d
1/2
1/2
3/2
3/2
5/2
1/2
5/2
7/2
5/2
7/2
9/2
3/2
1/2
3/21/2
1h11/2
7/2
5/2
9/2
13/23/2
1/2
9/2
11/215/2
5/2
3/2
7/2
1/2
11/22h
1p
1s
20
28
50
184
SPIN−ORBITWOODS−SAXON
5
6
4
3
1
0
S. H. O.
8
82
126
2
Figure 50: The orbitals generated by the simple Harmonic Oscillator, simple Wood-Saxon
and corrected Wood-Saxon potentials. The split induced by the spin-orbit correction is
necessary to generate the appropriate shell-model magic numbers.
70

these two possible states can be written as
g =gs + (2I − 1)gl
2Ifor I = l +
1
2
g =−gs + (2I + 3)gl
2I + 1for I = l −
1
2(3)
and are commonly referred as Schmidtg-factors [Sch37]. For nuclei far from the major
shell closures, the magnetic effects of the core cannot be ignored and the magnetic moment
is written as
µ = [gcJc +∑
i
(glili + gsisi)]
µN
~(4)
wheregc, Jc are properties of the core and the many-body problem is thus reduced to a
sum over a small number,i, of valence particles. With the introduction of residual inter-
actions, it is necessary to acknowledge contributions from many coupled states and this
requires calculations that involve the correct vector coupling of different spins and angular
momenta.
Qualitative arguments based on simple shell theory also explain the origin ofg-
factors in even-even nuclei. One example is the experimentally measuredg-factors in Zr
isotopes beyond theN = 50 shell closure. IfZ = 40 is taken to be a strong sub-shell
closure,9040Zr50 is then a doubly-magic nucleus. Therefore, even-even Zr isotopes just be-
yond this double shell should be dominated by neutron orbitals. Since neutrons produce a
measurable negative magnetic moment, theg-factors are expected to be take on negative
values. This has been confirmed by the negative measuredg(2+) values of92Zr and94Zr
[Smi04].
A successful extension to the shell model is the Nilson Model which describes sin-
gle particle states in a deformed nuclear potential as opposed to the spherically symmetric
formulations of the conventional shell model. Nuclear shape deformation is an intrinsic
assumption made in collective nuclear models.
71

The Collective Model
Collective excitations originate from the co-operative behavior of all or at least a
large fraction of the nucleons. Nearly all nuclei with neutron number at mid shell between
two major magic numbers show some degree of collective behavior. In even-even nuclei,
strong indicators are, for example, the ratios of the lowest4+- to 2+-state energies and2+
state electric quadrupole moments. They are both linked to one of the most common forms
of collectivity, rotational nuclear motion.
Evidence of rotational and vibrational collectivity is shown in Figure 51, where the
ratios of the energies of the first4+ and2+ are shown. The classical kinetic energy of a
rotating object is
E =1
2Iω2 (5)
whereI is the moment of inertia and the angular momentum is given byl = Iω. Using the
appropriate quantum mechanical values for the angular momentum, the rotational energy
is given by
E =~
2
2II2 (6)
whereI is the angular momentum quantum number in√
(I(I + 1)). Thus, successive
states in the rotational ground-state band of an even-even nucleus have energies given by
E(2+) = 6~
2
2I(7)
E(4+) = 20~
2
2I(8)
E(6+) = 42~
2
2I(9)
and so on. Note that the ratio of the energies of the first4+ and2+ states is 20/6 = 3:33.
The E(4+) : E(2+) ratios very rarely become exactly 3.33 because real nuclear systems are
not perfect rigid rotors with a fixed moment of inertia. They are better described as being
composed of a fluid of nucleons which can experience some centrifugal stretching. Collec-
tive properties vary slowly and smoothly with nucleon number, and to a first approximation
are independent of the number of valence nucleons outside the filled sub-shells.
72

52 54 56 58 60 62 64 66 681.0
1.2
1.5
1.8
2.0
2.2
2.5
2.8
3.0
3.2
3.5
E(4
+)
: E
(2+)
SHELL MODEL
VIBRATIONAL
ROTATIONAL
40Zr
42Mo
44Ru
Figure 51: E(4+):E(2+) ratios of ground state rotational bands in neutron rich Zr, Mo and
Ru nuclei.
Theg-factors of excited states in even-even nuclei can also be predicted. For exam-
ple, the collective rotation of protons can be regarded as an electric current responsible for
a corresponding magnetic moment. For a state with angular momentum,I, the contribution
made from protons to this angular momentum is equal toZ/A. If we assume that the neu-
trons make no contribution to the magnetic moment and that each pair of protons/neutrons
are coupled in a spin-zero configuration, theg-factor of this state is simply given by
g =Z
A. (10)
More refined models allow for non-rigid collectivity by reducingg-factor by a uni-
form factor. For example, Greiner [Gre66] assumed that the distribution of protons within
the nucleus is less deformed than that of neutrons due to the fact that protons are known to
be subject to a slightly greater pairing force. Hence the neutrons are assumed to contribute
slightly more to the collective motion of the nucleus than the protons. This imbalance is
73

expressed as
g =Z
A(1 − 2f) (11)
where
f =N
A[(
Gn
Gp
)1
2 ) − 1] (12)
and the proton and neutron pairing strength parameters are given byGp andGn, respec-
tively.
The Interacting Boson Models
The Interacting Boson Models (IBM) was first introduced by Arima and Iachello
[Ari75] as an alternative description of the collective properties of nuclei. Essentially,
there are two models: IBM1, treats protons and neutrons equally and is similar to the
collective model; IBM2, treats protons and neutrons separately and is more like a shell
model description of the nuclear system.
The most fundamental assumption of the IBM is that the low-lying collective states
of even-even nuclei are governed by the interactions of a fixed number, N of bosons. These
bosons are either particulate pairs of protons and neutrons or pairs of proton- and neutron-
holes. The bosons exist around the known shell closures and it is only these valence bosons
that contribute to nuclear structure as opposed to the total number of bosons.
The IBM bosons exist in configurations where the constituent particles (protons or
neutrons) are coupled into one of two possible states: those with angular momentuml = 0
(s-boson) and those withl = 2 (d-bosons). A boson vacuum corresponds to a doubly-magic
nucleus and the energy levels and properties of more complicated nuclei are built on the
individual bosons present in the system as well as the interactions between them.
For the investigation of magnetic moments andg-factors, the IBM2 model was
adopted [Sam84]. Since the proton (π) and neutron (ν) bosons are treated separately, the
total number of bosons is given by
Nt = Nπ + Nν (13)
74

whereNπ and Nν are the separate proton- and neutron-boson numbers. The magnetic
dipole moment operator in IBM2 is given by
µ̂ =
√
3
4π(gπL̂π + gνL̂ν) (14)
wheregπ, gν are the proton- and neutron-bosong-factors, respectively, and̂Lπ,
L̂ν are the proton- and neutron-boson angular momentum operators, respectively. Since
Lµ = Lπ + Lν , Equation 14 is rearranged to
µ̂ =
√
3
4π[1
2(gπ + gν)Lµ +
1
2(gπ − gν)(Lπ − Lµ)] (15)
The first term is diagonal, so in IBM2, only the second term contributes. Theg-
factor of theIπ = 2+ state is then given by
g =Nπ
Nt
gπ +Nν
Nt
gν (16)
Equation 16 is valid only if the2+ state is F-spin symmetric. F-spin is a new
quantum number in IBM2 which is used to describe proton and neutron bosons [Sam84].
Note that withgπ = 1 andgν = 0, this equation reduces to the collective model,g = Z/A,
but only if Z and A are taken to be the number of valence nucleons as opposed to the total
number of nucleons.
75

Gamma-Ray Angular Correlation
A two-componentγ-ray cascade involving nuclear states with spinsI1, I2 andI3
may be described with Figure 52. TheL1 andL2 define the multipole orders of the first
and second transitions, respectively, and are the minimum values obtained from
|I1 − I2| ≤ L1 ≤ |I1 + I2|
|I2 − I3| ≤ L2 ≤ |I2 + I3| (17)
TheL′
1 = L1 + 1 andL′
2 = L2 + 1 describe possible multipole mixtures inγ1 andγ2. The
mixing ratio is defined as the ratio of reducedγ-ray matrix elements, such as forγ1,
δ1 =< I2‖L
′
1‖I1 >
< I2‖L1‖I1 >=
< I2‖L1 + 1‖I1 >
< I2‖L1‖I1 >. (18)
Thus, the ratio of the intensities of theL1 + 1 andL1 components is given byδ21 . A similar
parameter may be defined forγ2 if it should also be mixed.
The theory of gamma-ray angular correlations has been treated in great details
[Rac51] [Ham75] [Sie65]. For a two-component cascade, the angular correlationW (θ)
has the form
W (θ) =∑
k=even
Ak(γ1)Ak(γ2)Pk(cos θ) (19)
wherek = 0, 2, 4, ...,θ is the angle between the propagation vectors of the twoγ-rays, and
Pk(cos θ) are normalized Legendre polynomials. If we assume that each transitions is a
mixture of no more than two multipole, the maximum value ofk = Min(2L′
1, 2L′
2, 2I2).
ThenAk(γ1) andAk(γ2) are determined by the parameters ofγ1 andγ2, respectively. With
normalizedA0(γ1) = A0(γ2) = 1, W (θ) becomes,
W (θ) = 1 +∑
k=even
AkPk(cos θ). (20)
The most general form forAk occurs when both radiations are mixed,
Ak =1
1 + δ21
{Fk(L1L1I1I2) + (−1)L1−L′
12δ1Fk(L1L′
1I1I2) + δ21Fk(L
′
1L′
1I1I2)}
×1
1 + δ22
{Fk(L2L2I3I2) + 2δ2Fk(L2L′
2I3I2) + δ22Fk(L
′
2L′
2I3I2)} (21)
76

γ1
γ2(L
2L
2
')
(L1L
1
')
I1
I2
I3
Figure 52: A gamma-ray cascade.
The F-coefficients are given by
Fk(L1L′
1I1I2) = (−1)I1+I2−1(2L1 + 1)(2I2 + 1)1/2(2k + 1)1/2
× (L1 L′
1 k1 −1 0
){L1 L′
1 kI2 I2 I1
} (22)
and similarly forFk(L2L′
2I2I3).
As for Equation 20, it is usually sufficient to consider only the A2 and A4 parameters
in γ − γ angular correlations, thus we have
W (θ) = 1 + A2P2(cos θ) + A4P4(cos θ). (23)
with
P2(cos θ) =1
2(3 cos2 θ − 1)
P4(cos θ) =1
8(35 cos4 θ − 30 cos2 θ + 3). (24)
TheoreticalA2 andA4 coefficients are tabulated in [Tay71]. We have developed a program
to calculate the theoretical angular correlation coefficients as well.
77

Perturbed Angular Correlation
To measure the magnetic moments of short-lived states, the perturbed angular cor-
relation/distribution (IPAC/D) technique is required to be employed with the intense hyper-
fine fields present at dilute impurities implanted into ferromagnetic hosts. Usually heavy-
ion beams are used to create and excite the nuclei of interest and implant them during recoil
into a ferromagnetic host placed behind a target foil [Stu01]. Another important class of
measurements is to use spontaneous fission sources to populate excited states and ferro-
magnetic materials to provide hyperfine fields [Smi99] [Pat02].
In general, the measurements ofg-factors require that the precession of nuclear state
in the hyperfine field to be extracted from the perturbed angular correlation/distribution.
Once the precession angle has been measured, the effective magnetic field at the nucleus,
Beff , and the effective interaction time of the nuclear state with the field,teff , must be
known to extract theg-factor value, since
φ = −gµNBeff teff
~(25)
Perturbation From a Static Magnetic Field
A general scheme of perturbation from an external magnetic field is shown in Figure
53. If we take the alignment axis to be the direction of the feedingγ-ray, the angle between
γ1 andγ2 is given by
cos Θ12(θ1, θ2, φ,t) = cos θ1 cos θ2 + sin θ1 sin θ2 cos(φ − ωt) (26)
Therefore, the angular correlation of these twoγ-rays, Equation 23, can be re-arranged and
gives the time-dependent, perturbed angular correlation function,
W (θ1, θ2, φ, t) =n=4∑
n=0
fn(θ1, θ2) cos(n(φ − ωt)) (27)
78

X
Y
Z
φ
θ1θ2
θ
Bγ2
γ1
Figure 53: A geometry used in discussion of perturbed angularcorrelations.
where the coefficients are given by
f0 = 1 + A2(3
2A2 +
1
2B2 −
1
2)
+ A4(3
8+
105
8A2B2 +
35
8A4 +
105
64B4 −
15
4A2 −
15
8B2),
f1 = A2(3AB) + A)4(105
8B3A +
35
8A3B −
15
2AB),
f2 = A2(3
4B2) + A4(
35
16B4 +
105
8A2B2 −
15
8B2),
f3 = A4(35
8AB3),
f4 = A4(35
64B4). (28)
The two constants, A and B, are given byA = cos θ1 cos θ2 andB = sin θ1 sin θ2, respec-
tively. The time integral perturbed angular correlation becomes
W (θ1, θ2, φ) =1
τ
n=4∑
n=0
fn(θ1, θ2)
∫
∞
0
e−tτ cos(n(φ − ωt))dt (29)
The integration over the mean lifetime of the state,τ , allows the perturbed angular correla-
tion function to be dependent on the average precession angle,φp = ωτ ,
Wp(φp) =
n=4∑
n=0
fn(θ1, θ2)
(1 + n2φ2p)
1/2[cos(nφ) + nφp sin(nφ)] (30)
79

This is a 3-dimensional description of perturbed angular correlation from an alignedB field,
given by D. Patelet al.[Pat02]. In their work, the double ratio is defined and interpreted as
ρ12(φp) =Wp(θ1, θ2, φ, +φp)
Wp(θ1, θ2, φ,−φp). (31)
These double ratios can allow a non-linear, least squares fit analysis in order to extract the
precession angle,φ. By using this technique,g-factors of many excited states populated
from spontaneous fission have been determined. More details are given in [Pat02].
Perturbation From Randomly Oriented Magnetic Field
The perturbation from a randomly oriented classical magnetic field B of constant
magnitude (e.g. magnetic fields in randomly oriented ferromagnetic domains) is a more
complicated case and has been discussed in details in [Mat65] and [Ham75]. The perturbed
angular correlation is described by
W (θ) = 1 + Athe2 G2P2(cos θ) + Athe
4 G4P4(cos θ) (32)
whereG2 andG4 are the attenuation factors, defined as
Gk =Aexp
k
Athek
. (33)
The attenuation factorGk is related to the precession angleφ in Equation 25 as
Gk =1
2k + 1(1 + 2
k∑
q>0
1
1 + q2φ2). (34)
In our 2000 binary fission experiment, the Californium source was sandwiched be-
tween two Fe foils, with no external magnetic field, as shown in Figure 54. The recoiling
fission fragments are implanted into the un-magnetized iron foils. We have also assumed
that the domains in the foil are randomly oriented and small enough that there is no pref-
erential direction in the foil. With a large set of statistical events collected, we are able to
measureg-factors of excited states in neutron-rich nuclei. If the state of interest interacts
80

Cf Fe252
Figure 54: A scheme of experimental setup of our 2000 binary fission experiment. The
252Cf source was sandwiched between two Fe foils.
with a magnetic field of sufficient strength for a sufficient length of time, which means, in
Equation 25, theτ is much longer than the stopping time, the attenuation in Equation 32
will be measurable. Typically, the error is small for states with lifetimes between a few
hundred picoseconds and a few nanoseconds and for magnetic fields between 10 and 100
Tesla. For the excited states with very short lifetimes, but longer than the stopping time
(∼ few picoseconds), it is assumed that the angular correlation forγ-rays connecting this
state will not be perturbed. Otherwise, the observed angular correlations will be affected
by transient field effect. But for longer lifetimes, the nucleus will be subject to a hyperfine
field (HFF) and precess about this field. It’s assumed that the HFFs are those of an ion
implanted in a substitutional site in the lattice [Rao79], as shown in Figure 55.
81

Figure 55: Calculated impurity hyperfine field for isotopes in Fe lattice [Rao79].
82

φ0 1 2 3 4 5
φ/d k
dG
-0.8
-0.6
-0.4
-0.2
0
0.2
0.4
0.6
0.81
φ0 1 2 3 4 5
φ/d k
dG
-0.8
-0.6
-0.4
-0.2
0
0.2
0.4
0.6
0.81
φ0 1 2 3 4 5k
G0.1
0.2
0.3
0.4
0.5
0.6
0.7
0.8
0.91
φ0 1 2 3 4 5k
G0.1
0.2
0.3
0.4
0.5
0.6
0.7
0.8
0.91
K=2
K=4
Figure 56: Dependence of G2,4 and| dG2,4
dφ| on the precession angleφ.
The dependence of Gk and the its derivative on the precession angleφ is shown
in Figure 56. Asφ gets large, the uncertainty in our measurement, which depends on
|dG2,4/dφ|, also gets very large. The same is true ifφ is very small. This places a funda-
mental limitation on the sensitivity of our method of measuring a perturbed angular corre-
lation (PAC) to deduce theg-factor of an excited state. Also, it is clear from Equation 34
that the PAC method can only determine the magnitude, and not the sign of theg-factor.
This is in contrast to the method employed by [Pat02], in which the HFFs were aligned by
an external magnetic field. Despite the limitations in our measurement, there are still many
cases where this method can be applied with useful accuracy.
In practice, the experimental angular distribution function is given by
N(θn) = Aexp0 (1 + Aexp
2 P2(cos θn) + Aexp4 P4(cos θn)) (35)
for some set of discrete angles,θn.
83

Analytical Techniques
Angular Properties of Gammasphere
The 110 Ge detectors in the Gammasphere array are arranged in 17 concentric rings
of constant angleθ relative to the beamline axis. For example, the 10 detectors located at
θi = 90◦ make up the central ring which occupies thez = 0, x − y plane.
Figure 57 shows the polar and azimuthal positions of each Gammasphere detector
with respect to the center of the array. To create angle bins, all possible detector pairs were
considered. The 110 detectors create 110×109/2=5995 number of pairings. For detectori
and detectorj, the angle between them is,
cos θij = θ̂i · θ̂j
= sin θi cos φi sin θj cos φj + sin θi sin φi sin θj sin φj + cos θi cos θj (36)
Since these detectors were symmetrically arranged on the Gammasphere support
cage, we are able to reduce the angle bins to 64 discrete values. Each angle bin has many
detectors, generally between 55 and 120. For our experiment, only 101 detectors were
present, so the number of detectors in each bin is slightly different from that of Gammas-
phere at full capacity. The angle bin information is given in Table 7.
Table 7: Angle bins in Gammasphere. (101 detectors).
Nbin Cos(θ) Npairs Nbin Cos(θ) Npairs
1 0.939 203 2 0.934 583 0.840 47 4 0.823 455 0.815 104 6 0.809 567 0.764 100 8 0.762 459 0.755 50 10 0.745 3011 0.656 50 12 0.613 10413 0.594 88 14 0.580 10015 0.577 116 16 0.500 5617 0.495 88 18 0.471 5219 0.391 91 20 0.357 5821 0.333 60 22 0.327 44
Continued on next page
84

Table 7 – continued from previous pageNbin Cos(θ) Npairs Nbin Cos(θ) Npairs
23 0.309 56 24 0.298 10024 0.282 101 26 0.269 10427 0.175 100 28 0.168 4429 0.139 23 30 0.064 9231 0.057 104 32 0.000 27333 -0.057 104 34 -0.064 9035 -0.139 23 36 -0.168 4437 -0.175 101 38 -0.269 10439 -0.282 101 40 -0.298 10041 -0.309 56 42 -0.327 4643 -0.333 60 44 -0.357 5845 -0.391 90 46 -0.471 5247 -0.495 89 48 -0.500 5649 -0.577 116 50 -0.580 10151 -0.594 90 52 -0.613 10453 -0.656 50 54 -0.745 3055 -0.755 50 56 -0.762 4557 -0.764 100 58 -0.809 5659 -0.815 104 60 -0.823 4461 -0.840 44 62 -0.934 5863 -0.939 196 64 -1.000 46
Solid Angle Correction and Response Function
In practice, the extended size of the detectors must be taken into consideration in
angular correlation measurements. For our 2000 binary fission experiment with the Gam-
masphere detector array, the252Cf source can be taken to be point-like, but each HPGe
detector has an opening angle of7◦ which is not negligible. Therefore,A2 andA4 need
to be corrected by multiplying solid angle correction factors, which can be theoretically
calculated [Ham75].
Qλ = Jλ/J0. (37)
The Jλ coefficients are evaluated from the solid angle subtended by the detector on the
source and
Jλ =
∫ γ
0
Pλε(α) sinαdα (38)
85

0 30 60 90 120 150 180
θi
0
60
120
180
240
300
360
φi
Figure 57: The polar (θi) and azimuthal (φi) positions of each detector within the Gamma-
sphere array.
whereα is the angle between the photon direction and the detector-source axis. If it is
assumed that the detector response is uniform across its front face and the detection effi-
ciency,ǫ, is independent of the angle at which the photon enters the detectors, then
Jλ = ε
∫ 1
cos γ
Pλ(x)dx (39)
with
J0 = ε(1 − cos γ)
J2 =1
2ε cos γ(1 − cos2 γ)
J3 =1
8(−3 cos γ + 10 cos3 γ − 7 cos5 γ) (40)
For Gammasphere detectors,Q2 andQ4 are calculated to be
Q2 = 0.9779,
Q4 = 0.9278. (41)
86

cos( )q
R(
)K
q
Figure 58: The response functions of five of the 64 angle bins.
For a typical angular correlation measurement, it is necessary to calculate a solid an-
gle correction factorQk for each parameterAk. However, for very low intensity transitions,
the sensitivity of the angular correlation measurement can be improved by determining the
detector response functionRn(θ, E1, E2) for each pair of detectors. For a given detector
pair, the response function describes the distribution of possible angles about the central
angle of the pair as a function of energy. The response functions for each pair can then be
summed to find the response function of each angle bin.
We calculated the response function using a simple Monte Carlo simulation, with
theγ ray transport simulated up to the first collision. This is equivalent to the traditional
calculation ofQk. The mean free path,λ(E), of γ-rays was calculated using the known
Gammasphere detector properties. The energy dependence ofRn(θ, E1, E2) is negligible,
and so onlyRn(θ) was calculated. Examples of response functions for a few bins are shown
in Figure 58.
87

Data Sorting and Fragment Identification
In the November, 2000 run, 182 tapes of data was recorded, with1.1 × 1011 triple-
and higher-fold coincidence events, which is effectively6.6 × 1011 pure triple coincidence
events. For the angular correlation measurements, the data were sorted into 64 two dimen-
sional histograms corresponding to the 64 angle bins, as defined in Table 7. The histograms
were produced by reading the data files event by event. For eachγ − γ coincidence, the
angle between the detectors was calculated and the event was added to the corresponding
histogram. For each angle bin, the histogram was fit to find the coincidence counts for a
givenγ-ray cascade. For each bin, n, the histogram was then fit to find the number of coin-
cidences of the cascade of interest, Nn. This Nn must be corrected for the detector response
functions, relative detector efficiency, and the number of detectors in the particular. The
value for the correctedNn is given by
Nn = εn(E1, E2) ×
∫ π
0
W (θ)Rn(θ, E1, E2) sin(θ)dθ (42)
whereεn(E1, E2) is the relative efficiency of the pair andRn(θ, E1, E2) is the response
function of the pair. As an example, the coincidence peaks of 171.8- and 350.8-keV transi-
tions in106Mo in angle bin 1 and 61 matrices are shown in Figure 59.
Transitions in high-yield fragments from the SF of252Cf can be easily identified. In
the 64 matrices created with full energy ranges, many angular correlations can be measured
directly. However, in some cases, additional gatingγ-rays are required to resolve transitions
in nuclei of interest and reduce contamination fromγ-rays with similar energies. One
example is to measure angular correlations in the ground bands of104Mo and108Mo nuclei.
Partial level scheme of these two nuclei are shown in Figure 60. The 368.6-192.4 keV
cascade in104Mo and 371.0-192.7 keV cascade in108Mo have very similar energies. In the
full two-dimensional matrices, it is hard to resolve correlation peaks in these two nuclei, as
shown in Figure 61. Our solution is to add additional gatingγ-rays to increase selectivity.
The gatingγ-rays come from upper transitions in the nucleus of interest or from its fission
88

166 168 170 172 174 176 178
344346
348350
352354
356
5000
10000
15000
20000
25000
30000
166 168 170 172 174 176 178
344346
348350
352354
356
1000
2000
3000
4000
5000
6000
Figure 59: Coincidence peak of 171.8- and 350.8-keV transitions in106Mo in angle bin
number 1 (top) and 61 (bottom).
89

0 0.0
2 192.4
4 561.0
6 1080.4
8 1721.9
10 2455.9
0 0.0
2 192.7
4 563.7
6 1090.7
8 1752.8
10 2529.4
192.4
368.6
519.4
641.5
734.0 776.6
662.1
527.0
371.0
192.7
104Mo 108Mo
Figure 60: Partial ground bands of104,108Mo.
partners. For example, by taking 519.4- and 641.5-keV transition gates in104Mo to measure
angular correlation between 368.6- and 192.4-keV transitions, and 527.0- and 662.1-keV
transition gates to measure angular correlation between 192.7- and 371.0-keV transitions in
108Mo, we would have much better peak resolutions, as shown in Figure 62. For some cases
to measure weak cascades in these nuclei, we can use additional gates from partner nuclei.
Recall that in SF of252Cf, prompt transitions in complementary nuclei are in coincidence.
Study of binary fission [TA97] [Fon06] [Goo06] have shown that the neutron channels lead
to different yield ratios, and generally the4n channel is the strongest channel. For104Mo,
108Mo, their strongest partners are144Ba and140Ba, respectively. Therefore, for104Mo
and108Mo, transitions in144Ba and140Ba can also be used as additional gates. Software
have been developed to create the 64 histograms with additional gatingγ-rays. Fitting
procedures are same as the measurement from those full matrices.
90

182184186188190192194196198200202
360362
364366
368370
372374
376378
500010000150002000025000300003500040000
Figure 61: In the full matrix, the correlation peaks of 192.4–368.6 keV in104Mo and 192.7–
371.0 keV in108Mo overlap.
Relative Efficiency Correction
After matrices are created, the next step is to fit each matrix to find correlations
counts and fit with Equation 32 to find out those attenuation factors. However, it has been
shown [Pat02] that the efficiencies of the individual detectors of Gammasphere may vary
greatly compared to the mean efficiency.
We have scanned the projection spectrum of each detector. For each one detector,
its normalized detector efficiency curve is calculated by dividing the sum of all detectors.
Two efficiency curves are shown in Figure 63, which shows how the relative efficiency
varies greatly for some detectors. Actually most detectors have similar curves as detector
5. However, some detectors have efficiency curves which vary a lot. This may be related
with the experimental setup. Therefore, for an angle bin, the efficiency is given by
εn(E1, E2) =1
2
∑
i,j
[εi(E1)εj(E2) + εi(E2)εj(E1)], (43)
which is a sum of all detector pairs belonging to this bin. Equation 43 also works as a
smoothing procedure of statistical errors.
91

360362
364366
368370
372374
376378
182184186188190192194196198200202
0500
1000150020002500300035004000
362364
366368
370372
374376
378380
182184186188190192194196198200202
0100200300400500600700800
Figure 62: (Top)Correlation peak 192.4–368.6 keV cascade in104Mo gated by 519.4 and
641.5 keV transitions. (Bottom)Correlation peak of 192.7–371.0 keV cascade in108Mo
gated by 527.0 and 662.1 keV transitions.
92

200 400 600 800 10000,0
0,5
1,0
1,5
E, MeV
Effici
ency
Detector - 57
0,5
1,0
1,5
Detector - 5
Figure 63: Relative efficiencies of detectors 5 and 57.
Fitting Procedure
To determine the angular correlation, each of the 64 histograms was fit to find the
intensity of the peak of interest,Nn. Our method is based on the analysis of two dimen-
sionalγ − γ coincidence spectra given in [TA97]. To fit a given histogram, a window
within the histogram is selected. Within this window, the positions of the peaks are defined
by using projections of the histogram on the two axes. The surface is then approximated
by three types of background and the sum of the two dimensionalγ peaks found in the
projections. The three types of background consist of a smooth background and two series
of ridges parallel to the axes corresponding toγ lines in the x and y direction. The last
part of the fitting procedure is to solve a well known NNLS (Non-Negative Least Square)
problem [Law74].
Using theN expn found from fitting the histograms,we can estimate the two parame-
93

)θcos(-1 -0.8 -0.6 -0.4 -0.2 0 0.2 0.4 0.6 0.8 10
0.05
0.1
0.15
0.2
0.25
0.3
0.35
0.4
0.45
Figure 64: The response functions of the 17 groups in the ideal case when all 110 detectors
are present and have the same efficiency.
tersAexp2 andAexp
4 using the minimization expression
min∑
n
(N exp(θn) − N(θn))2
δ2n,exp + δ2
n,model
(44)
The experimental uncertainty in theγ peak intensity is always much greater than
the model error, soδmodel was neglected. Once the experimentalA2 andA4 are found, the
g-factor can be calculated by using the procedure outlined in the previous sections.
In practice, a set of 64 experimental points is more than adequate to estimate the
three parameters in Equation 35, and it is therefore convenient to further combine angle
bins, thereby increasing the statistics of each bin. Note that the minimization approach did
not assume that all the pairs of a group must have the same angle. This means we can group
the angle bins into even larger groups by using the equation
Ngrα=
∑
n
ǫn(E1, E2) ×
∫ π
0
W (θ)∑
n
Rn(θ)sin(θ)dθ (45)
94

TheNgrαcan be obtained in two different ways. The most straightforward way is to sum
theNn values given by Equation 42 for some grouping. Another way is to sum the two-
dimensional histograms by this grouping and then fit the histograms in the same way asNn
to find Ngrα. The results of the two methods are nearly identical in most cases. However,
for very weakly populated decays, it is necessary to use the second method to better resolve
the peak of interest. In both cases, we grouped the 64 angle bins into 17 larger bins. The
response function for each of the 17 groups is presented in Figure 64, which shows the
angular position and resolution of the bins.
95

Prompt Angular Correlations Measurements
Several cases have been shown in Chapter. 3 for spin/parity assignments using this
technique. For a given cascade, if the lifetime of the intermediate state is much less than
the order ofnanosecond, the perturbation effect, or the attenuation of the angular corre-
lation, will be very small. The measured angular correlation coefficients will be same as
theoretical values. By comparing measured angular correlation coefficients with theoreti-
cal predictions [Tay71], we can get evidence to support spin/parity assignments, as we have
shown in the previous chapter. Here one strong cascade is given to show the validity of this
technique. For the6+ → 4+ → 2+, 486.6 – 326.5 keV cascade in the ground-state band
of 102Zr , the lifetime of the4+ state in the ground band of102Zr is around 30∼ 50 ps.
So the attenuation of angular correlations of the 486.6 – 326.5 keV cascade should be very
small. Matrices were created for this cascade by gating on otherγ-rays in this band. The
fitting curve is shown in Figure 65. The experimental angular correlation coefficients are
Aexp2 = 0.099(7) andAexp
4 = 0.004(10), which are consistent with the theoretical values
of Athe2 = 0.102 andAthe
4 = 0.009 for a quadrupole – quadrupole cascade within error
bar [Tay71]. More measurements of similar “prompt” cascades confirmed this technique
as well.
A set of∆I = 1 doublet bands recently observed in106Mo were proposed as chiral
doublets, but the spins and parities were assigned tentatively. With the technique developed,
we are able to measure angular correlations of some cascades involved with these bands. A
partial level scheme of106Mo is shown in Figure 66. Relative intensities ofγ-ray transitions
in 106Mo have been measured. We will measure some cases which have relatively high
intensities.
The first cascade we measured is the 517.5 – 724.4 keV cascade, proposed with a
5− → 4+ → 2+ spin configuration. Therefore, a dipole-quadrupole correlation is expected,
with theoretical coefficients ofAthe2 = −0.07 andAthe
4 = 0. As shown in Figure 67, the
measured angular correlation coefficients areAexp2 = −0.088(17), andAexp
4 = −0.004(25).
96

)θcos(-1 -0.5 0 0.5 1
Rel
ativ
e u
nit
s
72
74
76
78
80
82E: 486.6 - 326.5
0.00719±A2 = 0.0994 0.01082±A4 = 0.0045
Figure 65: Angular correlation curve of 486.6 and 326.5 keV transitions in the ground-state
band of102Zr.
3 885.4
4 1068.0
5 1307.0
6 1563.4
7 1868.4 41937.052090.6
62276.5
72499.0
82746.6
93041.7
103349.8
(12 )4049.4
5 1952.4
6 2142.9
7 2369.5
8 2630.1
9 2922.3
10 3239.5
11 3592.8
12 3946.4
(13 ) 4372.7
(14 ) 4753.2
41434.9
51657.9
61910.5
72199.8
113707.7
4522.6
2 710.5
2171.800.0
1051.6
339.5
517.5
724.4
ground state band
(4)
(5)
Figure 66: Partial level scheme of106Mo to show the decay patterns of chiral bands intoγ
andγγ bands.
97

)θcos(-1 -0.5 0 0.5 1
Rel
ativ
e u
nit
s
33
34
35
36
37
38
39
40
41
42
E: 517.5 - 724.4
0.01655±A2 = -0.0876
0.02496±A4 = -0.0037
)θcos(-1 -0.5 0 0.5 1
Rel
ativ
e u
nit
s
33
34
35
36
37
38
39
40
41
42
E: 517.5 - 724.4
0.01655±A2 = -0.0876
0.02496±A4 = -0.0037
)θcos(-1 -0.5 0 0.5 1
Rel
ativ
e u
nit
s
33
34
35
36
37
38
39
40
41
42
E: 517.5 - 724.4
0.01655±A2 = -0.0876
0.02496±A4 = -0.0037
Figure 67: Angular correlations of 517.5 and 724.4 keV transitions in106Mo.
Compared with theoretical values, this result confirms the spin and parity of the 1952.4
keV state to be5−, since the 517.5-keV transition shows property of a dipole transition.
Therefore, we have determined the spins and parities of states in band (5).
Angular correlation of the 339.5 – 1051.5 keV cascade has been measured as well,
as shown in Figure 68. However, this cascade is relatively weaker, which leads to a result
of Aexp2 = −0.066(47), andAexp
4 = −0.024(70). Different gatingγ-rays were used to
measure this angular correlation, and we have found that all yieldedAexp2 ≈ −0.07 to
−0.13 andAexp4 ≈ 0. This negativeAexp
2 indicates the spin/parity of this cascade to be
6−(Q)4−(D)3+, to be consistent with the theoreticalAthe2 = −0.07 andAthe
4 = 0 for this
kind of sequence. Attempts to assign other different spin/parity configurations would lead
to disagreement between experimental and theoretical values.
The proposal of chiral vibrational bands for band (4) and in106Mo is also supported
by theoretical calculations, which are not going to be discussed in this dissertation. Now
with angular correlation measurements, we are more convinced that these bands are the
98

)θcos(-1 -0.5 0 0.5 1
Rel
ativ
e u
nit
s
12
13
14
15
16
17
18
E: 1051.6 - 339.5 0.04677±A2 = -0.0660 0.07083±A4 = -0.0241
Figure 68: Angular correlations of 339.5 and 1051.2 keV transitions in106Mo.
first chiral vibrational bands in an even-even nucleus.
99

Theg-factor Measurements
Theg-factor values are extracted from measured delayed angular correlations , us-
ing techniques discussed above. These measurements were performed by scanning the
November run experimental data. To increase the selectivity, matrices were created with
additionalγ gates. For each nucleus, different sets of gatingγ-rays were compared to get
a best selectivity. We assumed that the HFFs are those of an ion implanted in a substitu-
tional site in the lattice [Rao79], shown in Figure 55. Lifetimes of the nuclei of interest
were quoted in different references, most of which can be found on National Nuclear Data
Center website.
From Equation 34, we have found out the solutions of the precession angles in the
form of
φ = ±
√
15 − 25G2 ±√
145 − 270G2 + 45 ∗ G22
8(5G2 − 1)(46)
whereG2 is the attenuation factor. There are four solutions ofφ. We take the rational
positive solutions to calculate the average precession angles. Once the precession angle is
determined, the magnitude ofg-factor values are given by
|g| =φ~
µNBτ(47)
Theg-factor values of several2+ states in even-even neutron-rich nuclei from spon-
taneous fission of252Cf have been studied using the technique discussed above. In these
data analysis, the gatingγ-rays were selected carefully, to gain best statistics with least
contaminations. Different gates were used to confirm the results.
The fitting results of delayed cascades in some even-even nuclei are listed in Figure
69, 70, 71, 72, 73, 74, 75, 76, 77, 78, 79, 80. Gatingγ-rays for each case are listed in Table
8. As shown in Table 8, for most cases, transitions from the same cascades are enough to
generate enough statistical data for angular correlation measurements. For the102Zr case,
transitions from its partner isotopes were used.
100

Table 8: List of cascades and gating gamma-rays to measureg-factor values.
Nucleus Iπ Cascade (keV) Gatingγ-rays (keV)
100Zr 2+ 352.0–212.6 497.2, 625.4
102Zr 2+ 326.5–151.8 486.6, 630.5 (102Zr)
158.5, 295.0, 386.2 (148Ce)
117.6, 283.5 (147Ce)
258.3, 409.7 (146Ce)
104Mo 2+ 368.6–192.4 519.4, 641.7
106Mo 2+ 350.8–171.8 511.0, 654.9, 784.0
108Mo 2+ 371.0–192.7 527.0, 662.1
108Ru 2+ 422.3–242.1 574.6, 701.7
110Ru 2+ 422.2–240.7 575.9, 705.4
112Ru 2+ 408.4–236.6 544.9, 705.4
144Ba 2+ 330.8–199.0 431.4, 509.3
146Ba 2+ 332.6–181.3 444.6, 524.3
146Ce 2+ 409.6–258.3 503.2, 565.2, 515.0
148Ce 2+ 294.9–158.5 386.2, 450.8, 501.3
101

)θcos(-1 -0.5 0 0.5 1
Rel
ativ
e u
nit
s
104
106
108
110
112
114
116
118
120
122
E: 352.0 - 212.6
0.00564±A2 = 0.0851
0.00855±A4 = 0.0145
)θcos(-1 -0.5 0 0.5 1
Rel
ativ
e u
nit
s
104
106
108
110
112
114
116
118
120
122
E: 352.0 - 212.6
0.00564±A2 = 0.0851
0.00855±A4 = 0.0145
)θcos(-1 -0.5 0 0.5 1
Rel
ativ
e u
nit
s
104
106
108
110
112
114
116
118
120
122
E: 352.0 - 212.6 0.00564±A2 = 0.0851 0.00855±A4 = 0.0145 0.0743±GF = 0.3297
Figure 69: Angular correlations of 352.0-212.6 keV cascade in100Zr.
)θcos(-1 -0.5 0 0.5 1
Rel
ativ
e u
nit
s
150
155
160
165
170E: 326.5 - 151.8
0.00694±A2 = 0.0546
0.01064±A4 = 0.0057
)θcos(-1 -0.5 0 0.5 1
Rel
ativ
e u
nit
s
150
155
160
165
170E: 326.5 - 151.8
0.00694±A2 = 0.0546 0.01064±A4 = 0.0057 0.0460±GF = 0.2347
Figure 70: Angular correlations of 326.5- and 151.8-keV transitions in102Zr.
102

)θcos(-1 -0.5 0 0.5 1
Rel
ativ
e u
nit
s
150
155
160
165
170
175
E: 368.6 - 192.4
0.00492±A2 = 0.0823
0.00740±A4 = 0.0155
)θcos(-1 -0.5 0 0.5 1
Rel
ativ
e u
nit
s
150
155
160
165
170
175
E: 368.6 - 192.4 0.00492±A2 = 0.0823 0.00740±A4 = 0.0155 0.0524±GF = 0.2944
Figure 71: Angular correlations of 368.6- and 192.4-keV transitions in104Mo.
)θcos(-1 -0.5 0 0.5 1
Rel
ativ
e u
nit
s
114
116
118
120
122
124
126
128
130
E: 350.8 - 171.8 0.00559±A2 = 0.0670
0.00845±A4 = 0.0107
)θcos(-1 -0.5 0 0.5 1
Rel
ativ
e u
nit
s
114
116
118
120
122
124
126
128
130
E: 350.8 - 171.8 0.00559±A2 = 0.0670 0.00845±A4 = 0.0107 0.0428±GF = 0.2732
Figure 72: Angular correlations of 350.8- and 171.8-keV transitions in106Mo.
103

)θcos(-1 -0.5 0 0.5 1
Rel
ativ
e u
nit
s
24
25
26
27
28
29E: 371.0 - 192.7
0.01279±A2 = 0.0816
0.01918±A4 = -0.0039
)θcos(-1 -0.5 0 0.5 1
Rel
ativ
e u
nit
s
24
25
26
27
28
29
E: 371.0 - 192.7
0.01279±A2 = 0.0816
0.01918±A4 = -0.0039
)θcos(-1 -0.5 0 0.5 1
Rel
ativ
e u
nit
s
24
25
26
27
28
29E: 371.0 - 192.7
0.01279±A2 = 0.0816 0.01918±A4 = -0.0039 0.1972±GF = 0.4342
Figure 73: Angular correlations of 371.0- and 192.7-keV transitions in108Mo.
)θcos(-1 -0.5 0 0.5 1
Rel
ativ
e u
nit
s
94
96
98
100
102
104
106
108
110
E: 422.3 - 242.1
0.00805±A2 = 0.0927
0.01212±A4 = 0.0162
)θcos(-1 -0.5 0 0.5 1
Rel
ativ
e u
nit
s
94
96
98
100
102
104
106
108
110
E: 422.3 - 242.1 0.00805±A2 = 0.0927 0.01212±A4 = 0.0162 0.1034±GF = 0.2032
Figure 74: Angular correlations of 422.3- and 242.1-keV transitions in108Ru.
104

)θcos(-1 -0.5 0 0.5 1
Rel
ativ
e u
nit
s
175
180
185
190
195
200
205
210
E: 422.2 - 240.7
0.00895±A2 = 0.0820
0.01376±A4 = 0.0161
)θcos(-1 -0.5 0 0.5 1
Rel
ativ
e u
nit
s
175
180
185
190
195
200
205
210
E: 422.2 - 240.7 0.00895±A2 = 0.0820 0.01376±A4 = 0.0161 0.1228±GF = 0.3825
Figure 75: Angular correlations of 422.2- and 240.7-keV transitions in110Ru.
)θcos(-1 -0.5 0 0.5 1
Rel
ativ
e u
nit
s
43
44
45
46
47
48
49
50
51
E: 408.4 - 236.6 0.00898±A2 = 0.0766 0.01357±A4 = -0.0119
)θcos(-1 -0.5 0 0.5 1
Rel
ativ
e u
nit
s
43
44
45
46
47
48
49
50
51
E: 408.4 - 236.6 0.00898±A2 = 0.0766 0.01357±A4 = -0.0119 0.1213±GF = 0.4288
Figure 76: Angular correlations of 408.4- and 226.6-keV transitions in112Ru.
105

)θcos(-1 -0.5 0 0.5 1
Rel
ativ
e u
nit
s
285
290
295
300
305
310
315
320
E: 330.8 - 199.0 0.00376±A2 = 0.0645 0.00572±A4 = 0.0090
)θcos(-1 -0.5 0 0.5 1
Rel
ativ
e u
nit
s
285
290
295
300
305
310
315
320
E: 330.8 - 199.0 0.00376±A2 = 0.0645 0.00572±A4 = 0.0090 0.1614±GF = 1.5491
Figure 77: Angular correlations of 330.8- and 199.0-keV transitions in144Ba.
)θcos(-1 -0.5 0 0.5 1
Rel
ativ
e u
nit
s
51
52
53
54
55
56
57
58
59
60
E: 332.6 - 181.3 0.00777±A2 = 0.0708 0.01178±A4 = 0.0050 0.2409±GF = 1.0713
Figure 78: Angular correlations of 332.6- and 181.3-keV transitions in146Ba.
106

)θcos(-1 -0.5 0 0.5 1
Rel
ativ
e u
nit
s
145
150
155
160
165
170
E: 409.6 - 258.3 0.00466±A2 = 0.0888 0.00702±A4 = 0.0142
)θcos(-1 -0.5 0 0.5 1
Rel
ativ
e u
nit
s
145
150
155
160
165
170
E: 409.6 - 258.3 0.00466±A2 = 0.0888 0.00702±A4 = 0.0142 0.0223±GF = 0.1002
)θcos(-1 -0.5 0 0.5 1
Rel
ativ
e u
nit
s
145
150
155
160
165
170
E: 409.6 - 258.3 0.00466±A2 = 0.0888 0.00702±A4 = 0.0142 0.0900±GF = 0.4044
Figure 79: Angular correlations of 409.6- and 258.3-keV transitions in146Ce.
)θcos(-1 -0.5 0 0.5 1
Rel
ativ
e u
nit
s
124
126
128
130
132
134
136
E: 294.9 - 158.5 0.00599±A2 = 0.0462 0.00910±A4 = -0.0024
)θcos(-1 -0.5 0 0.5 1
Rel
ativ
e u
nit
s
124
126
128
130
132
134
136 E: 294.9 - 158.5 0.00599±A2 = 0.0462 0.00910±A4 = -0.0024 0.0713±GF = 0.3806
Figure 80: Angular correlations of 294.5- and 158.5-keV transitions in148Ce.
107

Table 9: Measuredg-factors of excited states in neutron-rich nuclei produced from sponta-
neous fission of252Cf.
Nucleus I(π) τ (ns) B (T) g gref
100Zr 2+ 0.78(3) 27.4(4) 0.33(7) 0.30(3)a 0.26(6)b
102Zr 2+ 2.76(36) 27.4(4) 0.23(5) 0.22(5)a
104Mo 2+ 1.040(59) 25.6(1) 0.29(5) 0.27(2)a
106Mo 2+ 1.803(43) 25.6(1) 0.27(4) 0.21(2)a
108Mo 2+ 0.721(433) 25.6(1) 0.43(20) 0.5(3)a
108Ru 2+ 0.498(43) 47.8(1) 0.20(10) 0.23(4)a
110Ru 2+ 0.433(29) 47.8(1) 0.38(12) 0.44(7)a
112Ru 2+ 0.462(43) 47.8(1) 0.43(12) 0.44(9)a
144Ba 2+ 1.024(29) 8.5(14) 1.55(16) 0.34(5)c 0.34(5)d
146Ba 2+ 1.241(43) 8.5(14) 1.07(24) 0.20(10)c 0.28(7)d
146Ce 2+ 0.361(43) 41.0(2) 0.40(9) 0.46(34)c 0.24(5)e
148Ce 2+ 1.457(87) 41.0(2) 0.38(7) 0.37(6)c 0.37(6)e
a[Smi04] b[Wol89] c[Smi99] d[Wol83] e[Gil86]
From the perturbed angular correlation measurements, we are able to find out the
precession angles. And if we have determined lifetimes of the excited states and hyperfine
field strengths for these isotopes, we can solve out theg-factors from Equation 47. The
measuredg-factor values are tabulated in Table 9. Previously reportedg-factor values are
listed as well. The hyperfine field taken to calculateg-factors are same as [Smi04] and
related references. We noticed a large discrepancy for Ba isotopes. This is an evidence that
the hyperfine field for Barium implanted in iron might be quite different from that given in
[Pat02] and [Smi04].
108

Discussion
Zr isotopes
For the measurement of theg-factor of the2+ state in100Zr, we took the lifetime
as 0.78(3)ns [Fir96] and hyperfine field of Zr in iron as -27.4(4)T [Are79]. The measured
g(2+) of 100Zr, 034(7), is consistent with reported values [Wol89] [Smi04]. For102Zr, we
took the lifetime of2+ state as 2.76(36) ns [Fir96] and theg(2+) is measured as 0.23(5),
which is consistent with [Smi04]. A comparison of these measurements with previous
measurements is plotted in Figure 81.
In A ∼ 100 region, Zr isotopes exhibit a subshell closure atN = 56, 58 [Ham95],
with a sudden onset of deformation atN = 60. This is reflected in the ratios of the energies
of the first4+ and2+ states, which are close to a rotating, charged object. As shown in
Figure 81, theg(2+) values are close, but do not overlap the liquid-drop model prediction
of Z/A, which are 0.40 and 0.39 for100,102Zr, respectively.
Wolf et al. [Wol89] interpreted theg(2+) values ofN = 60 isotones,98Sr,100Zr and
102Mo in terms of bother the hydrodynamic model and the IBA-2 model. They suggested
thatNπ = 0 for 100Zr, which means that theZ = 40 sub-shell closure was still active for
100Zr. Zhao et al. [Zha95] calculated the effective boson numbers,Nπ andNν , according
to experimental data on energy spectra and electromagnetic transitions probabilities. They
foundNπ = 1, Nν = 4 for 98Zr but Nπ = 3, Nν = 5, 6 for 100,102Zr. The conclusion was
that theZ = 40 sub-shell closure was destroyed atN = 60. This is due to the transition
from spherical to deformed shapes aroundN = 60 for Zr isotopes.
Mo isotopes
As shown in Figure 82, the measuredg-factor values of2+ states in104,106,108Mo
isotopes are in excellent agreement with previous measurements [Smi04]. Located above
theZ = 40 andN = 56, 58 sub-shell closures, and at the middle of major shells, we would
109

59 60 61 62 63
0.10
0.15
0.20
0.25
0.30
0.35
0.40
0.45
0.50
This Experiment
[Sim04]
[Wol89]
Z/A
g(2
+)
Neutron Number
Figure 81: Measuredg(2+) in Zr nuclei in this experiment, with comparison of previous
data andZ/A.
expect collective properties in these nuclei, withg-factors of2+ states approachingZ/A.
However, the measuredg(2+) in 104,106Mo are apparently lower thanZ/A. And atN = 64,
the sub-shell closure seems to be very significant for neutron-rich Mo isotopes. These Mo
nuclei are widely accepted asγ-soft rotors, which are not quite fully collective rotational
nuclei. Another explanation for this fall ing(2+) is contributions from theh11/2 intruder
orbital [Smi04].
Ru isotopes
The measured2+ stateg-factors for Ru isotopes are plotted in Figure 83. The new
measurements are in good agreement with previous results [Smi04]. We have confirmed
that theg(2+) drop at theN = 64 sub-shell closure, as well as observed in Mo isotopes.
110

62 63 64 65 66
0.1
0.2
0.3
0.4
0.5
0.6
0.7
0.8
0.9
This experiment
[Sim04]
Z/A
g(2
+)
Neutron Number
Figure 82: Measuredg(2+) in Mo nuclei in this experiment, with comparison of previous
data andZ/A.
63 64 65 66 67 68 69
0.0
0.1
0.2
0.3
0.4
0.5
0.6 This experiment
[Sim04]
Z/A
g(2
+)
Neutron Number
Figure 83: Measuredg(2+) in Ru nuclei in this experiment, with comparison of previous
data andZ/A.
111

87 88 89 90 910.05
0.10
0.15
0.20
0.25
0.30
0.35
0.40
0.45
0.50
This Experiment
[Sim99]
[Wol83]
Z/A
g(2
+)
Neutron Number
Figure 84: Measuredg(2+) in Ba nuclei in this experiment, with comparison of previous
data andZ/A.
Ba isotopes
As shown in Table 9, the measured2+-stateg-factors for144,146Ba are about 5 times
larger than reported values in [Wol83] and [Smi99]. The impurity hyperfine field for Bar-
ium in iron was measured to be 8.5T [Kug70] [Rao79]. This value is used to measure
g-factors in [Smi04]. Since this technique has been approved by several measurements, the
only explanation is that the hyperfine field for Barium in iron is much larger than it was
taken. Both [Wol83] and [Smi99] measured the2+-stateg-factor of 144Ba to be 0.34(5).
Therefore, this value is used to calibrate our data, with the2+-stateg-factors of144,146Ba
to be 0.34(4) and 0.23(5). The correctedg-factor of146Ba agrees well with previous mea-
surements in [Wol83] and [Smi99]. A comparison of these results is shown in Figure 84.
The hyperfine field for Ba in iron becomes∼38.8T. These results raise questions for future
theoretical and experimental work.
In Wolf et al’s work [Wol83], they combinedg(2+) of 144,146Ba with neighboring
112

87 88 89 90 910.0
0.1
0.2
0.3
0.4
0.5
0.6
0.7
0.8
0.9
1.0
This Experiment
[Sim99]
[Wol83]
Z/A
g(2
+)
Neutron Number
Figure 85: Measuredg(2+) in Ce nuclei in this experiment, with comparison of previous
data andZ/A.
Nd, Sm and Gd isotopes in order to investigate the IBM model in this region. They deduced
thatgπ = +0.76(10) andgν = +0.20(11) only after allowing for a sharp change inNπ at
N = 90. This change is due to theZ = 64 sub-shell closure atN = 90. But Barium
isotopes are closer to theZ = 50 shell closure, with no affect from theZ = 64 sub-shell
closure effect.
Ce isotopes
The measurements of2+-stateg-factors of146,148Ce are in good agreement with
previous results. Our data for146Ce is more close to [Smi04], as plotted in Figure 85.
Our data agree perfectly with collective model predictions, since the even-even Cerium
isotopes undergo a transition from vibrational to rotational-like structure as the number
of neutrons change fromN = 86 to 92 [Cas81]. This transition is attributed to neutron-
proton interaction between spin-orbit partner states, which causes protons to occupy the
113

h11/2 orbitals when theh9/2 neutron orbit begins to be filled nearN = 90. The resulting
πh11/2 − νh9/2 interaction induces a rapid onset of deformation, similar to the situation in
theA ∼ 100 region.
In Gill et al.’s work, they fit with the IBA-2 model withgπ = −0.64 ± 0.04 and
gν = 0.05 ± 0.05. They assumedNν = 3 and 4 for146Ce and148Ce, respectively and
obtainedN effπ = 1.5 ± 0.6 for 146Ce andN eff
π = 4.9 ± 2.1 for 148Ce. These values are
consistent with Castenet al. [Cas81], who proposed the abrupt eradication of theZ = 64
sub-shell for N≥ 90.
Conclusion
In this chapter, we introduced the theoretical background, technical details and re-
cent results to measureγ-ray angular correlations andg-factors in neutron-rich nuclei pro-
duced from the spontaneous fission of252Cf. The theoretical prediction of nuclearg-factors
from different nuclear models were given. The angular correlation theory was described.
For the measurement ofg-factors, perturbed angular correlation techniques were intro-
duced. The angular properties, response functions and relative efficiencies of Gammas-
phere detectors were investigated in details. The technique to increment and fit angular
correlation matrices were described.
The angular correlations of two prompt cascades in the chiral bands of106Mo were
investigated. The measured angular correlation coefficients supported the proposed spin
and parity assignments. The2+-stateg-factors in several neutron-rich nuclei,100,120Zr,
104,106,108Mo, 108,110,112Ru, 144,146Ba, and146,148Ce, were measured. For Zr, Mo, Ru, and
Ce isotopes, the measured2+-stateg-factors are consistent with previous data. For Ba
isotopes, theg-factors were calibrated, and a new value of the impurity hyperfine field
for Ba isotopes in Fe host was proposed. The measuredg-factors were compared with
collective model predictions as well as other nuclear models.
114

CHAPTER V
SUMMARY
This dissertation is mainly based on 2000 binary fission experimental data. With the
Gammasphere detector array, we accumulated a large amount of data for detailed nuclear
structure analysis,γ-ray angular correlation measurements andg-factor measurements.
By analyzing our 2000 binary fission data, structure of several neutron-rich nuclei
were studied. The level scheme of88Kr was extended to a 7169.4-keV state, spins and
parities were assigned by following the level systematics in theN = 52 isotones,86Se
and90Sr. The level scheme of90Kr was extended, with several new transitions and states
identified. Angular correlation measurements confirmed the3− assignment to the 1506.7-
keV level in90Kr, in agreement with reported data. The lack of systematics in theN = 54
isotones,90Kr and 92Sr, provides insight into this region and indicates the requirement of
further experimental and theoretical investigation. A few new transitions were observed in
92Kr as well. No new transition or state was identified in94Kr, due to its low yield. In102Zr,
three new collective band structures were identified. Angular correlation measurements
were performed to assign spins and parities. In the neutron-rich114Ru, the ground-state
band andγ-band were extended. A new band was identified and proposed as a two-phonon
γ-band, by comparing band-head energies with its neighboring even-even Ru isotopes.
Cranked Shell Model calculations indicate that the band-crossing of ground-state band in
114Ru is from alignment of twog9/2 protons, instead of alignment of twoh11/2 neutrons as
found in 108−112Ru. The staggering pattern of theγ-band indicates a rigid triaxial shape
in 114Ru. The level scheme of138Cs was constructed for the first time in this work, with
that of137Cs extended with several new transitions. Spins, parities and configurations were
assigned to the levels of138Cs based on total internal conversion coefficient measurements
of the low-energy transitions, shell-model calculations, angular correlation measurements
115
and level systematics. Shell Model calculations were performed with results in agreement
with experimental data. Similarities were observed for theN = 82 isotones,137Cs and135I
as well as theN = 83 isotones,138Cs and136I. The Shell-Model calculations indicate the
important role played by the coupling between the excitation of the fifth proton outside the
Z = 50 major shell and thef7/2 neutron outside theN = 82 major shell.
In our 2000 binary fission experiment, the252Cf source was sandwiched between
Fe foils. For prompt cascades, we are able to measure angular correlations. The com-
parison between the measured angular correlation coefficients with theoretical values help
us to assign spin/parity configurations. The angular correlations of two prompt cascades
in the chiral bands of106Mo were investigated. The measured angular correlation coef-
ficients supported the proposed spin and parity assignments. For delayed cascades,γ-ray
angular correlations are perturbed, which is described by the attenuation factors. The atten-
uation factors are used to extract theg-factors of the intermediate state. By measuring per-
turbed angular correlations, the2+-stateg-factors of several neutron-rich nuclei,100,120Zr,
104,106,108Mo, 108,110,112Ru, 144,146Ba, and146,148Ce, were measured. For Zr, Mo, Ru, and
Ce isotopes, the measured2+-stateg-factors are consistent with previous data. For Ba iso-
topes, theg-factors were calibrated, and a new value of the impurity hyperfine field for Ba
isotopes in Fe host was proposed. The measuredg-factors were compared with collective
model predictions as well as other nuclear models.
116

BIBLIOGRAPHY
[Are79] Arends, A. R. and Pleiter, F.,Hyp. Int., vol. 7(1), (1979) 361.
[Ari75] Arima, A. and Iachello, F.,Phys. Rev. Lett., vol. 35(16), (1975) 1069.
[Bha97] Bhattacharyya, P., Zhang, C. T., Fornal, B.et al., Phys. Rev. C, vol. 56(5), (1997) R2363.
[Bro99] Broda, R., Fornal, B., Daly, P. J.et al., Phys. Rev. C, vol. 59(6), (1999) 3071.
[Car74] Carlson, G. H., Talbert, W. L., and McConnell, J. R.,Phys. Rev. C, vol. 9(1), (1974) 283.
[Cas81] Casten, R. F., Warner, D. D., Brenner, D. S.et al., Phys. Rev. Lett., vol. 47(20), (1981)
1433.
[Che70] Cheifetz, E., Jared, R., Thompson, S.et al., Phys. Rev. Lett, vol. 25, (1970) 38.
[Che04] Che, X., Zhu, S., Hamilton, J.et al., Chin. Phys. Lett, vol. 21, (2004) 1904.
[Che06] Che, X., Zhu, S., Hamilton, J.et al., Chin. Phys. Lett, vol. 23, (2006) 328.
[Cor05] Coraggio, L., Covello, A., Gargano, A.et al., Phys. Rev. C, vol. 72, (2005) 057302.
[Cor06] Coraggio, L., Covello, A., Gargano, A.et al., Phys. Rev. C, vol. 73, (2006) 031302.
[Cov07] Covello, A., Coraggioa, L., Gargano, A.et al., Prog. Part. Nucl. Phys., vol. 59, (2007)
401.
[Dal99] Daly, P., Bhattacharyya, P., Zhang, C. T.et al., Phys. Rev. C, vol. 59(6), (1999) 3066.
[Dan07] Daniel, A. V., Goodin, C., Li, K.et al., Nucl. Instrum. Methods Phys. Res. B, vol. 262,
(2007) 399.
[Dev96] Devi, R. and Khosa, S.,Phys. Rev. C, vol. 54, (1996) 1661.
[Dur95] Durell, J., Phillips, W., Pearson, C.et al., Phys. Rev. C, vol. 52, (1995) R2306.
[Fir96] Firestone, R. and Shirley, V.,Table of Isotopes, 8th ed.(Wiley, 1996).
117

[Fon06] Fong, D., Hamilton, J. H., Ramayya, A. V.et al., Physics of Atomic Nuclei, vol. 69(7),
(2006) 1161.
[For01] Fornal, B., Broda, R., Daly, P. J.et al., Phys. Rev. C, vol. 63(2), (2001) 024322.
[Gil86] Gill, R. L., Warner, D. D., Mach, H.et al., Phys. Rev. C, vol. 33(3), (1986) 1030.
[Goo06] Goodin, C., Fong, D., Hwang, J. K.et al., Phys. Rev. C, vol. 74(1), (2006) 017309.
[Gre66] Greiner, W.,Nucl. Phys., vol. 80, (1966) 417.
[Ham75] Hamilton, W., The Electromagnetic Interaction in Nuclear Spectroscopy(North-
Holland, 1975).
[Ham89] Hamilton, J.,Treatise on Heavy-ion Science(Plenum Publishing Corp., 1989), vol. 8,
chap. 1, 3–98.
[Ham95] Hamilton, J., Ramayya, A., Zhu, S.et al., Prog. Part. Nucl. Phys., vol. 35, (1995) 635.
[Hil91] Hill, J. C., Schwellenbach, D., Wohn, F.et al., Phys. Rev. C, vol. 43, (1991) 2591.
[Hot91] Hotchkis, M., Durell, J., Fitzgerald, J.et al., Nucl. Phys. A, vol. 530, (1991) 111.
[Hua04] Hua, H., Wu, C., Cline, D.et al., Phys. Rev. C, vol. 69, (2004) 014317.
[Hwa06a] Hwang, J., Ramayya, A., Hamilton, J.et al., Phys. Rev. C, vol. 73, (2006) 044216.
[Hwa06b] Hwang, J., Ramayya, A., Hamilton, J.et al., Phys. Rev. C, vol. 74, (2006) 017303.
[Jia03] Jiang, Z., Zhu, S., Hamilton, J.et al., Chin. Phys. Lett, vol. 20, (2003) 350.
[Jon06] Jones, E. F., Gore, P. M., Hamilton, J. H.et al., Phys. Rev. C, vol. 73, (2006) 017301.
[Kug70] Kugel, H. W., Polga, T., Kalish, R.et al., Phys. Lett. B, vol. 32, (1970) 463.
[Law74] Lawson, C. and Hanson, R.,Solving Least Square Problems(Prentice-Hall, 1974).
[LCC71] L. C. Carraz, E. M. and Moussa, A.,Nucl. Phys. A, vol. 171, (1971) 209.
[Lee97] Lee, I. Y.,Prog. Part. Nucl. Phys., vol. 38, (1997) 65.
118

[Lhe01] Lhersonneau, G., Pfeiffer, B., Gabelmann, H.et al., Phys. Rev. C, vol. 63, (2001)
054301.
[Luo01] Luo, Y., Rasmussen, J., Ramayya, A.et al., Phys. Rev. C, vol. 64(5), (2001) 054306.
[Luo02] Luo, Y., Rasmussen, J., Hamilton, J.et al., in Proceedings of the Third International
Conference: Fission and Properties of Neutron-rich Nuclei, edited by Hamilton, J., Ra-
mayya, A., and Carter, H. (2002), 310.
[Luo04] Luo, Y., Rasmussen, J. O., Hamilton, J. H.et al., Phys. Rev. C, vol. 70(4), (2004) 044310.
[Luo05] Luo, Y., Rasmussen, J., and Stefanescu, I.,J. Phys. G: Nucl. Part. Phys., vol. 31.
[Luo06] Luo, Y., Hamilton, J. H., Rasmussen, J. O.et al., Phys. Rev. C, vol. 74(2), (2006) 024308.
[Luo08] Luo, Y., Zhu, S., and Hamilton, J.,Euro. Phys. J. A. submitted.
[Mac01] Machleidt, R.,Phys. Rev. C, vol. 63(2), (2001) 024001.
[Mat65] Matthias, E., Rosenblum, S., and Shirley, D.,Phys. Rev. Lett, vol. 14, (1965) 46.
[May55] Mayer, M. and Jensen, J.,Elementary Theory of Nuclear Shell Structure(John Wiley
and Sons, Inc., 1955).
[Mol95] Moller, P., Nix, J. R., Myers, W. D.et al., At. Data and Nuc. Data Tab., vol. 59, (1995)
185.
[Pat02] Patel, D., Smith, A., Simpson, G.et al., J. Phys. G: Nucl. Part. Phys., vol. 28, (2002)
649.
[Pra87] Prade, H., Enghardt, W., Dioszegi, I.et al., Nucl. Phys. A, vol. 65(1472), (1987) 381.
[Rac51] Racah, G.,Phys. Rev., vol. 82, (1951) 309.
[Rad95] Radford, D.,Nucl. Instrum. Methods Phys. Res. A, vol. 361, (1995) 297.
[Rao79] Rao, G.,Hyperfine Interactions, vol. 7, (1979) 141.
[RU00] Rzaca-Urban, T., Urban, W., Kaczor, A.et al., Eur. Phys. J. A, vol. 9, (2000) 165.
119

[Sah01] Saha, S. K., Constantinescu, C., Daly, P. J.et al., Phys. Rev. C, vol. 65(1), (2001) 017302.
[Sam84] Sambataro, M., Scholten, O., Dieperink, A. E. L.et al., Nucl. Phys. A, vol. 423, (1984)
333.
[Sch37] Schmidt, T.,Z. Phys., vol. 106, (1937) 358.
[Sha94] Shannon, J., Phillips, W., Durell, J.et al., Phys. Lett. B, vol. 334, (1994) 136.
[Sie65] Siegbahn, K.,Apha-, Beta- and Gamma-ray Spectroscopy(North-Holland, 1965).
[Smi99] Smith, A., Simpson, G., Billows, J.et al., Phys. Lett. B, vol. 453, (1999) 206.
[Smi04] Smith, A., Patel, D., Simpson, G.et al., Phys. Lett. B, vol. 591, (2004) 55.
[Ste01] Stefanova, E. A., Schwengner, R., Rainovski, G.et al., Phys. Rev. C, vol. 63(6), (2001)
064315.
[Ste02] Stefanova, E. A., Danchev, M., Schwengner, R.et al., Phys. Rev. C, vol. 65(3), (2002)
034323.
[Stu01] Stuchbery, A. E.,Nucl. Phys. A, vol. 682, (2001) 470c.
[TA97] Ter-Akopian, G. M., Hamilton, J. H., Oganessian, Y. T.et al., Phys. Rev. C, vol. 55(3),
(1997) 1146.
[Tay71] Taylor, H., Singh, B., Prato, F.et al., Nuclear Data Tables, vol. A9, (1971) 1.
[Urb01] Urban, W., Durell, J., Smith, A.et al., Nucl. Phys. A, vol. 689, (2001) 605.
[Urb05] Urban, W., Rzaca-Urban, T., Durell, J. L.et al., Eur. Phys. J. A, vol. 24, (2005) 161.
[Urb06] Urban, W., Sarkar, M. S., Sarkar, S.et al., Eur. Phys. J. A, vol. 27, (2006) 257.
[Wah88] Wahl, A.,At. Data and Nuc. Data Tab., vol. 39, (1988) 1.
[Wol83] Wolf, A., Berant, Z., Warner, D. D.et al., Phys. Lett. B, vol. 123, (1983) 165.
[Wol89] Wolf, A., Sistemich, K., Mach, H.et al., Phys. Rev. C, vol. 40(2), (1989) 932.
[Zha95] Zhao, Y. M. and Chen, Y.,Phys. Rev. C, vol. 52(3), (1995) 1453.
120

[Zha96] Zhang, C. T., Bhattacharyya, P., Daly, P. J.et al., Phys. Rev. Lett., vol. 77(18), (1996)
3743.
[Zha01] Zhang, X.,High Spin Studies of Neutron-rich Nuclei Produced in Spontaneous Fission
of 252Cf, Ph.D. thesis, Vanderbilt University (2001).
[Zhu08] Zhu, S., Luo, Y., and Hamilton, J.,Euro. Phys. J. A. submitted.
121


![Calibration measurements for the efficiency and response ... · a fast neutron source which produces a continuous neutron spectrum such as a 252Cf spontaneous fission source [4]-[6].](https://static.fdocuments.net/doc/165x107/5e2d92b9b5abd06f313987ec/calibration-measurements-for-the-efficiency-and-response-a-fast-neutron-source.jpg)
![Study of fission using multi-nucleon transfer reactionseprints.whiterose.ac.uk/125802/1/epjconf_fusion2017_00041.pdf · excited compound nuclei (CN) for fission studies [1, 2]. Spontaneous](https://static.fdocuments.net/doc/165x107/605c1ee68a751155f840f049/study-of-fission-using-multi-nucleon-transfer-excited-compound-nuclei-cn-for-ission.jpg)


