Study of sintered Nd-Fe-B magnet with high performance of...
18
Study of sintered Nd-Fe-B magnet with high performance of Hcj (kOe) + (BH)max (MGOe) > 75 Bo-Ping Hu, E. Niu, Yu-Gang Zhao, Guo-An Chen, Zhi-An Chen et al. Citation: AIP Advances 3, 042136 (2013); doi: 10.1063/1.4803657 View online: http://dx.doi.org/10.1063/1.4803657 View Table of Contents: http://aipadvances.aip.org/resource/1/AAIDBI/v3/i4 Published by the AIP Publishing LLC. Additional information on AIP Advances Journal Homepage: http://aipadvances.aip.org Journal Information: http://aipadvances.aip.org/about/journal Top downloads: http://aipadvances.aip.org/features/most_downloaded Information for Authors: http://aipadvances.aip.org/authors Downloaded 16 Aug 2013 to 111.193.240.134. All article content, except where otherwise noted, is licensed under a Creative Commons Attribution 3.0 Unported license. See: http://creativecommons.org/licenses/by/3.0/
Transcript of Study of sintered Nd-Fe-B magnet with high performance of...

Study of sintered Nd-Fe-B magnet with high performance of Hcj (kOe) +(BH)max (MGOe) > 75Bo-Ping Hu, E. Niu, Yu-Gang Zhao, Guo-An Chen, Zhi-An Chen et al. Citation: AIP Advances 3, 042136 (2013); doi: 10.1063/1.4803657 View online: http://dx.doi.org/10.1063/1.4803657 View Table of Contents: http://aipadvances.aip.org/resource/1/AAIDBI/v3/i4 Published by the AIP Publishing LLC. Additional information on AIP AdvancesJournal Homepage: http://aipadvances.aip.org Journal Information: http://aipadvances.aip.org/about/journal Top downloads: http://aipadvances.aip.org/features/most_downloaded Information for Authors: http://aipadvances.aip.org/authors
Downloaded 16 Aug 2013 to 111.193.240.134. All article content, except where otherwise noted, is licensed under a Creative Commons Attribution 3.0 Unported license.See: http://creativecommons.org/licenses/by/3.0/
AIP ADVANCES 3, 042136 (2013)
Study of sintered Nd-Fe-B magnet with high performance ofHcj (kOe) + (BH)max (MGOe) > 75
Bo-Ping Hu,1 E. Niu,1,3,a Yu-Gang Zhao,1,2 Guo-An Chen,1,2 Zhi-An Chen,1
Guo-Shun Jin,1 Jin Zhang,1,2 Xiao-Lei Rao,1 and Zhen-Xi Wang1,3
1Beijing Zhong Ke San Huan Research, No.10 Chuangxin Road, Changping District,Beijing 102200, China2Sanvac (Beijing) Magnetics Co., Ltd, No.23 Chuangxin Road, Changping District,Beijing 102200, China3State Key Laboratory for Magnetism, Institute of Physics, Chinese Academy of Sciences,P. O. Box 603, Beijing 100190, China
(Received 1 February 2013; accepted 18 April 2013; published online 25 April 2013)
We have developed a Nd-Fe-B sintered magnet of extremely high performance.The intrinsic coercivity Hcj is as high as 35.2 kOe (2803kA/m) together with themaximum energy product (BH)max of 40.4 MGOe (321.6kJ/m3). These values resultin Hcj (kOe) + (BH)max (MGOe) > 75. Between 293 K (20oC) and 473 K (200oC), thetemperature coefficients of remanence and intrinsic coercivity are αBr =−0.122 %/◦Cand αHcj = −0.403%/◦C, respectively. A maximum operating temperature of 503 K(230oC) is obtained when permeance coefficient Pc = −B/H = 2. Grain boundarydiffusion (GBD) technique on magnet surface has been developed to increase Hcj by3.6 kOe without significantly decrease of Br and (BH)max. The intrinsic coercivity ofthe GBD treated magnet Hcj(C) has a linear relationship with that of the untreatedmagnet Hcj(B) between 200 K and 473 K (in unit of kOe): Hcj(C) = 1.03Hcj(B)+ 2.38. The enhancement of Hcj by GBD treatment has contributions not only fromthe improvement of microstructure but also from the increase of Ha in the grainsurface layer. It is also found that GBD treatment brings no deterioration in corrosionresistance of untreated magnet. C© 2013 Author(s). All article content, except whereotherwise noted, is licensed under a Creative Commons Attribution 3.0 UnportedLicense. [http://dx.doi.org/10.1063/1.4803657]
I. INTRODUCTION
Invented in 1983,1, 2 Nd-Fe-B sintered magnets possess outstanding magnetic properties. Theyare widely applied in various fields such as information technology, home appliance, magneticresonance image and industry. Sustainable development and green energy create new applications inhybrid or electrical vehicle (HEV or EV), energy-saving appliance, wind mill power generator andso on.3, 4 Most of these applications require Nd-Fe-B magnets with high maximum energy product(BH)max and high thermal stability which can operate at elevated temperature beyond 200 ◦C.5
Excellent thermal stability depends on high Curie temperature (TC), low temperature coefficient ofremanence (αBr), high intrinsic coercivity (Hcj) with low temperature coefficient (αHcj).6 Practicallyhigh Hcj is an essential factor. Unfortunately the increase in Hcj always accompanies the decreasein (BH)max. Therefore the performance of the magnet should be judged by both Hcj and (BH)max,rather than by individual Hcj or (BH)max. For sintered Nd-Fe-B magnets the value of Q = Hcj (kOe)+ (BH)max (MGOe) may be used as an comprehensive index for judging their performance. Thehigher the value of Q is, the better performance of the magnet will be. The value Q reflectsthe technological level of the magnet production. Focusing on the issue of how to produce high
aElectronic mail: [email protected]
2158-3226/2013/3(4)/042136/17 C© Author(s) 20133, 042136-1
Downloaded 16 Aug 2013 to 111.193.240.134. All article content, except where otherwise noted, is licensed under a Creative Commons Attribution 3.0 Unported license.See: http://creativecommons.org/licenses/by/3.0/

042136-2 Hu et al. AIP Advances 3, 042136 (2013)
performance (big value Q) magnets by improving the thermal stability with little sacrifices in Br and(BH)max, many efforts have been devoted and much progress has been made in recent years.
Element addition or substitution is a conventional solution. However the merit and demerit areoften co-existed for single element. For example, partial substitution of Fe by Co increases TC anddecreases αBr but reduces Hcj. Thus the thermal stability is not actually improved with overdose ofCo.3, 7–9 On the other hand, partial substitution of Nd by heavy rare earth (HRE) Dy or Tb promotesthe magnetocrystalline anisotropy field Ha drastically and greatly increases Hcj.9–11 However thissubstitution reduces the saturation magnetization Ms and thus Br and (BH)max due to the antiparallelcoupling of Fe and Dy/Tb magnetic moments. In addition, element abundance and supply of Dy andTb is much more limited than Nd.12 The third solution is to optimize the microstructure of sinteredmagnets by small amount addition of fusible metals (Al, Cu, Ga) or refractory metals (V, Nb, Mo,etc.) to enhance the Hcj. But in most cases, these additives generate phases other than hard magneticphase R2Fe14B (R = rare earth) and decrease the Br and (BH)max.10, 13–17 Combined addition ofdifferent elements, including proper oxygen doping,3, 6, 18, 19 is applied to compromise the demeritsand achieve high performance.
Different from the element substitution of Dy or Tb, grain boundary diffusion (GBD) treatmentshave been widely studied recently. In GBD process oxides, fluorides, alloys or even pure metalsof Dy or Tb are supplied on the surface of sintered magnets. Dy or Tb atoms diffuse along thegrain boundary phase during post-sinter heat treatment at temperature higher than melting pointof rare-earth rich (RE-rich) phase but lower than sintering temperature.20–22 Hcj can be raised upto 4 ∼ 5 kOe without obvious reduction of Br. Moreover, the composition of Dy or Tb is muchlower than those in conventional alloying process, which may reduce magnet cost dramatically.The maximum diffusion depth of GBD-treated magnets is about 6 mm.23–26 However, according toNakamura et al.,26 the Hcj enhancement effect of Dy/Tb GBD-treated magnets depends significantlyon the diffusion depth in magnets. The Hcj of the surface part is higher than the Hcj of the inner partdue to the content decrease of Dy/Tb from the surface to the center.
Appropriately reducing the grain size of sintered magnet is another way to effectively increaseHcj but make little change of Br and (BH)max. Sagawa et al.4, 5, 27 applied jet mill with Helium gas asmedium to bring the average particle size of Nd-Fe-B powder down to ∼1 μm. To prevent such fineparticles from oxidation, they invented a so-called ‘press-less pressing (PLP)’ technique to compactfine powder into block in air-tight and oxygen free container. The green parts were sintered inhigh vacuum. They succeeded in making the Dy or Tb-free Nd-Fe-B magnet of intrinsic coercivityof 20 kOe, which is 9 kOe higher than conventional powder metallurgic process. The (BH)max is48 MGOe. Obviously this procedure has great advantage over conventional sintering and GBDprocess. But it also confronts a lot of difficulties in realizing mass production, such as oxygencontamination and grain size control.
These aforementioned methods make it possible to realize high performance magnet withHcj(kOe) + (BH)max(MGOe) ≈ 70.19, 28 For high temperature applications, it is necessary to keep Hcj
higher than 30 kOe and make (BH)max as large as possible. Manufacture process has to be optimizedin every detail to eliminate possible factors of (BH)max decrease. In this work the production processhas been optimized in order to increase the degree of orientation, to decrease the grain size, and toenhance the uniformity of grain size distribution. GBD procedure of fine Dy alloy powder has alsobeen developed. Sintered Nd-Fe-B magnets with Hcj > 30 kOe and Hcj (kOe) + (BH)max (MGOe)> 75 are achieved and suitable for high-end applications. The intrinsic magnetic properties, extrinsicmagnetic properties and microstructure were investigated to unveil their relationship with technicalprocedure.
II. EXPERIMENTAL
Raw materials was prepared according to a nominal composition ofPr2.8Nd8.7Tb1.9Dy0.3(Cu,Al,Ga)0.6Co1.5FebalB5.7. The addition of Co, Tb and Dy could im-prove the Curie temperature and magnetocrystalline anisotropy field of the Nd2Fe14B-structurephase in magnet. The dopants of fusible elements of Al, Cu and Ga could positively influence thewetting behavior of the liquid phase during sintering, then enhance the magnetic decoupling of the
Downloaded 16 Aug 2013 to 111.193.240.134. All article content, except where otherwise noted, is licensed under a Creative Commons Attribution 3.0 Unported license.See: http://creativecommons.org/licenses/by/3.0/

042136-3 Hu et al. AIP Advances 3, 042136 (2013)
grains29 and the corrosion resistance.30 Alloy flakes were prepared by strip-casting technique. Themolten alloy was kept at 1400 ◦C ∼ 1450 ◦C, and the cooling water at 35 ∼ 40 ◦C. The rotatingrate of casting wheel was set to 1.1 m/s and the thickness of the alloy flakes was in an range of0.3 ∼ 0.5 mm. The alloy flakes were crushed by hydrogen decrepitation (HD) process into coarsepowder of hundreds microns. With nitrogen gas jet mill, the coarse powder was further milled intofine powder with D50 of 6.63 μm. The particle size distribution of fine powder was characterizedby a laser particle size analyzer. Under the protection of nitrogen gas, fine powder was aligned ina constant magnetic field of 18.2 kOe (1.45 MA/m) together with alterative field pulses of peakfield 40.2 kOe (3.20 MA/m) parallel or antiparallel to the constant field. The powder was pressedto density of 4.2 g/cm3 at a pressure of 120 MPa in the direction perpendicular to magnetic field.The green compacts were then isostatically compacted in oil cylinder under a pressure of 200 MPa.Sintering was undertaken in vacuum at 1080 ◦C for 3 hours to reach full density and quenchingto room temperature by Ar gas blower. Post-sintered magnets were heat-treated in two stages at900 ◦C for 2 hours and 500 ◦C for 3 hours, respectively. This kind of magnet is called “referencemagnet” or “Specimen A”.
To improve the performance of the “reference magnet”, the sample preparation routine wasoptimized in strip casting, jet milling and sintering. Started from the same nominal composition,kept the same temperature range of molten alloy and cooling water as the ‘reference magnet’, alloystrip casting was conducted at rotating rate of 1.5 m/s using a specially designed copper wheel withthe diameter 610 mm. The thickness of the alloy flakes was in a range of 0.2 ∼ 0.4 mm. The jetmilling was also optimized to narrow the particle size distribution with D50 of 5.28 μm. To preventgrains from abnormal growing the sintering was at lower temperature of 1020 ◦C for longer time of6 hours, compared with the sintering condition of Specimen A. The same two-stage heat-treatmentas the Specimen A was taken after sintering. The magnets prepared by this routine are referred as“optimized magnets” or “Specimen B”.
The third way of sample preparation was in the same routine as that for “optimized magnet”except an additional grain boundary diffusion (GBD) treatment. The post-sintered magnets were cutinto cylinders of dimensions �10.0 × 10.0 mm3 or blocks of 50.0 × 48.0 × 3.8 mm3. The cylindersand blocks were coated with Dy alloy powders of several microns in thickness and then were heatedat 750 ◦C ∼ 1000 ◦C for 20 min to 6 h, which was regarded as GBD treatment. Afterwards, themagnets were annealed in the same two-stage condition as Specimen A and Specimen B. Themagnets prepared by this routine are referred as “GBD treated magnets” or “Specimen C”.
The chemical composition was determined by inductively coupled plasma (ICP) spectropho-tometry. The contents of oxygen, nitrogen and hydrogen were determined by an ONH analyzer(ELTRA ONH2000).
The phase identification and the microstructure were analyzed by X-ray diffraction (XRD) andscanning electron microscope (SEM).
The magnets samples were sliced into cubic of 1.5 × 1.5 × 1.5 mm3 for measuring mag-netization. A Lakeshore 7410 vibrating sample magnetometer (VSM) was used to measure thetemperature dependence of magnetization (M) in an applied field of 300 Gs (23.9 kA/m) to de-termine the Curie temperature TC. The magnetization curves were measured by a superconductingquantum interference device (SQUID) VSM with the maximum field of 70 kOe (5.57 MA/m).
Because of the pole-piece saturation effect in close-loop measurement, the room tempera-ture demagnetization curves were measured by a pulse field magnetometer PFM12.cn with thepeak field up to 100 kOe (7.96 MA/m). The demagnetization curves of specimens from 120 ◦Cto 200 ◦C were measured by a Magnet-Physik permagraph C-300. Samples for close-loop mea-surements were �10.0 × 10.0 mm3 cylinders. The temperature-dependent irreversible flux losseswere deduced from the magnetic flux differences of the magnets at 20 ◦C and a fixed temper-ature (up to 250 ◦C) for 2 hours. The magnetic flux was measured by Lakeshore Helmholtzcoil and fluxmeter. The permeance coefficients (Pc = −B/H) of samples were chosen as 0.5,1.0 and 2.0, respectively, by cutting samples from blocks with the same thickness of 3.8 mmand different diameters. The maximum operating temperature for a magnet with a certain Pc
value is defined by the temperature point at which the absolute value of irreversible flux lossis 5%.
Downloaded 16 Aug 2013 to 111.193.240.134. All article content, except where otherwise noted, is licensed under a Creative Commons Attribution 3.0 Unported license.See: http://creativecommons.org/licenses/by/3.0/

042136-4 Hu et al. AIP Advances 3, 042136 (2013)
FIG. 1. Demagnetization curves of (a) 4πM-H at 20 ◦C and 200 ◦C, (b) 4πM-H and B-H at 200 ◦C of reference magnet(Specimen A, the dot line), optimized magnet (Specimen B, the dash line) and GBD treated magnets (Specimen C, thecontinuous line) at 20 ◦C and 200 ◦C. (Close-loop measurement and sample dimension: �10.0 × 10.0 mm3)
The corrosion resistance is characterized by the weight loss measured after the acceleratedaging test. A pressure cook test (PCT) chamber was employed under the test condition of 120 ◦Cand 100%RH (relative humidity) with condensation of water vapor (according to JEDEC standard:JESD22-A102D, Accelerated Moisture Resistance-Unbiased Autoclave).
III. RESULTS AND DISCUSSION
A. Extrinsic magnetic properties and thermal stability of magnets
Fig. 1(a) shows the 4πM-H demagnetization curves of reference magnet (Specimen A), opti-mized magnet (Specimen B) and GBD treated magnet (Specimen C) at temperatures of 20 ◦C and200 ◦C, respectively. Fig. 1(b) shows B-H curves together with 4πM-H curves at 200 ◦C. The extrin-sic magnetic parameters between 20 ◦C and 200 ◦C are summarized in Table I and Fig. 2. Comparingto Specimen A, Specimen B with optimized routine has its (BH)max increased by 0.6 MGOe and Hcj
by 1.2 kOe at 20 ◦C. According to a high magnetic performance description, by adding data of Hcj
and (BH)max in Gaussian unit we can get Hcj(kOe) + (BH)max(MGOe) = 72.5. The Specimen A onlyhas this value of 70.7. Obviously the optimized routine significantly improves the performance ofthe magnet. In addition, Specimen C (GBD treated magnet) has Br of 12.8 kGs (1.28 T), Hcj of 35.2kOe (2803 kA/m) and (BH)max of 40.4 MGOe (321.6 kJ/m3). The Br decreases slightly compare toSpecimen B. The Hcj increases drastically with 3.6 kOe by GBD treatment which brings the valueof Hcj (kOe) + (BH)max (MGOe) up to 75.6. At 200 ◦C the B-H curve of GBD treated magnet hasno obvious knee point. This implies that the GBD treated magnets can be applied at temperature
Downloaded 16 Aug 2013 to 111.193.240.134. All article content, except where otherwise noted, is licensed under a Creative Commons Attribution 3.0 Unported license.See: http://creativecommons.org/licenses/by/3.0/

042136-5 Hu et al. AIP Advances 3, 042136 (2013)
TABLE I. The magnetic properties of reference magnet (Specimen A), optimized magnet (Specimen B) and GBD treatedmagnet (Specimen C) at different temperatures. (Close-loop measurement and sample dimension: � 10.0 × 10.0 mm3)
Parameters Br Hcj (BH)max Hcj(kOe) +(kGs) (kOe) (MGOe) (BH)max(MGOe)
T ( ◦C) A B C A B C A B C A B C
20 12.8 13.0 12.8 30.4 31.6 35.2 40.3 40.9 40.4 70.7 72.5 75.6100 11.9 12.0 11.9 17.8 19.4 —a 33.4 33.9 33.6 51.2 53.3 —a
120 11.6 11.7 11.6 15.6 16.7 19.7 31.5 32.0 31.8 47.1 48.7 51.5140 11.1 11.3 11.1 13.0 14.2 17.3 29.0 29.6 29.2 42.0 43.8 46.5160 10.8 11.0 10.8 10.3 11.9 14.6 27.5 28.0 27.6 37.8 39.9 42.2180 10.2 10.4 10.2 7.81 9.55 12.1 24.5 25.1 24.8 32.3 34.7 36.9200 9.96 10.1 10.0 5.59 7.43 9.67 22.8 23.2 23.0 28.4 30.6 32.7
aThe Hcj value of GBD treated magnet at the temperature of 100 ◦C is beyond the measuring range of the Magnet-Physikpermagraph C-300.
up to 200 ◦C. Contrastively, both Specimen A and B have knee points on their B-H curves at thistemperature (see Fig. 1(b)).
From Table I and Fig. 2 it can be recognized that all the extrinsic magnetic parameters decreasewith the increase of temperature. The difference of Br between Specimen A and Specimen Bkeeps at 0.1 ∼ 0.2 kGs (see Fig. 2(a)). The (BH)max of Specimen B are 0.4 ∼ 0.6 MGOe higherthan Specimen A (Fig. 2(c)). The Br of Specimen C is nearly the same as Specimen A in thewhole temperature range. Because of the improvement of squareness in demagnetization curve, the(BH)max of Specimen C is slightly higher than Specimen A. Obvious change occurs on the intrinsiccoercivity Hcj. With optimized routine Hcj of Specimen B enhance by 1.1 ∼ 1.8 kOe compare toSpecimen A. The GBD treatment adds another 2.2 ∼ 3.6 kOe to Hcj (see Fig. 2(b)). Subsequentlythe optimized routine has positive effect to increase the sum of Hcj (kOe) and (BH)max (MGOe) by1.6 ∼ 2.4. Meanwhile the GBD treatment improves the sum of Specimen C by 2.1∼3.1 within thewhole temperature range compare to Specimen B. The temperature coefficient of Br is defined asαBr = (Br(T) − Br(T0))/(Br(T0)(T − T0)). The corresponding temperature coefficient of Hcj is αHcj
= (Hcj(T) − Hcj(T0))/(Hcj(T0)(T − T0)). Between 20 ◦C and 200 ◦C the temperature coefficientsof Br and Hcj are αBr (B) = −0.124 %/ ◦C and αHcj (B) = −0.425 %/ ◦C for optimized magnets.These values become αBr(C) = −0.122 %/ ◦C and αHcj(C) = −0.403 %/ ◦C for GBD treatedmagnets. While αBr is nearly the same value, αHcj is reduced by about 5%. This indicates thatthe GBD treatment enhances the intrinsic coercivity efficiently at all measured temperatures so thattemperature coefficients of Hcj have improved. The GBD treatment has little effect on the temperaturecoefficient of remanence.
Fig. 3 and Table II illustrate the irreversible flux loss of the magnets of Specimen B and Cfor different permeance coefficients Pc = −B/H = 0.5, 1.0, 2.0 after exposure at the temperaturesof 26 ◦C, 120 ◦C, 150 ◦C, 180 ◦C, 200 ◦C, 220 ◦C, 230 ◦C, 240 ◦C and 250 ◦C for 2 hours, respec-tively. The irreversible flux loss31 is defined by (�(T) − �(20 ◦C))/�(20 ◦C),where the magneticflux �(T) was measured at room temperature after the magnet exposed at high temperature T for2 hours. It can be seen that all the absolute values of irreversible loss are less than 3% below 200 ◦C,no matter what the treatment and Pc are. Therefore even the samples of optimized magnet withPc no less than 0.5 can be stably used at 200 ◦C. At higher temperature, the absolute values ofirreversible losses increase drastically with decrease of Pc. The samples of optimized magnet showlarger loss comparing to the samples of GBD treated magnet of the same Pc at the same temperature.The maximum working temperature for a magnet with a certain Pc value is usually defined as thetemperature at which the absolute value of irreversible loss is 5%. It can be recognized from Fig. 3that the maximum working temperatures of Specimen C are 5 ∼ 10 ◦C higher than Specimen B.In other words GBD treated magnets have better thermal stability than optimized magnets. Themaximum working temperature of GBD treated magnet with Pc = 2.0 is higher than 230 ◦C, whichmeans that GBD magnets may meet the demands of many applications such as hybrid or electricalvehicle (HEV or EV), energy-saving appliance, wind mill power generator and so on.
Downloaded 16 Aug 2013 to 111.193.240.134. All article content, except where otherwise noted, is licensed under a Creative Commons Attribution 3.0 Unported license.See: http://creativecommons.org/licenses/by/3.0/

042136-6 Hu et al. AIP Advances 3, 042136 (2013)
FIG. 2. The temperature dependence of (a) remanence Br, (b) intrinsic coercivity Hcj, (c) the maximum energy product(BH)max and (d) Hcj(kOe) + (BH)max(MGOe) of reference magnet (Specimen A, the dot line with triangle symbol), optimizedmagnet (Specimen B, the dash line with square symbol) and GBD treated magnet (Specimen C, the continuous line withcircular symbol).
Downloaded 16 Aug 2013 to 111.193.240.134. All article content, except where otherwise noted, is licensed under a Creative Commons Attribution 3.0 Unported license.See: http://creativecommons.org/licenses/by/3.0/

042136-7 Hu et al. AIP Advances 3, 042136 (2013)
TABLE II. Irreversible flux losses of optimized magnet (Specimen B1, B2, B3) and GBD treated magnet (Specimen C1, C2,C3) at different working points (Pc = −B/H = 0.5, 1.0, 2.0) and temperatures. The uncertainty for the measurement is about0.6%.
Temperature Irreversible flux losses of Irreversible flux losses ofSpecimen B (optimized magnet), % Specimen C (GBD treated magnet), %
B1 B2 B3 C1 C2 C3◦C Pc = 0.5 Pc = 1.0 Pc = 2.0 Pc = 0.5 Pc = 1.0 Pc = 2.0
26 0.0 0.0 0.0 0.0 0.0 0.085 − 0.3 − 0.1 − 0.1 0.1 0.2 − 0.2100 − 0.4 − 0.3 − 0.3 0.0 0.1 − 0.4120 0.2 − 0.2 − 0.4 0.0 0.1 − 0.4150 − 0.5 − 0.3 − 0.7 − 0.1 0.0 − 0.5180 − 0.9 − 0.7 − 0.8 − 0.4 − 0.3 − 0.8200 − 1.9 − 1.2 − 1.1 − 0.8 − 0.6 − 1.2220 − 18.7 − 4.2 − 2.2 − 9.0 − 1.6 − 2.0230 − 30.8 − 12.5 − 4.5 − 20.4 − 5.0 − 3.3240 − 42.4 − 24.6 − 7.8 − 32.1 − 13.7 − 5.5250 − 55.3 − 39.9 − 15.9 − 46.5 − 28.7 − 10.1
FIG. 3. Irreversible flux losses of optimized magnet (Specimen B1, B2, B3, the dash lines with hollow symbols) and GBDtreated magnet (Specimen C1, C2, C3, the continuous lines with solid symbols) at different working points (Pc = −B/H= 0.5, 1.0, 2.0) as a function of temperature.
B. Microstructure of magnets and related alloys
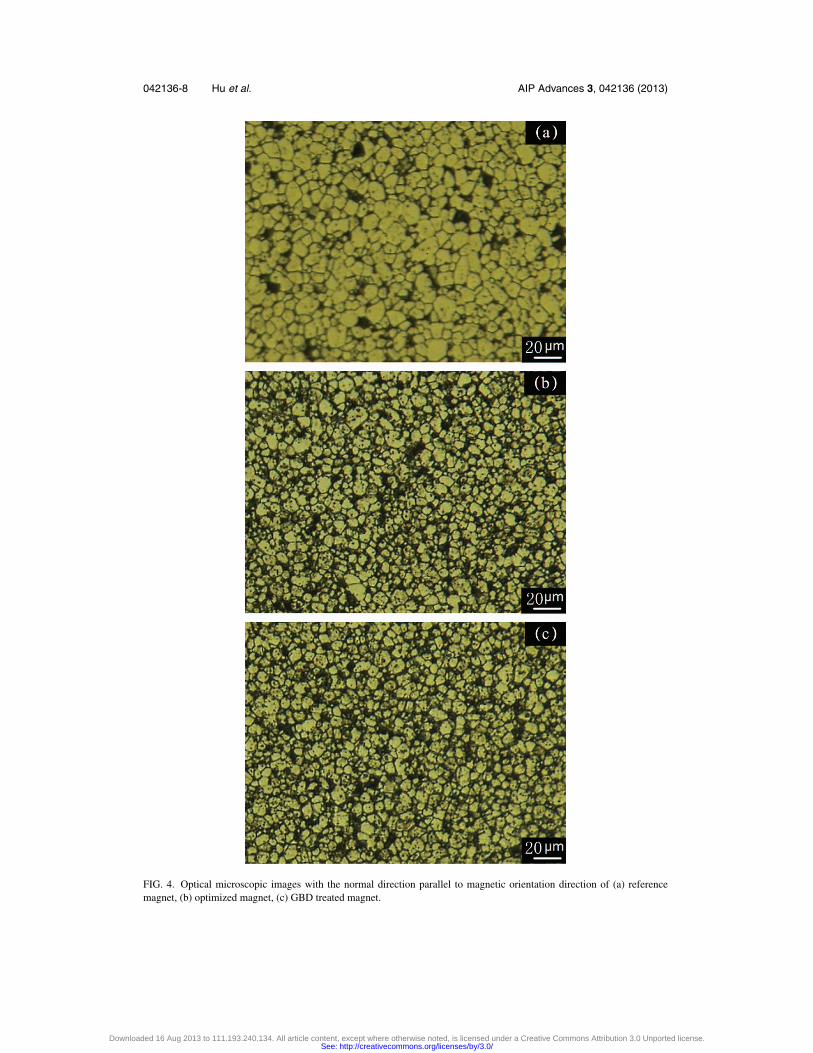
Large field images observed by optical microscope are shown in Fig. 4 for reference magnet(Fig. 4(a)), optimized magnet (Fig. 4(b)) and GBD treated magnet (Fig. 4(c)). The images weretaken on the surface perpendicular to magnetic orientation direction. From Fig. 4(b) and 4(c) it canbe estimated that the grain sizes of matrix phase are from 2 to 15 μm with an average of 7 μm.There is no abnormally growing large grain and even no two grains join together. The net-like blacklines of etched RE-rich phase obviously indicate that fine matrix grains are well separated fromeach other. This metallurgic structure is essential for Nd-Fe-B magnets to achieve high coercivity.For comparison, the image of reference magnet (Fig. 4(a)) shows an average grain size of 10 μm.The notable difference of Fig. 4(a) to Fig. 4(b) and 4(c) is the existence of 20 μm large grains andsub-micron fine grains. Abnormally grown large grains in reference magnet are responsible for therelatively low Hcj. In addition, the very fine grains will decrease both Br and Hcj because of theirstrong tendency of oxidation and misalignment.
Several efforts have been made in optimized manufacturing routine to result in such differences.The technique of strip casting is helpful for the starting R-Fe-B alloy to uniformly disperse RE-richphase and depress the growth of α-Fe phase.32 With optimized structure of tundish the temperature
Downloaded 16 Aug 2013 to 111.193.240.134. All article content, except where otherwise noted, is licensed under a Creative Commons Attribution 3.0 Unported license.See: http://creativecommons.org/licenses/by/3.0/
042136-8 Hu et al. AIP Advances 3, 042136 (2013)
FIG. 4. Optical microscopic images with the normal direction parallel to magnetic orientation direction of (a) referencemagnet, (b) optimized magnet, (c) GBD treated magnet.
Downloaded 16 Aug 2013 to 111.193.240.134. All article content, except where otherwise noted, is licensed under a Creative Commons Attribution 3.0 Unported license.See: http://creativecommons.org/licenses/by/3.0/

042136-9 Hu et al. AIP Advances 3, 042136 (2013)
FIG. 5. The microstructure comparison of optimized strip-casting (SC) alloy (a), (c), (e) and the conventional SC alloy (b),(d), (f). The left side of each photo is the wheel-contact surface while the right side is the free surface. (a) and (b) are the BSE(Back Scattered Electron) images of polished samples. (c), (d), (e), (f) are the second electron images of samples’ fracturesection. (e) and (f) are the detail views of the wheel-contact surface.
in melt pool keeps homogeneous during alloy cast.33 Together with optimized wheel spinning ratean ideal microstructure of strip-casting alloy have been achieved. Fig. 5(a) and Fig. 5(b) show theSEM back scattered electron images (BSE) of strip-casting alloy prepared by optimized process andconventional method, respectively. It can be seen that the thicknesses of the strip-casting alloy are0.2 ∼ 0.4 mm. The columnar grains (the dark areas) are about 3 ∼ 5 μm in width and well separatedby the uniformly distributed RE-rich phase (the white lines). Across the thickness direction from thewheel-contact surface to the free surface, the grains of optimized process are uniformly distributed(Fig. 5(c) and Fig. 5(e)). Different from the optimized strip-casting process, in conventional strip-casting alloy there are ultra-fine grain zones on the wheel-contact surface (areas with white ellipticmark in Fig. 5(b) and Fig. 5(d)). Further enlarged image (Fig. 5(f)) shows that the ultra-fine zonecontains submicron isometric grains of matrix phase. During jet milling some of these submicronisometric crystals may keep in multi-crystalline status which is proven to be harmful to pow-der orientation.34 The remanence perpendicular to the orientation direction Br
⊥ was measured on
Downloaded 16 Aug 2013 to 111.193.240.134. All article content, except where otherwise noted, is licensed under a Creative Commons Attribution 3.0 Unported license.See: http://creativecommons.org/licenses/by/3.0/

042136-10 Hu et al. AIP Advances 3, 042136 (2013)
FIG. 6. Particle size distribution of conventional crushing process and optimized process.
Specimen A and B magnets. They are 0.89 kGs and 0.80 kGs, respectively. Dividing Br⊥ by Br in
Table I one can get the ratio of Br⊥/ Br as 7.0% for reference magnet and 6.2% for optimized mag-
net. The degree of orientation in reference magnet is slightly distorted. Other submicron isometriccrystals may be crushed into sub-micron single-crystalline particles. Then they are eliminated intodust collector. The total rare earth composition will decrease and the liquid-phase sintering processwill be negatively affected.34 The ICP analysis revealed the composition results. The total rare earthcompositions are 30.95 wt.% for optimized magnet and 30.60 wt.% for reference magnet, eventhough they started from the same nominal composition. Therefore the metallurgical structure ofstrip-casting alloy plays a critical role in optimizing the magnetic properties.
Narrow distribution of fine grains in optimized magnet is also ensured by optimized crushingprocess. Fig. 6 compares the particle size distribution of optimized and conventional crushing process.The optimized crushing process leads to a very narrow particle size distribution. The measurementof particle size distribution reveals that the D50 is 5.28 μm for optimized crushing process, while6.63 μm for the conventional process. The very large particles may lead to abnormal grain growthduring sintering. The over-grown grains will damage the coercivity and the squareness of demagne-tization curve. It is worth noting that the D50 is comparable to the width of the columnar grains inalloy strips. Together with low temperature and long time sintering, the optimized magnet with finegrains is realized to ensure high coercivity.
Normally a two-step annealing at temperature of 900 ◦C for 2 hours and 500 ◦C for 3 hours wasapplied to the post-sintered magnets. Fig. 7(a) and Fig. 7(b) compare the microstructures of magnetsbefore and after annealing, respectively. In as-sintered magnet (Fig. 7(a)) patches of RE-rich phasescan be seen to concentrate in triple-junctions and corners of main phase grains. It is hard to recognizeany thin RE-rich phase penetrating into two-grain boundary. However, in two-stage annealed magnet(Fig. 7(b)) there are continuous thin RE-rich phases along the grain boundaries with scattered RE-rich concentrated junctions. After GBD treatment, more distinct, continuous and thinner RE-richphase between the grain boundaries can be seen in the magnet (Fig. 7(c)). Apparently, two-stageannealing and the GBD treatment uniformly disperse the RE-rich phases into grain boundaries tocompletely isolate the matrix phase grains.
During manufacturing process O, H, or N contamination is inevitable and sensitive to mag-netic properties. Oxygen content in strip-casting alloy flake was determined by ONH analyzer as100 ppm. In optimized magnet and GBD treated magnet the oxygen contents increased to be1000 ppm. The hydrogen content is about 1.3 ppm and the nitrogen content is less than 110 ppm.The X-ray diffraction pattern of grinded magnet shows a Nd2Fe14B-structure phase together with atiny hint of R2O3 phase. Supposing all oxygen atoms exist in form of R2O3, it can be deduced thatthere is about 0.71 wt.% of R2O3 in magnets. Over dosage of oxygen contamination is consideredto be harmful for forming smooth thin RE-rich phase, thus decreases the coercivity dramatically.35
Fig. 8(a) shows the metallographic image of optimized magnet on the surface perpendicular tomagnetic orientation direction. The image is binarized to whiten the Nd2Fe14B-structure main phaseand leave the grain boundary as black (Fig. 8(b)). Based on the area method of the Quantitative
Downloaded 16 Aug 2013 to 111.193.240.134. All article content, except where otherwise noted, is licensed under a Creative Commons Attribution 3.0 Unported license.See: http://creativecommons.org/licenses/by/3.0/

042136-11 Hu et al. AIP Advances 3, 042136 (2013)
FIG. 7. BSE images of magnets with the normal direction parallel to magnetic orientation direction, (a) optimized magnetbefore annealing, (b) optimized magnet after annealing, (c) GBD treated magnet.
Metallographic Analysis (QMA) system, together with the software Image-Pro Plus (IPP), the arearatio of the main phase are estimated. Three different zones of 0.6 × 0.5mm2 have been selectedand analyzed under the magnification of 500×. The area ratios of main phase are 94.6%, 94.9% and94.6%, respectively. The average value is 94.7%. With this area ratio the main phase grains are wellseparated by black net lines. The RE-rich phase is sufficient to form nonmagnetic intergranular phaseto completely isolate matrix phase. If there were too much oxygen, the R-rich phase would be insuf-ficient. Neighbor grains of main phase have tendency to join each other directly. This phenomenonis equivalent to abnormal grown large grains in magnet which decreases intrinsic coercivity.
Downloaded 16 Aug 2013 to 111.193.240.134. All article content, except where otherwise noted, is licensed under a Creative Commons Attribution 3.0 Unported license.See: http://creativecommons.org/licenses/by/3.0/

042136-12 Hu et al. AIP Advances 3, 042136 (2013)
FIG. 8. The metallography images of the cross-section with the normal direction parallel to magnetic orientation directionbefore binarization (a) and after binarization (b).
C. Intrinsic magnetic properties and intrinsic coercivity before and after GBD treatment
The intrinsic magnetic properties of the rare-earth transition-metal intermetallic compounds(R1,R2,. . . Ri,. . . ,Rn)2(T1,T2,. . . Tj,. . . Tm)14B can be predicted by taking the corresponding valuesof individual isostructural Ri2Tj14B compound. From ICP analysis the strip-casting alloy flake hasa composition of Pr2.79Nd8.68Tb1.90Dy0.28(Cu,Al,Ga)0.58Co1.50Fe78.51B5.76. If considering all Fe andCo atoms form Nd2Fe14B-structure phase and Cu, Al and Ga enter into R-rich phase, one may deducethe formula of the R2T14B phase as Pr0.41Nd1.27Tb0.28Dy0.04Co0.26Fe13.74B. The remaining rare earthand oxygen exist as R-rich phase or R-oxide. Taking the weighted average over corresponding valuesof individual intermetallic compounds R2Fe14B and R2Co14B (R = Pr,Nd,Tb,Dy), the saturationpolarization 4πMs = 14.4 kGs can be predicted. To make a more accurate estimation of 4πMs,the volume ratio of Nd2Fe14B-structure main phase has to be considered. As discussed above, bytaking the volume fraction of 94.7% for the main phase, the saturation polarization 4πMs will be13.6 kGs. Together with room temperature magnetocrystalline anisotropy field Ha of Nd2Fe14B as76 kOe, Tb2Fe14B as 220 kOe and Dy2Fe14B as 150 kOe,10 the magnetocrystalline anisotropy fieldHa = 99.7 kOe is expected. In R2(Fe,Co)14B intermetallic compounds, the Curie temperature TC ismainly determined by exchange interaction of Fe-Co sub-lattice and partially affected by R-(Fe,Co)and R-R interactions. According to the composition the relative percentage of Co substitution
Downloaded 16 Aug 2013 to 111.193.240.134. All article content, except where otherwise noted, is licensed under a Creative Commons Attribution 3.0 Unported license.See: http://creativecommons.org/licenses/by/3.0/

042136-13 Hu et al. AIP Advances 3, 042136 (2013)
FIG. 9. Initial magnetization curves of directions along the easy magnetization direction and the hard magnetization directionfor the optimized magnet and the GBD treated magnet.
of Fe is 1.37 at.%. Based on the TC-x curve of Curie temperature TC against Co content x inNd2(Fe1-xCox)14B,8, 16, 36 the TC of the strip-casting alloy should be 324 ◦C.
For comparison of prediction and measurement, the density of magnet has to be obtained first.From X-ray diffraction the lattice parameters of Nd2Fe14B-structure main phase for all specimenshave the same values of a = 0.879 nm and c = 1.218 nm. It indicates that GBD treatment does notaffect main phase. If taking the lattice parameters of individual R2(Fe,Co)14B intermetallic compound(R = Pr, Nd, Tb, Dy) in accordance with the composition of Pr0.41Nd1.27Tb0.28Dy0.04Co0.26 Fe13.74B,the lattice parameters of a = 0.879 nm and c = 1.216 nm may be obtained, which are well agreedwith the experimental results. From the room temperature measurement, we obtained the density ofoptimized magnets and GBD treated magnets. They have the same value of ρm
exp = 7.621g/cm3.The magnetization curves of an optimized magnet (Specimen B) and a GBD treated magnet
(Specimen C) were measured in the applied fields up to 70 kOe along the easy magnetizationdirection (parallel to the magnetic orientation direction) and the hard direction (perpendicular to themagnetic orientation direction). The magnets were cubic with side length of 1.5 mm. And one edgewas chosen as parallel to the orientation direction. Fig. 9 gives the typical magnetization curves attemperature of 20 ◦C. The open circuit measurements were corrected by a demagnetization factorN = 0.26.37 The saturation polarization 4πMs is deduced from the magnetization curve along easydirection with density of ρm
exp = 7.621 g/cm3. The 4πMs is 13.3 kGs for the optimized magnet and13.2 kGs for the GBD treated magnet. These values are slightly smaller than that of the strip-castingalloy flake and the predicted value.
The magnetocrystalline anisotropy field Ha is estimated from the cross point of extension lines ofthe 4πM-H curves along easy and hard directions (Fig. 9). In both directions, the polarization 4πM ofthe GBD treated magnet is slightly smaller than that of the optimized magnet. The magnetocrystallineanisotropy field Ha has almost the same value of 104 kOe for both magnets. This value is higherthan the predicted value of 99.7 kOe from composition. The misalignment of main phase grains ofthe magnet may affect the extrapolation of magnetization curve along hard magnetization direction.
The measured value of Curie temperature TC is nearly the same as 334 ◦C for strip-castingalloy, the optimized magnet and the GBD treated magnet. Comparing to TC = 315 ◦C of the pureNd2Fe14B, the TC increases by 19 ◦C. This contribution is mainly from Co substitution since the TC
of Nd2Co14B is as high as 727 ◦C. Different from the prediction of 324 ◦C, another 10 ◦C increasein TC comes from rare earth substitution. Although the substitution of Nd by Pr slightly decreasesTC, the overall rare earth effect is positive. Co substitution has another positive effect to increasemagnetization of Nd2Fe14B if the relative composition of Co to Fe is less than 20 at.%. HoweverCo substitution is accompanied with the regressing of anisotropy.38, 39 Therefore the Co addition islimited.
The measured parameters of intrinsic magnetic property have a good match with the predictionbased on the Pr0.41Nd1.27Tb0.28Dy0.04Co0.26Fe13.74B compound. And more importantly it indicates
Downloaded 16 Aug 2013 to 111.193.240.134. All article content, except where otherwise noted, is licensed under a Creative Commons Attribution 3.0 Unported license.See: http://creativecommons.org/licenses/by/3.0/

042136-14 Hu et al. AIP Advances 3, 042136 (2013)
FIG. 10. Hcj/Ms varies with Ha/Ms for the optimized magnet (Specimen B) and the GBD treated magnet (Specimen C) atdifferent temperatures.
that the optimized magnet and the GBD treated magnet have almost the same values of intrinsicmagnetic properties. In other words, the GBD treatment has little effect on the intrinsic magneticproperties of the main phase of the magnets. Therefore the intrinsic coercivity is enhanced by GBDtreatment while the remanence and the maximum energy product almost keep unchanged, which isone of the outstanding advantages of our GBD technique. If the same amount of Hcj enhancement isexpected, the conventional process may need more Dy to replace Nd. The reduction in Br is estimatedto be 0.8 ∼ 1.0 kGs40, 41 rather than 0.1 to 0.2 kGs.
The intrinsic coercivity may be expressed by the following model:42–44
Hcj = αHa − Nef f Ms (1)
The first term on the right-hand side reflects the contribution of the magnetocrystalline anisotropyfield Ha associated with the microstructure effect represented by parameter α. The second term‘NeffMs’ is an effective magnetostatic interaction, where Neff is effective demagnetization parameterwhich mainly depends on the shape and size of the grains of main phase. Here the parameters α
and Neff are purely phenomenological and are usually determined by plotting Hcj/Ms versus Ha/Ms
at different temperatures.Hcj/Ms varies with Ha/Ms at different temperatures is plotted in Fig. 10, which is similar to the
Hcj/Ms-Ha/Ms plotting on Pr-Fe-B magnet by Sagawa et al.43 It can be seen that Hcj/Ms has a linearrelationship with Ha/Ms for both the optimized magnet and the GBD treated magnet below 340 K.By linear fitting the data between 200 K and 340 K, we obtain (in unit of kOe):
Hcj(B)/Ms(B) = α(B)Ha(B)/Ms(B) − Neff(B) = 0.825Ha(B)/Ms(B) − 4.07 (2)
for the optimized magnet, and
Hcj(C)/Ms(C) = α(C)Ha(C)/Ms(C) − Neff(C) = 0.823Ha(C)/Ms(C) − 3.81 (3)
for the GBD treated magnet. Our α values are about 2.3 times larger than 0.36 on the Pr-Fe-B magnetachieved by Sagawa et al.,43 which indicate that the microstructures in our magnets are very muchimproved to transfer Ha to Hcj.
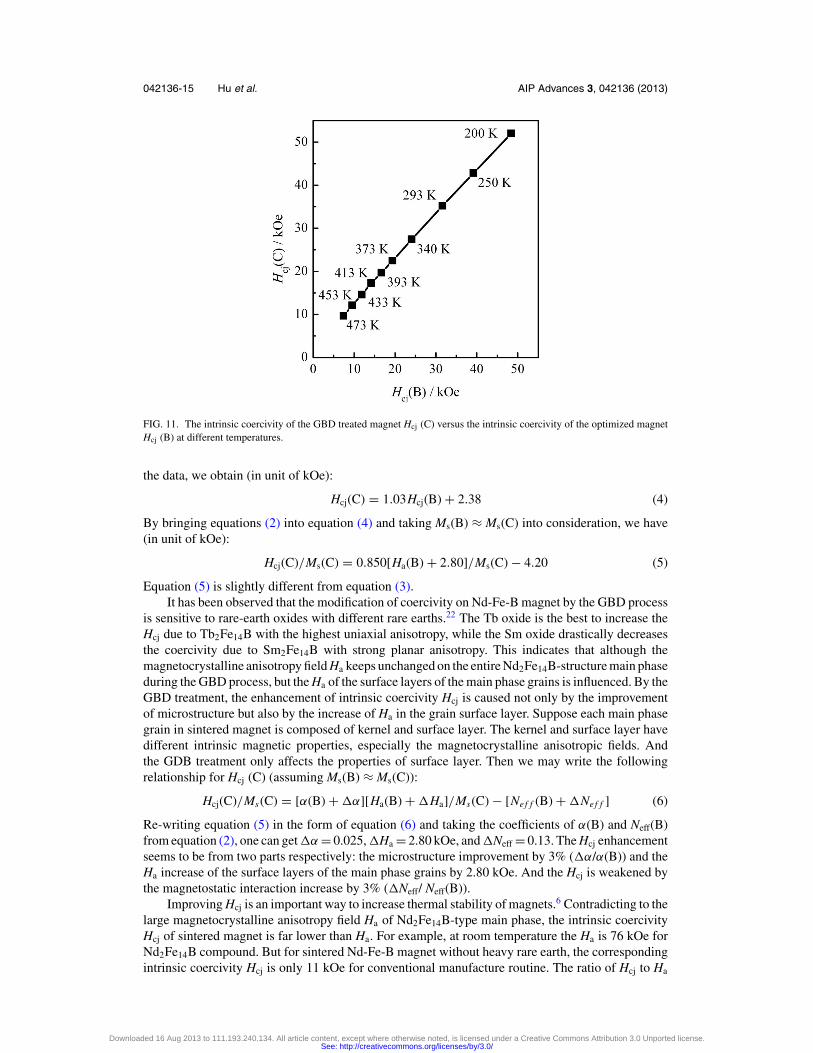
The Hcj(C) of the GBD treated magnet as a function of the Hcj(B) of the optimized magnetat different temperatures is shown in Fig. 11. It can be seen that the Hcj(C) has a very good linearrelationship with the Hcj(B) within the whole temperature range of measurement. By linear fitting
Downloaded 16 Aug 2013 to 111.193.240.134. All article content, except where otherwise noted, is licensed under a Creative Commons Attribution 3.0 Unported license.See: http://creativecommons.org/licenses/by/3.0/
042136-15 Hu et al. AIP Advances 3, 042136 (2013)
FIG. 11. The intrinsic coercivity of the GBD treated magnet Hcj (C) versus the intrinsic coercivity of the optimized magnetHcj (B) at different temperatures.
the data, we obtain (in unit of kOe):
Hcj(C) = 1.03Hcj(B) + 2.38 (4)
By bringing equations (2) into equation (4) and taking Ms(B) ≈ Ms(C) into consideration, we have(in unit of kOe):
Hcj(C)/Ms(C) = 0.850[Ha(B) + 2.80]/Ms(C) − 4.20 (5)
Equation (5) is slightly different from equation (3).It has been observed that the modification of coercivity on Nd-Fe-B magnet by the GBD process
is sensitive to rare-earth oxides with different rare earths.22 The Tb oxide is the best to increase theHcj due to Tb2Fe14B with the highest uniaxial anisotropy, while the Sm oxide drastically decreasesthe coercivity due to Sm2Fe14B with strong planar anisotropy. This indicates that although themagnetocrystalline anisotropy field Ha keeps unchanged on the entire Nd2Fe14B-structure main phaseduring the GBD process, but the Ha of the surface layers of the main phase grains is influenced. By theGBD treatment, the enhancement of intrinsic coercivity Hcj is caused not only by the improvementof microstructure but also by the increase of Ha in the grain surface layer. Suppose each main phasegrain in sintered magnet is composed of kernel and surface layer. The kernel and surface layer havedifferent intrinsic magnetic properties, especially the magnetocrystalline anisotropic fields. Andthe GDB treatment only affects the properties of surface layer. Then we may write the followingrelationship for Hcj (C) (assuming Ms(B) ≈ Ms(C)):
Hcj(C)/Ms(C) = [α(B) + �α][Ha(B) + �Ha]/Ms(C) − [Nef f (B) + �Nef f ] (6)
Re-writing equation (5) in the form of equation (6) and taking the coefficients of α(B) and Neff(B)from equation (2), one can get �α = 0.025, �Ha = 2.80 kOe, and �Neff = 0.13. The Hcj enhancementseems to be from two parts respectively: the microstructure improvement by 3% (�α/α(B)) and theHa increase of the surface layers of the main phase grains by 2.80 kOe. And the Hcj is weakened bythe magnetostatic interaction increase by 3% (�Neff/ Neff(B)).
Improving Hcj is an important way to increase thermal stability of magnets.6 Contradicting to thelarge magnetocrystalline anisotropy field Ha of Nd2Fe14B-type main phase, the intrinsic coercivityHcj of sintered magnet is far lower than Ha. For example, at room temperature the Ha is 76 kOe forNd2Fe14B compound. But for sintered Nd-Fe-B magnet without heavy rare earth, the correspondingintrinsic coercivity Hcj is only 11 kOe for conventional manufacture routine. The ratio of Hcj to Ha
Downloaded 16 Aug 2013 to 111.193.240.134. All article content, except where otherwise noted, is licensed under a Creative Commons Attribution 3.0 Unported license.See: http://creativecommons.org/licenses/by/3.0/

042136-16 Hu et al. AIP Advances 3, 042136 (2013)
TABLE III. Weight loss of PCT (120 ◦C, 100%RH relative humidity, with condensation of water vapor).
Weight loss Whole surface (mg/cm2) Two pole surface (mg/cm2)Exposing time 96 h 96 h + 96 h 96 h 96 h + 96 h
Specimen B −1.3 −3.2 −2.5 −6.2Specimen C −1.4 −2.7 −2.7 −5.2
is Hcj/Ha = 14.5%. Many activities have been focusing on narrowing this gap and increase the ratio.By reducing the jet milling particle size to 1μm, the Hcj can reach 20 kOe and Hcj/Ha = 26%.4
In this work, at temperature of 20 ◦C, the Hcj/Ha = 31.6kOe/104kOe = 30.4% for the optimizedmagnet and Hcj/Ha = 35.2kOe/104kOe = 33.8% for GBD treated magnet. The advantage of ourGBD process is to enhance the intrinsic coercivity about 11.4%, but only to reduce the remanenceabout 1.5%.
D. Corrosion resistance before and after GBD treatment
The corrosion resistance of magnets has been examined by Pressure Cooker Test (PCT) for96 hours and 192 hours under the condition of 120 ◦C, 100%RH relative humidity, with condensationof water vapor (according to JEDEC standard: JESD22-A102D, Accelerated Moisture Resistance-Unbiased Autoclave). The weight loss of a sintered magnet is defined by WL = (W1−W0)/S0 inwhich W0 and W1 are the weight of the sample before and after test, and S0 is the surface area ofthe sample before test. It was found that both magnets with and without GBD treatment have littledifference on weight loss (see Table III). It was also found that the weight loss on the two polesurfaces (c-axis as the normal direction) is much bigger than that of the side surfaces (in which thec-axis lies). This anisotropic corrosion phenomena was also observed by others.45, 46 So, the weightlosses of unit surface area from PCT were calculated in two ways: weight loss divided either bytotal surface area or only by area of two pole surfaces. The absolute value of weight losses for bothsamples are ≤3.2 mg/cm2 based on the total surface, and ≤6.2 mg/cm2 based on the two pole surface.The latter is almost doubled. The PCT result indicates that our GBD treatment has no negative effecton the corrosion resistance of the magnets.
IV. CONCLUSION
In this work, we have developed a new procedure to significantly improve Hcj and keep a highmaximum energy product of sintered Nd-Fe-B magnet. This new procedure is an optimized routinecompare to the conventional one. It consists of an optimized composition design, optimized stripcasting, jet milling and low temperature sintering, especially an excellent grain boundary diffusion(GBD) technique.
A magnet with remarkably high performance has been achieved with intrinsic coercivity Hcj
as 35.2 kOe (2803 kA/m) and maximum energy product (BH)max as 40.4MGOe (321.6kJ/m3) at20 ◦C. They give Hcj (kOe) + (BH)max (MGOe) > 75. The temperature coefficients of remanenceand intrinsic coercivity between temperature of 20 ◦C and 200 ◦C are αBr(C) = −0.122 %/ ◦C andαHcj(C) = −0.403 %/ ◦C, respectively. A maximum operating temperature of 230 ◦C is obtained withpermeance coefficient Pc = −B/H = 2. It is found that the intrinsic coercivity of the GBD treatedmagnet Hcj(C) has a linear relationship with that of non-treated magnet Hcj(B) between 200 K and393 K: Hcj(C) = 1.03Hcj(B) + 2.38. The enhancement of Hcj by GBD treatment has contributionsnot only from the improvement of microstructure but also from the increase of Ha in the grain surfacelayer.
Taking the measurement uncertainty into consideration, the intrinsic properties of 4πMs, Ha
and TC values of the GBD treated magnet are nearly the same as the optimized magnet without GBDtreatment. It indicates that our new GBD process has no obvious effect on the Nd2Fe14B-structuremain phase in the magnets. The Dy diffusion mainly affects the microstructure of the optimized
Downloaded 16 Aug 2013 to 111.193.240.134. All article content, except where otherwise noted, is licensed under a Creative Commons Attribution 3.0 Unported license.See: http://creativecommons.org/licenses/by/3.0/

042136-17 Hu et al. AIP Advances 3, 042136 (2013)
magnet and increase the magnetocrystalline anisotropic field in surface layer of main phase grainto enhance the intrinsic coercivity Hcj without significant reduction of the remanence Br and themaximum energy product (BH)max. Our new GBD method also brings no deterioration in corrosionresistance of magnet.
ACKNOWLEDGMENTS
This work was supported by the National High-Tech Research and Development Program ofChina (863 Program). The project numbers are 2010AA03A401 and 2011AA03A401.
1 M. Sagawa, S. Fujimura, N. Togawa, H. Yamamoto, and Y. Matsuura, J. Appl. Phys. 55, 2083 (1984).2 J. J. Croat, J. F. Herbst, R. W. Lee, and F. E. Pinkerton, J. Appl. Phys. 55, 2078 (1984).3 A. S. Kim and F. E. Camp, J. Appl. Phys. 79, 5035 (1996).4 R. Goto, M. Matsuura, S. Sugimoto, N. Tezuka, Y. Une, and M. Sagawa, J. Appl. Phys. 111, 07A739 (2012).5 H. Sepehri-Amin, Y. Une, T. Ohkubo, K. Hono, and M. Sagawa, Scripta Mater. 65, 396 (2011).6 B. M. Ma, W. L. Liu, Y. L. Liang, D. W. Scott, and C. O. Bounds, J. Appl. Phys. 75, 6628 (1994).7 S. Pandian, V. Chandrasekaran, G. Markandeyulu, K. J. L. Iyer, and K. Rao, J. Alloys Compd. 364, 295 (2004).8 R. S. Mottram, A. J. Williams, and I. R. Harris, J. Magn. Magn. Mater. 217, 27 (2000).9 M. Sagawa, S. Fujimura, H. Yamamoto, Y. Matsuura, and K. Hiraga, IEEE Trans. Magn. 20, 1584 (1984).
10 J. F. Herbst, Rev. Mod. Phys. 63, 819 (1991).11 L. Pareti, F. Bolzoni, M. Solzi, and K. H. J. Buschow, J. Less-Common Met. 132, L5 (1987).12 P. C. Dent, J. Appl. Phys. 111, 07A721 (2012).13 M. Endoh, M. Tokunaga, and H. Harada, IEEE Trans. Magn. 23, 2290 (1987).14 J. Strzeszewski, G. C. Hadjipanayis, and A. S. Kim, J. Appl. Phys. 64, 5568 (1988).15 S. Hirosawa, H. Tomizawa, S. Mino, and A. Hamamura, IEEE Trans. Magn. 26, 1960 (1990).16 W. Rodewald and W. Fernengel, IEEE Trans. Magn. 24, 1638 (1988).17 S. Pandian, V. Chandrasekaran, G. Markandeyulu, K. J. L. Iyer, and K. Rao, J. Appl. Phys. 92, 6082 (2002).18 M. Tokunaga, H. Kogure, M. Endoh, and H. Harada, IEEE Trans. Magn. 23, 2287 (1987).19 G. H. Yan, R. J. Chen, Y. Ding, S. Guo, D. Lee, and A. R. Yan, in 2nd International Symposium on Advanced Magnetic
Materials and Applications, Sendai, 2010, edited by M. Takahashi, H. Saito, S. Yoshimura, K. Takanashi, M. Sahashi, andM. Tsunoda [J. Phys.: Conference Series 266 No.012052 (2011)].
20 H. Nakamura, K. Hirota, T. Minowa, and M. Honshima, in IEEE International Magnetics Conference, Nagoya, 2005 [IEEETrans. Magn. 41, 3844–3846 (2005)].
21 K. Hirota, H. Nakamura, T. Minowa, and M. Honshima, IEEE Trans. Magn. 42, 2909 (2006).22 H. Nakamura, K. Hirota, T. Minowa, and M. Honshima, J. Magn. Soc. Jpn. 31, 6 (2007).23 D. Li, S. Suzuki, T. Kawasaki, and K. Machida, Jpn. J. Appl. Phys. 47, 7876 (2008).24 N. Oono, M. Sagawa, R. Kasada, H. Matsui, and A. Kimura, J. Magn. Magn. Mater. 323, 297–300 (2010).25 N. Watanabe, M. Itakura, N. Kuwano, D. Li, S. Suzuki, and K. Machida, Mater. Trans. 48, 915 (2007).26 H. Nakamura, K. Hirota, T. Ohashi, and T. Minowa, J. Phys. D: Appl. Phys. 44, 064003 (2011).27 M. S. Yasuhiro Une, J. Jpn. Inst. Met. 76, 12 (2012).28 B. C. Chen, X. M. Liu, R. J. Chen, S. Guo, D. Lee, and A. Yan, J. Alloys Compd. 516, 73 (2012).29 J. Fidler and T. Schrefl, J. Appl. Phys. 79, 5029 (1996).30 M. Katter, L. Zapf, R. Blank, W. Fernengel, and W. Rodewald, IEEE Trans. Magn. 37, 2474 (2001).31 Y. Kato, J. Appl. Phys. 85, 4868 (1999).32 G. Bai, R. W. Gao, Y. Sun, G. B. Han, and B. Wang, J. Magn. Magn. Mater. 308, 20 (2007).33 R. Kopp, F. Hagemann, L. Hentschel, J. W. Schmitz, and D. Senk, J. Mater. Process. Technol. 80-1, 458 (1998).34 B. Wang, H. Q. Liu, R. W. Gao, and G. B. Han, J. Funct. Mater. Devices 10, 37 (2004).35 A. S. Kim and F. E. Camp, IEEE Trans. Magn. 31, 3656 (1995).36 Y. Matsuura, S. Hirosawa, H. Yamamoto, S. Fujimura, and M. Sagawa, Appl. Phys. Lett. 46, 308 (1985).37 D. X. Chen, E. Pardo, and A. Sanchez, IEEE Trans. Magn. 38, 1742 (2002).38 C. D. Fuerst, J. F. Herbst, and E. A. Alson, J. Magn. Magn. Mater. 54–7, 567 (1986).39 R. Grossinger, R. Krewenka, X. K. Sun, R. Eibler, H. R. Kirchmayr, and K. H. J. Buschow, J. Less-Common Met. 124,
165 (1986).40 L. Q. Yu, Y. H. Wen, and M. Yan, J. Magn. Magn. Mater. 283, 353 (2004).41 P. Tenaud, F. Vial, and M. Sagawa, IEEE Trans. Magn. 26, 1930 (1990).42 F. Kools, J. Phys. 46, C6-349 (1985).43 M. Sagawa and S. Hirosawa, J. Phys. 49, C8-617 (1988).44 H. Kronmuller, Phys. Status Solidi B: Basic Research 144, 385 (1987).45 A. S. Kim, F. E. Camp, and T. Lizzi, J. Appl. Phys. 79, 4840 (1996).46 M. Rada, A. Gebert, I. Mazilu, K. Khlopkov, O. Gutfleisch, L. Schultz, and W. Rodewald, J. Alloys Compd. 415, 111
(2006).
Downloaded 16 Aug 2013 to 111.193.240.134. All article content, except where otherwise noted, is licensed under a Creative Commons Attribution 3.0 Unported license.See: http://creativecommons.org/licenses/by/3.0/