STUDY OF REGENERATIVE BRAKING OF … Shoubra/Electrical...STUDY OF REGENERATIVE BRAKING OF...
16
STUDY OF REGENERATIVE BRAKING OF ELECTRICAL VEHICLES Samy M. Ghania Shoubra Faculty of Engineering – Benha University – Cairo _Egypt [email protected] ABSTRACT The optimized use of the energy stored in induction motors during deceleration is still a competitive challenge especially for Electrical Vehicles (EV) drive systems designer and manufactures. There are many control algorithms depending on many different methodologies to reach a balance point to determine when exactly the regenerative braking will be used effectively and how long that whether it will be remained usage rather using the normal mechanical braking. The drive system allows the control/conversion of the mechanical energy stored in the EV’s inertial mass to convert the kinetic energy into electric energy. Further benefits of regenerative braking is fuel saving rather than the corresponding internal combustion engine ICE while ramp down/deceleration. This paper presents the simulated model and the concept of the control algorithm used in electrical vehicles. Moreover, it presents the main factors that affect the regenerated power and the optimization of using regenerative brake. Besides that, it presents the effects of using different super capacitor sizes on the regenerative power and the voltage profile. Moreover, to verify the validity and reliability of the developed control model, a permanent magnet synchronous motor is used and its results are compared with induction motors. Keywords :- Super capacitor –Electrical vehicles- regenerative braking. دراسةلطاقة ا و المرتجعة الل للكھربائية افرامل بال مولدةلكھربائية ارات سيا د/ غنية العزيز عبد محمد سامي عربى ملخص: يزال ا تمثلتباطؤ ا أثناء الحث محركات في المخزنةلطاقة ا منمثل ا ستخدام بالنسبة خاصة تنافسية تحديا للكھربائية اراتلسيا ل ال مصممي و لمھندسييضا ا و محرك ات الحثية. و من العديد ھناك بالرياضياتتمثيل ال طرق ال معرفة ولتجكم ل منھجيات ال بالضبط لتحديد توازن نقطة إلىوصولل ل مختلفةمثلي الستفادة ا و ع فعال نحو لى التي والمدةستف ا يتم منھا ادة بدستخدام ا منلعادي افراملل للميكانيكية ا. و نظم يجبلكھربائية اراتلسيا ل التحريك ت انلمحرك ل سمح بلميكانيكية الطاقة ا تحويل الحركيةممثلة ال كتلة في ا التحركثناء السيارة ا و الذاتي القصور عندس منحدر علي اوالتحركلميكانيكية افراملل للسائق ا استخدام ف اولتباطؤ ا ال الي كھربائيةلطاقة ا طاقة لكي يعادلبطاربات ا شحن في منھاستفادة ا وب ذلك يكون فوائد منلكھربائية افرامل المستھلكة اللطاقة ا من توفيرجزء ھو. و ھذا يعرض ال بحث محاكاة نموذج حثي محرك بأستخدام الكھربأئيةراتلسيا ل الدفع لنظام. فإن، ذلك علىوة وع ه على تؤثر التي الرئيسيةعوامل ال يعرض مديفرامل ال استخدام منستفادة ا الكھربأئية على عليفرامل ال حسابلميكانيكية ا. حجام ا مختلف استخدام عنلناجمة اأثيرات الت يعرض فإنه ذلك الىضافة وبا من على مكثف سوبر مدي المرتجعةلطاقة ا منستفادة ا. على تأكيدعمل ل و تزامنى محرك على تطبيقة تم المقترح التحكم نظام فاعلية مدى حيث من الحثى المحرك بنتائج بهلخاصة النتائج ا مقارنة تم و ثابتةاقطاب ب المرتجعةلطاقة ا منستفادة ا مدي. 1. INTRODUCTION
Transcript of STUDY OF REGENERATIVE BRAKING OF … Shoubra/Electrical...STUDY OF REGENERATIVE BRAKING OF...

STUDY OF REGENERATIVE BRAKING OF ELECTRICAL VEHICLES
Samy M. Ghania
Shoubra Faculty of Engineering – Benha University – Cairo _Egypt [email protected]
ABSTRACT The optimized use of the energy stored in induction motors during deceleration is still a competitive challenge especially for Electrical Vehicles (EV) drive systems designer and manufactures. There are many control algorithms depending on many different methodologies to reach a balance point to determine when exactly the regenerative braking will be used effectively and how long that whether it will be remained usage rather using the normal mechanical braking. The drive system allows the control/conversion of the mechanical energy stored in the EV’s inertial mass to convert the kinetic energy into electric energy. Further benefits of regenerative braking is fuel saving rather than the corresponding internal combustion engine ICE while ramp down/deceleration. This paper presents the simulated model and the concept of the control algorithm used in electrical vehicles. Moreover, it presents the main factors that affect the regenerated power and the optimization of using regenerative brake. Besides that, it presents the effects of using different super capacitor sizes on the regenerative power and the voltage profile. Moreover, to verify the validity and reliability of the developed control model, a permanent magnet synchronous motor is used and its results are compared with induction motors.
Keywords :- Super capacitor –Electrical vehicles- regenerative braking.
سيارات الكھربائيةمولدة بالفرامل الكھربائية للالالمرتجعة والطاقة دراسة سامي محمد عبد العزيز غنية/د
:ملخص عربى
ل تحديا تنافسية خاصة بالنسبة ستخدام األمثل من الطاقة المخزنة في محركات الحث أثناء التباطؤ تمثالاال يزال طرق التمثيل بالرياضيات ھناك العديد منو. الحثية اتمحركو ايضا لمھندسي و مصممي ال للسيارات الكھربائية لى نحو فعال عو االستفادة المثلي مختلفة للوصول إلى نقطة توازن لتحديد بالضبطالمنھجيات للتجكم و معرفة ال
التحريك للسيارات الكھربائية يجب نظمو. الميكانيكيةللفرامل العادي من االستخدام بدال ادة منھايتم االستف والمدة التيعند القصور الذاتي والسيارة اثناء التحرك ا في كتلة الممثلة الحركية تحويل الطاقة الميكانيكيةب سمح للمحركان ت
يعاد لكي طاقة الطاقة كھربائيةالي ال التباطؤاو ف استخدام السائق للفرامل الميكانيكية اوالتحرك علي منحدر الس .ھو توفيرجزء من الطاقة المستھلكة الفرامل الكھربائيةمن فوائد يكون ذلك وب االستفادة منھا في شحن البطاربات
ه وعالوة على ذلك ، فإن. لنظام الدفع للسيارات الكھربأئية بأستخدام محرك حثينموذج محاكاة بحث اليعرض ھذا وحساب الفرامل علي على الكھربأئية االستفادة من استخدام الفراملمدي يعرض العوامل الرئيسية التي تؤثر على
مدي سوبر مكثف على من وباالضافة الى ذلك فإنه يعرض التأثيرات الناجمة عن استخدام مختلف األحجام. الميكانيكيةمدى فاعلية نظام التحكم المقترح تم تطبيقة على محرك تزامنى و لعمل تأكيد على .االستفادة من الطاقة المرتجعة
.مدي االستفادة من الطاقة المرتجعةباقطاب ثابتة و تم مقارنة النتائج الخاصة به بنتائج المحرك الحثى من حيث
1. INTRODUCTION

A short term solution to the demand of cleaner transportation is electric vehicle technology. Electrical vehicle uses two or more different technologies to store and convert energy to propulsion power. The majority of electrical vehicles are hybrid vehicles which use alternative technologies to complement the power delivery of a combustion engine, to give a more efficient conversion of hydrocarbon fuel to vehicle propulsion energy. The alternative energy storage systems include batteries, hydraulic accumulators and flywheels. To satisfy consumer demand the performance of hybrid vehicles must be competitive with conventional vehicles. Also the vehicle’s operation must be seamless to the driver, with no extra driver interaction required to operate the hybrid system. An important component in reducing hybrid fuel consumption is a regenerative braking system [1-2]. A regenerative system captures the braking energy usually lost as heat in the disk or drum brakes of a conventional vehicle. Current production hybrids utilize a limited electric motor / battery regenerative system. The regenerative braking is generally limited by the amount of current that can be used to recharge the battery pack since battery life is reduced with high power charge and discharge cycles [3-4]. All parts in electric vehicles are often considered as one unit and the entire vehicle is treated as one lumped mass in acceleration or deceleration performance analyses. All inertias of rotating components such as motor/generator (M/G), driveline, and assemblies of wheels and tires are lumped into an equivalent inertial mass and the combination of the equivalent mass and the mass of the test vehicle becomes an effective mass. An electro-mechanical system that represents the ac induction motor drive and the inertia of an electric car is implemented in Matlab/Simulink considering the most important parts: induction motor (IM),and the mechanical system (flywheel, disc brakes, bearings,transmission and shaft), based on [5,6] as shown in Figure 1. This intelligent controller (Fuzzy Controller) aims to perform a better following of driving speed set point and improve the regenerative braking by diminish the action of the dissipative mechanical brake. Figure 2 shows the state of charge (SOC) of battery with and without regenerative braking, in which the number of cycles is recorded. As a result, the driving range (No. of drive cycles) with regenerative braking system increases from 50 to 60 cycles and generally, regenerative brake can increase the driving cycles up to maximum of 20% [7].
Fig. 1: Schematic diagram of the simulated model

Fig. 2: State of charge of lead acid batteries during the driving range test
The application of batteries and ultracapacitors in electric energy storage units for battery powered (EV) and charge sustaining and plug-in hybrid-electric (HEV and PHEV) vehicles have been studied in detail [8]. The energy and power density characteristics of both battery and ultracapacitor technologies are sufficient for the design of attractive EVs, HEVs, and PHEVs. Charge sustaining, engine powered hybrid-electric vehicles (HEVs) can be designed using either batteries or ultracapacitors with fuel economy improvements. Mild hybrid-electric vehicles (MHEVs) can be designed using ultracapacitors having an energy storage capacity of 75-150 Wh. The fuel economy improvement with the ultracapacitors is 10%-15% higher than with the same weight of batteries due to the higher efficiency of the ultracapacitors and more efficient engine operation Table 1 presents the different types and sizes of the applied capacitors used in electrical vehicles.
Table 1: Ultra-capacitor different sizes
2. SYSTEM SIMULATION
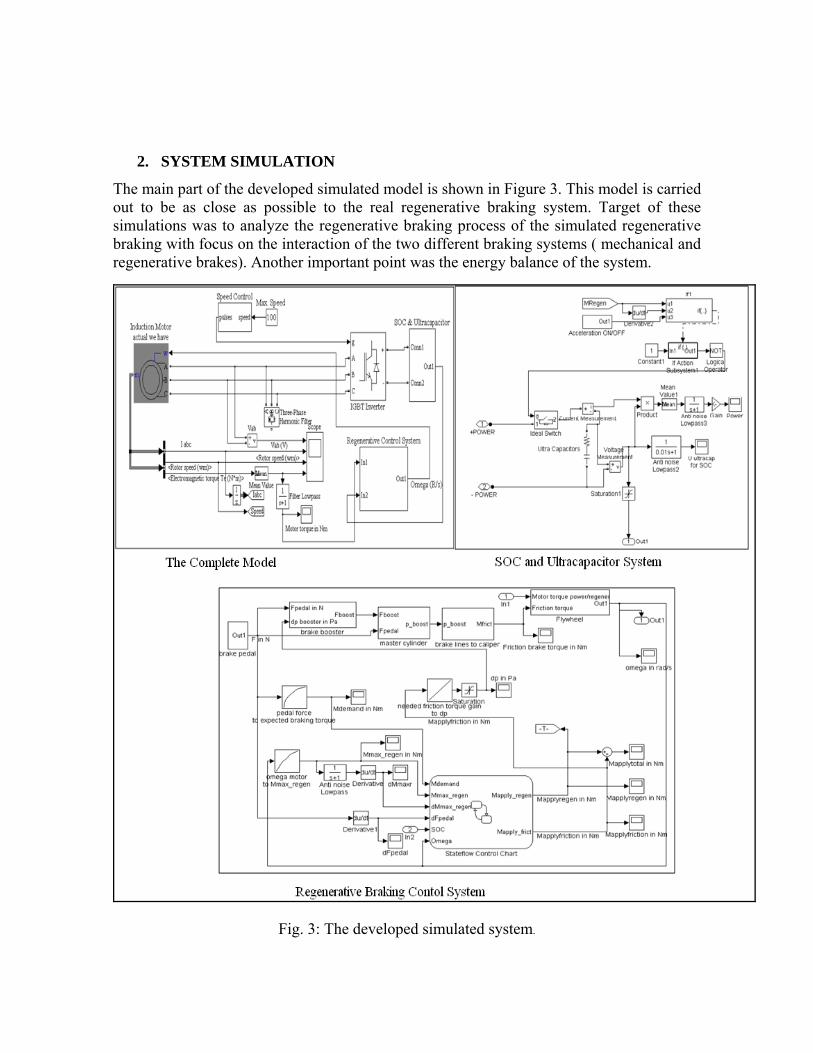
The main part of the developed simulated model is shown in Figure 3. This model is carried out to be as close as possible to the real regenerative braking system. Target of these simulations was to analyze the regenerative braking process of the simulated regenerative braking with focus on the interaction of the two different braking systems ( mechanical and regenerative brakes). Another important point was the energy balance of the system.
Fig. 3: The developed simulated system.

The Simulink blocks of the simulation model can be separated into three different parts. The first part presents the complete simulated system. The second part presents the main blocks to simulate the ultracapacitor and its state of charge measuring system. The third part includes the blocks which simulate the physical components of the regenerative braking and the control system which are realized with standard Simulink blocks and State flow blocks. This comprises the State flow control chart as main control for the two different brake systems. This state flow system cooperates with the induction motor vector control (which is responsible for the motor driving) to optimize the regenerative braking and to adjust on/off control system for the connection and disconnection of the ultra-capacitors from the inverter system.
3. – SIMULATION RESULTS
Table 2 presents the main simulation parameters of the motor and the whole mechanical system. The simulation time for these simulations was set to 10 s to allow the acceleration to a sufficient motor speed and a braking sequence to stop the system. Within the first seven seconds the motor connected to the flywheel was accelerated. At the next two seconds the spinning system was decelerated down to zero via regenerative braking and friction braking. In the last second of the simulation the system was in idling mode. The behavior of the motor speed is shown in Figure 4.
Table 2: The main simulation parameters.

Fig. 4: Rotation speed of the motor (one drive cycle).
One of the most important result parameters for the regenerative braking simulation was the voltage of the ultra-capacitor stack USOC which indicates the State Of Charge SOC of the ultra-capacitors. At the beginning of the simulation the voltage of the stack was set to 350 V. During acceleration of the system energy is derived from the ultra-capacitors and the voltage drops down to 308 V. At the regenerative braking process part of the energy is feed back to the ultra-capacitors and the voltage rises up from 317 V to about 326 V as shown in Figure 5. Thus approximately 20 % of the voltage drop during acceleration cycle is compensated due to regenerative braking.
Fig. 5: Voltage of the Ultra-capacitor stack

Another interesting parameter at the regenerative braking process is the power flow from and to the ultra-capacitors. This is displayed in Figure 6. The negative power means the power flows from the ultra-capacitors to the system and a positive power stands for a power flow in direction of the ultra-capacitors. The power value is also used in the power on/off control to disconnect the ultra-capacitor stack from the system if the regenerative power drops under a certain threshold. Below this threshold regenerative braking is no longer effective. For the simulations this threshold is set at 500 W.
Fig. 6: Power flow from/to the ultra-capacitor stack
The demanded regenerative braking torque Mcontrol_regen and the demanded friction braking torque Mcontrol frict are shown in Figure 7 and are compared to the actual torques applied. There Mmotor equals the torque applied by the induction motor and Mfrict equals the torque applied by the friction brakes. The motor torque Mmotor thereby shows positive values which stand for acceleration of the motor and negative values which stand for deceleration of the motor. In Figure 7 first the motor torque Mmotor shows a strong positive value because of the acceleration of the system at the beginning. Seven seconds after the start of the simulation, the brake is applied. Then with a small delay caused by the brake pedal. The brake control system gets an input signal which causes an increasing output signal for the demanded regenerative torque Mcontrol regen. At this time the Stateflow brakes control chart switches from the Off state in the brake state with the Regenerative only. substate. At the same time the friction brake already applies a slowly increasing torque Mfrict even if the demanded friction torque Mcontrol frict is still zero. The reason therefore is that the force applied at the brake pedal is finally transferred to the friction brakes. At about 8 seconds after the simulation start the demanded braking torque exceeds the torque that can be provided by the regenerative braking system and thus the demanded friction torque Mfrict increases.
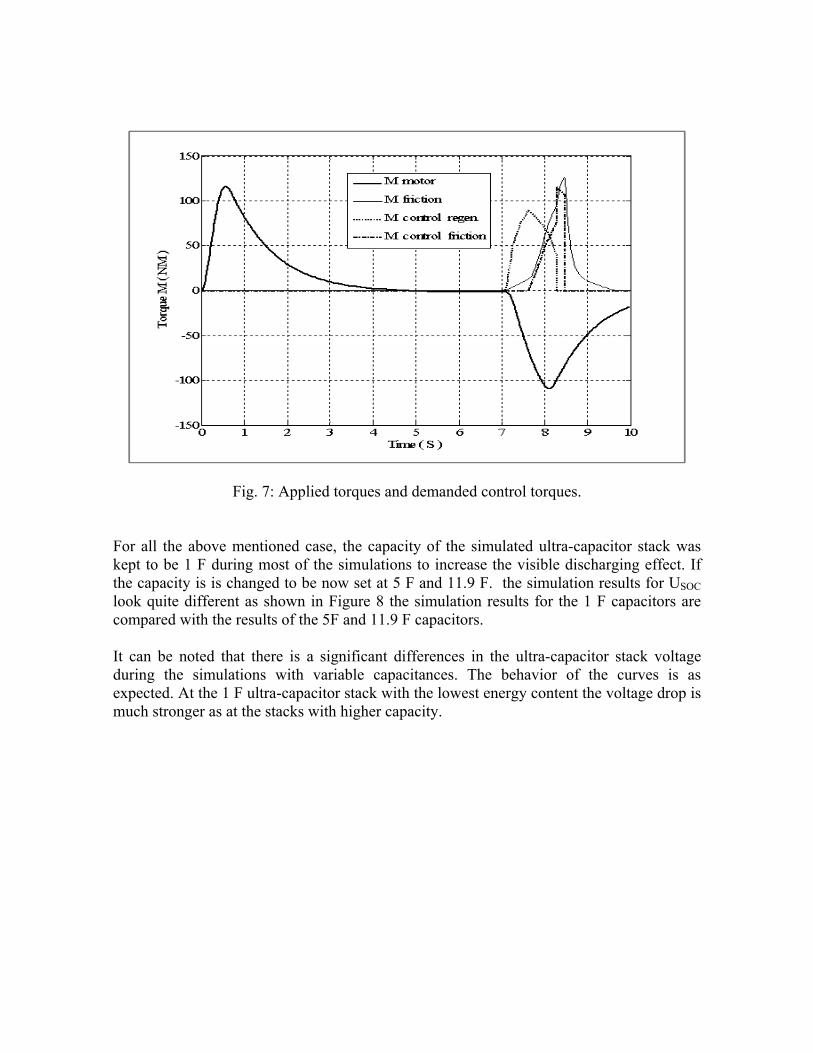
Fig. 7: Applied torques and demanded control torques.
For all the above mentioned case, the capacity of the simulated ultra-capacitor stack was kept to be 1 F during most of the simulations to increase the visible discharging effect. If the capacity is is changed to be now set at 5 F and 11.9 F. the simulation results for USOC look quite different as shown in Figure 8 the simulation results for the 1 F capacitors are compared with the results of the 5F and 11.9 F capacitors. It can be noted that there is a significant differences in the ultra-capacitor stack voltage during the simulations with variable capacitances. The behavior of the curves is as expected. At the 1 F ultra-capacitor stack with the lowest energy content the voltage drop is much stronger as at the stacks with higher capacity.

Fig. 8: Ultra-capacitor voltage with different Stacks capacities of 1 F, 5 F and 11.9 F.
The brake torque demand (which controls the time to reach zero speed) is another interesting parameter to be changed and investigated. The variation of this parameter will change the behavior of both brake systems and finally the amount of regenerated energy. Different brake torque demands are applied on the regenerative braking system. All the other parameters were still the same. The motor speed behavior shows some differences as shown in Figure 9. The curve with the high braking demand drops down rather quickly and reaches zero speed after approximately 8.6 s. The curve with the low braking demand decreases slower and reaches zero speed at approximately 9.9 s after the simulation start. All this finally also has an influence on the regenerated energy during the regenerative braking process. The difference in the SOC curves between the two braking demands is displayed in Figure 10.

Fig. 9: The motor speed with the two different brake demands
The difference between the final USOC of the two curves is approximately 3 V. The low braking demand curve reaches 326 V and the high braking demand curve reaches 329V at the end of the simulation. So the amount of regenerated energy is noticeably higher at the low braking demand. The reason is that the slower increase of the braking demand at the low demand curve keeps the system longer in the Regenerative only state of the State flow brake control chart which leads to a higher amount of regenerated energy. At the high demand curve the strong increase of demanded braking torque pushes the State flow chart quickly from the Regenerative only state into the Standard state because the regenerative braking system can’t provide all the demanded torque alone. It can be noted that at low braking demand curve the compensation by regenerative braking equals 20.8 % of the energy used for the initial acceleration process. Meanwhile, At the high braking demand curve this value is much lower with only 16.2 %. There the applied brake force was approximately the mean value of the low and high braking demand curve. This leads to energy compensation of 18.5 % due to regenerative braking what is also in the middle between the two values discussed above.

Fig. 10: Voltage of the Ultra-capacitor stack for the different brake demands
During an emergency brake situation the brake pedal force and so the demanded braking torque Mdemand reaches very high values. These values exceed the braking torque provided by the regenerative braking system by far. Only the friction braking system can provide such high braking torque demands. Thus the regenerative braking system is shut off at such emergency brake events and only the friction braking system provides the full braking torque as shown in Figure 11.
Fig. 11: Voltage of Ultra-capacitor stack at an emergency brake situation

Drive cycles are a very common tool to compare the fuel consumption of different cars. Figure 12 presents two different drive cycles used in the simulation which contains eight acceleration periods and eight braking periods. The drive cycles time is set to 80 s with the same sample time and parameters as the simulation as before with only the ultra-capacitor stack capacity was increased to 11.9 F to provide enough energy and to support more constant voltage for the longer simulation time. Figure 13 shows the voltage curve of the regenerative braking drive cycle for the two different considered drive cycles. The conventional cycle uses the same model as the regenerative but the regenerative braking system is shut off completely and all the braking is done by the friction brakes.
It can be noted that with regenerative braking drive cycle ( Continuous Drive Cycle), a steady voltage decrease interrupted only by the regenerative braking events which has a smaller voltage drop rather than with the conventional cycle shows a non-stop decreasing voltage ( Discrete Drive Cycle)
0 10 20 30 40 50 60 70 800
50
100
150
Time ( S )
Mot
or S
peed
( R
ad/S
)
0 10 20 30 40 50 60 70 800
20
40
60
80
100
120
Time ( S )
Mot
or S
peed
( R
ad/S
)
Conventional Brake (Discrete Drive Cycle)
Regenerative Brake (Continuous Drive Cycle)
Fig. 12: The motor speed during the regenerative braking drive cycle.

Fig. 13: The voltage of the ultra-capacitor stack for the regenerative and conventional drive
cycles.
Figure 14 presents implementation of the developed control model with a permanent magnet synchronous motor with the main specifications shown in Table 3.
Table 3: The main specification of the used permanent magnet motor.
Motor Parameters Values
No. of pair of poles 4
Stator resistance 2.8750 Ω
Stator inductance 8.5e-3 H
Voltage ( Line to Line) 350 V
Torque Constant (N.m peak) 24 N.m
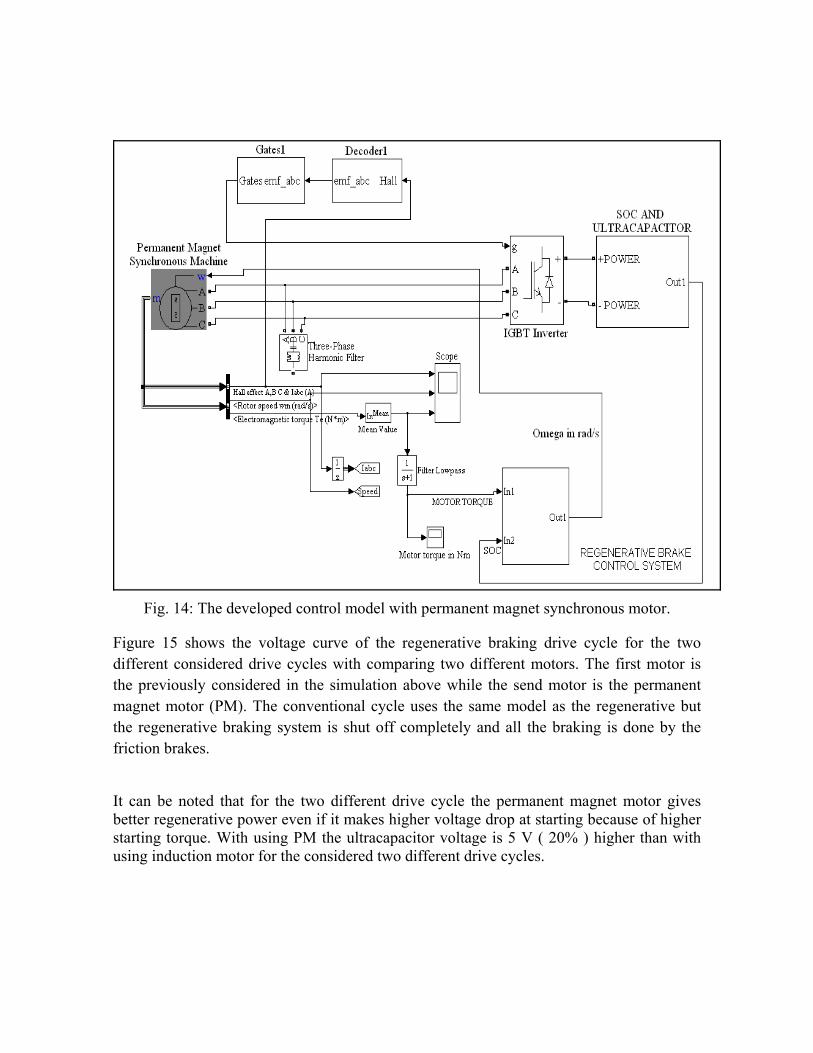
Fig. 14: The developed control model with permanent magnet synchronous motor.
Figure 15 shows the voltage curve of the regenerative braking drive cycle for the two different considered drive cycles with comparing two different motors. The first motor is the previously considered in the simulation above while the send motor is the permanent magnet motor (PM). The conventional cycle uses the same model as the regenerative but the regenerative braking system is shut off completely and all the braking is done by the friction brakes.
It can be noted that for the two different drive cycle the permanent magnet motor gives better regenerative power even if it makes higher voltage drop at starting because of higher starting torque. With using PM the ultracapacitor voltage is 5 V ( 20% ) higher than with using induction motor for the considered two different drive cycles.
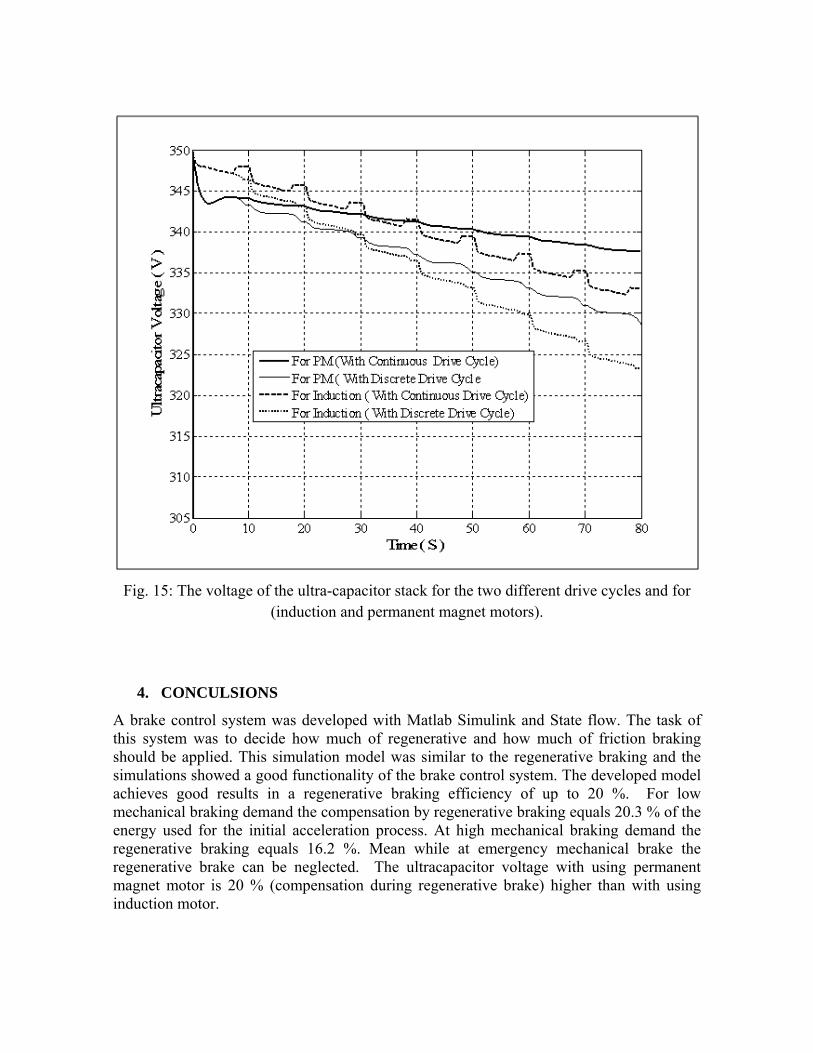
Fig. 15: The voltage of the ultra-capacitor stack for the two different drive cycles and for (induction and permanent magnet motors).
4. CONCULSIONS
A brake control system was developed with Matlab Simulink and State flow. The task of this system was to decide how much of regenerative and how much of friction braking should be applied. This simulation model was similar to the regenerative braking and the simulations showed a good functionality of the brake control system. The developed model achieves good results in a regenerative braking efficiency of up to 20 %. For low mechanical braking demand the compensation by regenerative braking equals 20.3 % of the energy used for the initial acceleration process. At high mechanical braking demand the regenerative braking equals 16.2 %. Mean while at emergency mechanical brake the regenerative brake can be neglected. The ultracapacitor voltage with using permanent magnet motor is 20 % (compensation during regenerative brake) higher than with using induction motor.

5. REFERENCES
[1] S.R.Cikanek, K.E.Bailey. “Regenerative Breaking System for a hybrid Electric Vehicle”. Proceeding of the American Control Conference. Anchorage, AK. 2002, vol. 4, pp.3129-3134.
[2] Gao. Y and Ehsani. M, “Electronic Braking System of EV and HEV-Integration of Regenerative braking, Automatic Braking Force Control and ABS” Future Transportation Technology Conference, Costa Mesa, CA, August 2001.
[3] S. Pay and Y. Baghzouz, “Effectiveness of battery-super capacitor combination in
electric vehicles,” 2003 IEEE Power Tech. Conference Proceedings, Bologna, Italy, Vol.3, pp.6, June 23-26, 2003.
[4] F. Gagliardi and M. Pagano “Experimental results of on-board battery-ultra capacitor
system for electric vehicle applications,”Proceedings of the 2002 IEEE International Symposium on Industrial Electronics, L'Aquila, Italy, Vol.1, pp.93–98, July 8-11, 2002.
[5] S. Cholula, A. Claudio, J. Ruiz ,”Intelligent Control of the Regenerative Braking in an
Induction Motor Drive”, 2nd International Conference on Electrical and Electronics Engineering (ICEEE) and XI Conference on Electrical Engineering (CIE 2005) Mexico City, Mexico. September 7-9, 2005.
. [6] Mahmoud M. Salem,” Classical Controller with Intelligent Properties for Speed control of vector controlled induction Motor”, Journal of Power Electronics, Vol. 8, No. 3, july 2008.
[7] Yee-Pien Yang and Tsung-Hsien Hu ,”A New Energy Management System of
Directly-Driven Electric Vehicle with Electronic Gearshift and Regenerative Braking”, Proceedings of the 2007 American Control Conference Marriott Marquis Hotel at Times Square New York City, USA, July 11-13, 2007
. [8] Burke, A.F.; ,” Batteries and Ultracapacitors for Electric, Hybrid, and Fuel Cell
Vehicles”, Proceedings of the IEEE 2007, Volume: 95 Issue:4, PP 806 – 820.


![REGENERATIVE BRAKING SYSTEM IN ELECTRIC VEHICLES · REGENERATIVE BRAKING SYSTEM IN ELECTRIC VEHICLES ... REGENERATIVE BRAKING SYSTEM ... Regenerative action during braking[9].](https://static.fdocuments.net/doc/165x107/5adccef67f8b9a1a088c7cf0/regenerative-braking-system-in-electric-vehicles-braking-system-in-electric-vehicles.jpg)


![[PPT]Regenerative Braking Systems and their functions · Web viewHow Does Regenerative Braking Work? Regular brakes waste large amounts of useable energy6 Regenerative Braking systems](https://static.fdocuments.net/doc/165x107/5ae8634b7f8b9aee078f7805/pptregenerative-braking-systems-and-their-functions-viewhow-does-regenerative.jpg)