Study of RC Framed Structure using Push over · PDF filePush over analysis is an approximate...
8
International Journal of Engineering Technology, Management and Applied Sciences www.ijetmas.com May 2017, Volume 5, Issue 5, ISSN 2349-4476 436 Mr. Gaurav Pratap Singh, Mr. Mohd. Zain,Er. Shubham Srivastava Study of RC Framed Structure using Push over Analysis Mr. Gaurav Pratap Singh 1 , Mr. Mohd. Zain 2 ,Er. Shubham Srivastava 3, 1 M.tech (structural engineering), Shri RamswaroopMemorial University,LUCKNOW 2 Assistant Professor, Shri RamswaroopMemorial University,LUCKNOW 3 Assistant Professor, Shri Ramswaroop Memorial University,LUCKNOW Abstract: Recent earthquakes in which many concrete structures have been severely damaged or collapsed, have indicated the need for evaluating the seismic adequacy of buildings. About 60% of the land area of our country is susceptible to damaging levels of seismic hazard. We can’t avoid future earthquakes, but safe building construction practices can certainly reduce the extent of damage and loss. To evaluate the performance of framed building under future expected earthquakes, a non-linear static pushover analysis has been conducted. The main aim of this study is to understand the behaviour of Reinforced Concrete framed structures by using nonlinear static procedure (NSP) or pushover analysis in finite element software “SAP2000”.and the Comparative study made for different models in terms of base shear, displacement, performance point Keywords: push over analysis, non linear static procedure, seismic hazard INTRODUCTION This analysis of the non linear response of RC structures to be carried out in a routine fashion. It helps in the investigation of the behavior of the structure under different loading conditions, its load deflection behavior and the cracks pattern. In the present study, the non-linear response of RCC frame using SAP2000 under the loading has been carried out with the intention to investigate the relative importance of several factors in the non- linear analysis of RCC frames. This includes the variation in load displacement graph. Push over analysis is an approximate analysis method in this we monotonically increase forces with an invariant height wise distribution on a structure until we achieve a target displacement. Push over analysis comprises of series of step wise elastic analysis, superimposed to approximate a force displacement curve of the overall structure. A 2D or 3D model with bilinear or trilinear load deformation diagram of all lateral force resisting element is first created and gravity loads are applied initially. Then lateral load which is predefined and distributed along the building height is then applied. The lateral forces are increased until some members yield. The structure model is modified to deal with the reduced stiffness of yielded members and lateral forces are again increased until another member yield. This process is continued until structure under consideration becomes unstable and a control displacement at the top of building is achieved. To get the global capacity curve, the roof displacement is plotted with base shear the next key component of seismic hazard we create the seismic models, forwhich we need translating seismotectonic information into a spatial approximation of earthquake localisation and temporal recurrence. For this we need to compile and view all the available data on neo-tectonics, geodynamics, morph structures etc, on a seismicity map. These maps then need to be carefully studied for defining areal seismic source zones and active faults. For defining the parameters that characterise the seismicity of the sources region, on earthquake recurrence model is then put on these source zone, which can be used as inputs to the algorithm for the computation of seismic hazard viz. fig.1.1 gives a flow chart that represents the important steps in performance-based design process. This process is iterative which begins with the selection of performance objective, followed by the development of a preliminary design an assessment, as to whether or not the design meets the performance objective and finally redesign and reassessment , if required ,until our design
Transcript of Study of RC Framed Structure using Push over · PDF filePush over analysis is an approximate...

International Journal of Engineering Technology, Management and Applied Sciences
www.ijetmas.com May 2017, Volume 5, Issue 5, ISSN 2349-4476
436 Mr. Gaurav Pratap Singh, Mr. Mohd. Zain,Er. Shubham Srivastava
Study of RC Framed Structure using Push over Analysis
Mr. Gaurav Pratap Singh1, Mr. Mohd. Zain
2,Er. Shubham Srivastava
3,
1M.tech (structural engineering), Shri RamswaroopMemorial University,LUCKNOW
2Assistant Professor, Shri RamswaroopMemorial University,LUCKNOW
3Assistant Professor, Shri Ramswaroop Memorial University,LUCKNOW
Abstract:
Recent earthquakes in which many concrete structures have been severely damaged or collapsed, have indicated the
need for evaluating the seismic adequacy of buildings. About 60% of the land area of our country is susceptible to
damaging levels of seismic hazard. We can’t avoid future earthquakes, but safe building construction practices can
certainly reduce the extent of damage and loss. To evaluate the performance of framed building under future expected
earthquakes, a non-linear static pushover analysis has been conducted.
The main aim of this study is to understand the behaviour of Reinforced Concrete framed structures by using nonlinear
static procedure (NSP) or pushover analysis in finite element software “SAP2000”.and the Comparative study made for
different models in terms of base shear, displacement, performance point
Keywords: push over analysis, non linear static procedure, seismic hazard
INTRODUCTION
This analysis of the non linear response of RC
structures to be carried out in a routine fashion. It
helps in the investigation of the behavior of the
structure under different loading conditions, its load
deflection behavior and the cracks pattern.
In the present study, the non-linear response of RCC
frame using SAP2000 under the loading has been
carried out with the intention to investigate the
relative importance of several factors in the non-
linear analysis of RCC frames. This includes the
variation in load displacement graph.
Push over analysis is an approximate analysis
method in this we monotonically increase forces
with an invariant height wise distribution on a
structure until we achieve a target displacement.
Push over analysis comprises of series of step wise
elastic analysis, superimposed to approximate a
force displacement curve of the overall structure. A
2D or 3D model with bilinear or trilinear load
deformation diagram of all lateral force resisting
element is first created and gravity loads are applied
initially. Then lateral load which is predefined and
distributed along the building height is then applied.
The lateral forces are increased until some members
yield. The structure model is modified to deal with
the reduced stiffness of yielded members and
lateral forces are again increased until another
member yield. This process is continued until
structure under consideration becomes unstable and
a control displacement at the top of building is
achieved. To get the global capacity curve, the roof
displacement is plotted with base shear
the next key component of seismic hazard we create
the seismic models, forwhich we need translating
seismotectonic information into a spatial
approximation of earthquake localisation and
temporal recurrence. For this we need to compile
and view all the available data on neo-tectonics,
geodynamics, morph structures etc, on a seismicity
map. These maps then need to be carefully studied
for defining areal seismic source zones and active
faults. For defining the parameters that characterise
the seismicity of the sources region, on earthquake
recurrence model is then put on these source zone,
which can be used as inputs to the algorithm for the
computation of seismic hazard viz. fig.1.1 gives a
flow chart that represents the important steps in
performance-based design process. This process is
iterative which begins with the selection of
performance objective, followed by the
development of a preliminary design an assessment,
as to whether or not the design meets the
performance objective and finally redesign and
reassessment , if required ,until our design

International Journal of Engineering Technology, Management and Applied Sciences
www.ijetmas.com May 2017, Volume 5, Issue 5, ISSN 2349-4476
437 Mr. Gaurav Pratap Singh, Mr. Mohd. Zain,Er. Shubham Srivastava
performance level is achieved (ATC,1977a)
Figure 1.1Performance-Based Design Flow
Diagram
GENERAL DESCRIPTION OF THE
STRUCTURE
Our major objective of this work was to check a
real-life structure under pushover loads. For no
special design of the structure as such war
performed we use choose a portion of real life
existing office building to keep the structure as close
to reality as possible. In this, we check a replica of a
part of an existing office building. The portion was
selected in such a way that it had certain
eccentricities and was un-symmetric in plan
MATERIAL PROPERTIES
We are using material for concrete with M-20 grade
concrete and fe-415 grade reinforcing steel for
construction. The stress-strain relationship will be
same as per IS456:2000. The basic material
properties used are as follows;
Modulus of elasticity of steel, Es=21,0000MPa
Modulus of elasticity of concrete,
EC=22,360.68Mpa
Characteristic strength of concrete, fck=20MPa
Yield stress for steel, fy=415MPa
Ultimate strain in bending, ϵcu=0.0035
MODEL GEOMETRY
The structure used for analysis is a five-storied, two
bays along X-direction and two bays along Y-
direction moment-resisting frame of reinforced
concrete with properties as specified above.
We will use rigid concrete floor. The detail of
model are given as;
Number of stories=5
Number of bays along X-direction=2
Number of bays along Y-direction=2
Story height=3
Bay width along X-direction=4 meters
Bay width along Y-direction=4 meters
3D Model of the Structure
Fig 1.2 3D model of five storey building for push
over analysis
Result and Analysis
COMPARISON BETWEEN THE SAP2000
ANALYSIS AND THE EXPERIMENTAL
RESULTS OF THE FRAME
FIG.1.34 combined pushover curve from
experimental data (reddy. Et.al,2010)

International Journal of Engineering Technology, Management and Applied Sciences
www.ijetmas.com May 2017, Volume 5, Issue 5, ISSN 2349-4476
438 Mr. Gaurav Pratap Singh, Mr. Mohd. Zain,Er. Shubham Srivastava
The behaviour of the frame has been observed to be
linear up to the value of base shear around 230 KN,
whereas the structure has been found to be linear up
to the value of base shear 300 KN in case of
experiment. At this point the flexural tension cracks
at the base of the columns depicting reduction in
stiffness have been observed.
After reaching a base shear value of approximately
425 KN, the cracks at the base of the columns have
been found to open wider and failures at other
location like beams and beam – column joints
started. Whereas in case of experiment at a base
shear value of approximately 500 KN, the cracks at
the base of the columns have been observed and
failures at beam – column joints start to show up.
As a result the stiffness of the frame further goes
down, as can be seen from the pushover curve.
After reaching the base shear values of 660 KN,
displacements have found to be increasing at fast
rate whereas in case of experiment at the base shear
values of 700 KN, the joints of the frame have
found to be displaying rapid degradation and the
inter storey drift increasing rapidly.
Maximum deflection has been found to be more
than 600mm at 902 KN. Maximum deflection is
more than 770mm at 880KN experimentally.
Variety of failures like beam-column joint failure,
flexural failures and shear failures have been
observed almost in the same way as seen in the case
of experiment.
Prominent failures shown by both models have been
the joint failures. Also the severe damages have
been observed at joints of lower floors whereas
moderate damages have been observed in first and
second floors. Minor damage is seen at floor level
in both the cases.
Fig.1.4Graph between resultant base shear
&Monitored Displacement
Fig 1.5 fema 440 equivalent linearization graph
between spectral acceleration & spectral
displacement
Fig 1.6fema 440 displacement modification
graph between base reaction &displacement
Fig 1.7ATC-40 capacity spectram graphbetween
spectral acceleration & spectral displacement

International Journal of Engineering Technology, Management and Applied Sciences
www.ijetmas.com May 2017, Volume 5, Issue 5, ISSN 2349-4476
439 Mr. Gaurav Pratap Singh, Mr. Mohd. Zain,Er. Shubham Srivastava
Fig 1.8fema 356 coefficient method
graphbetweenbase reaction & displacement
Step by step deformation for pushover
Fig 1.8(a) step 1
Fig 1.8(b) step 2
Fig 1.8(c) step 3
Fig 1.8 (d) step 4

International Journal of Engineering Technology, Management and Applied Sciences
www.ijetmas.com May 2017, Volume 5, Issue 5, ISSN 2349-4476
440 Mr. Gaurav Pratap Singh, Mr. Mohd. Zain,Er. Shubham Srivastava
Fig 1.8 (e) step 5
Fig 1.8 (f) step 6
Fig 1.8 (g) step 7
Fig 1.8 (h) step 8
Fig 1.8 (i) step 9
Fig 1.8 (j) step 10

International Journal of Engineering Technology, Management and Applied Sciences
www.ijetmas.com May 2017, Volume 5, Issue 5, ISSN 2349-4476
441 Mr. Gaurav Pratap Singh, Mr. Mohd. Zain,Er. Shubham Srivastava
Fig 1.8 (k) step 11
Fig 1.8 (l) step 12
Fig 1.8 (m) step 13
Fig 1.8 (n) step 14
Fig 1.8 (o) step 15
Fig 1.8 (p) step 16
International Journal of Engineering Technology, Management and Applied Sciences
www.ijetmas.com May 2017, Volume 5, Issue 5, ISSN 2349-4476
442 Mr. Gaurav Pratap Singh, Mr. Mohd. Zain,Er. Shubham Srivastava
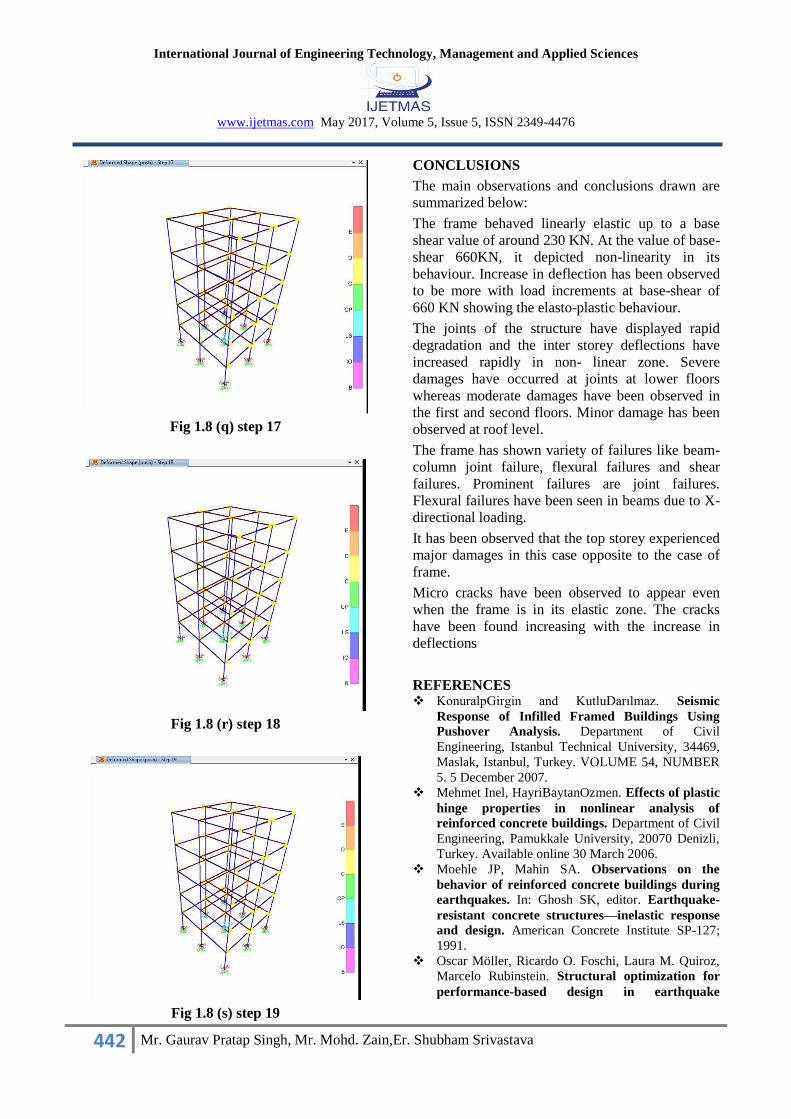
Fig 1.8 (q) step 17
Fig 1.8 (r) step 18
Fig 1.8 (s) step 19
CONCLUSIONS
The main observations and conclusions drawn are
summarized below:
The frame behaved linearly elastic up to a base
shear value of around 230 KN. At the value of base-
shear 660KN, it depicted non-linearity in its
behaviour. Increase in deflection has been observed
to be more with load increments at base-shear of
660 KN showing the elasto-plastic behaviour.
The joints of the structure have displayed rapid
degradation and the inter storey deflections have
increased rapidly in non- linear zone. Severe
damages have occurred at joints at lower floors
whereas moderate damages have been observed in
the first and second floors. Minor damage has been
observed at roof level.
The frame has shown variety of failures like beam-
column joint failure, flexural failures and shear
failures. Prominent failures are joint failures.
Flexural failures have been seen in beams due to X-
directional loading.
It has been observed that the top storey experienced
major damages in this case opposite to the case of
frame.
Micro cracks have been observed to appear even
when the frame is in its elastic zone. The cracks
have been found increasing with the increase in
deflections
REFERENCES KonuralpGirgin and KutluDarılmaz. Seismic
Response of Infilled Framed Buildings Using
Pushover Analysis. Department of Civil
Engineering, Istanbul Technical University, 34469,
Maslak, Istanbul, Turkey. VOLUME 54, NUMBER
5. 5 December 2007.
Mehmet Inel, HayriBaytanOzmen. Effects of plastic
hinge properties in nonlinear analysis of
reinforced concrete buildings. Department of Civil
Engineering, Pamukkale University, 20070 Denizli,
Turkey. Available online 30 March 2006.
Moehle JP, Mahin SA. Observations on the
behavior of reinforced concrete buildings during
earthquakes. In: Ghosh SK, editor. Earthquake-
resistant concrete structures—inelastic response
and design. American Concrete Institute SP-127;
1991.
Oscar Möller, Ricardo O. Foschi, Laura M. Quiroz,
Marcelo Rubinstein. Structural optimization for
performance-based design in earthquake

International Journal of Engineering Technology, Management and Applied Sciences
www.ijetmas.com May 2017, Volume 5, Issue 5, ISSN 2349-4476
443 Mr. Gaurav Pratap Singh, Mr. Mohd. Zain,Er. Shubham Srivastava
engineering: Applications of neural networks.
Structural Safety 31, 490–499. (2009).
Priestley, M. J. N. & Park, R. Strenght and
Ductility of Concrete Bridge Columns Under
Seismic Loading. ACI Structural Journal, Technical
paper, Title n° 84-S8, 79(1), pp. 61-76, January-
February, 1987.
Zou XK. Optimal seismic performance-based
design of reinforced concrete buildings. Ph.D.
dissertation. Hong Kong (PR China): Hong Kong
University of Science and Technology; 2002.
www.architectjaved.com