
Study of Product Take-back Systems: American … · Product Take-back Systems: Mandates...
40
by Lynn Scarlett Policy Study Number 153 October 1999 Washington University in St. Louis Center for the Study of American Business Product Take-back Systems: Mandates Reconsidered
Transcript of Study of Product Take-back Systems: American … · Product Take-back Systems: Mandates...

by Lynn Scarlett
Policy StudyNumber 153
October 1999
Washington University in St. Louis
Centerfor the
Study ofAmericanBusiness
Product Take-back Systems:Mandates Reconsidered

Lynn Scarlett is executive director of the Reason Public PolicyInstitute and vice president for research at the Reason Founda-tion, a Los Angeles-based public policy research organization. Herresearch focuses primarily on environmental issues, with a par-ticular emphasis on solid and hazardous waste, recycling, urbanair quality, environmental risk issues, and market-based environ-mental policy. Scarlett is the author of numerous articles publishedin both academic and general-audience publications.

by Lynn Scarlett
CENTER FOR THE STUDY OF AMERICAN BUSINESS
Policy Study Number 153
October 1999
Product Take-back Systems:Mandates Reconsidered

This booklet is one in a series designed to enhance understand-ing of the private enterprise system and the key forces affecting it.The series provides a forum for considering vital current issues inpublic policy and for communicating these views to a wide audi-ence in the business, government, and academic communities.
The Center for the Study of American Business is a nonprofit,nonpartisan organization funded entirely by grants from founda-tions, business firms, and private citizens. Funding is unrestricted,enabling researchers to maintain academic freedom and ensuringunbiased and independent research. The Center is an integral partof Washington University, which has been granted tax-exempt sta-tus under section 501(c)(3) of the Internal Revenue Code.
Donations can be made to the Center at the following address:
Center for the Study of American BusinessWashington UniversityCampus Box 1027One Brookings DriveSt. Louis, MO 63130-4899
Copyright © 1999 Center for the Study of American Business.All rights reserved.
The opinions expressed are those of the author and not neces-sarily those of the Center for the Study of American Business orWashington University.

Contents
I. Introduction ............................................................... 1
II. EPR Theory Revisited ................................................ 4
What Is Pollution? ...................................................... 5
Who Is the Polluter? .................................................. 6
Boundaries of Responsibility ..................................... 7
III. EPR Expectations and Implementation Challenges .. 8
Goal Tradeoffs ............................................................ 9
Setting Fees ............................................................ 11
Reporting Costs ....................................................... 14
EPR and Packaging Design: The Bottom Line ......... 16
IV. EPR Benefits: A Reality Check ................................ 16
The Case of Germany .............................................. 17
Benefits—The Limiting Factors ............................... 20
V. The Matter of Costs ................................................. 22
The Case of Germany .............................................. 22
Implementation Lessons.......................................... 23
VI. The Rise of Voluntary EPR Programs ...................... 24
Program Challenges ................................................ 27
VII. Conclusion ............................................................... 29
Endnotes ........................................................................ 30

List of Tables and Figures
Table 1: Worldwide Extended Producer ResponsibilityLaws .............................................................. 2-3
Table 2: Material Savings from PackagingInnovations ....................................................... 9
Table 3: Variation in European Packaging Fees .......... 11
Figure 1: Inefficiency of Germany’s DSD High RecyclingQuotas ............................................................ 13
Table 4: EPR Cost-allocation Schemes forPackaging ....................................................... 14
Table 5: International Data Reporting Requirementsfor Packaging .................................................. 15
Figure 2: What Would Have Happened without DSD? ... 18
Figure 3: Annual Material Use for Typical GroceryProduct Packaging .......................................... 19
Figure 4: Cumulative Reductions in PackagingConsumption in Germany andthe Netherlands ............................................. 20
Table 6: Reduction of German Packaging Materialbefore Packaging Ordinance .......................... 21
Figure 5: Differing Costs for European EPRRecovery Schemes ......................................... 22

1
Lynn Scarlett is executive director of the Reason Public Policy Insti-tute and vice president for research at the Reason Foundation, a LosAngeles-based public policy research organization.
“Producer responsibility is a philosophy,not a description of a cheap and reliable system.”
—Ib LarsenDenmark EnvironmentalProtection Agency
I. Introduction
Frustrated with the challenges—and costs—of meeting state andlocal recycling goals, mayors and their public works teams are won-dering if laws mandating that producers take back their discardedproducts would, once and for all, impel manufacturers to design forrecyclability. The U.S. Conference of Mayors has debated the mer-its of product take-back schemes for nearly a decade, but by 1999the debate had begun unfolding with renewed vigor. In 1999, Min-nesota legislators moved ahead with the “take-back” idea, intro-ducing a bill that would require carpet manufacturers to recovercarpets when consumers discard them.
Across the border in Canada, three provinces have outlined take-back programs for packaging, newspapers, and other products. TheParis-based Organization for Economic Cooperation and Develop-ment (OECD), a membership research organization of the majorindustrialized nations, is attempting to advance take-back programsby documenting case studies and developing templates for modelprograms.1
Product take-back programs, often called “extended producer re-sponsibility” (EPR), have taken root internationally (see Table 1).Over 25 nations have some form of EPR program for packaging—the most celebrated program being Germany’s packaging ordinance,which gave rise in 1991 to its privately operated Green Dot pro-gram. Nearly two dozen nations, including the United States, haveEPR programs for some batteries. Others are rolling out EPR pro-grams for automobiles, electronic and electrical equipment, appli-ances, and other products. Some of these programs—like Dell’scomputer take-back program—are voluntary programs set up byindustries. Many, however, have resulted from legislation.
All EPR programs have in common one central feature: manufac-turers arrange to take back, recycle, or reuse (either directly, orindirectly by contracting with a third party) some of their products

2
Table 1
Worldwide Extended Producer Responsibility Laws
Country Products Recycling or Recovery Target
EuropeEU Directive Directive on packaging binding on 50% minimum recovery by 2001;
national governments 25% minimum recycling rate.Austria Batteries, refrigerators, packaging Various materials, 20%-70% recovery.
Belgium Appliances, batteries, electronics, Recovery targets by 2000: 95% ferrous,packaging 85% non-ferrous, 20% plastics;
50% packaging recovery by 1999.
Denmark Batteries, packaging (voluntary) 54% overall recovery rate by 2000,with 50%-60% industrial waste.
Finland Packaging 82% of packaging must be recovered.
France Batteries, packaging Follows EU directive.
Germany Batteries, packaging Various materials 60%-75% recovery targets.
Greece Packaging 25% recovery by 2001.
Ireland Packaging �
Italy Appliances, batteries, packaging Recover 30,000 appliances a year;follows EU directive for packaging.
Luxembourg Packaging Recovery target: 55%.
Netherlands Appliances, batteries, packaging Appliance/battery recovery target: 90%;packaging recycling target: 65%.

Norway Appliances, batteries, packaging Appliances: 80% recovery within 5 years;ni-cad battery pilot: 20,000 households;packaging recovery follows EU directive.
Poland Packaging Follows EU directive.
Portugal Packaging 25% recovery by 2001 and 50% recovery by 2005.
Slovakia Packaging Follows EU directive.
Spain Batteries, packaging. Follows EU directive.
Switzerland Packaging Follows EU directive.
United Kingdom Packaging Overall target 38%, increasing to 52% by 2001.
Czech Republic Packaging Similar to EU directive.
Estonia Packaging 60% recovery by 2001.
Slovenia Packaging Recycling recovery: 48% by 2000, 78% by 2010.
AsiaChina Packaging
Japan Appliances, packaging
South Korea Packaging
Singapore Packaging (voluntary) To reduce waste 80% through recycling.
Taiwan Packaging
Latin AmericaBrazil Packaging Specific manufacturers must set up recycling
centers for products: combustible oils, cosmetics, etc.Source: 1998 Raymond Communications Inc., www.Raymond.com.
3

4
after they are discarded by consumers. In essence, these programsrearrange the allocation of rights and responsibilities associated withproducts as they pass from producer to retailer to final consumer.
Most mandatory EPR programs have two components:
• They impose a fee, paid for by product manufacturers, ontargeted products
• They establish specific take-back goals for each targetedmaterial or product
The popularity of EPR as a public policy tool is growing. Someproponents view take-back schemes as necessary to inspiremanufacturers to design products that minimize consumer wasteor facilitate product recycling. Other proponents advance the moreprosaic goal of shifting direct waste management costs away fromtaxpayers or waste-service consumers to product manufacturers.
Despite their popularity, mandated EPR programs provoke theo-retical questions and face practical limitations to their efficacy asan environmental policy instrument. Voluntary take-back programs,on the other hand, are emerging in specific situations where manu-facturers tailor such programs to “add value” by reducing productcost or improving product quality.
II. EPR Theory Revisited
The term extended producer responsibility first surfaced in Swe-den in the 1980s.2 Its proponents view the concept as an extensionof a “polluter pays” principle; that is, pollution generators must miti-gate or pay for their pollution. Put another way, proponents arguethat EPR will internalize the costs of negative externalities (spillovereffects) that result from production and consumption. On a morepractical level, EPR proponents argue that the current allocation ofresponsibilities for pollution mitigation and waste managementdoes not result in “environmentally optimal development.”3
Few would dispute the idea that polluters should be responsiblefor the pollution they cause. But acknowledging this principle re-veals little about the merit of EPR in theory or practice. Three prob-lems cloud EPR theory:
• The “polluter pays” principle does not answer the ques-tion, “What is pollution?”
• The principle does not delineate who is the polluter.
• The principle does not define the dimensions or bound-aries of the word “responsibility.”

5
What Is Pollution?
In conventional environmental economics, pollution refers to theresiduals from production and consumption that create harmful orunpleasant impacts—harmful air and water emissions, release oftoxins into soils, and so on.4
The polluter is the generator of these harmful or unpleasantimpacts. Under this definition, responsibility for pollution lies withthe person or persons who directly generate these impacts. As own-ership of a material or product shifts from the resource extractor tothe manufacturer to the retailer to the final consumer, responsi-bility for waste and pollution generated at each stage also shifts.
EPR theory departs significantly from conventional environmen-tal economics. EPR theory broadens the meaning of “polluter” toinclude “any person or organisation which produces a good that, ifdisposed of in a certain way, might cause pollution.”5 In somediscussions of EPR, the actual use of resources, distinguished fromany harmful residuals or waste associated with that use, is implic-itly characterized as pollution.
These new definitions of pollution (and the polluter) are problem-atic. They blur the distinction between actual and hypotheticalpollution, inviting the prospect that “pollution” fees or fines will beassessed even in the absence of any actual impacts. Such feesmay add to the costs of goods without introducing tangible benefits.Moreover, these definitions erode any distinction between resourceconsumption and pollution externalities. The costs of resource con-sumption are typically already incorporated into the prices paid forgoods and waste-management services. The costs of pollutionexternalities are not captured in economic transactions. Thus,the altered definitions of pollution embraced by many EPR propo-nents may distort, rather than improve, market pricing signalsreflecting resource scarcities.
Despite their popularity, mandated EPR programsprovoke theoretical questions and face practicallimitations to their efficacy as an environmental
policy instrument.

6
Who Is the Polluter?
Using the more traditional definition of pollution, the “polluterpays” principle requires that the person, firm, or organization thatmost directly generates environmental harms is responsible fortheir mitigation through prevention, emission control, or cleanup.This notion of responsibility underlies virtually all modern envi-ronmental management systems and laws. Miners are (in theory)accountable for mining waste; manufacturers are accountable forair, water, and solid waste emissions that occur during the produc-tion process; retailers are responsible for their waste; consumers(through taxes or service fees) are responsible for their sewage,their trash, and other environmental impacts they may cause.
Mandated EPR programs depart from this traditional “polluter pays”principle, replacing it with a “producer pays” principle. This depar-ture has two consequences. First, it diminishes responsibility ofothers along the production-consumption chain for pollution thatthey might generate. Second, it blurs the distinction between prod-ucts per se and any pollution that those products might cause.
With regard to the first point, it is not at all clear that the manu-facturer ought to be responsible in all circumstances for a productonce possession has been transferred to the consumer. A briefmental exercise demonstrates why it is difficult, or even misguided,to apply this assumption as a general precept.
Think of automobiles. On the one hand, manufacturers are re-sponsible (increasingly, through regulations) for producing cars thatemit only small amounts of pollutants. But once these cars arepurchased by motorists, these motorists control when and whetherto maintain the car, how they drive their cars, and whether to haveperiodic tests to check that the car is still operating at low emis-sions levels. Asserting that the manufacturer is responsible forthe car essentially lifts any personal responsibility from the con-sumer, which is not likely to result in good environmental out-comes over the long run.
It is not at all clear that the manufacturer ought to beresponsible in all circumstances for a product oncepossession has been transferred to the consumer.

7
Packaging is an example of the second consequence of replacing“polluter pays” with “producer pays.” Packaging is not per se pollution.Packaging is deliberately produced; it is not a residual of production.It serves many beneficial purposes. Unless it is littered (an act by theconsumer, not the producer) or discarded into improperly operateddisposal facilities, the package does not cause harmful pollution.
Manufacturing packaging does, of course, require resources. Butthe use of these resources generally is not “external” to the eco-nomic transaction. Packaging is typically owned all along the con-tinuum from production through sale, consumption, and disposal,though who owns the package varies as the package itself changeshands. As ownership shifts, costs to make, ship, store, and, finally,discard packaging are all incorporated into either the package priceor waste-disposal taxes and/or fees paid for by the end user.
Boundaries of Responsibility
The term “responsibility” implies a duty, burden, or obligation todo something. But that “something” must be specified. In marketeconomies, custom, contracts, tort law, and statutes jointly deter-mine who is responsible for what. Unless contracts specify other-wise, consumers are generally responsible for the products theypurchase. What they do with the product, when they sell it toothers, or how they discard it is their responsibility. This arrange-ment ensures some level of security of possession and some levelof stewardship for the product.
There are exceptions to this allocation of responsibilities, espe-cially in the realm of liability laws relating to accidents or harmsresulting from the use of a product. Here, product manufacturers(or even retailers) may be held accountable for these harms andproduct failures. In contrast to these liability laws, EPR laws do nottarget harms; they target the mere existence of a product.
Extended producer responsibility programs, which place somepart of waste-handling costs in the up-front purchase price of aproduct, do not, therefore, internalize an externality. They shiftsome (or all) of the costs of waste handling from a back-end trashfee (or tax) to an up-front product fee. EPR programs cannot, then,be justified as a correction to some market failure or in purelyphilosophical terms as consistent with a polluter-pays principle.Instead, EPR programs must be judged based upon whether ornot a shift of waste-handling fees, coupled with mandatory waste-recovery and recycling targets, generate hoped-for benefits (forexample, resource conservation) and more efficient waste-management systems.

8
III. EPR Expectations and Implementation Challenges
At a practical level, its proponents advance EPR as a means ofimproving decisions about resource use. Because EPR programsattempt to incorporate product disposal or recycling costs as an up-front fee, they are expected to change how manufacturers designand market their products. Specifically, these changes mightinclude design for:
• waste minimization
• reuse or recyclability
• material conservation
• pollution reduction
• lower toxicity
In addition to these environmental goals, some champions ofmandatory EPR systems anticipate that these systems will gener-ate a secure, nonvolatile revenue stream to fund waste collection,recycling, composting, and waste-disposal programs.
EPR began in Europe as a philosophy about product responsibil-ity. In the United States, its proponents generally focus on morepragmatic concerns. Public works managers, faced with recyclingand waste-diversion targets, express frustration that some new pack-aging forms entering the marketplace make recycling more, notless, difficult. They cite three recent examples:
• The introduction of pigmented HDPE milk containers,which mingle in the waste stream with the more tradi-tional “natural” HDPE containers and make separation ofthose containers into a clean stream more difficult;
• The introduction of polystyrene “wrapper” labels aroundglass containers, which they fear may make glass recy-cling more difficult; and
• The introduction of plastic beer bottles, which may sup-plant the easier-to-recycle glass bottles or aluminum cans.
Because EPR programs attempt to incorporate productdisposal or recycling costs as an up-front fee, they are
expected to change how manufacturers design andmarket their products.

9
While some public works managers see EPR as a potential newrevenue stream, many hope that development of an EPR programin the United States will ensure that recyclability will move centerstage as a design criterion for manufacturers. They view productsprimarily from the vantage of their waste-handling attributes.
Manufacturers, on the other hand, view products in terms of con-sumer preferences, overall product performance, and overall pro-duction and product-delivery costs. This vantage requires jugglingmultiple goals in a context of both technological and economic con-straints. Waste-handling attributes are one of many performance,environmental, and other design criteria that a manufacturer con-siders in product design, development, and marketing.
These differences in vantage points make evaluation of EPR com-plicated. The local mayor or waste manager is generally seekinglower-cost waste handling; the manufacturer is seeking to antici-pate consumer preferences and product-quality requirements whileminimizing resource costs. Because EPR is typically advanced as awaste-management policy, the central question remains whetherEPR programs are likely to result in efficient waste diversion andrecycling.
Goal Tradeoffs
The various goals for EPR programs are not necessarily compat-ible. EPR design considerations depend on the size of the fee and
Table 2
Material Savings from Packaging Innovations
Flexible Packaging Packaging Replaced Material ReductionVolume Weight
Laminate brick pack Metal coffee can 70% 55%
Fabric softener pouch Plastic bottle 85% 84%
Plastic diaper wrapping Folding cardboard carton 85% 86%
Peelable lid Metal top 87% 50%
Plastic instant soup pouch Metal can 93% 97%
Frozen food bag, plastic Waxed-wrap carton 89% 83%
Source:Lynn Scarlett, “Packaging, Solid Waste, and Environmental Trade-Offs,”Illahee: Journal for the Northwest Environment 10 (1), Spring 1994, 25.

10
the criteria used to establish fee levels. Packaging fees set to re-flect recycling costs and, thus, encourage “design for recyclability”may discourage source reduction and materials conservation.
For example, fees based on recycling costs will typically be higherfor composites and laminated products than for single-material glassor paperboard containers. Recycling requires recovering cleanstreams of uniform materials. Segregating the different materialsin a laminated or composite package is often difficult and costly.Yet substituting these packages for more traditional glass, metal,and paper packages has historically resulted in reductions inmaterial use by both weight and volume (see Table 2).
A 1992 report on green product design by the U.S. Office of Tech-nology Assessment (OTA) cautioned that “what is ‘green’ dependsstrongly on context.”6 Product-design choices are often subtle. TheOTA report offers an example of potential tradeoffs between materi-
als-use reduction and recyclability. A modern snack chip bag ismade up of thin laminated layers of nine lightweight materials,each of which serves a different function in assuring overallproduct integrity and consumer utility. This multilayering makesrecycling difficult. The package is, however, “much lighter than anequivalent package made of a single [recyclable] material andprovides longer shelf life, resulting in less food waste.”7
How manufacturers respond to EPR fees will depend on the feelevels, packaging weight and volume, and other consumer-qualityvariables. Materials-reduction opportunities may be foregone if feespush manufacturers out of laminates, composites, and plastics (orother innovative, new packaging materials) and into single-material paper, glass, wood, or metal containers.
While one can anticipate some general tension between sourcereduction and recycling goals through EPR programs, predicting theoutcomes of different EPR fee structures for any given product isnearly impossible because of the multiple variables that affect prod-uct-design decisions. For example, in Germany, clear glass—whichis easy to recycle—carries a much lower fee than HDPE (plastic).But the lower transportation costs associated with lightweight plas-
How manufacturers respond to EPR fees will dependon the fee levels, packaging weight and volume, and
other consumer-quality variables.

11
tics, ease-of-handling, lower breakage, and better performance (fromthe consumer’s standpoint) have still resulted in decisions by manymanufacturers to use plastic containers for shampoo bottles, de-tergents, cleansers, and so on. Some of these choices, driven byEPR fees, have even made packaging more, not less, complex. Somecleansers, which had been sold in a single-material HDPE container,now are sold in very thin plastic containers held upright with athin paperboard sleeve.
Setting Fees
There is no intrinsically right fee level. There is wide varia-tion in packaging fees among European EPR programs, evenwhere waste-management technology, wages, and other relevantcost factors are similar. Packaging fees among European na-tions vary as much as thirty-five-fold for identical products (seeTable 3).
Differing fee structures for EPR programs in Europe result froma combination of political maneuvering, differences in waste-management infrastructure and program goals, and differencesin how costs are allocated. In other words, fee setting is a politi-cal exercise rather than an economic calculation based on com-prehensive assessments of waste-handling costs or relativeenvironmental impacts of different products. The explosion indifferent fees confuses rather than improves the informationabout resource scarcities signaled through prices to product andpackaging producers.
Table 3
Variation in European Packaging Fees(1997 Fee Structures, $ per 1,000 containers)
Country 300ml 75 ml Granular DetergentPlastic Bottle Glass Bottle Carton, Size 5
Austria $67 $22 $48
Belgium $10 $ 4 $ 7
France $ 2 < $ 1 $ 4
Germany $75 $26 $56
Sweden $ 8 $ 2 $14
Source: Klaus Draeger, Principal Scientist, Procter & Gamble, Schwalbach, Germany.

12
Political Maneuvering
Establishing back-end waste-handling fees is a fairly straightfor-ward process. At the point of waste collection, the hauler/recyclerhas relatively clear information about the average and marginalcosts to collect and recycle, compost, or dispose of a given amountof waste. Determining the collection, reprocessing, or disposal costsfor individual items or for their various components (such as bottlecaps, labels, safety enclosures, and so on) involves a much broaderset of loose assumptions. Yet establishing up-front product fees re-quires making these kinds of item-by-item cost estimates.
As a result, fee setting is often subject to political jockeying. TheGerman experience bears this out. In the mid-1990s, Germany’sDuales System Deutschland (DSD, a manufacturer consortium setup to manage the Green Dot packaging recovery program) soughtto raise fees to meet unanticipated costs. The proposed fee for glasschanged at least three times over several months, as glass-con-tainer producers and fillers pressed for more favorable treatment.8
Program Goals
Fees also vary depending on program goals. Germany’s EPR pro-gram emphasizes recycling and recovery more than waste mini-mization (source reduction). The DSD sets fees based on estimatedcosts to recycle or recover materials, with a special surcharge tocover plastics reprocessing costs. The result is costs for plastic con-tainers that are about 20 times higher than the fees for glass con-tainers. Glass and paper-based packaging compose 75 percent ofpackaging consumed in Germany by weight, but glass and paper-based packaging fees make up less than 30 percent of fees paidinto the DSD system.9
These fee variations may approximate the differential recyclingcosts of the different materials. The net effect is to discourage wasteminimization. Evidence of this result is offered by some Germanpackaging anomalies relative to general trends. For example, in allother European nations, packaging for cat litter is made entirely ofplastic. In Germany, it is made from paper with a plastic reinforce-ment of less than 5 percent of the package by weight (in order tostill qualify as a paper package).10 There is no obvious environ-mental benefit from this choice.
Goal details also affect fee structures. Denmark’s EPR programfor packaging offers reduced fees for packaging with recycledcontent. France allows waste-to-energy as a recovery option. Untilrecently, Germany required “mechanical recycling”—the direct

13
fabrication of products from recovered materials—to meet re-covery targets. Packagers may now meet 40 percent of the plas-tics recovery target through “feedstock recycling”—theconversion of plastics into their basic chemical elements forreuse.11 Germany’s very high recovery targets push fees upward,requiring increased processing while generating lower-qualitymaterials (see Figure 1).
Cost Allocation and Cost Sharing
Some of the wide variation in fees seen in EPR programs resultsfrom different decisions regarding which costs to allocate to manu-facturers and whether costs will be shared among producers/fill-ers and others in the manufacturing and product distribution chain(see Table 4). In Germany, packaging fees are much higher thanin France, in part because German producers pay the total esti-mated waste-collection and handling costs for packaging and anadditional fee for plastics that covers reprocessing costs. In France,producers pay the incremental cost associated with expandingrecycling programs. Moreover, the French program relies on the
Figure 1
Inefficiency of Germany�s DSD High Recycling Quotas
*Based on sales packaging consumption.
Source: Marcus Schroll, “The German Packaging Ordinance,” Insititute forApplied Innovation Research.
50%
DM 1,000(U.S.$590)
DM 2,000
DM 3,000
(U.S.$1,180)
(U.S.$1,770)
Mar
gina
l Cos
ts p
er M
etric
Ton
DSD-quota1997 (86%)
100%
Recycling Quota *
Incineration(DM 650/U.S.$382
DualSystem

14
existing municipal waste-management infrastructure rather thanon a parallel system operated under contract to the producerconsortium.
In the United Kingdom, waste-handling costs for packaging arespread among raw material manufacturers (6 percent), converters(11 percent), packers/fillers (36 percent), and suppliers (47 per-cent). Companies that handle less than 50 tons of packaging areexempt, reducing potential participants from an estimated 200,000to 11,500.12 The exemption essentially legalizes “free riding” bysmall companies, since larger firms pay for the recovery of small-firm packaging.
Reporting Costs
Establishing fees and ensuring their payment by targeted firmsis an information-intensive undertaking. Packaging consultantVictor Bell notes that:
[I]n most cases, the cost of data collection and report prepa-ration far exceeds the cost of the fees themselves....Forexample, a large personal care company, which manu-factures and distributes its products globally, will spendmillions of dollars creating and maintaining its environ-mental packaging database, which is necessary to com-plete all country reporting requirements. Additionally, itis spending thousands of dollars to complete each coun-try report.... [O]ne company is spending more than [$1,000]each month in preparing its monthly reports to SvenskGlasatervinning in Sweden for their glass bottles andpaying less than $200 in fees per month.”13
Table 4
EPR Cost-allocation Schemes for Packaging
Nation Producer Responsibility Items Recovered(EPR program) Incremental Total Selected All
Cost Cost
Austria (ARA) X XBelgium (FostPlus) X XFrance (Eco-Emballages) X XGermany (DSD) X XSweden (REPA) X X
Source: Klaus Draeger, “Ist Der Grüne Punkt Zu Teuer?” June 10, 1997.

15
At least 30 nations now require environmental packaging re-ports, often for the purposes of setting EPR fees and monitoringchanges in packaging design on a national level. As Bell points out:
[T]he data requirements are constantly changing, mak-ing the database requirements for multinational compa-nies increasingly difficult. For example, in the EU alonethe same piece of paperboard can be defined as paper inFrance, composite in Germany, aluminum in Spain, andother in Belgium.14
Criteria for determining packaging fees vary widely, with theresult being that reporting requirements also vary widely. The cu-mulative list of required data elements is extensive (see Table 5).
While firms to date have the broadest experience with EPR pro-grams that target packaging, any mandatory EPR program—whetherfor electronic equipment, automobiles, or appliances—needs datareporting to determine what fees must be paid and to track pro-gram compliance. Data-reporting costs depend on program com-plexity and numbers and types of program participants.
� Weight of the package� Shelf area� Declared weight� Declared volume� Product-to-package ratio� Empty-space ratio� Specific material typeP Resin type
� Fiber content� Rigidity� Heavy metal content� Country of origin� Packaging categoryP PrimaryP Sales unitP TransportP Service
� Packaging elementP Cap, carton, etc.
� Percentage of recycled materialP PostconsumerP PreconsumerP Industry scrap
� Data on recyclability� Percent composition by
componentFor example:P Fiber 84.5%P Aluminum film 5.8%P Acetate film 3.8%P Glue for acetate 3.8%P Ink 1.4%P Glue for aluminum 0.7%P Carton glue 0.3%
Table 5
International Data Reporting Requirements for Packaging
Source: Victor Bell, “How Manufacturers Are Responding to Extended ProducerResponsibility Programs,” paper presented at OECD Workshop on EPR,December 1–3, 1998, Washington, D.C.
16
EPR and Packaging Design: The Bottom Line
Material competitiveness among packaging alternatives is re-lated to the total costs associated with using a material to achievethe desired product performance. These costs include energy costsin production and transportation, productivity in handling, tonnageof material required to achieve particular packaging characteris-tics, and so on. For example, plastics may have a high cost perpound relative to some other materials, but may require much lessmaterial to create needed packaging characteristics compared withglass or paper. Thus, a substitution of plastics for more traditionalmaterials may result in lower packaging costs.
As an example, EPR programs typically change the feedstock costto the manufacturer. But how this change affects the choice ofmaterials or design of the product will depend on:
• what percentage of total costs feedstock costs represent
• how changes in materials and design will affect other costssuch as transportation, handling, and distribution
• how changes in design will affect product performance
• how big the differential is among different material optionsand how that cost difference affects total product cost
The outcome will vary for each product. Where thousands of differ-ent products exist in a product category (such as packaging), there issimply no way to know in advance how changes in fees will affectdesign choices. If the fees are high enough and the differential be-tween one material choice and another is high, the fees will likelyaffect outcomes. But predicting which aggregate outcomes will resultis not possible. EPR programs to date bear this caveat out.
IV. EPR Benefits: A Reality Check
Proponents of EPR list a variety of hoped-for product design ben-efits. However, most programs have based EPR fees on resourcerecovery and recycling costs and coupled these fees with recoverytargets for specific products or materials. Proponents then evalu-ate success in terms of whether these targets are met.
Such a program evaluation is incomplete. Assessing whethermandatory EPR programs “work” requires two added steps. Targeteffects also should be compared to recycling and waste minimiza-tion trends in places that do not have mandated EPR programs.Analysis should also include opportunity costs—benefits that may

17
have been foregone by investing in EPR programs. For example,EPR programs may require greater materials use or stifle productinnovations.
As there is no single model of EPR, evaluating a few experiencesapplied to one set of products is, at best, only suggestive. EPR sys-tems, as implemented around the globe, share no common set ofgoals or uniform regulatory structure. Pricing schemes vary widely.Nonetheless, a look at several mature EPR programs for packagingis useful.
Targeting packaging for EPR raises some especially difficult chal-lenges for a number of reasons. First, there are large numbers ofpotential participants that make heterogeneous products. Second,the value of each individual packaging transaction is small, evenminuscule. Third, potential health and safety impacts from mis-handling of waste may exist, but are small, limiting any harm-reduction benefits that might accompany an EPR program. Finally,packaging makers are already highly sensitive to price and con-sumer-preference signals. These characteristics all point to likelyhigh system costs with limited environmental benefits.
What does the record show?
The Case of Germany
Germany’s Green Dot program has the longest track record, dat-ing to 1991. Germany had one explicit and one implicit goal in es-tablishing its EPR program: waste minimization and increasedrecycling, respectively.
Absolute Benefits
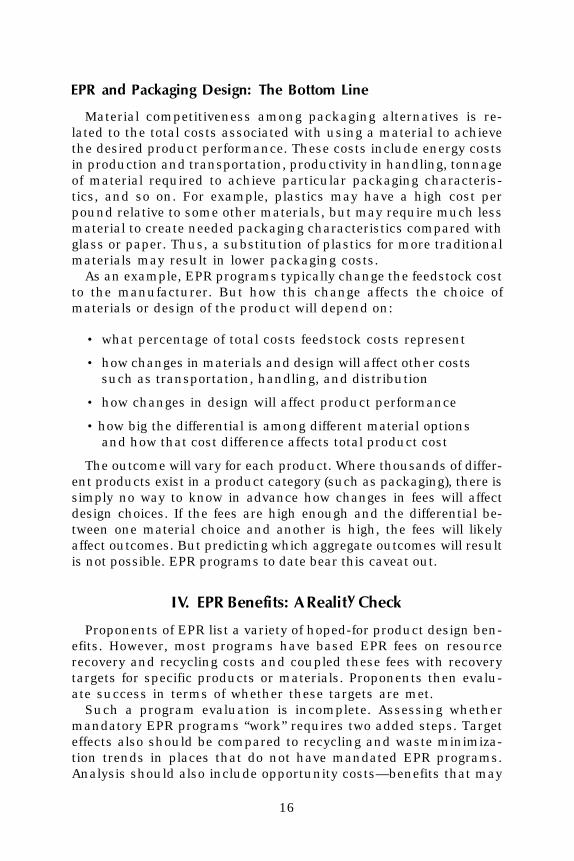
Germany did see some decline in packaging waste. Outer (sec-ondary) packaging was virtually eliminated but made up a smallfraction of total packaging. Looking at a typical set of grocery prod-ucts, packaging dropped from 2,500 pounds per gross productionunit to just under 2,100 pounds, a 14 percent reduction betweenthe outset of the program and 1994.15 The program achieved anoverall packaging recycling rate of around 78 percent by year-end1996.
By 1998, 6.2 million tons of used sales packaging was placed inthe containers distributed to communities by DSD for the purposeof collecting packaging waste containing the “Green Dot” DSD sym-bol. Of this amount, 5.6 million was recovered for recycling. Tar-gets were achieved for all materials.16
These levels of recycling very likely exceed levels that would have

18
been achieved by market trends. However, only a portion of the totalamount of recycling can be attributed to the EPR program. Germaneconomist Marcus Schroll estimates that without the DSD program,recycling would have increased from the 1990 baseline of 2.5 milliontons to around 3.6 million tons (see Figure 2). The DSD program has,thus, resulted in about 2 million tons of additional recycling.17
Cross-national Comparisons
In absolute terms, the German program has achieved (even ex-ceeded) its waste-recovery targets. But these reductions in wasteand increases in recycling need to be put into perspective. Cross-national comparisons are instructive.
Over the same time period, and with no EPR system in place, thesame basket of grocery items in the United States experienced areduction from 2,750 pounds per gross production unit to 2,100pounds, nearly a 26 percent drop (see Figure 3). A 1999 analysis ofwaste-generation changes in the United States shows a reductionin projected rates of waste generation (before any recycling) of 23million tons between 1990 and 1996, with 17 percent of this reduc-tion coming from packaging.18
In 1988, Canadian packaging manufacturers voluntarily set as a
1990
6,000
5,000
4,000
3,000
2,000
1,000
Qua
ntity
Col
lect
ed[T
hous
ands
of M
etric
Ton
s]
1993 1994 1995 1996 1997
Quantity already collected in 1990 without DSD
2,537
3,587
5,618
Further glass and paper quantitiescollected without DSD (trend extrapolation)
Further quantity collected by DSD
Source: Marcus Schroll, “The German Packaging Ordinance,” Institute forApplied Innovation Research.
Figure 2
What Would Have Happened without DSD?
19
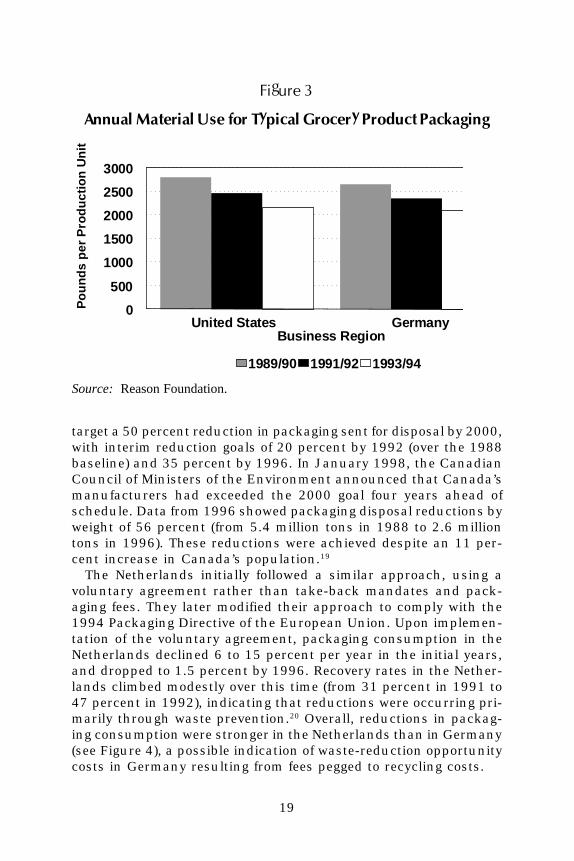
target a 50 percent reduction in packaging sent for disposal by 2000,with interim reduction goals of 20 percent by 1992 (over the 1988baseline) and 35 percent by 1996. In January 1998, the CanadianCouncil of Ministers of the Environment announced that Canada’smanufacturers had exceeded the 2000 goal four years ahead ofschedule. Data from 1996 showed packaging disposal reductions byweight of 56 percent (from 5.4 million tons in 1988 to 2.6 milliontons in 1996). These reductions were achieved despite an 11 per-cent increase in Canada’s population.19
The Netherlands initially followed a similar approach, using avoluntary agreement rather than take-back mandates and pack-aging fees. They later modified their approach to comply with the1994 Packaging Directive of the European Union. Upon implemen-tation of the voluntary agreement, packaging consumption in theNetherlands declined 6 to 15 percent per year in the initial years,and dropped to 1.5 percent by 1996. Recovery rates in the Nether-lands climbed modestly over this time (from 31 percent in 1991 to47 percent in 1992), indicating that reductions were occurring pri-marily through waste prevention.20 Overall, reductions in packag-ing consumption were stronger in the Netherlands than in Germany(see Figure 4), a possible indication of waste-reduction opportunitycosts in Germany resulting from fees pegged to recycling costs.
Figure 3
Annual Material Use for Typical Grocery Product Packaging
Source: Reason Foundation.
United States Germany0
500
1000
1500
2000
2500
3000
1989/90 1991/92 1993/94
Business Region
Pou
nds
per
Pro
duct
ion
Uni
t

20
Market-process Comparisons
Individual products show significant materials-use reductionsbefore implementation of Germany’s Green Dot program. Anticipa-tion of the new program by producers cannot fully explain thesereductions, since lightweighting and substitution toward more ef-ficient materials predates discussion of take-back programs (seeTable 6). In the years just prior to implementation of Germany’sprogram, reductions were especially dramatic. For example, bar soappackaging declined by 35 percent; detergent packaging dropped 27percent.21
Benefits�The Limiting Factors
While mandatory EPR systems have generally been successfulin increasing material recovery and recycling rates, their overallenvironmental benefits are more ambiguous. They appear to havehad only limited impact on overall source reduction. Several fac-tors limit their effectiveness for this purpose.
First, fees are typically passed on to consumers, softening therole they might otherwise play in inducing manufacturers to rede-sign products to reduce costs.
Figure 4
Cumulative Reductions in Packaging Consumption inGermany and the Netherlands(Adjusted to Economic Cycle)
Source: Andreas Troge, “Comparison of Cost Efficiency of Packaging RecoverySystems,” University of Bayreuth.
1996
90%
100%
80%
70%1991 1992 1993 1994 1995
Germany
The Netherlands

21
Second, with the proliferation of fees associated with different pro-grams, manufacturers designing products for international marketsface no clear price signal. Packaging analyst Victor Bell points outthat “since there is such a variance in the methods of calculatingpackaging fees in each country, making decisions regarding mate-rial substitutions that reduce the weight or volume of packaging isalmost impossible.”22
Bell offers several examples. In Germany, switching from a 50ml glass container to a 50 ml plastic (PET) container will increasefees as much as 132.50 DM per 1,000 containers but will have noimpact on fees in France. Fees for laminated paper send even moreconfusing messages. In Sweden, France, and the United Kingdom,a package is considered laminated if fiber content is 50 percent orless. In Germany, it’s considered laminated if fiber content is lessthan 95 percent.
Third, fee structures change frequently in some programs. Bel-gium, which introduced EPR “eco-taxes” for a variety of products(batteries, disposable cameras, and packaging, for example),amended its law 17 times between July 1993 and 1998.23
Finally, all products must meet a variety of design goals. NotesGerman economist Eric Staudt, “measures concerning the de-sign of sales packaging are oriented first and foremost towardsthe requirements of the packaging contents, the buyer, [retail]trade, and the packaging costs.”24 The EPR fees and take-backrequirements are, therefore, only one of many considerationsthat manufacturers take into account when designing products.At the margin, the fees have some influence on packaging deci-sions, but product performance and total (rather than solid waste)costs dominate design decisions.
Table 6
Reduction of German Packaging Materialbefore Packaging Ordinance
Tinplate can Glass bottle Plastic tub Soft rinse plastic bottle0.33 liter 1 liter 150g 4 liter
1950=80g 1972=570g 1970=11g 1970=300g1992=33g 1992=350g 1985= 5g 1985=100g
Source: Marcus Schroll, Institute for Applied Innovation Research, 1998.

22
V. The Matter of Costs
Any program that sets mandatory product recovery targets (andenforces compliance) will likely achieve those targets. However, atleast as important as the achievement of stated targets is the costto achieve those results.
The Case of Germany
Architects of Germany’s EPR program acknowledge its high costrelative to other waste-management programs. Costs to collect, re-cover, and recycle packaging waste under the Green Dot programexceed $500 per metric ton.25 Incremental costs of the programrise significantly for recovery rates above 65 percent. Germany’sprogram costs are substantially higher than integrated waste man-agement program costs in the United States that are achieving 30percent diversion of the total waste stream, with an aggregate na-tional diversion rate for packaging of around 40 percent.26 Whileprogram costs vary widely, many U.S. programs operate recyclingand waste diversion programs for under $200 per ton of materialrecycled. These U.S. figures, like the German figures, representtotal collection, recycling, and disposal costs.
Estimated Cost in Dollars per Ton Diverted from Final Disposal600
500
400
300
200
100
0Austria(ARA)
Belgium(F-P)
France(E-E)
Germany(DSD)
Sweden(RE-PA)
Dol
lars
per
Ton
Figure 5
Differing Costs for European EPR Recovery Schemes
Source: Klaus Draeger, Principal Scientist, Procter & Gamble, Schwalbach,Germany.

23
Germany’s program costs are also higher than program costs inother European nations that operate some sort of extended (orshared) producer responsibility program (see Figure 5). However, adirect comparison using EPR program costs is misleading, sincereported EPR costs in some nations represent only a portion of totalwaste-management costs. For example, some nations, like France,require that manufacturers pay only the added incremental costsof recycling through their EPR program. The remainder of wastemanagement costs is covered in municipally operated or contractedprograms covered through taxes or back-end (residential) service fees.
Several full-cost comparisons between Germany’s EPR programand other, more market-driven voluntary programs do exist. Onecomparison of Germany’s Green Dot program with the “packagingcovenant” program in the Netherlands concluded that 1996 diver-sion costs in Germany were around 719 ECUs per ton. The Nether-lands’ diversion costs were 174.08 ECUs per ton. Adjusting theGerman costs to reflect different labor and other costs in the Neth-erlands, Germany’s program required 639 ECUs per ton.27 Even with1998 projected reductions in Germany’s program costs, the effi-ciency ratio would still be one to three for the Dutch system con-trasted with the German system.28
Germany’s packaging recovery rates (over 75 percent) are higherthan in the Netherlands (50 percent). However, source reductionhas been significantly greater in the Netherlands, where the waste-management program does not specifically favor recycling, than inGermany.
Implementation Lessons
Looking at Germany’s program costs is instructive. Such an ex-amination helps illuminate some of the implementation factorsthat affect costs. If the policy challenge is how to design a least-costEPR program, understanding these implementation issues is use-ful. For example, the chief operating officer of Germany’s DualesSystem Deutschland, Wolfram Bruck, points to four regulatory-design elements that pushed Germany’s costs upward:29
• short set-up time to fully implement the program
• noncompetitive award of collection and recycling contracts
• very high recovery targets
• dual (parallel) collection system that operated alongsideexisting waste-management collection systems ratherthan being integrated into those systems (as in France)

Other analysts of the German program identify additional imple-mentation issues that affect both its efficacy and efficiency. KlausDraeger of Procter & Gamble points out the importance of how costsare allocated, whether and how free-rider problems are addressed,and how fees are structured.
Uniform fees for all packages, for example, are easier and lesscostly to develop and administer than are fees that vary by mate-rial, weight, and volume. However, they are less effective as a meansof steering design choices in some predetermined direction. Cost-allocation among multiple “players” (as in the United Kingdom) re-duces the cost burden on any particular participant, but substantiallyincreases tracking and reporting costs. Shared cost structures alsoreduce the impact that fees might have on product design, sinceeach participant pays only some fraction of the total. Free-riderproblems (arising from both consumers who place non-licensed ma-terials into collection containers and manufacturers who fail topay fees for products they introduce into the market) can result incontaminated waste streams and higher costs to participating firms.On the other hand, reducing free-rider problems generates enforce-ment costs—the more extensive the enforcement effort, the higherthe costs.
VI. The Rise of Voluntary EPR Programs
Heightened concerns about waste and other environmental im-pacts, especially for consumer products, have prompted a searchfor new institutional relationships—within firms, among firms, andbetween firms and customers—that:
• create incentives for companies to deliberately incorpo-rate waste-minimization values into product design deci-sions;
• motivate firms to reduce the overall environmental im-pact of their production processes and products; and
• motivate consumers to generate less waste and reducetheir environmental “footprint.”
As firms compete to add value for customers, EPR has emergedvoluntarily in some settings. What distinguishes voluntary EPRarrangements from other experiments in industrial ecology is onecentral feature—some or all responsibility for products at the endof their useful life span is reallocated from the end user to themanufacturer.
Three categories of voluntary programs that embody features ofEPR can be identified:
24

• take-back and product-leasing programs
• private-sector “green design,” recycling, and remanu-facturing consortia
• producer leveraging agreements with private-sectorsuppliers
Take-back and Product Leasing Programs
Voluntary take-back programs in many ways mirror those cre-ated through legislation or public-private negotiated agreements.Individual companies or specific industries set up mechanisms torecover products, either directly by the manufacturer or through adesignated collection network. Costs are borne either by an indi-vidual firm or through a fee system established collectively bythe sponsoring industry.
In the United States, the only current industry-wide take-backscheme is the Rechargeable Battery Recycling Corporation. Sev-eral pilot industry-wide programs also exist, such as a windshieldtake-back pilot sponsored by the U.S. Council for AutomotiveResearch (USCAR).
Other programs have been established by individual businessesindependent of other firms operating in the same industry. Theseprograms include:
• Nike’s Reuse-a-Shoe program
• IBM, Dell, and Hewlett-Packard’s computer-recovery pro-grams
• Hewlett-Packard’s printer toner cartridge return program
• several brand-name clothing return programs
• a number of returnable transport packaging programs
• Saturn’s bumper fascia return program
• a furniture manufacturer’s retrieval program for foamshipping material
• several returnable camera programs
As firms compete to add value for customers, EPR hasemerged voluntarily in some settings.
25

Consortia for Green Design, Recycling, and Remanufacturing
Where manufacturers within an industry share common envi-ronmental challenges, especially relating to product reuse, recy-cling, and disposal, many collaborative research efforts have beenundertaken. Well-known in this realm are efforts by trade associa-tions such as the American Forest and Paper Association, theSteel Institute, and the American Plastics Council. Some indus-tries have moved beyond these traditional joint research efforts toembark on direct, industry-funded research into reuse and recy-cling. Most notable of these efforts is the Vehicle Recycling Devel-opment Center (VRDC), established in 1994 as a partnership ofAmerican auto manufacturers, who also collaborate with the Auto-motive Recyclers Association, the American Plastics Council, andthe Institute for Scrap Recycling Industries. The primary goalsof VRDC include: 1) finding ways to recycle automobile “fluff”—the25 percent or so of material remaining after recycling of the fer-rous, nonferrous, and other readily recycled components; and 2)finding ways to more cost-effectively disassemble cars, includingremoval of fluids.
Producer Agreements/Collaboration with Private-sector Suppliers
Most manufacturers purchase parts and other production inputsfrom outside suppliers. These relationships are often stable andinvolve large transactions, giving the manufacturer substantial “le-verage” over its suppliers. Through this leverage, firms invest in prod-uct redesign to meet company recycling, waste reduction, toxinreduction, and other environmental goals. Such “green partnerships”between manufacturers and suppliers are among the most commonforms of voluntary extended (or shared) producer responsibility pro-grams. Notable examples include:
• Dell’s Environmental and Recyclability Design Guidelinesfor all input suppliers;
• Hewlett-Packard’s “Controlled Materials List,” which iden-tifies 154 hazardous wastes suppliers must avoid;
• DuPont’s Emerald Environmental Services, which workswith DuPont clients to implement waste-recovery pro-grams; and
• Bell Atlantic’s coordination with Westvaco, supplier of bill-ing envelopes, to create an envelope of 100 percent re-cycled content, half coming from recycled phone books,diverting 575 tons of waste from landfills.
26
Program Challenges
Program challenges vary by program type but generally include:1) finding mechanisms to attract customer participation; 2) estab-lishing cost-effective collection and return networks; 3) identifyingmarkets and uses for returned items; and 4) achieving cooperationwhere multiple firms are involved.
Customer Participation
Some programs use incentives—such as Nike’s $5 rebate on re-turned shoes—to generate customer participation. Other programsinvolve direct economic benefits to consumers—as in the case ofDell’s computer leasing and take-back program—that stimulateconsumer cooperation. Others, such as LensCrafters’s eyeglassreturn program, use a social services approach by working withlocal nonprofit Lions Clubs to generate consumer responsiveness.
Preexisting relationships and economic incentives facingsuppliers facilitate manufacturer-supplier leveraged agreements.The relatively small universe of suppliers that some companiesinteract with makes customer participation less of an issue forthese agreements.
Collection Networks
Collection networks fall into several categories. These include:1) contracting with professional shippers using prepaid shippinglabels; 2) direct return to retail outlets, where product is reshippedto the manufacturer; 3) use of nonprofit service organizations ascollection centers; and 4) use of a manufacturer-operated returnnetwork.
Hewlett-Packard’s toner cartridge take-back program is an ex-ample of the first type of collection network. HP supplies all cus-tomers with prepaid United Parcel Service (UPS) shipping labels.Large customers also receive bulk shipping containers for mul-tiple cartridges free of charge. The customer may request a UPSpick-up of the cartridge, or may take the cartridge to Mail BoxesEtc., where UPS will pick it up.
UPS now has over 200 clients that use its Asset Recovery Ser-vice (ARS) to provide for efficient, prepaid return of items. Some ofthese ARS programs have no environmental dimension; others,like the Hewlett-Packard program, are specifically designed withenvironmental goals in mind. The UPS program allows companieswith take-back programs to take advantage of a preexisting, highly
27

efficient shipping network. Prepaid shipping programs appear mostfeasible when the returned product has high reuse,remanufacturing, or recycling value.
Numerous programs, such as Nike’s Reuse-a-Shoe program andthe Ecolog outdoor clothing program, are examples of the secondcategory of collection network. When the manufacturer has a pre-existing, decentralized, and substantial network of retail outletsdirect returns can be efficient. LensCrafters’ Gift of Sight programuses its 700-plus retail outlets and the nonprofit Lions Club Inter-national to provide a product-return network.
Several product-leasing programs, including some returnablepallet programs, offer manufacturer-operated networks. Chep USAships products in a variety of returnable containers and pallets,each marked with a bar code for tracking purposes. Chep providesparticipating customers with computer software to allow for tracking and return.
To date, voluntary take-back programs appear to have emergedin circumstances where there are one or several of the followingcharacteristics:
• a high risk of improper disposal and associated liabilities
• a high value associated with the discarded product
• relatively low-frequency, high-value transactions betweena manufacturer and a consumer
• a relatively close or ongoing relationship between the cus-tomer and manufacturer
• specialty or high-end products for which environmentalor other social goals may enhance customer loyalty
In the absence of any of these qualities, environmental steward-ship is more likely to take a different form. Environmental certifi-cation initiatives, firm-specific life-cycle analysis in productdevelopment, and source reduction offer viable alternatives.
Environmental progress involves not only technological innova-tion but also institutional innovation that links production and con-
Mandated EPR programs … stifle innovativeapproaches and impose added costs on consumers.
28

sumption choices to the environmental impacts associated withthose choices. Competitive markets help foster this institutionaldiscovery process and allow firms and industries to tailor their en-vironmental responses.
If take-back programs fail to emerge, this is not evidence ofmarket failure. It is an indication that: 1) manufacturers antici-pate more costs than benefits to their consumers from theseprograms; or 2) barriers exist (for example, disadvantageous taxtreatment for leased rather than purchased products) that inhibitintroduction of take-back programs.
VII. Conclusion
Twenty-first century business practices will increasingly movetoward product-design and manufacturing decisions that routinelyblend in environmental considerations. Moving toward this “indus-trial ecology” involves experimentation in product development andnew technologies as well as in organizational strategy and institu-tional design.
As consumers press for continued environmental protection,firms competing in the marketplace are stepping up their efforts toprovide “environmental value” to their customers through newproducts, new services, and new organizational arrangements.Markets offer a “discovery process” in which part of the search foradding value involves experimenting with new manufacturer-sup-plier-customer relationships. Different arrangements are emerg-ing, depending on product and marketplace characteristics. EPR isone possible institutional arrangement for advancing industrialecology, but it will not “add value” for all products in all circum-stances.
Mandated EPR programs override this discovery process. Likeearlier environmental regulations that prescribed technologicalresponses, such mandates stifle innovative approaches and im-pose added costs on consumers because reporting requirement costsand EPR fees are passed on from manufacturers.
29

Endnotes
1. The OECD held four workshops from 1997 through 1999 on“extended producer responsibility,” or product take back. Themajor focus of these efforts was how to implement such pro-grams. Their literature accepts as relatively undisputed thephilosophical merits of the concept. See, for example, OECDEnvironment Directorate, Environment Policy Committee,Extended and Shared Producer Responsibility: Phase 2 Frame-work Report (Paris: OECD, 5-6 November, 1997). That reportstates, “When properly undertaken, EPR’s strength lies in itsability to simultaneously operationalise life-cycle thinking,the waste minimisation hierarchy, and the Polluter PaysPrinciple” (p. 6).
2. Thomas Lindhquist, “EPR as a Strategy for Cleaner Prod-ucts,” presented at Invitational Expert Seminar, TrolleholmCastle, Sweden, May 4-5, 1992. The term first appeared in1988 in a report to the Swedish Environmental ProtectionAgency, “About a Waste Conscious Product Development,”Swedish EPA Report 3488, Solna, May 1988.
3. Ibid. Lindhquist writes that EPR requires manufacturers ofproducts to “bear a degree of responsibility for the environ-mental impacts of their products throughout the products’life cycles, including upstream impacts inherent in theselection of materials for the products, impacts from themanufacturers’ production process itself, and downstreamimpacts from the use and disposal of the products.”
4. See, for example, M. Porter, (ed.) Environmental Resourcesand the Marketplace (Sydney, Australia: Allen & Unwin,1991); L. Ruff, “The economic common sense of pollution,” inR. Dorfman and N. Dorfman (eds.) Economics of the Environ-ment (New York: Norton, 1972); and P. Lewin, “Pollutionexternalities: Social cost and strict liability,” Cato Journal 1(1982), pp. 205-229.
5. Julian Morris, “Extended Producer Responsibility: Objec-tives, Incentives and the Impact on Trade,” paper presentedat the OECD Workshop on Extended Producer Responsibility,Helsinki, May 11-13, 1998, p. 1.
6. Office of Technology Assessment, Green Products by Design(Washington, D.C.: U.S. Government Printing Office, 1992).
7. Lindhquist, “EPR as a Strategy for Cleaner Products.”
30

8. Lynn Scarlett et al., Packaging, Recycling, and Solid Waste(Los Angeles: Reason Public Policy Institute, June 1997), p. 83.
9. Albrecht Schmidt, Kraft Jacobs Suchard, “Managing theRising Cost of ‘Producer Responsibility’ for Packaged Prod-ucts,” seminar proceedings, Panel III, Questions and An-swers (Brussels: EUROPEN, 1996).
10. Ursula Denison, Duales System Deutschland, “Managingthe Rising Cost of ‘Producer Responsibility’ for PackagedProducts,” seminar proceedings, Panel III, Questions andAnswers (Brussels: EUROPEN, 1996).
11. Mass Flow Verification Report: 1998 (Cologne: Duales Sys-tem Deutschland, May 1999).
12. David Perchard, “Understanding System Differences,”Seminar Proceedings: Managing the Rising Cost of ‘ProducerResponsibility’ for Packaged Products, (Brussels: EUROPEN,1996).
13. Victor Bell, “How Manufacturers Are Responding to ExtendedProducer Responsibility Programs and How These ProgramsCan be Made More Effective,” paper presented at OECDWorkshop on Extended Product Responsibility, December 1-3,1998, Washington, D.C., p. 1.
14. Ibid., p. 2.
15. Scarlett et al., Packaging, Recycling, and Solid Waste, p. 86.
16. Duales System Deutschland, web site (http://www.gruener-punkt.de/e/content/daten/pmmenge.htm), news release,May 3, 1999.
17. Marcus Schroll, “The Challenge of the German Industry inSolid Waste Management: The Example of Packaging”(Bochum, Germany: Institute for Applied Innovation Research,1998).
18. U.S. Environmental Protection Agency, National SourceReduction Report for Municipal Solid Waste in the United States,unpublished draft, April 28, 1999.
19. Canadian Council of Ministers of the Environment, “CanadaExceeds Target to Reduce the Amount of Packaging Sent forDisposal Four Years ahead of Schedule,” news release,January 30, 1998.
20. Andreas Troge, “Comparison of Cost-efficiency of PackagingRecovery Systems in Germany and the Netherlands,” short
31

32
version of diploma of Philipp Axt, translation from German,University of Bayreuth, 1999, Table 17.
21. Klaus Draeger, Principal Scientist, Procter & Gamble,Schwalbach, Germany.
22. Victor Bell, “How Manufacturers Are Responding.”
23. Jacques Fonteyne, Peter White, and S. Gabola, “Assessmentof the Differences between Packaging-related EPR Policiesin Belgium and the Netherlands,” presented at OECD Work-shop on Extended Product Responsibility, December 1-3,1998, Washington, D.C.
24. Eric Staudt, “Innovation: Forschung und Management,”Institut fur angewandte Innovationsforschung, 1997.
25. Marcus Schroll, “The Challenge of the German Industry inSolid Waste Management: The Example of Packaging,”presentation slides, Institute for Applied Research, Bochum,Germany, 1998.
26. See Franklin Associates, Characterization of Municipal SolidWaste in the United States: 1997 Update, prepared for U.S.Environmental Protection Agency, Report No. EPA530-r-98-007, May 1998. For a discussion of recycling costs in theUnited States, see Lynn Scarlett, “Recycling Costs: ClearingAway Some Smoke,” Solid Waste & Power, July/August 1993;see also Solid Waste Association of North America, IntegratedMunicipal Solid Waste Management: Six Case Studies of SystemCosts and Energy Use (Silver Springs, Md.: SWANA, November1995).
27. Andreas Troge, “Comparison of Cost-efficiency of PackagingRecovery Systems in Germany and the Netherlands,” Tables16, 25, and 29.
28. Ibid., Section D, II, 2.
29. Wolfram Bruck, presentation at the fifth meeting on “Imple-mentation of the Packaging Ordinance and Packaging WasteDirective,” Brussels, March 25, 1998.


Other publications available in this series:
145. Are Storm Clouds Brewing on the Environmental JusticeHorizon? Stephen B. Huebner, April 1998
146. Global Deception: The Exaggeration of the GlobalWarming Threat, Patrick J. Michaels, June 1998
147. A New Approach to Regulatory Reform, MurrayWeidenbaum, August 1998
148. Government�s Hand in the Recycling Market: A NewDecade, Christopher Douglass, September 1998
149. Questioning the Emphasis on EnvironmentalContaminants as a Significant Threat to Children�s Health,Stephen Huebner with Kenneth Chilton, November 1998
150. Do We Need the Federal Government to Protect AirQuality? Indur M. Goklany, December 1998
151. Enhancing Environmental Protection While FosteringEconomic Growth, Kenneth W. Chilton, March 1999
152. Are Economic Growth and a Sustainable EnvironmentCompatible? Kenneth W. Chilton, September 1999
Additional copies are available from:
Center for the Study of American BusinessWashington UniversityCampus Box 1027One Brookings DriveSt. Louis, Missouri 63130-4899Phone: (314) 935-5630http://csab.wustl.edu