Study of Low Cycle Thermal Fatigue and Aluminum Alloy … · · 2012-02-06Fatigue and fracture...
32
Instructions for use Title Low cycle thermal fatigue and microstructural change of AC2B-T6 aluminum alloy Author(s) Sasaki, Katsuhiko; Takahashi, Tsuyoshi Citation International Journal of Fatigue, 28(3): 203-210 Issue Date 2005-08-02 Doc URL http://hdl.handle.net/2115/1399 Type article (author version) File Information IJF28-3.pdf Hokkaido University Collection of Scholarly and Academic Papers : HUSCAP
Transcript of Study of Low Cycle Thermal Fatigue and Aluminum Alloy … · · 2012-02-06Fatigue and fracture...

Instructions for use
Title Low cycle thermal fatigue and microstructural change of AC2B-T6 aluminum alloy
Author(s) Sasaki, Katsuhiko; Takahashi, Tsuyoshi
Citation International Journal of Fatigue, 28(3): 203-210
Issue Date 2005-08-02
Doc URL http://hdl.handle.net/2115/1399
Type article (author version)
File Information IJF28-3.pdf
Hokkaido University Collection of Scholarly and Academic Papers : HUSCAP
1/20
Low Cycle Thermal Fatigue and Microstructural Change of AC2B-T6 Aluminum Alloy
Katsuhiko SASAKI
Division of Mechanical Science, Hokkaido University, N13, W8, Kita-ku, Sapporo, 060-8628 Japan TEL:+81-11-706-6415, FAX:+81-11-706-7889
E-mail: [email protected] (Corresponding Author)
Tsuyoshi TAKAHASAHI Department of CAE & System Promotion, Hokkaido Engineering Group,
ISUZU Motors Limited, Chitose, 066-0009 Japan
ABSTRACT - Low cycle thermal fatigue tests were conducted using an aluminum alloy AC2B-T6,
which is widely used in diesel engines, especially, in cylinder heads. Specimens made of the
AC2B-T6 alloy were subjected to thermal fatigue with thermo-mechanical loadings over several
temperature ranges, symmetric and asymmetric strain amplitudes, and cycle periods. These test
conditions are chosen considering realistic running conditions of diesel engines. A method to predict
time to fatigue failure under the test conditions is proposed. The specimens were also observed by
transmission electron microscope (TEM) to clarify the effects of temperature, strain amplitude, and
cycle period on microstructural changes such as precipitates. Finally, the relationship between the
microstructural changes and the low cycle thermal fatigue is discussed.
Key Words: Low Cycle Thermal Fatigue, Aluminum Alloy, Precipitate, Plasticity, Engines

2/20
1 INTRODUCTION
Demand for an aluminum alloy cylinder head for diesel engines has increased to reduce
the weight of automobiles and improve fuel economy for environmental protection. However, low
durability of aluminum alloys as a result of low cycle fatigue failure at high temperatures is an
important issue in predicting efficient engine systems where the cylinder head can be used at higher
temperature than in existing engine systems.
The cylinder head is subjected to heat cycling, i.e. the temperature of an engine is low at
stopping and high when running. As a result, aluminum alloys used for cylinder heads are subjected
to thermo-mechanical loading, which causes thermal fatigue failure. Aluminum alloys are usually
hardened by precipitation, and the microstructure of the aluminum alloys change due to the high
temperature at running [1]. Non-linear mechanical behaviors such as plastic and viscoplastic
deformation caused by thermo-mechanical loading also lead to microstructural changes [1].
Therefore, evaluation of low cycle thermal fatigue failure is very difficult. This suggests the need for
a new method to evaluate thermal fatigue failure. Also, the microstructural changes due to
thermo-mechanical loading must be better understood to help in the development of new aluminum
alloys for more reliable cylinder heads.
Fatigue and fracture toughness of high-strength aluminum alloys have been studied
extensively. Srivatsan et al. [2] studied the influence of temperature on cyclic stress response

3/20
characteristics, cyclic strain resistance, fatigue life, and fracture behavior of the AA2254 aluminum
alloy and they observed the microstructural changes during the loading. Clark et al. [3] conducted
fatigue tests using the AA7050-T7351 aluminum alloy and examined temperature effects on fatigue
failure. DeBartolo et al. [4] studied fatigue behavior of an aluminum alloy containing particle
clusters and established the effect of constituent particles on the fatigue failure. Yu et al. [5]
investigated hardness, strength, and elongation using the AA2618 aluminum alloy with Al3 (Sc, Zr)
phases at several temperatures. Fujii et al. [6] investigated the microstructural evolution during
fatigue under constant stress amplitudes using a polycrystalline AA3003 aluminum alloy, and
compared the results with the stress-strain responses under constant strain amplitudes. Bergsma et al.
[7] studied the effect of temperature on strength and fatigue resistance of the AA6069 aluminum
alloy from microscopic observations. Turkmen et al. [8] examined the uniaxial cyclic response of an
aluminum alloy, AA7075-T6, based on finite element (FEM) simulation considering microstructural
changes and compared the simulation with the macroscopic behavior obtained by tests. Fan et al. [9]
performed a FEM analysis for micronotches including pores and silicon particles of an AA356
aluminum alloy to better understand the fatigue resistance from a microscopic point of view.
The effects of heat treatments and ambient temperature on mechanical properties and
fatigue failure of aluminum alloys have also been studied. Tsai et al. [10] observed the
microstructure of tensile test specimens and concluded that an over-aging treatment is effective to

4/20
prevent stress corrosion cracking at room temperature. Esmaeili et al. [11] examined the deformation
behavior of AA6111 as a function of temperature and precipitates using work hardening behavior
analysis and strain rate sensitivity measurements. Dumont et al. [12] investigated the relationship
between yield strength, strain hardening, notch resistance, and fracture and microstructural changes
such as precipitates using the AA7050 aluminum alloy.
In these studies, however, the microstructural characteristics such as precipitates and
dislocation densities were not evaluated quantitatively, and very few thermal fatigue tests of
aluminum alloys for engine parts have been conducted under actual engine running conditions [13].
Recently, the authors conducted FEM analysis of a cylinder head considering the microstructure
distribution due to casting conditions [14].
In this paper, a method to evaluate low cycle thermal fatigue failure, and microstructure
changes during the thermal fatigue failure was studied using an AC2B-T6 aluminum alloy for
cylinder heads. First, low cycle thermal fatigue tests were performed under engine running
conditions to clarify the elastic, plastic, viscoplastic deformation, and thermal fatigue failure. An
efficient method to evaluate the low cycle thermal fatigue failure was developed to estimate the
fatigue failure due to different temperature ranges, symmetric and asymmetric strain ranges, and
cycle periods. Microstructural changes after low cycle thermal fatigue tests were observed by TEM,
especially focusing on precipitates. The relationship between precipitates and temperature range,
5/20
symmetric strain ranges, and cycle periods during the low cycle thermal fatigue tests are discussed.
2 EXPERIMENTAL PROCEDURES
2.1 Specimens and Testing Machine
Table 1 shows the chemical composition of the tested alloy. The alloy is AC2B treated by
the T6 heat treatment. The alloy was held at 490 ºC for 1.5 hours, then quenched in water, and
artificially aged at 196 ºC for 2 hours. The dendrite Arm Spacing (DAS) was 0.02 to 0.03mm and the
volume fraction of porosity smaller than 0.3%. Test pieces for the low cycle thermal fatigue tests
were solid rods which have a diameter of 7mm and gauge length of 21mm, respectively.
The specimens for the microscopic observations were sampled approximately 3 mm from
the fractured surface of the test piece in the longitudinal direction; the specimens were circular plates
which have a 2 mm diameter and 0.2 mm thick, respectively. The center of the circular plate was
thinned by electrolytic polishing using methanol nitrite. The minimum thickness of the sample was
around 500nm. The microstructure was observed by a transmission electron microscope (TEM) of
200 kV accelerating voltage. The same crystal plane was observed in the same direction for all the
samples: <110>, g={111}.
An electro-hydraulic servo testing machine, MTS 810, was used for the thermal fatigue
tests. Strain was measured by using an extensometer, the MTS model 632, 50C-05 [13]. The test

6/20
pieces were heated by an induction heating apparatus, Shimada-Rika SST-20L. The specimens were
cooled down by air blowing with controlling air to keep the temperature error under 0.2K. FEM
analyses were conducted to clarify the temperature distribution of the specimen during the heating
and cooling processes. The maximum difference in the temperature between the surface and center
of the specimen was 0.2K. Therefore the temperature distribution of the specimen does not affect on
the test results significantly.
2.2 Test Method and Conditions
Figure 1 shows the strain and temperature conditions in the thermal fatigue tests. The
waves of both strain and temperature are triangular, and controlled so that the maximum strain is
produced at the lower temperature, to simulate actual running conditions in engines.
Table 2 shows the test conditions. The test parameters are the total strain amplitude ,
temperature range , and cycle time
Δε
TΔ tΔ , each at two or more values; Nf is the number of cycles
to fatigue failure, which was defined as the number of cycles when the tensile load was reduced to
75% of the maximum or steady-state value, and tf is the time to fatigue failure.
Tests No.9~11 were conducted in the asymmetric strain range, where the center of the
strain was not zero, and they are referred to as ‘mean strain tests’ hereafter. These test conditions
were chosen to simulate the running conditions of the engine [15, 16].
In all the thermal fatigue tests, loading was started in the compressive direction, as in a
7/20
real engine [15]. The brackets of tests No.3~8 indicate that the microstructural observations were
conducted by TEM.
3. RESULTS OF LOW CYCLE THERMAL FATIGUE TESTS
3.1 Stress-Strain Relations Caused by Thermo-Mechanical Loading
Figure 2 (a) shows stress-strain relations for several temperatures ranges; 100°C to 200°C,
100°C to 250°C, and 120°C to 300°C with a strain amplitude of 0.55% under a cycle period of 10
minutes. In Fig. 2 only the 3rd cycle is shown for clarify. The stress-strain relations are very different
in the different temperature ranges. Stress relaxation occurred in the compressive process in the
100°C to 250°C and 120°C to 300°C temperature ranges. The stress relaxation starts at around -0.3%
in the 100°C to 250°C temperature range, and at around -0.06% in the 120°C to 300°C temperature
range. Both the total strains of -0.3% and -0.06% correspond to temperatures of approximately
220°C. The 220°C (493K) temperature is about 56% of the melting point Tm of the aluminum alloy,
615°C (888K). The temperature range between 0.5Tm and 0.6Tm is considered to be the range where
both diffusion creep and dislocation creep occur, and the alloy is considered to soften in this
temperature range. At the same time, stress relaxation does not occur in the tensile process where the
temperature is low.
Figure 2 (b) shows the stress-strain relation with different cycle period. In Fig. 2 (b), the
8/20
cycle periods differ from 5, 10, to 20 minutes at the strain amplitude of 0.55% in the 100°C to 250°C
temperature range. There is a small but noticeable difference in maximum stress due to the cycle
period despite the only 4 times difference in cycle period. The minimum stress decreases as the cycle
period becomes shorter, and the maximum difference between the 5 and 20 minute cycle periods is
about 20MPa.
Figure 2 (c) shows the stress-strain relation at the 3rd cycle of four different mean strain
tests. The stresses at the maximum and minimum strains of the three mean strain tests of -0.15, 0.15,
and -1.55% are almost the same values, while those of 0% mean strain test are a little smaller than
the others.
3.2 Method of to Evaluate Low Cycle Thermal Fatigue Failure
The Nf and tf in Table 2 show the number of cycles and time to fatigue failure. There are
large differences in the Nf and tf fatigue lives due to temperature range, cycle period, the strain range,
and mean strain. The fatigue life becomes shorter as the strain range becomes larger, and it is longer
as the cycle period is lengthens and as the maximum temperature increases. However, the mean
strain does not correlate with fatigue life.
In this paper the plastic work density per unit time was used as a parameter in evaluating
fatigue failure. Figure 3 shows the definitions of the plastic work density per unit time; the total
strain amplitude , plastic strain amplitude 3 3Δε pΔε , and stress amplitude 3Δσ for the 3rd cycle

9/20
stress-strain curve are also shown in Fig. 3. The plastic work density per unit time 3PΔ can be
expressed by the plastic strain energy density 3SΔ , which is the area of the stress-stress curve at 3rd
cycle, and the cycle period as follows: tΔ
33
SP =t
ΔΔ Δ
(1)
The reason for focusing on the 3rd cycle is that if the parameter of the early stage of the
fatigue process can be used, a great deal of time for computer simulation can be saved in estimating
the fatigue life by the structural analysis and thermo-mechanical fatigue test.
Coffin-Manson relation [17, 18] has been widely used for evaluations of low cycle fatigue
failure. To evaluate fatigue failure under creep-fatigue interaction conditions, the plastic strain
energy density has been used [19, 20] and applied to stainless steels [21] and solder alloys [22, 23].
However the plastic strain energy density can not be applied to the thermal fatigue failure of the
aluminum alloy because the effect of cycle period on the hysteresis loops is small as shown in Fig.
2(b) though the effect of the cycle period on the number of cycle to fatigue failure is large. In this
paper, therefore the plastic work density per unit time was used as a parameter in evaluating fatigue
failure.
Figure 4 shows the relationship between the plastic strain amplitude and fatigue life time
in log-log scale because the plastic strain amplitude is ordinarily used to evaluate low cycle fatigue
failure as the Coffin-Manson relation [17, 18]. The arrow in Fig. 4 shows the results of the mean
10/20
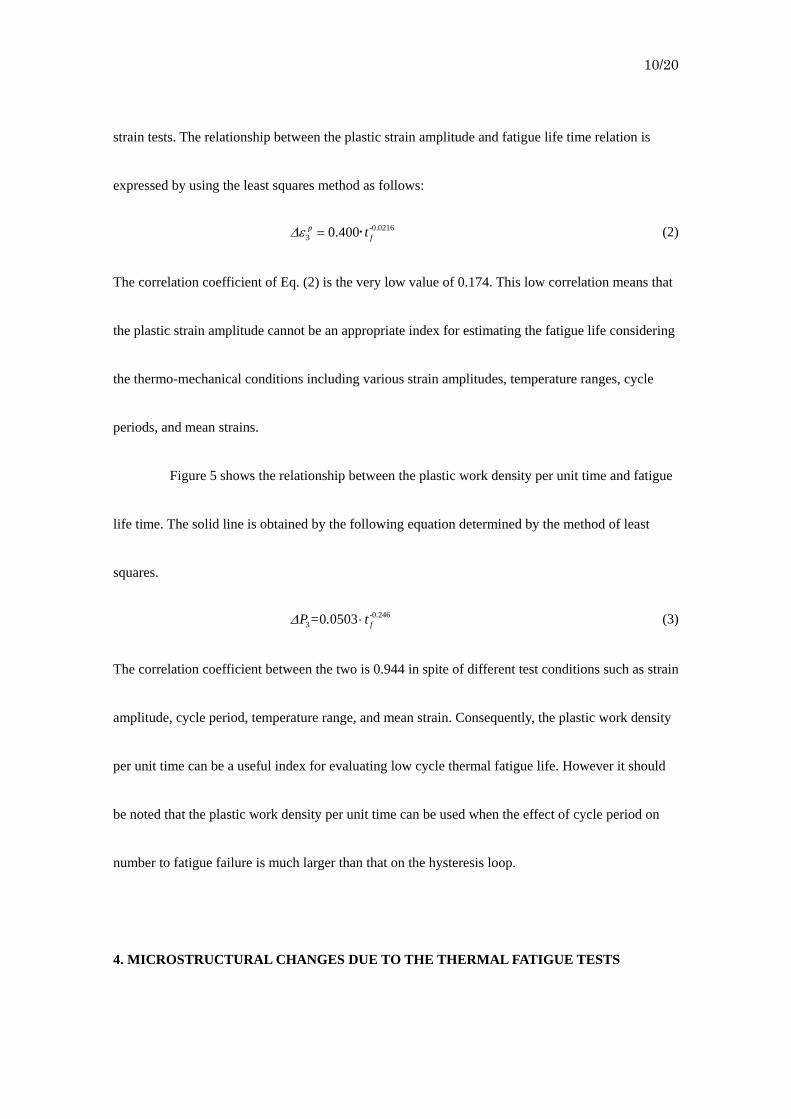
strain tests. The relationship between the plastic strain amplitude and fatigue life time relation is
expressed by using the least squares method as follows:
(2) -0.02163 0.400p
ftΔε = ・
The correlation coefficient of Eq. (2) is the very low value of 0.174. This low correlation means that
the plastic strain amplitude cannot be an appropriate index for estimating the fatigue life considering
the thermo-mechanical conditions including various strain amplitudes, temperature ranges, cycle
periods, and mean strains.
Figure 5 shows the relationship between the plastic work density per unit time and fatigue
life time. The solid line is obtained by the following equation determined by the method of least
squares.
(3) 0 2463 0 0503 - .
fP = . tΔ ⋅
The correlation coefficient between the two is 0.944 in spite of different test conditions such as strain
amplitude, cycle period, temperature range, and mean strain. Consequently, the plastic work density
per unit time can be a useful index for evaluating low cycle thermal fatigue life. However it should
be noted that the plastic work density per unit time can be used when the effect of cycle period on
number to fatigue failure is much larger than that on the hysteresis loop.
4. MICROSTRUCTURAL CHANGES DUE TO THE THERMAL FATIGUE TESTS
11/20
The aluminum alloy AC2B-T6 is strengthened by both solutions of Cu and precipitates of
metastable medium phases such as Al2Cu. The precipitation hardening of materials subjected to T6
heat treatment is the highest in the materials subjected to other heat treatments such as T3, T4, T5,
T7, T8, and T9 for aluminum alloys. This means that the precipitates mainly dominate the hardening
of the aluminum alloy AC2B-T6. Therefore, if there is a correlation between the low cycle thermal
fatigue failure and precipitates, and this correlation could be incorporated into a method to evaluate
fatigue failure, the development of new aluminum alloys could proceed more rapidly. Here, the
precipitate at fatigue failure was observed by TEM and the correlation between changes in
precipitates and low cycle fatigue failure is discussed.
4.1 TEM Observation
Figure 6 shows the microstructure of a specimen before the thermal fatigue testing. The
wavy lines in Fig. 6 are dislocation lines occurring during the water quenching. No precipitates are
observed in the specimen before the thermal fatigue tests.
Figures 7(a) ~ (c) are examples of TEM observations of the fractured test pieces after the
thermal fatigue tests No. 3, 7, and 8 in Table 2. The TEM micrograph were chosen to show the
temperature dependence, which affects the stress-strain relation strongly during the fatigue test as
shown in Fig. 2(a). Figure 7(a) shows the microstructure of the No.3 specimen (Δε = ±0.55 %,
ΔT=100~250ºC, Δt=10 min.) with the picture of the diffraction pattern showing the g vector.

12/20
There are precipitates and dislocations in Fig. 7 (a) ~ (c), and the sizes and densities of the
precipitates are affected by the test conditions, i.e., the size of the precipitates increases with the
maximum temperature and the density is higher for lower temperatures. Two types of precipitates are
observed in Fig. 7 (a) ~ (c): one appears needle and the other ellipsoidal-like. The needle-like
precipitates incline in the same direction at an angle to the g vector and are present on the <100>
plane. The chemical compositions of the two types of precipitates were the same, the intermetallic
compound Al2Cu. The needle-like precipitates are actually considered to be plane in shape [24], and
their thicknesses appear in the micrographs as needle-like. In general, Θ-phase ellipsoidal
precipitates are considered to be contained in the precipitates, but they cannot be distinguished from
the other precipitates in this observation of the surface. In this paper, to evaluate the relationships
between the precipitates and fatigue failure the precipitates were simply divided into two types;
needle-like (type 1) and ellipsoidal-like (type 2). To identify the two precipitates crystallography and
morphology, the precipitates on other planes such as (101) and (001) planes should be observed. This
observation remains as a further work.
The sizes of the two types of precipitates are defined as shown in Fig. 8, i.e. the length of
the needle-like precipitate is defined as the size, , and the length of longer axis of the
ellipsoidal-like precipitate, . The relationship between the size of the precipitates and fatigue
life, and the plastic work density per unit time are discussed below.
type1L
type2L

13/20
4.2 Relationship between Size of Precipitates and Fatigue Life
Figure 9(a) and (b) show the relationships between the mean sizes of type 1, and type 2
and fatigue life, where the lines connect the data plots with only one test parameter varied. For the
effect of the cycle period (chained lines: No. 3, 5, and 6), temperature range (solid lines: No. 3, 7,
and 8), and strain amplitude (broken-lines: No. 3 and 4) in Fig. 9 (a), there are correlations between
the mean size of type 1 and the cycle period, temperature range, and strain amplitude. Longer cycle
period, higher temperature, and smaller strain amplitude lead to smaller mean size of type 1.
Moreover, the fatigue life is longer with smaller size of precipitates, and there are no type 1
precipitates if the fatigue life is longer than a certain time to fatigue failure. This indicates that the
size of type 1 precipitate has a strong effect on the fatigue life, and that life is long when no type 1
precipitates are present in the microstructure.
For the type 2 precipitates in Fig. 9(b), the cycle period (chained lines: No. 3, 5, and 6)
does not make a great difference in the mean size of precipitate. The effect of the temperature range
(solid lines: No. 3, 7, and 8) on the mean size of the type 2 is largest. The effect of strain amplitude
(broken-lines: No. 3 and 4) on the mean size of the type 2 is between those of the effect of
temperature range and cycle period. Therefore, for type 2 precipitates, there is no correlation
between the mean size and the fatigue life. All this suggests that the fatigue life can be lengthened by
preventing the formation of type 1 precipitates or by reducing the size.

14/20
The good correlation between the mean sizes of the type 1 precipitate and fatigue failure
comes from the interaction between the type 1 precipitates and dislocation. That is, the type 1
precipitate becomes obstacles for the progress of the dislocation and the dislocation piles up around
the type 1 precipitates. The lager mean size of the type 1 precipitate leads to the more pile-up of the
dislocation.
4.3 Relationship between Size of Precipitates and Plastic Work Density per unit time
Figure 10 shows the relationship between the mean size and the plastic work density per
unit time for types 1 and 2 precipitates. It can be seen from Fig. 10(a) that there is a correlation
between the mean size of the type 1 and the plastic work density per unit time over 0.00175 kW/m3,
i.e., the plastic strain work density per unit time is larger as the mean size of type 1 is larger. The
mean size of the type 1 (Ltype1) is expressed by a formula of plastic work density per unit time,
except for the test 6 results, as follows:
(4) type1 3L =1623 6 ln( P ) 10111 . Δ⋅ +
On the other hand, there is no correlation of the mean size of type 2 precipitate with the plastic work
density per unit time In Fig. 10(b).
Equation (4) can be used to estimate the mean size of the type 1 if the plastic work density
per unit time as a macroscopic characteristic is obtained from fatigue test results. However, Eq. (4)
can be applied to the loading condition discussed in this paper. For the other loading conditions,

15/20
which include hold time and creep deformation, additional experiments are required.
5 CONCLUSIONS
In this paper, a method to evaluate low cycle thermal fatigue failure was developed for the
aluminum alloy AC2B-T6 which is used for cylinder heads of diesel engines. The relationship
between low cycle thermal fatigue characteristics and microstructure observed by TEM is also
discussed. The following conclusions were obtained:
1. Stress-strain relations are influenced by temperature range, cycle period, strain range, and mean
strain. The effect of temperature range on the stress-strains is the largest.
2. Thermal fatigue life is influenced by temperature range, cycle period, strain range, and mean
strain. The effect of the cycle period on the thermal fatigue life is the largest.
3. There is a correlation between the plastic work density per unit time and time to fatigue failure,
irrespective of the temperature ranges, symmetric strain ranges, asymmetric strain ranges, cycle
periods, and mean strain. Plastic work density per unit time was shown to provide a useful
index for evaluating thermal fatigue under the condition of the time period of fatigue tests
conducted in this paper.
4. Precipitates on the (100) plane were observed after the thermal fatigue tests. The precipitates
were categorized into two types, needle-like type 1 and ellipsoidal-like type 2 on the (100)

16/20
plane.
5. There is a strong positive correlation between the plastic work density per unit time and the
mean size of Type 1 precipitates observed in the (100) plane. This means that the macroscopic
characteristic of plastic work density per unit time can be used to know the condition of the
microstructure of a specimen. This also suggests the possibility of developing method for
evaluating the thermal fatigue life by considering the macroscopic and microscopic
characteristics.
Finally it should be noted that additional experiments and microstructural observation will
be needed to apply the method discussed in this paper to more general cases. These will appear in
the other paper.
ACKNOWLEDGEMENTS
The authors wish to thank Professor Soumei Ohnuki (Graduate School of Material Science
and Technology, Hokkaido University) for discussions and comments.
REFERENCES
[1] K. Sasaki, T. Takahashi and H. Numano,” Low Cycle Fatigue Failure and Microstructural
Change of Aluminum Alloy Subjected to Thermo-Mechanical Loading”, ICM-8 proceedings,
17/20
(1999) 79-84.
[2] T.S. Srivatsan, D. Kolar and P. Magnusen, ”Influence of temperature on cyclic stress response
strain resistance and fracture behavior of aluminum Alloy 2524”, Materials Science and
Engineering, Vol. A314 (2001) 118-130.
[3] D. A. Clark and W. S. Johnsonl, ”Temperature effects on fatigue performance of cold expanded
holes in 7050-T7451 aluminum alloy”, Fatigue International Journal of Fatigue, Vol. 25, (2003)
159-165.
[4] E.A. DeBartolo and B.M. Hillberry, ”Effects of constituent particle clusters on fatigue behavior
of 2024-T3 aluminum alloy”, Int. J. Fatigue Vol. 20, (1998) 727-735.
[5] Kun Yu, Wenxian Li, Songrui Li, Jun Zhao, ”Mechanical properties and microstructute of
aluminum alloy 261 8 with Al3(Sc, Zr) phases”, Materials Science And Engineering, Vol. A368,
(2004) 88-93.
[6] T. Fujii, C. Watanabe, Y. Nomura, N. Tanaka and M. Kato, “Microstructural Evolution during
Low Cycle Fatigue of a 3003 Aluminum Alloy”, Materials Science and Engineering, Vols.
A319-321, (2001) 592 -596.
[7] S. C. Bergsma, M. E. Kassner, X. Li and M. A. Wall, “Strengthening in The New Aluminum
Alloy AA 6069”, Materials Science and Engineering, Vol. A254, (1998) 112 -118.
[8] H. S. Turkmen, R. E. Loge, P. R. Dawson and M. P. Miller, “On The Mechanical Behavior of
18/20
AA 7075-T6 during Cyclic Loading”, International Journal of Fatigue, Vol. 25, (2003) 267-281.
[9] J. Fan, D. L. McDowell, M. F. Horstemeyer and K. Gall, “Cyclic Plasticity at Pores and
Inclusions in Cast Al-Si Alloys”, Engineering Fracture Mechanics, Vol. 70, (2003) 1281-1302.
[10] T.C. Tsai and J.C. Chang, Chuang TH,”Atmospheric Stress Corrosion Cracking of Superplastic
7475 Aluminum Alloy”, Metallurgical and Materials Transactions A”, Vol. 27A, September,
(1996) 2617-2627.
[11] S. Esmaeili, L.M. Cheng, A. Deschamps, D.J.Lloyd, W J Poole, “The deformation behaviour of
AA6111 as a function of temperature and precipitation state”, Materials Science and
Engineering, Vols. A319-321, (2001) 461 -465.
[12] D. Dumont, A. Deschamps, Y. Brechet, “On the relationship between microstructure strength
and toughness in aa7050 aluminum alloy”, Materials Science and Engineering, Vol. A356,
(2003) 326-336.
[13] T. Takahashi, A. Koike and K. Sasaki, “Inelastic Behavior and Low Cycle Fatigue of Aluminum
Alloy Subjected to Thermo-Mechanical Loading”, SAE1998 Transactions, Vol.107, Journal of
Materials & Manufacturing, Section 5, (1998) 454-461.
[14] T. Takahashi, Y. Sugimura and K. Sasaki, “Thermal Plastic-Elastic Analysis in Consideration of
Metallurgical Microstructure”, ASME, Journal of Manufacturing Science and Engineering, Vol.
126, (2004) 25-32.
19/20
[15] Takashi Nagayoshi, Takao Kodaira, Masahiko Kumano, “Analysis of thermal fatigue cracks in
cylinder head”, JSAE proceeding, Vol.21, (1992) 153-156.
[16] K.S.Lee, D.N. Assanis, J. Lee and K.M. Chun, “Measurement and Predictions of Steady-State
and Transient Stress Distribution in a Diesel Engine Cylinder Head”, SAE proceedings, (1999)
1999-01-0973.
[17] L. F. Coffin, “A Study of the Effects of Cyclic Thermal Stresses on a Ductile Metal”, ASME,
Vol. 76, (1954) 931-950.
[18] S. S. Manson, “Behavior of Materials under Conditions of Thermal stress”, NACA Report 1170,
(1954).
[19] D. E. Martin, “An Energy Criterion for Low-Cycle Fatigue”, ASME, Journal of Basic
Engineering, 82, (1961) 565-571.
[20] J. D. Morrow, “Cyclic Plastic Strain Energy and Fatigue of Metals”, ASTM STP 378, (1965)
45-87.
[21] F. Ellyin, and K. Golos, “Multiaxial Fatigue Damage Criterion”, ASME, Journal of Engineering
Material and Technology, 110, (1988) 63-68.
[22] H. Ishikawa, K. Sasaki and K. Ohguchi, “Prediction of Fatigue Failure of 60Sn-40Pb Solder
Using Constitutive Model for Cyclic Viscoplasticity”, ASME, Journal of Electronic Packaging,
118, (1996) 164-169.

20/20
[23] J. H. L. Pang, B. S. Xiong and T. H. Low, “Low Cycle Fatigue Study of Lead Free
99.3Sn-0.7Cu Solder Alloy”, International Journal of Fatigue, 26, (2004) 865-872.
[24] J.Y. Yao, G.A. Edwards, D.A. Graham, “Precipitation and Age-Hardening in Al-Si-Cu-Mg-Fe
Casting Alloys”, Materials Science Forum Vols.217-222, (1996) 777-782.
Captions of tables and figures
Table 1 Chemical compositions, wt (%)
Table 2 Thermo-mechanical fatigue test conditions with Nf and tf
Fig. 1 Strain and temperature versus time
Fig. 2 Stress-strain relation of the thermo-mechanical loading for different test factors
(a) Temperature range dependence
(b) Cycle period dependency
(c) Mean strain dependency
Fig. 3 Schematic representation of the plastic strain amplitude, stress amplitude, and plastic work density per unit time
Fig. 4 Plastic strain amplitude at the 3rd cycle versus time to fatigue failure
Fig. 5 Plastic work density per unit time at the 3rd cycle versus time to fatigue failure
Fig. 6 Microstructure of specimen before thermal fatigue tests
Fig. 7 Temperature range effect on microstructure
(a) No.3, ±0.55%, 100-250ºC, 10min/cycle
(b) No.7, ±0.55%, 120-300ºC, 10min/cycle
(c) No.8, ±0.55%, 100-200ºC, 10min/cycle
Fig. 8 Precipitate types and shapes (schematic figure)
Fig. 9 Mean size of precipitate types versus time to fatigue failure
(a) Precipitate type 1
(b) Precipitate type 2
Fig. 10 Mean size of precipitate types versus plastic work density per unit time at 3rd cycle
(a) Precipitate type 1
(b) Precipitate type 2

Table 1 and Table 2 (K. SASAKI and T. TAKAHASHI )
Table 1 Chemical compositions, wt (%)
Cu Si Mg Zn Fe Mn Ni Al2.94 6.09 0.31 <0.01 0.17 <0.01 <0.01 Balance
Table 2 Thermo-mechanical fatigue test conditions with Nf and tf
Test Δε (%) ΔT ( °C) Δt Nf t f (sec)No. εmax εmin Center Tmax Tmin
(min)1 0.4 -0.4 0 250 100 10 984 5904002 0.5 -0.5 0 250 100 10 586 351600
(3) 0.55 -0.55 0 250 100 10 221 132600(4) 0.6 -0.6 0 250 100 10 24 14400(5) 0.55 -0.55 0 250 100 5 18 5400(6) 0.55 -0.55 0 250 100 20 858 1029600(7) 0.55 -0.55 0 300 120 10 624 374400(8) 0.55 -0.55 0 200 100 10 312 187200<9> 0.4 -0.7 -0.15 250 100 10 131 78600<10> 0.7 -0.4 0.15 250 100 10 126 75600<11> 0 -1.1 -0.55 250 100 10 99 59400( );TEM observation, <>;mean strain condition
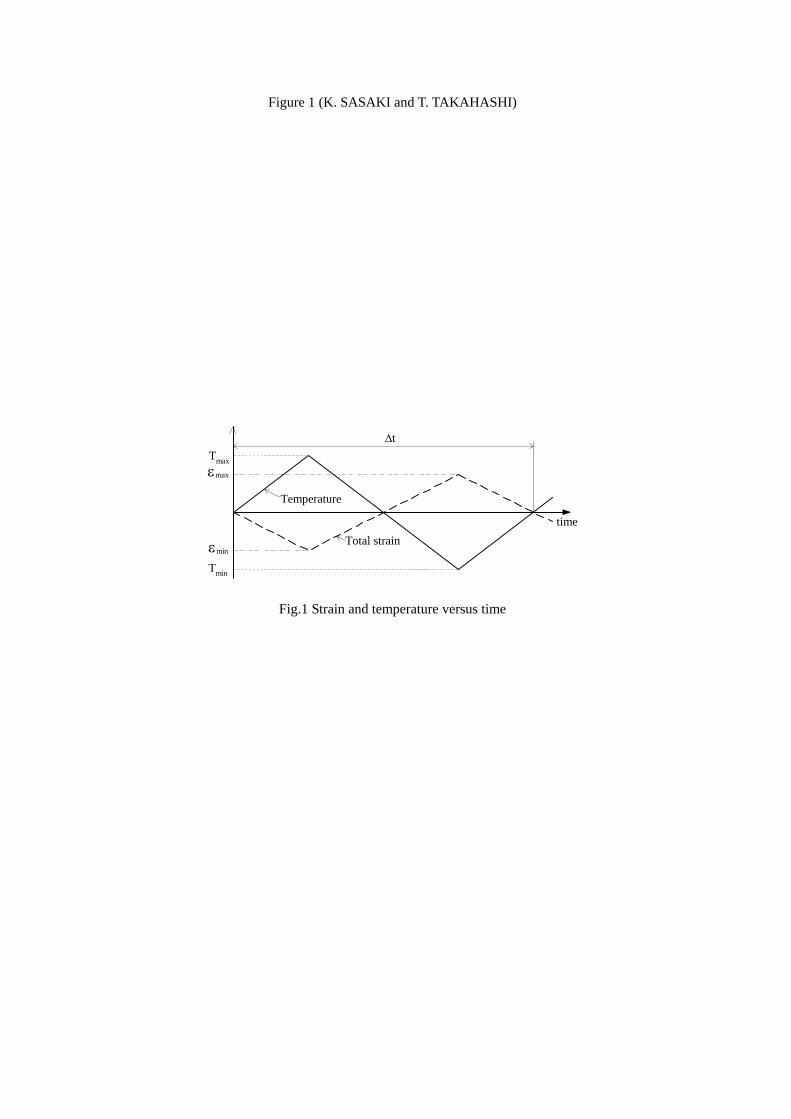
Figure 1 (K. SASAKI and T. TAKAHASHI)
Tmax
Tmin
εmax
εmin
time
Temperature
Total strain
Δt
Fig.1 Strain and temperature versus time

Figure 2 (K. SASAKI and T. TAKAHASHI)
(a) Temperature range dependence
(b) Cycle period dependency
-200
-100
0
100
200
-1.5 -1 -0.5 0 0.5 1
0% -0.15% 0.15% -0.55%
Axia
l stre
ss σ
, (M
Pa)
Axial strain ε, (%)
offset strain
-200
-100
0
100
200
-0.6 -0.4 -0.2 0 0.2 0.4 0.6
; 5; 10; 20
-200
-100
0
100
200
-0.6 -0.4 -0.2 0 0.2 0.4 0.6
; 100-200; 100-250; 120-300
(c) Mean strain dependency
Fig. 2 Stress-strain relation of the thermo-mechanical loading for different test factors

Figure 3 (K. SASAKI and T. TAKAHASHI)
Fig.3 Schematic representation of the plastic strain amplitude, stress amplitude, and plastic work
density per unit time

Figure 4 and Figure 5 (K. SASAKI and T. TAKAHASHI)
0.100
1.000
103
Time to fatigue failure, tf (sec)
Plas
tic st
rain
am
plitu
de a
t 3rd
cyc
le,
3(%
)
mean strain tests
3 = 0.400・tf-0.0216
R = 0.174
No.7No.8No.9
No.10No.11
No.1No.2No.3
No.4No.5No.6
p
104 105 106 107
p
Fig.4 Plastic strain amplitude at the 3rd cycle versus time to fatigue failure
0.001
0.010
Plas
tic w
ork
dens
ity p
er u
nit t
ime
at 3
rd c
ycle
,P 3
(MW
/m3 )
No.7No.8No.9No.10No.11
No.1No.2No.3No.4No.5No.6
P3 = 0.0503・t f-0.246
R= 0.944
103
Time to fatigue failure, tf (sec)104 105 106 107
mean strain tests
Fig.5 Plastic work density per unit time at the 3rd cycle versus time to fatigue failure

Figure 6 (K. SASAKI and T. TAKAHASHI)
Fig.6 Microstructure of specimen before thermal fatigue tests

Figure 7 (K. SASAKI and T. TAKAHASHI)
(a) No.3, ±0.55%, 100-250ºC, 10min/cycle
(b) No.7, ±0.55%, 120-300ºC, 10min/cycle
(c) No.8, ±0.55%, 100-200ºC, 10min/cycle
Figure 7 Temperature range effect on microstructure
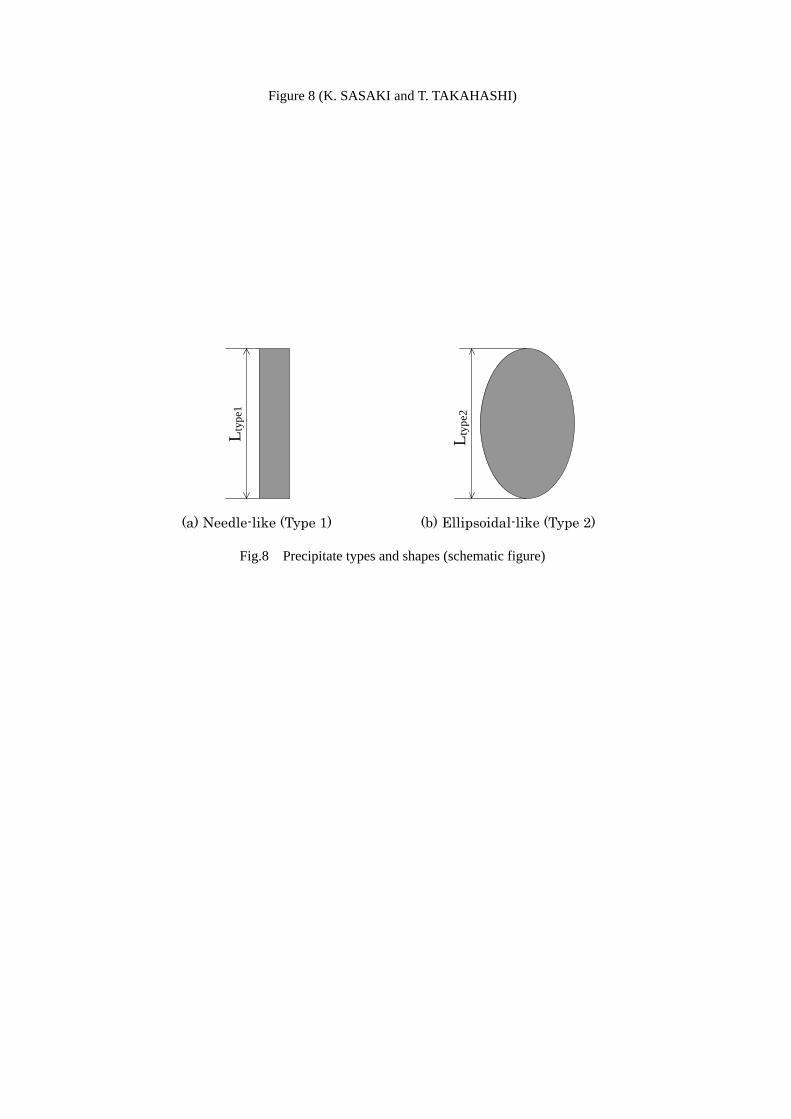
Figure 8 (K. SASAKI and T. TAKAHASHI)
L typ
e1
L typ
e2
(a) Needle-like (Type 1) (b) Ellipsoidal-like (Type 2)
Fig.8 Precipitate types and shapes (schematic figure)

Figure 9 (K. SASAKI and T. TAKAHASHI)
0200400600800
100012001400160018002000
_
Mea
n-Si
ze
L typ
e1, (
A) No.6
No.7No.8
No.3No.4No.5
102
Time to fatigue failure, tf (min)103 104 105
.
(a) Precipitate type 1
200
400
600
800
1000
1200
1400
1600
_
Mea
n-Si
ze
L typ
e2 ,
(A) No.6
No.7No.8
No.3No.4No.5
_102
Time to fatigue failure, tf (min)103 104 10510
.
(b) Precipitate type 2
Fig. 9 Mean size of precipitate types versus time to fatigue failure
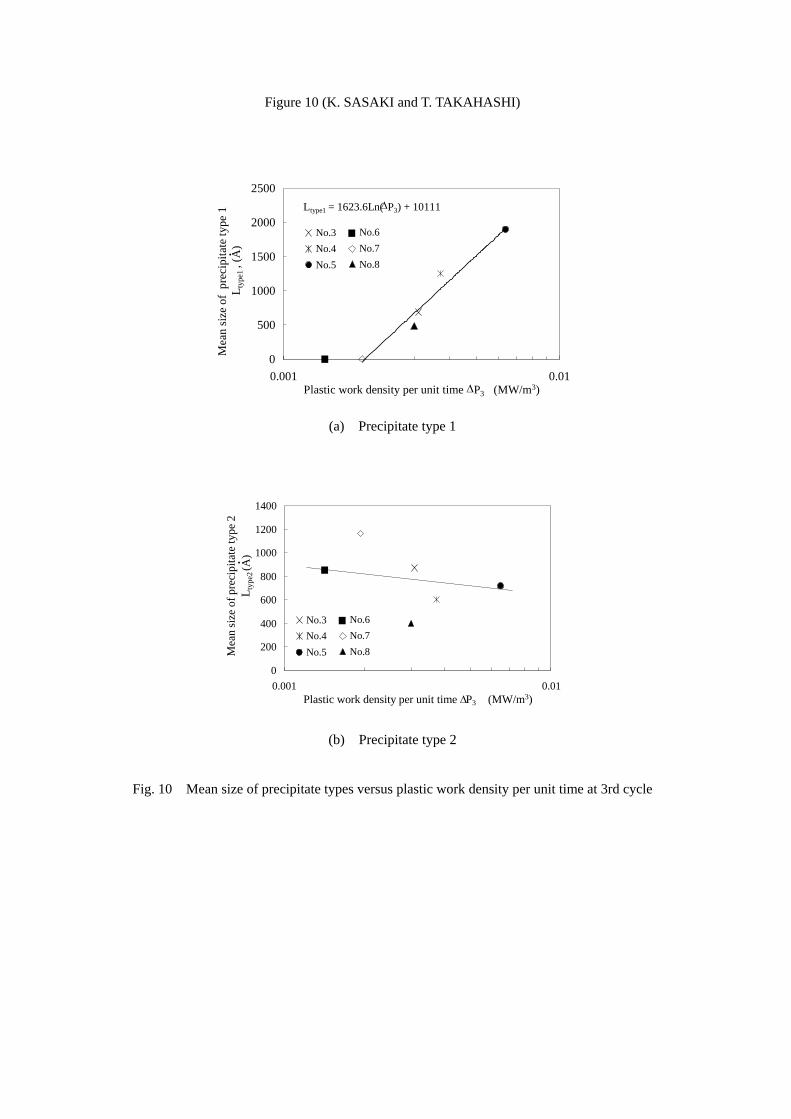
Figure 10 (K. SASAKI and T. TAKAHASHI)
0
500
1000
1500
2000
2500
0.001 0.01Plastic work density per unit time ΔP3 (MW/m3)
Mea
n si
ze o
f pr
ecip
itate
type
1 L
type
1 , (A
)No.6No.7No.8
No.3No.4No.5
Ltype1 = 1623.6Ln(ΔP3) + 10111
.
(a) Precipitate type 1
0
200
400
600
800
1000
1200
1400
0.001 0.01Plastic work density per unit time ΔP3 (MW/m3)
Mea
n si
ze o
f pre
cipi
tate
type
2
No.6No.7No.8
No.3No.4No.5
. (A)
Lty
pe2
(b) Precipitate type 2
Fig. 10 Mean size of precipitate types versus plastic work density per unit time at 3rd cycle