Study of Large Deformations in Automobile Crash Box with ...
206
i Study of Large Deformations in Automobile Crash Box with Novel Geometric Shapes THESIS Submitted in partial fulfilment of the requirements for the degree of DOCTOR OF PHILOSOPHY by NASIR HUSSAIN N ID. No. 2013PHXF0113H Under the Supervision of Prof. Srinivasa Prakash Regalla & Under the Co-supervision of Prof. Yendluri Venkata Daseswara Rao BIRLA INSTITUTE OF TECHNOLOGY AND SCIENCE, PILANI 2020
Transcript of Study of Large Deformations in Automobile Crash Box with ...
i
Study of Large Deformations in Automobile Crash
Box with Novel Geometric Shapes
THESIS
Submitted in partial fulfilment of the requirements for the degree of
DOCTOR OF PHILOSOPHY
by
NASIR HUSSAIN N ID. No. 2013PHXF0113H
Under the Supervision of
Prof. Srinivasa Prakash Regalla
&
Under the Co-supervision of Prof. Yendluri Venkata Daseswara Rao
BIRLA INSTITUTE OF TECHNOLOGY AND SCIENCE, PILANI 2020
ii
BIRLA INSTITUTE OF TECHNOLOGY AND SCIENCE, PILANI
CERTIFICATE
This is to certify that the thesis entitled “Study of Large Deformations in Automobile
Crash Box with Novel Geometric Shapes” and submitted by NASIR HUSSAIN N, ID No.
2013PHXF0113H, for the award of Ph.D. of the Institute embodies original work done by
him under our supervision.
(Signature of the Supervisor) Date:
Dr. Srinivasa Prakash Regalla
Professor, Department of Mechanical Engineering, BITS-Pilani, Hyderabad Campus,
Jawahar Nagar, Kapra Mandal, Hyderabad – 500 078, Telangana, India.
(Signature of the Co-supervisor) Date:
Dr. Yendluri Venkata Daseswara Rao
Associate Professor, Department of Mechanical Engineering, BITS-Pilani, Hyderabad
Campus, Jawahar Nagar, Kapra Mandal, Hyderabad – 500 078, Telangana, India.
iii
BIRLA INSTITUTE OF TECHNOLOGY AND SCIENCE, PILANI
DECLARATION
I hereby declare that the thesis entitled “Study of Large Deformations in Automobile
Crash Box with Novel Geometric Shapes” is conducted under the supervision of Prof.
Srinivasa Prakash Regalla and Prof. Yendluri Venkata Daseswara Rao, Department of
Mechanical Engineering, BITS-Pilani, Hyderabad Campus for the award of Ph.D.
I also declare that this thesis represents original work done by me after the registration for
degree of Ph.D. at BITS-Pilani, Hyderabad Campus and has not been included in any other
thesis or dissertation submitted to this or any other institution for a degree, diploma or other
qualifications.
(Signature of the Candidate) Date:
Name: Nasir Hussain N
ID. NO.: 2013PHXF0113H
Research Scholar,
Department of Mechanical Engineering, BITS-Pilani,
Hyderabad Campus, Jawahar Nagar, Kapra Mandal, Hyderabad – 500 078, Telangana, India.

iv
Dedicated to my beloved Parents
v
Acknowledgements
First and above all, sincere and deep hearted thanks to God, the Almighty, for
providing me everything including this opportunity and granting me the support and
capability to proceed successfully. With His blessings only, I have accomplished this huge
task.
I am grateful to my honourable supervisors Prof. Srinivasa Prakash Regalla and Prof.
Yendluri Venkata Daseswara Rao for their constant support during the entire course of the
Ph.D. program. Their timely guidance and continuous encouragement helped me in
completing the thesis in time.
I express my sincere thanks to all those who directly or indirectly helped me in
completing my Ph.D. in the Mechanical Engineering Department at Birla Institute of
Technology & Science, Pilani (BITS Pilani), Hyderabad campus. I take this opportunity to
thank my doctoral advisory committee members, namely, Prof. N. Suresh Kumar Reddy and
Dr. Arshad Javed, for their valuable suggestions during the entire course of Ph.D.
I express my sincere thanks to Prof. Jeevan Jaidi and Dr. Sabareesh Geetha
Rajasekharan for their support and guidance during the process of submission of the Ph.D
thesis and also for their valuable suggestions during the course.
I am thankful to Prof. B.N. Jain (former Vice-Chancellor, BITS Pilani), Prof. V.S.
Rao (former Director, BITS Pilani Hyderabad campus and former acting Vice-Chancellor,
BITS Pilani), Prof. Souvik Bhattacharyya, Vice-Chancellor, BITS Pilani and Prof. G. Sundar,
Director, Hyderabad campus for giving me this opportunity and providing the facilities for
research in the institute. I am thankful to Prof. S.K. Verma, former Dean, Academic Research
Division, BITS Pilani, Prof. Vidya Rajesh, former Associate Dean, Academic Research
Division BITS Pilani, Hyderabad campus and Dr. V.V. Vamsi Krishna, Associate Dean,
AGSRD of BITS Pilani, Hyderabad campus for their encouragement and co-operation in
carrying out this doctoral work. I am thankful to the convener and members of the DRC for
their continuous support in fulfilling the academic requirements.

vi
I would extend my sincere thanks to all the teaching and non-teaching staff members
of the Department of Mechanical Engineering, BITS-Pilani, Hyderabad campus for
supporting and helping me whenever I needed.
I would like to express my sincere thanks to Prof. Tatacipta Dirgantara, Prof.
Leonardo Gunawan, Dr. Annisa Jusuf, Rizkyansyah Alif Hidayatullah and Eka Curie of
Bandung Institute of Technology and Research University for allowing and also supporting
me in conducting the drop weight impact testing of crash box specimens in the Impact
Testing Laboratory, Mechanical and Aerospace Engineering Department, Bandung Institute
of Technology and Research University located in Bandung, Indonesia.
Lastly and importantly I would express special thanks to my supportive family. My
sincere thanks to my parents, for their unconditional support and making all my dreams come
true. Their love, support, motivation and all physical help have been immeasurable. Special
thanks to my wife for all the sacrifices she has gone through for the successful completion of
my thesis.
NASIR HUSSAIN N
vii
ABSTRACT
Passenger car vehicle safety requirements are growing steadily due to the increased
user awareness. To ensure conformance of vehicle design to these safety requirements,
different countries have put in place regulations with respect to crash safety. These
regulations require a particular vehicle to satisfy certain criteria for obtaining good ratings in
the crash test, thus forcing the manufacturer to make safer cars. Therefore, it has become
more important for automobiles manufactures, in order to pass these regulations, to improve
vehicles through innovative design of the critical parts of the vehicle having bearing on crash
safety. The crash box is one such very important component. The challenge for the
manufacturer is always to decrease the weight of the automobile by reducing the mass of the
vehicle, at the same time provide greater safety through stronger body parts and more energy
absorbing crash box. Making the automobile parts with thinner sheet metals to reduce weight
of the vehicle makes it more difficult for the automobile structural components to qualify by
absorption of sufficient crash energy in case of an impact to the vehicle. The solution to this
contradicting requirement lies in using composite materials that offer higher strength to
weight ratio as compared to the conventional metals and alloys. Composite materials can be
good alternatives for metals and metallic alloys in vehicle structural safety applications such
as crash boxes. Crash box is used in a vehicle for the purpose of absorption of the collision
energy in a frontal collision or frontal crash impact. It is mounted at the front portion of the
front rails in a BIW (body-in-white) or structure of a vehicle. In the event of an impact due to
collision of vehicle, crash box absorbs the impact energy by collapsing with large
deformation so that there is minimum damage to the vehicle parts mounted behind it.
The behaviour of crash box made of composite materials under impact loads has to be
studied for a better understanding of the influence of geometry and type of material on the
crashworthiness. One interesting method of improving the geometric shape of the crash box
is the use of triggers. Triggers are geometric features applied on the crash box to initiate,
modify and improve the deformation pattern so that the crash box may deform in the desired
pattern that helps in achieving the target force and energy level during the deformation of the
crash box. Triggers of certain shapes have been used in the past in metal crash boxes but the
usage of triggers for composite material crash boxes is still under development in automobile
industry. External triggers (external devices with intended trigger configuration and attached
to the crash box) were explored more in composite shell crashworthiness studies. On the
viii
other hand, the work involving triggers intrinsic to geometry (triggers integrally incorporated
into the geometry of the crash box itself, also known as geometric intrinsic triggers) was
done more for metals but less for composite materials. In the present work, for the
improvement of crashworthiness of glass fiber reinforced plastic (GFRP) composite crash
box, triggers have been designed to be integral with the geometric shape/design of crash box.
Triggers can be very helpful for obtaining the target peak force value, energy absorption and
desired deformation pattern.
In this research work, crashworthiness of composite crash box made of GFRP
material designed with different types of geometric cross sections, along with application of
various geometrically intrinsic novel triggers is studied extensively. Initially, crash boxes
made of glass fiber reinforced plastic with four different types of cross sections are
considered. The cross sectional shapes selected for the present work are square, cylindrical,
hexagonal and decagonal geometries. Later, various types of novel triggers, such as; Notch
triggers (different types of notch triggers), Thickness variation triggers (different types of
thickness variation/front end triggers) and Slot triggers (different types of slot triggers) are
used with combination of different geometric cross-sectional shapes.
Numerical simulation is done to understand the effectiveness of each type of cross
section on the crashworthiness behaviour of the GFRP crash boxes when subjected to impact
at low velocity, as per the standard of vehicle testing procedure known as Research Council
for Automobile Repairs (RCAR) test. This was followed by a comparative numerical analysis
for understanding the effectiveness of each type of trigger on the crashworthiness
characteristics of GFRP crash boxes. Force versus displacement plots also known as Force-
Displacement (F-D) diagrams have been constructed and studied in detail to understand the
relationship between the force and deformation of the GFRP crash boxes under impact
loading. Specific Energy Absorption (S.E.A) values are compared for all the combinations of
the cross sections as well as the trigger types used for the crash box for better understanding
of the crashworthiness characteristics. Later carefully chosen variations of the crash box are
manufactured by hand lay-up process to conduct the experiments. The crashworthiness of the
crash boxes is studied by impact testing experiments using drop weight impact testing
machine. The experimental results are correlated with numerical simulation and a good
agreement between them is achieved.

ix
Keywords: Automobile crash box, composite materials, crashworthiness, drop weight impact
testing, glass fiber reinforced plastic (GFRP), low-speed impact testing, numerical
simulation, RCAR, specific energy absorption (S.E.A), triggers.
x
Index
Certificate..…………….……………………………………………………………….. ii
Declaration..…………….……………………………………………………………….. iii
Acknowledgements……...…………………………………………………………….. v
Abstract……….………………………………..………..………………………..……. vii
Table of Contents………………..……………………………………....………….….. xi
List of Tables………………..………………………………………..………….……... xv
List of Figures………………………………………………………………………….. xviii
List of Abbreviations………………………………...………………….………..……. xxvii
List of Symbols……………………..………………………………..………..….…..... xxviii
xi
Table of Contents
Title Page No.
Chapter-1 Introduction…………………………………………………………… 01
1.1 Automobile safety and crashworthiness………………………………………... 01
1.2 Composites in Automobiles…………………………………………………….. 05
1.3 Potential for Composites in Electric Vehicles………………………………….. 07
1.4 Research Background…………………………………………………………... 09
1.5 Background of Deformation and Fracture in Composite Material Crash Boxes.. 11
1.5.1 Types of Composite Materials…………………………………………….. 11
1.5.2 Failure Modes in Compressively Loaded Composite Material Structures... 12
1.5.2.1. Breakage of fiber…………………………………………………….. 12
1.5.2.2. Matrix-Deformation or Matrix-Cracking……………………………. 13
1.5.2.3 Separation of Fibers from the Matrix………………………………… 13
1.5.3 Axial Crushing of Composites…………………………………………….. 15
Chapter-2: Literature Review……………………………………………………. 19
2.1 Review of the Past Work……………………………………………………….. 19
2.2 Gaps in existing Research………………………………………………………. 26
2.3. Research Objectives of the Present Work……………………………………… 27
2.4. Scope of Study…………………………………………………………………. 28
2.5. Research Methodology…………………………………….…..………………. 29
2.6. Organization of the Thesis Report……………………….…..………………… 31
Chapter – 3: Numerical Simulation of GFRP Crash Boxes..…………………... 34
3.1. Introduction…………………………………………………………………….. 34
3.2 Merits of Pre-Test Numerical Simulation in Crashworthiness ………….……... 34
3.3 Numerical simulation of composites in LS-DYNA…………………………….. 35
3.4 Analysis Procedure of Composite Crash Boxes……...………………………… 40
3.5 Numerical Analysis of GFRP Crash Boxes…………..………………………… 46
3.5.1 Different types of cross sectional geometries with no triggers……………. 47
3.5.2. Notch Triggers for Different Cross Sectional Crash Boxes………………. 50
3.5.2.1. Square crash boxes with notch triggers ……………………………... 50
3.5.2.2. Cylindrical crash boxes with notch triggers …………….……..……. 52
3.5.2.3. Hexagonal crash boxes with notch triggers …………………………. 54
3.5.2.4 Decagonal crash boxes with notch triggers ………………………….. 57
xii
3.5.3. Slot Triggers for Different Cross Sectional Crash Boxes ………………... 59
3.5.3.1 Square crash boxes with different types of slot triggers …………….. 59
3.5.3.2 Cylindrical crash boxes with different types of slot triggers ………... 61
3.5.3.3 Hexagonal crash boxes with different types of slot triggers ………… 63
3.5.3.4 Decagonal crash boxes with different types of slot triggers…………. 65
3.5.4. Thickness Variation (Front End) Triggers for Different Cross Sectional
Crash Boxes…....................................................................................................... 67
3.5.4.1 Square crash boxes with thickness variation triggers ………….….…. 68
3.5.4.2 Cylindrical crash boxes with thickness variation triggers ………..….. 70
3.5.4.3 Hexagonal crash boxes with thickness variation triggers …………… 72
3.5.4.4 Decagonal crash boxes with thickness variation triggers ……………. 74
3.6 Comparative Analysis of Crashworthiness of GFRP crash boxes……………… 76
3.6.1 Consolidated results for each type of geometry used for crash boxes…….. 76
3.7 Observations from the Chapter………………………………………….…........ 80
3.8 Summary of the Chapter….…………………………………………………….. 81
Chapter – 4: Manufacturing of the Experimental GFRP Crash Box
Specimens………………………………………………………………………...... 83
4.1 Introduction………………………………………………………………….…. 83
4.2 Description of the Hand Lay-Up Process………………………………………. 83
4.3 Step by Step Procedure for Making Specimens……………..…………………. 84
4.3.1 Precautions while dealing with glass fibers, hardening agents and resins… 84
4.3.2 Making of Mould for the Specimen……………………………………….. 85
4.3.3 Step by Step Hand Lay-Up Process for Composite Crash Box…………… 88
4.3.3.1 Application of Releasing Agent on the Mould Surface……………… 89
4.3.3.2 Wrapping of Mylar Film on the Mould Surface……………………... 90
4.3.3.3 Preparation of the Resin……………………………………………… 91
4.3.4.4 Application of resin and hardener mixture to fiber mat……………… 93
4.3.4.5 Wrapping of fiber mat on the mould…………………………………. 94
4.4 Summary of the Chapter………………………………...………….…...……… 100
Chapter – 5: Experimental Impact Testing of GFRP Crash Box Specimens…. 101
5.1 Introduction…………………..…………………………………….……....... 101
5.2 Drop Weight Impact Testing…….…………………..………………………. 101
5.2.1 Drop weight impact testing machine…………..……………………….. 101
5.2.2 Preparation for Drop Weight Impact Test……………………………… 105
5.2.2.1 Making of Clamp for Specimen………………..…………………. 105
xiii
5.2.2.2 Safety Precautions during Drop Weight Impact Testing…...……... 112
5.2.2.3 Drop Weight Impact Testing Procedure…………..………………. 116
5.3. Results and Discussion………………..……………………………………….. 120
5.3.1 Results of experiments on GFRP crash boxes without trigger…………….
120
5.3.2 Results of experiments on GFRP crash boxes with front end trigger
(thickness variation 1 trigger)…………………………………………………… 123
5.3.3 Results of experiments on GFRP crash boxes with slot trigger (type-1 slot
trigger)……………………………………………………………………………
..
126
5.4. Effect of Triggers on Various Cross Sectional Crash boxes…………………... 128
5.4.1 Effect of triggers on square geometry………………………..……..……... 128
5.4.2 Effect of triggers on cylindrical geometry………………………………… 130
5.4.3 Effect of triggers on hexagonal geometry…………………..….....……….. 131
5.4.4 Effect of triggers on decagonal geometry………….……………...………. 133
5.5 Correlation of Experimental Test and Numerical Simulation………………….. 134
5.5.1 Need for Correlation of Experimental Test and Numerical Simulation…... 135
5.5.2 Numerical Simulation of Drop Weight Impact Testing of GFRP Crash
Boxes……………………………………………………………………………..
.….
136
5.5.2.1 Calibration of Simulation Parameters in LS-DYNA…………………. 139
5.5.3 Correlation of Drop Weight Impact Test and Numerical Simulation for
GFRP Crash Boxes………………………………....…………………………… 141
5.5.3.1 Correlation of square crash boxes ……………………….…………... 141
5.5.3.2 Correlation of cylindrical crash boxes……………………………….. 146
5.5.3.3 Correlation of hexagonal crash boxes……………………………...… 150
5.5.3.4 Correlation of decagonal crash boxes……….……………………….. 155
5.6 Key Points from Experimentation and Numerical Simulation of Drop Weight
Impact Test ……………………….…....................................................................... 159
5.7 Summary of the Chapter……………………………………………………….. 160
Chapter-6: Summary, Conclusions and Future Scope……….…………………. 161
6.1 Summary of the Research …………………………………………………... 161
6.2 Conclusions…………………………………………………………………. 163
6.3 Specific Contributions of the Study…………………………………………. 165
6.4 Usefulness of the Present Research…………………………………………. 166
6.5 Recommendations for Future Scope of the Study…..….…………………… 166
References………………………………………………………………….............. 168
List of Publications and Presentations…………………………………………… 173
Brief Biography of the Candidate……...………………..….……………………. 176

xiv
Brief Biography of the Supervisor (Guide)………...………………..................... 176
Brief Biography of the Supervisor (Co-Guide)………………………………….. 177
xv
List of Tables
Table
No. Description
Page
No.
3.1 Material properties of GFRP Composite 41
3.2 Force Comparision of experiment and present numerical simulation 44
3.3 Comparison of energy absorbed and peak force for geometries without
trigger
48
3.4 Comparison of energy absorbed and peak force for square crash boxes with
notch triggers
52
3.5 Comparison of energy absorbed and peak force for cylindrical crash boxes
with notch triggers
54
3.6 Comparison of energy absorbed and peak force for hexagonal crash boxes
with notch triggers
56
3.7 Comparison of energy absorbed and peak force for decagonal crash boxes
with notch triggers
58
3.8 Comparison of energy absorbed and peak force for square crash boxes with
different slot triggers
61
3.9 Comparison of energy absorbed and peak force for cylindrical crash boxes
with different slot triggers
63
3.10 Comparison of energy absorbed and peak force for hexagonal crash boxes
with different slot triggers
65
3.11 Comparison of energy absorbed and peak force for decagonal crash boxes
with different slot triggers.
67
3.12 Comparison of energy absorbed and peak force for square crash boxes with
different thickness variation triggers
69
3.13 Comparison of energy absorbed and peak force for cylindrical crash boxes
with different thickness variation triggers
71
3.14 Comparison of energy absorbed and peak force for hexagonal crash boxes
with different thickness variation triggers
73
3.15 Comparison of energy absorbed and peak force for decagonal crash boxes
with different thickness variation triggers
75
xvi
3.16 Comparison of energy absorbed and peak force for square crash boxes with
various types of triggers
76
3.17 Comparison of energy absorbed and peak force for cylindrical crash boxes
with various types of triggers
77
3.18 Comparison of energy absorbed and peak force for hexagonal crash boxes
with various types of triggers
78
3.19 Comparison of energy absorbed and peak force for decagonal crash boxes
with various types of triggers
79
3.20 Comparison of S.E.A consolidated from Numerical Analysis for all the
cases
80
5.1 Test energy absorbed and peak force comparision for crash boxes with
different geometries
122
5.2 Test energy absorbed and peak force comparision for crash boxes with front
end trigger
125
5.3 Test energy absorbed and peak force comparision for crash boxes with slot
trigger
127
5.4 Test energy absorbed and peak force comparision for square crash boxes
with various triggers
129
5.5 Test energy absorbed and peak force comparision for cylindrical crash boxes
with various triggers
131
5.6 Test energy absorbed and peak force comparision for hexagonal crash boxes
with various triggers
132
5.7 Test energy absorbed and peak force comparision for decagonal crash boxes
with various triggers
134
5.8 Details of parameters used in LS-DYNA simulation 140
5.9 Energy absorbed and force level comparision of test and simulation for
square crash box without trigger
142
5.10 Energy absorbed and force level comparision of test and simulation for
square crash boxes with front end trigger
144
5.11 Energy absorbed and force level comparision of test and simulation for
square crash boxes with slot trigger
145
5.12 Energy absorbed and force level comparision of test and simulation for
cylindrical crash boxes without trigger
147
xvii
5.13 Energy absorbed and force level comparision of test and simulation for
cylindrical crash box with front end trigger
148
5.14 Energy absorbed and force level comparision of test and simulation for
cylindrical crash boxes with slot trigger
150
5.15 Energy absorbed and force level comparision of test and simulation for
hexagonal crash boxes without trigger
151
5.16 Energy absorbed and force level comparision of test and simulation for
hexagonal crash boxes with Front End Trigger
153
5.17 Energy absorbed and force level comparision of test and simulation for
hexagonal crash boxes with slot trigger
154
5.18 Energy absorbed and force level comparision of test and simulation for
decagonal crash boxes without trigger
156
5.19 Energy absorbed and force level comparision of test and simulation for
decagonal crash boxes with front end trigger
157
5.20
Energy absorbed and force level comparision of test and simulation for
decagonal crash boxes with slot trigger
158
xviii
List of Figures
Figure
No. Description
Page
No.
1.1 Classification of vehicle safety 1
1.2 Typical cabin region in the center along with the crumple zones in a
passenger car
3
1.3 Typical vehicle collision in urban traffic 3
1.4 Typical RCAR Test Collision 4
1.5 Damage to the radiator due to low speed impact 5
1.6 Automobiles made of composites 6
1.7 Composite structure inside BMW I3 electric car 8
1.8 Various high speed electric cars made from composites 8
1.9 Front structural components in a vehicle, with crash boxes 9
1.10 Crash Box in a vehicle 10
1.11 The BIW 11
1.12 Representation of long-fiber reinforced composites for various cases 12
1.13 Fiber failure modes 13
1.14 Matrix failures 13
1.15 A typical fiber debonding and fiber pullout failure 14
1.16 A typical delamination failure due to bending of composite 15
1.17 Axial Impact Testing of Composite 16
1.18 Typical desirable force versus displacement plot for component subject to
impact
16
3.1 Example of stress-strain curve used for material model-58 40
xix
3.2 Crash box meshed model for sample 40
3.3 Crash box simulation setup 42
3.4 Comparison of experimental result and present numerical simulation 43
3.5 Ideal force versus displacement curve 45
3.6 Typical practical force versus displacement curve 45
3.7 Various cross sections of the crash box used for the study 47
3.8 Various crash boxes used for the study before deformation 47
3.9 Deformation of the crash boxes after the impact 48
3.10 Force versus displacement curves for geometries without trigger 48
Square crash boxes with notch triggers
3.11 The square crash boxes before impact 50
3.12 The square crash boxes after impact 51
3.13 The force versus displacement curves for square crash boxes 51
Cylindrical crash boxes with notch triggers
3.14 The cylindrical crash boxes before impact 53
3.15 The cylindrical crash boxes after impact 53
3.16 The force versus displacement curves for cylindrical crash boxes 53
Hexagonal crash boxes with notch triggers
3.17 The hexagonal crash boxes before impact 55
3.18 The hexagonal crash boxes after impact 55
3.19 The force versus displacement curves for hexagonal crash boxes 55

xx
Decagonal crash boxes with notch pattern triggers
3.20 The decagonal crash boxes before impact 57
3.21 The decagonal crash boxes after impact 57
3.22 The force versus displacement curves for decagonal crash boxes 58
Square crash boxes with different types of slot triggers
3.23 The Square crash boxes before impact 60
3.24 The Square crash boxes after impact 60
3.25 The force versus displacement curves for square crash boxes with different
slot triggers
60
Cylindrical crash boxes with different types of slot triggers
3.26 The Cylindrical crash box before impact 62
3.27 The Cylindrical crash box after impact 62
3.28 The force versus displacement curves for cylindrical crash boxes with
different slot triggers
62
Hexagonal crash boxes with different types of slot triggers
3.29 The Hexagonal crash box before impact 64
3.30 The Hexagonal crash box after impact 64
3.31 The force versus displacement curves for hexagonal crash boxes with
different slot triggers
64
Decagonal crash boxes with different types of slot triggers
3.32 The Decagonal crash box before impact 66
3.33 The Decagonal crash box after impact 66
3.34
The force versus displacement curves for decagonal crash boxes with
different slot triggers
66

xxi
Square crash boxes with thickness variation triggers
3.35 The Square crash boxes before impact 68
3.36 The Square crash boxes after impact 68
3.37 The force versus displacement curves for square crash boxes with different
thickness variation triggers
69
Cylindrical crash boxes with thickness variation triggers
3.38 The Cylindrical crash boxes before impact 70
3.39 The Cylindrical crash boxes after impact 70
3.40 The force versus displacement curves for cylindrical crash boxes with
different thickness variation triggers
71
Hexagonal crash boxes with thickness variation triggers
3.41 The hexagonal crash boxes before impact 72
3.42 The hexagonal crash boxes after impact 72
3.43 The force versus displacement curves for hexagonal crash boxes with
different thickness variation triggers
73
Decagonal crash boxes with thickness variation triggers
3.44 The decagonal crash boxes before impact 74
3.45 The decagonal crash boxes after impact 74
3.46 The force versus displacement curves for decagonal crash boxes with
different thickness variation triggers
75
4.1 The hand lay-up process 84
4.2 The cross-sections of all specimens were maintained to be within a circle of
same radius R
85
4.3 The various shapes of the crash boxes 86
4.4 The different moulds for each cross section of the crash box 88
xxii
4.5 The glass fiber mat 89
4.6 The releasing agent 90
4.7 The Mylar film roll 90
4.8 Wrapping of Mylar film on the mould 91
4.9 Application of releasing agent on Mylar film 91
4.10 Resin and Hardener 92
4.11 Measuring quantity of Resin and Hardener 92
4.12 Mixing of Resin and Hardener 93
4.13 Application of Resin mixture on mat by brush 93
4.14 Spreading of Resin and Hardener mixture by roller 94
4.15 Beginning of wrapping of fiber mat on the mould 94
4.16 Wrapping of fiber mat on the mould 95
4.17 Applying finishing touches to the specimen 95
4.18 Square specimen after curing period 96
4.19 Cylindrical specimen after curing period 97
4.20 Hexagonal specimen after curing period 97
4.21 Decagonal specimen after curing period 98
4.22 Cutting of the specimen 98
4.23 Sample for square specimens 99
4.24 Sample for cylindrical specimens 99
4.25 Sample for hexagonal specimens 99
4.26 Sample for decagonal specimens 100
xxiii
5.1 The schematic diagram of drop weight impact testing machine 102
5.2a Drop weight Impact Testing Setup 103
5.2b Drop weight Impact Testing Machine 104
5.3 Data acquisition system setup 105
5.4 Schematic diagram of specimen with clamp and base plate 106
5.5 Dimensions of the base plate and the specimen clamp for square specimen 107
5.6 3-dimensional image of the base plate and the specimen clamp for square
specimen (top)
108
5.7 3-dimensional image of the base plate and the specimen clamp for square
specimen (bottom)
108
5.8 Dimensions of the base plate and the specimen clamp for cylindrical
specimen
109
5.9 3-dimensional image of the base plate and the specimen clamp for
cylindrical specimen (top)
110
5.10 3-dimensional image of the base plate and the specimen clamp for
cylindrical specimen (bottom)
110
5.11 (a) Machined clamps in their final shape 111
5.11 (b) Intermittent checking of fitting of the crash box onto the clamp 112
5.12 The testing is protected with a locked up cage to prevent inadvertent entry
of any person
112
5.13 The safety clamp for impactor 113
5.14 Safety clamp for impactor with safety pin installed 114
5.15 Wooden frame for impactor 114
5.16 Protective gear used during testing 115
5.17 Weight plates attached to the impactor 115
5.18 Motor mounted on the main frame 116
xxiv
5.19 Laser equipped distance measuring device 117
5.20 Data acquisition system 117
5.21 High speed camera setup 118
5.22 The different cross sections of geometries used in the experimental study 119
5.23 The different types of geometries used in the experimental study 119
5.24 The crash boxes with various geometries after impact 121
5.25 The force versus displacement curves for test of crash boxes with different
geometries
121
5.26 The crash boxes with front end trigger after impact 123
5.27 The force versus displacement curves for test of crash boxes with front end
trigger
124
5.28 The crash boxes with slot trigger after impact 126
5.29 The force versus displacement curves for test of crash boxes with slot
trigger
126
5.30 The deformation for square crash boxes with various triggers 128
5.31 The force versus displacement curves for square crash boxes with various
triggers
129
5.32 The deformation for cylindrical crash boxes with various triggers 130
5.33 The force versus displacement curves for cylindrical crash boxes with
various triggers
130
5.34 The deformation for hexagonal crash boxes with various triggers 131
5.35 The force versus displacement curves for hexagonal crash boxes with
various triggers
132
5.36 The deformation for decagonal crash boxes with various triggers 133
5.37 The force versus displacement curves for decagonal crash boxes with
various triggers
133
5.38 The simulation setup for drop weight impact test 137
xxv
5.39 PART_COMPOSITE configuration in HyperMesh software 138
5.40 The deformation of square crash boxes without trigger in test and
simulation
141
5.41 The force versus displacement curves for square crash box without trigger
in test and simulation
142
5.42 The deformation of square crash boxes with front end trigger in test and
simulation
143
5.43 The force versus displacement curves for square crash boxes with front end
trigger in test and simulation
143
5.44 The deformation of square crash boxes with slot trigger in test and
simulation
144
5.45 The force versus displacement curves for square crash boxes with
slot trigger in test and simulation
145
5.46 The deformation of cylindrical crash boxes without trigger in test and
simulation
146
5.47 The force versus displacement curves for cylindrical crash boxes without
trigger in test and simulation
146
5.48 The deformation of cylindrical crash boxes with front end trigger in test and
simulation
147
5.49 The force versus displacement curves for cylindrical crash boxes with front
end trigger in test and simulation
148
5.50 The deformation of cylindrical crash boxes with slot trigger in test and
simulation
149
5.51 The force versus displacement curves for cylindrical crash boxes with slot
trigger in test and simulation
149
5.52 The deformation of hexagonal crash boxes without trigger in test and
simulation
150
5.53 The force versus displacement curves for hexagonal crash boxes without
trigger in test and simulation
151
5.54 The deformation of hexagonal crash boxes with Front End Trigger in test
and simulation
152
5.55 The force versus displacement curves for hexagonal crash boxes with Front
End Trigger in test and simulation
152
xxvi
5.56 The deformation of hexagonal crash boxes with slot trigger in test and
simulation
153
5.57 The force versus displacement curves for hexagonal crash boxes with slot
trigger in test and simulation
154
5.58 The deformation of decagonal crash boxes without trigger in test and
simulation
155
5.59 The force versus displacement curves for decagonal crash boxes without
trigger in test and simulation
155
5.60 The deformation of decagonal crash boxes with front end trigger in test and
simulation
156
5.61 The force versus displacement curves for decagonal crash boxes with front
end trigger in test and simulation
157
5.62 The deformation of decagonal crash boxes with slot trigger in test and
simulation
158
5.63 The force versus displacement curves for decagonal crash boxes with slot
trigger in test and simulation
158
xxvii
List of Abbreviations
ABS Anti-Lock Braking System
BIW Body in White
CFRP Carbon Fiber Reinforced Plastic
D Displacement
D.C.B Double Cantilever Beam
ELFORM Element Formulation
GFRP Glass Fiber Reinforced Plastic
E Energy Absorbed
F Crash Force
F mean Mean Force
F peak Peak Force
GFRP Glass Fiber Reinforced Plastic
Mat 58 Material 58
MDO Multi Layout Optimization
M.M.C Metal matrix composites
R Radius
RCAR Research Council for Automobile Repairs
S.E.A Specific Energy Absorption

xxviii
List of Symbols
Ea Young's modulus - longitudinal direction
Eb Young's modulus - transverse direction
Ec Young's modulus -normal direction
Es Specific Energy Absorption
Gab Shear modulus (along local plane-ab)
Gbc Shear modulus (along local plane bc)
Gca Shear modulus (along local plane-ca)
m Damage Exponent
M Damage Operator
Sc Shear strength, (ab) plane
ϵ11c Strain at longitudinal compressive strength
ϵ11t Strain at longitudinal tensile strength
ϵ22c Strain at transverse compressive strength
ϵ22t Strain at transverse tensile strength
ϵgms Strain at shear strength
ρ Mass Density
δ Crush-displacement
ˆij Stress Component
Damage Evolution Variable
Vba Poisson's ratio

xxix
X Longitudinal strength
Xt Longitudinal tensile strength.
Xc Longitudinal compressive strength
Y Transverse strength
Yt Transverse tensile strength
Yc Transverse compressive strength
1
Chapter-1: Introduction
In today’s world automobile sector is facing a continuous and ever increasing challenge
from consumers as well as from various regulating and certification authorities which want
the automobile to satisfy certain requirements. The most important regulation criterions are
related to the vehicle crash safety and emissions. But in urban driving conditions it is
common that the vehicle is subjected to low speed impacts which leads to damage to the
vehicle and repair for the same. These low speed impacts are more frequent and lead to
increase in repair cost which indirectly burdens the insurance organizations.
1.1. Automobile Safety and Crashworthiness
With increasing incidents of road accidents, there is a huge damage to passengers as
well as vehicles. The most common type of collision is the frontal collision in regular traffic
scenarios. Not only the damage caused to the vehicle, but also the injuries caused to the
occupant are important in the event of a crash. Hence safety and protection against severe
damage to vehicle play very important roles in vehicle design. In case the vehicle is damaged
more severely it may increase the cost required to repair it. Therefore, to reduce the damage
to human life and the vehicle, safety systems are to be designed according to the usage.
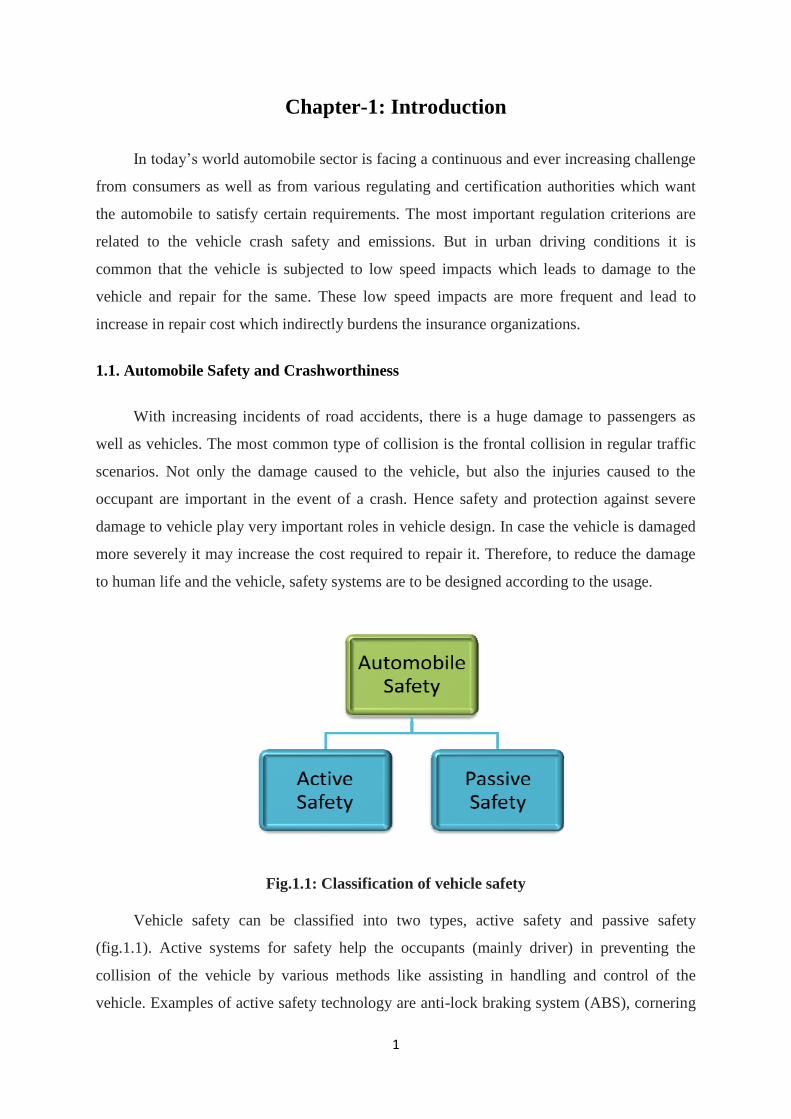
Fig.1.1: Classification of vehicle safety
Vehicle safety can be classified into two types, active safety and passive safety
(fig.1.1). Active systems for safety help the occupants (mainly driver) in preventing the
collision of the vehicle by various methods like assisting in handling and control of the
vehicle. Examples of active safety technology are anti-lock braking system (ABS), cornering
2
assist (to maintain stability in sharp turns), hill hold assist, hill descend assist, remote
pressure monitor for tires, driver sleep/nap warning system, laser sensors for detecting
obstacles/animals/pedestrians in advance etc., Passive systems for safety provide injury
control and minimization during a collision. Examples for it are three point seat-belts, driver
airbag, passenger airbag, side airbag, curtain airbag, knee airbag, seats equipped with
head/neck support. These are very vital for the survival of an occupant after the vehicle
accident/collision. Since the crash box also acts to minimize the effect of collision on the
passenger by absorbing the energy of collision, it is also an element of passive safety. In
addition, unlike other passive elements, it is integrated into the structure of the vehicle.
Automobile crashworthiness is the capability of the structure of the vehicle to absorb or
dissipate the energy of impact in the events of collision. In passenger vehicles, the concept of
crashworthiness also contains the degree of reducing the impact of the collision on the
occupants so that the injuries to occupants are less and there is enough space between the
vehicle structure and occupants for safety in case of collisions. The important thing in
crashworthiness is controlling the deceleration within the distance available during the crash
and preventing any intrusion into occupant space that can lead to injuries. Crash box is a
structural element of the automobile to specifically improve the crashworthiness in head-
on/front collisions. It functions along with the specifically designed crumple zones which are
useful in absorbing the crash energy by deformation.
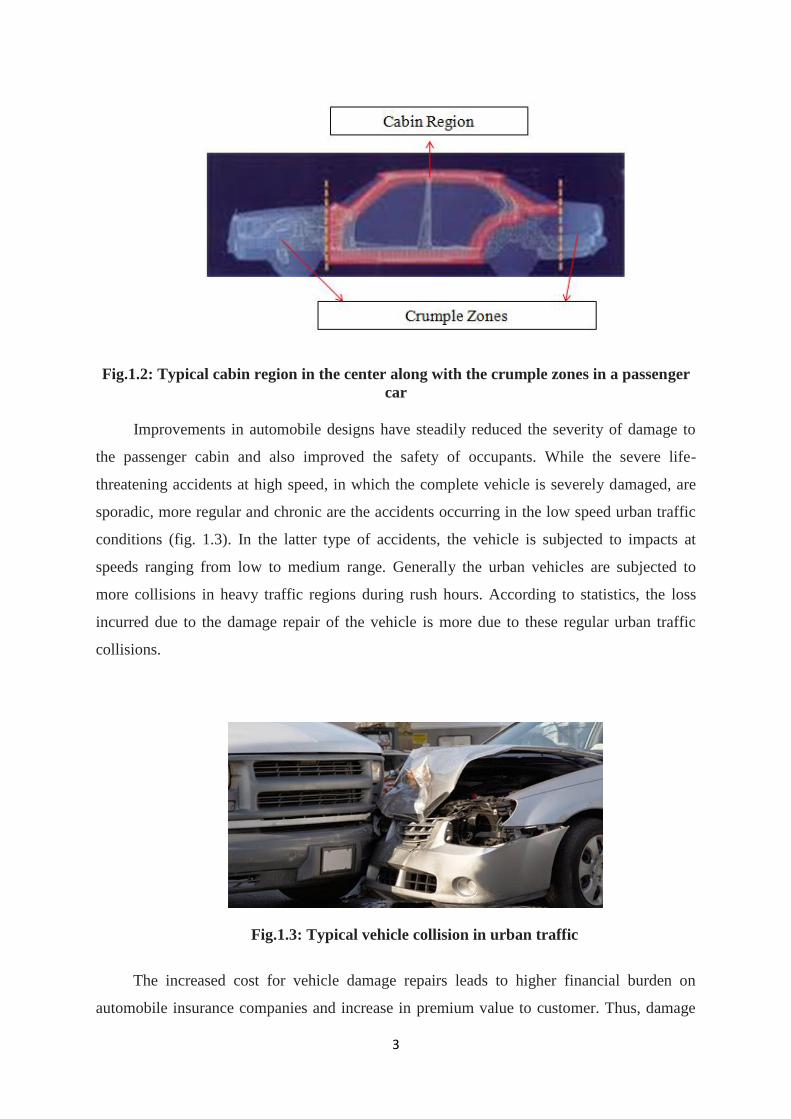
In general the vehicle structure is divided into two parts, namely, (i) Safe occupant
cabin or cage region and (ii) crumple zones (fig.1.2). The crumple zones, which are a part of
passive safety, are provided in the vehicle structure. Crumple zones play a vital role in
improving the safety of the passengers. The protection of occupants located in the cabin
region depends on the proper functioning of the energy absorbing mechanisms in case of an
impact/accident. The crumple regions consist of specially designed structural components
useful for minimising the damage to the vehicle as well as the occupants by undergoing a
systematic crush/deformation during the impact. In general the crumple regions are provided
by the car manufacturers in the front and rear portions of the car, as in general the events of
front collisions are more, followed by rear impacts, compared to side impacts. In a car, the
crumple zone is made such that it is less stiff compared to the occupant region. So that in case
of an impact/accident the crumple region undergoes crush/deformation systematically thus
reduces the damage to the occupant cabin.
3
Fig.1.2: Typical cabin region in the center along with the crumple zones in a passenger
car
Improvements in automobile designs have steadily reduced the severity of damage to
the passenger cabin and also improved the safety of occupants. While the severe life-
threatening accidents at high speed, in which the complete vehicle is severely damaged, are
sporadic, more regular and chronic are the accidents occurring in the low speed urban traffic
conditions (fig. 1.3). In the latter type of accidents, the vehicle is subjected to impacts at
speeds ranging from low to medium range. Generally the urban vehicles are subjected to
more collisions in heavy traffic regions during rush hours. According to statistics, the loss
incurred due to the damage repair of the vehicle is more due to these regular urban traffic
collisions.
Fig.1.3: Typical vehicle collision in urban traffic
The increased cost for vehicle damage repairs leads to higher financial burden on
automobile insurance companies and increase in premium value to customer. Thus, damage

4
repair costs financially impact both the customer and the insuring companies. This lead to the
formation of Research Council for Automobile Repairs (RCAR) in Europe.
RCAR is an association of car manufacturers. Their objective is to minimize the
damage to the automobiles as well as reduce injury to human beings due to vehicular
accidents. The monetary losses incurred due to accident are due to hospitalization of injured
people as well as repair/service costs required for the damaged vehicle. RCAR is promoting
improvements in passenger car reparability and reduction in damage to vehicles by increasing
the crashworthiness of the vehicles under these speed conditions. RCAR provides score for
the cars, based on which the insurance premium is adjusted for vehicle insurance. Vehicles
with poor score have a higher insurance premium, thus promoting car manufacturers for
making the cars safer for urban traffic conditions. Typically RCAR council uses a low speed
impact testing procedure at 15 km/hr (+/- 1 km/hr) to determine the effectiveness of the front
energy absorbing mechanism used by the car manufacturer, known as the front structural
RCAR test (fig. 1.4 & 1.5).
Before Impact After Impact
Fig.1.4: Typical RCAR Test Collision
Low speed vehicle collision tests are performed to assess and classify the vehicle
insurance costs. For example, if the vehicle has more deformation then it may lead to more
vehicle insurance premium for the vehicle insurance and vice-versa. So the damage to
structural components of the vehicle should be minimal in order to achieve lower
repair/service charges and to get a good rating for vehicle insurance premium. The design of
a good structure in the frontal region of a vehicle plays an important role for absorption of
impact energy in the event of a head-on/frontal collision. But, there are many challenges for
completion of the front region design as many other factors are also related to it like the
aesthetic appeal, mass of the vehicle, front overhang of the vehicle, manufacturing cost etc.,
5
So the design of the front region is to be made keeping in mind the overall cost of the total
vehicle. Therefore low speed regulations pose a new challenge to the automobile
manufacturers as it requires cost-effective and mass-effective design of the front energy
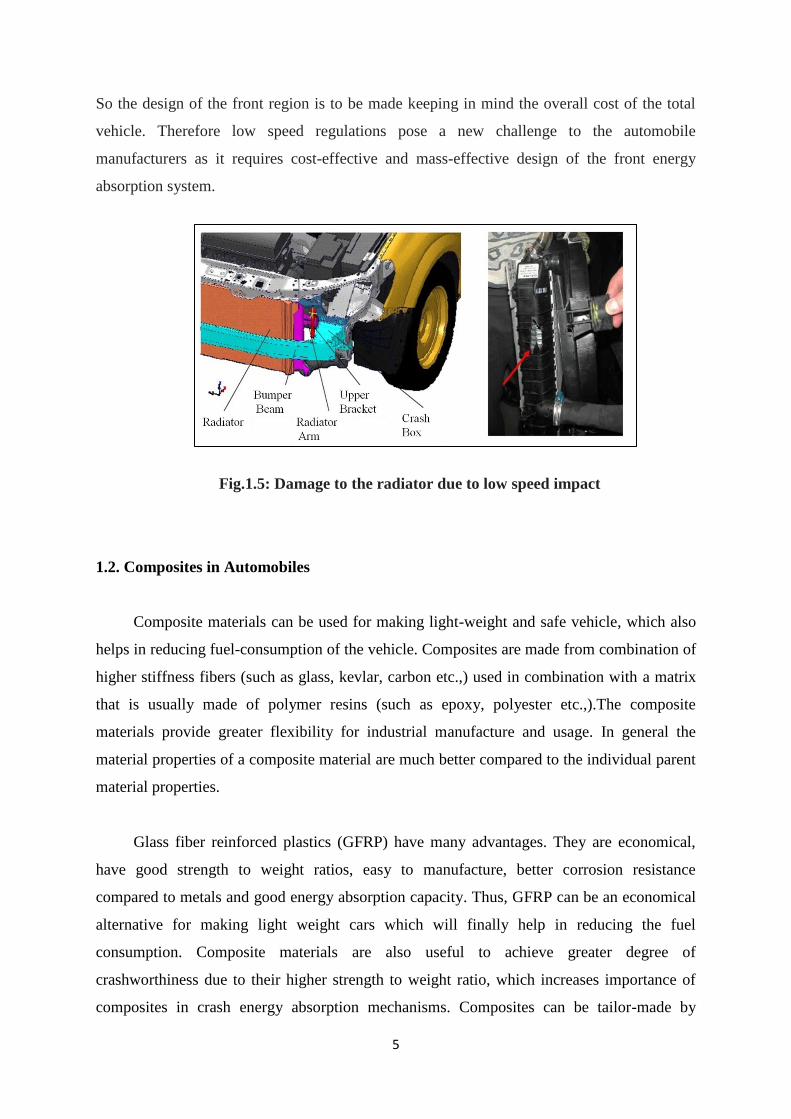
absorption system.
Fig.1.5: Damage to the radiator due to low speed impact
1.2. Composites in Automobiles
Composite materials can be used for making light-weight and safe vehicle, which also
helps in reducing fuel-consumption of the vehicle. Composites are made from combination of
higher stiffness fibers (such as glass, kevlar, carbon etc.,) used in combination with a matrix
that is usually made of polymer resins (such as epoxy, polyester etc.,).The composite
materials provide greater flexibility for industrial manufacture and usage. In general the
material properties of a composite material are much better compared to the individual parent
material properties.
Glass fiber reinforced plastics (GFRP) have many advantages. They are economical,
have good strength to weight ratios, easy to manufacture, better corrosion resistance
compared to metals and good energy absorption capacity. Thus, GFRP can be an economical
alternative for making light weight cars which will finally help in reducing the fuel
consumption. Composite materials are also useful to achieve greater degree of
crashworthiness due to their higher strength to weight ratio, which increases importance of
composites in crash energy absorption mechanisms. Composites can be tailor-made by

6
changing their geometric parameters for better usage in crashworthiness applications which
will be discussed later in this study.
(a) (b) (c)
(d)
Fig.1.6: Automobiles made of composites, (a) Chevrolet made futuristic concept car
using composite material, (b) Lamborghini uses composite materials in its superfast
cars, (c) BMW used composite material for I3 electric vehicle and (d) Ford Soybean.
Due to their higher strength to weight ratios composites find large possibilities of usage
in manufacturing of aircrafts, spacecrafts etc. where the reduction in weight of the
components is highly important but their use in passenger cars has been limited, barring few
attempts previously (fig. 1.6), due to their overall higher cost compared to metals. The usage
of composites in passenger vehicles is low mainly because of the cost incurred for making
structural components. As the mass production methods and assembly lines were previously
established based on metals (mainly steel) it requires a complete new procedure in case the
composites are used, and moreover the overall cost of composite materials is higher when
compared to metals.

7
Nevertheless, composite materials provide a large scope in making of tailor-made
designs for safety along with light-weight structures which can be far better in
crashworthiness applications compared to metals. In general the crash energy is absorbed by
metal alloys by yielding of the material, but in case of composite material the crash energy is
absorbed by complex fiber-matrix failures, which are discussed in detail in latter sections. In
this study focus will be done on controlling as well as modifying the deformation of
composite materials subjected to axial impact.
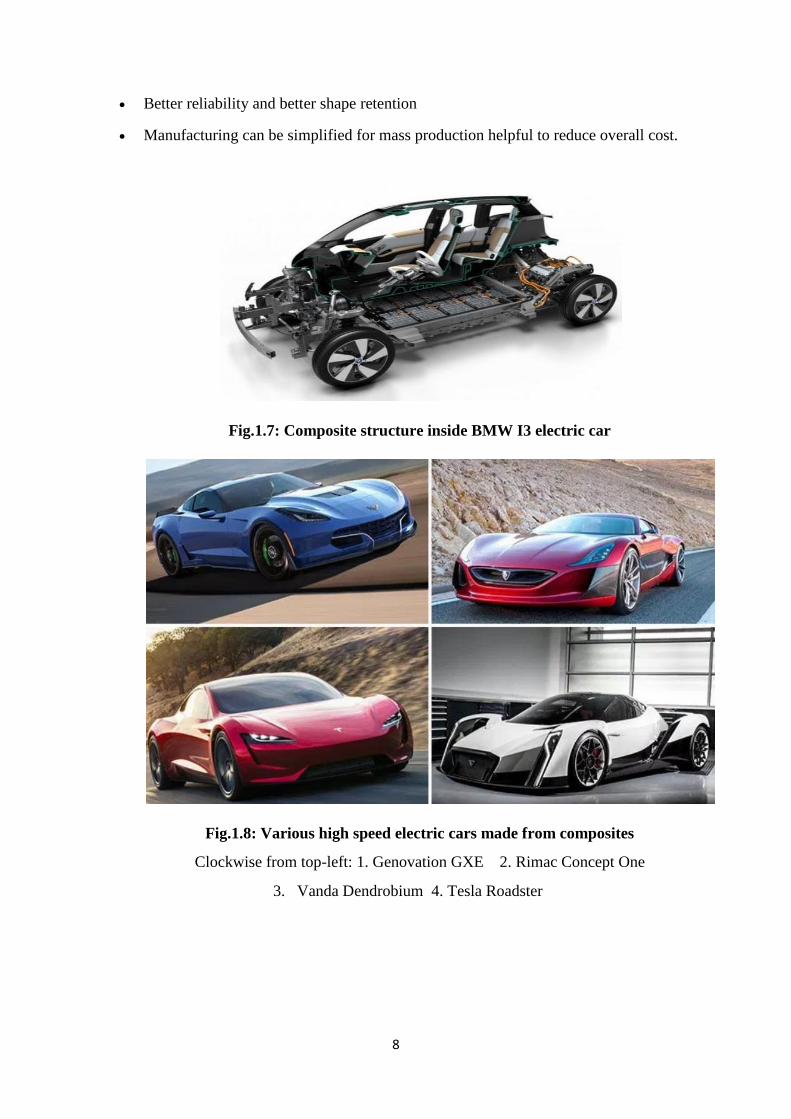
1.3. Potential for Composites in Electric Vehicles
Today manufacturers of electric and hybrid electric vehicles are giving top priority in
design to structural changes to accommodate the new fuels, which are aimed to reduce
emissions. This new fuel, primarily electric power from batteries, requires substantial space
and proportion of weight to accommodate the batteries on the vehicle (fig.1.7). Therefore,
there is an impending need to compensate the weight by using further lighter materials for
structural parts, which is possible with the usage of composite materials. But electrical
insulation is one of the key factors to be considered while building electric cars (fig. 1.8). If
there is collision of the electric car there is high possibility that the insulation on wiring from
high voltage electric battery of the vehicle is teared due to collision, which can lead to a
dangerous state of electric shock to the occupants and also rescuers. All these developments
and future requirements of the automobile industry pave way for futuristic materials such as
composite materials which may satisfy multiple and ever growing needs of the future
automobiles.
Composite materials have many advantages over metal alloys that are particularly
attractive for automobile sector. Some of these advantages are mentioned below:
Thermal expansion co-efficient is less.
Tailor made complex shapes can be achieved at industrial level.
Stable retentions of complex shapes and stable dimensions after manufacturing.
Corrosion resistance helpful in usage for varied environmental conditions.
Higher strength/stiffness to weight ratios
Lesser inherent mass useful for making lighter weight components.
Higher surface finish quality can be achieved.
8
Better reliability and better shape retention
Manufacturing can be simplified for mass production helpful to reduce overall cost.
Fig.1.7: Composite structure inside BMW I3 electric car
Fig.1.8: Various high speed electric cars made from composites
Clockwise from top-left: 1. Genovation GXE 2. Rimac Concept One
3. Vanda Dendrobium 4. Tesla Roadster
9
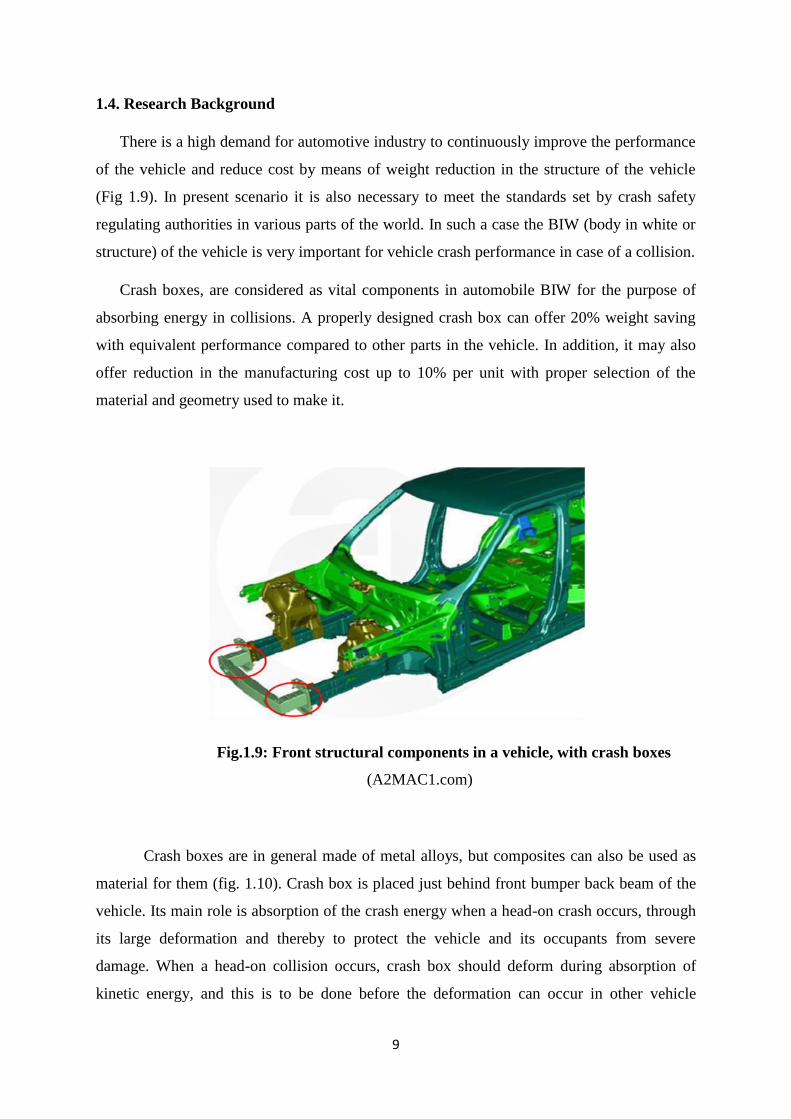
1.4. Research Background
There is a high demand for automotive industry to continuously improve the performance
of the vehicle and reduce cost by means of weight reduction in the structure of the vehicle
(Fig 1.9). In present scenario it is also necessary to meet the standards set by crash safety
regulating authorities in various parts of the world. In such a case the BIW (body in white or
structure) of the vehicle is very important for vehicle crash performance in case of a collision.
Crash boxes, are considered as vital components in automobile BIW for the purpose of
absorbing energy in collisions. A properly designed crash box can offer 20% weight saving
with equivalent performance compared to other parts in the vehicle. In addition, it may also
offer reduction in the manufacturing cost up to 10% per unit with proper selection of the
material and geometry used to make it.
Fig.1.9: Front structural components in a vehicle, with crash boxes
(A2MAC1.com)
Crash boxes are in general made of metal alloys, but composites can also be used as
material for them (fig. 1.10). Crash box is placed just behind front bumper back beam of the
vehicle. Its main role is absorption of the crash energy when a head-on crash occurs, through
its large deformation and thereby to protect the vehicle and its occupants from severe
damage. When a head-on collision occurs, crash box should deform during absorption of
kinetic energy, and this is to be done before the deformation can occur in other vehicle

10
components placed behind it. Thus it is important in the design of the crash box to ensure
initialization of a proper deformation mode and systematic continuation of deformation in the
body of the crash box in the event of vehicle collision, thereby minimizing severity of
damage to passengers as well as the vehicle itself (fig. 1.11).
Fig.1.10: Crash Box in a vehicle (A2MAC1.com)
Improper design of crash box may lead to more deformation of the vehicle structure.
Successful design of an effective crash box is an essential criterion for certification of the
vehicle by crash regulating authority, in crash tests.
11
(a) (b)
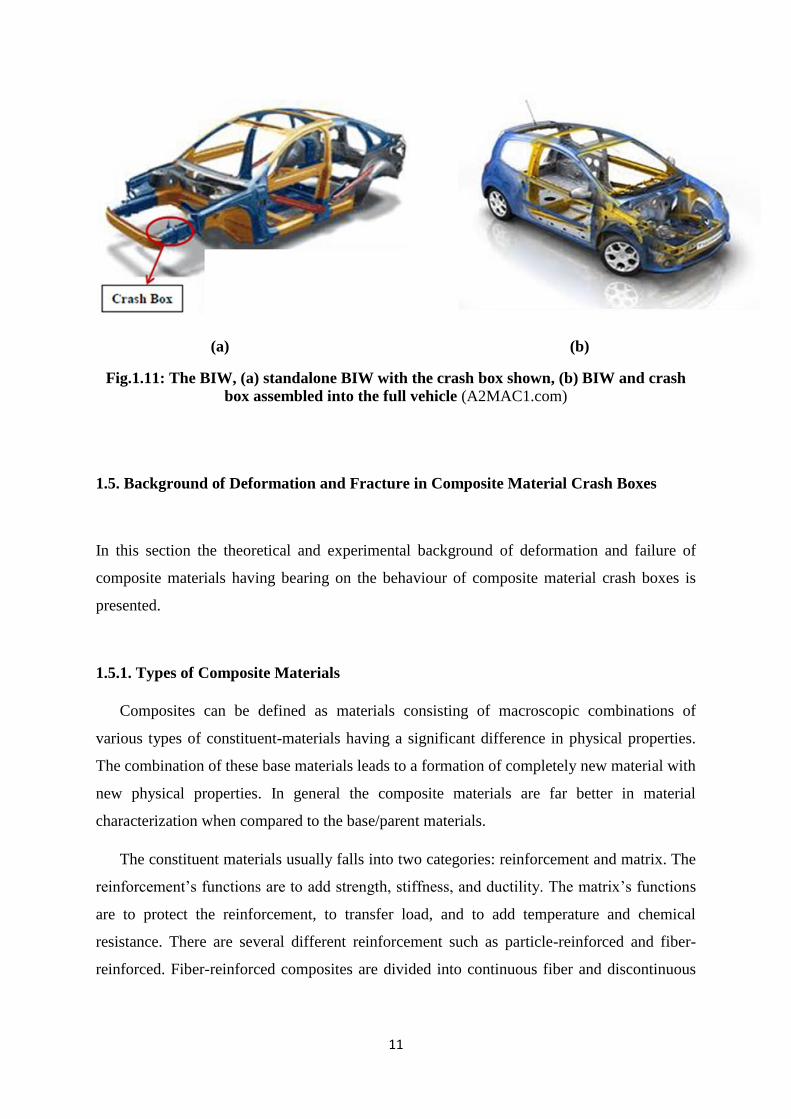
Fig.1.11: The BIW, (a) standalone BIW with the crash box shown, (b) BIW and crash
box assembled into the full vehicle (A2MAC1.com)
1.5. Background of Deformation and Fracture in Composite Material Crash Boxes
In this section the theoretical and experimental background of deformation and failure of
composite materials having bearing on the behaviour of composite material crash boxes is
presented.
1.5.1. Types of Composite Materials
Composites can be defined as materials consisting of macroscopic combinations of
various types of constituent-materials having a significant difference in physical properties.
The combination of these base materials leads to a formation of completely new material with
new physical properties. In general the composite materials are far better in material
characterization when compared to the base/parent materials.
The constituent materials usually falls into two categories: reinforcement and matrix. The
reinforcement’s functions are to add strength, stiffness, and ductility. The matrix’s functions
are to protect the reinforcement, to transfer load, and to add temperature and chemical
resistance. There are several different reinforcement such as particle-reinforced and fiber-
reinforced. Fiber-reinforced composites are divided into continuous fiber and discontinuous
12
fiber composites. Our main focus is on continuous fiber-reinforced composite since it is most
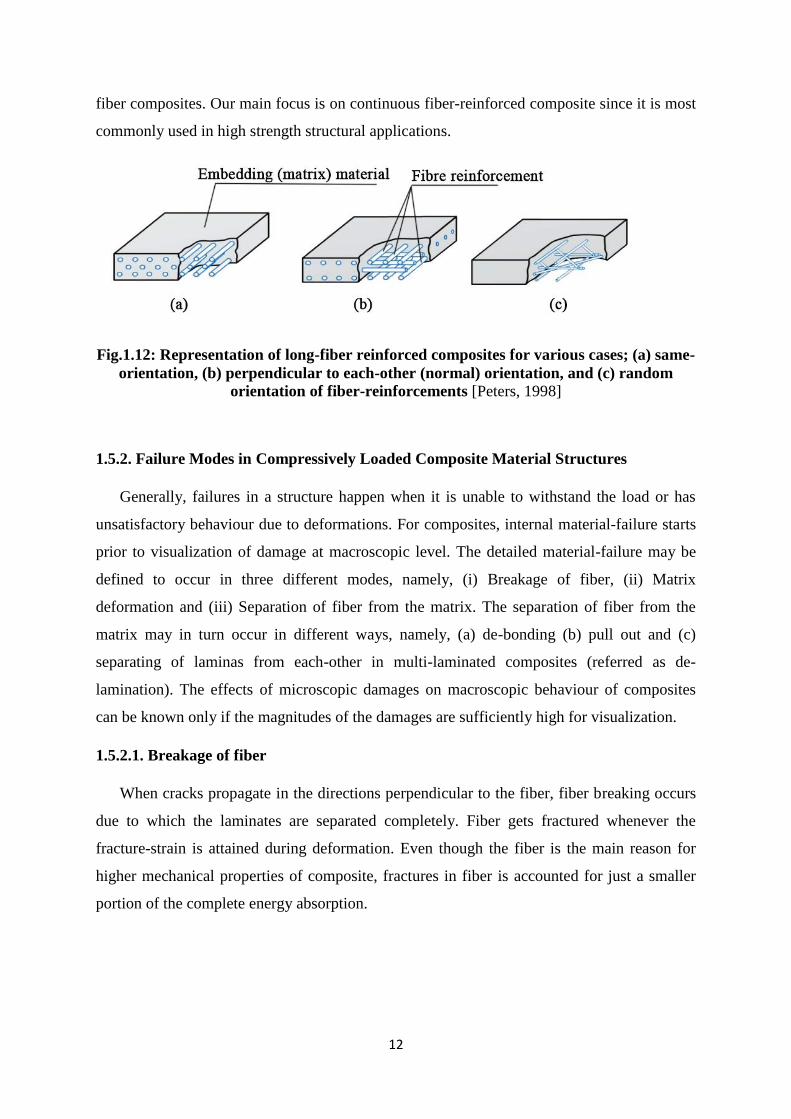
commonly used in high strength structural applications.
Fig.1.12: Representation of long-fiber reinforced composites for various cases; (a) same-
orientation, (b) perpendicular to each-other (normal) orientation, and (c) random
orientation of fiber-reinforcements [Peters, 1998]
1.5.2. Failure Modes in Compressively Loaded Composite Material Structures
Generally, failures in a structure happen when it is unable to withstand the load or has
unsatisfactory behaviour due to deformations. For composites, internal material-failure starts
prior to visualization of damage at macroscopic level. The detailed material-failure may be
defined to occur in three different modes, namely, (i) Breakage of fiber, (ii) Matrix
deformation and (iii) Separation of fiber from the matrix. The separation of fiber from the
matrix may in turn occur in different ways, namely, (a) de-bonding (b) pull out and (c)
separating of laminas from each-other in multi-laminated composites (referred as de-
lamination). The effects of microscopic damages on macroscopic behaviour of composites
can be known only if the magnitudes of the damages are sufficiently high for visualization.
1.5.2.1. Breakage of fiber
When cracks propagate in the directions perpendicular to the fiber, fiber breaking occurs
due to which the laminates are separated completely. Fiber gets fractured whenever the
fracture-strain is attained during deformation. Even though the fiber is the main reason for
higher mechanical properties of composite, fractures in fiber is accounted for just a smaller
portion of the complete energy absorption.
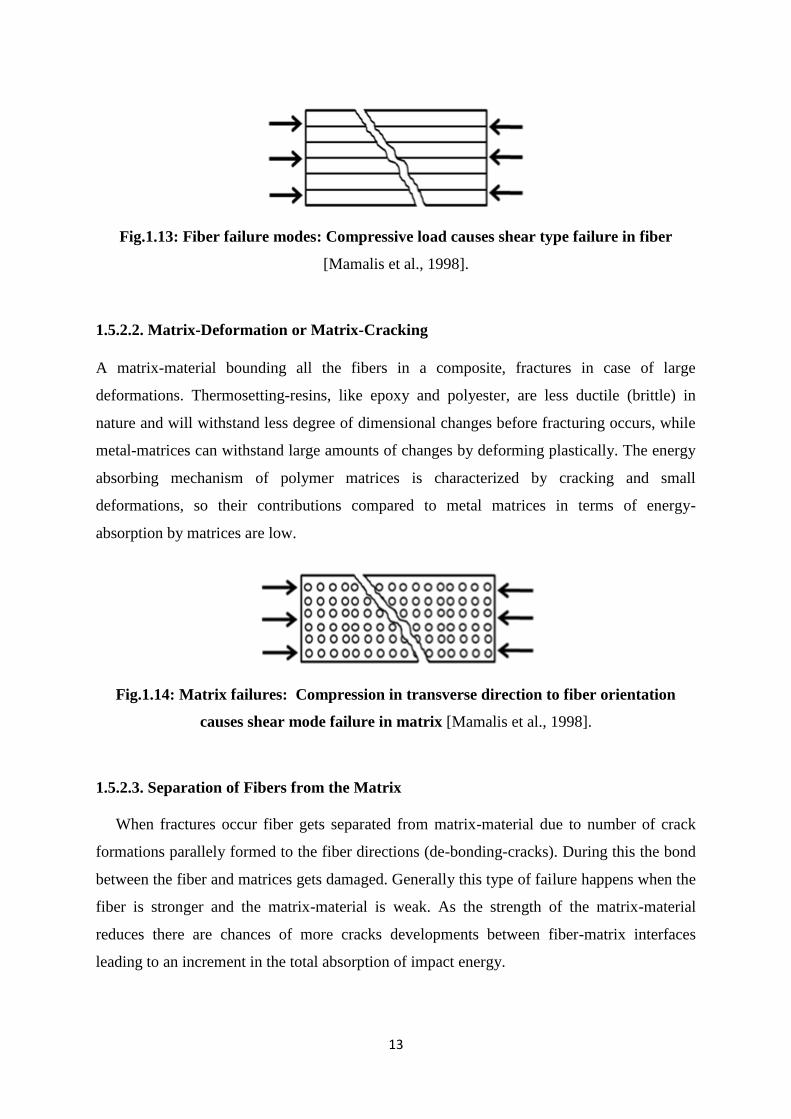
13
Fig.1.13: Fiber failure modes: Compressive load causes shear type failure in fiber
[Mamalis et al., 1998].
1.5.2.2. Matrix-Deformation or Matrix-Cracking
A matrix-material bounding all the fibers in a composite, fractures in case of large
deformations. Thermosetting-resins, like epoxy and polyester, are less ductile (brittle) in
nature and will withstand less degree of dimensional changes before fracturing occurs, while
metal-matrices can withstand large amounts of changes by deforming plastically. The energy
absorbing mechanism of polymer matrices is characterized by cracking and small
deformations, so their contributions compared to metal matrices in terms of energy-
absorption by matrices are low.
Fig.1.14: Matrix failures: Compression in transverse direction to fiber orientation
causes shear mode failure in matrix [Mamalis et al., 1998].
1.5.2.3. Separation of Fibers from the Matrix
When fractures occur fiber gets separated from matrix-material due to number of crack
formations parallely formed to the fiber directions (de-bonding-cracks). During this the bond
between the fiber and matrices gets damaged. Generally this type of failure happens when the
fiber is stronger and the matrix-material is weak. As the strength of the matrix-material
reduces there are chances of more cracks developments between fiber-matrix interfaces
leading to an increment in the total absorption of impact energy.
14
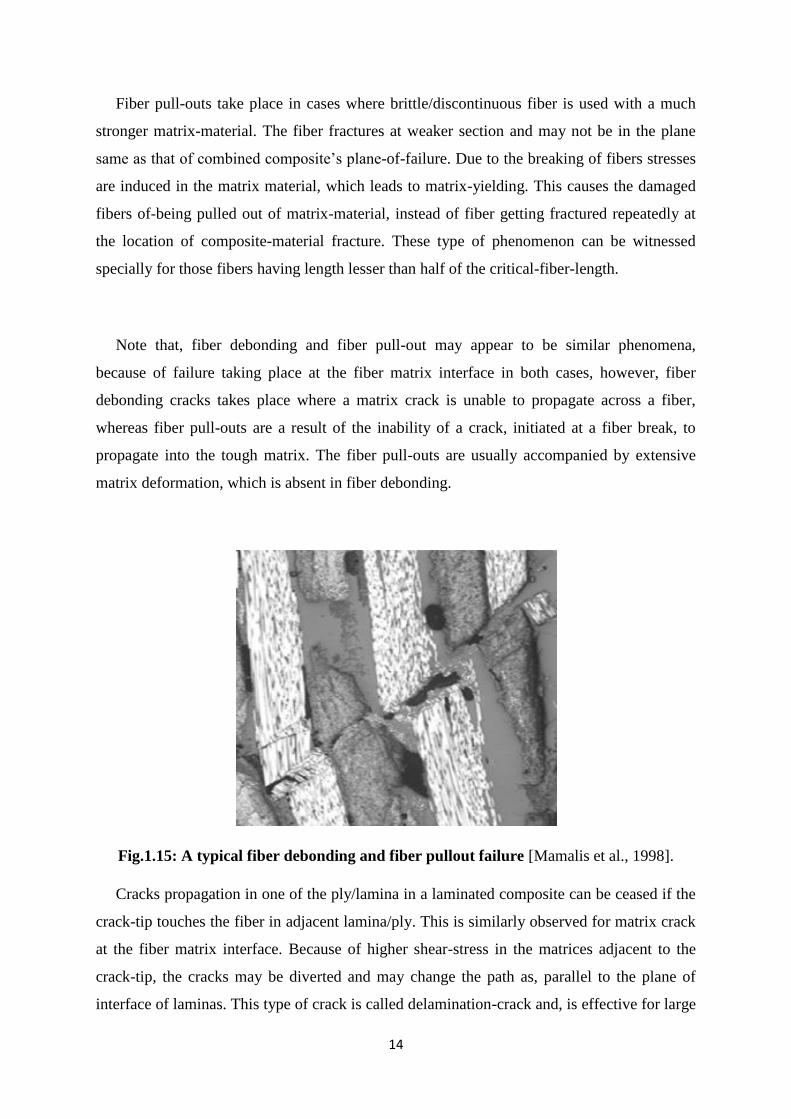
Fiber pull-outs take place in cases where brittle/discontinuous fiber is used with a much
stronger matrix-material. The fiber fractures at weaker section and may not be in the plane
same as that of combined composite’s plane-of-failure. Due to the breaking of fibers stresses
are induced in the matrix material, which leads to matrix-yielding. This causes the damaged
fibers of-being pulled out of matrix-material, instead of fiber getting fractured repeatedly at
the location of composite-material fracture. These type of phenomenon can be witnessed
specially for those fibers having length lesser than half of the critical-fiber-length.
Note that, fiber debonding and fiber pull-out may appear to be similar phenomena,
because of failure taking place at the fiber matrix interface in both cases, however, fiber
debonding cracks takes place where a matrix crack is unable to propagate across a fiber,
whereas fiber pull-outs are a result of the inability of a crack, initiated at a fiber break, to
propagate into the tough matrix. The fiber pull-outs are usually accompanied by extensive
matrix deformation, which is absent in fiber debonding.
Fig.1.15: A typical fiber debonding and fiber pullout failure [Mamalis et al., 1998].
Cracks propagation in one of the ply/lamina in a laminated composite can be ceased if the
crack-tip touches the fiber in adjacent lamina/ply. This is similarly observed for matrix crack
at the fiber matrix interface. Because of higher shear-stress in the matrices adjacent to the
crack-tip, the cracks may be diverted and may change the path as, parallel to the plane of
interface of laminas. This type of crack is called delamination-crack and, is effective for large
15
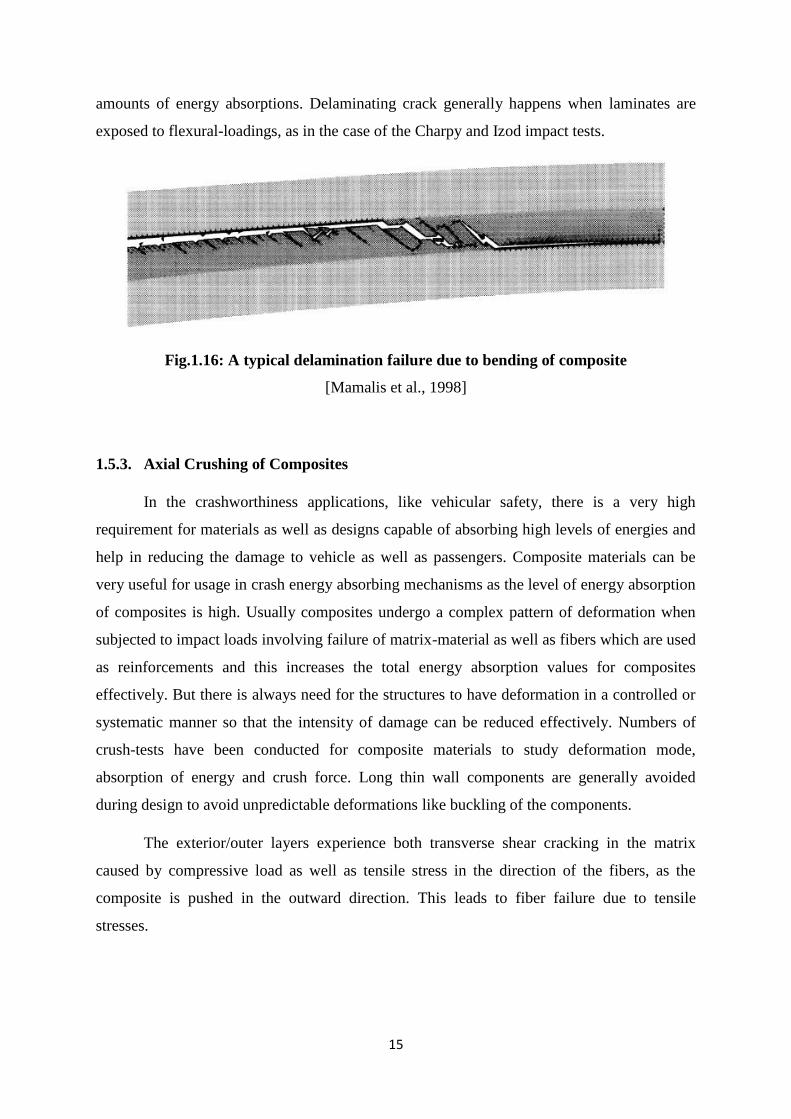
amounts of energy absorptions. Delaminating crack generally happens when laminates are
exposed to flexural-loadings, as in the case of the Charpy and Izod impact tests.
Fig.1.16: A typical delamination failure due to bending of composite
[Mamalis et al., 1998]
1.5.3. Axial Crushing of Composites
In the crashworthiness applications, like vehicular safety, there is a very high
requirement for materials as well as designs capable of absorbing high levels of energies and
help in reducing the damage to vehicle as well as passengers. Composite materials can be
very useful for usage in crash energy absorbing mechanisms as the level of energy absorption
of composites is high. Usually composites undergo a complex pattern of deformation when
subjected to impact loads involving failure of matrix-material as well as fibers which are used
as reinforcements and this increases the total energy absorption values for composites
effectively. But there is always need for the structures to have deformation in a controlled or
systematic manner so that the intensity of damage can be reduced effectively. Numbers of
crush-tests have been conducted for composite materials to study deformation mode,
absorption of energy and crush force. Long thin wall components are generally avoided
during design to avoid unpredictable deformations like buckling of the components.
The exterior/outer layers experience both transverse shear cracking in the matrix
caused by compressive load as well as tensile stress in the direction of the fibers, as the
composite is pushed in the outward direction. This leads to fiber failure due to tensile
stresses.
16
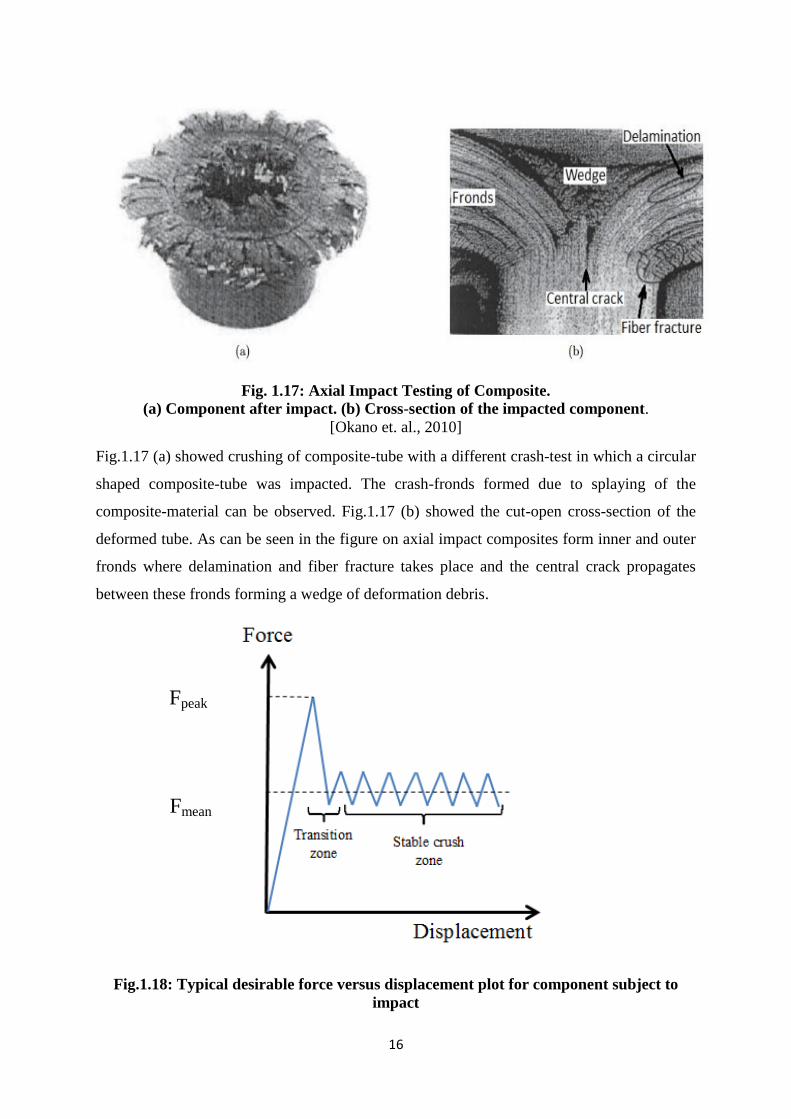
Fig. 1.17: Axial Impact Testing of Composite.
(a) Component after impact. (b) Cross-section of the impacted component.
[Okano et. al., 2010]
Fig.1.17 (a) showed crushing of composite-tube with a different crash-test in which a circular
shaped composite-tube was impacted. The crash-fronds formed due to splaying of the
composite-material can be observed. Fig.1.17 (b) showed the cut-open cross-section of the
deformed tube. As can be seen in the figure on axial impact composites form inner and outer
fronds where delamination and fiber fracture takes place and the central crack propagates
between these fronds forming a wedge of deformation debris.
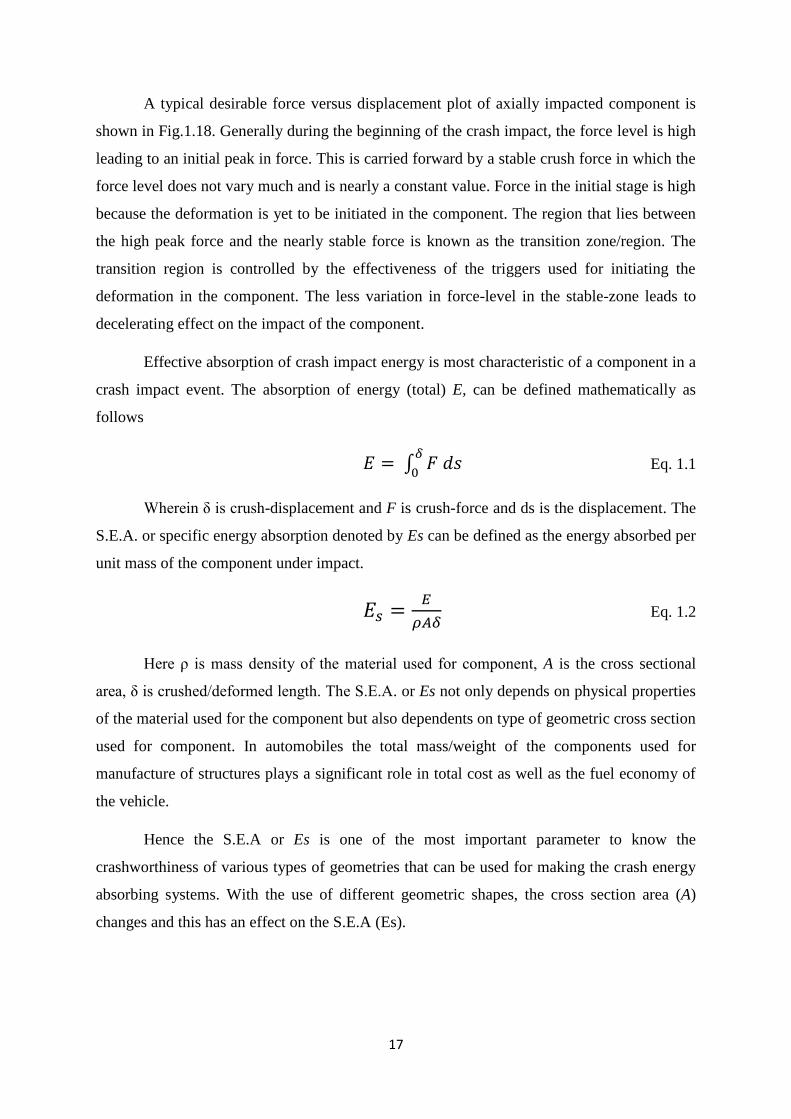
Fig.1.18: Typical desirable force versus displacement plot for component subject to
impact
Fpeak
Fmean
17
A typical desirable force versus displacement plot of axially impacted component is
shown in Fig.1.18. Generally during the beginning of the crash impact, the force level is high
leading to an initial peak in force. This is carried forward by a stable crush force in which the
force level does not vary much and is nearly a constant value. Force in the initial stage is high
because the deformation is yet to be initiated in the component. The region that lies between
the high peak force and the nearly stable force is known as the transition zone/region. The
transition region is controlled by the effectiveness of the triggers used for initiating the
deformation in the component. The less variation in force-level in the stable-zone leads to
decelerating effect on the impact of the component.
Effective absorption of crash impact energy is most characteristic of a component in a
crash impact event. The absorption of energy (total) E, can be defined mathematically as
follows
Eq. 1.1
Wherein δ is crush-displacement and F is crush-force and ds is the displacement. The
S.E.A. or specific energy absorption denoted by Es can be defined as the energy absorbed per
unit mass of the component under impact.
Eq. 1.2
Here ρ is mass density of the material used for component, A is the cross sectional
area, δ is crushed/deformed length. The S.E.A. or Es not only depends on physical properties
of the material used for the component but also dependents on type of geometric cross section
used for component. In automobiles the total mass/weight of the components used for
manufacture of structures plays a significant role in total cost as well as the fuel economy of
the vehicle.
Hence the S.E.A or Es is one of the most important parameter to know the
crashworthiness of various types of geometries that can be used for making the crash energy
absorbing systems. With the use of different geometric shapes, the cross section area (A)
changes and this has an effect on the S.E.A (Es).

18
Thus the research problem concerning the crash box is to find the optimum geometric
design and choice of material that can result in maximum possible absorption of energy of
frontal RCAR speed level of collisions. Several authors in the past have proposed a variety of
crash box geometries made of both metals and non-metals and studied their energy
absorption characteristics through numerical simulation as well as experimental work. The
details of this past work available in the literature are exhaustively reviewed in the next
chapter leading to the identification of the specific gaps in research and selection of
objectives of the present doctoral work.
19
Chapter-2: Literature Review
In this chapter, an exhaustive literature review is carried out on the work related to the central
theme of the present work. The review has been presented in a chronological order of
progress of work with suitable comments on salient aspects of geometric shape and material
of crash box and their influence on the deformation pattern and energy absorption
characteristics.
2.1. Review of the Past Work
Langseth et al., (1998) studied the crashworthiness of aluminum extrusion subjected
to impact loading and also validated numerical model using LS-DYNA with experimental
results. For increasing energy absorption ability of thin walled aluminum structures subjected
to impacts axially, an experimental evaluation was done to study combined effect of
extrusions as well as aluminum foams.
Miyazaki et al., (1999) performed axial impact test for rectangular tubes for obtaining
bending as well as impact resistance. The crush behaviour was captured using high speed
cameras and also simulated numerically for analysis. They found compressive strains reach a
top level in the tube-wall at the central portion of the tubes in the axial route; uneven surfaces
and ripple at the surfaces of the tubes are due to buckling-deformation.
Compressive and bending type loading of crash box considering it as a walled beam
structure representing a part of the vehicle structure with the use of finite-element process
was studied by Noma et al., (2002). According to them, area of component can be divided
into two different areas such as an effective area and ineffective area. The effective collapse
force was studied and improvement of the vehicle structure was done.
Carbon Fiber Reinforced Plastic (CFRP) composite which can be appreciably useful
due to their high-stiffness and light-weight was studied by Ando et al., (2003). CFRP also has
an advantage on impact protection as it gives the liberty for tailor made physical-properties.
In their evaluation, a multi layer shell was used to reproduce the impact characterization of
carbon fibers. Basic impact-test values of easy to make specimens were taken to evaluate
characterization of carbon fibers. Then this was used for modeling of crash-box of Nissan-
20
GT500 race car. Simulated results were in proper correlation compared to experiments.
Hence the optimized model was developed on the basis of numerical method.
Bernal et al., (2004) targeted on using braided composite materials for car frontal
structure in case of frontal crash. The front longitudinal beam of the vehicle structure was
studied by them; S.E.A values and absolute energy absorbed were compared for structures
made of CFRP and GFRP materials.
Maddever et al., (2005) targeted on the usage of aluminum-foams obtained by melting
technique of metal matrix composites (M.M.C) for use in crash-boxes. Efficiency of hollow
extruded aluminium was evaluated against similar crash-boxes with M.M.C foam with
different values of densities. Details regarding the deformation and crash-energy absorption
were explained. Outcome of the study indicates sizable upgrades, permitting a useful
decrease in crash-box dimensions.
Marcus et al., (2005) studied the optimisation of metallic crash box with an objective
of reducing its mass. They used LS-OPT for solving the optimization problem and they also
used Neural-Networks as meta-model. They carried out their research work based on the
finite element model provided by Saab Automobiles for their passenger cars.
Rossi et al., (2005) studied the post buckling deformations characteristic for
aluminium-alloy extrusions under longitudinal-axial impact. LS-DYNA was used in their
study. They focussed on studying post buckling deformations, often induced through an
axial-crumpling motion which generates cloth like folds as the crash energy is absorbed.
They determined that increment in flange had a major effect at the axial crush pressure and
deformation parameters.
Zhang et al., (2007) studied the effect of patterned surfaces for traditional thin walled
rectangular tube in order to increase absorbed energy values when compression is done
axially. They carried out quasi static crash of the tubes using numeric analysis by use of LS-
DYNA. They introduced different pattern types with the usage of pyramid shaped element.
One type was focused at initiating deformation in extension-mode and the other was aimed at
creating new deformation type for increasing absorption of crash-energy. Effectiveness of
different patterned types was studied for crashworthiness of tube.
21
Performance under crash for thermoplastic crash box made of composites was studied
by Hamidreza et al., (2008). To get more details LS-DYNA was used for numerical
simulation of the tubes. Tube wall was modelled using layer of shell elements to replicate the
delamination. Contacts were used between the different layers of the lamina. Optimization
technique was used to find the best suitable design for the crash box.
Rajendran et al., (2008) studied the closed-cell-aluminium foams equipped with AISI-
304L stainless-steel tubes to know crashworthiness. Drop weight experiments were carried
out with the usage of a free-flight drop-tower on aluminum-foam fitted to stainless-steel tubes
to find the acceleration time data of the impactor. They determined that the foam is useful for
increasing crashworthiness.
Extensive numerical analyses of dynamic buckling of a crash box, taking into
consideration both the elastic waves and plasticity consequences was studied by Rusineka et
al., (2008). It became evident that both elastic-wave propagation and the plasticity acted
during the first level of impact. This change in elastic-wave propagation and the plasticity
defined the disintegrate region. In order to approximate effectively the buckling, correct
description of the stress-rate sensitivity of materials were considered. The principal concept
was to guarantee a high plastic stress stage under excessive pressure to prevent any unwanted
buckling.
Impact crash on the empty and foam filled square tubular structures was studied by
Zarei et al., (2008). The multi layout optimization (MDO) technique was used to locate the
most appropriate empty tube that absorbed most energy with minimal self-weight. Square-
tube thickness, length and width, were decided as optimization parameters. On the basis of
this optimisation method the best square-tube that absorbed most energy with minimal self-
weight was found.
Hadavinia et al., (2009) studied the mode I and mode II inter-laminar crack
propagation and their effect on the deformation mode of the composites. The double-
cantilever-beam (D.C.B), 3 point end notched flexure ( 3 E.N.F ) and axial-crush boxes,
samples were made from carbon- epoxy twill weave fabric and these examined for quasi
static loading to decide the inter-laminar fracture-toughness in mode I ( G I C ), mode II (G II
C) and S.E.A of every lay-up. The deformation method of composites was additionally
22
studied via finite-element software LS-DYNA and result was validated with the applicable
experimentation.
Effect of fiber orientation at the interlaminar fracture toughness of GFRP composite
crash boxes was studied by Ghasemnejad et al., (2009). It was proven that the fiber
orientation at interface fracture plane influences the interlaminar fracture of GFRP composite
substances. The interlaminar fracture strength of interface fracture planes of 0 / 90, 90 / 90
and 0 / 45 had been close collectively whilst +60/-60 behaved pretty differently. The interface
plane of 0 /90 confirmed the most interlaminar fracture strength while it turned into minimum
for the +60/ -60 interface plane. It was revealed that energy absorbing capacity in axially
crushed composites depended on the interlaminar fracture toughness of laminates.
Hadavinia et al., (2009) focused on the effectiveness of fiber orientations at the inter-
lamina fracture-toughness for mode I and mode II, as well as absorbed energy for carbon-
epoxy twill weave composites. They proved that the lamina designs near interface-fracture
planes effects the inter-laminar fracture-toughness in woven-CFRP composites. The variation
of laminate bending and brittle fracturing deformation was determined for the lay ups of [0] 4
and [0/45] 2. In this situation a variation in mode I and mode II, effects the absorbed energy
of woven-CFRP composites. For laminates layout of [45] 4, the mode II crack progress was
witnessed in the facet wall, due to which buckling and transverse shear crush modes
occurred. Importance of inter-laminar fracture toughness for laminates was determined.
Lee et al., (2009) gave an analytical system for increasing the efficiency of tubes full
of granule, on the basis of effective-thickness principle from the previous studies. A goal was
picked to evaluate the analytical setup and display the crash of a tubes packed with granule.
They investigated the crashworthiness of a tube filled with granules and proposed modified
analytic expressions for the energy absorption in the tubes full of granules.
Xiao et al., (2009) studied the damage mechanics of composites, using mat-58, in LS-
DYNA for braided-composite materials using axially loaded tubes. Numerical simulation
analysis for the model was done with the use of single-element formulations.
Xiao et al., (2009) focused on higher S.E.A for tubes made of composites. They
observed that simulation model formed on the basis of continuum-damage-mechanics (C D
M) method was insufficient to replicate un-loading behaviour of deformed composite

23
materials. They conducted experimentation and found that, braided-composite tube forms
various continuous crush-fronds. Localized un-loading occurred in cases where material
portion moving-out of the crush-front became part of crush-frond.
Ghasemnejad et al., (2010) focused on results of delaminated failures in hybrid-
composite crash-boxes crashworthiness performances, in comparison with non hybrid types.
The combinations in twill-weave and uni-directional CFRP composites were considered.
Delaminating effect on mode I and mode II with the identical lay ups was done to analyze the
effects of delaminating cracks progress on absorption of energy for hybrid-composites. It was
proven that hybrid-laminate design displayed better fracture-toughness in mode I and mode II
delaminations and also better crashworthiness during crushing. Simulation of hybrid-
composite impacts was done with the aid of LS-DYNA software and the results were
validated with the applicable experiments.
Crash-energy absorption behaviour in Al (aluminium) closed-mobile foam crammed
commercial 1050H14 Al crash boxes in two sizes and three different thicknesses under quasi-
static and dynamic deformation velocities was studied by Toksoy et al., (2010). The quasi-
static and dynamic crushes of empty as well as foam stuffed crash boxes have been simulated
with usage of LS-DYNA. It was shown both experimentally and numerically that partial-
foam filling tended to alter the deformation modes of empty crash-boxes from a non-
sequential to a sequentially folding mode. The experiment as well as simulated results
showed comparable crushing values and deformation modes. In order to evaluate the
efficiency of partial-foam filling, the S.E.A values of empty, in-part and absolutely foam
filled crash-boxes were characterized using box-wall thickness and foam filler relative-
density. The consequences confirmed that empty crash-boxes were energetically more
efficient than absolutely and in part foam crammed crash-boxes, importance of foam relative-
density was also found. It was revealed that, on comparison with complete foam fill, the
crucial foam density for partial-foam filling decreases with increment of crash-box wall
thickness.
Crash-boxes fabricated from metallic alloys steel-aluminum, subjected to crash-
impact loading was studied by İnce et al., (2011). The evaluation of the crash-box was carried
based on impact-loading. Hybrid type crash-box, manufactured from steel-aluminium was
modelled and evaluated for impact load. The hybrid crash-boxes were optimal for weight
reduction, 17.5% weight-reduction was obtained with the aid of hybrid crash-boxes.
24
Moreover, it was essential to use customized techniques for the hybrid crash box to increase
the weld strength.
Ghamarian et al., (2011) studied the crumble mechanism and absorption of energy
through axial compressions of the end capped and thin walled circular aluminium tubular
structures, which were hollow and also filled with polyurethane-foam. Simulation model was
developed to evaluate deformation in tube. The experiment and simulation outcomes were
useful to decide absorption of energy due to the deformations of thin wall tube and
collapsible foam. The performances of end capped tube were evaluated with non capped
tubes, in order to manage preliminary top load.
Qureshi et al., (2012) studied various sinusoidal type patterns which had been applied
to the crash-box; the effect of these was evaluated for crash-impact. Possibilities to alter the
crash deformation-mode and buckling-frequency through introduction of pattern were
checked. It was found that in the pattern containing nodal-hinges, the pressure peaks might be
managed by method of manipulation of the longitudinal as well as horizontal wave-
amplitude.
Obradovic et al., (2012) developed analytic, numeric and experiment models to study
the crash energy absorption characteristics of composites. In spite of the complex nature of
fracture, a close result was obtained for both numerical and experimental methods, performed
for simpler structured tubes. The simplified finite element model was capable of simulating
the absorption of energies with an error of 10 %.
Deformation mechanisms of expanded-metallic tubular structures under impact crush
was studied using experiments by Graciano et al., (2012). They also calculated the
crashworthiness potential of metallic tubular structures. It was determined that the force-
deformation response and failure mechanism of the tubes relied upon the aspect-ratios of the
expanded-metallic tubular structures.
Tarlochan et al., (2012) focused on crushing behaviour in polymer composite
sandwich systems. They performed experiments for investigating behaviour of composite-
sandwich systems under quasi static compressions. The test samples were made of
glass/carbon fiber and epoxy resins. The optimized layout of their research had absorption of
energy and force-efficiency greater than traditional metal alloys.
25
Influence of adding a variety of patterned shapes on box beam crash absorbers was
studied by Qaiser et al., (2013). Addition of patterned shapes on beam crash absorbers lead to
higher energy absorption in case of pure-bending deformation. Energy efficiency increased
by 53.49 % for ideal case in comparision with original model. Moreover, patterned shapes on
box beam generally distributed energy uniformly.
Costas et al., (2013) studied 5 unique types of energy absorbers via experimentation
as well as numeric analysis. The outcomes showed improvements for energy absorbed of the
whole steel padding components when compared to base specimen. Moreover, in terms of
efficiency, the tube with corrugated CFRP insert and the cork-crammed tube required a
redesign, so that the results of the simulations with modified design showed a good gain in
absorbed energy.
Eshkoor et al., (2013) studied distinct trigger configurations and their variations in the
parameter related to crash and deformation styles of silk-epoxy composites. Plug-type
triggers gave a very exceptional sample of failure as well as vulnerable crash parameter in
comparison to different triggers. Moreover, 4-piece triggers were not good for epoxy
composite tubes, as it considerably decreased the quantity of peak force with a massive
reduction in energy absorbed values. Finally, the systematic and no catastrophical
deformations were observed in components.
Oshkovr et al., (2013) studied various types of quasi static compressive testing
considering rectangular tube made from different quantities of silk and epoxy laminates such
as 12, 24 and 30 laminates. It was observed that the results from the two approaches, finite
element analysis and experiments have a good agreement in terms of failure modes and
crashworthiness characteristics.
Gedikli et al., (2013) investigated the crashworthiness of tubes manufactured using
aluminium ( AL6061 T6 ), high-strength-steel ( AIS I1018, HSLA 350, DP 600, DP 800 )
and tailor welded tube (T.W.T), made from aluminium and high-strength-steel (AL 6061 -T6
& AIS I1018, AL 6061 - T6 & HSLA 350, AL 6061 - T6 & DP 600, AL 6061 - T6 & DP
800). Simulation analysis was done to find the effectiveness of materials type, thicknesses
and aspect- ratios (tube-length/diameter) of tubes.
26
Waimer et al., (2013) carried out experimentations for studying dynamic-failure
behaviours of generic CFRP specimens when axially loaded, useful as crash absorbers in
aerospace applications. Various materials and designs were parameterized to study the
behavioural effects. Effectiveness of all parameters was studied based on force displacement
characterization and absorption of energy.
Effect of corrugation on the crush behaviours, absorption of energy, and mode of
failure in round aluminum tubes was studied by Eyvazian et al., (2014). Experiments were
completed on 5 geometries for corrugate as well as simple-shaped tubular structures along
with corrugation varying in length and orientation, under axial-compressive load. It was
proven that tube with corrugation displayed a uniformly distributed load versus displacement
values without any preliminary high loads. After applying corrugation, there was also
improvement in mode of failure.
Dhatreyi et al., (2014) studied the characterizing of trans-laminar fracture in plain
weave, fabric reinforced composites subjected to mixed mode loadings. Using fracto-graphy
of the fractured specimens, the influence on the mechanism of failures was checked and also
the propagation of cracks was studied.
Gurusideswar et al., (2014) studied the effects of clay when mixed in epoxy and glass
/ epoxy composite materials at lower strain-rates. The clay is mixed in the epoxy-resin using
stirring and then by process of sonication. The glass / epoxy nano-composites were made by
glass fiber with epoxy–clay mixture using hand lay-up process and then following a
compression-molding.
2.2. Gaps in existing Research
It is clear from the literature review that very little work done in the past considered a
detailed study and comparison of the behaviour and energy absorption performance of crash
boxes made of composite materials. Moreover, only a few different cross sectional shapes
were experimented. Detailed crash box sub system level analysis such as the effect of various
geometric shapes and triggers (which act as deformation initiators) in the design was done
sparsely. The amount of work using composite material crash boxes is also limited. Very less
study is done on comparison of crashworthiness of composite material crash boxes under
27
axial impact loading with sufficient variety of cross sections being used. Research work on
using triggers as deformation initiators is also limited in the literature. Very less study was
done for the feasibility of trigger type features in combination with various cross sections of
the crash boxes. Comparative crashworthiness analysis of crash boxes with and without
geometrically intrinsic triggers subjected to RCAR speed level impact loading was not done.
Very less study is available on crashworthiness behaviour for GFRP composite crash boxes
made of different types of geometric shapes along with the application of various types of
triggers subjected to impact loading under RCAR speed conditions.
After careful assessment of these research gaps, the following research objectives
were identified for the present doctoral work.
2.3. Research Objectives of the Present Work
1. Finite element simulation of proposed crash box when subjected to impact.
Comparative analysis of crashworthiness behaviour of the crash boxes with different
geometries along with combination of various triggers.
2. Manufacturing of the required specimens of crash boxes for experimental analysis.
3. Experimental analysis of crashworthiness behaviour of the crash boxes with different
geometries along with combination of different triggers.
4. Suggestion of best combinations of geometric cross sections and trigger types for
improving crashworthiness behaviour of composite crash boxes based on force versus
displacement plots and specific energy absorption.
These research objectives are further detailed out in the following paragraphs.
The primary objectives of the present work is to, study crash energy absorbing
characteristics of a Glass fiber reinforced plastic (GFRP) crash boxes when subjected to an
axial impact load with various types of geometrical cross sections and different trigger types
extensively. GFRPs have good energy absorbing characteristics useful for crashworthiness
applications. They are also cheaper and can be easily manufactured. In the first phase of
work, finite element method based numerical analysis was done extensively to study the
effectiveness of various cross sectional shapes on crashworthiness of crash boxes without
application of triggers. Later different triggers were applied to various cross sections of
GFRP crash boxes and study was carried further in a comparative manner to know the
relative effectiveness of various combinations of trigger types and geometric cross section by

28
analyzing the F-D diagrams (force versus displacement curves), energy absorption values and
specific energy absorption (S.E.A).
Crash boxes made of composite material (GFRP) are used for this study. In present study
GFRP crash boxes made of four different types of cross sections: square, cylindrical,
hexagonal and decagonal are used. A comparative numerical simulation analysis is done to
study the effect of each type of cross section on the crashworthiness behaviour of crash boxes
when subjected to impact at low velocity, on the basis of automotive “RCAR Test”. For the
purpose of improvement in crashworthiness of the composite crash box, triggers are applied
to the composite crash boxes to obtain higher value of energy absorption and required
deformation pattern. Triggers are widely used in crash boxes made of metal alloys whereas
the usage of triggers for composite crash boxes is still under development in automobile
industry. Crashworthiness of GFRP composite crash box structures with novel geometrically
intrinsic triggers are studied extensively for various types of geometric cross sections. For
this purpose various types of novel triggers, such as; Notch triggers (different types of notch
triggers), Thickness variation triggers (different types of thickness variation/front end
triggers) and Slot triggers (different types of slot triggers) are used with combination of all
the geometric shapes considered for this research. Force- displacement diagrams and Specific
Energy Absorption (S.E.A) are studied for all combinations of geometry and trigger types for
better understanding of behaviour of crash boxes subjected to axial impact. Later an
experimental analysis is done to correlate the numerical simulation. Best combinations of
geometric cross sections and trigger types for improving crashworthiness behaviour of
composite crash boxes are suggested based on force versus displacement plots and specific
energy absorption.
2.4. Scope of Study
This research is done to study the crash energy absorbing characteristics of a crash box
subjected to impact load with various types of geometrical cross sections and trigger
configurations. Extensive literature review was done to understand the research work done
and also to find the gaps in the research in this area. For better understanding the details of
composites were presented based on the configuration of composites along with background.
Numerical simulation was discussed in detail including the special techniques for simulation
of composites, material model used in LS-DYNA software, parameters and simulation
29
methodology. Manufacturing of composites (specimens) was discussed in detailed including
the ingredients, mould / mandrel preparation, procedure and precautions. Experimental
testing was discussed in detail including the preparation of test, test setup, specimen clamp
preparation, safety design of drop weight holder, data acquisition system and safety
precautions. Numerical simulation and experimental analysis was done extensively and
correlated to compare various types of geometries of the composite crash box for specific
energy absorption and also to understand the effectiveness of different triggers on
crashworthiness behaviour of GFRP crash boxes made of various geometric cross sections.
This research successfully highlights the relative effectiveness of various trigger types on the
energy absorption level and peak force variations for all the combinations of geometric cross
sections of the GFRP crash box. Result discussion was done to elaborate the effect of each
geometric cross section and each trigger type along with combination of geometric cross
section and trigger types on the crashworthiness of the GFRP crash boxes.
2.5. Research Methodology
In the present study GFRP crash boxes are considered. Analysis setup is built based on
“RCAR test”. Assuming the vehicle is undergoing low velocity impact test, popularly known
as the “Front Structural RCAR Impact”. Purpose of RCAR testing is to validate the
effectiveness of frontal energy absorption mechanism of the vehicle in low velocity impact
(16kmph), which is common in day-to-day traffic conditions. This test helps in finding the
crashworthiness of crash box under impact. For the vehicle to pass the test it is required that
the components mounted behind the crash box do not get damaged during the impact, so that
there is minimal damage and repair cost. For this to happen the crash box must absorb the
maximum possible energy. Hence crash box plays a very vital role in this test. In present
study behaviour of crash box is analyzed at sub-system/component level, so as to suggest the
relatively better combination of geometrical cross section and trigger configuration for GFRP
crash boxes. Component/sub-system analysis is helpful in saving computing time, is less
complex for analyzing and can be solved in relatively less powerful computers.
The crash energy absorbing characteristics of a crash box subjected to impact load with
various geometric cross sections and trigger types is studied extensively. In present study
GFRP crash box made of four different types of cross sections: square, cylindrical, hexagonal
30
and decagonal is considered. Numerical simulation analysis and is done extensively to
highlight the effect of each geometric cross-section and also each type of trigger on crash
behaviour of GFRP crash boxes. Comparative analysis is done to understand the relative
effectiveness of each trigger type on the energy and force variation; with the variations of
cross section and triggers for the crash boxes based on the RCAR Test. Force- displacement
diagrams and Specific Energy Absorption (S.E.A) is studied for all combinations of geometry
and trigger types for better understanding of behaviour of crash boxes subjected to axial
impact.
Finite element pre-processor called HyperMesh is used for setting up the simulation
model and applying all the boundary conditions. The finite element model of the component
is generated by meshing the required geometric shape of the component in pre-processor
HyperMesh. MAT LAMINATED COMPOSITE FABRIC: material type 58, is widely used
to model the composites for finite element simulation. MAT LAMINATED COMPOSITE
FABRIC (MAT-58) material model provided by finite element solver LS-DYNA is used for
crash box model. This material model can be used with shell and thick shell elements. LS-
DYNA is used for solving the model. HyperView and HyperGraph are used as post-processor
for extraction and analysis of the simulation results. Furthermore, the experimental analysis is
carried out for the crash boxes with various geometric shapes and trigger configurations using
drop weight impact testing machine setup to correlate with numerical simulation analysis.
Numerical simulation analysis and experimental test analysis is done to study the effect of
each geometric cross-section along with each type of trigger configuration on
crashworthiness of GFRP crash boxes based on the energy and force variation. Specific
Energy Absorption (S.E.A) is considered as factor for determining the crashworthiness of the
crash box.
31
2.6. Organization of the Thesis Report
Chapter-1: Introduction
A brief introduction is given about automobile safety. Crashworthiness of a vehicle is
discussed. Low speed collisions which occur more often in urban traffic are discussed along
with RCAR (Research Council for Automobile Repairs) test. Scope of composite materials in
automobiles and their benefits when used in electric cars is discussed.
Study on composites is a complex subject due to the complexity involved in the
formulation of composites which involves combination of different materials (fibers and
matrix). Hence their behaviour is also different when compared to other materials. To better
understand the complex behaviour of composites, background of composites is discussed.
The behaviour of fiber reinforced composites when subjected to axial impact loading is also
discussed. Later discussion is done on research background.
Chapter-2: Literature Review
Extensive literature survey is done which is beneficial for understanding the work
done by previous researchers and the trend of the research done on crashworthiness of
materials specially composites. Based on the literature available from the work done by
previous researchers, gaps in the existing research work were found. Gaps in existing
Research are presented. Some noticeable gaps found in the existing research are as follows;
comparision of crashworthiness behaviour for crash box made of GFRP composite material
from different cross sections is done in sparse. Detailed crash box sub system level analysis is
done rarely to study the effect of various types of triggers. Very little work is done on
comparative crashworthiness analysis of crash boxes with and without application of
geometry intrinsic triggers subjected to impact loading. Research objectives of the present
work are presented and explained. Scope of study and research methodology is discussed.
32
Chapter –3: Numerical Simulation of GFRP Crash Boxes
Numerical simulation of composites is discussed in detail along with the procedure
for numerical simulation of glass fiber reinforced plastic (GFRP) crash boxes. The
significance of force versus displacement diagram is also discussed. Initially, a comparative
numerical simulation analysis of GFRP crash boxes made of various cross sections was done
to study the effect of each type of cross section on the energy absorption of crash boxes in
low velocity impact, based on the automobile standard testing known as “RCAR Test”.
GFRP crash boxes with four types of cross sections: square, cylindrical, hexagonal and
decagonal were considered for crashworthiness behaviour analysis. In order to improve the
crashworthiness of the composite crash boxes, triggers were implemented in the design of
crash boxes to help in achieving desired deformation pattern, energy absorption and peak
force value. The comparative numerical simulation analysis of GFRP composite crash box
structures was carried further; with novel geometrically intrinsic triggers studied extensively
for all the different types of geometric cross sections considered. Various types of novel
triggers for composites were introduced namely; Notch triggers (different types of notch
triggers), Thickness variation triggers (different types of thickness variation/front end
triggers) and Slot triggers (different types of slot triggers) and studied extensively, to
understand the effect of each type of trigger on the crashworthiness behaviour of GFRP crash
boxes made of square, cylindrical, hexagonal and decagonal geometrical cross sections. Force
versus displacement curves were plotted for each case providing detailed insights into the
force variation during deformation. Specific Energy Absorption (S.E.A) was compared for all
the combinations of the cross sections as well as the trigger types used for the crash boxes for
better understanding of the crashworthiness characteristics of each combination of geometric
cross section and trigger type. Later a comparative analysis of all the crash boxes considered
in this study with all combinations of geometries and trigger types is presented in a
consolidated manner for a better understanding of effectiveness of each type of geometry
shape and trigger type on the crashworthiness of GFRP crash boxes.
Chapter–4: Manufacturing of the Experimental GFRP Crash Box Specimens
In order to correlate the numerical simulation with experimental results crash box
specimens are required. Therefore, specimens of GFRP crash boxes were prepared using
hand lay-up process. The hand lay-up process is explained in detail. Discussion is also done
on the specimen mould required for making each type of crash box considered in the study.
33
Procedure used for hand lay-up process for crash box specimen making is explained step-
wise, including safety precautions and practical tips for manufacturing of composites.
Chapter–5: Experimental Impact Testing of GFRP Crash Box Specimens
Experimental analysis of the GFRP crash boxes was carried out using drop weight
impact testing in Indonesia. Details of drop weight impact testing were discussed including
preparation of specimen clamps required for holding the specimen during test. Drop weight
impact testing of GFRP composites involves many dangers so details of safety precautions
were explained elaborately. Experimental results were presented in a comparative manner.
Factors influencing the numerical simulation and experimental results were discussed along
with their limitations. Numerical simulation model replicating the drop weight impact testing
was developed. Correlation of experimental results and numerical simulation results was
done. A good correlation between the experimental test and numerical simulation was
achieved. Discussion on correlation between the experimental test and numerical simulation
was presented followed by summary of the chapter.
Chapter- 6: Summary, Conclusions and Future Scope
Summary of the work done in this research is presented in sequential manner. The
conclusions drawn from the work done are presented in a detailed manner so that a clear
picture of the effectiveness of geometrical cross section as well as the trigger configuration
can be obtained. Contributions of the study are discussed. Usefulness of the present research
is presented. Prospective future scope for continuation of the present work is discussed to
pave way for further study in this research area.
34
Chapter–3: Numerical Simulation of GFRP Crash Boxes
3.1. Introduction
This chapter mainly focuses on the numerical simulation and analysis of glass fiber
reinforced plastic (GFRP) crash boxes. The objective of this numerical simulation is two-
fold, firstly, to predict the force-displacement relationship and energy absorption, secondly,
to prediction the deformation pattern under impact loading. Composite materials have
complex deformation pattern under impact loading based on their constituent materials, their
nature of distribution and geometry. It is very important to understand this mechanical
behaviour and deformation pattern subjected to impact loading to correctly characterize the
performance of the crash box. In the present analysis, first, numerical analysis is done on
GFRP crash boxes made of various types of cross sectional geometries and subjected to axial
impact loading to study the effect of each cross sectional shape on the energy absorbing
characteristics of the crash boxes. Later, various types of triggers are applied to all the cross
sectional shapes considered in the study. Comparative analysis is done for each type of
trigger to understand the effect of each trigger on the crashworthiness of the crash box.
Crashworthiness characteristics like energy absorption, peak loads and specific energy
absorption are compared for better understanding of each type of geometry and trigger
combination.
3.2 Merits of Pre-Test Numerical Simulation in Crashworthiness
The numerical simulation done before the actual experimental testing known as pre-test
numerical simulation has the following advantages:
Numerical Simulation is a very cost effective way of analysing multiple case studies in
crashworthiness applications.
Simulation helps in identifying the load bearing capacity or force level the component
can withstand. It provides an approximate picture of the crash event before the actual
crash is done.
35
It gives the opportunity to check various possibilities or combinations and their effect on
the crashworthiness before actually implementing them, hence decreasing the prototype
testing and therefore reducing the cost of testing.
Even though numerical simulation may not exactly replicate the deformation of complex
materials such as composites it is a very useful tool which helps the engineers by
providing an approximate picture of weak locations in the structure.
Numerical simulation gives an opportunity to the engineer to carryout analysis of the
crash impact in a very detailed manner; this includes force analysis, energy analysis with
reference to time history of the crash event which is very difficult in experimental test.
Numerical simulation gives an opportunity to the engineer to optimise as well as improve
the design of the structure for crashworthiness and compare its effectiveness to the
base/original structure.
Therefore it is a good idea to carry out the numerical simulation analysis before the
actual experimental testing is done. These numerical simulation analysis models are generally
referred as pre-test simulation models, which provide the designer not only an overview of
the crash behaviour beforehand but also these are also helpful for optimising the actual
prototypes. For this purpose the numerical simulation is done with simplified models which
are easy to handle and can be simulated as well as analyzed in lesser time. At later stage
when the prototype/specimen testing is completed, the pre-test numerical analysis model can
be refined and correlated with the experimental test specimen for further analysis. This
method is cost and time effective for the designer to study a larger number of cases required
for the study.
3.3 Numerical simulation of composites in LS-DYNA
The crushing behaviour of composite crash box under axial impact loading is very
important for improving the crashworthiness of the energy absorbing structures in
applications such as automotive. Analysis of composite materials subjected to axial impact
loading is a complex problem which requires the usage of numerical simulation codes
available commercially for solving such problems. LS-DYNA is a widely used simulation
code for solving such non-linear problems. It provides support for solving composite
materials subjected to impact loading. It has material models which are suitable for composite
materials, one such material model is MAT_LAMINATED_COMPOSITE_FABRIC or
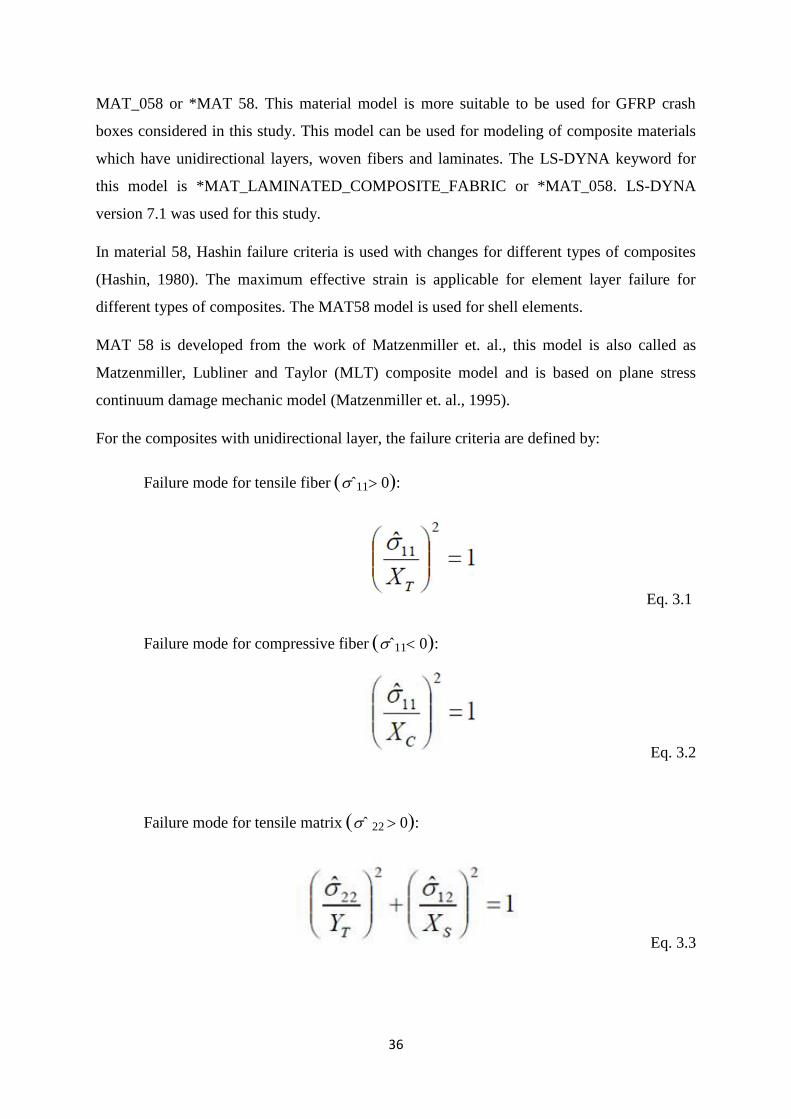
36
MAT_058 or *MAT 58. This material model is more suitable to be used for GFRP crash
boxes considered in this study. This model can be used for modeling of composite materials
which have unidirectional layers, woven fibers and laminates. The LS-DYNA keyword for
this model is *MAT_LAMINATED_COMPOSITE_FABRIC or *MAT_058. LS-DYNA
version 7.1 was used for this study.
In material 58, Hashin failure criteria is used with changes for different types of composites
(Hashin, 1980). The maximum effective strain is applicable for element layer failure for
different types of composites. The MAT58 model is used for shell elements.
MAT 58 is developed from the work of Matzenmiller et. al., this model is also called as
Matzenmiller, Lubliner and Taylor (MLT) composite model and is based on plane stress
continuum damage mechanic model (Matzenmiller et. al., 1995).
For the composites with unidirectional layer, the failure criteria are defined by:
Failure mode for tensile fiber ˆ11 0:
Eq. 3.1
Failure mode for compressive fiber ˆ11 0:
Eq. 3.2
Failure mode for tensile matrix ˆ 22 0:
Eq. 3.3
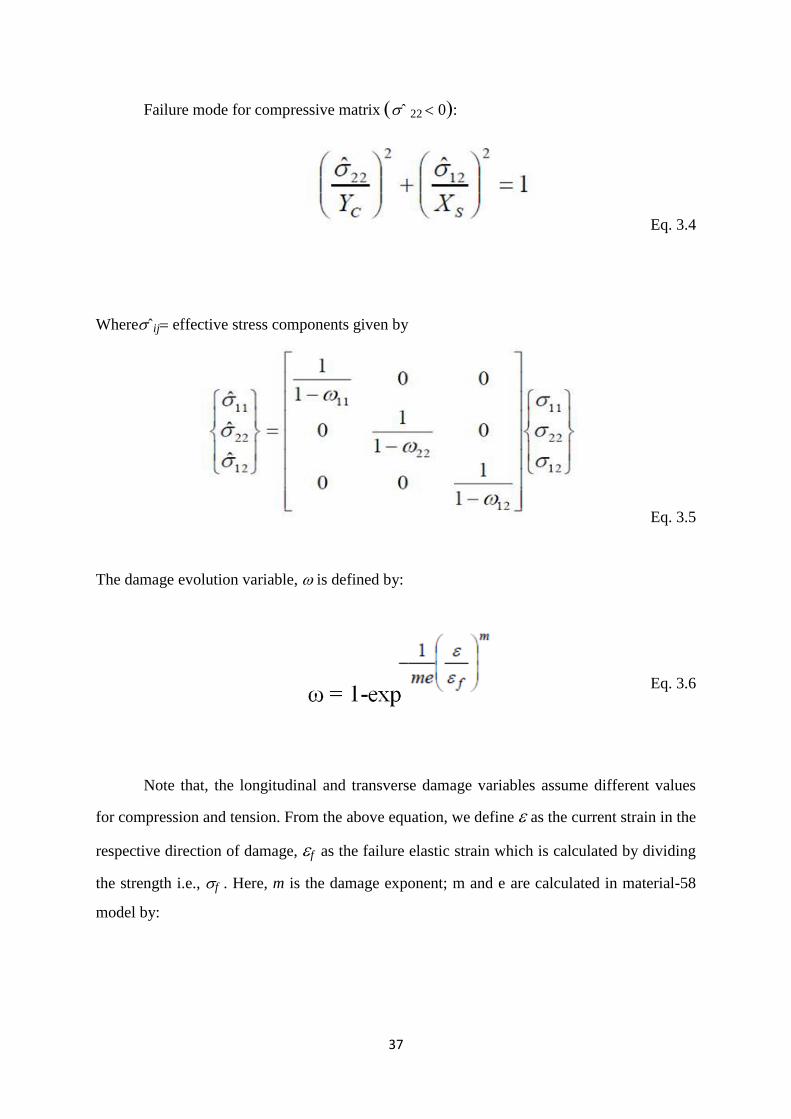
37
Failure mode for compressive matrix ˆ 22 0:
Eq. 3.4
Whereˆijeffective stress components given by
Eq. 3.5
The damage evolution variable, is defined by:
Eq. 3.6
Note that, the longitudinal and transverse damage variables assume different values
for compression and tension. From the above equation, we define as the current strain in the
respective direction of damage, f as the failure elastic strain which is calculated by dividing
the strength i.e., f . Here, m is the damage exponent; m and e are calculated in material-58
model by:
38
Eq. 3.7
Where q is the strain where strength is reached.
The stresses ˆ11, ˆ 22 and ˆ12are the components of effective stress tensor. Therefore, ˆ
can be written as
Eq. 3.8
Where M is the damage operator and is the nominal stress. M can be written as
Eq. 3.9
Where 11,22and12are the damage variables that distinguish matrix, fiber and
shear damage.
When the damage occurs in at least one mode at any point, then the damage operator
becomes substantial for damage initiation in other modes. The material response after
damage initiation is defined as
Eq. 3.10
Where C is damaged elasticity matrix which is written as
and
39
Eq. 3.11
Where D11111221221 0, and 11, 22and12 reflects the current state of fiber,
matrix and shear damages respectively. where u12 and u21 are Poisson’s ratios respectively.
The stress components in the failure criteria are given by,
Eq. 3.12
Eq. 3.13
Where c, t are for compression and tension and p, n are parallel (11-direction) and
perpendicular (22-direction), X and Y are the longitudinal and transverse strengths, Sc is the
shear strength. The initial damage threshold, r = r0, in the criterion for loading in fiber
direction is determined by the initial damage variable. Example of stress-strain curve for
material model-58 is shown in Fig. 3.1.
Eq. 3.14
40
Fig. 3.1: Example of stress-strain curve for material model-58
3.4. Analysis Procedure of Composite Crash Boxes
In the present study crash boxes made of GFRP material are considered. GFRP crash boxes
can be manufactured by hand layup process. In this study the crash box is modeled with
Belystcho-Tsay shell elements with element formulation 2 (ELFORM-2formulation).
Unidirectional long fiber single laminate GFRP material shell-structure model is applied to
all the crash boxes considered in the study. Sufficiently small element size (5mm x 5 mm)
has been used throughout the crash box. The meshed structure is shown in Fig. 3.2.
Fig. 3.2: Crash box meshed model for sample
Since a variety of cross-sectional shapes and trigger shapes have been simulated in the
present work, for better quality of finite element mesh, the modeling, mesh generation,
application of displacement and load-boundary conditions for all numerical studies were done
in a separate high-end mesh generation and pre-processing software called as HyperMesh
(version 13.0). The pre-processed models are then are imported into the LS-DYNA for

41
solving. The material property data were taken from work done by Tabiei et al. (2005). GFRP
composite crash box is considered with thickness1.8 mm in the all studies.The
MAT_LAMINATED_ COMPOSITE_FABRIC material model (material type 58) provided
by finite element solver of LS-DYNA is used for crash box model with material properties as
given in Table 3.1.
*Consistency of units is very important in numerical simulation and hence all the units were
modified according to Ton, mm, sec units system followed by LS-DYNA.
MAT_LAMINATED_ COMPOSITE_FABRIC (material type 58) is widely used to model
the composites for finite element simulation (Schweizerhof et al., 1998). This material model
can be used with shell and thick shell elements. LS-DYNA explicit finite element solver is
Table 3.1: Material properties of GFRP Composite ( Tabiei et al. ,2005)
Property Symbol Value
Mass Density ρ 1.8 gm/cc
Young's modulus - longitudinal direction Ea 41400 MPa
Young's modulus - transverse direction Eb 3381 MPa
Young's modulus – normal direction Ec 3381 MPa
Poisson's ratio Vba 0.0244
Longitudinal tensile strength. Xt 786.6 MPa
Longitudinal compressive strength Xc 786.6 MPa
Shear modulus (ab) Gab 5244 MPa
Shear modulus (bc) Gbc 5244 MPa
Shear modulus (ca) Gca 5244 MPa
Transverse tensile strength Yt 191.1 MPa
Transverse compressive strength Yc 191.1 MPa
Shear strength, (ab) plane. Sc 53.82 MPa
Strain at longitudinal compressive strength ϵ11c 0.019
Strain at longitudinal tensile strength ϵ11t 0.019
Strain at transverse compressive strength ϵ22c 0.056
Strain at transverse tensile strength ϵ22t 0.056
Strain at shear strength ϵgms 0.011
42
used for solving the model and HyperView and HyperGraph are used as post-processor for
extraction and analysis of the simulation results.
In real time the crash box is joined to thick plate at the rear end (bottom end) and this thick
plate is attached to a much stronger vehicle structure (front rails). The front end (top end) is
subjected to impact in the event of a collision. (Refer Fig 1.9 & Fig 1.10)
For the component level analysis of the crash box, the setup is simplified for ease of study
on crashworthiness. The crash box is considered to be fixed at the bottom, (considered to be
attached to a rigid surface at the bottom for simplification of the problem). The top end of the
crash box is impacted by the impactor. The impactor (which represents the rigid barrier) is
considered to be a rigid plate. The impactor was given a velocity of 16kmph similar to RCAR
test as shown in Fig. 3.3.
Fig. 3.3: Crash box simulation setup
Contact was defined between the impactor and the crash box by treating the former as the
master and the latter as the slave for proper interaction between the two. An additional
contact interface was defined for the crash box walls, as the walls of crash box would come
into contact with each other during the process of deformation under the impact.
The analysis setup is done based on “RCAR test”, as if the vehicle is undergoing the low
velocity impact test popularly known as the “Front Structural RCAR Test”. The purpose of
this test is to validate the crashworthiness of front structure of the vehicle in a low velocity
impact (16kmph), which is common in day-to-day traffic conditions. This test helps in
finding the crashworthiness of crash box under impact. For the vehicle to pass the test it is
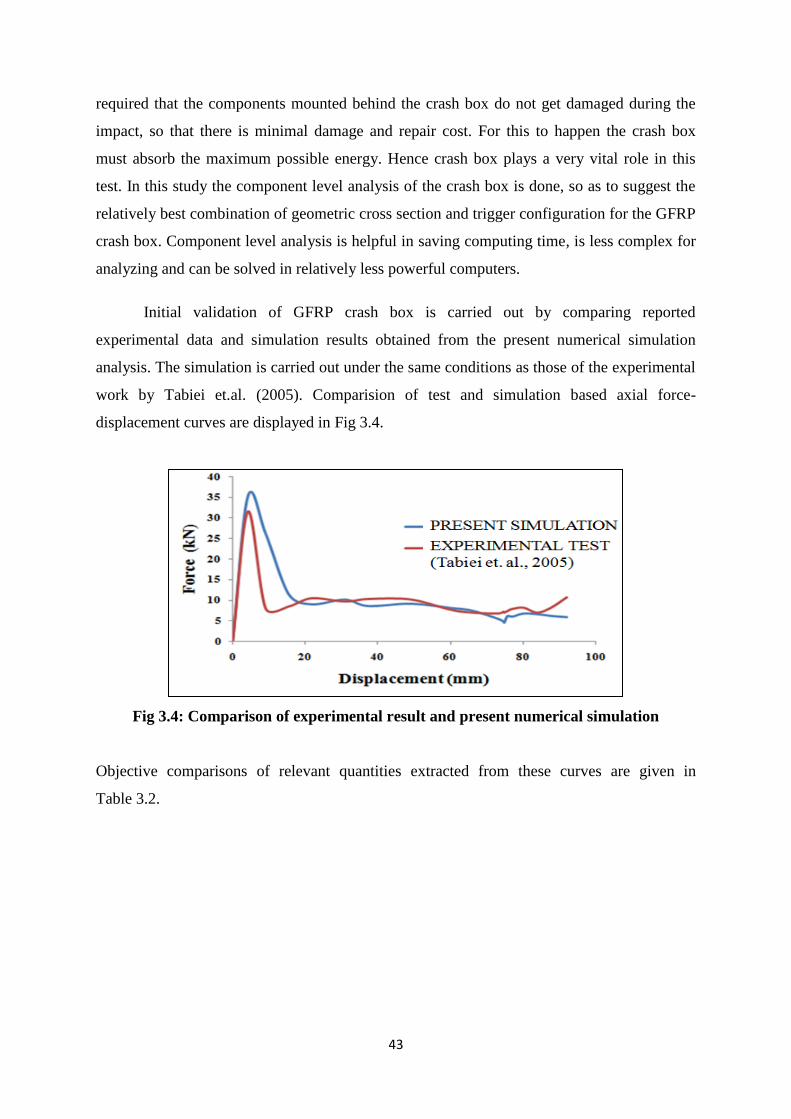
43
required that the components mounted behind the crash box do not get damaged during the
impact, so that there is minimal damage and repair cost. For this to happen the crash box
must absorb the maximum possible energy. Hence crash box plays a very vital role in this
test. In this study the component level analysis of the crash box is done, so as to suggest the
relatively best combination of geometric cross section and trigger configuration for the GFRP
crash box. Component level analysis is helpful in saving computing time, is less complex for
analyzing and can be solved in relatively less powerful computers.
Initial validation of GFRP crash box is carried out by comparing reported
experimental data and simulation results obtained from the present numerical simulation
analysis. The simulation is carried out under the same conditions as those of the experimental
work by Tabiei et.al. (2005). Comparision of test and simulation based axial force-
displacement curves are displayed in Fig 3.4.
Fig 3.4: Comparison of experimental result and present numerical simulation
Objective comparisons of relevant quantities extracted from these curves are given in
Table 3.2.
44
A good correlation is obtained between results of current simulation and those of
experimental test done by Tabiei et.al. (2005). The validated simulation model is used for
setting up the simulation for crash box for the cases required in this study. The material is
kept unchanged whereas only the geometry is updated according to the different cases of the
crash boxes explored in the present work.
The force versus displacement (F-D) diagram is used to study the behaviour of component
under crash. It basically shows the variation of force level with respect to displacement or
deformation. In general the F-D diagram is very useful in determining the parameters such as
primary peak force, secondary peak force and energy absorption. Primary peak force or
simply the peak force is the maximum force achieved during the crushing of specimen. The
peak force is generally high in the initial stage of crushing as the specimen resists the
deformation and thus the force level increases. It can be noted for better understanding
therefore that the peak force is the maximum reaction force offered by the specimen during
the impact. Energy absorption is another important parameter which is considered for
specimens subjected to impact or crash loads. Energy absorbed can be calculated from F-D
diagram by considering the area under the force versus displacement curve. The more the
area under the F-D curve, the more the energy absorbed. In addition to the above parameters,
another important parameter known as specific energy absorption is required to be taken into
consideration. Specific energy absorption (S.E.A) is defined as the energy absorbed by the
specimen per unit mass. In particular S.E.A is very important in automobile industry as the
performance of the specimen is considered with respect to the mass. Generally, higher values
of peak force, energy absorption and S.E.A are desirable for crash boxes undergoing impact.
Table 3.2: Force Comparision of experiment (Tabiei et al.,2005) and present numerical simulation
Parameter Experiment Test
(Tabiei et al., 2005) Present
Numerical Simulation
Peak Crush Force (kN) 31.56 36.21
Mean Crush force (kN) 9.357 8.90
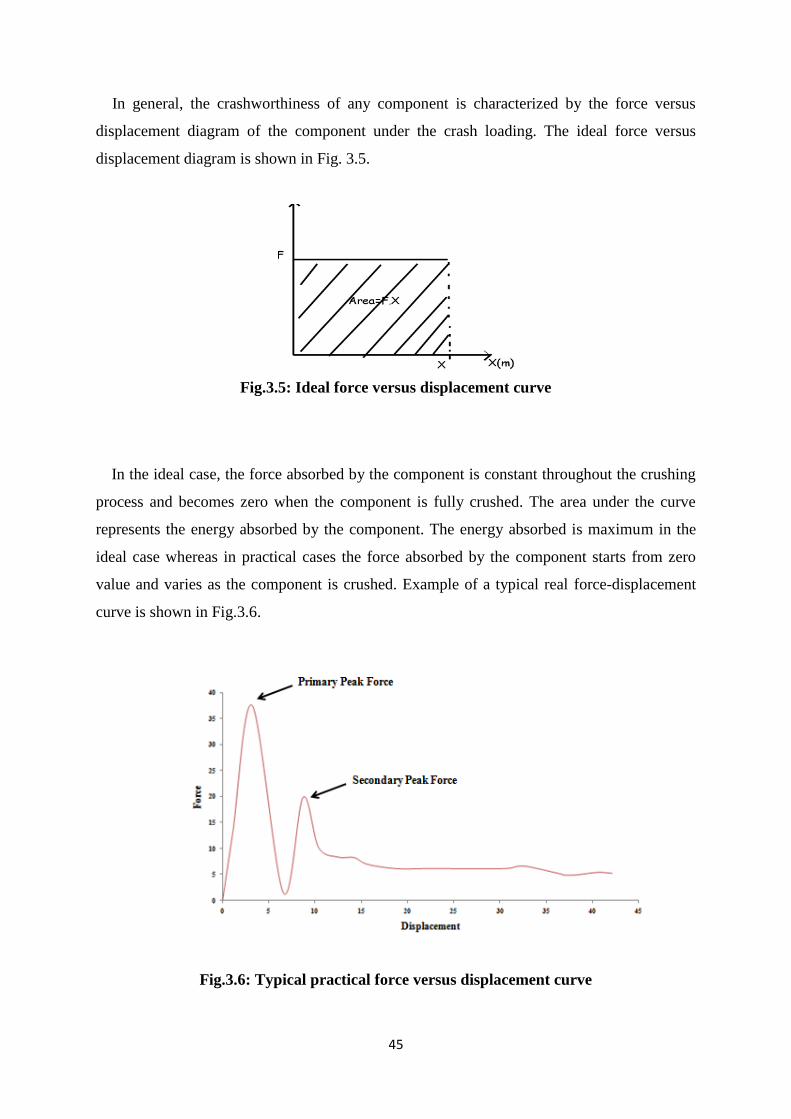
45
In general, the crashworthiness of any component is characterized by the force versus
displacement diagram of the component under the crash loading. The ideal force versus
displacement diagram is shown in Fig. 3.5.
Fig.3.5: Ideal force versus displacement curve
In the ideal case, the force absorbed by the component is constant throughout the crushing
process and becomes zero when the component is fully crushed. The area under the curve
represents the energy absorbed by the component. The energy absorbed is maximum in the
ideal case whereas in practical cases the force absorbed by the component starts from zero
value and varies as the component is crushed. Example of a typical real force-displacement
curve is shown in Fig.3.6.
Fig.3.6: Typical practical force versus displacement curve
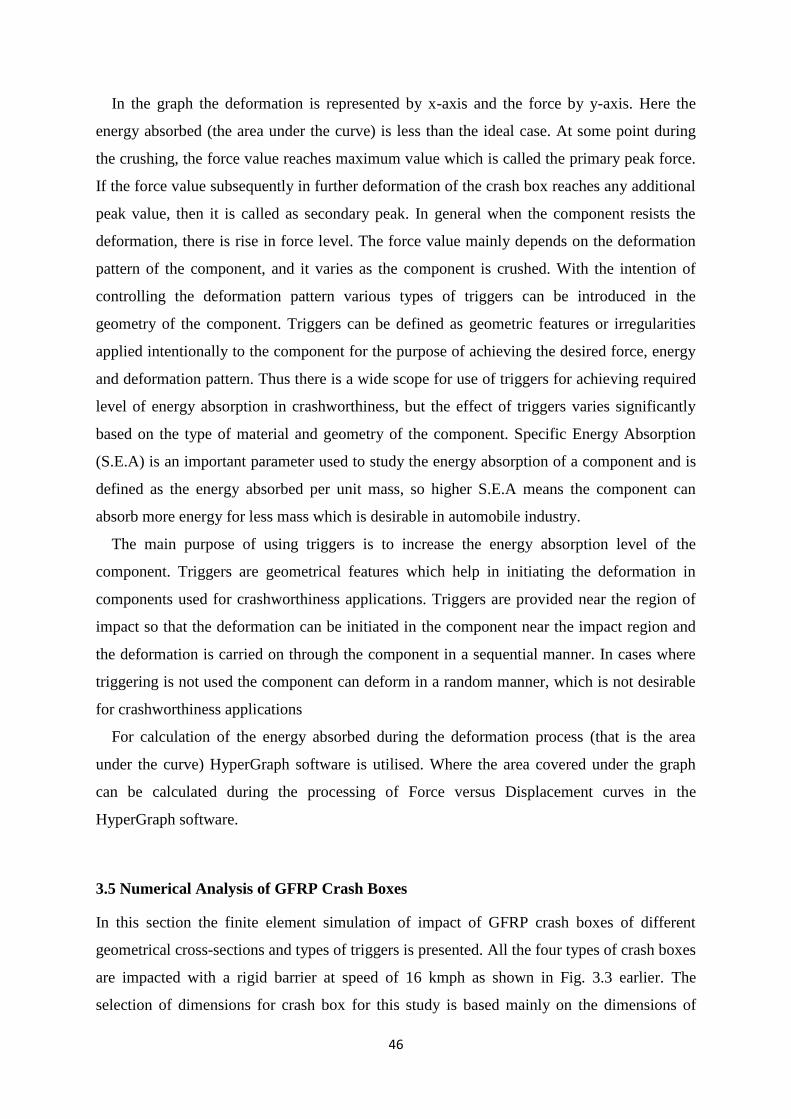
46
In the graph the deformation is represented by x-axis and the force by y-axis. Here the
energy absorbed (the area under the curve) is less than the ideal case. At some point during
the crushing, the force value reaches maximum value which is called the primary peak force.
If the force value subsequently in further deformation of the crash box reaches any additional
peak value, then it is called as secondary peak. In general when the component resists the
deformation, there is rise in force level. The force value mainly depends on the deformation
pattern of the component, and it varies as the component is crushed. With the intention of
controlling the deformation pattern various types of triggers can be introduced in the
geometry of the component. Triggers can be defined as geometric features or irregularities
applied intentionally to the component for the purpose of achieving the desired force, energy
and deformation pattern. Thus there is a wide scope for use of triggers for achieving required
level of energy absorption in crashworthiness, but the effect of triggers varies significantly
based on the type of material and geometry of the component. Specific Energy Absorption
(S.E.A) is an important parameter used to study the energy absorption of a component and is
defined as the energy absorbed per unit mass, so higher S.E.A means the component can
absorb more energy for less mass which is desirable in automobile industry.
The main purpose of using triggers is to increase the energy absorption level of the
component. Triggers are geometrical features which help in initiating the deformation in
components used for crashworthiness applications. Triggers are provided near the region of
impact so that the deformation can be initiated in the component near the impact region and
the deformation is carried on through the component in a sequential manner. In cases where
triggering is not used the component can deform in a random manner, which is not desirable
for crashworthiness applications
For calculation of the energy absorbed during the deformation process (that is the area
under the curve) HyperGraph software is utilised. Where the area covered under the graph
can be calculated during the processing of Force versus Displacement curves in the
HyperGraph software.
3.5 Numerical Analysis of GFRP Crash Boxes
In this section the finite element simulation of impact of GFRP crash boxes of different
geometrical cross-sections and types of triggers is presented. All the four types of crash boxes
are impacted with a rigid barrier at speed of 16 kmph as shown in Fig. 3.3 earlier. The
selection of dimensions for crash box for this study is based mainly on the dimensions of
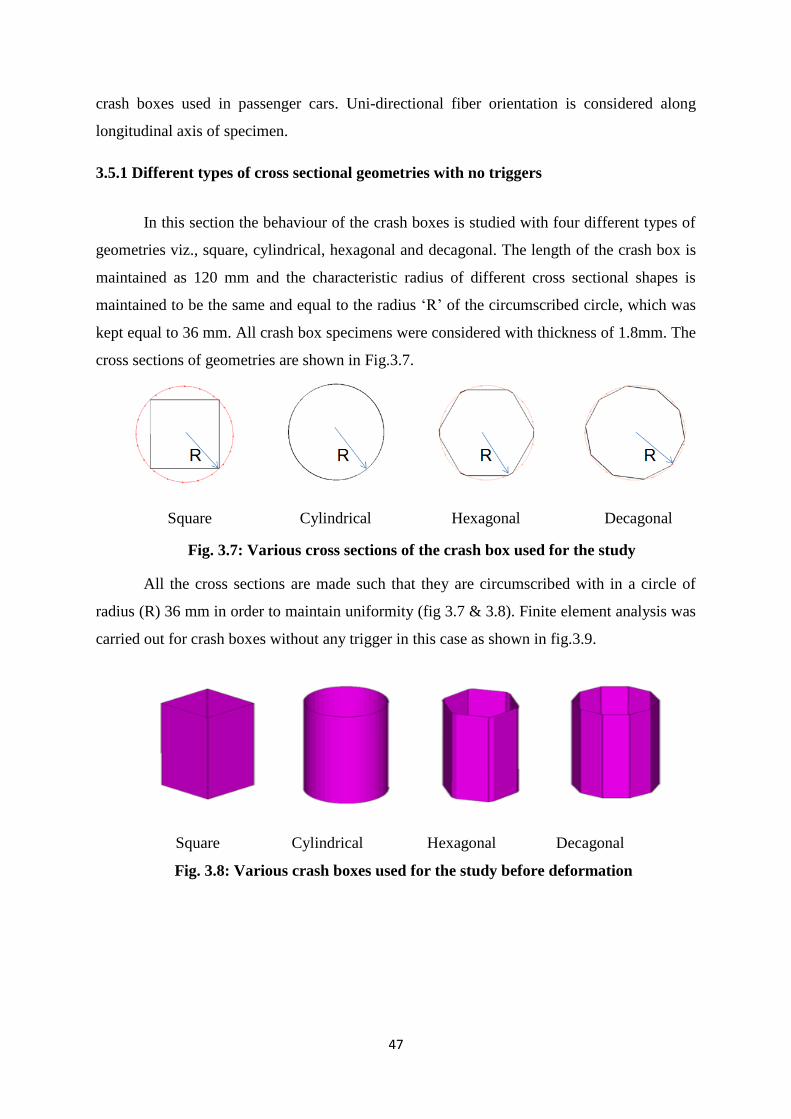
47
crash boxes used in passenger cars. Uni-directional fiber orientation is considered along
longitudinal axis of specimen.
3.5.1 Different types of cross sectional geometries with no triggers
In this section the behaviour of the crash boxes is studied with four different types of
geometries viz., square, cylindrical, hexagonal and decagonal. The length of the crash box is
maintained as 120 mm and the characteristic radius of different cross sectional shapes is
maintained to be the same and equal to the radius ‘R’ of the circumscribed circle, which was
kept equal to 36 mm. All crash box specimens were considered with thickness of 1.8mm. The
cross sections of geometries are shown in Fig.3.7.
Square Cylindrical Hexagonal Decagonal
Fig. 3.7: Various cross sections of the crash box used for the study
All the cross sections are made such that they are circumscribed with in a circle of
radius (R) 36 mm in order to maintain uniformity (fig 3.7 & 3.8). Finite element analysis was
carried out for crash boxes without any trigger in this case as shown in fig.3.9.
Square Cylindrical Hexagonal Decagonal
Fig. 3.8: Various crash boxes used for the study before deformation
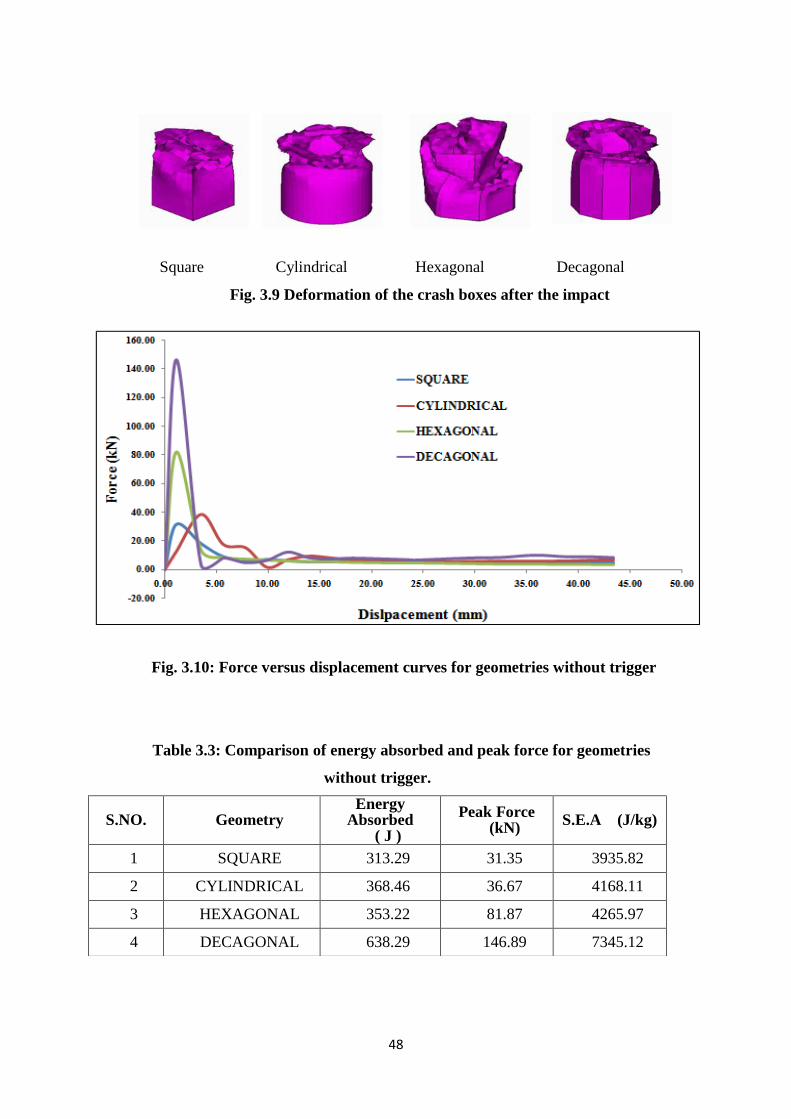
48
Square Cylindrical Hexagonal Decagonal
Fig. 3.9 Deformation of the crash boxes after the impact
Fig. 3.10: Force versus displacement curves for geometries without trigger
Table 3.3: Comparison of energy absorbed and peak force for geometries
without trigger.
S.NO. Geometry Energy
Absorbed ( J )
Peak Force (kN)
S.E.A (J/kg)
1 SQUARE 313.29 31.35 3935.82
2 CYLINDRICAL 368.46 36.67 4168.11
3 HEXAGONAL 353.22 81.87 4265.97
4 DECAGONAL 638.29 146.89 7345.12
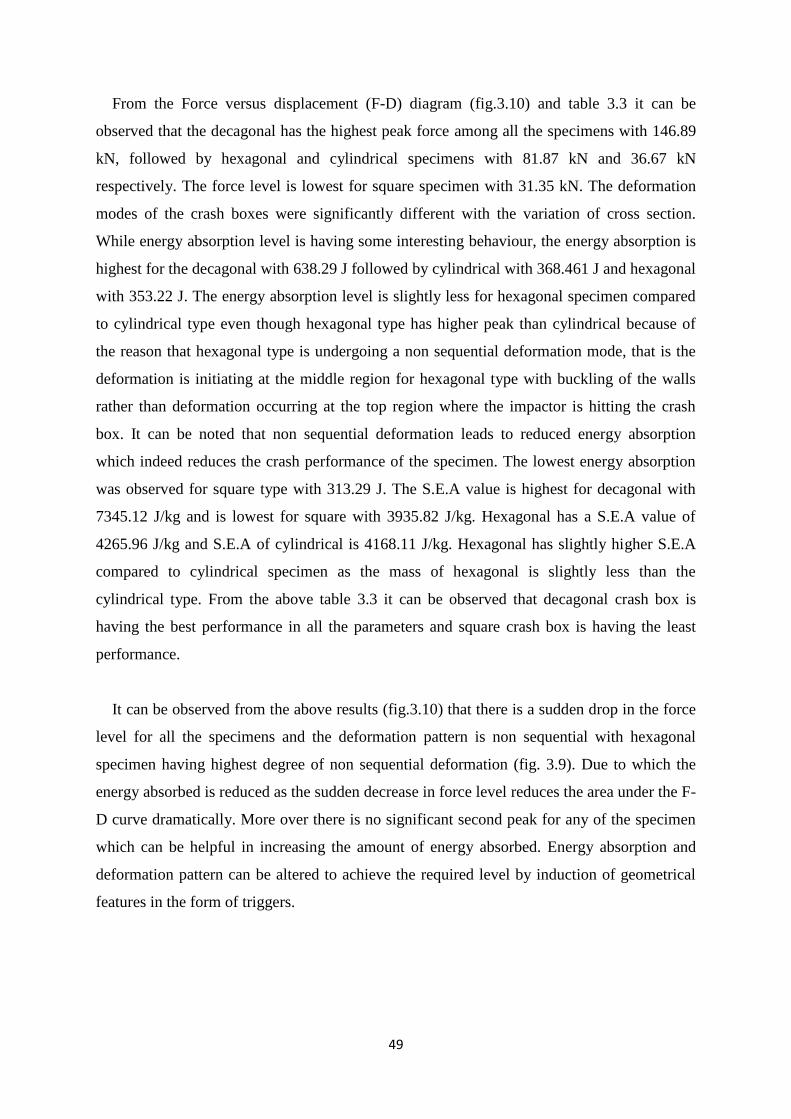
49
From the Force versus displacement (F-D) diagram (fig.3.10) and table 3.3 it can be
observed that the decagonal has the highest peak force among all the specimens with 146.89
kN, followed by hexagonal and cylindrical specimens with 81.87 kN and 36.67 kN
respectively. The force level is lowest for square specimen with 31.35 kN. The deformation
modes of the crash boxes were significantly different with the variation of cross section.
While energy absorption level is having some interesting behaviour, the energy absorption is
highest for the decagonal with 638.29 J followed by cylindrical with 368.461 J and hexagonal
with 353.22 J. The energy absorption level is slightly less for hexagonal specimen compared
to cylindrical type even though hexagonal type has higher peak than cylindrical because of
the reason that hexagonal type is undergoing a non sequential deformation mode, that is the
deformation is initiating at the middle region for hexagonal type with buckling of the walls
rather than deformation occurring at the top region where the impactor is hitting the crash
box. It can be noted that non sequential deformation leads to reduced energy absorption
which indeed reduces the crash performance of the specimen. The lowest energy absorption
was observed for square type with 313.29 J. The S.E.A value is highest for decagonal with
7345.12 J/kg and is lowest for square with 3935.82 J/kg. Hexagonal has a S.E.A value of
4265.96 J/kg and S.E.A of cylindrical is 4168.11 J/kg. Hexagonal has slightly higher S.E.A
compared to cylindrical specimen as the mass of hexagonal is slightly less than the
cylindrical type. From the above table 3.3 it can be observed that decagonal crash box is
having the best performance in all the parameters and square crash box is having the least
performance.
It can be observed from the above results (fig.3.10) that there is a sudden drop in the force
level for all the specimens and the deformation pattern is non sequential with hexagonal
specimen having highest degree of non sequential deformation (fig. 3.9). Due to which the
energy absorbed is reduced as the sudden decrease in force level reduces the area under the F-
D curve dramatically. More over there is no significant second peak for any of the specimen
which can be helpful in increasing the amount of energy absorbed. Energy absorption and
deformation pattern can be altered to achieve the required level by induction of geometrical
features in the form of triggers.

50
3.5.2. Notch Triggers for Different Cross Sectional Crash Boxes
In this section the behaviour of the crash box is studied with Notch triggers applied to all
the cross sections considered in the study. Triggers are applied near the impacted region of
the crash box. Trigger-A (Edge notch): 1 mm wide notches are made on the side walls of
crash box starting from the edges and up to a length of 20mm, Trigger-B (Corner notch):
Corner notch is made on the crash box such that the edge is bent outwards forming an arc of
radius 5mm at the impacted edge and Trigger-C (Combination of Edge and Corner Notch):
Notch combination of triggers A and B. The length of the crash box is maintained as 120 mm
and thickness 1.8mm. The cross sections of geometries are kept unchanged.
3.5.2.1. Square crash boxes with notch triggers
The square crash boxes after application of notch triggers are shown in fig. 3.11. Four
types of square crash box models which are considered to investigate the effect of triggers are
as follows, a) Without trigger (No trigger), b) With trigger-A, c) With trigger-B and d) With
trigger-C. The remaining parameters are kept unchanged for all the crash boxes. Finite
element analysis is carried out for all the above mentioned cases of crash boxes (fig. 3.12).
No Trigger Trigger-A Trigger-B Trigger-C
Fig.3.11: The square crash boxes before impact

51
No Trigger Trigger-A Trigger-B Trigger-C
Fig.3.12: The square crash boxes after impact
Fig.3.13: The force versus displacement curves for square crash boxes
52
From the force versus displacement data obtained (fig.3.13 and table. 3.4) it can be
observed that lowest S.E.A value is for trigger-A type with a value of 3437.59 (J/kg). For
trigger-A there is a sudden drop in force level after the primary peak due to which the amount
of energy absorption has reduced. Whereas the S.E.A improvement (41.2%) is highest for
Trigger-C type with a value of 5584.65(J/kg). Trigger-C type has a primary peak force of
16.78 kN and a secondary peak force of 10.22 kN and the area covered under the curve after
the primary peak is more, due to this the amount of energy absorbed during this time period is
more and hence the total energy absorbed has increased. For no-trigger, even though the
primary peak force value is 31.35 kN, there is no significant rise in force level for secondary
peak and there is a sharp fall in the force level after the primary peak due to which the overall
energy level is low. Trigger-B type has the primary and secondary peak force values as 20.38
kN and 8.60 kN, it can be observed that there is no significant rise in force level after the
primary peak due to which the amount of energy absorbed is low, as the overall area under
the curve is less. There is also a significant change in the deformation modes of the specimens
by the use of various triggers (fig.3.12.).
3.5.2.2. Cylindrical crash boxes with notch triggers
The cylindrical crash boxes after application of notch triggers are shown in fig. 3.14. Four
types of cylindrical crash box models which are considered to investigate the effect of triggers
are as follows a) Without trigger (No trigger), b) With trigger-A, c) With trigger-B and d)
With trigger-C. The remaining parameters are kept unchanged for all the crash boxes. Finite
element analysis is carried out for all the above mentioned cases of crash boxes (fig. 3.15).
Table 3.4: Comparison of energy absorbed and peak force for square crash boxes with notch triggers
S.NO. Square Energy
Absorbed ( J )
Primary Peak Force
(kN)
Secondary Peak Force (kN)
S.E.A (J/kg)
Percentage Improvement
of S.E.A (%)
1 No trigger 313.29 31.35 7.12 3935.82 0
2 Trigger-A 272.12 22.75 8.59 3437.59 - 5.1
3 Trigger-B 415.91 20.38 8.60 5109.45 29.8
4 Trigger-C 451.24 16.78 10.22 5584.65 41.2
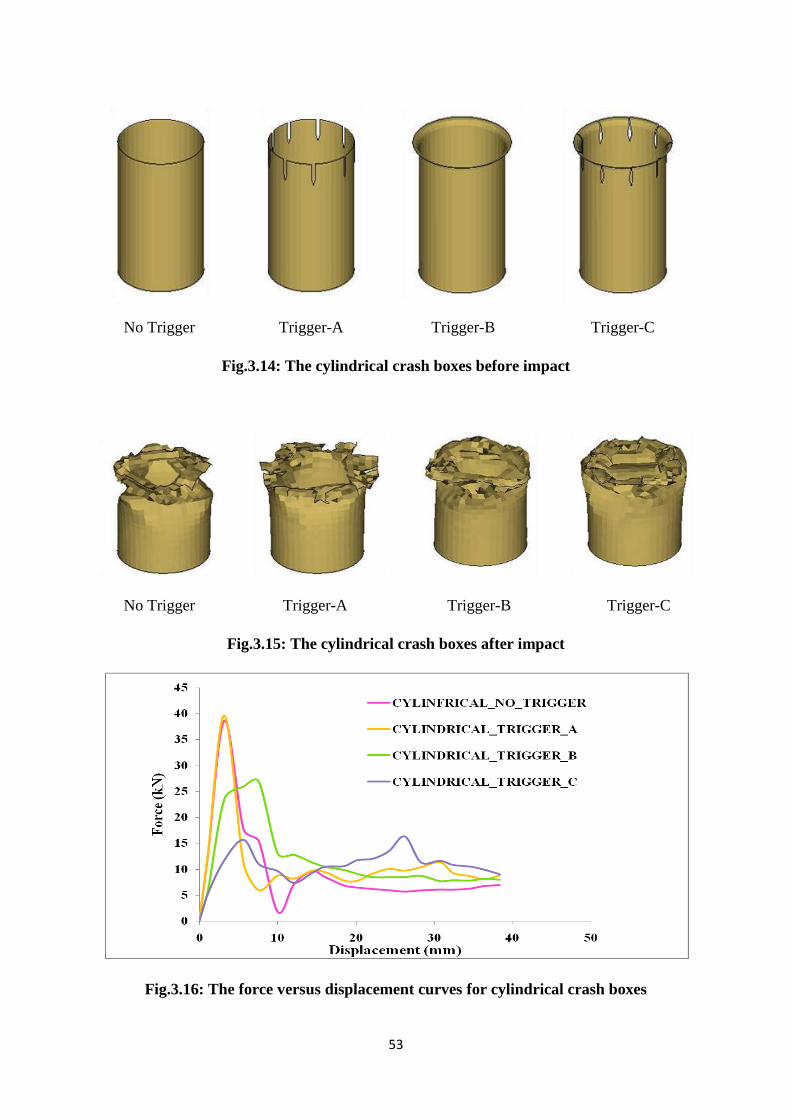
53
Fig.3.16: The force versus displacement curves for cylindrical crash boxes
No Trigger Trigger-A Trigger-B Trigger-C
Fig.3.14: The cylindrical crash boxes before impact
No Trigger Trigger-A Trigger-B Trigger-C
Fig.3.15: The cylindrical crash boxes after impact

54
From the force versus displacement data obtained (fig.3.16 and table. 3.5) it can be
observed that lowest S.E.A value is for No trigger type with a value of 4168.11 (J/kg). With
the use of Trigger-A the S.E.A improved by 11.51 percentage for a value of 4647.58 (J/kg).
With the use of Trigger-C the S.E.A value improved by 22.95 percentage and value of
5125.02 (J/kg) was obtained. The S.E.A improvement is highest for Trigger-B type with
35.45 percentage improvement for a value of 5646.12 (J/kg). Trigger-B type has a primary
peak force of 23.46 kN and a secondary peak force of 26.87 due to this the amount of energy
absorbed during this time period is more and hence the total energy absorbed is increased, as
the area under the curve has increased. For Trigger-C both the primary and secondary peak
values are less compared to Trigger –B, so the energy absorbed for Trigger-C is also less
compared to Trigger-B. For No trigger and Trigger-A types even though the primary peak is
high there is sudden drop in the force level which reduced the amount of energy absorbed as
the overall area under the respective curves was decreased due to this fall in force level. The
change of force level between the primary and secondary peaks was less for Trigger-B which
is desirable in crash worthiness. There is also a significant change in the deformation modes
of the specimens by the use of triggers (fig.3.15).
3.5.2.3. Hexagonal crash boxes with notch triggers
The hexagonal crash boxes after application of notch triggers are shown in fig. 3.17. Four
types of hexagonal crash box models which are considered to investigate the effect of triggers
are as follows, a) Without trigger (No trigger), b) With trigger-A, c) With trigger-B and d)
Table 3.5: Comparison of energy absorbed and peak force for cylindrical crash boxes
with notch triggers
S.NO. Cylindrical Energy
Absorbed ( J )
Primary Peak Force
(kN)
Secondary Peak Force (kN)
S.E.A (J/kg)
Percentage Improvement
of S.E.A (%)
1 No trigger 368.46 36.67 9.61 4168.11 0
2 Trigger-A 408.52 39.65 11.36 4647.58 11.51
3 Trigger-B 512.66 23.46 26.87 5646.12 35.45
4 Trigger-C 462.27 15.65 16.29 5125.02 22.95
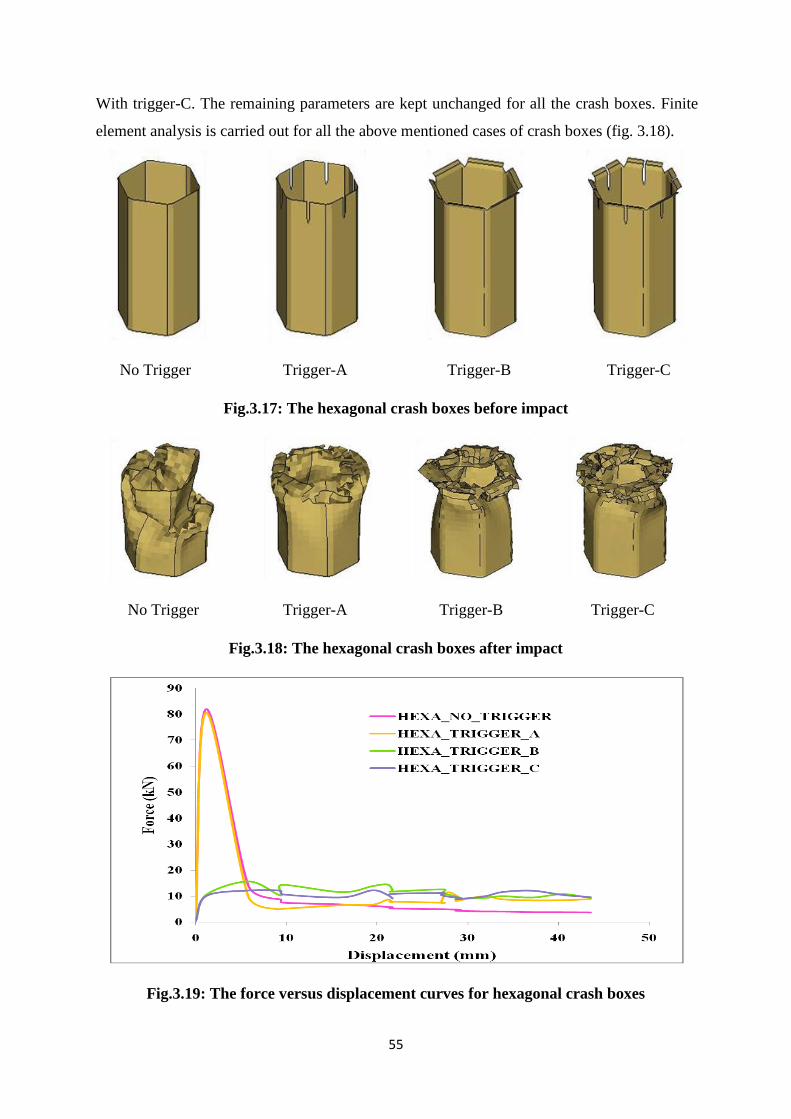
55
With trigger-C. The remaining parameters are kept unchanged for all the crash boxes. Finite
element analysis is carried out for all the above mentioned cases of crash boxes (fig. 3.18).
No Trigger Trigger-A Trigger-B Trigger-C
Fig.3.17: The hexagonal crash boxes before impact
No Trigger Trigger-A Trigger-B Trigger-C
Fig.3.18: The hexagonal crash boxes after impact
Fig.3.19: The force versus displacement curves for hexagonal crash boxes
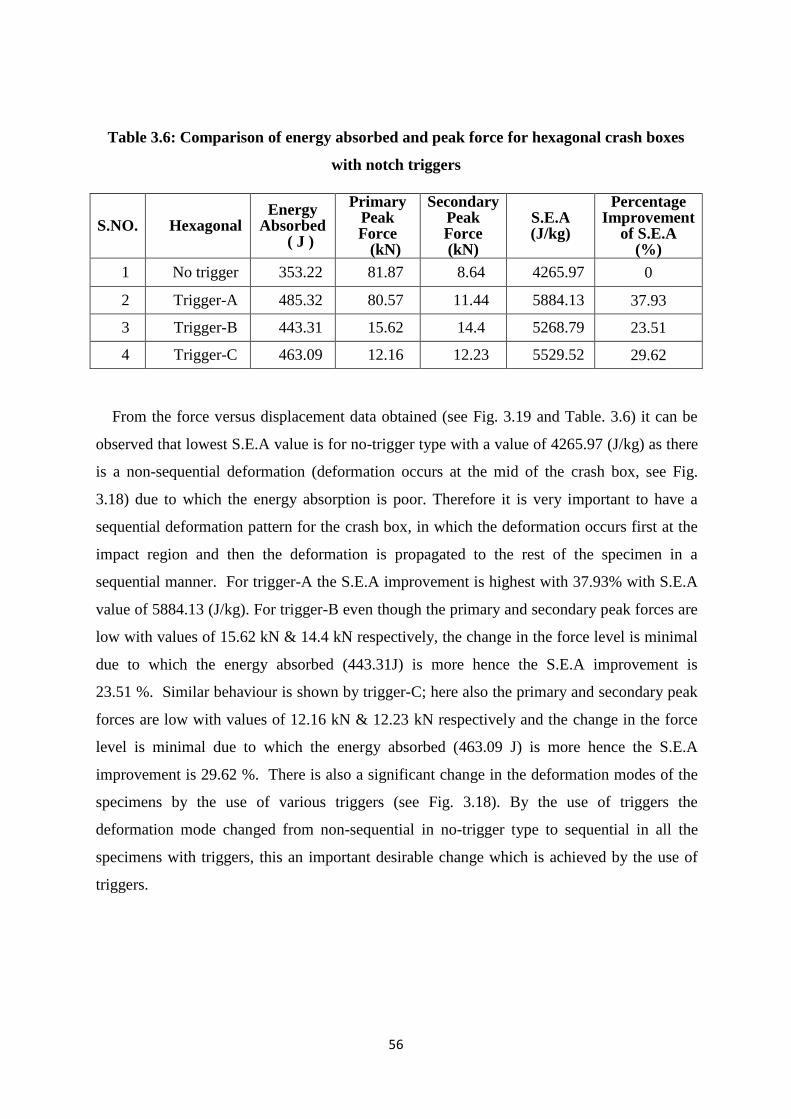
56
Table 3.6: Comparison of energy absorbed and peak force for hexagonal crash boxes
with notch triggers
S.NO. Hexagonal Energy
Absorbed ( J )
Primary Peak Force
(kN)
Secondary Peak Force (kN)
S.E.A (J/kg)
Percentage Improvement
of S.E.A (%)
1 No trigger 353.22 81.87 8.64 4265.97 0
2 Trigger-A 485.32 80.57 11.44 5884.13 37.93
3 Trigger-B 443.31 15.62 14.4 5268.79 23.51
4 Trigger-C 463.09 12.16 12.23 5529.52 29.62
From the force versus displacement data obtained (see Fig. 3.19 and Table. 3.6) it can be
observed that lowest S.E.A value is for no-trigger type with a value of 4265.97 (J/kg) as there
is a non-sequential deformation (deformation occurs at the mid of the crash box, see Fig.
3.18) due to which the energy absorption is poor. Therefore it is very important to have a
sequential deformation pattern for the crash box, in which the deformation occurs first at the
impact region and then the deformation is propagated to the rest of the specimen in a
sequential manner. For trigger-A the S.E.A improvement is highest with 37.93% with S.E.A
value of 5884.13 (J/kg). For trigger-B even though the primary and secondary peak forces are
low with values of 15.62 kN & 14.4 kN respectively, the change in the force level is minimal
due to which the energy absorbed (443.31J) is more hence the S.E.A improvement is
23.51 %. Similar behaviour is shown by trigger-C; here also the primary and secondary peak
forces are low with values of 12.16 kN & 12.23 kN respectively and the change in the force
level is minimal due to which the energy absorbed (463.09 J) is more hence the S.E.A
improvement is 29.62 %. There is also a significant change in the deformation modes of the
specimens by the use of various triggers (see Fig. 3.18). By the use of triggers the
deformation mode changed from non-sequential in no-trigger type to sequential in all the
specimens with triggers, this an important desirable change which is achieved by the use of
triggers.
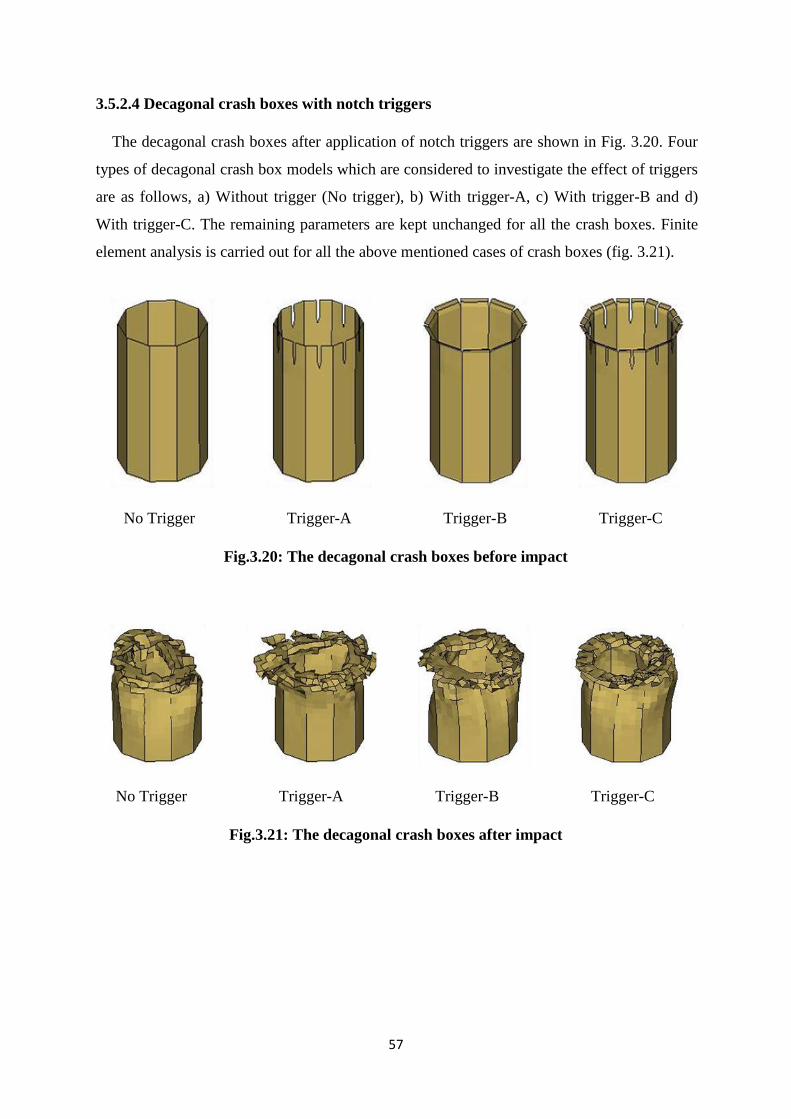
57
3.5.2.4 Decagonal crash boxes with notch triggers
The decagonal crash boxes after application of notch triggers are shown in Fig. 3.20. Four
types of decagonal crash box models which are considered to investigate the effect of triggers
are as follows, a) Without trigger (No trigger), b) With trigger-A, c) With trigger-B and d)
With trigger-C. The remaining parameters are kept unchanged for all the crash boxes. Finite
element analysis is carried out for all the above mentioned cases of crash boxes (fig. 3.21).
No Trigger Trigger-A Trigger-B Trigger-C
Fig.3.20: The decagonal crash boxes before impact
No Trigger Trigger-A Trigger-B Trigger-C
Fig.3.21: The decagonal crash boxes after impact

58
Fig.3.22: The force versus displacement curves for decagonal crash boxes
From the force versus displacement data obtained (see fig. 3.22 and table. 3.7) it can
be observed that highest S.E.A is observed for no-trigger type with a value of 7345.12 (J/kg)
due to significant high primary peak force of 146.89 kN which is very high compared to other
types, this increases the area under the curve which in turn increases the S.E.A. Lowest
S.E.A value is for trigger-C type with a value of 5409.06 (J/kg) it also has the lowest primary
peak value and low secondary peak force with 23.44 kN and 15.15 kN respectively, this
means that the component cannot resist the deformation and is too easy for getting deformed
Table 3.7: Comparison of energy absorbed and peak force for decagonal crash boxes with notch triggers
S.NO. Decagonal Energy
Absorbed ( J )
Primary Peak Force
(kN)
Secondary Peak Force (kN)
S.E.A (J/kg)
Percentage Improvement
of S.E.A (%)
1 No trigger 638.29 146.89 12.65 7345.12 0
2 Trigger-A 553.59 60.96 25.98 6404.32 - 12.80
3 Trigger-B 569.57 25.58 18.51 6403.26 -12.82
4 Trigger-C 477.62 23.44 15.15 5409.06 -26.35
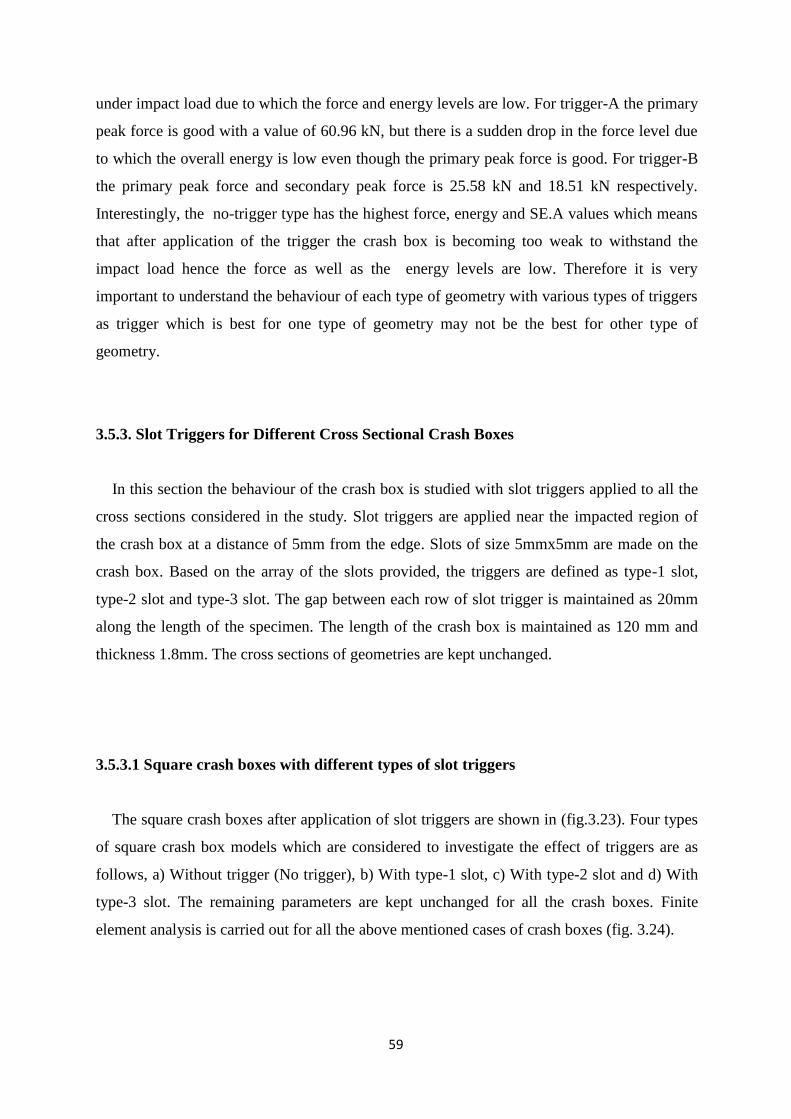
59
under impact load due to which the force and energy levels are low. For trigger-A the primary
peak force is good with a value of 60.96 kN, but there is a sudden drop in the force level due
to which the overall energy is low even though the primary peak force is good. For trigger-B
the primary peak force and secondary peak force is 25.58 kN and 18.51 kN respectively.
Interestingly, the no-trigger type has the highest force, energy and SE.A values which means
that after application of the trigger the crash box is becoming too weak to withstand the
impact load hence the force as well as the energy levels are low. Therefore it is very
important to understand the behaviour of each type of geometry with various types of triggers
as trigger which is best for one type of geometry may not be the best for other type of
geometry.
3.5.3. Slot Triggers for Different Cross Sectional Crash Boxes
In this section the behaviour of the crash box is studied with slot triggers applied to all the
cross sections considered in the study. Slot triggers are applied near the impacted region of
the crash box at a distance of 5mm from the edge. Slots of size 5mmx5mm are made on the
crash box. Based on the array of the slots provided, the triggers are defined as type-1 slot,
type-2 slot and type-3 slot. The gap between each row of slot trigger is maintained as 20mm
along the length of the specimen. The length of the crash box is maintained as 120 mm and
thickness 1.8mm. The cross sections of geometries are kept unchanged.
3.5.3.1 Square crash boxes with different types of slot triggers
The square crash boxes after application of slot triggers are shown in (fig.3.23). Four types
of square crash box models which are considered to investigate the effect of triggers are as
follows, a) Without trigger (No trigger), b) With type-1 slot, c) With type-2 slot and d) With
type-3 slot. The remaining parameters are kept unchanged for all the crash boxes. Finite
element analysis is carried out for all the above mentioned cases of crash boxes (fig. 3.24).
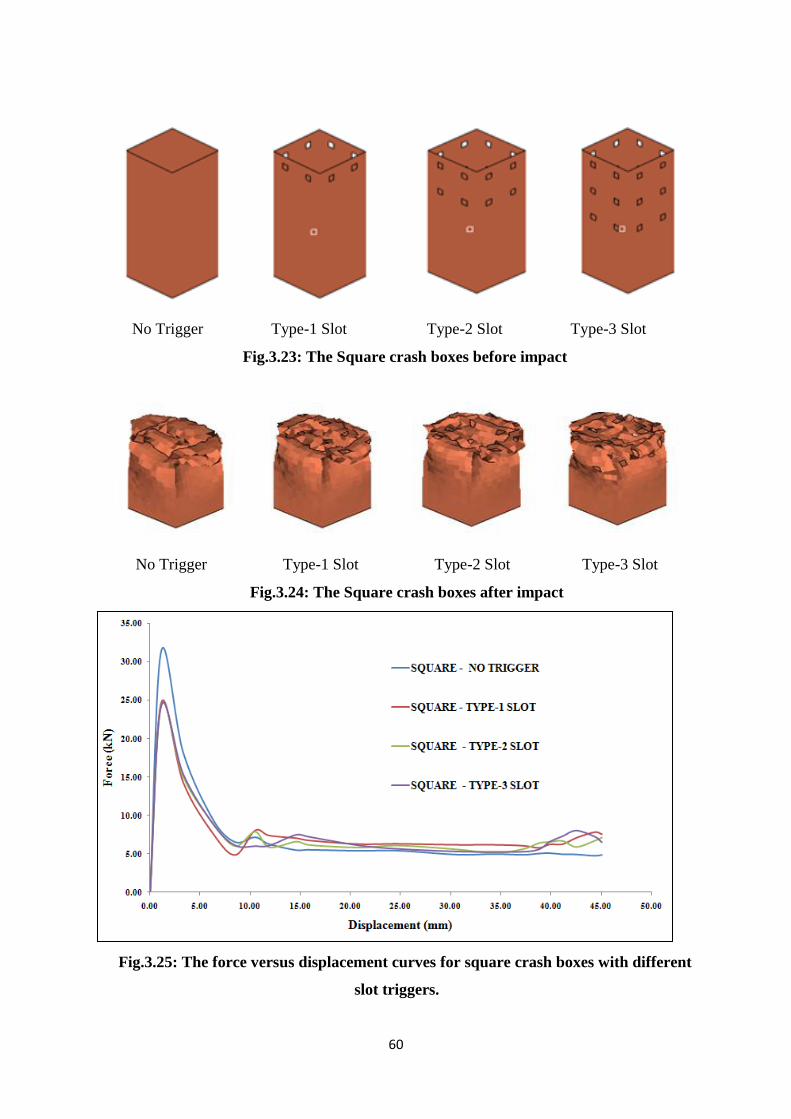
60
No Trigger Type-1 Slot Type-2 Slot Type-3 Slot
Fig.3.23: The Square crash boxes before impact
No Trigger Type-1 Slot Type-2 Slot Type-3 Slot
Fig.3.24: The Square crash boxes after impact
Fig.3.25: The force versus displacement curves for square crash boxes with different
slot triggers.

61
From the force versus displacement diagram (see fig. 3.25 and table 3.8) it can be observed
that the type-1 slot has the maximum S.E.A among all the crash boxes with 4375.36 (J/kg),
and with energy absorption of 341.71 (J). The energy absorption is lowest for type-2 slot
crash box with S.E.A value of 3790.34 (J/kg). Specific energy absorption is a key parameter
to measure the energy absorption with respect to mass. The higher the S.E.A the more
efficient the energy absorption is for the part. It can be observed from the above results that
there is a slight increase in force level at secondary peak for type-1 slot, due to which the
energy absorbed is increased, as the force level increases the region under the force versus
displacement curve which denotes the energy absorbed also increases. For type-2 slot and
type-3 slot the S.E.A is less with values of 3790.34 (J/kg) and 3856.94 (J/kg) which is less
compared to no-trigger type, which means that the specimen is getting weak after application
of these triggers, which is not desirable.
3.5.3.2 Cylindrical crash boxes with different types of slot triggers
The cylindrical crash boxes after application of slot triggers are shown in (fig.3.26). Four
types of cylindrical crash box models which are considered to investigate the effect of triggers
are as follows, a) Without trigger (No trigger), b) With type-1 slot, c) With type-2 slot and d)
With type-3 slot. The remaining parameters are kept unchanged for all the crash boxes. Finite
element analysis is carried out for all the above mentioned cases of crash boxes (fig. 3.27).
Table 3.8: Comparison of energy absorbed and peak force for square crash boxes with
different slot triggers
S.NO. Square Energy
Absorbed ( J )
Primary Peak Force
(kN)
Secondary Peak Force (kN)
S.E.A (J/kg)
Percentage Improvement
of S.E.A (%)
1 No trigger 313.29 31.35 7.12 3935.82 0
2 Type-1 Slot 341.71 24.71 8.05 4375.36 11.16
3 Type-2 Slot 296.82 24.32 7.82 3790.34 - 3.69
4 Type-3 Slot 299.41 24.23 7.41 3856.94 - 2.00
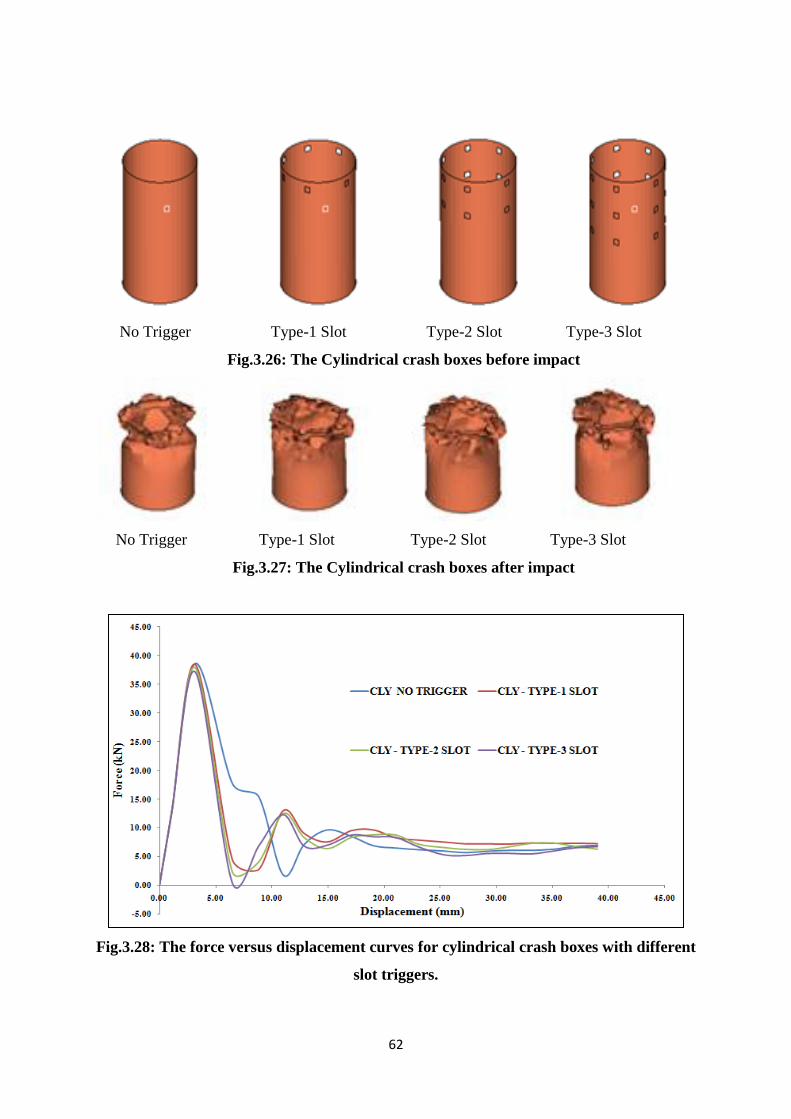
62
No Trigger Type-1 Slot Type-2 Slot Type-3 Slot
Fig.3.26: The Cylindrical crash boxes before impact
No Trigger Type-1 Slot Type-2 Slot Type-3 Slot
Fig.3.27: The Cylindrical crash boxes after impact
Fig.3.28: The force versus displacement curves for cylindrical crash boxes with different
slot triggers.
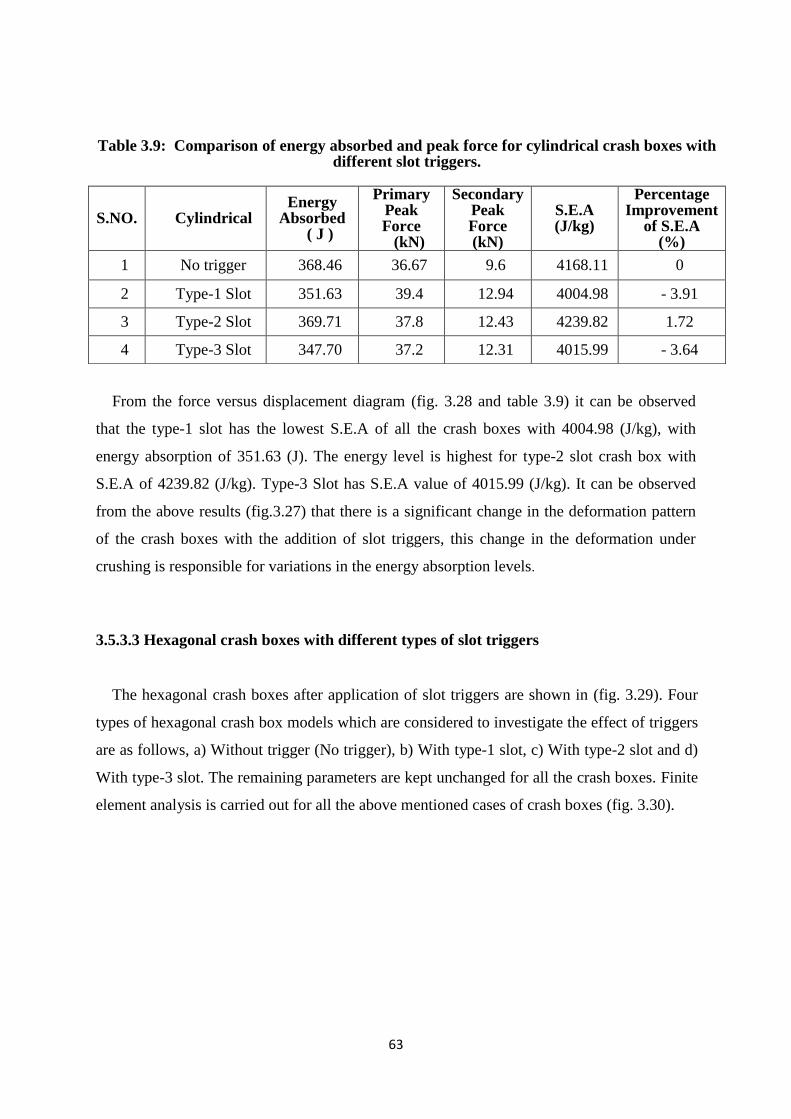
63
From the force versus displacement diagram (fig. 3.28 and table 3.9) it can be observed
that the type-1 slot has the lowest S.E.A of all the crash boxes with 4004.98 (J/kg), with
energy absorption of 351.63 (J). The energy level is highest for type-2 slot crash box with
S.E.A of 4239.82 (J/kg). Type-3 Slot has S.E.A value of 4015.99 (J/kg). It can be observed
from the above results (fig.3.27) that there is a significant change in the deformation pattern
of the crash boxes with the addition of slot triggers, this change in the deformation under
crushing is responsible for variations in the energy absorption levels.
3.5.3.3 Hexagonal crash boxes with different types of slot triggers
The hexagonal crash boxes after application of slot triggers are shown in (fig. 3.29). Four
types of hexagonal crash box models which are considered to investigate the effect of triggers
are as follows, a) Without trigger (No trigger), b) With type-1 slot, c) With type-2 slot and d)
With type-3 slot. The remaining parameters are kept unchanged for all the crash boxes. Finite
element analysis is carried out for all the above mentioned cases of crash boxes (fig. 3.30).
Table 3.9: Comparison of energy absorbed and peak force for cylindrical crash boxes with different slot triggers.
S.NO. Cylindrical Energy
Absorbed ( J )
Primary Peak Force
(kN)
Secondary Peak Force (kN)
S.E.A (J/kg)
Percentage Improvement
of S.E.A (%)
1 No trigger 368.46 36.67 9.6 4168.11 0
2 Type-1 Slot 351.63 39.4 12.94 4004.98 - 3.91
3 Type-2 Slot 369.71 37.8 12.43 4239.82 1.72
4 Type-3 Slot 347.70 37.2 12.31 4015.99 - 3.64
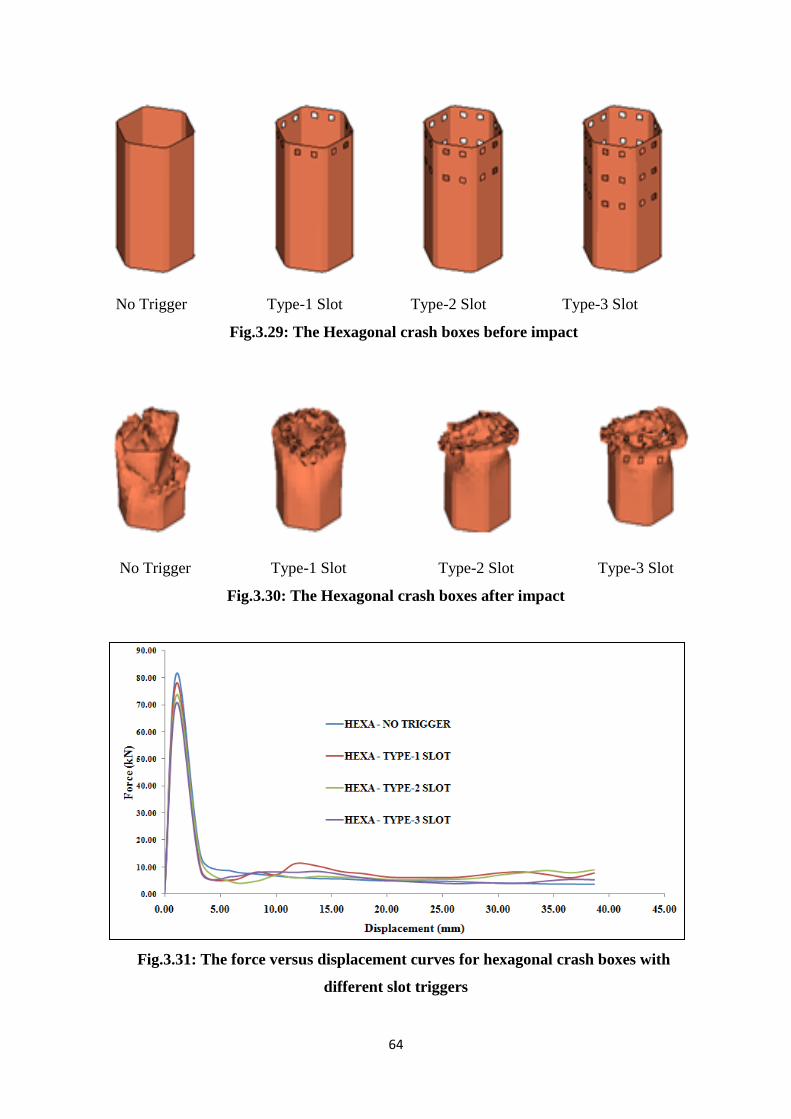
64
No Trigger Type-1 Slot Type-2 Slot Type-3 Slot
Fig.3.29: The Hexagonal crash boxes before impact
No Trigger Type-1 Slot Type-2 Slot Type-3 Slot
Fig.3.30: The Hexagonal crash boxes after impact
Fig.3.31: The force versus displacement curves for hexagonal crash boxes with
different slot triggers
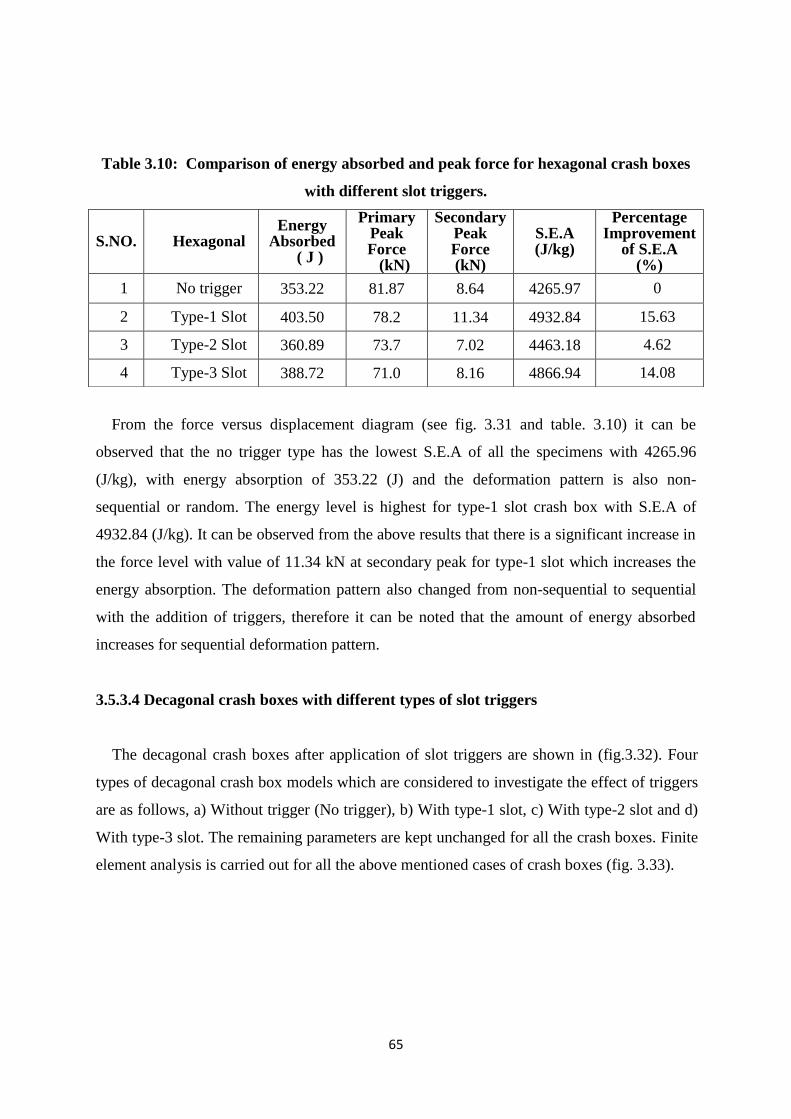
65
From the force versus displacement diagram (see fig. 3.31 and table. 3.10) it can be
observed that the no trigger type has the lowest S.E.A of all the specimens with 4265.96
(J/kg), with energy absorption of 353.22 (J) and the deformation pattern is also non-
sequential or random. The energy level is highest for type-1 slot crash box with S.E.A of
4932.84 (J/kg). It can be observed from the above results that there is a significant increase in
the force level with value of 11.34 kN at secondary peak for type-1 slot which increases the
energy absorption. The deformation pattern also changed from non-sequential to sequential
with the addition of triggers, therefore it can be noted that the amount of energy absorbed
increases for sequential deformation pattern.
3.5.3.4 Decagonal crash boxes with different types of slot triggers
The decagonal crash boxes after application of slot triggers are shown in (fig.3.32). Four
types of decagonal crash box models which are considered to investigate the effect of triggers
are as follows, a) Without trigger (No trigger), b) With type-1 slot, c) With type-2 slot and d)
With type-3 slot. The remaining parameters are kept unchanged for all the crash boxes. Finite
element analysis is carried out for all the above mentioned cases of crash boxes (fig. 3.33).
Table 3.10: Comparison of energy absorbed and peak force for hexagonal crash boxes
with different slot triggers.
S.NO. Hexagonal Energy
Absorbed ( J )
Primary Peak Force
(kN)
Secondary Peak Force (kN)
S.E.A (J/kg)
Percentage Improvement
of S.E.A (%)
1 No trigger 353.22 81.87 8.64 4265.97 0
2 Type-1 Slot 403.50 78.2 11.34 4932.84 15.63
3 Type-2 Slot 360.89 73.7 7.02 4463.18 4.62
4 Type-3 Slot 388.72 71.0 8.16 4866.94 14.08
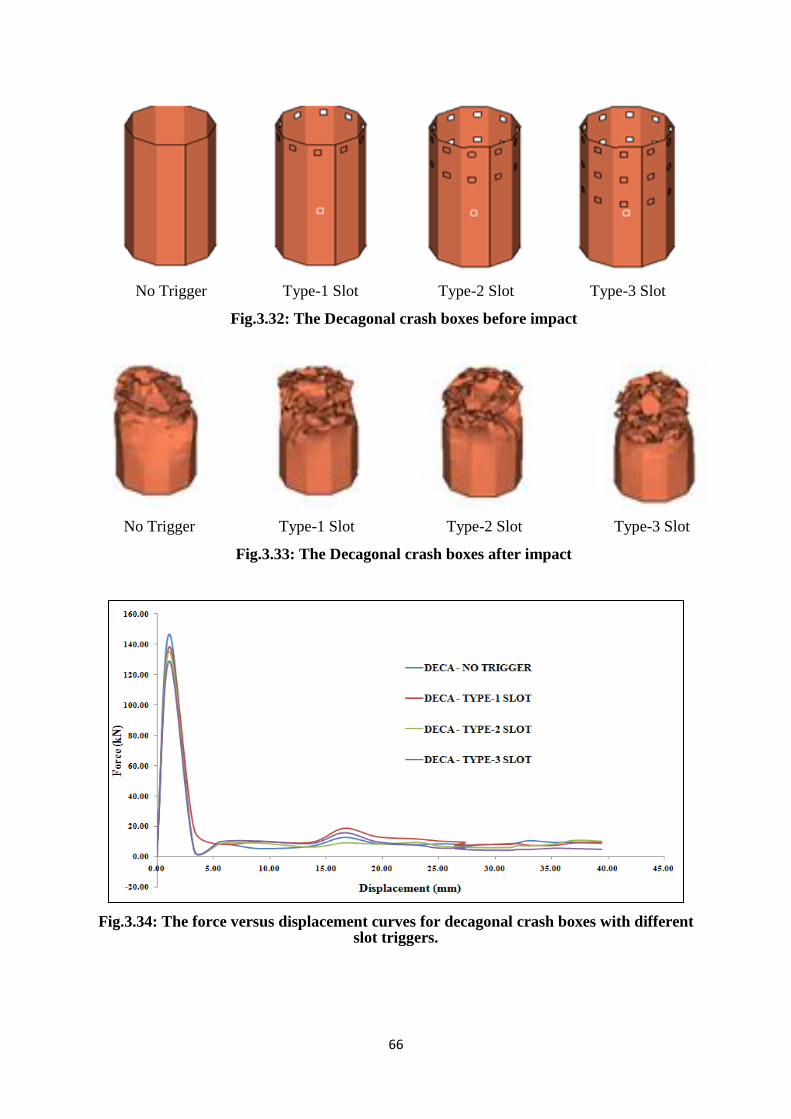
66
No Trigger Type-1 Slot Type-2 Slot Type-3 Slot
Fig.3.32: The Decagonal crash boxes before impact
No Trigger Type-1 Slot Type-2 Slot Type-3 Slot
Fig.3.33: The Decagonal crash boxes after impact
Fig.3.34: The force versus displacement curves for decagonal crash boxes with different slot triggers.
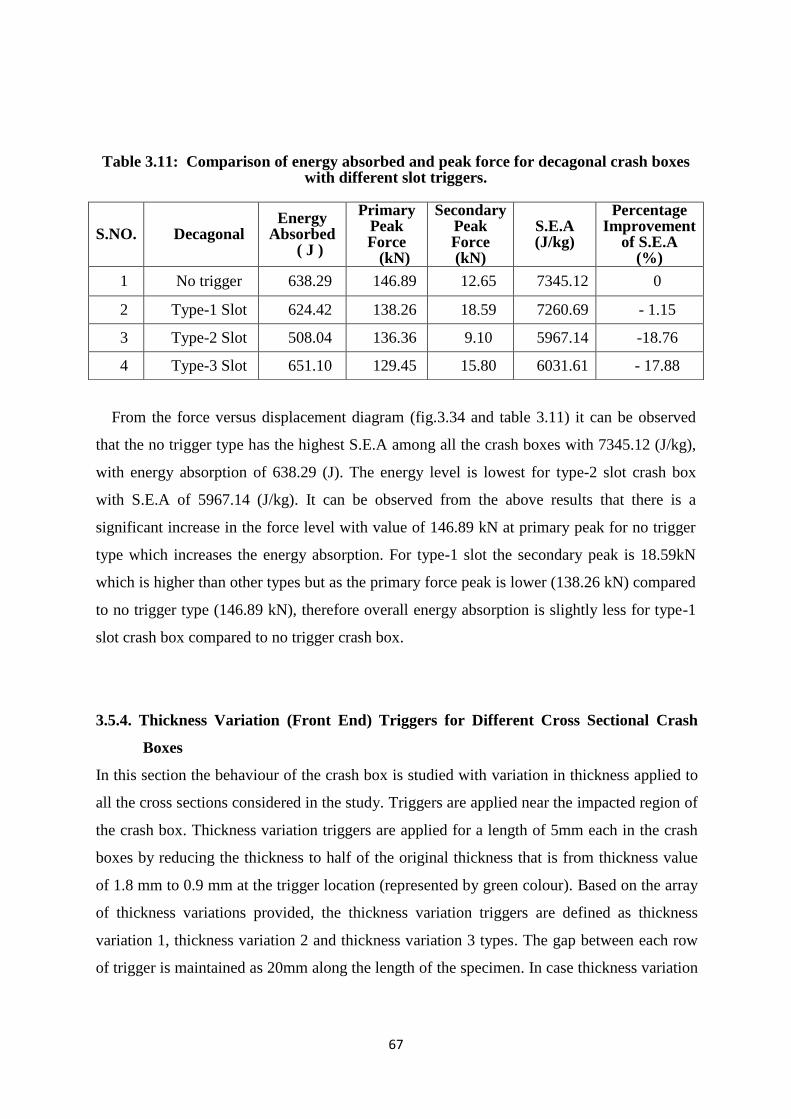
67
From the force versus displacement diagram (fig.3.34 and table 3.11) it can be observed
that the no trigger type has the highest S.E.A among all the crash boxes with 7345.12 (J/kg),
with energy absorption of 638.29 (J). The energy level is lowest for type-2 slot crash box
with S.E.A of 5967.14 (J/kg). It can be observed from the above results that there is a
significant increase in the force level with value of 146.89 kN at primary peak for no trigger
type which increases the energy absorption. For type-1 slot the secondary peak is 18.59kN
which is higher than other types but as the primary force peak is lower (138.26 kN) compared
to no trigger type (146.89 kN), therefore overall energy absorption is slightly less for type-1
slot crash box compared to no trigger crash box.
3.5.4. Thickness Variation (Front End) Triggers for Different Cross Sectional Crash
Boxes
In this section the behaviour of the crash box is studied with variation in thickness applied to
all the cross sections considered in the study. Triggers are applied near the impacted region of
the crash box. Thickness variation triggers are applied for a length of 5mm each in the crash
boxes by reducing the thickness to half of the original thickness that is from thickness value
of 1.8 mm to 0.9 mm at the trigger location (represented by green colour). Based on the array
of thickness variations provided, the thickness variation triggers are defined as thickness
variation 1, thickness variation 2 and thickness variation 3 types. The gap between each row
of trigger is maintained as 20mm along the length of the specimen. In case thickness variation
Table 3.11: Comparison of energy absorbed and peak force for decagonal crash boxes with different slot triggers.
S.NO. Decagonal Energy
Absorbed ( J )
Primary Peak Force
(kN)
Secondary Peak Force (kN)
S.E.A (J/kg)
Percentage Improvement
of S.E.A (%)
1 No trigger 638.29 146.89 12.65 7345.12 0
2 Type-1 Slot 624.42 138.26 18.59 7260.69 - 1.15
3 Type-2 Slot 508.04 136.36 9.10 5967.14 -18.76
4 Type-3 Slot 651.10 129.45 15.80 6031.61 - 17.88
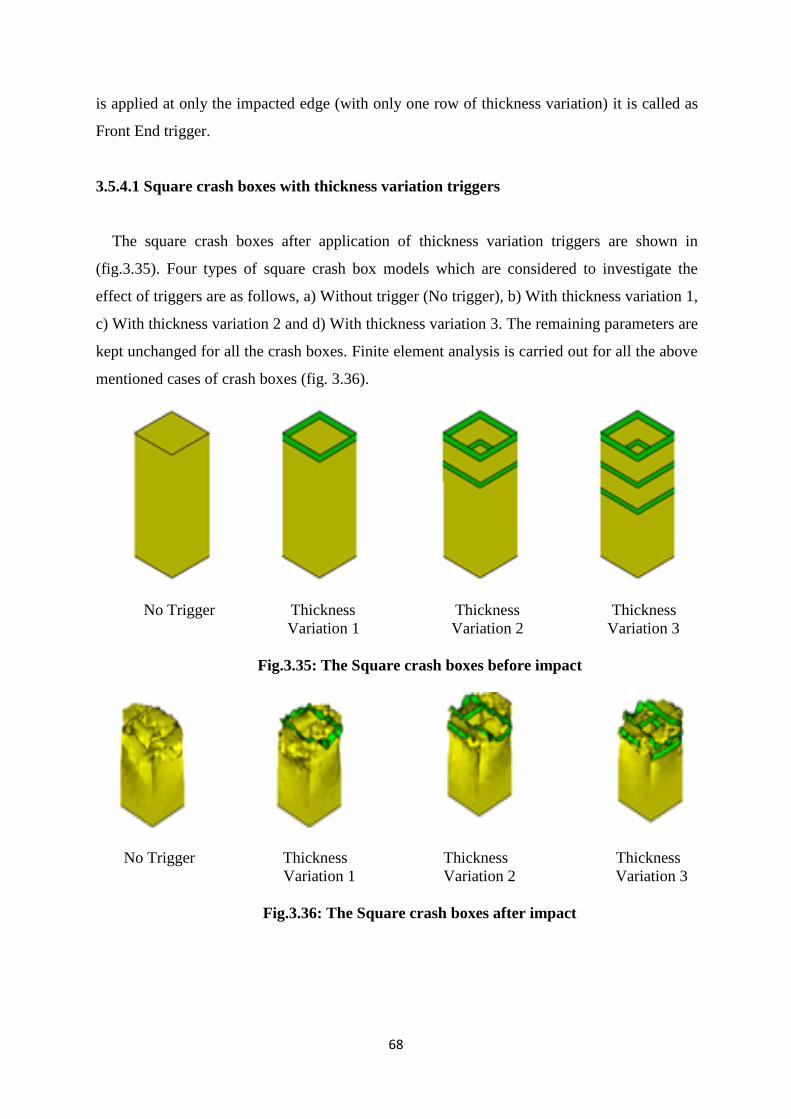
68
is applied at only the impacted edge (with only one row of thickness variation) it is called as
Front End trigger.
3.5.4.1 Square crash boxes with thickness variation triggers
The square crash boxes after application of thickness variation triggers are shown in
(fig.3.35). Four types of square crash box models which are considered to investigate the
effect of triggers are as follows, a) Without trigger (No trigger), b) With thickness variation 1,
c) With thickness variation 2 and d) With thickness variation 3. The remaining parameters are
kept unchanged for all the crash boxes. Finite element analysis is carried out for all the above
mentioned cases of crash boxes (fig. 3.36).
No Trigger Thickness Thickness Thickness
. Variation 1 Variation 2 Variation 3
Fig.3.35: The Square crash boxes before impact
No Trigger Thickness Thickness Thickness
. Variation 1 Variation 2 Variation 3
Fig.3.36: The Square crash boxes after impact
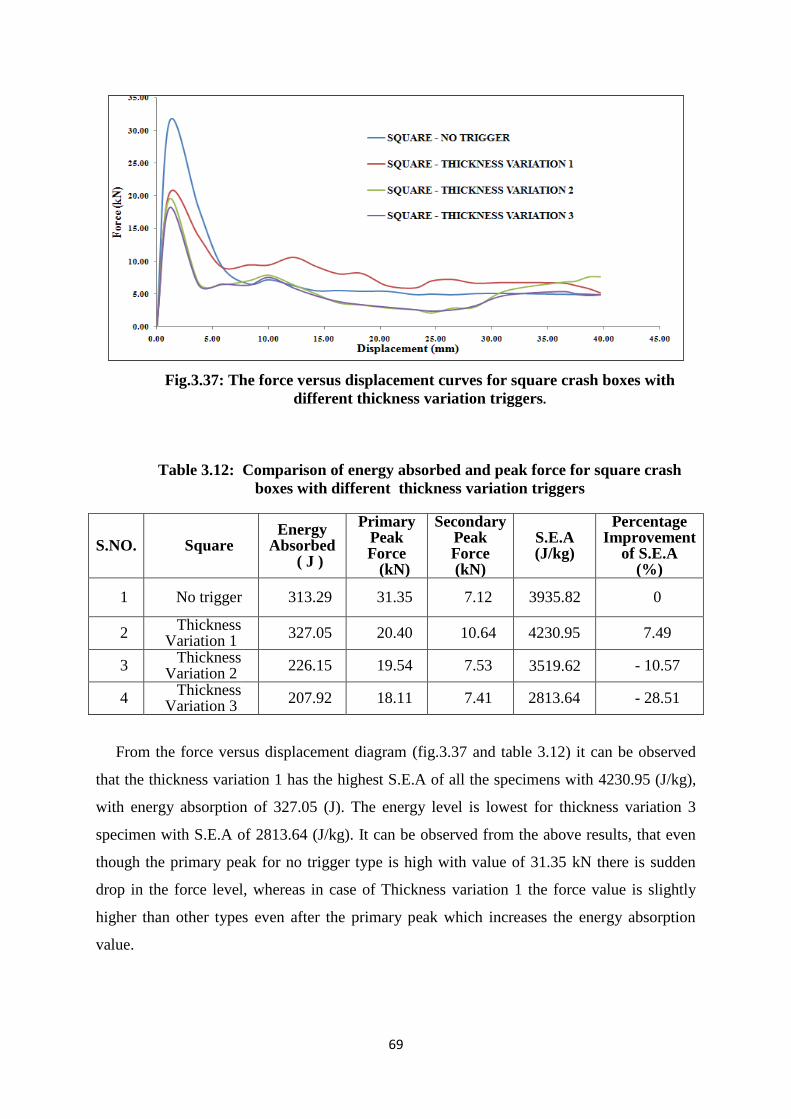
69
Fig.3.37: The force versus displacement curves for square crash boxes with
different thickness variation triggers.
From the force versus displacement diagram (fig.3.37 and table 3.12) it can be observed
that the thickness variation 1 has the highest S.E.A of all the specimens with 4230.95 (J/kg),
with energy absorption of 327.05 (J). The energy level is lowest for thickness variation 3
specimen with S.E.A of 2813.64 (J/kg). It can be observed from the above results, that even
though the primary peak for no trigger type is high with value of 31.35 kN there is sudden
drop in the force level, whereas in case of Thickness variation 1 the force value is slightly
higher than other types even after the primary peak which increases the energy absorption
value.
Table 3.12: Comparison of energy absorbed and peak force for square crash
boxes with different thickness variation triggers
S.NO. Square Energy
Absorbed ( J )
Primary Peak Force
(kN)
Secondary Peak Force (kN)
S.E.A (J/kg)
Percentage Improvement
of S.E.A (%)
1 No trigger 313.29 31.35 7.12 3935.82 0
2 Thickness
Variation 1 327.05 20.40 10.64 4230.95 7.49
3 Thickness
Variation 2 226.15 19.54 7.53 3519.62 - 10.57
4 Thickness
Variation 3 207.92 18.11 7.41 2813.64 - 28.51

70
3.5.4.2 Cylindrical crash boxes with thickness variation triggers
The cylindrical crash boxes after application of thickness variation triggers are shown in
(fig.3.38). Four types of cylindrical crash box models which are considered to investigate the
effect of triggers are as follows, a) Without trigger (No trigger), b) With thickness variation 1,
c) With thickness variation 2 and d) With thickness variation 3. The remaining parameters are
kept unchanged for all the crash boxes. Finite element analysis is carried out for all the above
mentioned cases of crash boxes (fig. 3.39).
No Trigger Thickness Thickness Thickness
. Variation 1 Variation 2 Variation 3
Fig.3.38: The Cylindrical crash boxes before impact
No Trigger Thickness Thickness Thickness
. Variation 1 Variation 2 Variation 3
Fig.3.39: The Cylindrical crash boxes after impact
71
From the F-D diagram (fig.3.40 and table 3.13) it can be observed that the No Trigger
type has the highest S.E.A with value of 4168.11 (J/kg) with energy absorption of 368.46 J
whereas the lowest is for Thickness Variation 2 with S.E.A value of 3275.41 (J/kg). From the
Force versus Displacement graph, it can be observed that the force level for No Trigger type
is maximum at primary peak with value of 36.67 kN and the force level drop is gradual
compared to other types which increases the area under the F-D curve hence the energy is
also increased.
Fig.3.40: The force versus displacement curves for cylindrical crash boxes with different
thickness variation triggers.
Table 3.13 Comparison of energy absorbed and peak force for cylindrical crash
boxes with different thickness variation triggers
S.NO. Cylindrical Energy
Absorbed ( J )
Primary Peak Force
(kN)
Secondary Peak Force (kN)
S.E.A (J/kg)
Percentage Improvement
of S.E.A (%)
1 No trigger 368.46 36.67 9.6 4168.11 0
2 Thickness
Variation 1 342.57 37.43 19.88 3960.40 - 4.98
3 Thickness
Variation 2 272.41 36.14 13.27 3215.84 - 22.84
4 Thickness
Variation 3 271.63 33.9 13.14 3275.41 - 21.41

72
3.5.4.3 Hexagonal crash boxes with thickness variation triggers
The hexagonal crash boxes after application of thickness variation triggers are shown in
(fig.3.41). Four types of hexagonal crash box models which are considered to investigate the
effect of triggers are as follows, a) Without trigger (No trigger), b) With thickness variation 1,
c) With thickness variation 2 and d) With thickness variation 3. The remaining parameters are
kept unchanged for all the crash boxes. Finite element analysis is carried out for all the above
mentioned cases of crash boxes (fig. 3.42).
No Trigger Thickness Thickness Thickness
. Variation 1 Variation 2 Variation 3
Fig.3.41: The hexagonal crash boxes before impact
No Trigger Thickness Thickness Thickness
. Variation 1 Variation 2 Variation 3
Fig.3.42: The hexagonal crash boxes after impact

73
Fig.3.43: The force versus displacement curves for hexagonal crash boxes with
different thickness variation triggers.
From the F-D diagram (fig.3.43 and table 3.14) it can be observed that the Thickness
Variation 1 has the highest S.E.A with value of 5340.51 (J/kg) with energy absorption of
432.58 J whereas the lowest is for Thickness Variation 2 with S.E.A value of 4056.04 (J/kg).
From the F vs. D graph, it can be observed that the force level for Thickness Variation 1 at
secondary peak is higher compared to other types with value of 17.17 kN and the force level
drop is gradual compared to other types which increases the area under the F-D curve hence
the energy is also increased. Thickness Variation 1 displays a unique behaviour where the
crash box side wall gets teared after the application of this trigger (fig.3.42).
Table 3.14: Comparison of energy absorbed and peak force for hexagonal crash
boxes with different thickness variation triggers
S.NO. Hexagonal Energy
Absorbed ( J )
Primary Peak Force
(kN)
Secondary Peak Force (kN)
S.E.A (J/kg)
Percentage Improvement
of S.E.A (%)
1 No trigger 353.222 81.87 8.64 4265.97 0
2 Thickness
Variation 1 432.58 60.15 17.70 5340.51 25.18
3 Thickness
Variation 2 321.81 53.74 14.96 4056.05 - 4.92
4 Thickness
Variation 3 326.65 57.34 14.41 4207.25 - 1.38
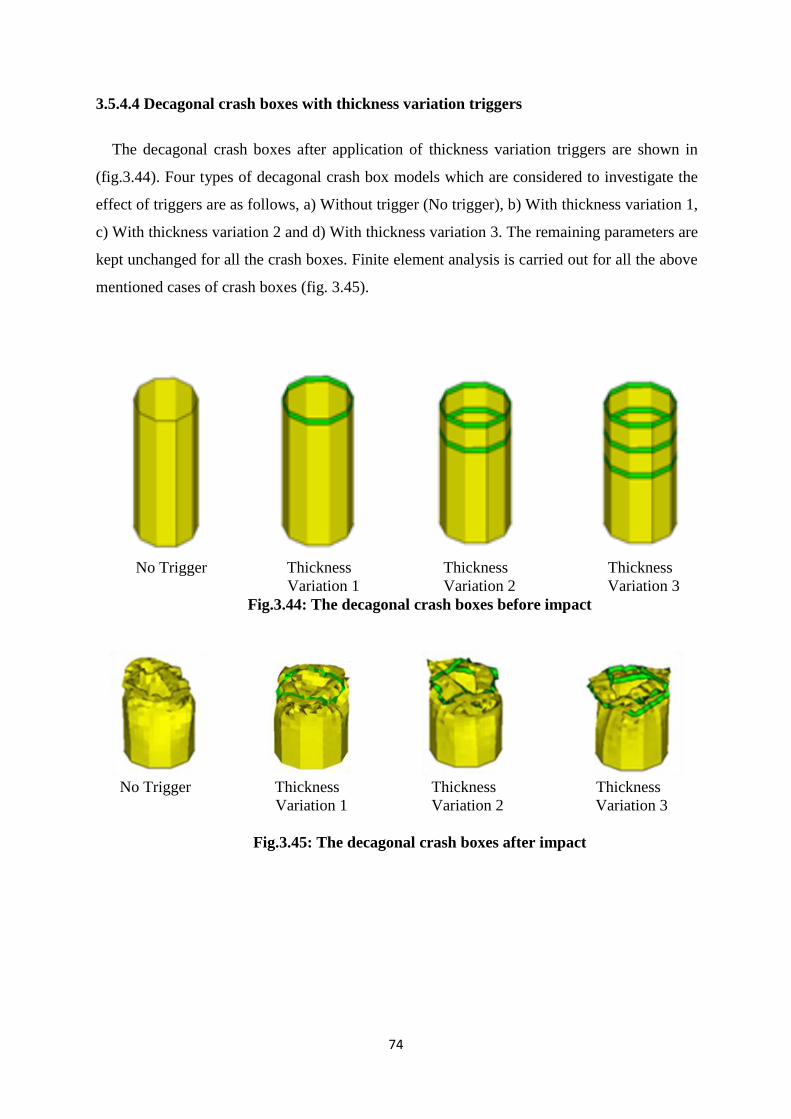
74
3.5.4.4 Decagonal crash boxes with thickness variation triggers
The decagonal crash boxes after application of thickness variation triggers are shown in
(fig.3.44). Four types of decagonal crash box models which are considered to investigate the
effect of triggers are as follows, a) Without trigger (No trigger), b) With thickness variation 1,
c) With thickness variation 2 and d) With thickness variation 3. The remaining parameters are
kept unchanged for all the crash boxes. Finite element analysis is carried out for all the above
mentioned cases of crash boxes (fig. 3.45).
No Trigger Thickness Thickness Thickness
. Variation 1 Variation 2 Variation 3
Fig.3.44: The decagonal crash boxes before impact
No Trigger Thickness Thickness Thickness
. Variation 1 Variation 2 Variation 3
Fig.3.45: The decagonal crash boxes after impact
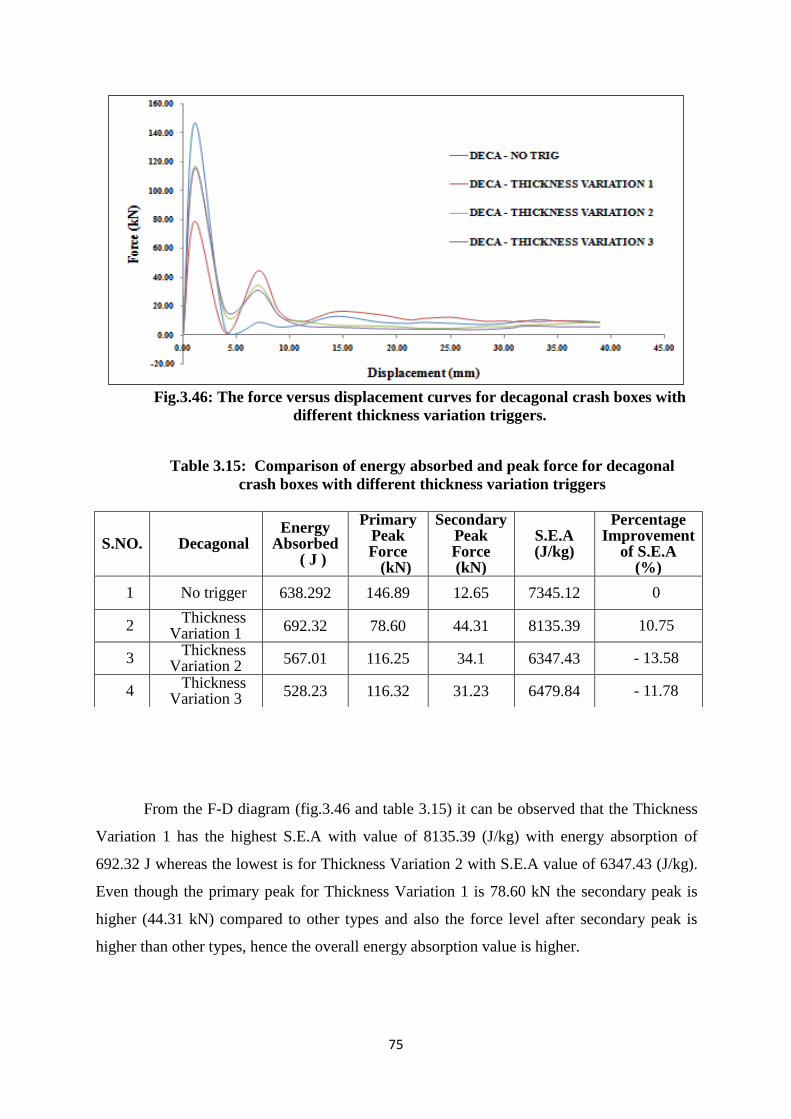
75
Fig.3.46: The force versus displacement curves for decagonal crash boxes with
different thickness variation triggers.
Table 3.15: Comparison of energy absorbed and peak force for decagonal
crash boxes with different thickness variation triggers
S.NO. Decagonal Energy
Absorbed ( J )
Primary Peak Force
(kN)
Secondary Peak Force (kN)
S.E.A (J/kg)
Percentage Improvement
of S.E.A (%)
1 No trigger 638.292 146.89 12.65 7345.12 0
2 Thickness
Variation 1 692.32 78.60 44.31 8135.39 10.75
3 Thickness
Variation 2 567.01 116.25 34.1 6347.43 - 13.58
4 Thickness
Variation 3 528.23 116.32 31.23 6479.84 - 11.78
From the F-D diagram (fig.3.46 and table 3.15) it can be observed that the Thickness
Variation 1 has the highest S.E.A with value of 8135.39 (J/kg) with energy absorption of
692.32 J whereas the lowest is for Thickness Variation 2 with S.E.A value of 6347.43 (J/kg).
Even though the primary peak for Thickness Variation 1 is 78.60 kN the secondary peak is
higher (44.31 kN) compared to other types and also the force level after secondary peak is
higher than other types, hence the overall energy absorption value is higher.
76
3.6 Comparative Analysis of Crashworthiness of GFRP crash boxes
In this section crashworthiness behaviour of the GFRP crash box made of various
geometries and trigger types is summarized and then discussed in a comparative manner so
that a clear picture of the effectiveness of geometrical cross section as well as the trigger
configuration can be obtained. The results of numerical simulation were used for presenting
the results in a comparative as well as consolidated manner for an overall view of the various
combinations of crash box geometries and trigger types used in this study.
3.6.1 Consolidated results for each type of geometry used for crash boxes
(a) Square Crash Boxes
From table 3.16 it is observed that for square cross-sectional crash boxes the trigger
types Trigger-B, Type-1 Slot, Thickness Variation 1 and trigger-C are helpful for increasing
the S.E.A values compared to the crash box without trigger. Whereas the trigger types
Trigger-A, Type-2 Slot, Type-3 Slot, Thickness Variation 2 and Thickness Variation 3 have
Table 3.16: Comparison of energy absorbed and peak force for square crash boxes
with various types of triggers
S.NO. Square Energy
Absorbed ( J )
Primary Peak Force
(kN)
Secondary Peak Force (kN)
S.E.A (J/kg)
Percentage Improvement
of S.E.A (%)
1 No trigger 313.29 31.35 7.12 3935.82 0
2 Trigger-A 272.12 22.75 8.59 3437.59 - 5.1
3 Trigger-B 415.91 20.38 8.60 5109.45 29.8
4 Trigger-C 451.24 16.78 10.22 5584.65 41.20
5 Type-1 Slot 341.71 24.71 8.05 4375.36 11.16
6 Type-2 Slot 296.82 24.32 7.82 3790.34 - 3.69
7 Type-3 Slot 299.41 24.23 7.41 3856.94 - 2.00
8 Thickness
Variation 1 327.05 20.40 10.64 4230.95 7.49
9 Thickness
Variation 2 226.15 19.54 7.53 3519.62 - 10.57
10 Thickness
Variation 3 207.92 18.11 7.41 2813.64 - 28.51
77
a negative effect in which the S.E.A value is reduced compared to the crash box without
trigger. The most suitable trigger type for square crash boxes is trigger-C as it helps in
achieving a huge 41.20 percentage increase in the S.E.A with a value of 5584.65 (J/kg). It
can also be seen that the thickness variation 3 type of trigger is most unsuitable for square
crash boxes as it reduces the S.E.A by 28.51 percentage with a value of 2813.64 (J/kg).
(b) Cylindrical crash boxes
From table 3.17 it is observed that for cylindrical cross-sectional crash boxes the
trigger types Trigger-A, Trigger-B, Trigger-C and Type-2 Slot are helpful for increasing the
S.E.A values compared to the crash box without trigger. Whereas the trigger types Type-1
Slot, Type-3 Slot, Thickness Variation 1, Thickness Variation 2 and Thickness Variation 3
have a negative effect in which the S.E.A value is reduced compared to the crash box without
trigger. The most suitable trigger type for cylindrical crash boxes is trigger-B as it helps in
achieving a 35.45 percentage increase in the S.E.A with a value of 5646.12 (J/kg). It can also
be seen that the thickness variation 2 type of trigger is most unsuitable for cylindrical crash
Table 3.17: Comparison of energy absorbed and peak force for cylindrical crash boxes
with various types of triggers
S.NO. Cylindrical Energy
Absorbed ( J )
Primary Peak Force
(kN)
Secondary Peak Force (kN)
S.E.A (J/kg)
Percentage Improvement
of S.E.A (%)
1 No trigger 368.46 36.67 9.61 4168.11 0
2 Trigger-A 408.52 39.65 11.36 4647.58 11.51
3 Trigger-B 512.66 23.46 26.87 5646.12 35.45
4 Trigger-C 462.27 15.65 16.29 5125.02 22.95
5 Type-1 Slot 351.63 39.4 12.94 4004.98 - 3.91
6 Type-2 Slot 369.71 37.8 12.43 4239.82 1.72
7 Type-3 Slot 347.70 37.2 12.31 4015.99 - 3.64
8 Thickness
Variation 1 342.57 37.43 19.88 3960.40 - 4.98
9 Thickness
Variation 2 272.41 36.14 13.27 3215.84 - 22.84
10 Thickness
Variation 3 271.63 33.9 13.14 3275.41 - 21.41
78
boxes as it reduces the S.E.A by 22.84 percentage with a value of 3215.84 (J/kg).
(c) Hexagonal crash boxes
From table 3.18 it is observed that for hexagonal cross-sectional crash boxes the
trigger types Trigger-A, Trigger-B, Trigger-C, Type-1 Slot, Type-2 Slot, Type-3 Slot and
Thickness Variation 1are helpful for increasing the S.E.A values compared to the crash box
without trigger. Whereas the trigger types Thickness Variation 2 and Thickness Variation 3
have a negative effect in which the S.E.A value is reduced compared to the crash box without
trigger. It is observed that for hexagonal cross-sectional crash boxes the most suitable trigger
type is trigger-A as it helps in achieving a 37.93 percentage increase in the S.E.A with a value
of 5884.13 (J/kg). It can also be seen that the thickness variation 2 type of trigger is most
unsuitable for hexagonal crash boxes as it reduces the S.E.A by 4.92 percentage with a value
of 4056.05(J/kg).
Table 3.18: Comparison of energy absorbed and peak force for hexagonal crash boxes
with various types of triggers
S.NO. Hexagonal Energy
Absorbed ( J )
Primary Peak Force
(kN)
Secondary Peak Force (kN)
S.E.A (J/kg)
Percentage Improvement
of S.E.A (%)
1 No trigger 353.22 81.87 8.64 4265.97 0
2 Trigger-A 485.32 80.57 11.44 5884.13 37.93
3 Trigger-B 443.31 15.62 14.4 5268.79 23.51
4 Trigger-C 463.09 12.16 12.23 5529.52 29.62
5 Type-1 Slot 403.50 78.2 11.34 4932.84 15.63
6 Type-2 Slot 360.89 73.7 7.02 4463.18 4.62
7 Type-3 Slot 388.72 71.0 8.16 4866.94 14.08
8 Thickness
Variation 1 432.58 60.15 17.70 5340.51 25.18
9 Thickness
Variation 2 321.81 53.74 14.96 4056.05 - 4.92
10 Thickness
Variation 3 326.65 57.34 14.41 4207.25 - 1.38
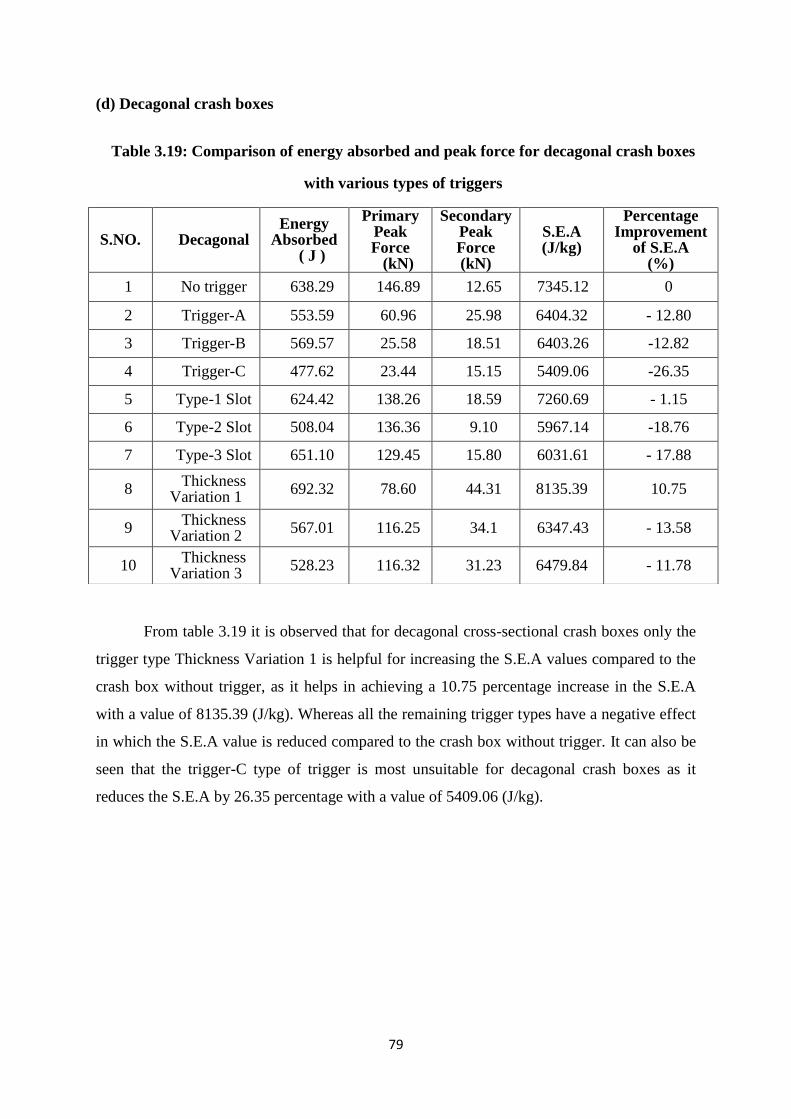
79
(d) Decagonal crash boxes
From table 3.19 it is observed that for decagonal cross-sectional crash boxes only the
trigger type Thickness Variation 1 is helpful for increasing the S.E.A values compared to the
crash box without trigger, as it helps in achieving a 10.75 percentage increase in the S.E.A
with a value of 8135.39 (J/kg). Whereas all the remaining trigger types have a negative effect
in which the S.E.A value is reduced compared to the crash box without trigger. It can also be
seen that the trigger-C type of trigger is most unsuitable for decagonal crash boxes as it
reduces the S.E.A by 26.35 percentage with a value of 5409.06 (J/kg).
Table 3.19: Comparison of energy absorbed and peak force for decagonal crash boxes
with various types of triggers
S.NO. Decagonal Energy
Absorbed ( J )
Primary Peak Force
(kN)
Secondary Peak Force (kN)
S.E.A (J/kg)
Percentage Improvement
of S.E.A (%)
1 No trigger 638.29 146.89 12.65 7345.12 0
2 Trigger-A 553.59 60.96 25.98 6404.32 - 12.80
3 Trigger-B 569.57 25.58 18.51 6403.26 -12.82
4 Trigger-C 477.62 23.44 15.15 5409.06 -26.35
5 Type-1 Slot 624.42 138.26 18.59 7260.69 - 1.15
6 Type-2 Slot 508.04 136.36 9.10 5967.14 -18.76
7 Type-3 Slot 651.10 129.45 15.80 6031.61 - 17.88
8 Thickness
Variation 1 692.32 78.60 44.31 8135.39 10.75
9 Thickness
Variation 2 567.01 116.25 34.1 6347.43 - 13.58
10 Thickness
Variation 3 528.23 116.32 31.23 6479.84 - 11.78
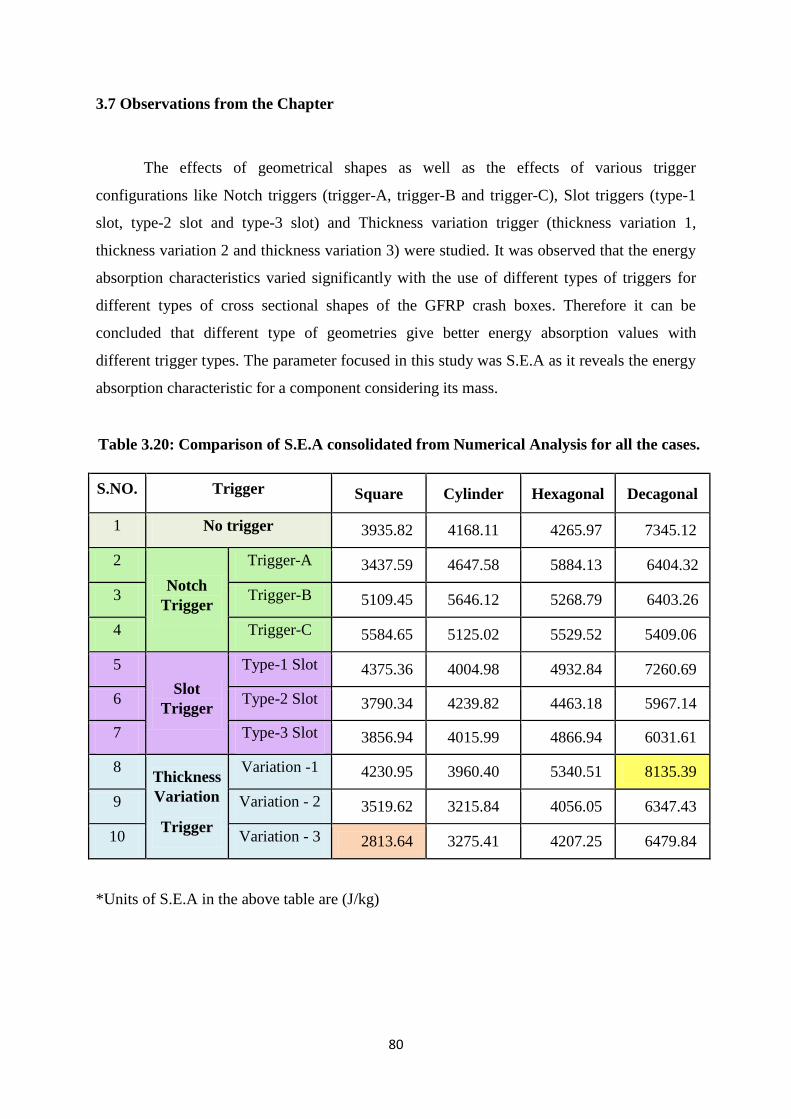
80
3.7 Observations from the Chapter
The effects of geometrical shapes as well as the effects of various trigger
configurations like Notch triggers (trigger-A, trigger-B and trigger-C), Slot triggers (type-1
slot, type-2 slot and type-3 slot) and Thickness variation trigger (thickness variation 1,
thickness variation 2 and thickness variation 3) were studied. It was observed that the energy
absorption characteristics varied significantly with the use of different types of triggers for
different types of cross sectional shapes of the GFRP crash boxes. Therefore it can be
concluded that different type of geometries give better energy absorption values with
different trigger types. The parameter focused in this study was S.E.A as it reveals the energy
absorption characteristic for a component considering its mass.
Table 3.20: Comparison of S.E.A consolidated from Numerical Analysis for all the cases.
S.NO. Trigger Square Cylinder Hexagonal Decagonal
1 No trigger 3935.82 4168.11 4265.97 7345.12
2
Notch
Trigger
Trigger-A 3437.59 4647.58 5884.13 6404.32
3 Trigger-B 5109.45 5646.12 5268.79 6403.26
4 Trigger-C 5584.65 5125.02 5529.52 5409.06
5
Slot
Trigger
Type-1 Slot 4375.36 4004.98 4932.84 7260.69
6 Type-2 Slot 3790.34 4239.82 4463.18 5967.14
7 Type-3 Slot 3856.94 4015.99 4866.94 6031.61
8 Thickness
Variation
Trigger
Variation -1 4230.95 3960.40 5340.51 8135.39
9 Variation - 2 3519.62 3215.84 4056.05 6347.43
10 Variation - 3 2813.64 3275.41 4207.25 6479.84
*Units of S.E.A in the above table are (J/kg)
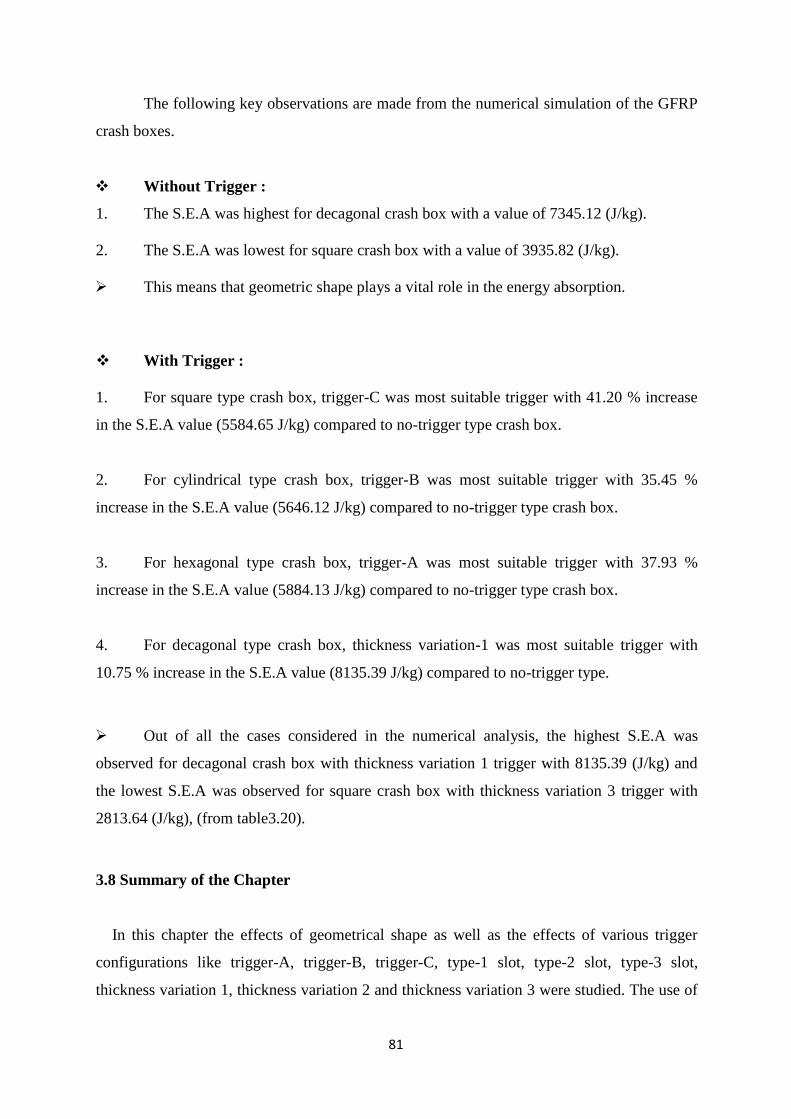
81
The following key observations are made from the numerical simulation of the GFRP
crash boxes.
Without Trigger :
1. The S.E.A was highest for decagonal crash box with a value of 7345.12 (J/kg).
2. The S.E.A was lowest for square crash box with a value of 3935.82 (J/kg).
This means that geometric shape plays a vital role in the energy absorption.
With Trigger :
1. For square type crash box, trigger-C was most suitable trigger with 41.20 % increase
in the S.E.A value (5584.65 J/kg) compared to no-trigger type crash box.
2. For cylindrical type crash box, trigger-B was most suitable trigger with 35.45 %
increase in the S.E.A value (5646.12 J/kg) compared to no-trigger type crash box.
3. For hexagonal type crash box, trigger-A was most suitable trigger with 37.93 %
increase in the S.E.A value (5884.13 J/kg) compared to no-trigger type crash box.
4. For decagonal type crash box, thickness variation-1 was most suitable trigger with
10.75 % increase in the S.E.A value (8135.39 J/kg) compared to no-trigger type.
Out of all the cases considered in the numerical analysis, the highest S.E.A was
observed for decagonal crash box with thickness variation 1 trigger with 8135.39 (J/kg) and
the lowest S.E.A was observed for square crash box with thickness variation 3 trigger with
2813.64 (J/kg), (from table3.20).
3.8 Summary of the Chapter
In this chapter the effects of geometrical shape as well as the effects of various trigger
configurations like trigger-A, trigger-B, trigger-C, type-1 slot, type-2 slot, type-3 slot,
thickness variation 1, thickness variation 2 and thickness variation 3 were studied. The use of
82
proper combination of geometry and trigger type plays a vital role in achieving desired level
of force and energy. It can also be noted that the deformation mode also varied significantly
with the use of different types of triggers. But the use of triggers depends mainly on the
feasibility of practically implementing the triggers in the manufacturing process. Therefore,
main factor obstructing the usage of triggers is the ease of manufacturing them considering
the manufacturing technique, cost incurred in manufacturing, skill of labour, type of
machinery and damage caused to the specimen while trigger is being applied to the specimen.
Thus, even though some triggers are efficient, the difficulty in practically manufacturing or
implementing them limits their usage. One such example is that manufacturing of trigger-A,
trigger-B and trigger-C is complex and requires special manufacturing equipment. Whereas,
for the application of type-2 slot, type-3 slot, thickness variation 2 and thickness variation 3,
special methods are required as there is possibility of damage to specimen during the
application of these triggers. These difficulties can be overcome at industrial manufacturing
level where there is feasibility of procuring advanced machinery and implementing skilled
labour and manufacturing techniques.
As far as specimen manufacturing is considered hand layup is most preferred technique as
it is simple and cost effective. The specimens like crash boxes without trigger (all shapes –
square, cylindrical, hexagonal and decagonal) can be made using hand lay-up process. For
trigger configuration specimens, type-1 slot and thickness variation-1, type of triggers can be
manufactured for all shapes of crash boxes – square, cylindrical, hexagonal and decagonal
using hand layup process. Due to limitation of manufacturing complex triggers other type of
triggers are not feasible to manufacture by simple hand lay-up process.
Therefore, the crash boxes a) Without trigger (all shapes – square, cylindrical, hexagonal
and decagonal), b) With Type-1 slot trigger (all shapes – square, cylindrical, hexagonal and
decagonal) and c) With thickness variation-1 trigger (all shapes – square, cylindrical,
hexagonal and decagonal) are feasible to manufacture with simple hand lay-up technique for
specimen testing. The manufacturing of specimens required for experimental testing is
discussed in detail in the next chapter.
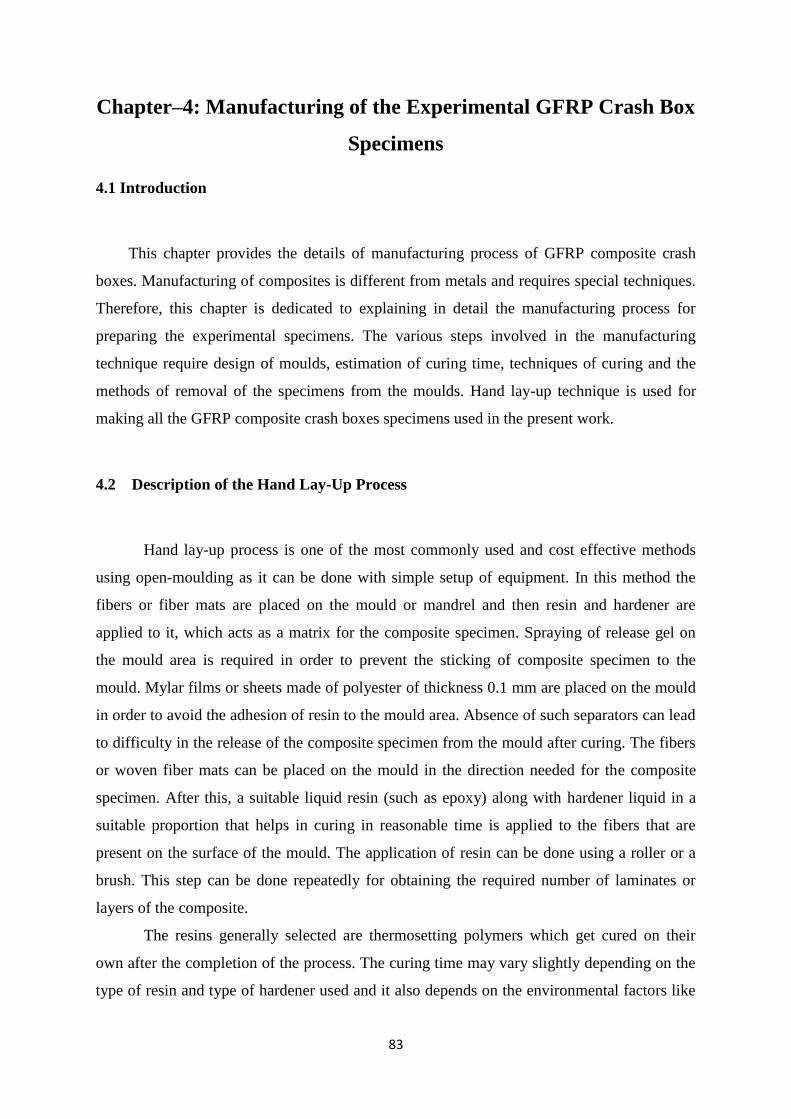
83
Chapter–4: Manufacturing of the Experimental GFRP Crash Box
Specimens
4.1 Introduction
This chapter provides the details of manufacturing process of GFRP composite crash
boxes. Manufacturing of composites is different from metals and requires special techniques.
Therefore, this chapter is dedicated to explaining in detail the manufacturing process for
preparing the experimental specimens. The various steps involved in the manufacturing
technique require design of moulds, estimation of curing time, techniques of curing and the
methods of removal of the specimens from the moulds. Hand lay-up technique is used for
making all the GFRP composite crash boxes specimens used in the present work.
4.2 Description of the Hand Lay-Up Process
Hand lay-up process is one of the most commonly used and cost effective methods
using open-moulding as it can be done with simple setup of equipment. In this method the
fibers or fiber mats are placed on the mould or mandrel and then resin and hardener are
applied to it, which acts as a matrix for the composite specimen. Spraying of release gel on
the mould area is required in order to prevent the sticking of composite specimen to the
mould. Mylar films or sheets made of polyester of thickness 0.1 mm are placed on the mould
in order to avoid the adhesion of resin to the mould area. Absence of such separators can lead
to difficulty in the release of the composite specimen from the mould after curing. The fibers
or woven fiber mats can be placed on the mould in the direction needed for the composite
specimen. After this, a suitable liquid resin (such as epoxy) along with hardener liquid in a
suitable proportion that helps in curing in reasonable time is applied to the fibers that are
present on the surface of the mould. The application of resin can be done using a roller or a
brush. This step can be done repeatedly for obtaining the required number of laminates or
layers of the composite.
The resins generally selected are thermosetting polymers which get cured on their
own after the completion of the process. The curing time may vary slightly depending on the
type of resin and type of hardener used and it also depends on the environmental factors like
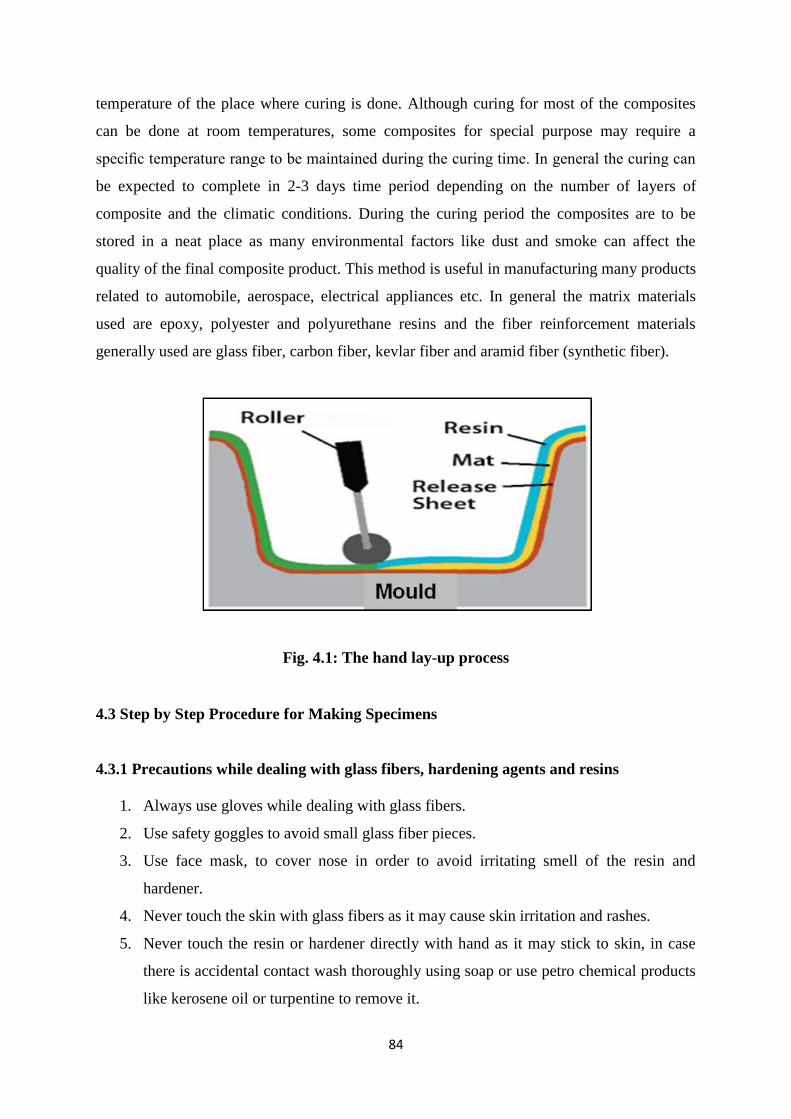
84
temperature of the place where curing is done. Although curing for most of the composites
can be done at room temperatures, some composites for special purpose may require a
specific temperature range to be maintained during the curing time. In general the curing can
be expected to complete in 2-3 days time period depending on the number of layers of
composite and the climatic conditions. During the curing period the composites are to be
stored in a neat place as many environmental factors like dust and smoke can affect the
quality of the final composite product. This method is useful in manufacturing many products
related to automobile, aerospace, electrical appliances etc. In general the matrix materials
used are epoxy, polyester and polyurethane resins and the fiber reinforcement materials
generally used are glass fiber, carbon fiber, kevlar fiber and aramid fiber (synthetic fiber).
Fig. 4.1: The hand lay-up process
4.3 Step by Step Procedure for Making Specimens
4.3.1 Precautions while dealing with glass fibers, hardening agents and resins
1. Always use gloves while dealing with glass fibers.
2. Use safety goggles to avoid small glass fiber pieces.
3. Use face mask, to cover nose in order to avoid irritating smell of the resin and
hardener.
4. Never touch the skin with glass fibers as it may cause skin irritation and rashes.
5. Never touch the resin or hardener directly with hand as it may stick to skin, in case
there is accidental contact wash thoroughly using soap or use petro chemical products
like kerosene oil or turpentine to remove it.
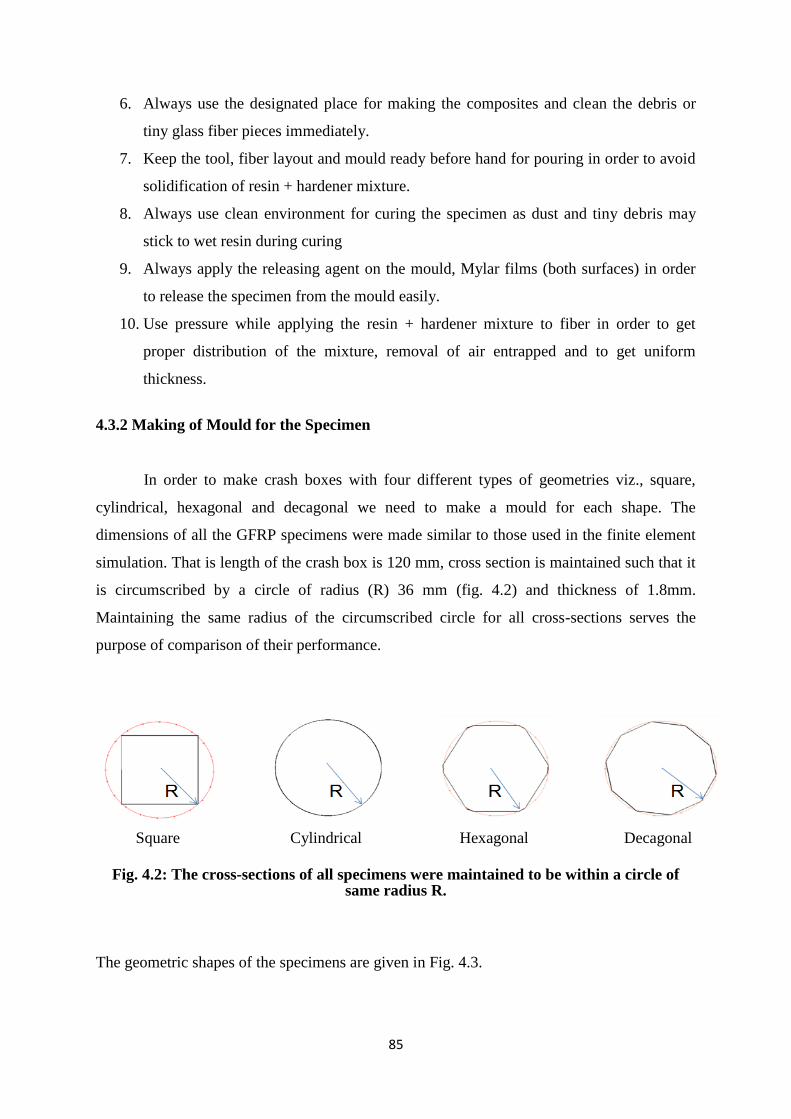
85
6. Always use the designated place for making the composites and clean the debris or
tiny glass fiber pieces immediately.
7. Keep the tool, fiber layout and mould ready before hand for pouring in order to avoid
solidification of resin + hardener mixture.
8. Always use clean environment for curing the specimen as dust and tiny debris may
stick to wet resin during curing
9. Always apply the releasing agent on the mould, Mylar films (both surfaces) in order
to release the specimen from the mould easily.
10. Use pressure while applying the resin + hardener mixture to fiber in order to get
proper distribution of the mixture, removal of air entrapped and to get uniform
thickness.
4.3.2 Making of Mould for the Specimen
In order to make crash boxes with four different types of geometries viz., square,
cylindrical, hexagonal and decagonal we need to make a mould for each shape. The
dimensions of all the GFRP specimens were made similar to those used in the finite element
simulation. That is length of the crash box is 120 mm, cross section is maintained such that it
is circumscribed by a circle of radius (R) 36 mm (fig. 4.2) and thickness of 1.8mm.
Maintaining the same radius of the circumscribed circle for all cross-sections serves the
purpose of comparison of their performance.
Square Cylindrical Hexagonal Decagonal
Fig. 4.2: The cross-sections of all specimens were maintained to be within a circle of same radius R.
The geometric shapes of the specimens are given in Fig. 4.3.
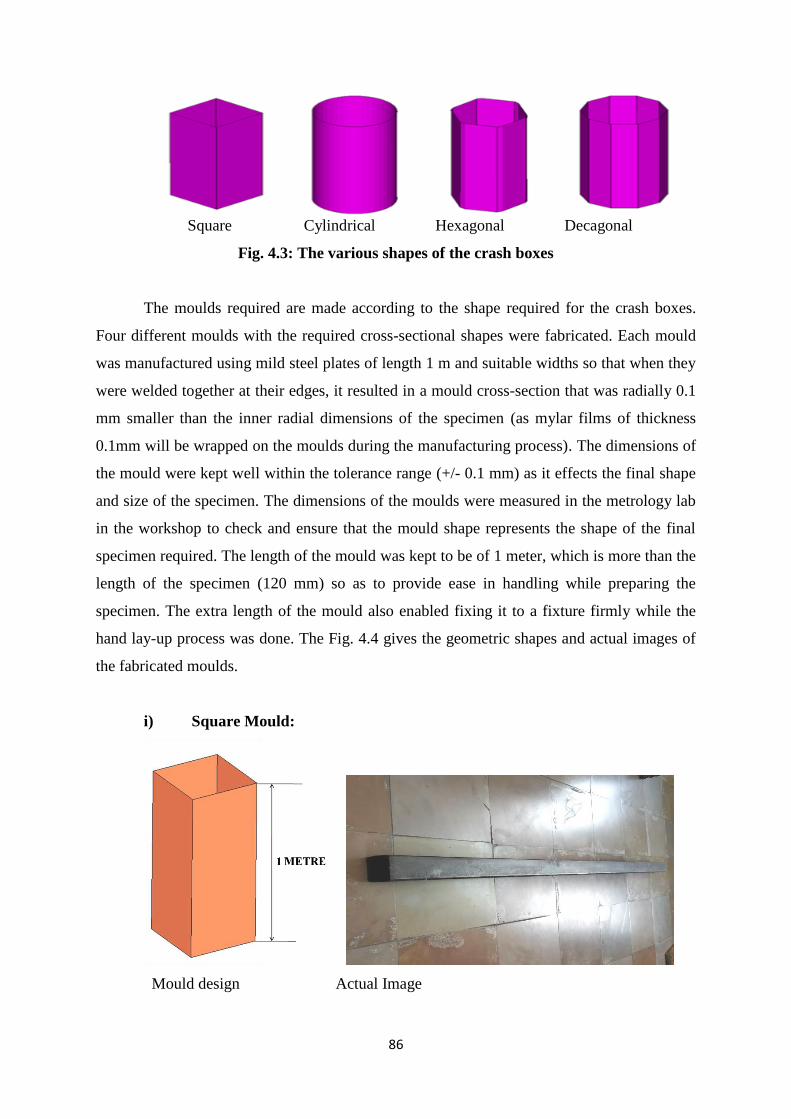
86
Square Cylindrical Hexagonal Decagonal
Fig. 4.3: The various shapes of the crash boxes
The moulds required are made according to the shape required for the crash boxes.
Four different moulds with the required cross-sectional shapes were fabricated. Each mould
was manufactured using mild steel plates of length 1 m and suitable widths so that when they
were welded together at their edges, it resulted in a mould cross-section that was radially 0.1
mm smaller than the inner radial dimensions of the specimen (as mylar films of thickness
0.1mm will be wrapped on the moulds during the manufacturing process). The dimensions of
the mould were kept well within the tolerance range (+/- 0.1 mm) as it effects the final shape
and size of the specimen. The dimensions of the moulds were measured in the metrology lab
in the workshop to check and ensure that the mould shape represents the shape of the final
specimen required. The length of the mould was kept to be of 1 meter, which is more than the
length of the specimen (120 mm) so as to provide ease in handling while preparing the
specimen. The extra length of the mould also enabled fixing it to a fixture firmly while the
hand lay-up process was done. The Fig. 4.4 gives the geometric shapes and actual images of
the fabricated moulds.
i) Square Mould:
Mould design Actual Image

87
ii) Cylindrical Mould:
Mould design Actual Image
iii) Hexagonal Mould:
Mould design Actual Image
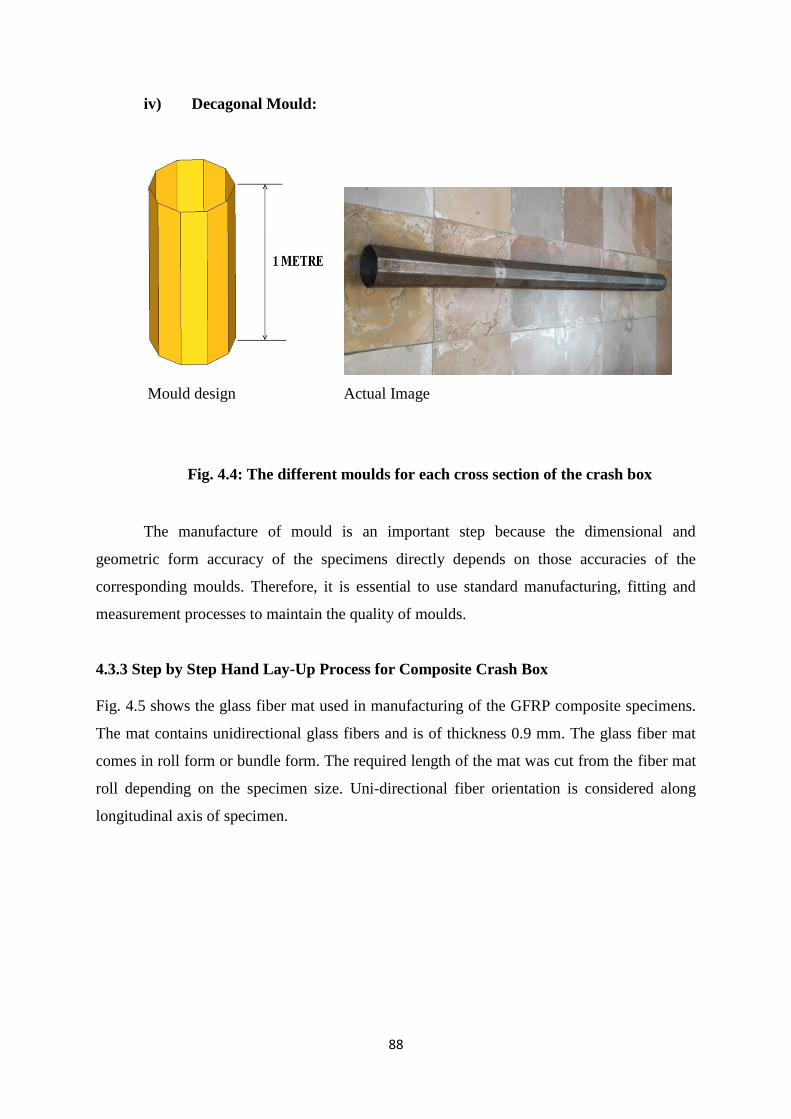
88
iv) Decagonal Mould:
Mould design Actual Image
Fig. 4.4: The different moulds for each cross section of the crash box
The manufacture of mould is an important step because the dimensional and
geometric form accuracy of the specimens directly depends on those accuracies of the
corresponding moulds. Therefore, it is essential to use standard manufacturing, fitting and
measurement processes to maintain the quality of moulds.
4.3.3 Step by Step Hand Lay-Up Process for Composite Crash Box
Fig. 4.5 shows the glass fiber mat used in manufacturing of the GFRP composite specimens.
The mat contains unidirectional glass fibers and is of thickness 0.9 mm. The glass fiber mat
comes in roll form or bundle form. The required length of the mat was cut from the fiber mat
roll depending on the specimen size. Uni-directional fiber orientation is considered along
longitudinal axis of specimen.
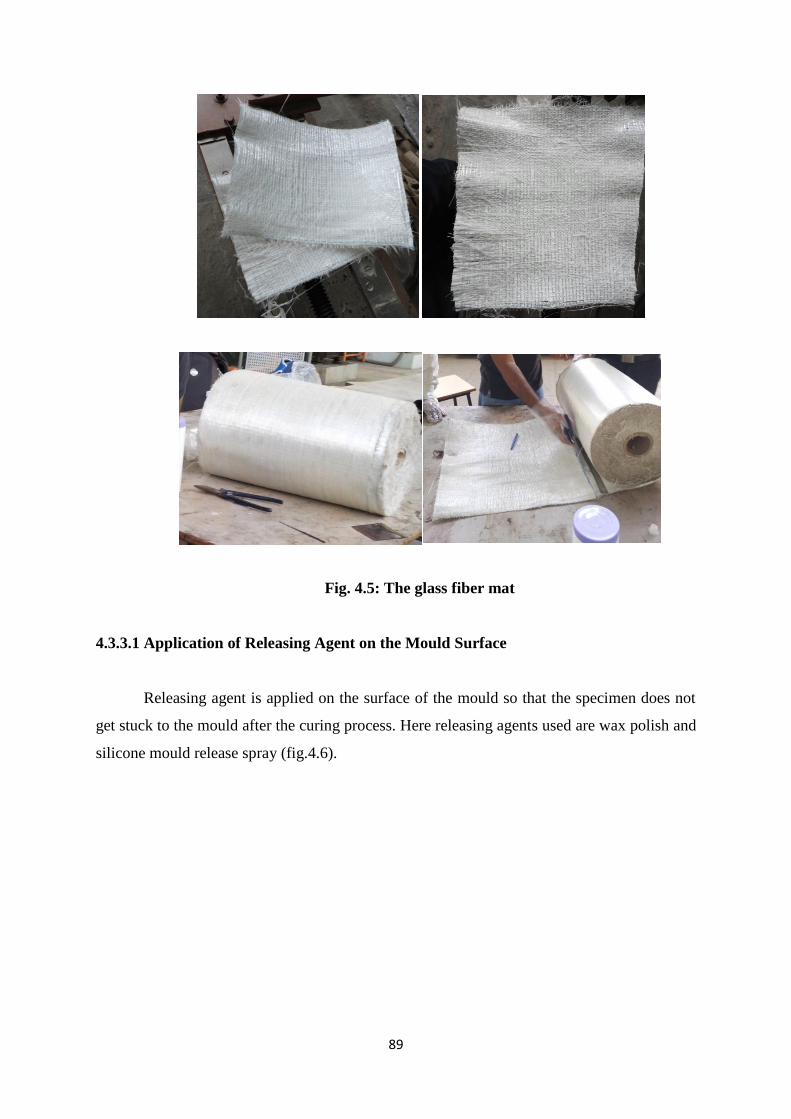
89
Fig. 4.5: The glass fiber mat
4.3.3.1 Application of Releasing Agent on the Mould Surface
Releasing agent is applied on the surface of the mould so that the specimen does not
get stuck to the mould after the curing process. Here releasing agents used are wax polish and
silicone mould release spray (fig.4.6).
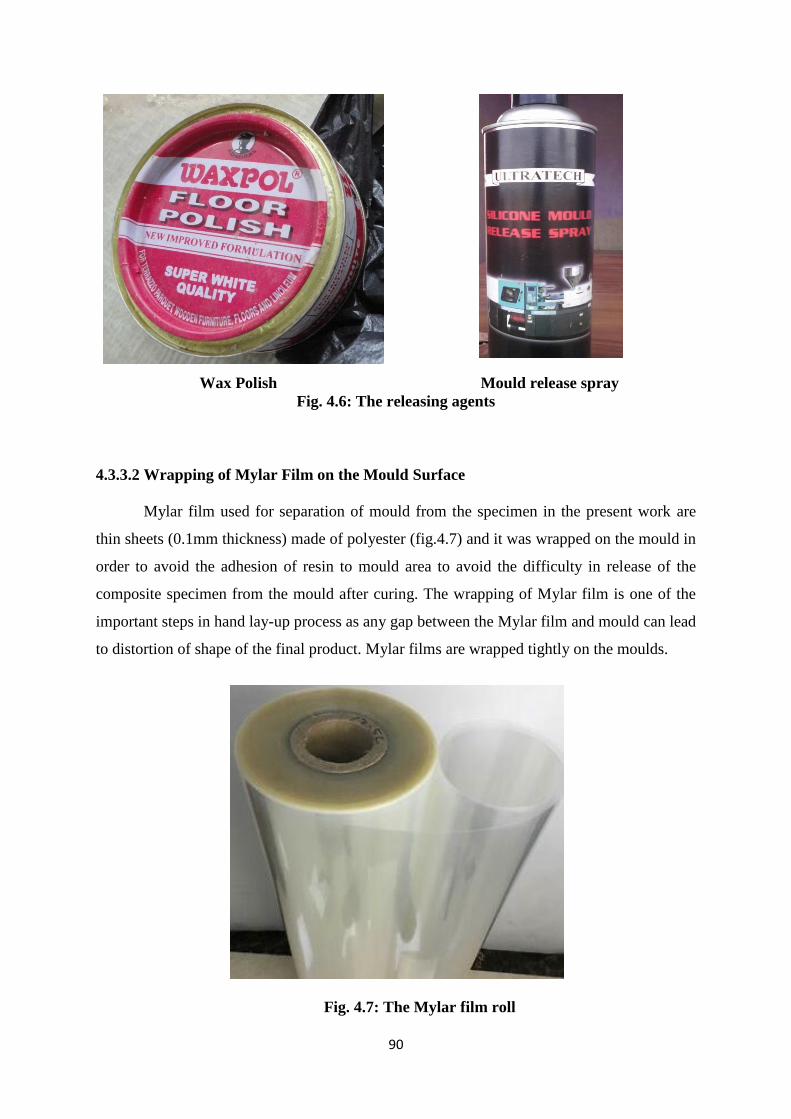
90
Wax Polish Mould release spray
Fig. 4.6: The releasing agents
4.3.3.2 Wrapping of Mylar Film on the Mould Surface
Mylar film used for separation of mould from the specimen in the present work are
thin sheets (0.1mm thickness) made of polyester (fig.4.7) and it was wrapped on the mould in
order to avoid the adhesion of resin to mould area to avoid the difficulty in release of the
composite specimen from the mould after curing. The wrapping of Mylar film is one of the
important steps in hand lay-up process as any gap between the Mylar film and mould can lead
to distortion of shape of the final product. Mylar films are wrapped tightly on the moulds.
Fig. 4.7: The Mylar film roll
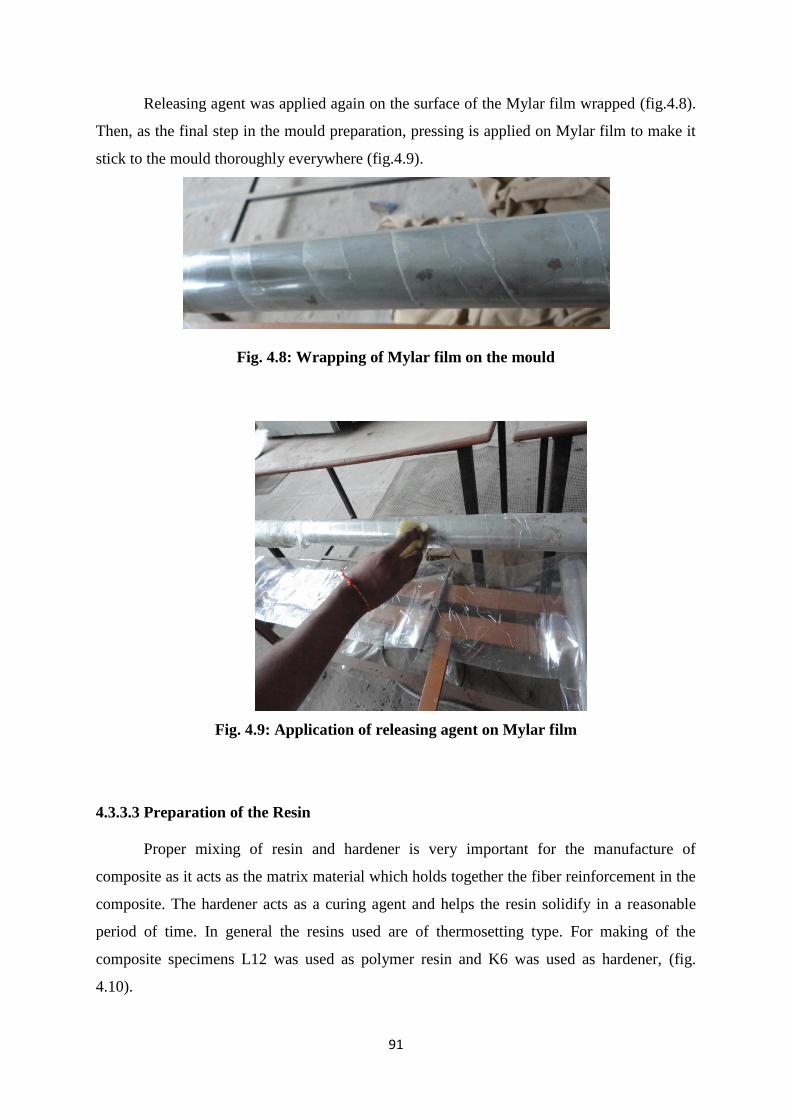
91
Releasing agent was applied again on the surface of the Mylar film wrapped (fig.4.8).
Then, as the final step in the mould preparation, pressing is applied on Mylar film to make it
stick to the mould thoroughly everywhere (fig.4.9).
Fig. 4.8: Wrapping of Mylar film on the mould
Fig. 4.9: Application of releasing agent on Mylar film
4.3.3.3 Preparation of the Resin
Proper mixing of resin and hardener is very important for the manufacture of
composite as it acts as the matrix material which holds together the fiber reinforcement in the
composite. The hardener acts as a curing agent and helps the resin solidify in a reasonable
period of time. In general the resins used are of thermosetting type. For making of the
composite specimens L12 was used as polymer resin and K6 was used as hardener, (fig.
4.10).
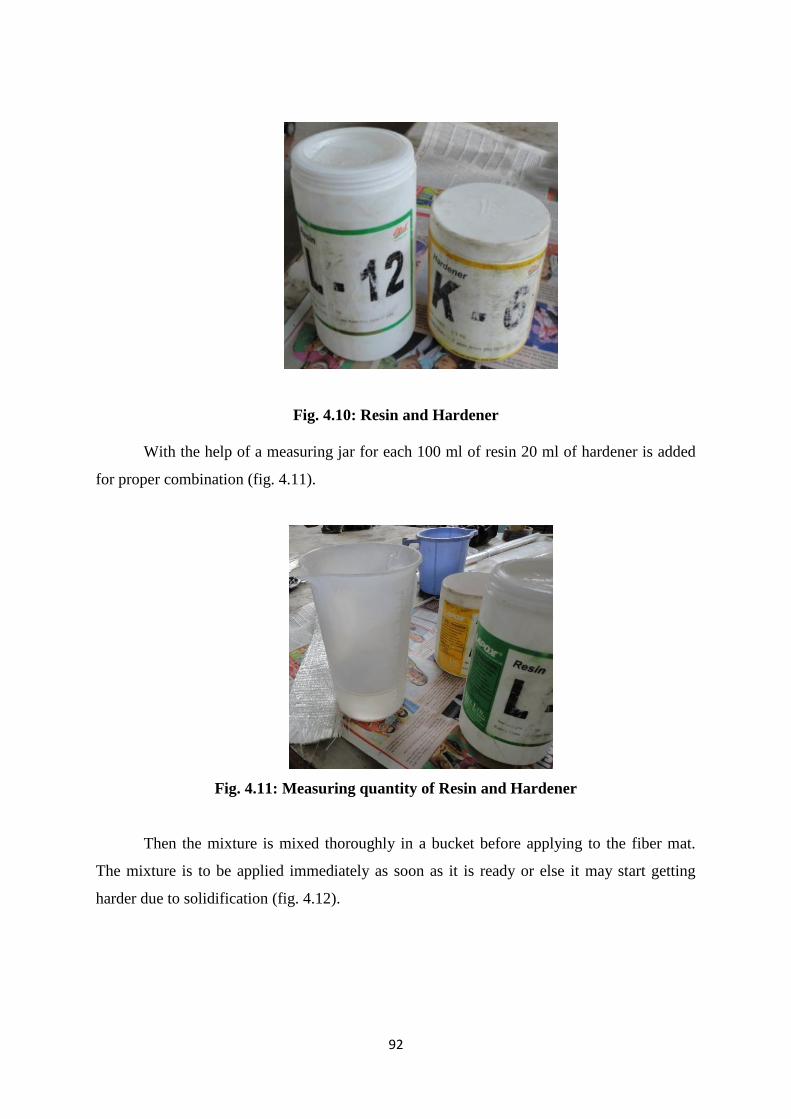
92
Fig. 4.10: Resin and Hardener
With the help of a measuring jar for each 100 ml of resin 20 ml of hardener is added
for proper combination (fig. 4.11).
Fig. 4.11: Measuring quantity of Resin and Hardener
Then the mixture is mixed thoroughly in a bucket before applying to the fiber mat.
The mixture is to be applied immediately as soon as it is ready or else it may start getting
harder due to solidification (fig. 4.12).
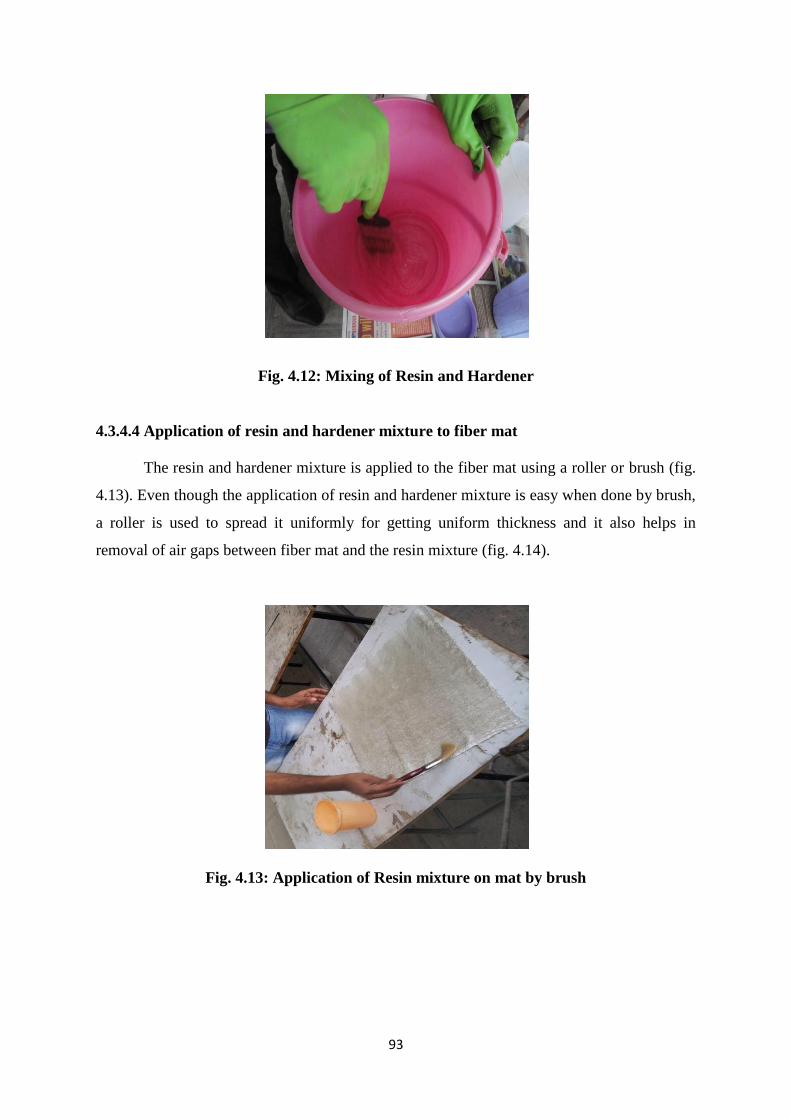
93
Fig. 4.12: Mixing of Resin and Hardener
4.3.4.4 Application of resin and hardener mixture to fiber mat
The resin and hardener mixture is applied to the fiber mat using a roller or brush (fig.
4.13). Even though the application of resin and hardener mixture is easy when done by brush,
a roller is used to spread it uniformly for getting uniform thickness and it also helps in
removal of air gaps between fiber mat and the resin mixture (fig. 4.14).
Fig. 4.13: Application of Resin mixture on mat by brush
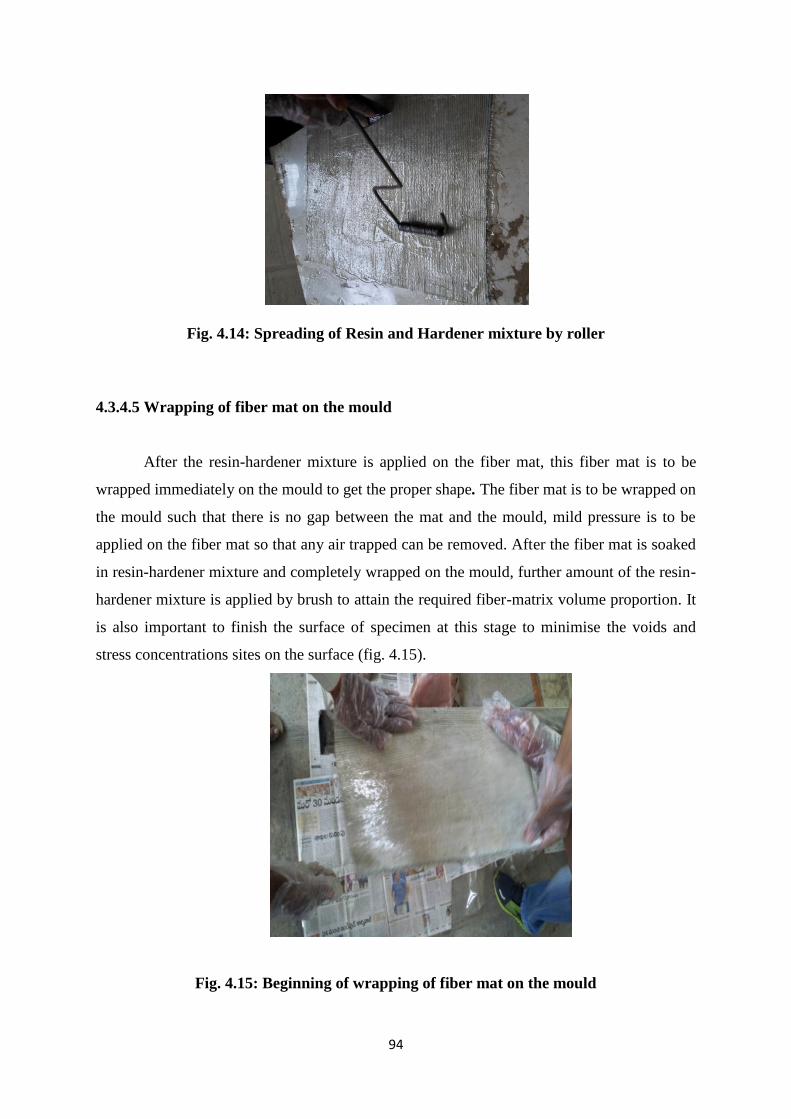
94
Fig. 4.14: Spreading of Resin and Hardener mixture by roller
4.3.4.5 Wrapping of fiber mat on the mould
After the resin-hardener mixture is applied on the fiber mat, this fiber mat is to be
wrapped immediately on the mould to get the proper shape. The fiber mat is to be wrapped on
the mould such that there is no gap between the mat and the mould, mild pressure is to be
applied on the fiber mat so that any air trapped can be removed. After the fiber mat is soaked
in resin-hardener mixture and completely wrapped on the mould, further amount of the resin-
hardener mixture is applied by brush to attain the required fiber-matrix volume proportion. It
is also important to finish the surface of specimen at this stage to minimise the voids and
stress concentrations sites on the surface (fig. 4.15).
Fig. 4.15: Beginning of wrapping of fiber mat on the mould
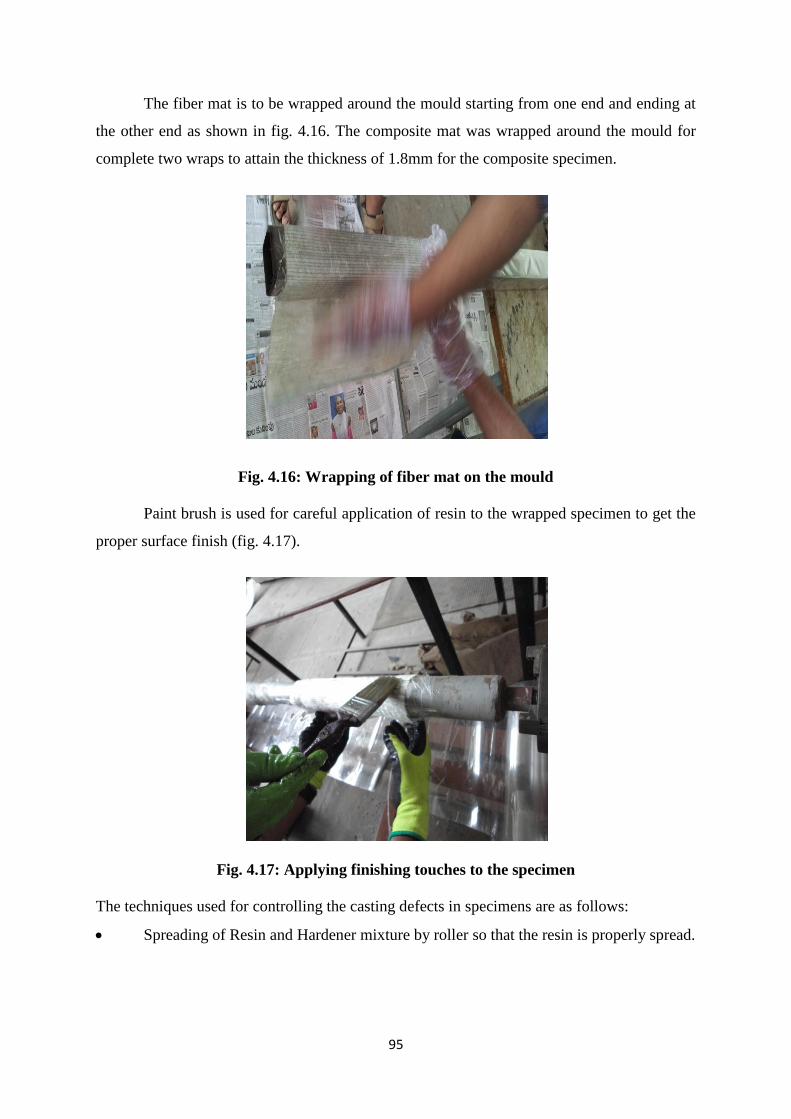
95
The fiber mat is to be wrapped around the mould starting from one end and ending at
the other end as shown in fig. 4.16. The composite mat was wrapped around the mould for
complete two wraps to attain the thickness of 1.8mm for the composite specimen.
Fig. 4.16: Wrapping of fiber mat on the mould
Paint brush is used for careful application of resin to the wrapped specimen to get the
proper surface finish (fig. 4.17).
Fig. 4.17: Applying finishing touches to the specimen
The techniques used for controlling the casting defects in specimens are as follows:
Spreading of Resin and Hardener mixture by roller so that the resin is properly spread.

96
Proper tight wrapping of the resin applied fiber mat, so that there is no air trapped
between the mould and the fiber mat and the fiber mat reflects the mould shape after
wrapping.
Applying finishing touches to the specimen this helps to improve surface finish and
also helps in filling tiny gaps in the composite specimen.
The wet specimen on the mould should be allowed for curing in a neat and dry
environment. Care should be taken that there is no dust or smoke in that area. The specimens
take around two to three days for curing to complete. The curing was done at room
temperature. After the curing is completed the specimens were pulled out of the mould such
that one end of the mould is held firmly using a machine vice (fig. 4.18, fig. 4.19, fig. 4.20 &
fig. 4.21)
Fig. 4.18: Square specimen after curing period

97
Fig. 4.19: Cylindrical specimen after curing period
Fig. 4.20: Hexagonal specimen after curing period
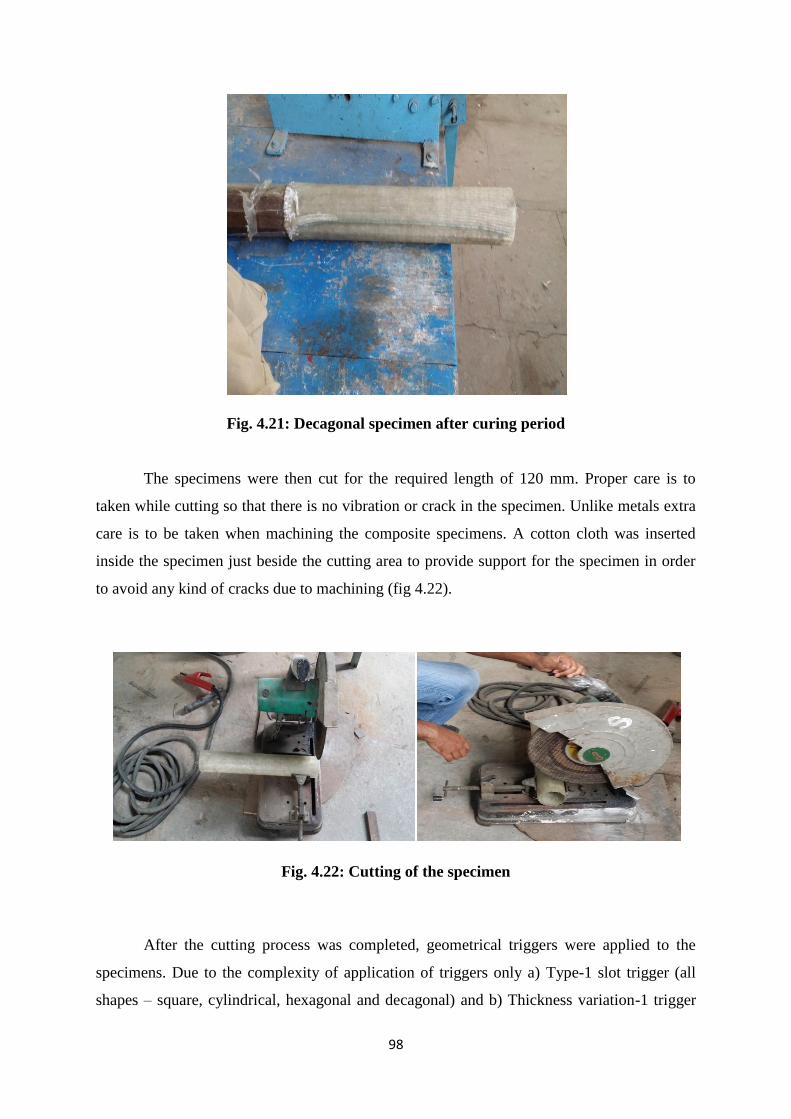
98
Fig. 4.21: Decagonal specimen after curing period
The specimens were then cut for the required length of 120 mm. Proper care is to
taken while cutting so that there is no vibration or crack in the specimen. Unlike metals extra
care is to be taken when machining the composite specimens. A cotton cloth was inserted
inside the specimen just beside the cutting area to provide support for the specimen in order
to avoid any kind of cracks due to machining (fig 4.22).
Fig. 4.22: Cutting of the specimen
After the cutting process was completed, geometrical triggers were applied to the
specimens. Due to the complexity of application of triggers only a) Type-1 slot trigger (all
shapes – square, cylindrical, hexagonal and decagonal) and b) Thickness variation-1 trigger

99
(all shapes – square, cylindrical, hexagonal and decagonal) were feasible to incorporate. The
dimensional accuracy of the specimens manufactured by the above process was checked in
metrology lab and was found to be within the tolerance value of ± 0.1mm. The samples of
specimens made of various cross sections are shown in the fig. 4.23, fig. 4.24, fig. 4.25 and
fig. 4.26.
Fig. 4.23: Sample for square specimens
Fig. 4.24: Sample for cylindrical specimens
Fig. 4.25: Sample for hexagonal specimens
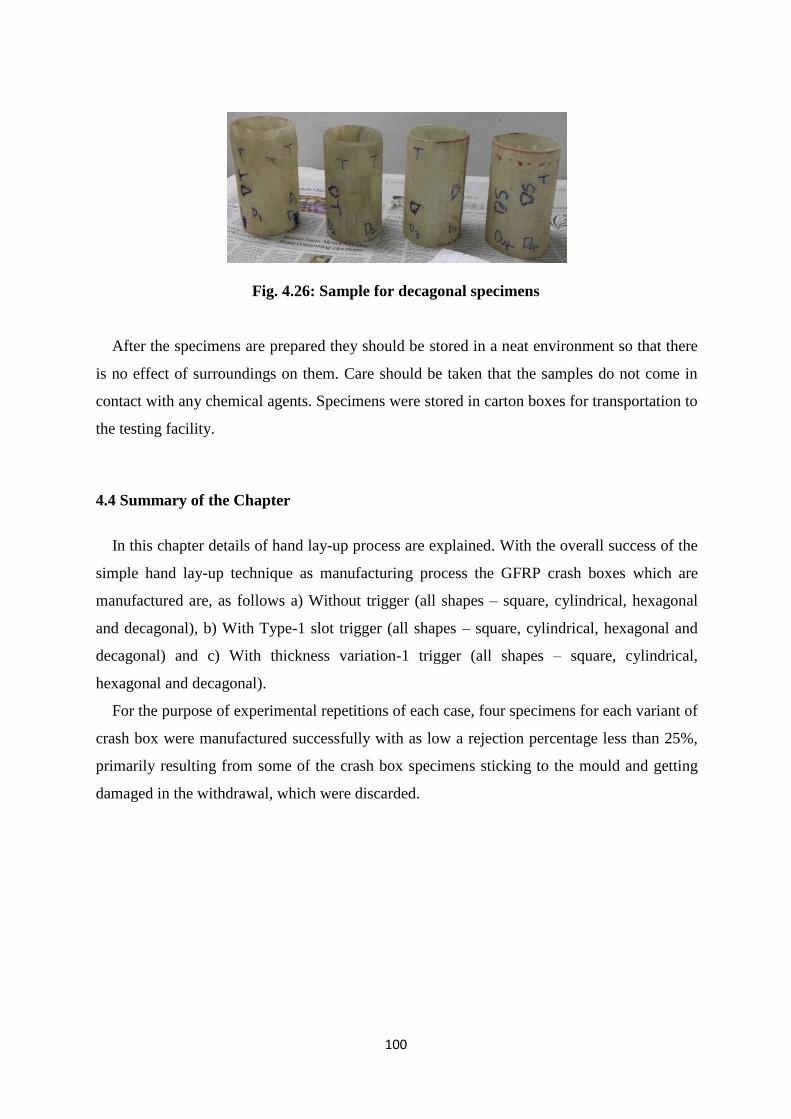
100
Fig. 4.26: Sample for decagonal specimens
After the specimens are prepared they should be stored in a neat environment so that there
is no effect of surroundings on them. Care should be taken that the samples do not come in
contact with any chemical agents. Specimens were stored in carton boxes for transportation to
the testing facility.
4.4 Summary of the Chapter
In this chapter details of hand lay-up process are explained. With the overall success of the
simple hand lay-up technique as manufacturing process the GFRP crash boxes which are
manufactured are, as follows a) Without trigger (all shapes – square, cylindrical, hexagonal
and decagonal), b) With Type-1 slot trigger (all shapes – square, cylindrical, hexagonal and
decagonal) and c) With thickness variation-1 trigger (all shapes – square, cylindrical,
hexagonal and decagonal).
For the purpose of experimental repetitions of each case, four specimens for each variant of
crash box were manufactured successfully with as low a rejection percentage less than 25%,
primarily resulting from some of the crash box specimens sticking to the mould and getting
damaged in the withdrawal, which were discarded.
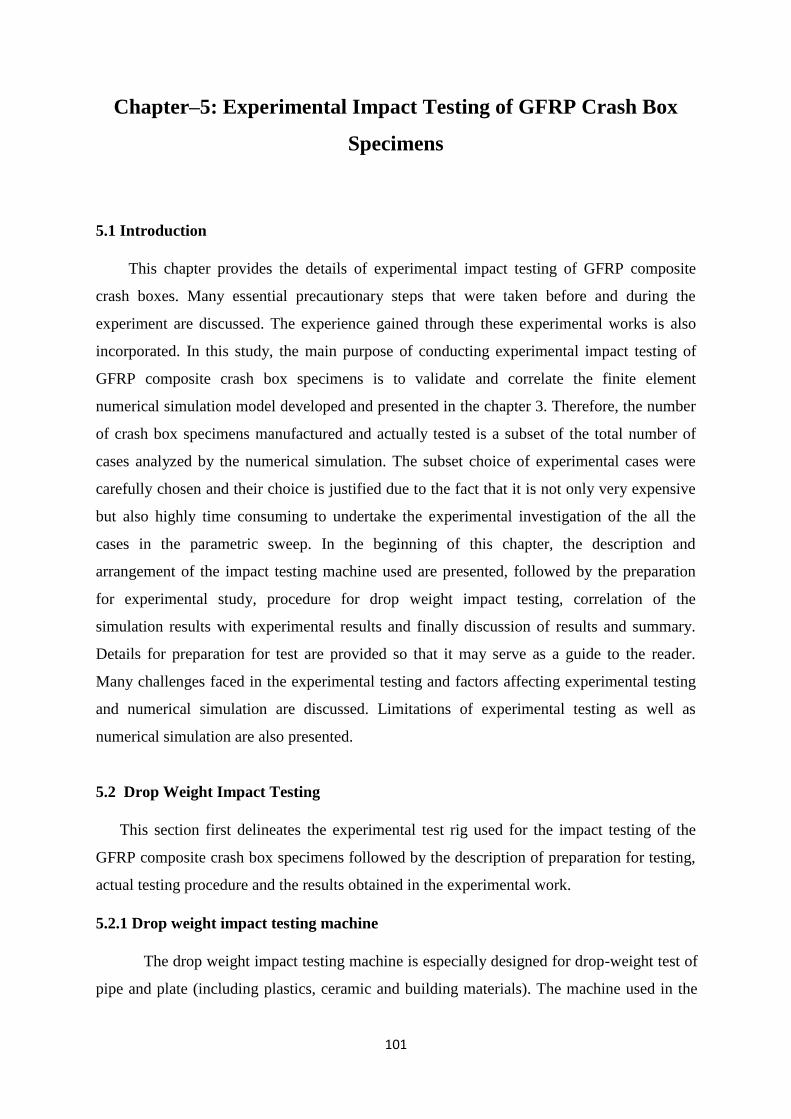
101
Chapter–5: Experimental Impact Testing of GFRP Crash Box
Specimens
5.1 Introduction
This chapter provides the details of experimental impact testing of GFRP composite
crash boxes. Many essential precautionary steps that were taken before and during the
experiment are discussed. The experience gained through these experimental works is also
incorporated. In this study, the main purpose of conducting experimental impact testing of
GFRP composite crash box specimens is to validate and correlate the finite element
numerical simulation model developed and presented in the chapter 3. Therefore, the number
of crash box specimens manufactured and actually tested is a subset of the total number of
cases analyzed by the numerical simulation. The subset choice of experimental cases were
carefully chosen and their choice is justified due to the fact that it is not only very expensive
but also highly time consuming to undertake the experimental investigation of the all the
cases in the parametric sweep. In the beginning of this chapter, the description and
arrangement of the impact testing machine used are presented, followed by the preparation
for experimental study, procedure for drop weight impact testing, correlation of the
simulation results with experimental results and finally discussion of results and summary.
Details for preparation for test are provided so that it may serve as a guide to the reader.
Many challenges faced in the experimental testing and factors affecting experimental testing
and numerical simulation are discussed. Limitations of experimental testing as well as
numerical simulation are also presented.
5.2 Drop Weight Impact Testing
This section first delineates the experimental test rig used for the impact testing of the
GFRP composite crash box specimens followed by the description of preparation for testing,
actual testing procedure and the results obtained in the experimental work.
5.2.1 Drop weight impact testing machine
The drop weight impact testing machine is especially designed for drop-weight test of
pipe and plate (including plastics, ceramic and building materials). The machine used in the
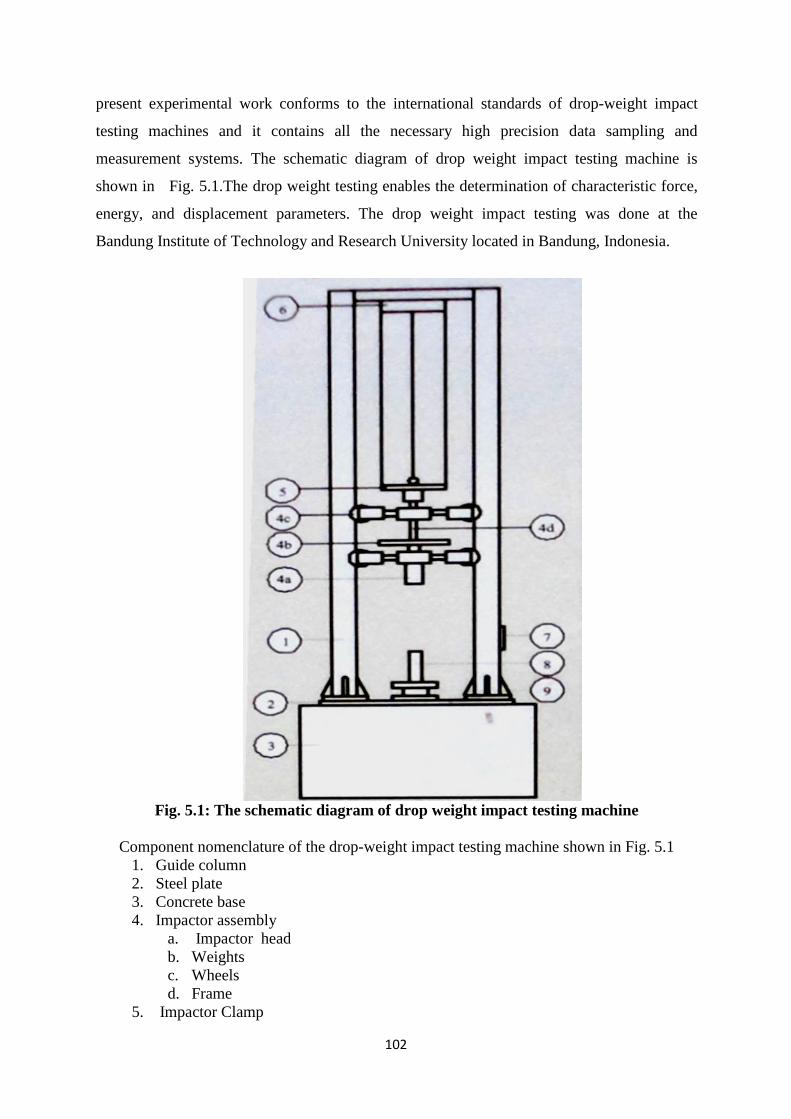
102
present experimental work conforms to the international standards of drop-weight impact
testing machines and it contains all the necessary high precision data sampling and
measurement systems. The schematic diagram of drop weight impact testing machine is
shown in Fig. 5.1.The drop weight testing enables the determination of characteristic force,
energy, and displacement parameters. The drop weight impact testing was done at the
Bandung Institute of Technology and Research University located in Bandung, Indonesia.
Fig. 5.1: The schematic diagram of drop weight impact testing machine
Component nomenclature of the drop-weight impact testing machine shown in Fig. 5.1
1. Guide column
2. Steel plate
3. Concrete base
4. Impactor assembly
a. Impactor head
b. Weights
c. Wheels
d. Frame
5. Impactor Clamp

103
6. Hoist
7. Speed sensor
8. Specimen
9. Load cell
With reference to the Fig. 5.1, the nomenclature of various component parts of the test
rig. The Fig. 5.2a & 5.2b shows the image of the actual setup with ancillary components of
the experimental test rig.
Fig. 5.2a: Drop weight Impact Testing Setup

104
Fig. 5.2b: Drop weight Impact Testing Machine
The load cell and the velocity measuring devices were connected to two of the
channels independently. The signals sensed by the load cell were fed to a charge amplifier
that converts the charge signal to a voltage signal. This voltage signal was then sent to a
personal computer through a data acquisition system. The data acquired was then converted
to a compatible ASCII file that gives the force-time data in digital form. This fundamental
data was then mathematically processed in the HyperGraph software to derive force and
displacement. The force-displacement curve was then plotted and the area under such curve
gives the energy absorbed (fig.5.3).
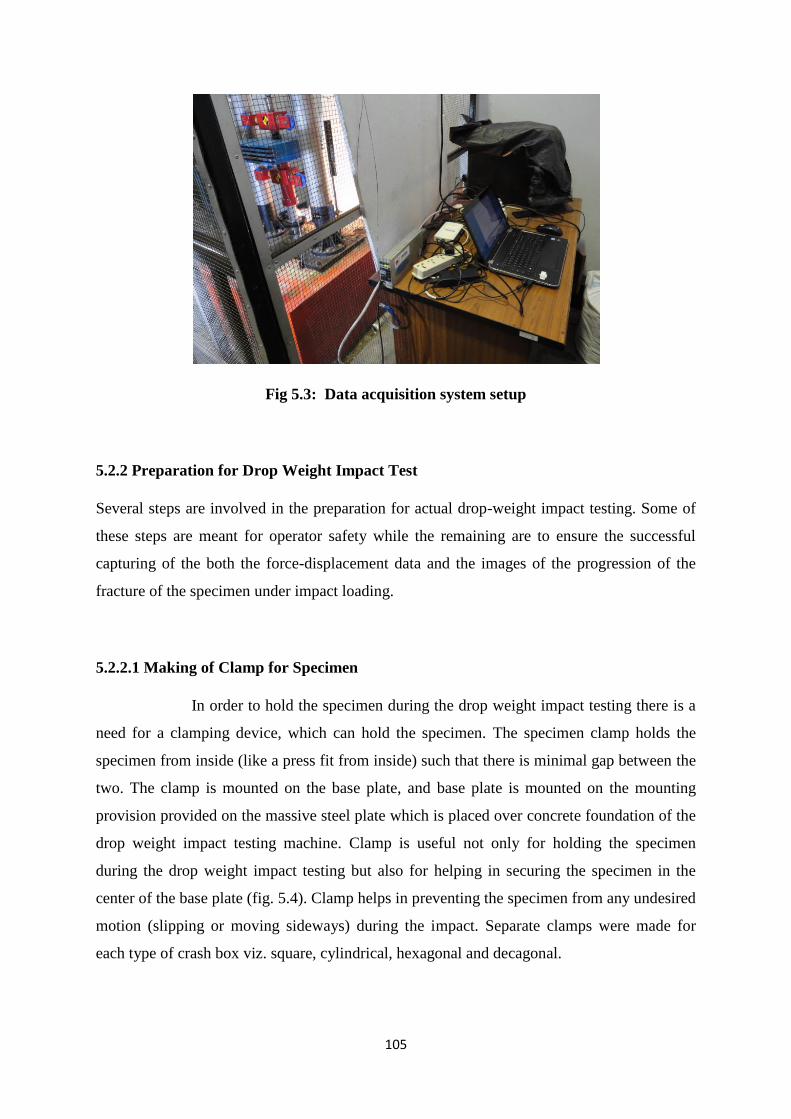
105
Fig 5.3: Data acquisition system setup
5.2.2 Preparation for Drop Weight Impact Test
Several steps are involved in the preparation for actual drop-weight impact testing. Some of
these steps are meant for operator safety while the remaining are to ensure the successful
capturing of the both the force-displacement data and the images of the progression of the
fracture of the specimen under impact loading.
5.2.2.1 Making of Clamp for Specimen
In order to hold the specimen during the drop weight impact testing there is a
need for a clamping device, which can hold the specimen. The specimen clamp holds the
specimen from inside (like a press fit from inside) such that there is minimal gap between the
two. The clamp is mounted on the base plate, and base plate is mounted on the mounting
provision provided on the massive steel plate which is placed over concrete foundation of the
drop weight impact testing machine. Clamp is useful not only for holding the specimen
during the drop weight impact testing but also for helping in securing the specimen in the
center of the base plate (fig. 5.4). Clamp helps in preventing the specimen from any undesired
motion (slipping or moving sideways) during the impact. Separate clamps were made for
each type of crash box viz. square, cylindrical, hexagonal and decagonal.
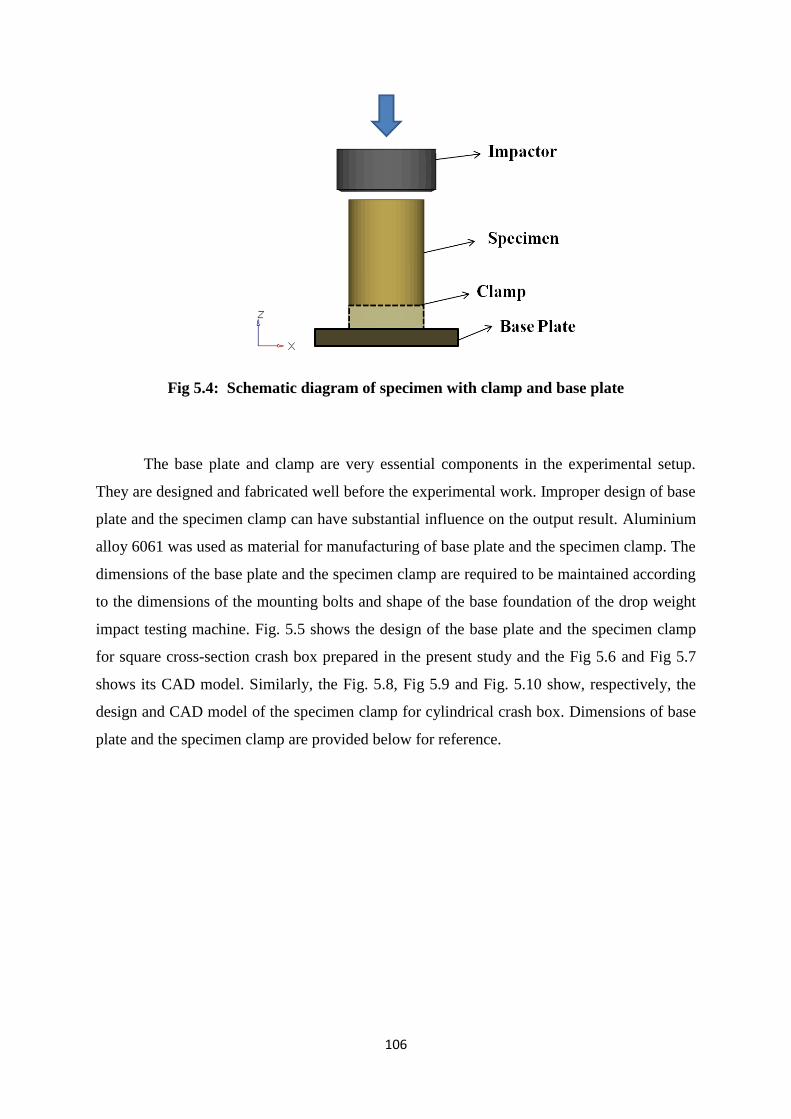
106
Fig 5.4: Schematic diagram of specimen with clamp and base plate
The base plate and clamp are very essential components in the experimental setup.
They are designed and fabricated well before the experimental work. Improper design of base
plate and the specimen clamp can have substantial influence on the output result. Aluminium
alloy 6061 was used as material for manufacturing of base plate and the specimen clamp. The
dimensions of the base plate and the specimen clamp are required to be maintained according
to the dimensions of the mounting bolts and shape of the base foundation of the drop weight
impact testing machine. Fig. 5.5 shows the design of the base plate and the specimen clamp
for square cross-section crash box prepared in the present study and the Fig 5.6 and Fig 5.7
shows its CAD model. Similarly, the Fig. 5.8, Fig 5.9 and Fig. 5.10 show, respectively, the
design and CAD model of the specimen clamp for cylindrical crash box. Dimensions of base
plate and the specimen clamp are provided below for reference.
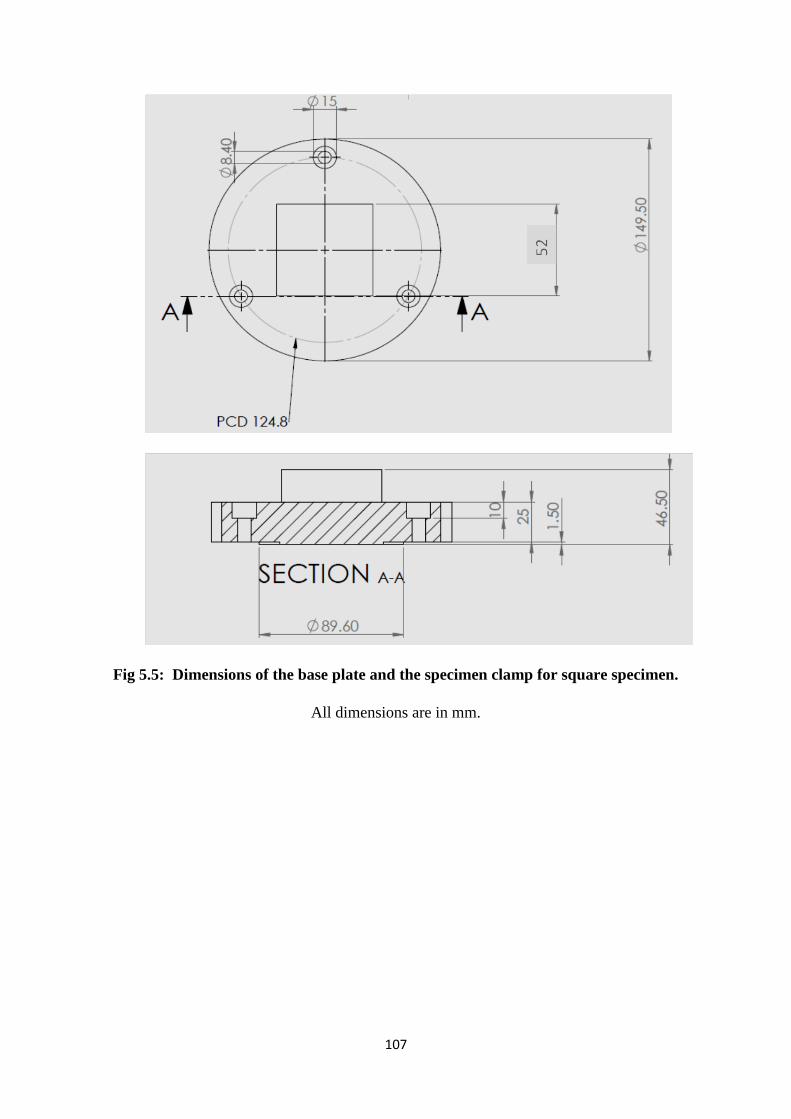
107
Fig 5.5: Dimensions of the base plate and the specimen clamp for square specimen.
All dimensions are in mm.
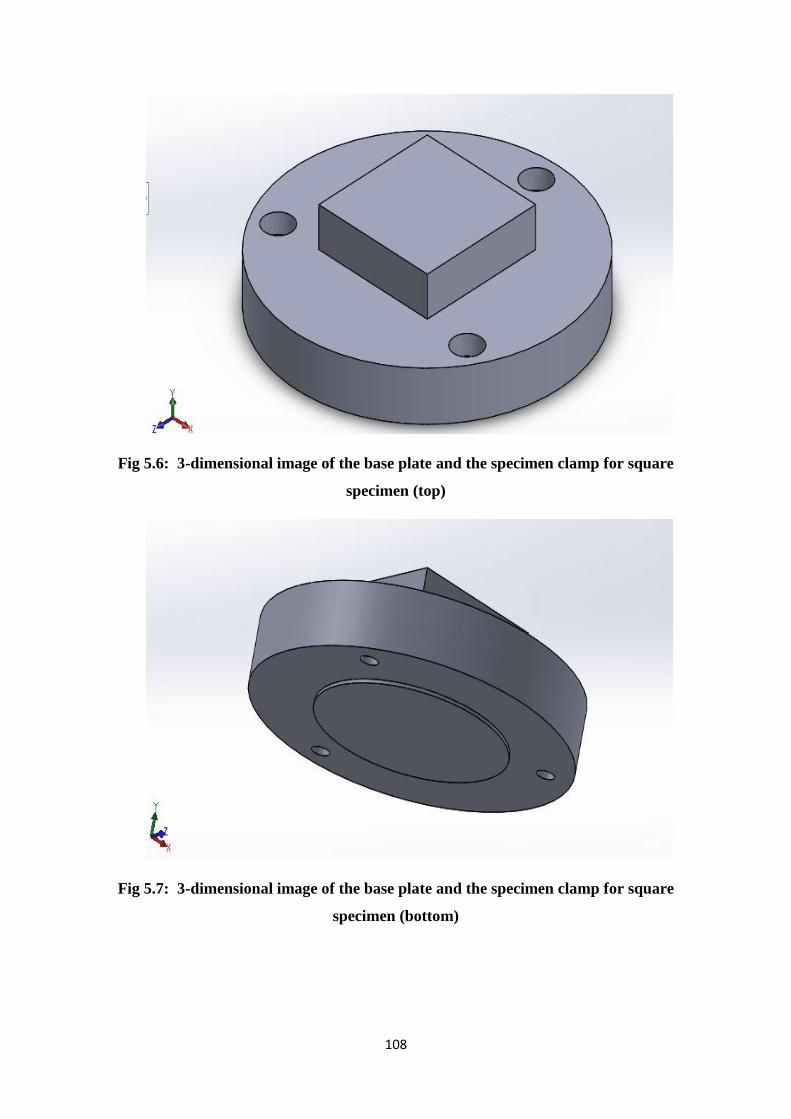
108
Fig 5.6: 3-dimensional image of the base plate and the specimen clamp for square
specimen (top)
Fig 5.7: 3-dimensional image of the base plate and the specimen clamp for square
specimen (bottom)
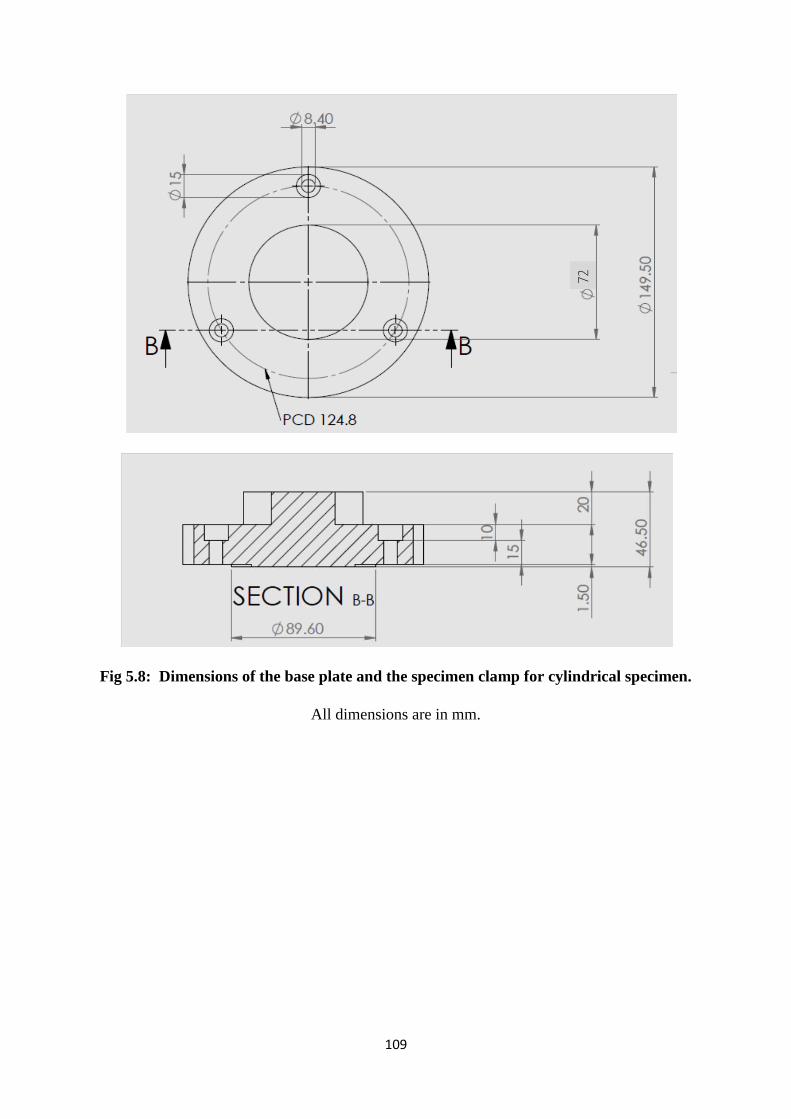
109
Fig 5.8: Dimensions of the base plate and the specimen clamp for cylindrical specimen.
All dimensions are in mm.

110
Fig 5.9: 3-dimensional image of the base plate and the specimen clamp for cylindrical
specimen (top)
Fig 5.10: 3-dimensional image of the base plate and the specimen clamp for cylindrical
specimen (bottom)

111
The base plate was deliberately designed to be common for all different clamps meant
for different cross-sectional shapes of the crash boxes. This was to help reduce the weight of
the total material involved in the rig to facilitate the international transport as well as material
saving. The clamps were so designed as to permit their easy mounting on the base plate with
the help of a screw on the base plate so that the clamps could be interchanged depending on
the specimen type for the testing.
The specimen clamp was made by machining of solid cylindrical block made of
aluminium alloy. The Fig. 5.11 (a) shows clamps after machining and in their final shape.
Care was taken such that there was no play between the specimen and clamp in the sideways
and the clamp was machined till a proper fit for each specimen was achieved as shown in
fig.5.11 (b).
Fig 5.11 (a): Machined clamps in their final shape
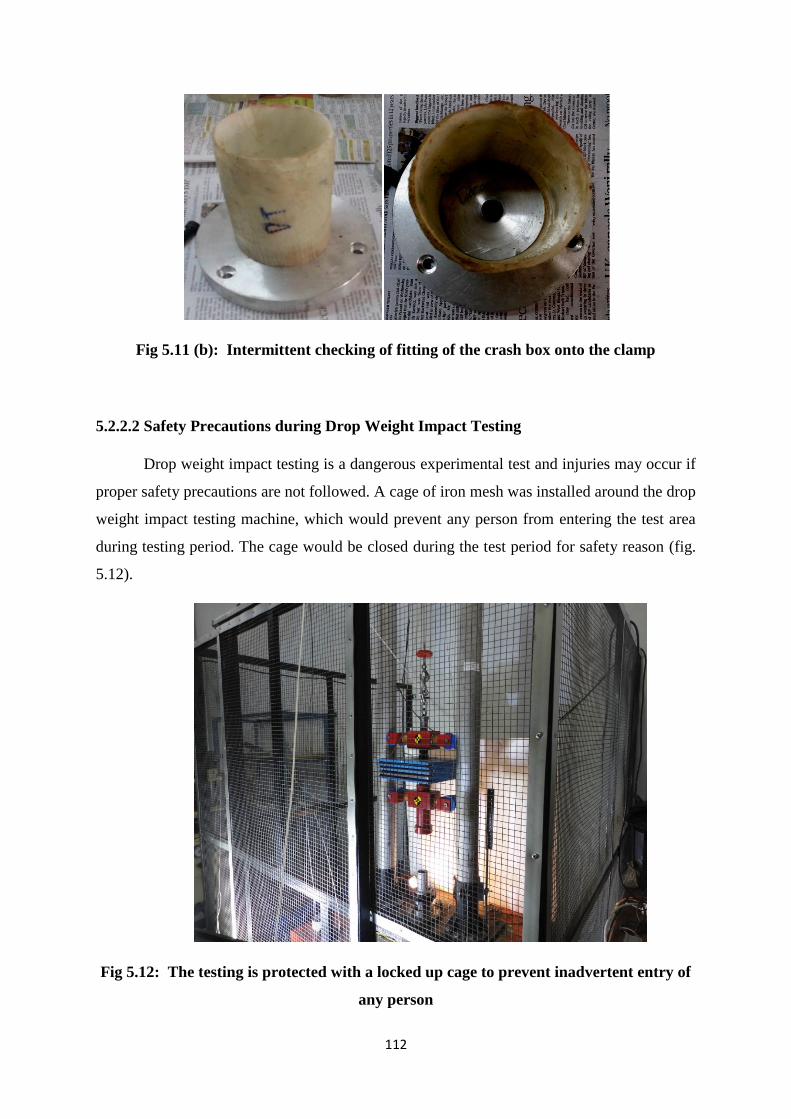
112
Fig 5.11 (b): Intermittent checking of fitting of the crash box onto the clamp
5.2.2.2 Safety Precautions during Drop Weight Impact Testing
Drop weight impact testing is a dangerous experimental test and injuries may occur if
proper safety precautions are not followed. A cage of iron mesh was installed around the drop
weight impact testing machine, which would prevent any person from entering the test area
during testing period. The cage would be closed during the test period for safety reason (fig.
5.12).
Fig 5.12: The testing is protected with a locked up cage to prevent inadvertent entry of
any person
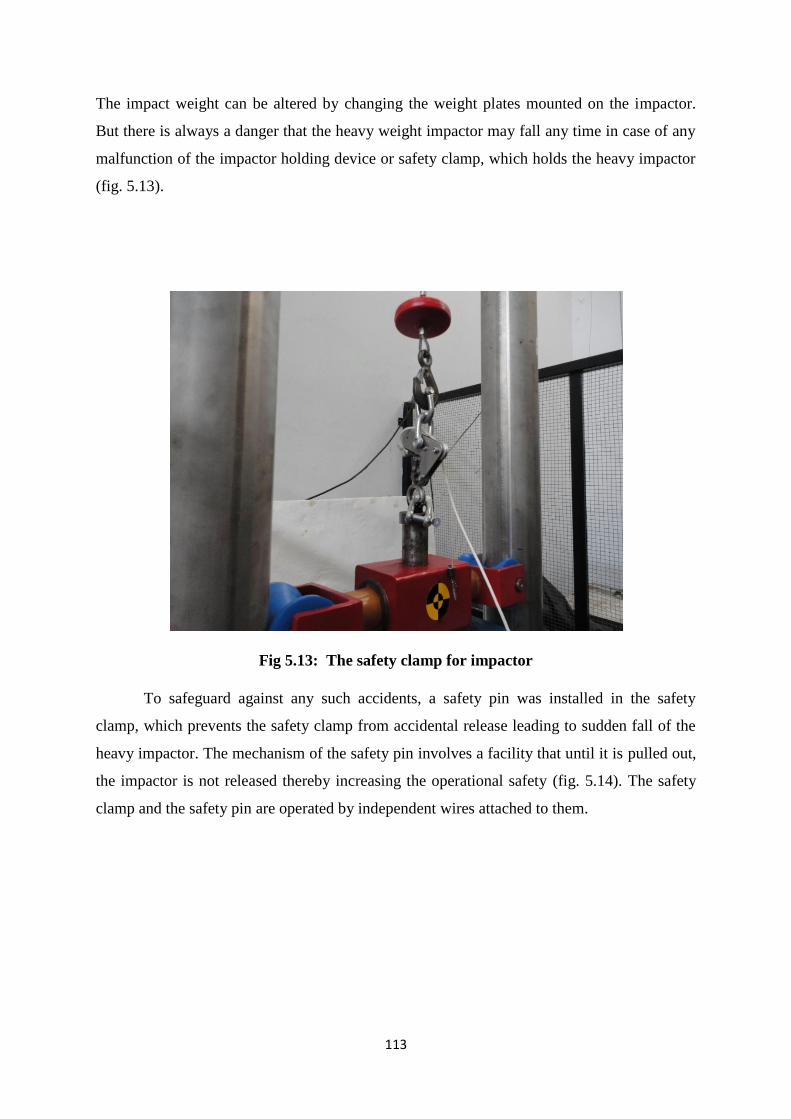
113
The impact weight can be altered by changing the weight plates mounted on the impactor.
But there is always a danger that the heavy weight impactor may fall any time in case of any
malfunction of the impactor holding device or safety clamp, which holds the heavy impactor
(fig. 5.13).
Fig 5.13: The safety clamp for impactor
To safeguard against any such accidents, a safety pin was installed in the safety
clamp, which prevents the safety clamp from accidental release leading to sudden fall of the
heavy impactor. The mechanism of the safety pin involves a facility that until it is pulled out,
the impactor is not released thereby increasing the operational safety (fig. 5.14). The safety
clamp and the safety pin are operated by independent wires attached to them.
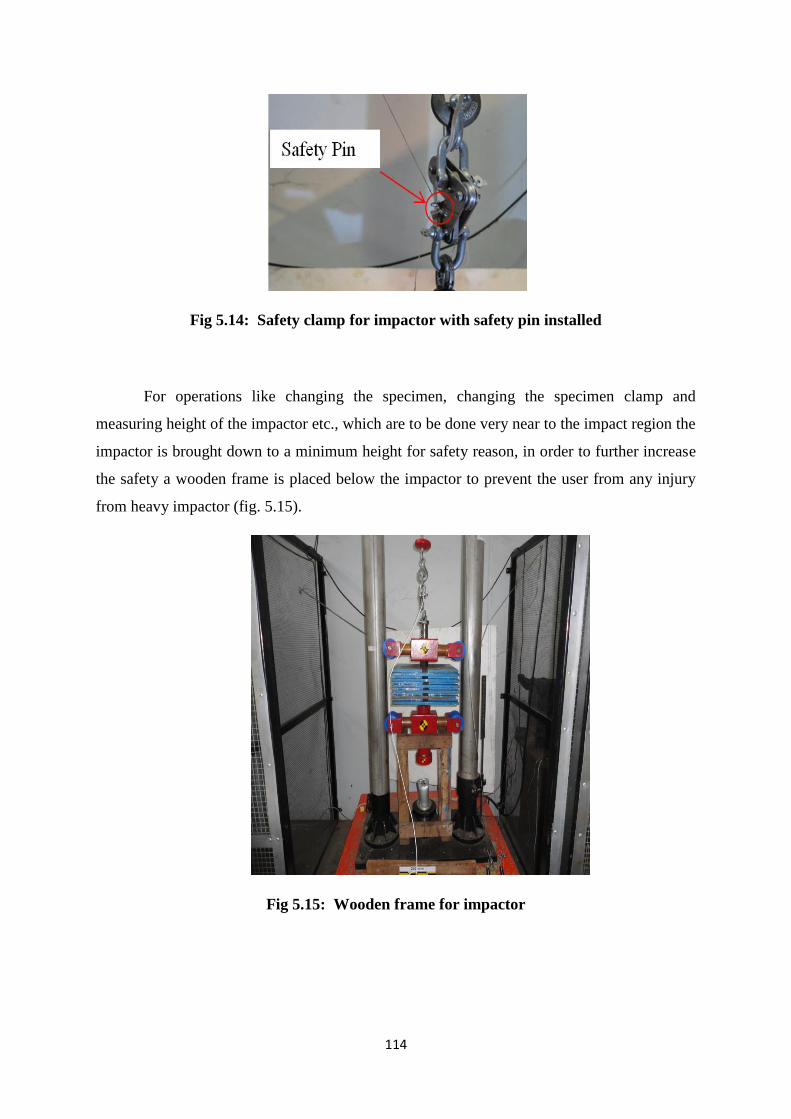
114
Fig 5.14: Safety clamp for impactor with safety pin installed
For operations like changing the specimen, changing the specimen clamp and
measuring height of the impactor etc., which are to be done very near to the impact region the
impactor is brought down to a minimum height for safety reason, in order to further increase
the safety a wooden frame is placed below the impactor to prevent the user from any injury
from heavy impactor (fig. 5.15).
Fig 5.15: Wooden frame for impactor
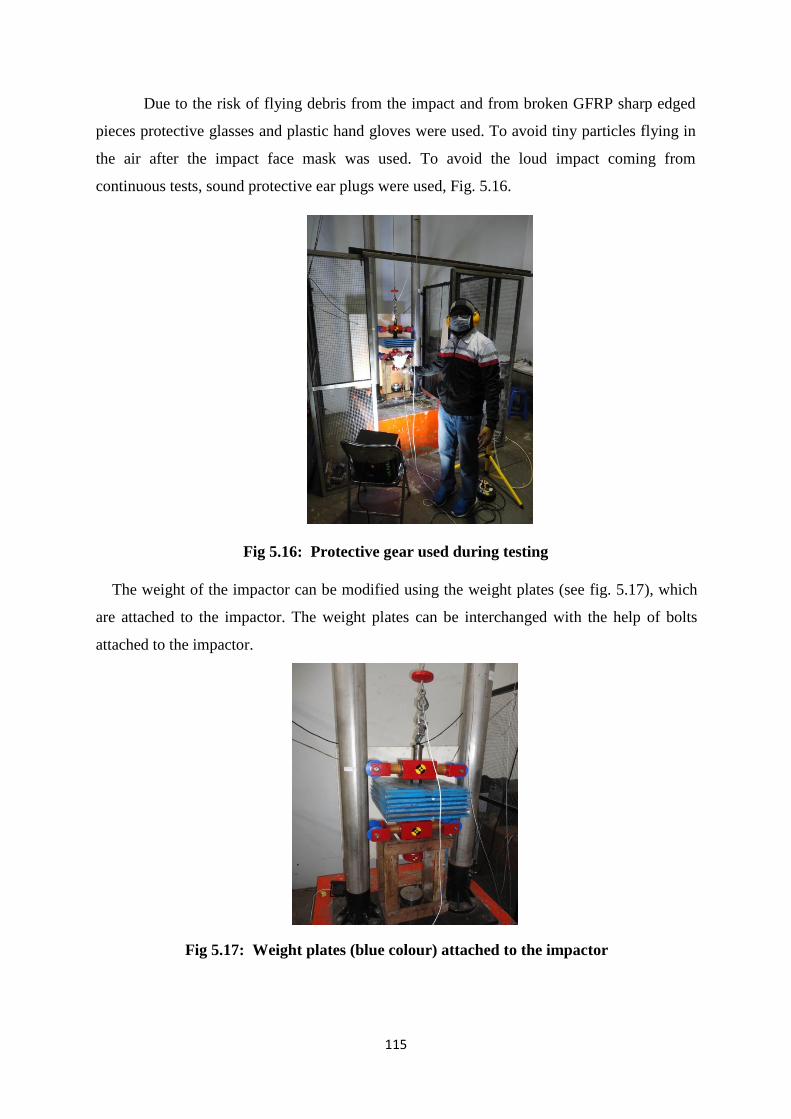
115
Due to the risk of flying debris from the impact and from broken GFRP sharp edged
pieces protective glasses and plastic hand gloves were used. To avoid tiny particles flying in
the air after the impact face mask was used. To avoid the loud impact coming from
continuous tests, sound protective ear plugs were used, Fig. 5.16.
Fig 5.16: Protective gear used during testing
The weight of the impactor can be modified using the weight plates (see fig. 5.17), which
are attached to the impactor. The weight plates can be interchanged with the help of bolts
attached to the impactor.
Fig 5.17: Weight plates (blue colour) attached to the impactor
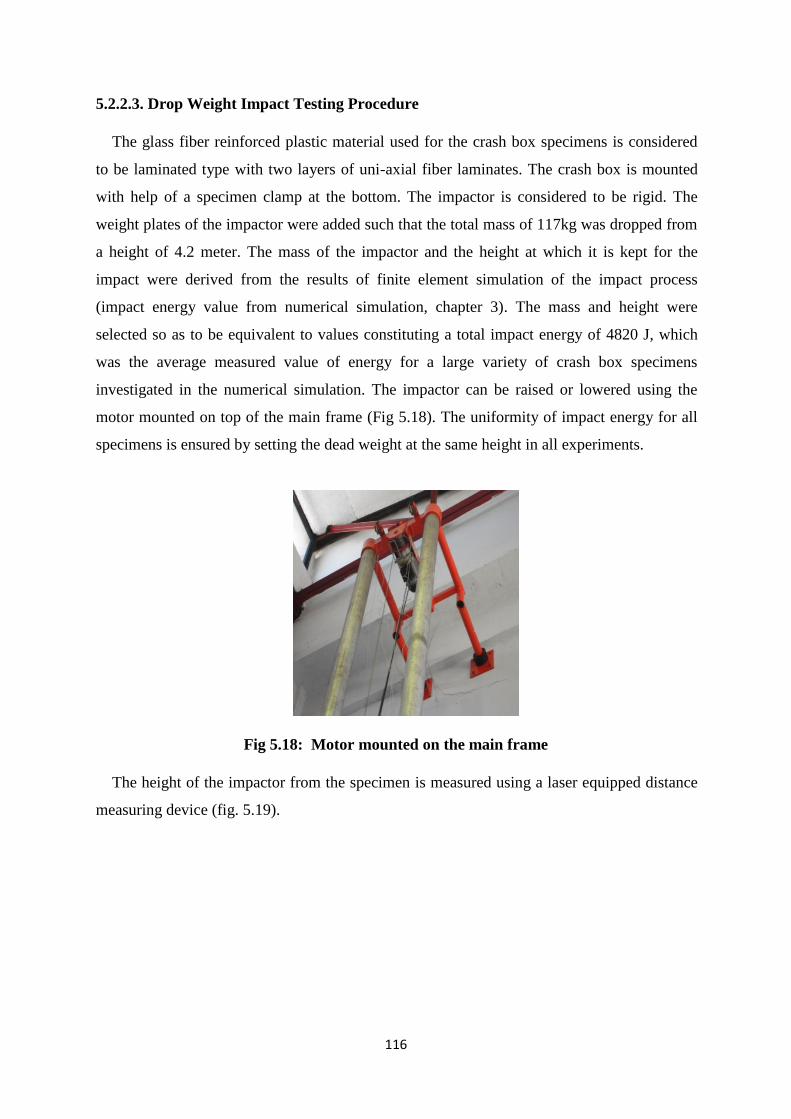
116
5.2.2.3. Drop Weight Impact Testing Procedure
The glass fiber reinforced plastic material used for the crash box specimens is considered
to be laminated type with two layers of uni-axial fiber laminates. The crash box is mounted
with help of a specimen clamp at the bottom. The impactor is considered to be rigid. The
weight plates of the impactor were added such that the total mass of 117kg was dropped from
a height of 4.2 meter. The mass of the impactor and the height at which it is kept for the
impact were derived from the results of finite element simulation of the impact process
(impact energy value from numerical simulation, chapter 3). The mass and height were
selected so as to be equivalent to values constituting a total impact energy of 4820 J, which
was the average measured value of energy for a large variety of crash box specimens
investigated in the numerical simulation. The impactor can be raised or lowered using the
motor mounted on top of the main frame (Fig 5.18). The uniformity of impact energy for all
specimens is ensured by setting the dead weight at the same height in all experiments.
Fig 5.18: Motor mounted on the main frame
The height of the impactor from the specimen is measured using a laser equipped distance
measuring device (fig. 5.19).

117
Fig 5.19: Laser equipped distance measuring device
Experimentation output data recording or data acquisition equipment mainly consisted
of the load cell connected through proper channel to a computer (Fig. 5.20) and also high-
speed camera setup useful in capturing deformations of specimens.
Fig 5.20: Data acquisition system
High speed cameras were installed for capturing the deformation images in a detailed
and sequential manner (fig. 5.21). A MEGA SPEED make HHC X7 PRO portable high speed
camera having a capacity of 600 fps (frames per second) at 1920x1080 pixel resolution was
used. Since the entire test setup was enclosed in a cage of iron mesh for operator safety during
the impact process, the deformation images were captured from outside the cage (hence the
iron mesh is slightly visible in the images captured). In order to capture the correct
deformation due to impact, images of the final deformed specimens were captured exactly at
the end of the first impact from the impactor (in order to avoid the additional deformation of

118
specimen due to rebound of the impactor, which was observed in some cases).
Fig 5.21: High speed camera setup
The load cell is connected to a computer wherein the data of impact force as a function
of time is recorded and plotted with the help of the LabView software. The MEGA SPEED
make HHC X7 PRO portable high speed camera is equipped with re-moveable SSD for data
security. The camera consists of a memory card in which the images as well as video of entire
impact process is recorded.
The load cell used is made by TML, Japan and it essentially consists of F-series foil
type strain gauge. The load cell provides voltage as output which is processed in LabVIEW
signal express software (2011) for obtaining Force versus Time (F vs. T). HyperGraph
software (13.0) was used for further processing of the data obtained from the experimental
data acquisition system, for filtrations of the noise (disturbance) due to transient conditions of
testing. Society of Automobile Engineers’, S.A.E – 60 filter which has a filtering frequency of
60 hertz along with curve smoothing options were used to get a smoother curve for the
(F vs. T) plots. The Images from high speed camera are processed using VIC-2D (Digital
Image Correlation Software) for obtaining the Displacement versus Time curve (D vs. T).
The (F vs. T) and (D vs. T) curve data is further mathematically processed in the
HyperGraph software, for obtaining the Force versus Displacement curve (F vs. D). The
force-displacement (F-D) curve was then plotted and the area under such curve gives the
energy absorbed, which can be calculated in HyperGraph software.
The present experimental work is carried on using GFRP material for the
crashworthiness study of composite crash box; the material is kept unchanged whereas only
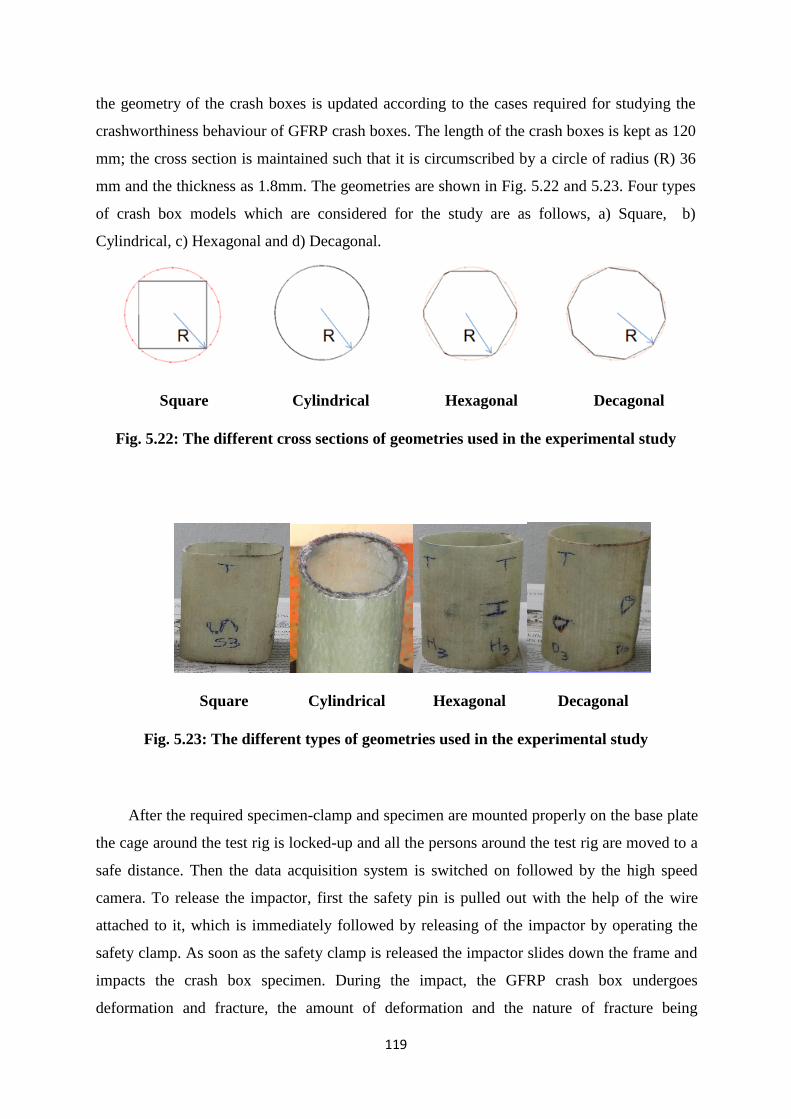
119
the geometry of the crash boxes is updated according to the cases required for studying the
crashworthiness behaviour of GFRP crash boxes. The length of the crash boxes is kept as 120
mm; the cross section is maintained such that it is circumscribed by a circle of radius (R) 36
mm and the thickness as 1.8mm. The geometries are shown in Fig. 5.22 and 5.23. Four types
of crash box models which are considered for the study are as follows, a) Square, b)
Cylindrical, c) Hexagonal and d) Decagonal.
Square Cylindrical Hexagonal Decagonal
Fig. 5.22: The different cross sections of geometries used in the experimental study
Square Cylindrical Hexagonal Decagonal
Fig. 5.23: The different types of geometries used in the experimental study
After the required specimen-clamp and specimen are mounted properly on the base plate
the cage around the test rig is locked-up and all the persons around the test rig are moved to a
safe distance. Then the data acquisition system is switched on followed by the high speed
camera. To release the impactor, first the safety pin is pulled out with the help of the wire
attached to it, which is immediately followed by releasing of the impactor by operating the
safety clamp. As soon as the safety clamp is released the impactor slides down the frame and
impacts the crash box specimen. During the impact, the GFRP crash box undergoes
deformation and fracture, the amount of deformation and the nature of fracture being
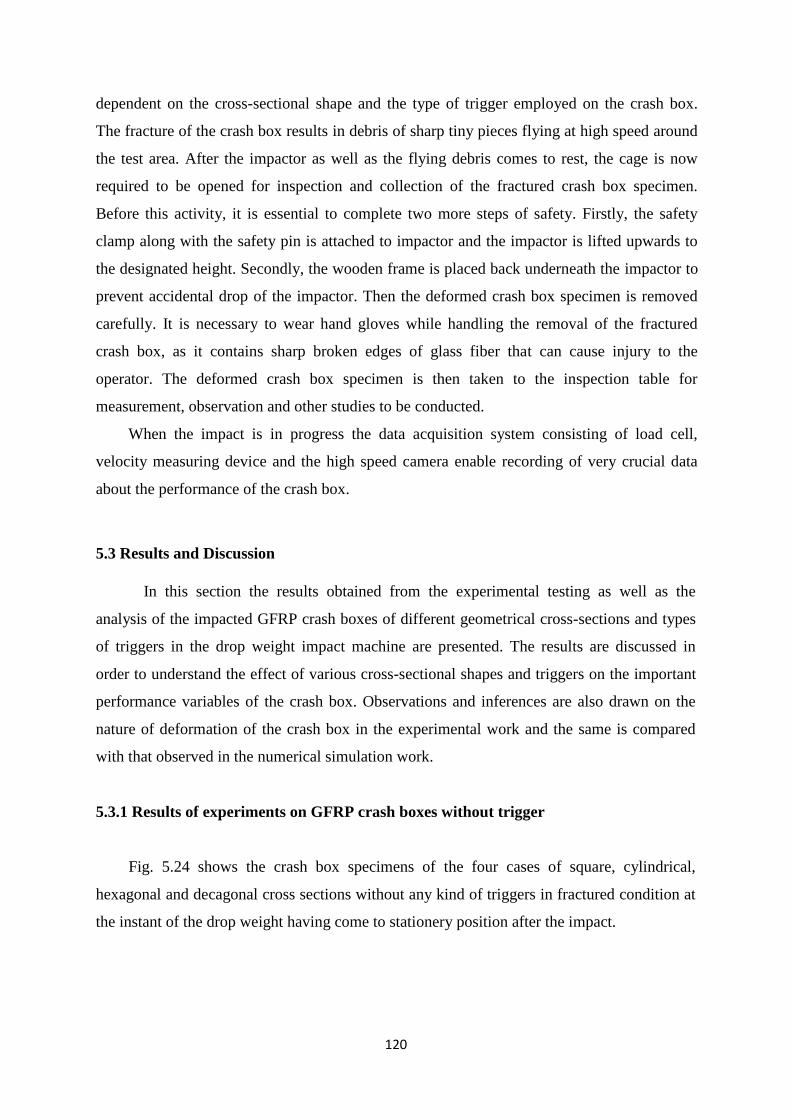
120
dependent on the cross-sectional shape and the type of trigger employed on the crash box.
The fracture of the crash box results in debris of sharp tiny pieces flying at high speed around
the test area. After the impactor as well as the flying debris comes to rest, the cage is now
required to be opened for inspection and collection of the fractured crash box specimen.
Before this activity, it is essential to complete two more steps of safety. Firstly, the safety
clamp along with the safety pin is attached to impactor and the impactor is lifted upwards to
the designated height. Secondly, the wooden frame is placed back underneath the impactor to
prevent accidental drop of the impactor. Then the deformed crash box specimen is removed
carefully. It is necessary to wear hand gloves while handling the removal of the fractured
crash box, as it contains sharp broken edges of glass fiber that can cause injury to the
operator. The deformed crash box specimen is then taken to the inspection table for
measurement, observation and other studies to be conducted.
When the impact is in progress the data acquisition system consisting of load cell,
velocity measuring device and the high speed camera enable recording of very crucial data
about the performance of the crash box.
5.3 Results and Discussion
In this section the results obtained from the experimental testing as well as the
analysis of the impacted GFRP crash boxes of different geometrical cross-sections and types
of triggers in the drop weight impact machine are presented. The results are discussed in
order to understand the effect of various cross-sectional shapes and triggers on the important
performance variables of the crash box. Observations and inferences are also drawn on the
nature of deformation of the crash box in the experimental work and the same is compared
with that observed in the numerical simulation work.
5.3.1 Results of experiments on GFRP crash boxes without trigger
Fig. 5.24 shows the crash box specimens of the four cases of square, cylindrical,
hexagonal and decagonal cross sections without any kind of triggers in fractured condition at
the instant of the drop weight having come to stationery position after the impact.

121
Square Cylindrical Hexagonal Decagonal
Fig.5.24: The crash boxes with various geometries after impact
It is interesting to see in Fig. 5.24 that the square cross sectional crash box undergoes
fracture at the bottom end (clamped end) where it is mounted on to the specimen clamp.
Whereas, the other three cross-sectional shape crash boxes undergo fracture at their free end
(impacted end) rather than at the clamped end. It is clear to see that the extent of fractured
length is progressively lower from square to cylindrical, hexagonal and decagonal crash
boxes, in that order. It may also be observed that the spread of the fractured fronds is highest
in the square crash box and this spread progressively reduces in cylindrical, hexagonal and
decagonal crash boxes, in that order.
Fig.5.25: The force versus displacement curves for test of crash boxes with
different geometries.
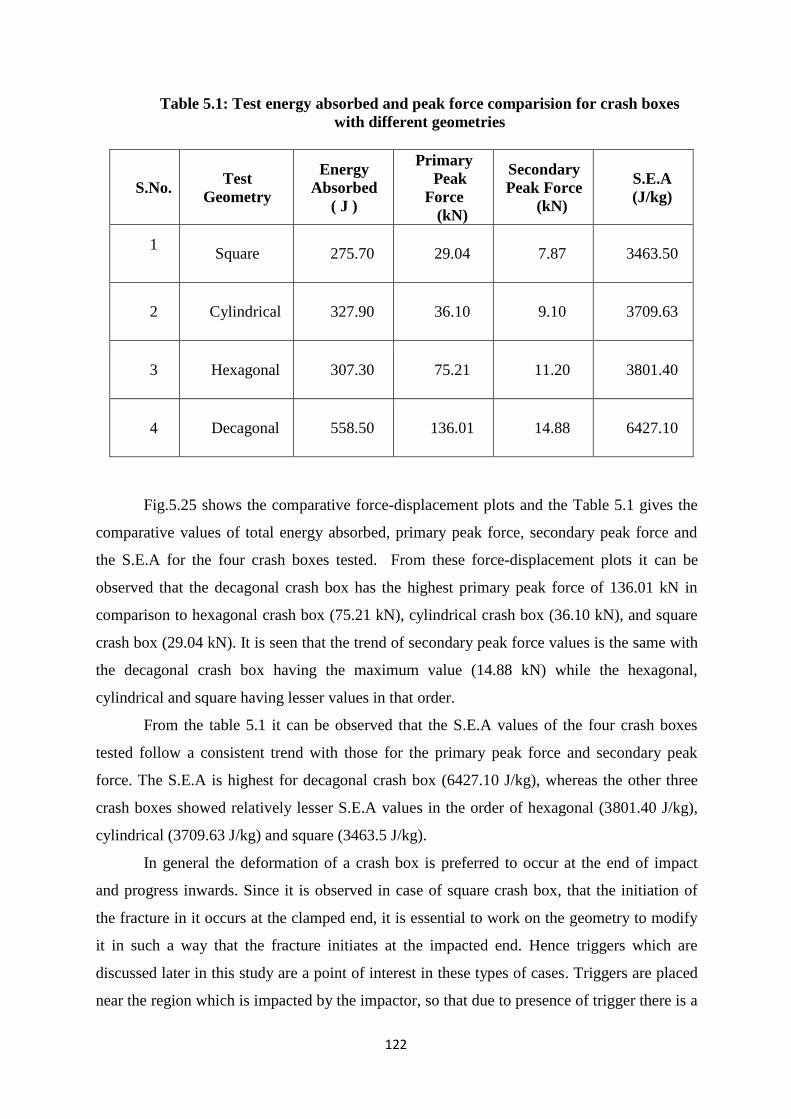
122
Table 5.1: Test energy absorbed and peak force comparision for crash boxes
with different geometries
S.No. Test
Geometry
Energy
Absorbed
( J )
Primary
Peak
Force
(kN)
Secondary
Peak Force
(kN)
S.E.A
(J/kg)
1
Square 275.70 29.04 7.87 3463.50
2 Cylindrical 327.90 36.10 9.10 3709.63
3 Hexagonal 307.30 75.21 11.20 3801.40
4 Decagonal 558.50 136.01 14.88 6427.10
Fig.5.25 shows the comparative force-displacement plots and the Table 5.1 gives the
comparative values of total energy absorbed, primary peak force, secondary peak force and
the S.E.A for the four crash boxes tested. From these force-displacement plots it can be
observed that the decagonal crash box has the highest primary peak force of 136.01 kN in
comparison to hexagonal crash box (75.21 kN), cylindrical crash box (36.10 kN), and square
crash box (29.04 kN). It is seen that the trend of secondary peak force values is the same with
the decagonal crash box having the maximum value (14.88 kN) while the hexagonal,
cylindrical and square having lesser values in that order.
From the table 5.1 it can be observed that the S.E.A values of the four crash boxes
tested follow a consistent trend with those for the primary peak force and secondary peak
force. The S.E.A is highest for decagonal crash box (6427.10 J/kg), whereas the other three
crash boxes showed relatively lesser S.E.A values in the order of hexagonal (3801.40 J/kg),
cylindrical (3709.63 J/kg) and square (3463.5 J/kg).
In general the deformation of a crash box is preferred to occur at the end of impact
and progress inwards. Since it is observed in case of square crash box, that the initiation of
the fracture in it occurs at the clamped end, it is essential to work on the geometry to modify
it in such a way that the fracture initiates at the impacted end. Hence triggers which are
discussed later in this study are a point of interest in these types of cases. Triggers are placed
near the region which is impacted by the impactor, so that due to presence of trigger there is a
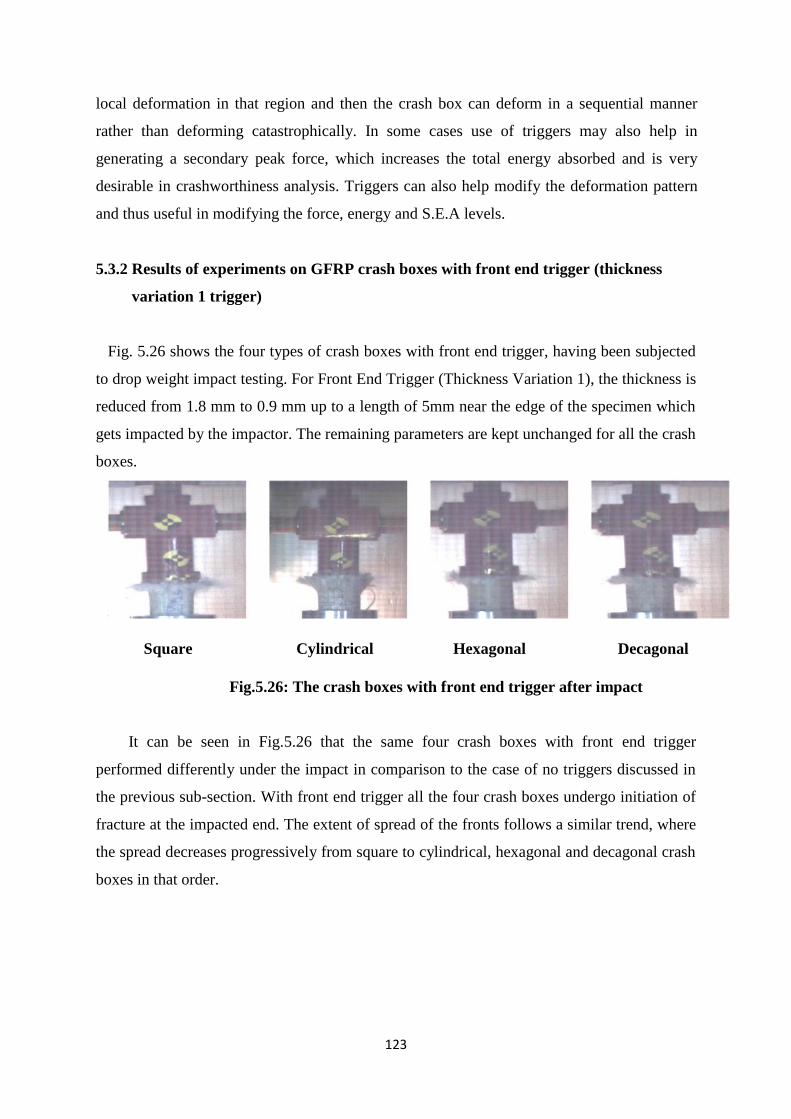
123
local deformation in that region and then the crash box can deform in a sequential manner
rather than deforming catastrophically. In some cases use of triggers may also help in
generating a secondary peak force, which increases the total energy absorbed and is very
desirable in crashworthiness analysis. Triggers can also help modify the deformation pattern
and thus useful in modifying the force, energy and S.E.A levels.
5.3.2 Results of experiments on GFRP crash boxes with front end trigger (thickness
variation 1 trigger)
Fig. 5.26 shows the four types of crash boxes with front end trigger, having been subjected
to drop weight impact testing. For Front End Trigger (Thickness Variation 1), the thickness is
reduced from 1.8 mm to 0.9 mm up to a length of 5mm near the edge of the specimen which
gets impacted by the impactor. The remaining parameters are kept unchanged for all the crash
boxes.
Square Cylindrical Hexagonal Decagonal
Fig.5.26: The crash boxes with front end trigger after impact
It can be seen in Fig.5.26 that the same four crash boxes with front end trigger
performed differently under the impact in comparison to the case of no triggers discussed in
the previous sub-section. With front end trigger all the four crash boxes undergo initiation of
fracture at the impacted end. The extent of spread of the fronts follows a similar trend, where
the spread decreases progressively from square to cylindrical, hexagonal and decagonal crash
boxes in that order.
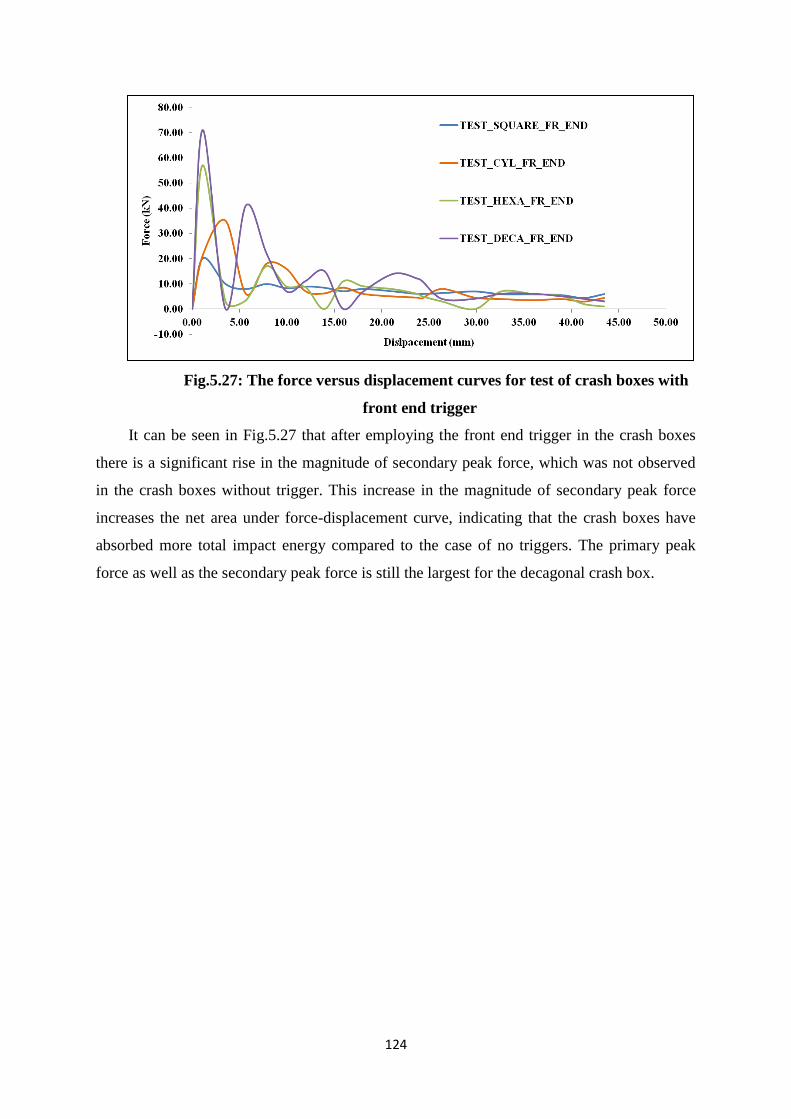
124
Fig.5.27: The force versus displacement curves for test of crash boxes with
front end trigger
It can be seen in Fig.5.27 that after employing the front end trigger in the crash boxes
there is a significant rise in the magnitude of secondary peak force, which was not observed
in the crash boxes without trigger. This increase in the magnitude of secondary peak force
increases the net area under force-displacement curve, indicating that the crash boxes have
absorbed more total impact energy compared to the case of no triggers. The primary peak
force as well as the secondary peak force is still the largest for the decagonal crash box.
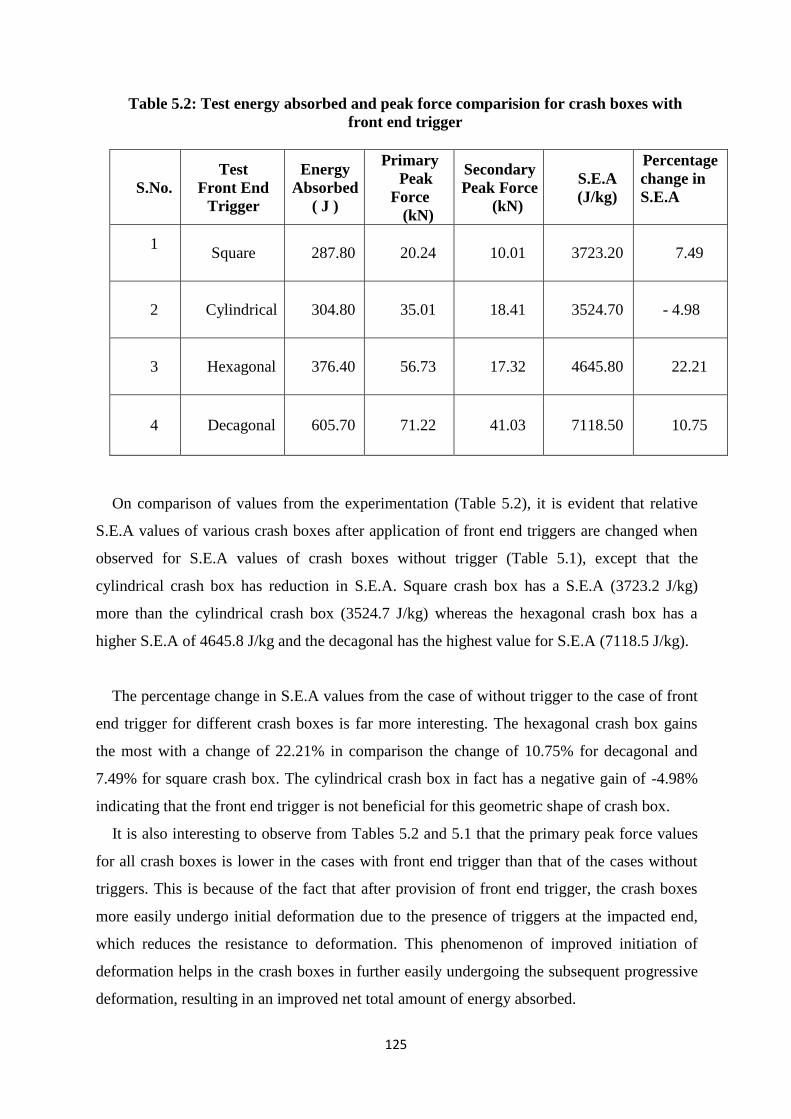
125
Table 5.2: Test energy absorbed and peak force comparision for crash boxes with
front end trigger
S.No.
Test
Front End
Trigger
Energy
Absorbed
( J )
Primary
Peak
Force
(kN)
Secondary
Peak Force
(kN)
S.E.A
(J/kg)
Percentage
change in
S.E.A
1
Square 287.80 20.24 10.01 3723.20 7.49
2 Cylindrical 304.80 35.01 18.41 3524.70 - 4.98
3 Hexagonal 376.40 56.73 17.32 4645.80 22.21
4 Decagonal 605.70 71.22 41.03 7118.50 10.75
On comparison of values from the experimentation (Table 5.2), it is evident that relative
S.E.A values of various crash boxes after application of front end triggers are changed when
observed for S.E.A values of crash boxes without trigger (Table 5.1), except that the
cylindrical crash box has reduction in S.E.A. Square crash box has a S.E.A (3723.2 J/kg)
more than the cylindrical crash box (3524.7 J/kg) whereas the hexagonal crash box has a
higher S.E.A of 4645.8 J/kg and the decagonal has the highest value for S.E.A (7118.5 J/kg).
The percentage change in S.E.A values from the case of without trigger to the case of front
end trigger for different crash boxes is far more interesting. The hexagonal crash box gains
the most with a change of 22.21% in comparison the change of 10.75% for decagonal and
7.49% for square crash box. The cylindrical crash box in fact has a negative gain of -4.98%
indicating that the front end trigger is not beneficial for this geometric shape of crash box.
It is also interesting to observe from Tables 5.2 and 5.1 that the primary peak force values
for all crash boxes is lower in the cases with front end trigger than that of the cases without
triggers. This is because of the fact that after provision of front end trigger, the crash boxes
more easily undergo initial deformation due to the presence of triggers at the impacted end,
which reduces the resistance to deformation. This phenomenon of improved initiation of
deformation helps in the crash boxes in further easily undergoing the subsequent progressive
deformation, resulting in an improved net total amount of energy absorbed.
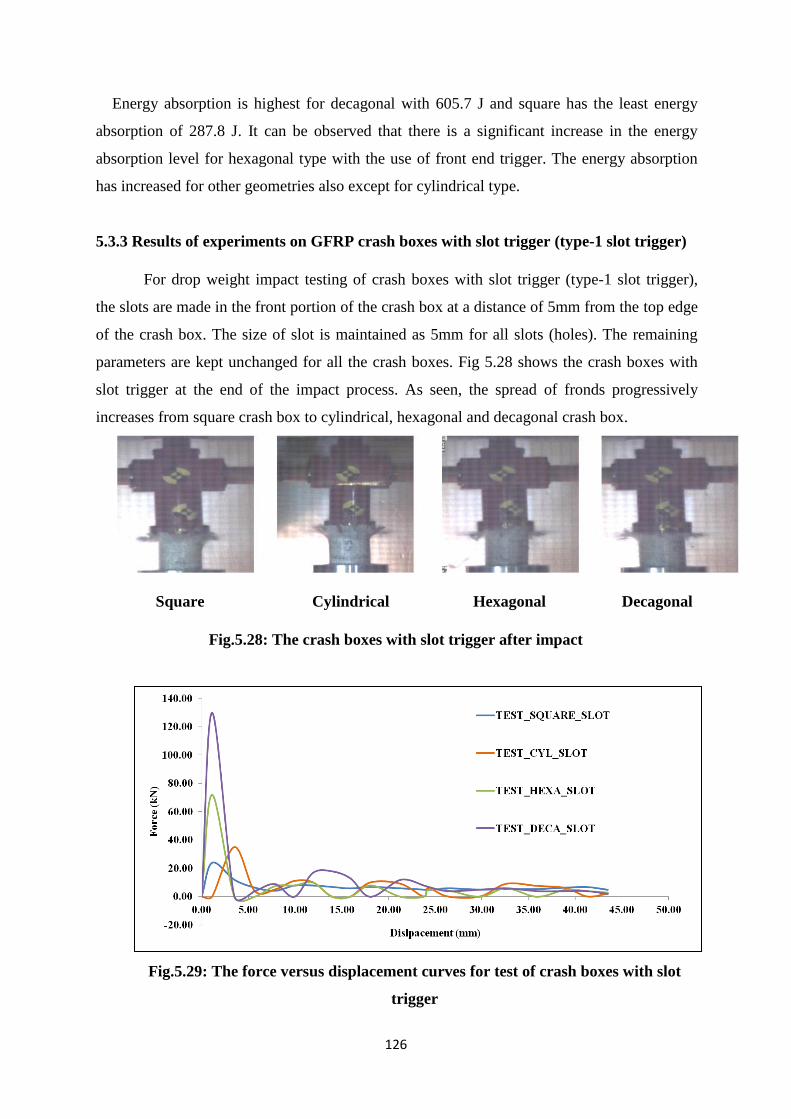
126
Energy absorption is highest for decagonal with 605.7 J and square has the least energy
absorption of 287.8 J. It can be observed that there is a significant increase in the energy
absorption level for hexagonal type with the use of front end trigger. The energy absorption
has increased for other geometries also except for cylindrical type.
5.3.3 Results of experiments on GFRP crash boxes with slot trigger (type-1 slot trigger)
For drop weight impact testing of crash boxes with slot trigger (type-1 slot trigger),
the slots are made in the front portion of the crash box at a distance of 5mm from the top edge
of the crash box. The size of slot is maintained as 5mm for all slots (holes). The remaining
parameters are kept unchanged for all the crash boxes. Fig 5.28 shows the crash boxes with
slot trigger at the end of the impact process. As seen, the spread of fronds progressively
increases from square crash box to cylindrical, hexagonal and decagonal crash box.
Square Cylindrical Hexagonal Decagonal
Fig.5.28: The crash boxes with slot trigger after impact
Fig.5.29: The force versus displacement curves for test of crash boxes with slot
trigger
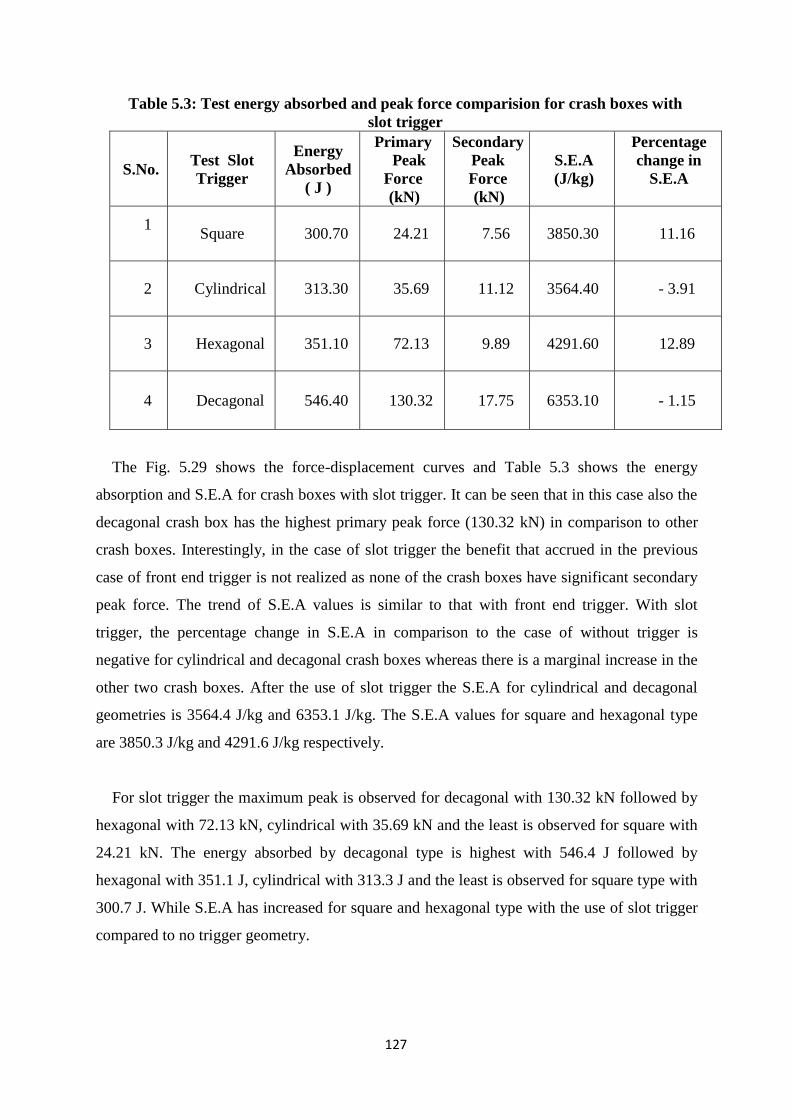
127
Table 5.3: Test energy absorbed and peak force comparision for crash boxes with
slot trigger
S.No. Test Slot
Trigger
Energy
Absorbed
( J )
Primary
Peak
Force
(kN)
Secondary
Peak
Force
(kN)
S.E.A
(J/kg)
Percentage
change in
S.E.A
1
Square 300.70 24.21 7.56 3850.30 11.16
2 Cylindrical 313.30 35.69 11.12 3564.40 - 3.91
3 Hexagonal 351.10 72.13 9.89 4291.60 12.89
4 Decagonal 546.40 130.32 17.75 6353.10 - 1.15
The Fig. 5.29 shows the force-displacement curves and Table 5.3 shows the energy
absorption and S.E.A for crash boxes with slot trigger. It can be seen that in this case also the
decagonal crash box has the highest primary peak force (130.32 kN) in comparison to other
crash boxes. Interestingly, in the case of slot trigger the benefit that accrued in the previous
case of front end trigger is not realized as none of the crash boxes have significant secondary
peak force. The trend of S.E.A values is similar to that with front end trigger. With slot
trigger, the percentage change in S.E.A in comparison to the case of without trigger is
negative for cylindrical and decagonal crash boxes whereas there is a marginal increase in the
other two crash boxes. After the use of slot trigger the S.E.A for cylindrical and decagonal
geometries is 3564.4 J/kg and 6353.1 J/kg. The S.E.A values for square and hexagonal type
are 3850.3 J/kg and 4291.6 J/kg respectively.
For slot trigger the maximum peak is observed for decagonal with 130.32 kN followed by
hexagonal with 72.13 kN, cylindrical with 35.69 kN and the least is observed for square with
24.21 kN. The energy absorbed by decagonal type is highest with 546.4 J followed by
hexagonal with 351.1 J, cylindrical with 313.3 J and the least is observed for square type with
300.7 J. While S.E.A has increased for square and hexagonal type with the use of slot trigger
compared to no trigger geometry.
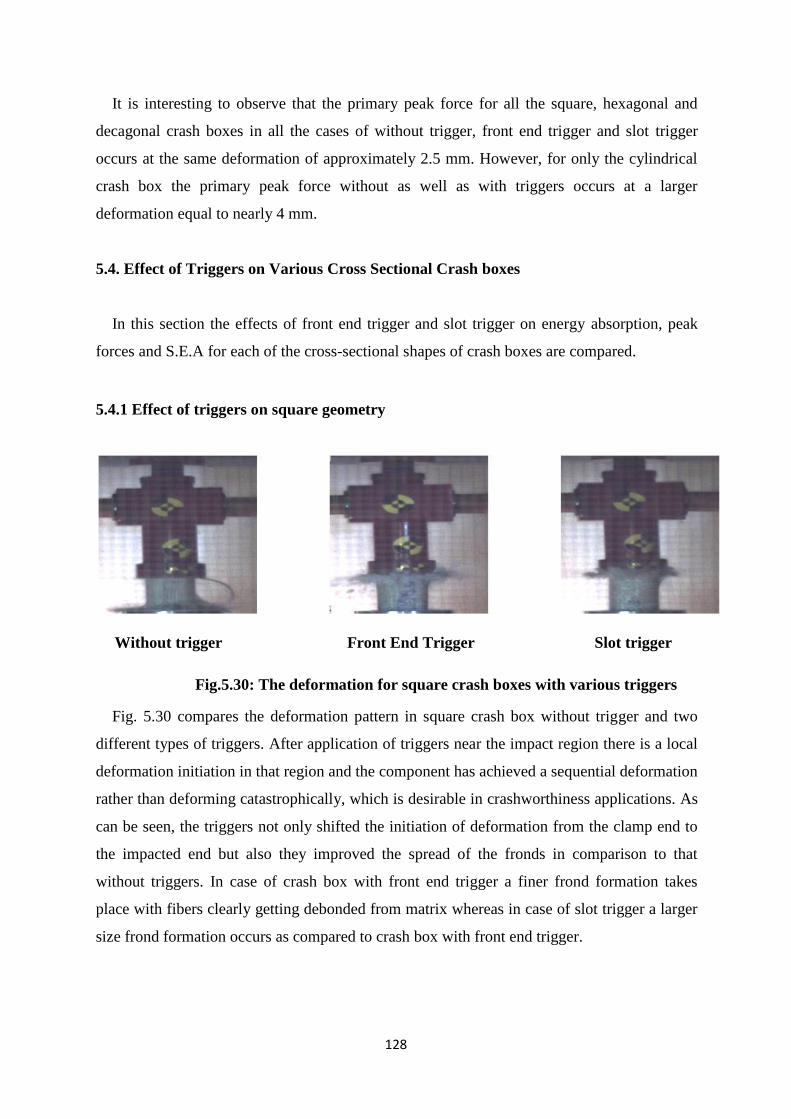
128
It is interesting to observe that the primary peak force for all the square, hexagonal and
decagonal crash boxes in all the cases of without trigger, front end trigger and slot trigger
occurs at the same deformation of approximately 2.5 mm. However, for only the cylindrical
crash box the primary peak force without as well as with triggers occurs at a larger
deformation equal to nearly 4 mm.
5.4. Effect of Triggers on Various Cross Sectional Crash boxes
In this section the effects of front end trigger and slot trigger on energy absorption, peak
forces and S.E.A for each of the cross-sectional shapes of crash boxes are compared.
5.4.1 Effect of triggers on square geometry
Without trigger Front End Trigger Slot trigger
Fig.5.30: The deformation for square crash boxes with various triggers
Fig. 5.30 compares the deformation pattern in square crash box without trigger and two
different types of triggers. After application of triggers near the impact region there is a local
deformation initiation in that region and the component has achieved a sequential deformation
rather than deforming catastrophically, which is desirable in crashworthiness applications. As
can be seen, the triggers not only shifted the initiation of deformation from the clamp end to
the impacted end but also they improved the spread of the fronds in comparison to that
without triggers. In case of crash box with front end trigger a finer frond formation takes
place with fibers clearly getting debonded from matrix whereas in case of slot trigger a larger
size frond formation occurs as compared to crash box with front end trigger.
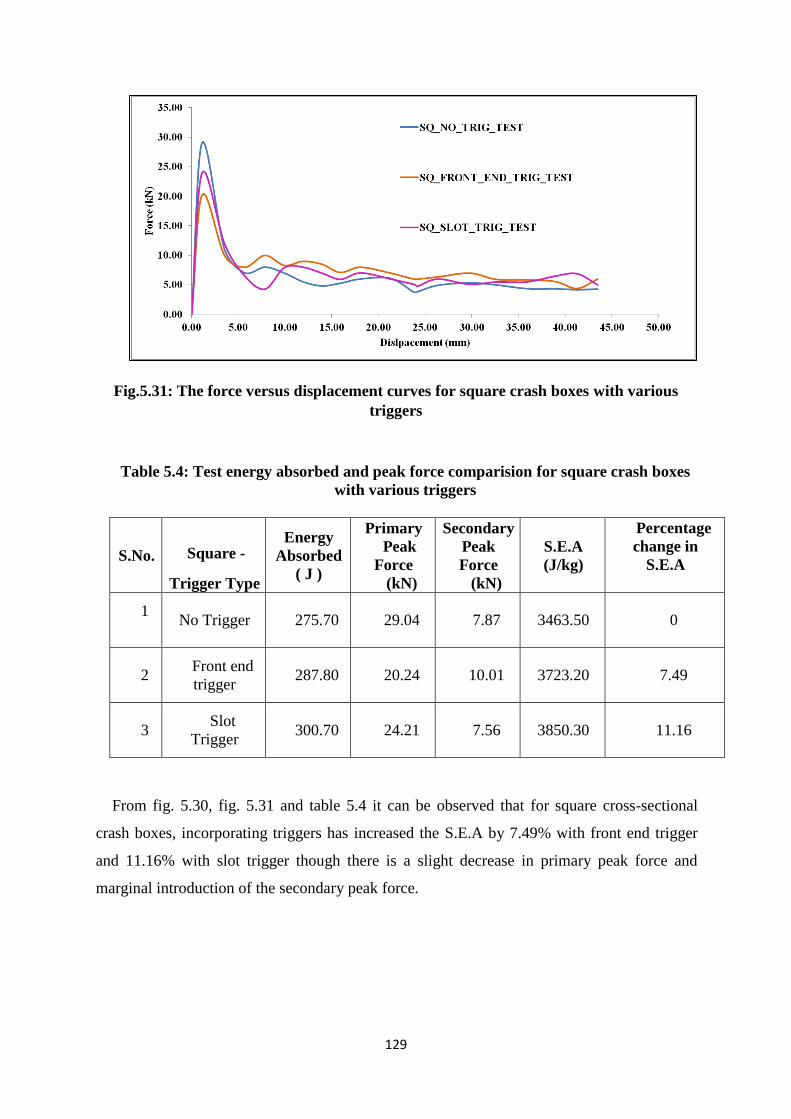
129
Fig.5.31: The force versus displacement curves for square crash boxes with various
triggers
Table 5.4: Test energy absorbed and peak force comparision for square crash boxes
with various triggers
S.No.
Square -
Trigger Type
Energy
Absorbed
( J )
Primary
Peak
Force
(kN)
Secondary
Peak
Force
(kN)
S.E.A
(J/kg)
Percentage
change in
S.E.A
1
No Trigger 275.70 29.04 7.87 3463.50 0
2 Front end
trigger 287.80 20.24 10.01 3723.20 7.49
3 Slot
Trigger 300.70 24.21 7.56 3850.30 11.16
From fig. 5.30, fig. 5.31 and table 5.4 it can be observed that for square cross-sectional
crash boxes, incorporating triggers has increased the S.E.A by 7.49% with front end trigger
and 11.16% with slot trigger though there is a slight decrease in primary peak force and
marginal introduction of the secondary peak force.
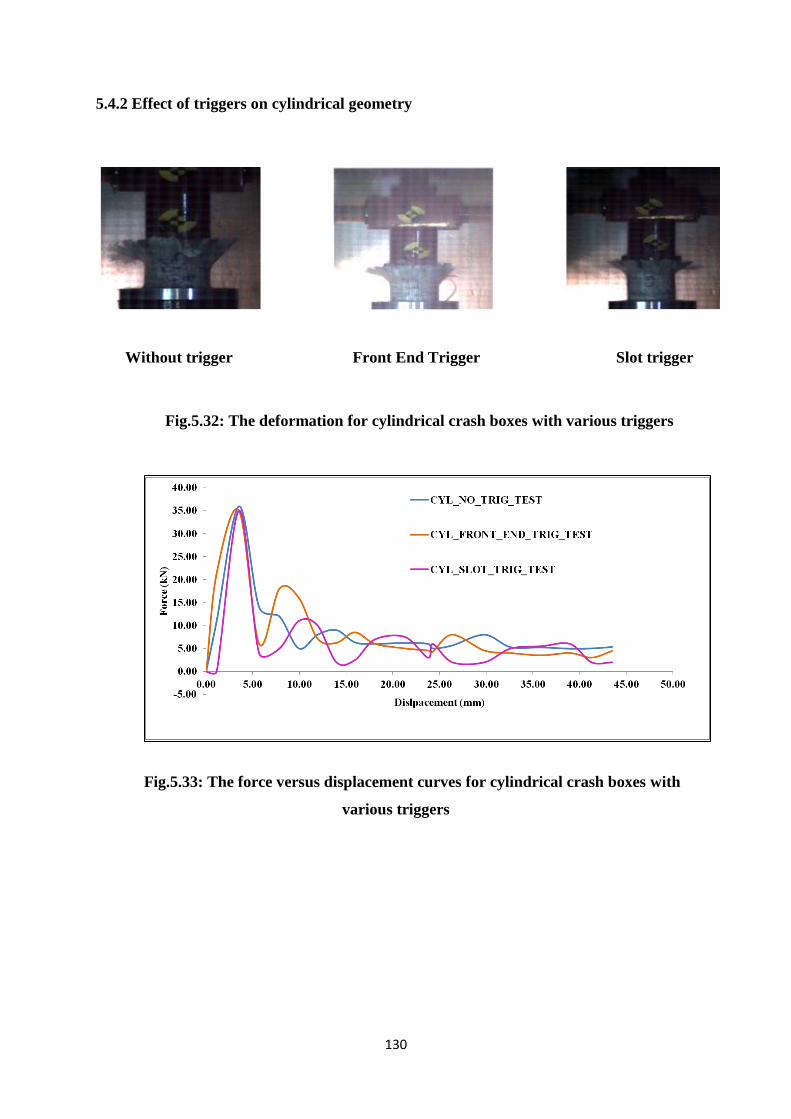
130
5.4.2 Effect of triggers on cylindrical geometry
Without trigger Front End Trigger Slot trigger
Fig.5.32: The deformation for cylindrical crash boxes with various triggers
Fig.5.33: The force versus displacement curves for cylindrical crash boxes with
various triggers
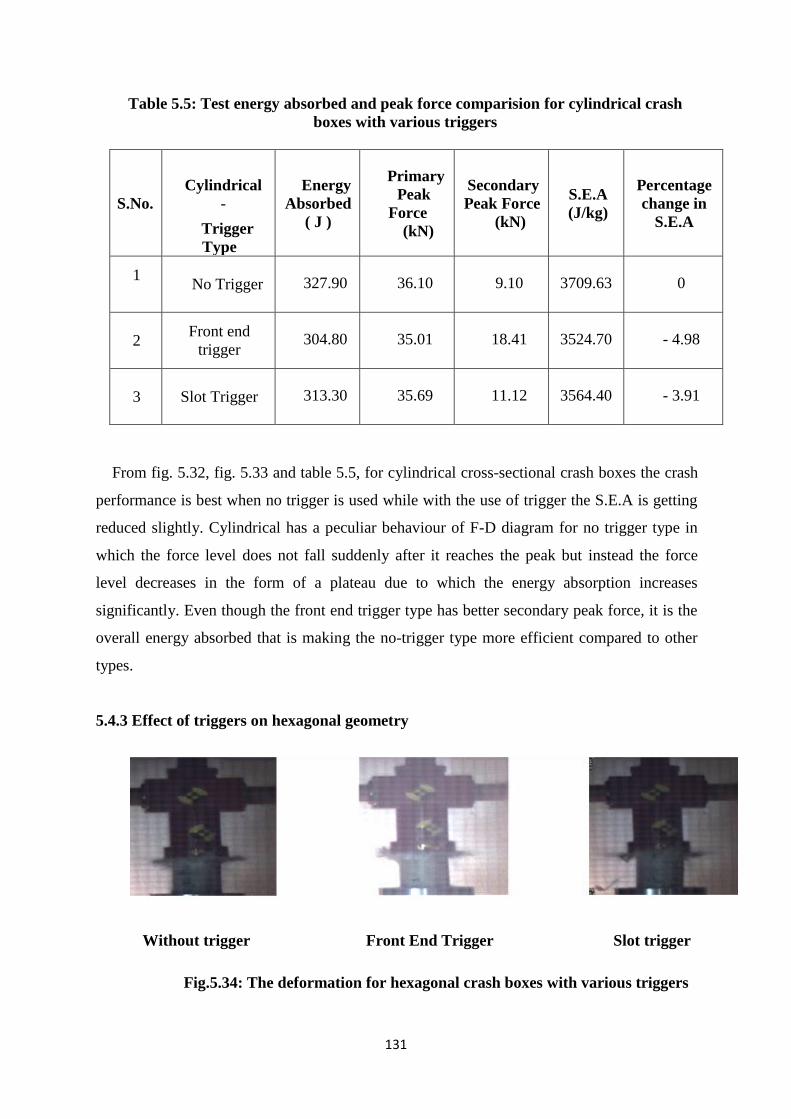
131
Table 5.5: Test energy absorbed and peak force comparision for cylindrical crash
boxes with various triggers
S.No.
Cylindrical
-
Trigger
Type
Energy
Absorbed
( J )
Primary
Peak
Force
(kN)
Secondary
Peak Force
(kN)
S.E.A
(J/kg)
Percentage
change in
S.E.A
1
No Trigger 327.90 36.10 9.10 3709.63 0
2 Front end
trigger 304.80 35.01 18.41 3524.70 - 4.98
3 Slot Trigger 313.30 35.69 11.12 3564.40 - 3.91
From fig. 5.32, fig. 5.33 and table 5.5, for cylindrical cross-sectional crash boxes the crash
performance is best when no trigger is used while with the use of trigger the S.E.A is getting
reduced slightly. Cylindrical has a peculiar behaviour of F-D diagram for no trigger type in
which the force level does not fall suddenly after it reaches the peak but instead the force
level decreases in the form of a plateau due to which the energy absorption increases
significantly. Even though the front end trigger type has better secondary peak force, it is the
overall energy absorbed that is making the no-trigger type more efficient compared to other
types.
5.4.3 Effect of triggers on hexagonal geometry
Without trigger Front End Trigger Slot trigger
Fig.5.34: The deformation for hexagonal crash boxes with various triggers
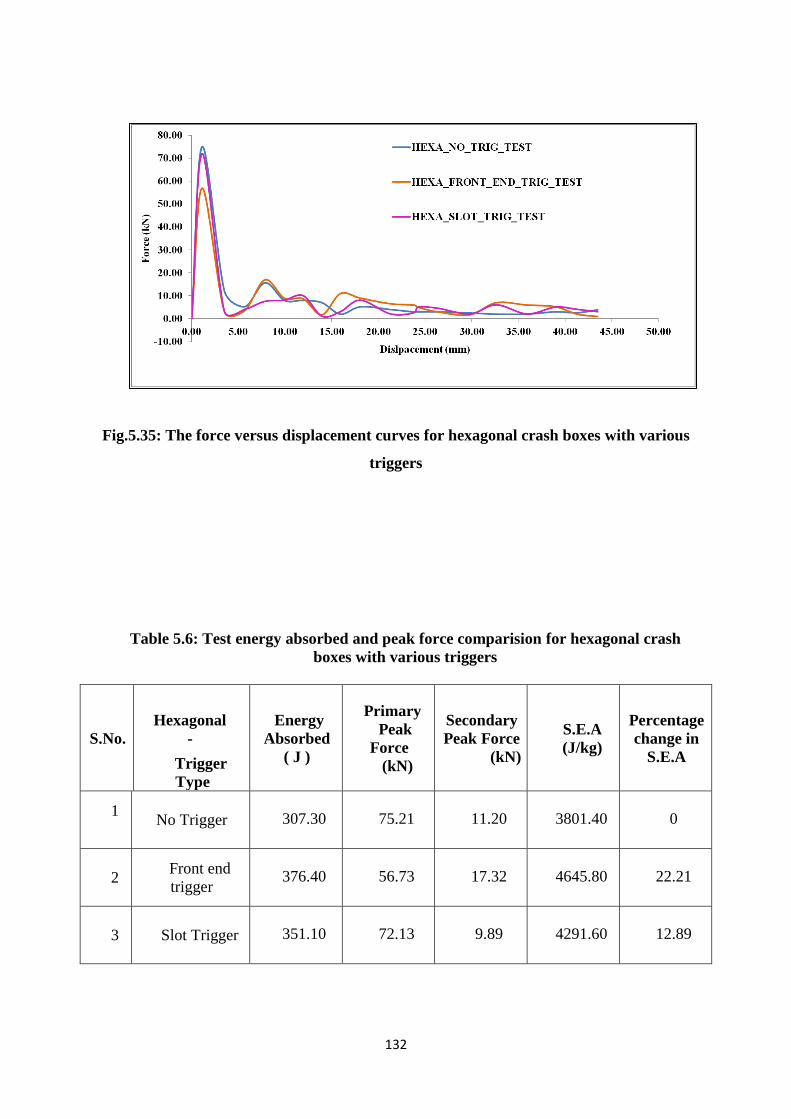
132
Fig.5.35: The force versus displacement curves for hexagonal crash boxes with various
triggers
Table 5.6: Test energy absorbed and peak force comparision for hexagonal crash
boxes with various triggers
S.No.
Hexagonal
-
Trigger
Type
Energy
Absorbed
( J )
Primary
Peak
Force
(kN)
Secondary
Peak Force
(kN)
S.E.A
(J/kg)
Percentage
change in
S.E.A
1
No Trigger 307.30 75.21 11.20 3801.40 0
2 Front end
trigger 376.40 56.73 17.32 4645.80 22.21
3 Slot Trigger 351.10 72.13 9.89 4291.60 12.89
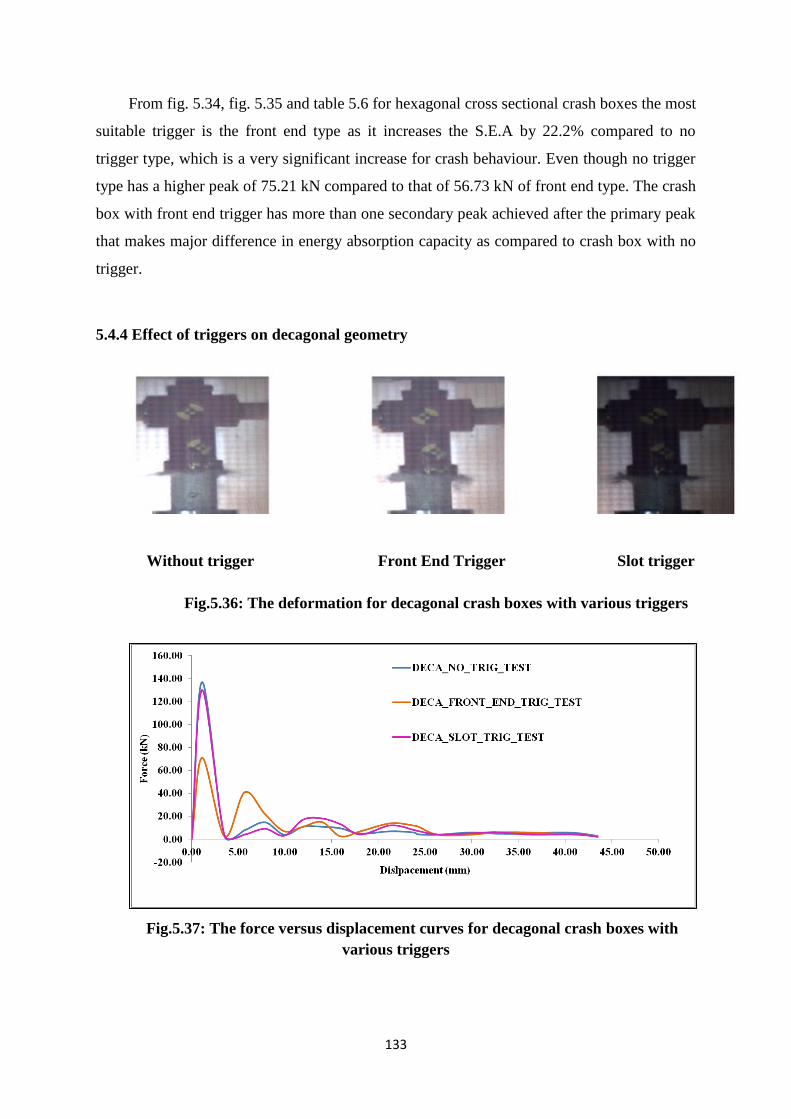
133
From fig. 5.34, fig. 5.35 and table 5.6 for hexagonal cross sectional crash boxes the most
suitable trigger is the front end type as it increases the S.E.A by 22.2% compared to no
trigger type, which is a very significant increase for crash behaviour. Even though no trigger
type has a higher peak of 75.21 kN compared to that of 56.73 kN of front end type. The crash
box with front end trigger has more than one secondary peak achieved after the primary peak
that makes major difference in energy absorption capacity as compared to crash box with no
trigger.
5.4.4 Effect of triggers on decagonal geometry
Without trigger Front End Trigger Slot trigger
Fig.5.36: The deformation for decagonal crash boxes with various triggers
Fig.5.37: The force versus displacement curves for decagonal crash boxes with
various triggers
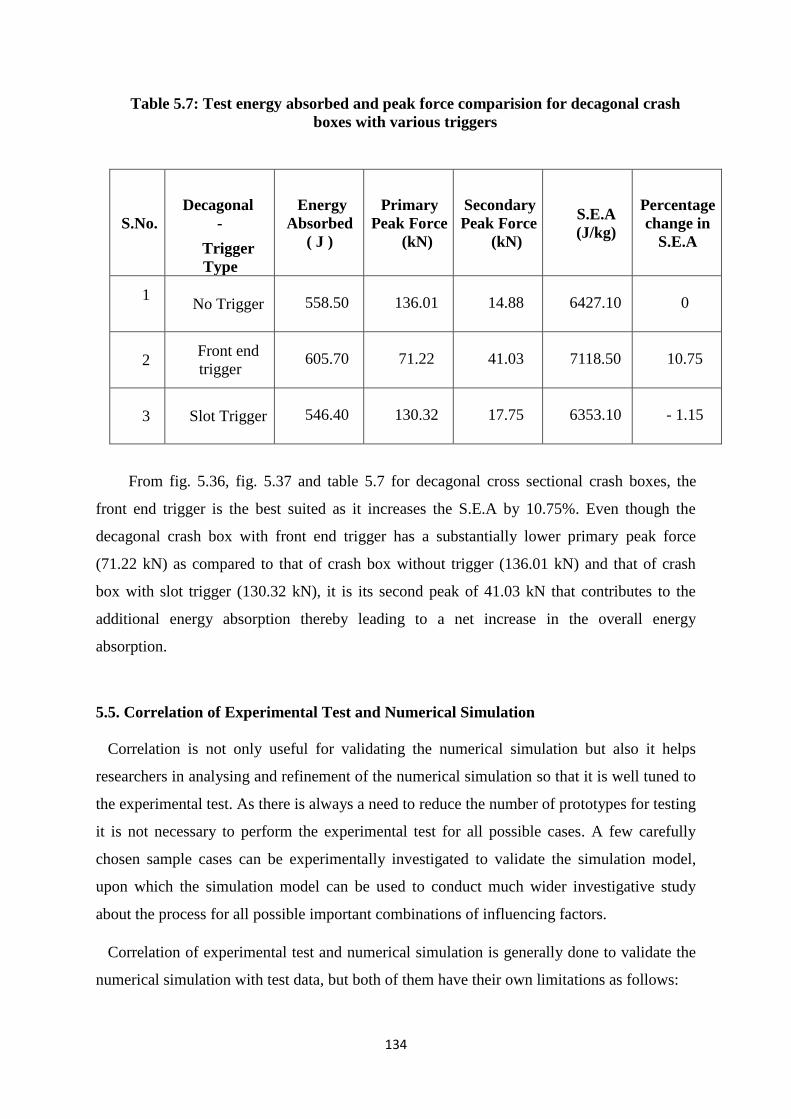
134
Table 5.7: Test energy absorbed and peak force comparision for decagonal crash
boxes with various triggers
S.No.
Decagonal
-
Trigger
Type
Energy
Absorbed
( J )
Primary
Peak Force
(kN)
Secondary
Peak Force
(kN)
S.E.A
(J/kg)
Percentage
change in
S.E.A
1
No Trigger 558.50 136.01 14.88 6427.10 0
2 Front end
trigger 605.70 71.22 41.03 7118.50 10.75
3 Slot Trigger 546.40 130.32 17.75 6353.10 - 1.15
From fig. 5.36, fig. 5.37 and table 5.7 for decagonal cross sectional crash boxes, the
front end trigger is the best suited as it increases the S.E.A by 10.75%. Even though the
decagonal crash box with front end trigger has a substantially lower primary peak force
(71.22 kN) as compared to that of crash box without trigger (136.01 kN) and that of crash
box with slot trigger (130.32 kN), it is its second peak of 41.03 kN that contributes to the
additional energy absorption thereby leading to a net increase in the overall energy
absorption.
5.5. Correlation of Experimental Test and Numerical Simulation
Correlation is not only useful for validating the numerical simulation but also it helps
researchers in analysing and refinement of the numerical simulation so that it is well tuned to
the experimental test. As there is always a need to reduce the number of prototypes for testing
it is not necessary to perform the experimental test for all possible cases. A few carefully
chosen sample cases can be experimentally investigated to validate the simulation model,
upon which the simulation model can be used to conduct much wider investigative study
about the process for all possible important combinations of influencing factors.
Correlation of experimental test and numerical simulation is generally done to validate the
numerical simulation with test data, but both of them have their own limitations as follows:
135
Experimental tests are influenced by many factors like dissimilarities or imperfections
present in the samples being tested. Whereas simulation does not take into account the
imperfections present in the samples like for example voids or impurities in the samples.
Experimental tests are influenced by the frictional forces between the moving parts of the
equipment. Whereas simulation does not consider the frictional losses during the
movement of parts in the equipment.
In numerical simulation the component is considered to be uniform throughout the
geometry but this may not be the practical case as the component may not be uniform
due to imperfections and this may vary the strength of the component.
Simulation is based on theories which govern its behaviour. These theories may involve
many assumptions made for simplification of the problem solving.
Numerical simulations depend on the material model chosen for defining the material of
the specimen. And it is a well-known fact that many parameters are set as default for
stability purpose in the background of the commercial numerical solving codes available
in the market for example LS-DYNA, Abaqus explicit etc.,
Numerical simulation is also dependent on mesh flow and mesh size of the elements used
for the structure.
Experimental tests are dependent on the efficiency and accuracy of the instrumentation
used for data acquisition and recording.
Numerical simulation depends on assumptions made when applying boundary conditions
like for example fixed end, pinned support for simplification of the problem definition.
Experimental test depends on the design of experimental setup as well as the losses
incurred during the reading of measuring values.
Numerical simulation also depends on the computing capacity and the hardware used for
solving.
5.5.1 Need for Correlation of Experimental Test and Numerical Simulation
Pre-test simulations are useful for determining the behaviour of structure as they provide
an approximate picture of crash event beforehand. Later the numerical simulation is
correlated with the experimental test so that it is beneficial for analyzing the various
possibilities for optimizing the structure. Experimental test gives real time failure mode but
detailed analysis during the crash event is not possible, as we can analyze only after the test.
136
Numerical simulation provides not only approximate scenario of the crash event but it also
provides a time history based result which can be analyzed even during the crash event.
In this study earlier (chapter-3), component level analysis was performed in the pre-test
numerical simulation for the composite GFRP crash box, which was very helpful in
determining the force and energy analysis. Even though the pre-test numerical simulation of
component level analysis of GFRP crash box was good at predicting the force and energy
levels for the crashworthiness, it was not sufficient to exactly replicate the complex
deformation modes of the laminated GFRP crash box and needed to be modified as per drop
weight impact test. In order to correlate the drop weight impacting with numerical simulation,
few updates are required to be made to the pre-test numerical simulation model such as; the
GFRP crash box is to be modeled using two layers of laminates as the required thickness (1.8
mm) for the crash box was achieved by using two layers of glass fiber mat (0.9 mm each)
during manufacturing of specimens (chapter-4).The impactor needs to be modeled as per the
impactor used in the experimental test (drop-weight testing impactor). The boundary
conditions are to be modified as per the test scenario like the crash box is in contact with the
specimen clamp at the bottom end and the bottom edge of the specimen is in contact with the
base plate.
Numerical simulation of drop weight impact testing of the GFRP crash boxes is done
for the purpose of correlation between the experimental test and numerical simulation. The
details of the numerical simulation for drop weight impact testing are further explained in
detail in the next section.
5.5.2 Numerical Simulation of Drop Weight Impact Testing of GFRP Crash Boxes
For the purpose of correlation with the drop weight impact testing the numerical
simulation model was updated as follows. The rigid impactor is modelled similar to drop
weight test impactor. The specimen-clamp which holds the specimen is modelled such that it
touches the internal surface of the specimen at bottom, without any interference (as in the real
test). The specimen is placed on the specimen-clamp which is attached to the base plate. The
required contacts are defined between the specimen and specimen-clamp, using
*CONTACT_SURFACE_TO_SURFACE card, with friction coefficient equal to 0.4. The
specimen-clamp and the base plate are attached to each other. Using
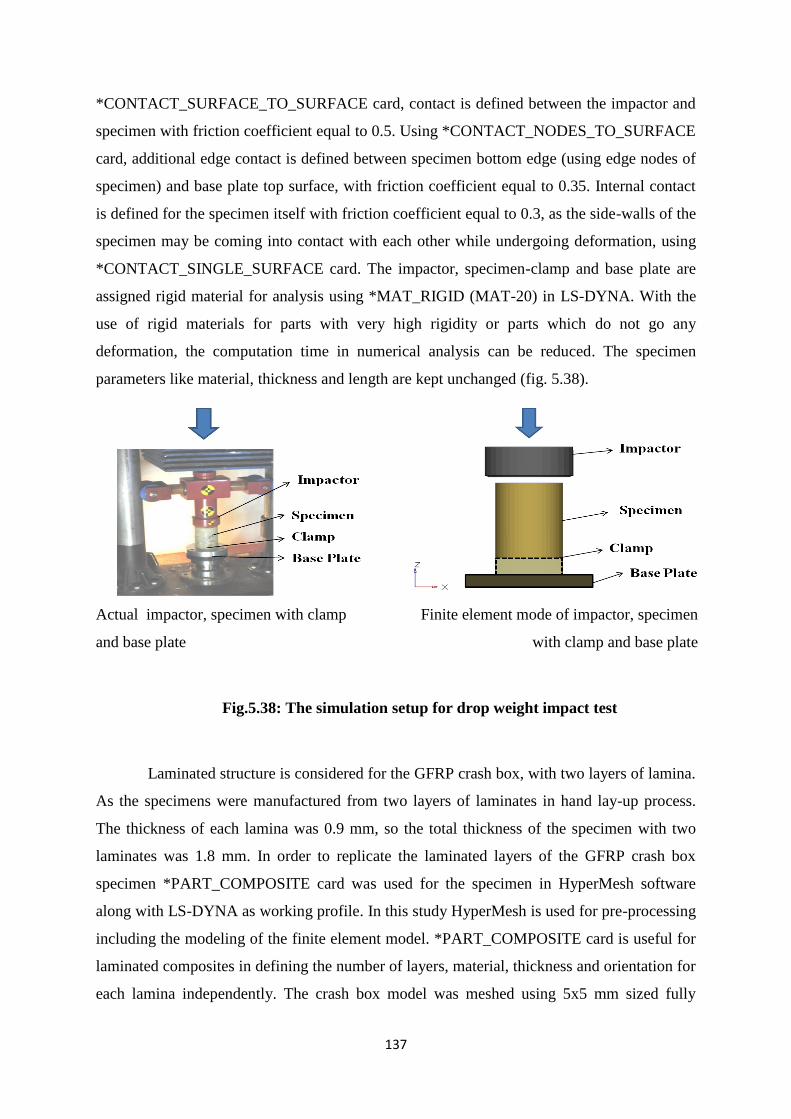
137
*CONTACT_SURFACE_TO_SURFACE card, contact is defined between the impactor and
specimen with friction coefficient equal to 0.5. Using *CONTACT_NODES_TO_SURFACE
card, additional edge contact is defined between specimen bottom edge (using edge nodes of
specimen) and base plate top surface, with friction coefficient equal to 0.35. Internal contact
is defined for the specimen itself with friction coefficient equal to 0.3, as the side-walls of the
specimen may be coming into contact with each other while undergoing deformation, using
*CONTACT_SINGLE_SURFACE card. The impactor, specimen-clamp and base plate are
assigned rigid material for analysis using *MAT_RIGID (MAT-20) in LS-DYNA. With the
use of rigid materials for parts with very high rigidity or parts which do not go any
deformation, the computation time in numerical analysis can be reduced. The specimen
parameters like material, thickness and length are kept unchanged (fig. 5.38).
Actual impactor, specimen with clamp
and base plate
Finite element mode of impactor, specimen
with clamp and base plate
Fig.5.38: The simulation setup for drop weight impact test
Laminated structure is considered for the GFRP crash box, with two layers of lamina.
As the specimens were manufactured from two layers of laminates in hand lay-up process.
The thickness of each lamina was 0.9 mm, so the total thickness of the specimen with two
laminates was 1.8 mm. In order to replicate the laminated layers of the GFRP crash box
specimen *PART_COMPOSITE card was used for the specimen in HyperMesh software
along with LS-DYNA as working profile. In this study HyperMesh is used for pre-processing
including the modeling of the finite element model. *PART_COMPOSITE card is useful for
laminated composites in defining the number of layers, material, thickness and orientation for
each lamina independently. The crash box model was meshed using 5x5 mm sized fully

138
integrated shell elements (ELFORM 16). Advantage of using fully integrated elements is that
with increased number of integration points (NIP) these elements are capable of predicting
the deformation in detailed manner at all the nodal coordinates of the element including
element bending and also these elements are helpful in avoiding hour-glass effect which is
observed in elements with less number of integration points. The components were modelled
in the mid - surface of the thickness for each part and thickness applied to each part is equally
added and offset on either sides of the mid – surface. As the specimens were manufactured
from two layers of laminates in hand lay-up process, number of plies (lamina) were also used
as two in *PART_COMPOSITE. The thickness of each lamina/ply was 0.9 mm, so the total
thickness of the specimen made of two laminates was 1.8 mm. Shown in example of
*PART_COMPOSITE card (Fig.5.39). The LS-DYNA keywords *PART_COMPOSITE and
*MAT 58 (MAT_LAMINATED_COMPOSITE_FABRIC) are linked to each other using the
material id (MID), here material id for GFRP is ‘2’ (MID=2). In *PART_COMPOSITE it is
possible to arrange the composite’s ply material, stacks, and its orientation according to the
laminate configurations of the particular composite material. Here as the crash boxes were
made of uni-directional fiber layout, hence the angles for fiber orientation {B(1), B(2)} are
kept as zero (0).
Fig.5.39: PART_COMPOSITE configuration in HyperMesh software
The numerical simulation was carried out in similar conditions, as those of drop
weight impact testing of the crash boxes to replicate the experimental test through numerical
simulation, so that the numerical simulation model can be correlated with the experimental
test as close as possible. The specimen parameters like material, thickness and length are kept
unchanged for all the cases used in this investigation.
139
In LS-DYNA, MAT-58 (MAT_LAMINATED_COMPOSITE_FABRIC) is used for
composite components modelled with shell elements. LS-DYNA provides additional controls
for composite material models in *Control Shell Card, for controlling the shell elements with
the help of laminated theory which is beneficial for MAT-58
(MAT_LAMINATED_COMPOSITE_FABRIC). In order to activate the laminated theory for
composite in this analysis, LAMSHT is activated using a value equal to one (LAMSHT=1) in
*Control Shell Card. Lamination theory is applied to correct for the assumption of a uniform
constant shear strain through the thickness of the shell. Unless this correction is applied, the
stiffness of the shell can be grossly incorrect if there are drastic differences in the elastic
constants from ply to ply, especially for sandwich type shells. Generally, without this
correction the results are too stiff. For the discrete Kirchhoff shell elements (which do not
consider transverse shear) this option is ignored.
5.5.2.1 Calibration of Simulation Parameters in LS-DYNA
Finite element simulation softwares use various types of non-physical parameters,
which are mainly used for the purpose of stability and convergence of the problem for
explicit analysis such as crash impacts. LS-DYNA also uses many such parameters. These
parameters have a considerable influence on the numerical simulation result. Many of these
parameters use default values assigned automatically in the backend by the solver code, used
by the finite element simulation software in absence of specific values as input from the user.
But it is advisable that the user calibrates these values with the help of experiments for
attaining a close correlation between the numerical simulation and experimentation.
In numerical simulation of impacts using LS-DYNA, the force value depends on
parameters like longitudinal compression stress limiting factor (SLIMC1) and softness factor
(SOFT) for the crash-front elements (row of elements in the component present near the
impacted region and these elements undergo deformations prior to other elements in the
model during simulation). Providing higher values for the above mention parameters results
in higher force values and vice-versa. Therefore, a justified value was needed to be assigned
to these parameters which could help in getting closer results for simulations on comparison
with results of experiments. These parameters were adjusted/calibrated based on
experimental data using past experience and as well as trial-and-error technique so that a
close relevance can be achieved between numerical simulation and experimentation
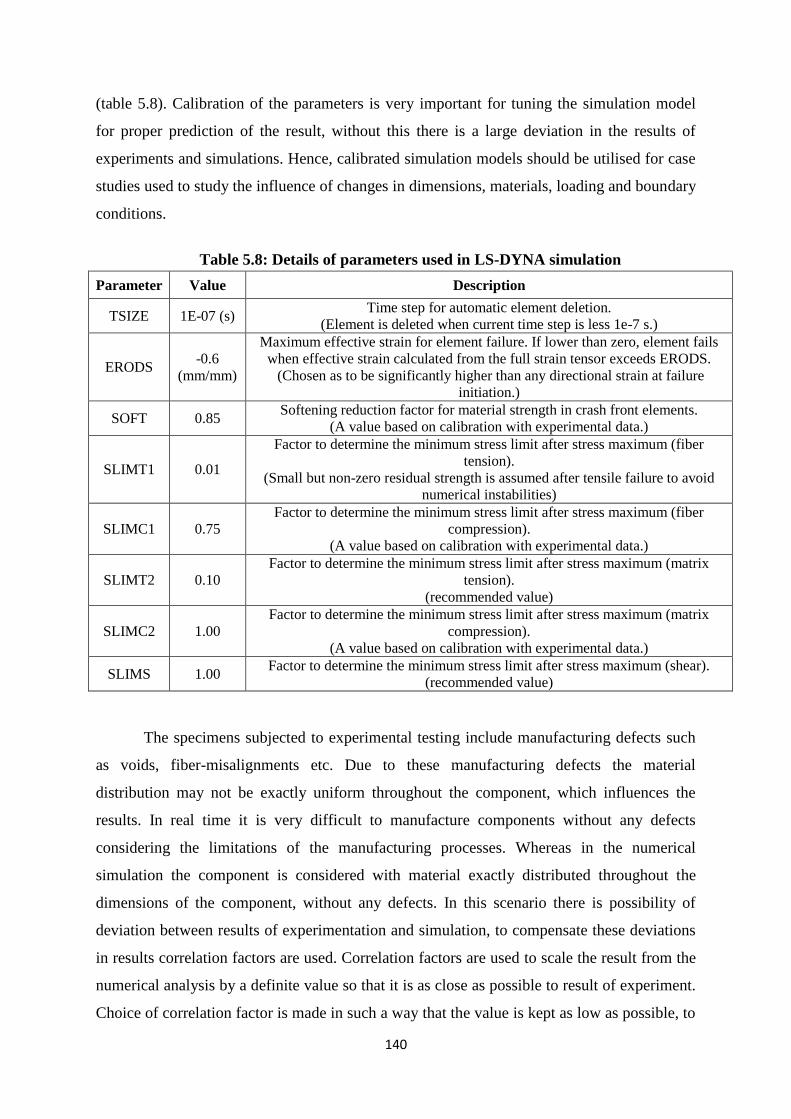
140
(table 5.8). Calibration of the parameters is very important for tuning the simulation model
for proper prediction of the result, without this there is a large deviation in the results of
experiments and simulations. Hence, calibrated simulation models should be utilised for case
studies used to study the influence of changes in dimensions, materials, loading and boundary
conditions.
Table 5.8: Details of parameters used in LS-DYNA simulation
Parameter Value Description
TSIZE 1E-07 (s) Time step for automatic element deletion.
(Element is deleted when current time step is less 1e-7 s.)
ERODS -0.6
(mm/mm)
Maximum effective strain for element failure. If lower than zero, element fails
when effective strain calculated from the full strain tensor exceeds ERODS.
(Chosen as to be significantly higher than any directional strain at failure
initiation.)
SOFT 0.85 Softening reduction factor for material strength in crash front elements.
(A value based on calibration with experimental data.)
SLIMT1 0.01
Factor to determine the minimum stress limit after stress maximum (fiber
tension).
(Small but non-zero residual strength is assumed after tensile failure to avoid
numerical instabilities)
SLIMC1 0.75
Factor to determine the minimum stress limit after stress maximum (fiber
compression).
(A value based on calibration with experimental data.)
SLIMT2 0.10
Factor to determine the minimum stress limit after stress maximum (matrix
tension).
(recommended value)
SLIMC2 1.00
Factor to determine the minimum stress limit after stress maximum (matrix
compression).
(A value based on calibration with experimental data.)
SLIMS 1.00 Factor to determine the minimum stress limit after stress maximum (shear).
(recommended value)
The specimens subjected to experimental testing include manufacturing defects such
as voids, fiber-misalignments etc. Due to these manufacturing defects the material
distribution may not be exactly uniform throughout the component, which influences the
results. In real time it is very difficult to manufacture components without any defects
considering the limitations of the manufacturing processes. Whereas in the numerical
simulation the component is considered with material exactly distributed throughout the
dimensions of the component, without any defects. In this scenario there is possibility of
deviation between results of experimentation and simulation, to compensate these deviations
in results correlation factors are used. Correlation factors are used to scale the result from the
numerical analysis by a definite value so that it is as close as possible to result of experiment.
Choice of correlation factor is made in such a way that the value is kept as low as possible, to

141
avoid over prediction of result of numerical analysis, this is done based on the experience as
well as trial and error-technique. In this study a correlation factor of 0.15 was chosen to scale
the result of numerical simulation, for its correlation with experimental drop weight impact
testing.
5.5.3 Correlation of Drop Weight Impact Test and Numerical Simulation for GFRP
Crash Boxes
In this section correlation is done for numerical simulation of drop weight impact test
and the actual experimental test. Objective comparisons of relevant quantities extracted from
experimental test as well as numerical simulation are presented for all the specimens of crash
boxes which were subjected to experimental drop weight impact testing.
5.5.3.1 Correlation of square crash boxes
i) Square crash boxes without trigger
Test Simulation
Fig.5.40: The deformation of square crash boxes without trigger in test and simulation

142
Fig.5.41: The force versus displacement curves for square crash box without
trigger in test and simulation
Table 5.9: Energy absorbed and force level comparision of test and
simulation for square crash box without trigger
S.No
Square -
No Trigger
Energy
Absorbed
( J )
Primary
Peak
Force
(kN)
Secondary
Peak
Force
(kN)
Mean
Crush
Force (kN)
S.E.A
(J/kg)
Percentage
change in
S.E.A
1
Test 275.7 29.04 7.87 6.50 3463.5 0
2 Simulation 308.8 33.21 8.20 7.54 3879.1 12.2
From fig. 5.40 the deformation mode of the square crash box in numerical simulation
is similar to experimental test; that is the deformation occurs at the clamped end (non-
impacted end) of the specimen leading to spread of fronds at the clamped end of the
specimen. From fig. 5.41, the numerical simulation has a slightly higher primary peak force
when compared to experimental test because simulation models are stiffer in the initial stage
of analysis during solving as they do not consider the non-uniformity in the component, to
compensate this use of softness parameter (SOFT) is done so that the stiffness of crash-front
elements can be reduced but high values of SOFT leads to reduction in the overall force level,
hence a balanced value was assigned. It was observed that, longitudinal compression stress
limiting factor (SLIMC1) had a greater influence on the mean force level, and it was
calibrated in combination with softness parameter (SOFT) for a reasonably good resemblance
with the experimental result. Therefore, the overall force-displacement behaviour is close
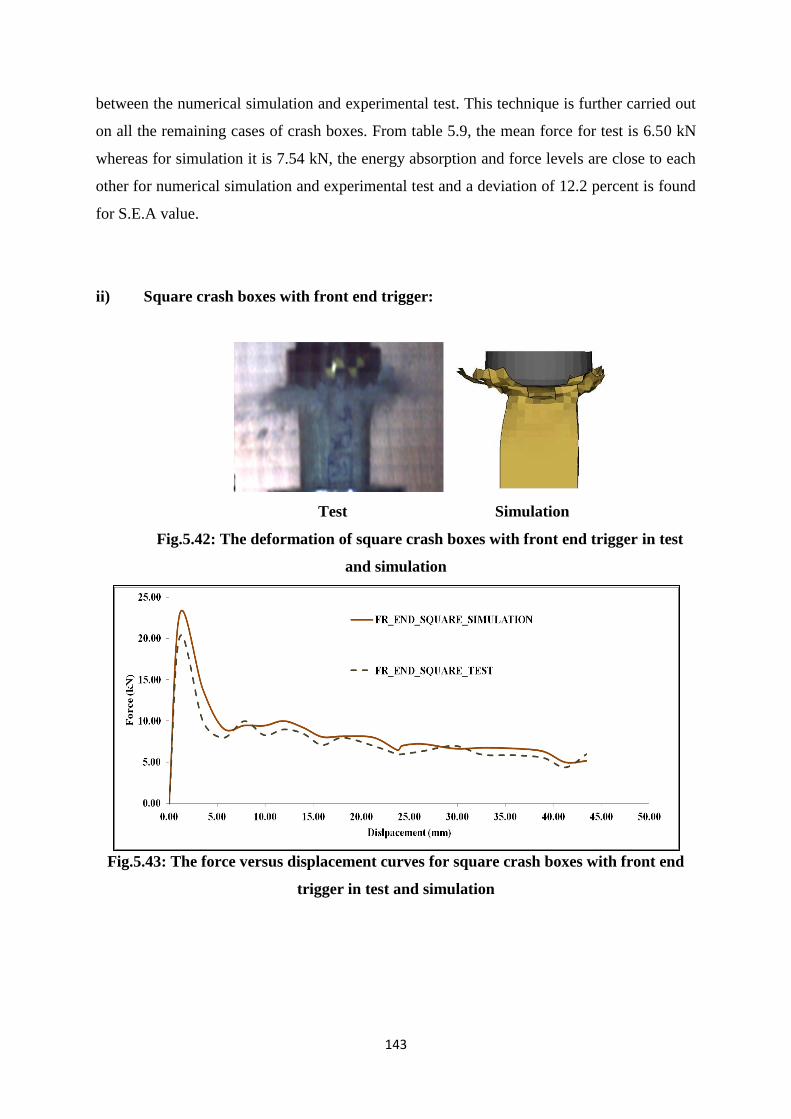
143
between the numerical simulation and experimental test. This technique is further carried out
on all the remaining cases of crash boxes. From table 5.9, the mean force for test is 6.50 kN
whereas for simulation it is 7.54 kN, the energy absorption and force levels are close to each
other for numerical simulation and experimental test and a deviation of 12.2 percent is found
for S.E.A value.
ii) Square crash boxes with front end trigger:
Test Simulation
Fig.5.42: The deformation of square crash boxes with front end trigger in test
and simulation
Fig.5.43: The force versus displacement curves for square crash boxes with front end
trigger in test and simulation

144
Table 5.10: Energy absorbed and force level comparision of test and simulation for
square crash boxes with front end trigger
S.No.
Square -
Front End
Trigger
Energy
Absorbed
( J )
Primary
Peak
Force
(kN)
Secondary
Peak
Force
(kN)
Mean
Crush
force (kN)
S.E.A
(J/kg)
Percentage
change in
S.E.A
1 Test 287.8 20.24 10.01 7.46 3723.2 0
2 Simulation 328.1 23.56 12.3 9.78 4244.4 14.1
From fig. 5.42 the deformation mode of the square crash box with front end trigger in
numerical simulation is similar to experimental test; that is the deformation occurs at the
impacted end of the specimen leading to spread of fronds towards outside. This change in
deformation pattern is achieved with the use of trigger, the deformation initiation changes
from non-impacted end (no-trigger) to impacted end (front end trigger). In general the
deformation initiation in a specimen is preferred to occur at the impacted end. From fig. 5.43,
the numerical simulation has a slightly higher primary peak force when compared to
experimental test because simulation models are stiffer in the initial stage of analysis during
solving, however the overall force-displacement behaviour is close between the numerical
simulation and experimental test. From table 5.10 the mean force for test is 7.46 kN whereas
for simulation it is 9.78 kN, the energy absorption and force levels are close to each other for
numerical simulation and experimental test and a deviation of 14.1 percent is found for S.E.A
value.
iii) Square crash boxes with slot trigger:
Test Simulation
Fig.5.44: The deformation of square crash boxes with slot trigger in test and
simulation
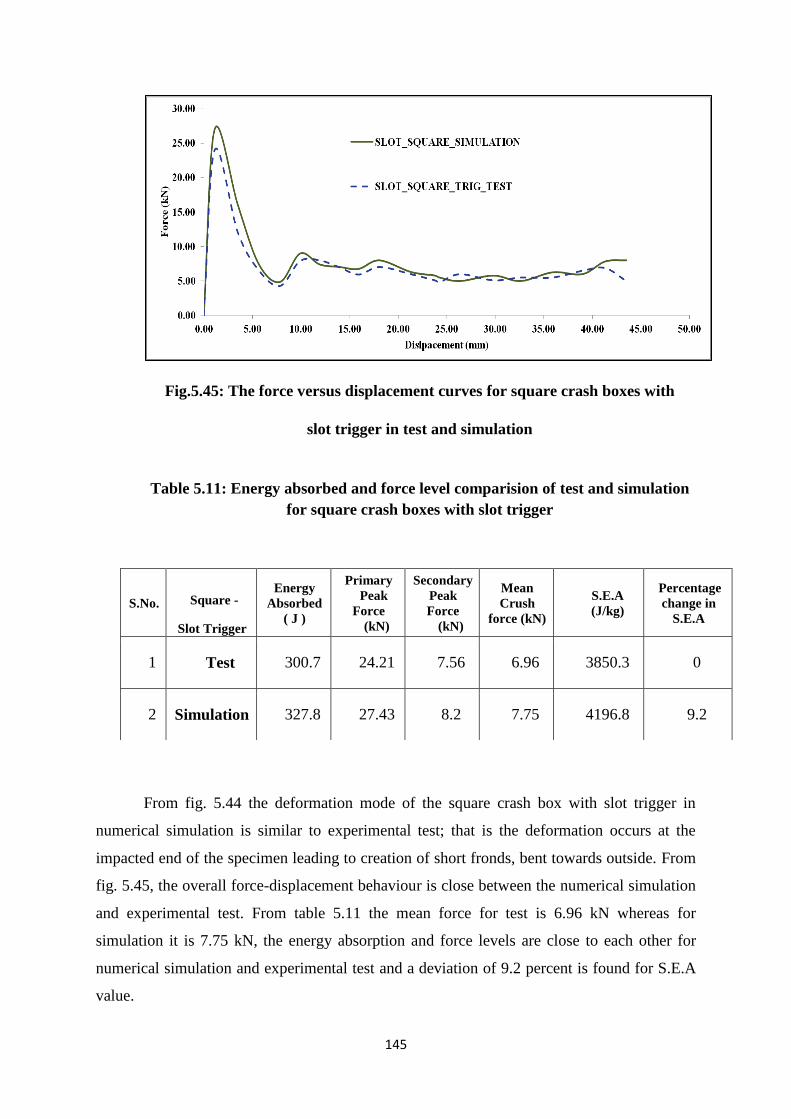
145
Fig.5.45: The force versus displacement curves for square crash boxes with
slot trigger in test and simulation
Table 5.11: Energy absorbed and force level comparision of test and simulation
for square crash boxes with slot trigger
From fig. 5.44 the deformation mode of the square crash box with slot trigger in
numerical simulation is similar to experimental test; that is the deformation occurs at the
impacted end of the specimen leading to creation of short fronds, bent towards outside. From
fig. 5.45, the overall force-displacement behaviour is close between the numerical simulation
and experimental test. From table 5.11 the mean force for test is 6.96 kN whereas for
simulation it is 7.75 kN, the energy absorption and force levels are close to each other for
numerical simulation and experimental test and a deviation of 9.2 percent is found for S.E.A
value.
S.No.
Square -
Slot Trigger
Energy
Absorbed
( J )
Primary
Peak
Force
(kN)
Secondary
Peak
Force
(kN)
Mean
Crush
force (kN)
S.E.A
(J/kg)
Percentage
change in
S.E.A
1 Test 300.7 24.21 7.56 6.96 3850.3 0
2 Simulation 327.8 27.43 8.2 7.75 4196.8 9.2
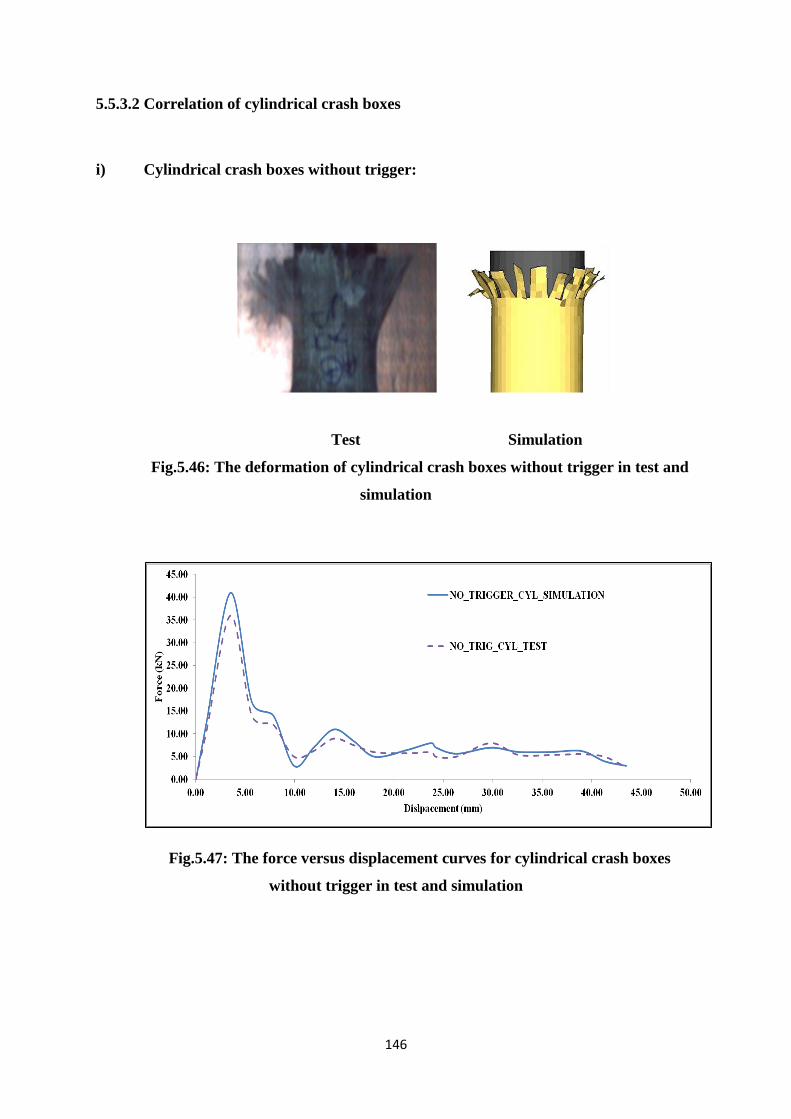
146
5.5.3.2 Correlation of cylindrical crash boxes
i) Cylindrical crash boxes without trigger:
Test Simulation
Fig.5.46: The deformation of cylindrical crash boxes without trigger in test and
simulation
Fig.5.47: The force versus displacement curves for cylindrical crash boxes
without trigger in test and simulation
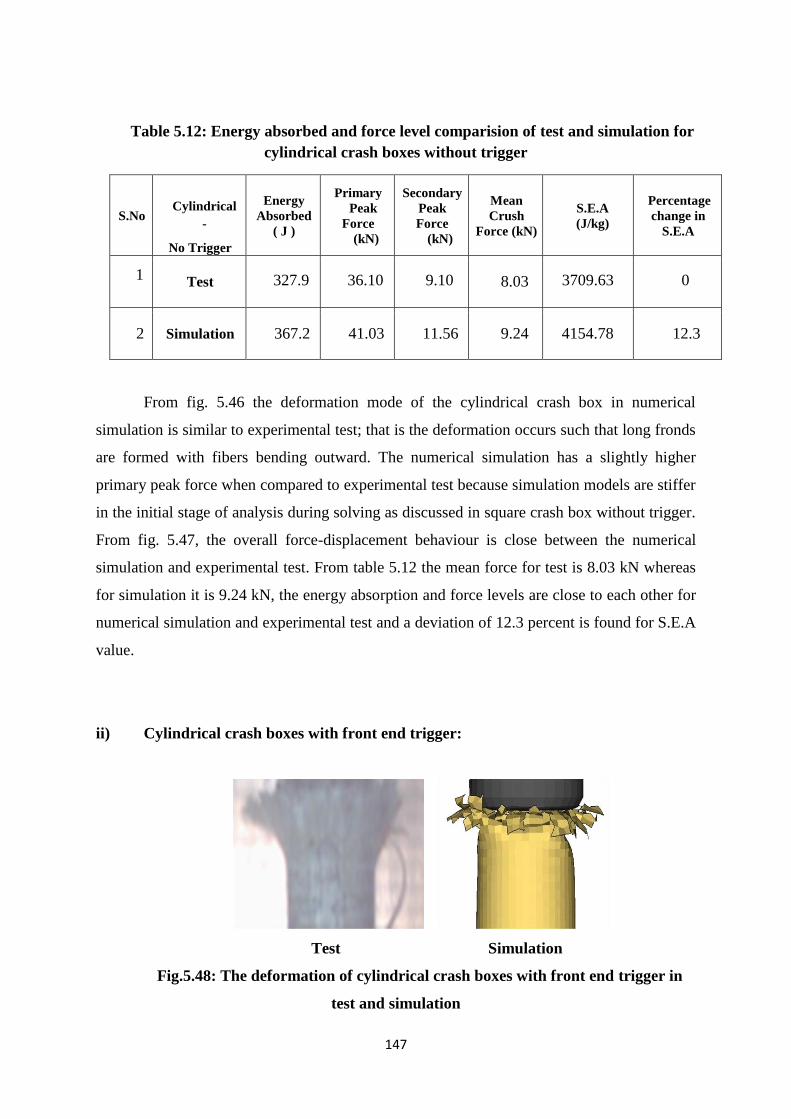
147
Table 5.12: Energy absorbed and force level comparision of test and simulation for
cylindrical crash boxes without trigger
S.No
Cylindrical
-
No Trigger
Energy
Absorbed
( J )
Primary
Peak
Force
(kN)
Secondary
Peak
Force
(kN)
Mean
Crush
Force (kN)
S.E.A
(J/kg)
Percentage
change in
S.E.A
1
Test 327.9 36.10 9.10 8.03 3709.63 0
2 Simulation 367.2 41.03 11.56 9.24 4154.78 12.3
From fig. 5.46 the deformation mode of the cylindrical crash box in numerical
simulation is similar to experimental test; that is the deformation occurs such that long fronds
are formed with fibers bending outward. The numerical simulation has a slightly higher
primary peak force when compared to experimental test because simulation models are stiffer
in the initial stage of analysis during solving as discussed in square crash box without trigger.
From fig. 5.47, the overall force-displacement behaviour is close between the numerical
simulation and experimental test. From table 5.12 the mean force for test is 8.03 kN whereas
for simulation it is 9.24 kN, the energy absorption and force levels are close to each other for
numerical simulation and experimental test and a deviation of 12.3 percent is found for S.E.A
value.
ii) Cylindrical crash boxes with front end trigger:
Test Simulation
Fig.5.48: The deformation of cylindrical crash boxes with front end trigger in
test and simulation
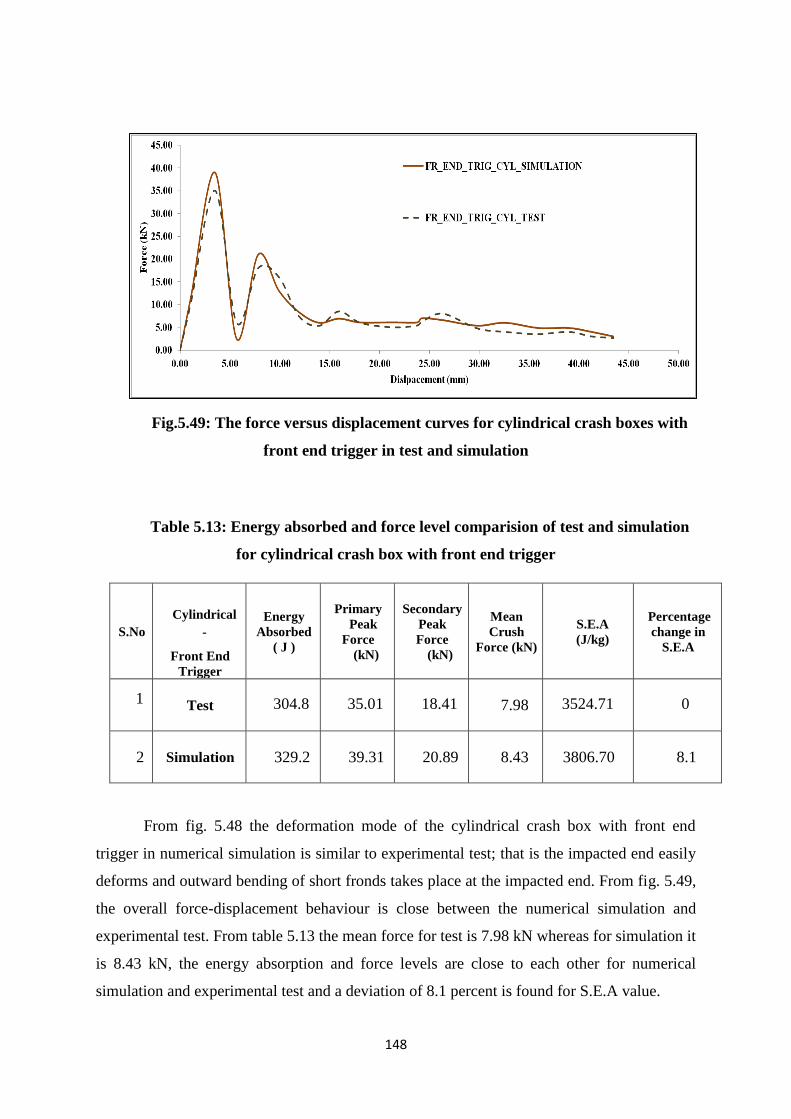
148
Fig.5.49: The force versus displacement curves for cylindrical crash boxes with
front end trigger in test and simulation
Table 5.13: Energy absorbed and force level comparision of test and simulation
for cylindrical crash box with front end trigger
S.No
Cylindrical
-
Front End
Trigger
Energy
Absorbed
( J )
Primary
Peak
Force
(kN)
Secondary
Peak
Force
(kN)
Mean
Crush
Force (kN)
S.E.A
(J/kg)
Percentage
change in
S.E.A
1
Test 304.8 35.01 18.41 7.98 3524.71 0
2 Simulation 329.2 39.31 20.89 8.43 3806.70 8.1
From fig. 5.48 the deformation mode of the cylindrical crash box with front end
trigger in numerical simulation is similar to experimental test; that is the impacted end easily
deforms and outward bending of short fronds takes place at the impacted end. From fig. 5.49,
the overall force-displacement behaviour is close between the numerical simulation and
experimental test. From table 5.13 the mean force for test is 7.98 kN whereas for simulation it
is 8.43 kN, the energy absorption and force levels are close to each other for numerical
simulation and experimental test and a deviation of 8.1 percent is found for S.E.A value.
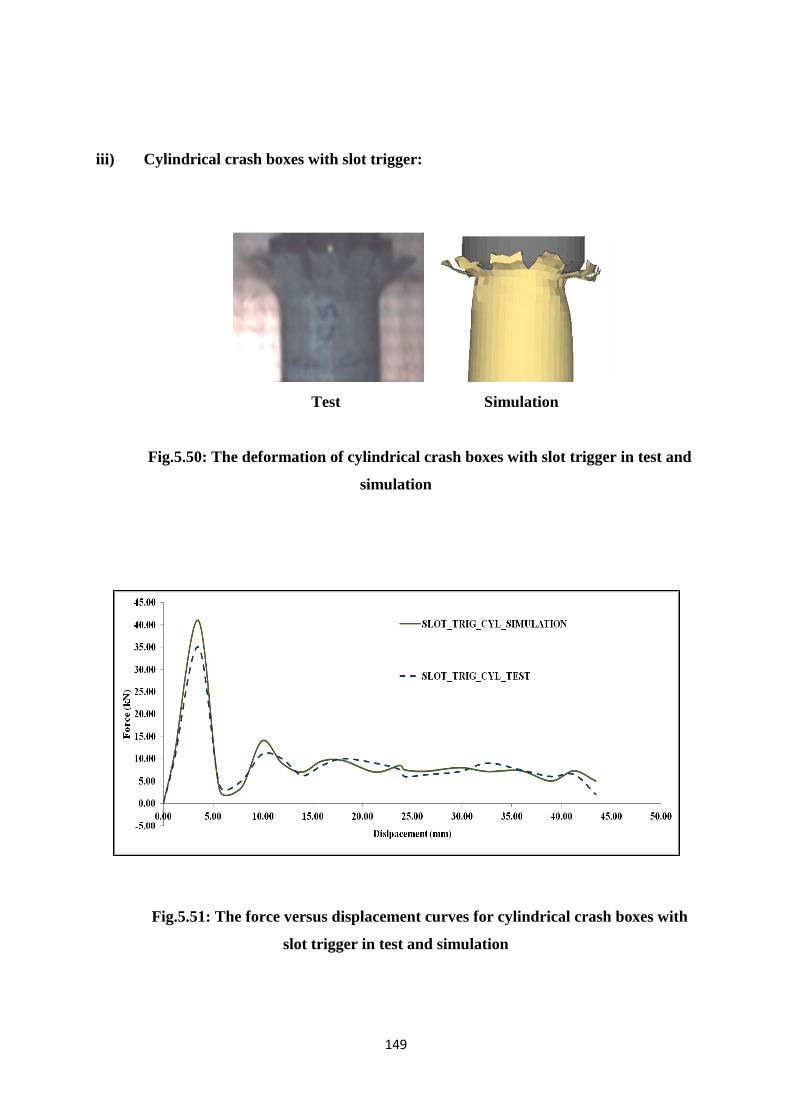
149
iii) Cylindrical crash boxes with slot trigger:
Test Simulation
Fig.5.50: The deformation of cylindrical crash boxes with slot trigger in test and
simulation
Fig.5.51: The force versus displacement curves for cylindrical crash boxes with
slot trigger in test and simulation
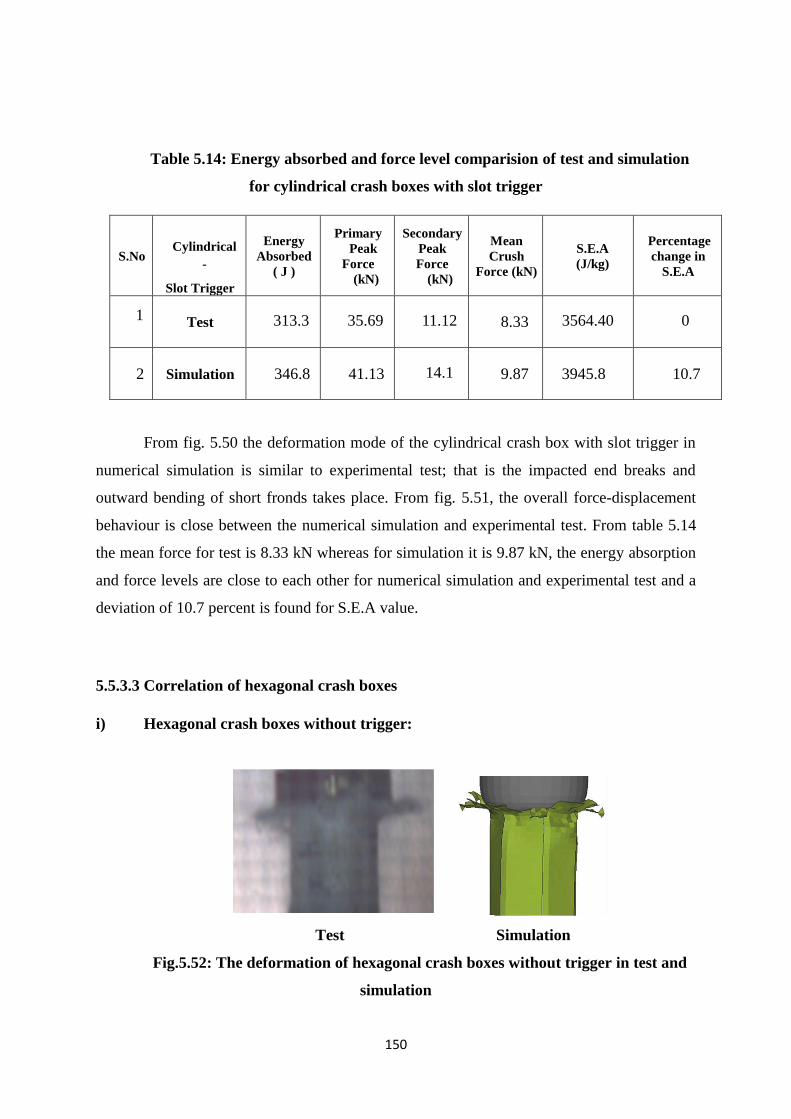
150
Table 5.14: Energy absorbed and force level comparision of test and simulation
for cylindrical crash boxes with slot trigger
S.No
Cylindrical
-
Slot Trigger
Energy
Absorbed
( J )
Primary
Peak
Force
(kN)
Secondary
Peak
Force
(kN)
Mean
Crush
Force (kN)
S.E.A
(J/kg)
Percentage
change in
S.E.A
1
Test 313.3 35.69 11.12 8.33 3564.40 0
2 Simulation 346.8 41.13 14.1 9.87 3945.8 10.7
From fig. 5.50 the deformation mode of the cylindrical crash box with slot trigger in
numerical simulation is similar to experimental test; that is the impacted end breaks and
outward bending of short fronds takes place. From fig. 5.51, the overall force-displacement
behaviour is close between the numerical simulation and experimental test. From table 5.14
the mean force for test is 8.33 kN whereas for simulation it is 9.87 kN, the energy absorption
and force levels are close to each other for numerical simulation and experimental test and a
deviation of 10.7 percent is found for S.E.A value.
5.5.3.3 Correlation of hexagonal crash boxes
i) Hexagonal crash boxes without trigger:
Test Simulation
Fig.5.52: The deformation of hexagonal crash boxes without trigger in test and
simulation
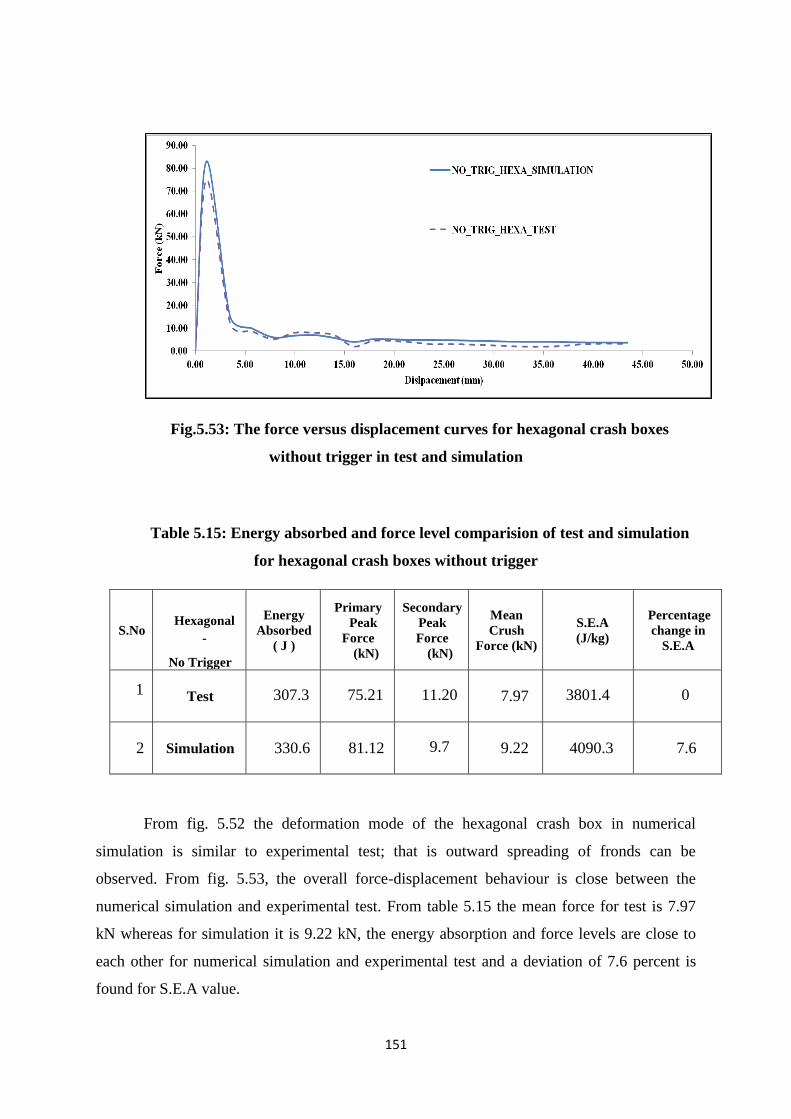
151
Fig.5.53: The force versus displacement curves for hexagonal crash boxes
without trigger in test and simulation
Table 5.15: Energy absorbed and force level comparision of test and simulation
for hexagonal crash boxes without trigger
S.No
Hexagonal
-
No Trigger
Energy
Absorbed
( J )
Primary
Peak
Force
(kN)
Secondary
Peak
Force
(kN)
Mean
Crush
Force (kN)
S.E.A
(J/kg)
Percentage
change in
S.E.A
1
Test 307.3 75.21 11.20 7.97 3801.4 0
2 Simulation 330.6 81.12 9.7 9.22 4090.3 7.6
From fig. 5.52 the deformation mode of the hexagonal crash box in numerical
simulation is similar to experimental test; that is outward spreading of fronds can be
observed. From fig. 5.53, the overall force-displacement behaviour is close between the
numerical simulation and experimental test. From table 5.15 the mean force for test is 7.97
kN whereas for simulation it is 9.22 kN, the energy absorption and force levels are close to
each other for numerical simulation and experimental test and a deviation of 7.6 percent is
found for S.E.A value.

152
ii) Hexagonal crash boxes with front end trigger:
Test Simulation
Fig.5.54: The deformation of hexagonal crash boxes with Front End Trigger in
test and simulation
Fig.5.55: The force versus displacement curves for hexagonal crash boxes with
Front End Trigger in test and simulation
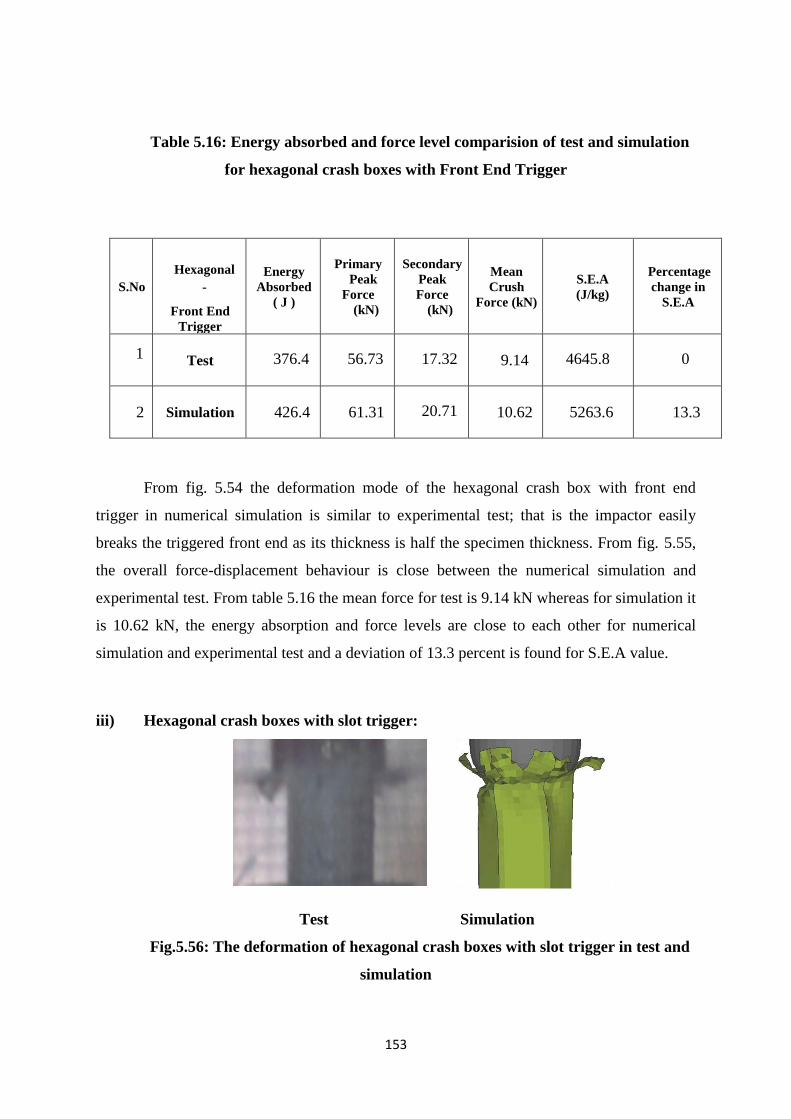
153
Table 5.16: Energy absorbed and force level comparision of test and simulation
for hexagonal crash boxes with Front End Trigger
S.No
Hexagonal
-
Front End
Trigger
Energy
Absorbed
( J )
Primary
Peak
Force
(kN)
Secondary
Peak
Force
(kN)
Mean
Crush
Force (kN)
S.E.A
(J/kg)
Percentage
change in
S.E.A
1
Test 376.4 56.73 17.32 9.14 4645.8 0
2 Simulation 426.4 61.31 20.71 10.62 5263.6 13.3
From fig. 5.54 the deformation mode of the hexagonal crash box with front end
trigger in numerical simulation is similar to experimental test; that is the impactor easily
breaks the triggered front end as its thickness is half the specimen thickness. From fig. 5.55,
the overall force-displacement behaviour is close between the numerical simulation and
experimental test. From table 5.16 the mean force for test is 9.14 kN whereas for simulation it
is 10.62 kN, the energy absorption and force levels are close to each other for numerical
simulation and experimental test and a deviation of 13.3 percent is found for S.E.A value.
iii) Hexagonal crash boxes with slot trigger:
Test Simulation
Fig.5.56: The deformation of hexagonal crash boxes with slot trigger in test and
simulation
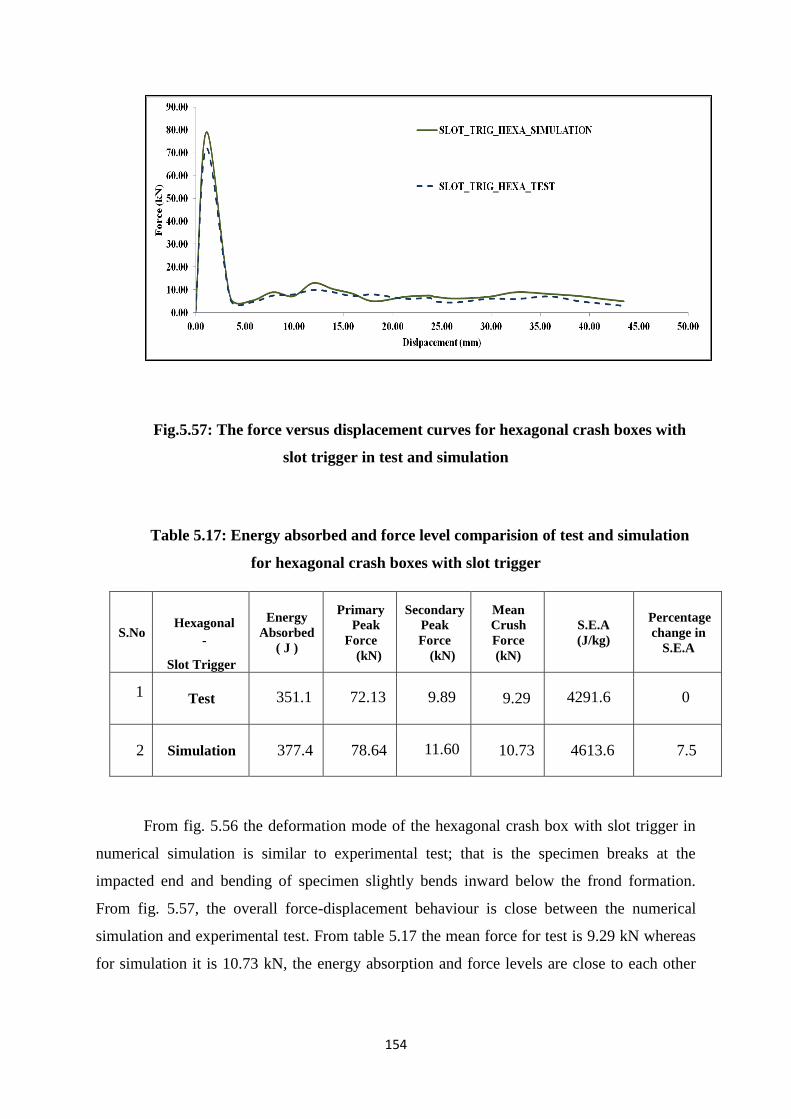
154
Fig.5.57: The force versus displacement curves for hexagonal crash boxes with
slot trigger in test and simulation
Table 5.17: Energy absorbed and force level comparision of test and simulation
for hexagonal crash boxes with slot trigger
S.No
Hexagonal
-
Slot Trigger
Energy
Absorbed
( J )
Primary
Peak
Force
(kN)
Secondary
Peak
Force
(kN)
Mean
Crush
Force
(kN)
S.E.A
(J/kg)
Percentage
change in
S.E.A
1
Test 351.1 72.13 9.89 9.29 4291.6 0
2 Simulation 377.4 78.64 11.60 10.73 4613.6 7.5
From fig. 5.56 the deformation mode of the hexagonal crash box with slot trigger in
numerical simulation is similar to experimental test; that is the specimen breaks at the
impacted end and bending of specimen slightly bends inward below the frond formation.
From fig. 5.57, the overall force-displacement behaviour is close between the numerical
simulation and experimental test. From table 5.17 the mean force for test is 9.29 kN whereas
for simulation it is 10.73 kN, the energy absorption and force levels are close to each other
155
for numerical simulation and experimental test and a deviation of 7.5 percent is found for
S.E.A value.
5.5.3.4 Correlation of decagonal crash boxes
i) Decagonal crash boxes without trigger:
Test Simulation
Fig.5.58: The deformation of decagonal crash boxes without trigger in test and
simulation
Fig.5.59: The force versus displacement curves for decagonal crash boxes
without trigger in test and simulation
156
Table 5.18: Energy absorbed and force level comparision of test and simulation
for decagonal crash boxes without trigger
S.No
Decagonal
-
No Trigger
Energy
Absorbed
( J )
Primary
Peak
Force
(kN)
Secondary
Peak
Force
(kN)
Mean
Crush
Force
(kN)
S.E.A
(J/kg)
Percentage
change in
S.E.A
1
Test 558.5 136.01 14.88 12.09 6427.12 0
2 Simulation 603.7 143.57 16.10 14.69 6947.69 8.1
From fig. 5.58 the deformation mode of the decagonal crash box in numerical
simulation is similar to experimental test; bending of short fronds formed after the impact can
be seen. From fig. 5.59, the overall force-displacement behaviour is close between the
numerical simulation and experimental test. From table 5.18 the mean force for test is 12.09
kN whereas for simulation it is 14.69 kN, the energy absorption and force levels are close to
each other for numerical simulation and experimental test and a deviation of 8.1 percent is
found for S.E.A value.
ii) Decagonal crash boxes with front end trigger:
Test Simulation
Fig.5.60: The deformation of decagonal crash boxes with front end trigger in test
and simulation
157
Fig.5.61: The force versus displacement curves for decagonal crash boxes with
front end trigger in test and simulation
Table 5.19: Energy absorbed and force level comparision of test and simulation
for decagonal crash boxes with front end trigger
S.No
Decagonal
-
Front End
Trigger
Energy
Absorbed
( J )
Primary
Peak
Force
(kN)
Secondary
Peak
Force
(kN)
Mean
Crush
Force
(kN)
S.E.A
(J/kg)
Percentage
change in
S.E.A
1
Test 605.7 71.22 41.03 13.15 7118.5 0
2 Simulation 674.7 77.36 47.6 14.61 7930.1 11.4
From fig. 5.60 the deformation mode of the decagonal crash box with front end
trigger in numerical simulation is similar to experimental test; formation of finer fronds at the
impacted end with bending of fibres can be seen. From fig. 5.61, the overall force-
displacement behaviour is close between the numerical simulation and experimental test.
From table 5.19 the mean force for test is 13.15 kN whereas for simulation it is 14.61 kN, the
energy absorption and force levels are close to each other for numerical simulation and
experimental test and a deviation of 11.4 percent is found for S.E.A value.
158
iii) Decagonal crash boxes with slot trigger:
Test Simulation
Fig.5.62: The deformation of decagonal crash boxes with slot trigger in test and
simulation
Fig.5.63: The force versus displacement curves for decagonal crash boxes with
slot trigger in test and simulation
Table 5.20: Energy absorbed and force level comparision of test and simulation
for decagonal crash boxes with slot trigger
S.No
Decagonal
-
Slot Trigger
Energy
Absorbed
( J )
Primary
Peak
Force
(kN)
Secondary
Peak
Force
(kN)
Mean
Crush
Force
(kN)
S.E.A
(J/kg)
Percentage
change in
S.E.A
1
Test 546.4 130.32 17.75 13.86 6353.1 0
2 Simulation 596.6 137.53 20.41 15.47 6937.5 9.2
159
From fig. 5.62 the deformation mode of the decagonal crash box with slot trigger in
numerical simulation is similar to experimental test; formation of fronds is less instead the
lamina bends outward allowing the impactor to penetrate inside. From fig. 5.63, the overall
force-displacement behaviour is close between the numerical simulation and experimental
test. From table 5.20 the mean force for test is 13.86 kN whereas for simulation it is 15.47
kN, the energy absorption and force levels are close to each other for numerical simulation
and experimental test and a deviation of 9.2 percent is found for S.E.A value.
5.6. Key Points from Experimentation and Numerical Simulation of Drop Weight
Impact Test
Details on drop weight impact testing setup, clamp preparation for specimen as well as
impactor, safety precautions during drop weight impact testing were discussed in detail.
Comparative experimental analysis was done for different cross sections of the GFRP crash
boxes, without and with triggers applied to each type of crash box geometry.
PART_COMPOSITE model with LAMSHT (laminated shell theory option) was used along
with MAT_58 (MAT_LAMINATED_COMPOSITE_FABRIC) for laminated GFRP crash
boxes. A detailed finite element model with impactor, specimen-clamp and base plate was
developed along with the use of various contact definitions between the parts as per the
experimental test for better correlation. Simulation factors influencing the numerical result
like longitudinal compression stress limiting factor (SLIMC1) and softness factor (SOFT) for
the crash-front elements were calibrated in accordance with the test data. It was revealed that
SLIMC1 influenced the average force level, whereas softness factor (SOFT) was having
significant influence on the peak-force levels. It was observed that deformation mode,
specific energy absorption, force with respect to displacement value (F versus D diagram) and
mean force were in good agreement with each other in test as well as in simulation. Whereas,
the peak force value was slightly higher for the simulation compared to the test. This was due
to the fact that, simulation models are stiffer in the initial stage of analysis during solving as
they do not consider the defects present in the specimen and material distribution is assumed
to be uniform throughout the specimen. Whereas in the test the specimen strength may be
slightly lower than the ideal strength value due to non-uniformity of material caused by
defects and imperfections present in the specimen. Usage of correlation factors for scaling
numerical simulation result to compensate the defects in the specimens, helped in achieving a
good correlation between experimental test and numerical simulation for drop weight impact
160
of GFRP crash boxes. Hence, it is vital that the parameters in the simulation model which
have a significant influence on the results are calibrated using experimental data. Thereafter,
the calibrated simulation model can be used for further investigations for optimizations with
multiple case studies in an efficient as well as economic manner with significant reduction in
prototype testing.
5.7. Summary of the Chapter
In this chapter detailed discussion was done on drop weight impact testing setup, test
preparation, clamp preparation for specimen as well as impactor. Safety precautions during
drop weight impact testing were explained. Comparative experimental analysis was done for
different cross sections of the GFRP crash boxes, without and with triggers applied to each
type of crash box geometry. Also a comparative analysis was done comparing the
effectiveness of different triggers for each type of geometry.
Detailed discussion was done on the factors influencing the numerical simulation and
experimental testing with their limitations. Correlation between test and simulation was
discussed. Importance of pre test simulation was presented. The pre test simulation model
was able to predict the force and energy levels but it was not sufficient to exactly replicate the
complex deformation modes of the laminated GFRP crash box as it was a simplified model.
Therefore, a numerical simulation model replicating the drop weight impact testing was
developed and correlated with the test data. A good agreement was achieved between the test
and simulation.
161
Chapter-6: Summary, Conclusions and Future Scope
6.1. Summary of the Research
The work done in this study can be summarized as follows:
Importance of crashworthiness in automobiles is discussed to understand the vehicle safety
in the event of a crash. Use of composites in automobiles is discussed. Advantages of
composites in future cars like the electric cars are discussed.
Background of composites is discussed to understand the complex behaviour of
composites under impact loading.
Literature survey is done related to the work to be carried out and gaps in the existing
research work were found. Comparision of crashworthiness of crash boxes made of GFRP
composite material from different cross sections, detailed crash box sub system level
analysis is not done to study the effect of various types of triggers in combination with
different cross-sectional geometries. Comparative crashworthiness analysis of crash boxes
with and without application of geometry intrinsic triggers subjected to impact loading is
not done as well.
Numerical simulation of composites is discussed in detail including the procedure for
numerical simulation and behaviour of composites subjected to impact loading using force
versus displacement diagrams.
Crash energy absorbing characteristics of a crash box made of GFRP composite material
subjected to impact load are studied initially with the help of numerical simulation for
square, cylindrical, hexagonal and decagonal types of geometrical cross sections with and
without application of different triggers.

162
Pre-test numerical simulation analysis is done to know the effect of different types of
novel triggers namely; Notch Triggers (trigger-A, trigger-B and trigger-C), Slot
Triggers (type-1 slot, type-2 slot and type-3 slot) and Thickness Variation Triggers
(thickness variation 1 / front end trigger, thickness variation 2 and thickness variation 3)
are studied extensively, to understand the effect of each type of trigger on the
crashworthiness behaviour of GFRP crash boxes made of square, cylindrical, hexagonal
and decagonal geometrical cross sections.
Results obtained from the numerical simulation analysis are discussed in detail. Later
consolidated results are presented in a comparative manner for all the combinations of
triggers applied to each type of crash box geometry to know the effectiveness of each
trigger type for all the combinations of cross sections used in the numerical analysis.
Specimen making is discussed in detail and step wise including the safety precautions,
mould making and tips involved in the manufacturing process.
Drop weight impact testing is discussed in detail including the working of drop weight
impact machine, specimen clamp making, safety precautions and procedure to conduct the
test.
Drop weight impact testing, experimental analysis is carried out on square, cylindrical,
hexagonal and decagonal cross sectional GFRP composite crash boxes to study the crash
energy absorbing characteristics when subjected to impact load with and without
application of different triggers.
A comparative experimental testing and analysis is done to study the variation of peak
force, energy absorbed, S.E.A (specific energy absorbed) with the variation of geometries
and triggers applied to GFRP crash boxes subjected to drop weight impact load.
163
A detailed finite element model with impactor, specimen-clamp and base plate was
developed along with the use of various contact definitions between the parts as per the
experimental test for better correlation of numerical simulation with experimental test.
PART_COMPOSITE model with LAMSHT (laminated shell theory option) was used
along with MAT_58 (MAT_LAMINATED_COMPOSITE_FABRIC) for laminated
GFRP crash boxes in LS-DYNA. Additionally calibration of simulation parameters like
longitudinal compression stress limiting factor (SLIMC1) and softness factor (SOFT) was
done in accordance with experimental data.
The numerical simulation was correlated with the experimental data using correlation
factors to compensate the defects present in the specimens and the values were found to be
close to each other, within the acceptable deviation range. Even the deformation modes,
the F-D (force versus displacement) curves and S.E.A (specific energy absorption) values
were found to have a close match between experiments and numerical simulations.
The objective of this study is to highlight the effect of cross sections and triggers on the
crashworthiness of GFRP crash boxes and also to showcase the relative effect of each
trigger configuration on the energy and force level achieved; with the variation of cross
sections of the GFRP crash boxes.
6.2. Conclusions
The conclusions drawn from this study can be mentioned as follows:
Considering only the geometrical cross-section without any trigger the most efficient
cross-section for GFRP crash box was decagonal cross-section with S.E.A value of
7345.12 (J/kg) and the least efficient cross-section without any trigger was square cross-
section with S.E.A value of 3935.82 (J/kg).
164
This means that geometric shape plays a vital role in the energy absorption.
Considering the trigger configurations for square crash box, trigger-C was the most
efficient trigger with 41.20 percentage increase in the S.E.A with a value of 5584.65 J/kg
compared to square crash box with no-trigger.
Considering the trigger configurations for cylindrical crash box, trigger-B was the most
efficient trigger with 35.45 percentage increase in the S.E.A with a value of 5646.12 J/kg
compared to cylindrical crash box with no-trigger.
Considering the trigger configurations for hexagonal crash box, trigger-A was the most
efficient trigger with 37.93 percentage increase in the S.E.A with a value of 5884.13 J/kg
compared to hexagonal crash box with no-trigger.
Considering the trigger configurations for decagonal crash box, thickness variation-1 was
the most efficient trigger with 10.75 percentage increase in the S.E.A with a value of
8135.39 J/kg compared decagonal crash box with no-trigger.
The crash behaviour of the GFRP crash boxes varied significantly with the usage of
different cross sectional geometries and trigger types.
It can be noted that the deformation mode also varied significantly with the use of
different types of triggers.
Interestingly the effectiveness of each type of trigger changed with the each geometrical
cross section used for the crash boxes. It is evident from the above study that, each type
of geometry had a peculiar behaviour with different types of triggers.
Therefore it can be noted that a component made of same material gives different energy
absorption values with the combination of different geometrical cross sections and trigger
types.
165
Hence this study has highlighted the change in crashworthiness behaviour of GFRP crash
boxes not only with respect to different types of cross sections but also with respect to
various triggers applied to different cross sectional shapes.
This study also showcased the relative effect of each trigger configuration on the energy
and force level achieved with the variation of cross sections of the GFRP crash boxes.
Thus it can be noted that use of proper combination of geometry and trigger type plays a
vital role in achieving desired level of force, deformation mode and energy absorption.
6.3. Specific Contributions of the Study
The objective of the study is to investigate optimal geometric design for automobile
crash box for better energy absorption through its large deformation in head-on collisions of
passenger cars. This research is focussed firstly, to understand the change in crashworthiness
behaviour of GFRP crash boxes made of different cross sectional shapes and secondly, to
study the effect of various types of triggers on the crashworthiness behaviour of the GFRP
crash boxes made of different cross sectional shapes. Initially, deformation behaviour of the
proposed GFRP crash boxes was studied with the help of finite element simulation, for
different novel geometric shapes, along with addition of various triggers on the geometry of
the crash boxes. A comparison between GFRP crash boxes with various types of cross-
sectional geometries along with application of different types of triggers was done for better
understanding of the significance of each with respect to energy absorption, peak force and
specific energy absorption.
Later the required crash box specimens were manufactured for experimental testing.
Drop weight impact testing was performed on the GFRP crash box specimens to study their
crashworthiness behaviour experimentally. Comparison of the drop weight impact testing and
numerical simulation was performed. A good correlation between the experimental test and
numerical simulation was achieved.
A comparative as well as detailed analysis and discussion was done to clearly
understand the effect of each type of geometry along with application of each type of trigger
on the crashworthiness of GFRP crash boxes. In this study it was found that the
166
crashworthiness behaviour of GFRP crash boxes varied with the use of different cross
sectional geometries. It was also found that the effectiveness of each trigger was different
when applied to a different cross sectional geometry. This study has shown that the force
level and energy absorption can be altered and the required energy absorption can be
achieved by use of proper type of trigger for the particular geometrical cross section.
This study has brought out a comparative significance for usage of different types of
geometries and different types triggers for GFRP composite crash boxes subjected to axial
impact loading. Thus this study serves as a guide for employing triggers in GFRP crash boxes
which is useful for automobile engineers working with composites subjected to impact where
the force level is very important for energy absorption and safety of the vehicle.
6.4. Usefulness of the Present Research
The present research will be helpful to the vehicle design engineers as well as
researchers in the following ways.
For better understanding of the complex behaviour of composites when subjected to
impact loading.
For better use of cost effective composites such as glass fiber reinforced plastics (GFRP)
in crashworthiness applications
In making light-weight as well as electrically insulated vehicle structures using composite
materials.
To understand the importance of cross sectional shapes for composites in crashworthiness
applications.
For making better use of triggers in improving the crashworthiness of composites in
impact loading.
Better understanding for the selection of cross-sectional geometry and trigger type
combinations based on the energy absorption level.
6.5. Recommendations for Future Scope of the Study
Even though the present work is extensively done there is always a prospective for
future scope of the work which motivates the researchers to carry forward the study in

167
different domains and directions. The future scope of this study would be to include
various other types of materials like carbon fiber reinforced plastics, kevlar fiber
reinforced plastics etc., To continue the study in different domains like aerospace
applications involving space craft where there is high need to increase the strength to
weight ratio of the structure. To study the crashworthiness of composites in naval
applications like ships and submarines where there is need for the composites to
withstand higher forces in a corrosive environment.

168
References
Ando, K., Nakagawa, K., Araki, T., Hagiwara, H., Kamie, Y., & Shibayama, T. (2003).
Impact simulation of the CFRP structure of a GT– car, SAE Technical Paper, 01, 2768-2769.
Bernal, E., Cuartero, J., Nuez, C., Miravete, A., & Castejon, L. (2004) Advances in crash
simulation of vehicle frontal crash structures using braided composite materials, SAE
Technical Paper, 1175-1176.
Dhatreyi, B., Anuradha, B., & Velmurugan, R. (2014). Mixed-mode translaminar fracture of
plain-weave composites, Composites: Part B, 60, 21-28.
Costas, M., Díaz, J., Romera, L.E., Hernández, S., & Tielas. A. (2013). Static and dynamic
axial crushing analysis of car frontal impact hybrid absorbers, International Journal of Impact
Engineering, 62, 166-181.
Eshkoor, A., Oshkovr, A., Sulong, B., Zulkifli, R., Ariffin, K., & Azhari, H. (2013). Effect of
trigger configuration on the crashworthiness characteristics of natural silk epoxy composite
tubes, Composites 55 5-10.
Eyvazian, A., Habibi, M. K., Hamouda, A. M., & Hedayati R., (2014): Axial crushing
behaviour and energy absorption efficiency of corrugated tubes. Materials & Design, 54,
1028-1038.
Gedikli, H. (2013). Numerical investigation of axial crushing behaviour of a tailor welded
tube. Materials & Design, 44, 587-595.
Ghasemnejad, H., Blackman, B.R.K., Hadavinia, H., & Sudall, B. (2009). Experimental
studies on fracture characterization and energy absorption of GFRP composite box structures,
Composite Structures, 88, 253–261.
Ghamarian, A., & Abadi, M. T., (2011). Axial crushing analysis of end-capped circular tubes.
Thin-Walled Structures, 49, 743–752.
169
Ghasemnejad, H., Hadavinia, H., & Aboutorabi, A. (2010). Effect of delamination failure in
crashworthiness analysis of hybrid composite box structures, Materials and Design, 31, 1105-
1116.
Graciano, C., Martınez, G., & Gutierrez, A., (2012). Failure mechanism of expanded metal
tubes under axial crushing. Thin-Walled Structures, 51, 20-24.
Gurusideswar, S., Velmurugan, R., (2014). Strain rate sensitivity of glass/epoxy composites
with nano fillers. Materials and Design, 60, 468-478.
Hadavinia, H., & Ghasemnejad, H. (2009) Effects of Mode-I and Mode-II interlaminar
fracture toughness on the energy, Composite Structures, 23, 1016-1017.
Hamidreza, Z., Kroger, M., & Albertsen, H. (2008). An experimental and numerical
crashworthiness investigation of thermoplastic composite crash boxes, Composite Structures,
85, 245–257.
Hadavinia, H., & Ghasemnejad, H., (2009). Effects of Mode-I and Mode-II interlaminar
fracture toughness on the energy absorption of CFRP twill/weave composite box sections.
Composite Structures, 89, 303–314.
Hashin, Z., (1980). Failure Criteria for Unidirectional Fiber Composites. Journal of Applied
Mechanics, 47, 329-334.
İnce, F., Türkmen, H.S., Mecitoğlu, Z., Uludağ, N., Durgun, İ., Altınok, E., & Örenel, H.,
(2011). A numerical and experimental study on the impact behaviour of box structures,
ProcediaEngineering,10,1736–1741.
Langseth, M., Hopperstad, O. S., & Hanssen, A. G., (1998). Crash behaviour of thin-walled
aluminium members. Thin-Walled Structures, 32, 127–150.
Lee, W., Zheng, M., & Noboru, K. (2009). FOA (first-order analysis) model of a granule-
filled tube for vehicle crash energy absorption, Mechanics of Materials 41684-690.
LS-DYNA Keyword Manual Volume II (2016). Material Models, Livermore Software
Technology Corporation.
170
Maddever, W., & Guinehut, S. (2005). Use of aluminium foam to increase crash box
efficiency, SAE Technical Paper, 01, 704-705.
Mamalis, A. G., (1998). Crashworthiness of Composite Thin-walled Structural Components.
Taylor & Francis Routledge.
Marcus, R., Larsgunnar, N., Fredrick, B., & Nielen, S., (2005). Shape Optimization of
Vehicle Crash-box Using LS-OPT. 5Th
European LS-DYNA User’s Conference.
Matzenmiller, A., Lubliner, J., & Taylor, R, L., (1995). A constitutive model for anisotropic
damage in fiber composites. Mechanics of Materials,20,125-152.
Miyazaki, M., Endo, H., & Negishi, H., (1999). Dynamic axial plastic buckling of square
tube. Journal of Materials Processing Technology, 85, 213–216.
Nasir Hussain, N., Regalla, S.P., & Rao, Y.V.D. (2017). Low velocity impact
characterization of glass fiber reinforced plastics for application of crash box, Materials
Today Proceedings, 4, 3252-3262.
Nasir Hussain, N., Regalla, S.P., & Rao, Y.V.D. (2017). Comparative Study of Trigger
Configuration for Enhancement of Crashworthiness of Automobile Crash Box Subjected to
Axial Impact Loading. Procedia Engineering, 173, 1390-1398.
Nasir Hussain, N., Regalla, S.P., & Rao, Y.V.D. (2017). Numerical investigation into the
effect of various trigger configurations on crashworthiness of GFRP crash boxes made of
different types of cross sections. International Journal of Crashworthiness, 22, 565-581.
Noma, K., Muguruma, M., & Takada, K. (2002). Analysis of Compressive and Bending
Collapse of the Vehicle Structure, SAE Technical Paper, 01, 680-681.
Obradovic, J., Simonetta, B., & Giovanni, B. (2012). Lightweight design and crash analysis
of composite frontal impact energy absorbing structures, Composite Structures, 94, 423-430.
Okano, M., Nakai, A., & Hamada, H., (2010). Axial crushing performance of braided
composite tubes. International Journal of Crashworthiness, 10.3, 287–294.
171
Oshkovr, S.A., Taher, S.T., Oshkour, A.A., Ariffin, A.K., & Azhari, C.H. (2013). Finite
element modeling of axially crushed silk/epoxy composite square tubes, Composite
Structures, 95, 411-418.
Peters, S. T., (1998). Handbook of composites, Springer US.
Qaiser, Z., Qureshi, M., & Awan, A. (2013). Thin walled beams with sinusoidal embedded
patterns under deep bending collapse, Thin Walled Structures, 73, 94-100.
Qureshi, M., & Bertocchi, E. (2012). Crash behaviour of thin-Walled box beams with
complex sinusoidal relief patterns, Thin-Walled Structures, 53, 217-223.
Rajendran, R., Sai. K. P., Chandrasekar, B., Gokhale, A., & Basu. S. (2008). Impact energy
absorption of aluminium foam fitted AISI 304L stainless steel tube. Materials & Design, 30,
1777–1784.
Rossi, A., Fawaz, Z., & Behdinan, K. (2005). Numerical simulation of the axial collapse of
thin-walled polygonal section tubes. Thin-Walled Structures, 43 1646–1661.
Rusineka, A., Zaerab, R., Forquina, P., & Klepaczkoa, J.R. (2008). Effect of plastic
deformation and boundary conditions combined with elastic wave propagation on the
collapse site of a crash box, Thin-Walled Structures, 46, 1143–1163.
Schweizerhof, K., Weimar, K., Munz, T., & Rottner, T., (1998). Crashworthiness Analysis
with Enhanced Composite Material Models in LS-DYNA - Merits and Limits. LS-DYNA
World Conference.
Tabiei, A., Weitao, Y., & Goldberg, R., (2005). Nonlinear strain rate dependent micro-
mechanical composite material model for finite element impact and crashworthiness
simulation, International Journal of Non-linear Mechanics, 40, 957-970.
Tarlochan, F., & Ramesh, S. (2012). Composite sandwich structures with nested inserts for
energy absorption application. Composite Structures, 94, 904–916.
Toksoy, K., & Guden, M. (2010). Partial Al foam filling of commercial 1050H14 Al crash
boxes: The effect of box column thickness and foam relative density on energy absorption,
Thin-Walled Structures, 48, 482–494.
172
Waimer, M., Kohlgrüber, D., Hachenberg, D., & Voggenreiter, H. (2013). Experimental
study of CFRP components subjected to dynamic crash loads. Composite Structures, 105,
288–299.
Xiao, X., Botkin, M. E., Nancy, L., & Johnson (2009). Axial crush simulation of braided
carbon tubes using MAT58 in LS-DYNA. Thin-Walled Structures, 47, 740–749.
Xiao, X., McGregor, C., Vaziri, R., & Poursartip, A., (2009). Progress in braided composite
tube crush simulation. International Journal of Impact Engineering, 36, 711–719.
Zarei, H.R., & Kroger, M. (2008). Optimization of the foam-filled aluminum tubes for crush
box application, Thin-Walled Structures, 46, 214–221.
Zhang, X., Cheng, G., You, Z., & Zhang, Z., (2007). Energy absorption of axially
compressed thin-walled square tubes with patterns. Thin-Walled Structures, 45, 737–746.
173
List of Publications and Presentations
International Journal Publications:
1. N. Nasir Hussain, Srinivasa Prakash Regalla and Venkata Daseswara Rao Yendluri.
“Numerical investigation into the effect of various trigger configurations on
crashworthiness of GFRP crash boxes made of different types of cross sections”,
International Journal of Crashworthiness, 2017, 22(5), pp. 565-581. DOI:
10.1080/13588265.2017.1286964
2. N. Nasir Hussain, Srinivasa Prakash Regalla and Venkata Daseswara Rao Yendluri.
“Comparative Study of Trigger Configuration for Enhancement of Crashworthiness of
Automobile Crash Box Subjected to Axial Impact Loading”. Procedia Engineering,
2017, 173(1), pp. 1390-1398. DOI: 10.1016/j.proeng.2016.12.198
3. N. Nasir Hussain, Srinivasa Prakash Regalla and Venkata Daseswara Rao Yendluri,
Tatacipta Dirgantara, Leonardo Gunawan, Annisa Jusuf. “Drop-weight Impact Testing
for the Study of Energy Absorption in Automobile Crash Boxes Made of Composite
Material”. Journal of Materials: Design and Applications. (Communicated-under
review).
4. N. Nasir Hussain, Srinivasa Prakash Regalla and Venkata Daseswara Rao Yendluri.
“Techniques for Correlation of Drop Weight Impact Testing and Numerical Simulation
for Composite GFRP Crash Boxes Using Ls-Dyna”. Journal of Composite Structures.
(Communicated-under review).
174
International Conference Publications and Presentations:
1. N. Nasir Hussain, Srinivasa Prakash Regalla and Venkata Daseswara Rao Yendluri.
“Low Velocity Impact Characterisation of Glass Fiber Reinforced Plastics for
Application of Crash Box.” Materials Today: Proceedings, 2017,4(2), Part A, pp. 3252-
3262. DOI: 10.1016/j.matpr.2017.02.211. In Proceedings of 5th
International Conference
of Materials Processing and Characterization (ICMPC 2016), GRIET, Hyderabad,
India, March, 2016.
2. N. Nasir Hussain, Srinivasa Prakash Regalla and Venkata Daseswara Rao Yendluri.
“Comparative Study of Trigger Configuration for Enhancement of Crashworthiness of
Automobile Crash Box Subjected to Axial Impact Loading”. Presented in 11th
International Symposium on Plasticity and Impact Mechanics (Implast 2016). Indian
Institute of Technology, Delhi, India, December, 2016.
3. N. Nasir Hussain, Srinivasa Prakash Regalla and Venkata Daseswara Rao Yendluri.
“Large Deformation in Composite Crash Box for Automobile under Impact Loading
With Various Trigger Configurations”. Presented in International Conference on
Composite Materials and Structures (ICCMS 2017). Indian Institute of Technology,
Hyderabad, India, December, 2017.
4. N. Nasir Hussain, Srinivasa Prakash Regalla and Venkata Daseswara Rao Yendluri.
“Economical Method for Manufacturing of Advanced Light Weight Material Crash Box
for Automobiles”. Materials Today: Proceedings, 2020. In Press. DOI:
10.1016/j.matpr.2020.02.081. In Proceedings of 1st International Conference on
Advanced Light-weight Materials and Structures (ICALMS-2k20), CMR Technical
Campus, Hyderabad, India, March, 2020.
5. N. Nasir Hussain, Srinivasa Prakash Regalla and Venkata Daseswara Rao Yendluri.
“Analysis on Crashworthiness of Light Weighted Automobile Composite Material
CrashBox with Advanced Triggers”. Presented in 1st International Conference on
Advanced Light-weight Materials and Structures (ICALMS-2k20), CMR Technical
Campus, Hyderabad, India, March, 2020.

175
National Conference Publications and Presentations:
1. N. Nasir Hussain, Srinivasa Prakash Regalla and Venkata Daseswara Rao Yendluri.
“Design of Trigger Geometry and Location for Crashworthiness of Automobile
Crashbox under Low Velocity Impact.” Presented in 2nd National Conference on Design
and Manufacturing Technologies for Product Life Cycle (DPLC-2016), Birla Institute of
Technology & Science, Pilani, Hyderabad Campus, Hyderabad, India, March, 2016.
176
Brief Biography of the Candidate
Mr. Nasir Hussain N obtained his B.Tech. in Mechanical Engineering with merit from
Jawaharlal Nehru Technological University (JNTU), Hyderabad, Telangana and
Master of Engg. in CAD/CAM (Mechanical Engineering) with gold medal from
Osmania University (OU), Hyderabad, Telangana. He is presently pursuing Ph.D. at
BITS-Pilani, Hyderabad Campus and also working as Deputy Manager at Hyundai
Motors India Engineering Pvt. Ltd. (Hyundai R&D Center, Hyderabad). He has over ten
years of experience in CAE simulation of automobile crash and safety. His areas of
research interests are crash safety of passenger vehicles, occupant injury and vehicle
safety performance (vehicle structural crash analysis). He has also submitted one patent.
Brief Biography of the Supervisor (Guide)
Prof. Srinivasa Prakash Regalla obtained his PhD in Mechanical Engineering from IIT
Delhi in 1998, M. Tech. in Manufacturing Science (Mechanical Engineering) from IIT
Kanpur in 1992 and B.Tech. in Mechanical Engineering from Kakatiya Institute of
Technology and Science, Warangal in 1990. Presently, he is a professor in the
department of Mechanical Engineering and the coordinator for the product design and
realization laboratory at the BITS Pilani, Hyderabad Campus. Previously, he was the
Head of the department of mechanical engineering, associate dean of work-integrated
learning programmes, assistant dean of research & consultancy, professor in-charge of
faculty affairs and lead of the industry engagement imperative of mission-2015 at BITS
Pilani. He published 22 sci/scie, 12 scopus and 15 other peer-reviewed journal papers
and more than 30 international conference proceedings papers, 2 books and submitted 3
patents. He completed 3 funded research projects, including as the PI of a project on low-
cost and affordable additive manufacturing (AM) made below-knee prosthesis funded by
DBT/BIRAC/BIG. He is currently a co-PI in an industrial R&D project. He taught a
large variety of undergraduate and postgraduate courses at BITS Pilani some of which
are newly introduced elective courses and lead the design of several new on-campus and
work-integrated learning programmes. He is a member of ASME, ISPO, SAE-India, TSI
and IEI. He has been a delegate of the IMPLAST series of conferences on plasticity and
impact mechanics since its occurrence at IIT Delhi in 1996.
https://www.bits-pilani.ac.in/hyderabad/spregalla/Profile
177
Brief Biography of the Supervisor (Co-Guide)
Prof.Yendluri Venkata Daseswara Rao obtained his M. Tech. in Design Engineering
(Mechanical Engineering) from Indian Institute of Technology, Delhi (IIT Delhi) and
Doctor of Philosophy (PhD) in Mechanical Engineering from National Institute of
Technology, Raipur (NIT Raipur). He is presently Associate Professor in the Department
of Mechanical Engineering, BITS Pilani Hyderabad Campus. He has been working with
BITS Pilani for last ten years in various capacities and has several years of experience in
academics. He has served at various capacities during his tenure at BITS-Pilani some
notable positions are Head Department of Mechanical Engineering, BITS Pilani
Hyderabad Campus till Sept 2016, Faculty In charge Maintenance Division till Sept
2016, Faculty In charge Engineering Services Division, BITS Pilani Hyderabad Campus,
Examination Committee member of Birla Institute of Technology and Science, Pilani,
from 1st August 2010 to 1
st April 2013.He has published several papers in various
national and international journals, and conferences.He is actively involved in teaching
and consultancy for industry. He is a fellow of professional societies like Member of
American Society for Mechanical Engineering, USA, Fellow of Institute of Engineers,
India and Life Member of Indian Society for Technical Education (ISTE).
https://www.bits-pilani.ac.in/hyderabad/daseswararaoyendluri/Profile


![LOCAL DEFORMATIONS OF WILD GROUP ACTIONS · Wiles, Taylor-Wiles, and others ([26], [25]). M. Artin and others have studied deformations of singularities. We focus on deformations](https://static.fdocuments.net/doc/165x107/5f0c14bc7e708231d433a5f8/local-deformations-of-wild-group-actions-wiles-taylor-wiles-and-others-26.jpg)