STUDY OF LAMOTRIGINE WITH ANTI-DIABETIC … OF LAMOTRIGINE WITH ANTI-DIABETIC DRUGS IN EPILEPTIC...
21
Available Online through www.ijpbs.com (or) www.ijpbsonline.com IJPBS |Volume 3| Issue 3 |JUL-SEP|2013|377-397 Research Article Biological Sciences International Journal of Pharmacy and Biological Sciences (e-ISSN: 2230-7605) P.Sujatha* et al Int J Pharm Bio Sci www.ijpbs.com or www.ijpbsonline.com Page377 STUDY OF LAMOTRIGINE WITH ANTI-DIABETIC DRUGS IN EPILEPTIC PATIENTS Sudhakar.A 1 , G.B.Simpson 2 , Sujatha Pasula* 3 1 Post graduate, 2 Professor and HOD, Department of Pharmacology, Katuri Medical College and Hospital, Chinakondrupadu, Guntur,Andhra Pradesh-530002. *3 Assistant Professor, Department of Biochemistry, D D Institute of Medical Science and Research, Thiruvalluri, Chennai-631210, *Corresponding Author Email: [email protected] ABSTRACT Background :Drug to drug interactions are common in epileptic patients with diabetes , but there are no reports about interactions of Lamotrigine with Tolbutamide and Glibenclamide. Aim:Present study was conducted in healthy rabbits ,albino rats which were alloxan induced diabetic to evaluate the influence of administration of Lamotrigine on the pharmacokinetics parameters of Tolbutamide and Glibenclamide. Method: Four groups( n=6) of animals ( I, II, III, IV) were selected. Groups I and II were administered with Tolbutamide (40 mg/kg) and groups III a nd I V were administered with Glibenclamide (40 g/kg) .Groups were treated with Lamotrigine respectively for 7 days. On the 8th day one hour after Lamotrigine treatment, groups I ,II and III , IV were administered with Tolbutamide (40m g/kg) and Glibenclamide (40 g/kg) respectively. Blood samples were drawn from tail vein of rat certian hours at the both the occasions i.e ,before and after and were analysed for blood glucose levels by GOD/POD method. The same experiment was repeated in rabbits and diabetic rats. Results: In rabbits Lamotrigine showed a very little reduction in the hypoglycaemic activity of Tolbutamide and also reduction in activity of Glibenclamide. Lamotrigine showed a little reduction in hypoglycaemic activity of Glibenclamide in diabetes induced rats. Conclusion: The study suggests that the dose and frequency of sulfonylureas must be readjusted so that their activity is not altered when administered concomitantly with Lamotrigine. KEY WORDS Sulfonylureas, Lamotrigine ,Tolbutamide ,Glibenclamide. INTRODUCTION The epilepsy is common devastating disorder, affecting approximately 2.5 million people in United States alone. Morethan 40 distinct forms of epilepsy have been indentified. Epileptically seizures often cause transient impairment of consciousness leaving the individual at risk of bodily harm and often interfering with education and employment. Therapy is symptomatic in that available drugs inhibit seizures, but neither effective prophylaxis nor complete cure is available. Compliance with medication is a major problem because of the need for long-term therapy together with unwanted effects of many of these drugs. The mechanism of action of anti seizure drugs fall into 3 major categories. Drugs effective against the most common forms of epileptic seizures, partial and generalized tonic-clomic seizures, appears to work by one of two mechanism. One is to limit the sustained, repetitive firing of a neuron, an effect mediated by promoting the inactivated state of voltage-activated Na+ channels. A second mechanism appears to involve enhanced amino butyric acid (GABA)-mediated synaptic inhibition, an effect mediated by an action pre-synaptically
-
Upload
vuongquynh -
Category
Documents
-
view
220 -
download
1
Transcript of STUDY OF LAMOTRIGINE WITH ANTI-DIABETIC … OF LAMOTRIGINE WITH ANTI-DIABETIC DRUGS IN EPILEPTIC...
Available Online through
www.ijpbs.com (or) www.ijpbsonline.com IJPBS |Volume 3| Issue 3 |JUL-SEP|2013|377-397
Research Article
Biological Sciences
International Journal of Pharmacy and Biological Sciences (e-ISSN: 2230-7605)
P.Sujatha* et al Int J Pharm Bio Sci www.ijpbs.com or www.ijpbsonline.com
Pag
e37
7
STUDY OF LAMOTRIGINE WITH ANTI-DIABETIC DRUGS IN EPILEPTIC PATIENTS Sudhakar.A1, G.B.Simpson2, Sujatha Pasula*3
1Post graduate, 2Professor and HOD, Department of Pharmacology, Katuri Medical College and Hospital,
Chinakondrupadu, Guntur,Andhra Pradesh-530002. *3Assistant Professor, Department of Biochemistry, D D Institute of Medical Science and Research,
Thiruvalluri, Chennai-631210,
*Corresponding Author Email: [email protected]
ABSTRACT Background :Drug to drug interactions are common in epileptic patients with diabetes , but there are no
reports about interactions of Lamotrigine with Tolbutamide and Glibenclamide. Aim:Present study was
conducted in healthy rabbits ,albino rats which were alloxan induced diabetic to evaluate the influence of
administration of Lamotrigine on the pharmacokinetics parameters of Tolbutamide and Glibenclamide.
Method: Four groups( n=6) of animals ( I, II, III, IV) were selected. Groups I and II were administered with
Tolbutamide (40 mg/kg) and groups III a nd I V were administered with Glibenclamide (40 g/kg) .Groups were
treated with Lamotrigine respectively for 7 days. On the 8th day one hour after Lamotrigine treatment,
groups I ,II and III , IV were administered with Tolbutamide (40m g/kg) and Glibenclamide (40 g/kg)
respectively. Blood samples were drawn from tail vein of rat certian hours at the both the occasions i.e
,before and after and were analysed for blood glucose levels by GOD/POD method. The same experiment was
repeated in rabbits and diabetic rats. Results: In rabbits Lamotrigine showed a very little reduction in the
hypoglycaemic activity of Tolbutamide and also reduction in activity of Glibenclamide. Lamotrigine showed a
little reduction in hypoglycaemic activity of Glibenclamide in diabetes induced rats. Conclusion: The study suggests
that the dose and frequency of sulfonylureas must be readjusted so that their activity is not altered when
administered concomitantly with Lamotrigine.
KEY WORDS Sulfonylureas, Lamotrigine ,Tolbutamide ,Glibenclamide.
INTRODUCTION
The epilepsy is common devastating disorder,
affecting approximately 2.5 million people in United
States alone. Morethan 40 distinct forms of epilepsy
have been indentified. Epileptically seizures often
cause transient impairment of consciousness
leaving the individual at risk of bodily harm and
often interfering with education and employment.
Therapy is symptomatic in that available drugs inhibit
seizures, but neither effective prophylaxis nor
complete cure is available. Compliance with
medication is a major problem because of the
need for long-term therapy together with unwanted
effects of many of these drugs.
The mechanism of action of anti seizure drugs fall
into 3 major categories. Drugs effective against the
most common forms of epileptic seizures, partial
and generalized tonic-clomic seizures, appears to
work by one of two mechanism. One is to limit the
sustained, repetitive firing of a neuron, an effect
mediated by promoting the inactivated state of
voltage-activated Na+ channels. A second
mechanism appears to involve enhanced amino
butyric acid (GABA)-mediated synaptic inhibition,
an effect mediated by an action pre-synaptically
Available Online through
www.ijpbs.com (or) www.ijpbsonline.com IJPBS |Volume 3| Issue 3 |JUL-SEPT|2013|377-397
International Journal of Pharmacy and Biological Sciences (e-ISSN: 2230-7605)
P.Sujatha* et al Int J Pharm Bio Sci www.ijpbs.com or www.ijpbsonline.com
Pag
e37
8
for some drugs and post synaptically for others.
Drugs effective against a less common form of
epileptic seizure, absence seizure, limit activation
of a particular voltage activated Ca++ channel
known as T-current.(1,2)
There are several incidences that a patient may
suffer with more than one disease at a time. It is a
need to treat all these aliments simultaneously.
Hence it may required to administer more than
one drug at the same time So, the incidence of
drug-drug interactions may be very high in case of
hospitalised patients.(1,3,4) This is a harmful type of
pharmacodynamic drug interaction. (5, 6)
In case of pharmacokinetic type of drug- drug
interaction, one drug may be interfering with
absorption, distribution, metabolism and excretion
of another drug and thereby increasing or
decreasing the potency, onset and duration of
action. It appears that the prolonged usage of
Lamotrigine may induce the enzyme responsible
for its own metabolism, keeping this aspect in
view, it is thought that the metabolism of other
drugs that are metabolized by cytochrome P450
enzyme system may be affected. Sulfonylureas are
belonging to a class of orally acting anti diabetic
agents (Tolbutamide, Glibenclamide etc.) That are
metabolized by cytochrome P450 enzyme system.(3)
Any alteration in the pharmacokinetics of these
orally acting anti-diabetic agents may result in
either severe hypoglycaemia or hyperglycaemia.
Hence, it is critical to monitor the plasma levels
of these agents to maintain the optimum blood
glucose level.(4,5,6)
Since, there are certain percentage of patients
who suffer from both partial seizure and diabetes,
the treatment to both the diseases require a
prolonged period and Lamotrigine and sulfonylureas
may be combined. During such treatment regime,
Lamotrigine is likely to affect the pharmacokinetics
of sulfonylureas, thereby influence their anti diabetic
effect.
Hence we have planned to investigate the
possible interaction between Lamotrigine and
sulfonylureas (Tolbutamide and glibenclamide) in
healthy rats, rabbits and diabetic rats. The criteria
for investigation is to estimate the ex tent of
influence of pretreatment of Lamotrigine on the
hypoglycaemic/anti-diabetic effect of sulfonylureas
(Tolbutamide and Glibenclamide).
In the following pages, the relevant literature
regarding epilepsy, anti epileptic drugs, Lamotrigine,
its pharmacodynamic and pharmacokinetic
properties, and interaction with the other drugs
along with reports regarding the sulfonylureas and
their interaction with other drugs are recorded
MATERIALS AND METHODS
1. Tolbutamide : A suspension was prep ared by
using 5% gum acacia as a suspending
2. Agent to represent 40mg/ml.
3. Glibenclamide : A solution was prepar ed (as
explained earlier) to represent 40!g/ml.
4. Lamotrigine: A suspension was prepared in 5%
gum acacia to represent 100mg/ml.
5. Anticoagulant powder: Potassium oxalate and
sodium fluoride in the ratio 3:1.
6. Alloxan : A solution of alloxan was prepared in
normal saline to represent 150mg/ml Route
Intraperitonially.
7. Albino rats: A group of 6 animals were taken.
Albino rabbits 3 in number
8. Glucose estimation kit
9. Spirit, aluminium foil, low voltage lamp, variable
micropipette, 3ml and 10ml test tubes, mouth
operated pipettes 1ml and 2ml, tissue paper,
distilled water etc.
10. Elico mini sl. 171 spectrophotometer.
Experimental procedure :( 7)
Albino rats of either sex weighing between 150-260
grams were divided into 4
groups (Group I, II, III, IV) of 6 animals and they
were marked . Albino rabbits of either sex weighing
between 1.5-2.0 Kg were divided groups (Group I,
II, III & IV) o f 3 animals each. They were suitably
marked and placed in different rabbit cages, they
were marked conveniently. The animals were fasted
for 18 hours before comencing the experiment.
During this period, the animals were allowed to take
adequate water. The f asting was continued till the
completion of the experiment. Then Lamotrigine
200mg/kg was administered orally to all the rats. The
blood samples are collected at 0, 0.5, 1.0, 2.0,
Available Online through
www.ijpbs.com (or) www.ijpbsonline.com IJPBS |Volume 3| Issue 3 |JUL-SEPT|2013|377-397
International Journal of Pharmacy and Biological Sciences (e-ISSN: 2230-7605)
P.Sujatha* et al Int J Pharm Bio Sci www.ijpbs.com or www.ijpbsonline.com
Pag
e37
9
4.0,6.0, 8.0, 12.0 and 24.0 hours after the
administration of Lamotrigine and analysed for
glucose levels by using GOD/POD method. The
animals in group I and II received suspension of
Tolbutamide 40mg/kg and the animals in the groups
III and IV received Glibenclamide 40!g/kg through
oral route. Blood samples were collected at 0.5,
1.0, 2.0, 4.0, 6.0. 8.0, 12.0, 18.0, 24.0, 30.0. 36.0.
42.0 and 48.0 hours from all the four groups.
Blood glucose levels were estimated.
The percentage reduction in blood glucose levels at
time "t” was calculated by using the following
equation.
_%, RRG_JOXFRVH_UHGXFWLRQ_DW_WLPH_³W´_$-
X100 A
Where,
A= Initial blood glucose level before dru g
administration.
B= Blood glucose levels at time "t" after the drug
administration.
In the first part of this present study, the
hypoglycaemic effect of Tolbutamide and
Glibenclamide was established in animals.
In the nex t stage of this experiment, the effect
of different doses of Lamotrigine (100mg/kg and
200mg/k g per day) for one week on the h
ypoglycaemic activity of Tolbutamide and
Glibenclamide was carried out in the same animals.
Induction of diabetes :( 8, 9)
Rats of either sex weighing between 150-260
grams were selected and fasted for 18 hours and
water ad-libitum. The rats were administered with
150mg/kg of alloxan intraperitonially. After 24 hours,
the blood samples were collected and analysed for
blood glucose level. It was found that diabetes was
induced in about 24 hours. The blood samples
were collected and analysed for four more days
to stabilize. These animals were further used for our
antidiabetic study.
Experimental procedure :( 10, 11)
Diabetic rats of either sex were divided into two
groups (group I and II) of 6 Animals and they were
marked conveniently. Blood samples were collected
by fasting for blood glucose estimation.
In the first part of this antidiabetic study, the animals
in group I and II received suspension of Tolbutamide
40mg/kg and Glibenclamide solution 40 mg/k g
respectively through oral route.61,62 and blood
glucose levels estimated
Animals in the groups I and II received suspensions
of Lamotrigine100mg/kg and 200mg/kg per day
orally respectively for one week. Groups III and IV
also received Lamotrigine 100mg/kg and 200mg/kg
orally respectively for one week. On the 7th day, 6
hours after administration of Lamotrigine, the rats
were fasted for 18 hours. On the 8th day blood
samples were collected for determining fasting
blood glucose levels and Lamotrigine 100mg/kg
and 200mg/kg was administered orally to groups I
and II respectively. Groups III and IV were also
treated with Lamotrigine in the similar doses. After
60 minutes, Tolbutamide 40mg/kg was administered
to first
two groups (group I and II) and Glibenclamide
40!g/kg was administered to III and IV
respectively. Blood samples were collected
thereafter at different time intervals up to 48 hours.
Blood glucose levels were estimated by GOD/POD
method and expressed as mg/l00mI of blood. Then
the hypoglycaemic activity of Tolbutamide and
Glibenclamide at time "t" was calculated and the
percentage blood glucose redu ction at various
time intervals were calculated before and after
Lamotrigine treatment.
% Blood glucose reduction at time’t’ = A-B X I 00 /A
RESULTS
Effect of Lamotrigine on blood glucose levels in
normal healthy rats revealed that Lamotrigine has
not altered blood glucose levels significantly . The
blood glucose reduction observed with Lamotrigine
was a minimum 0.63% to a maximum of 6.81%
during 24 hours of the study.
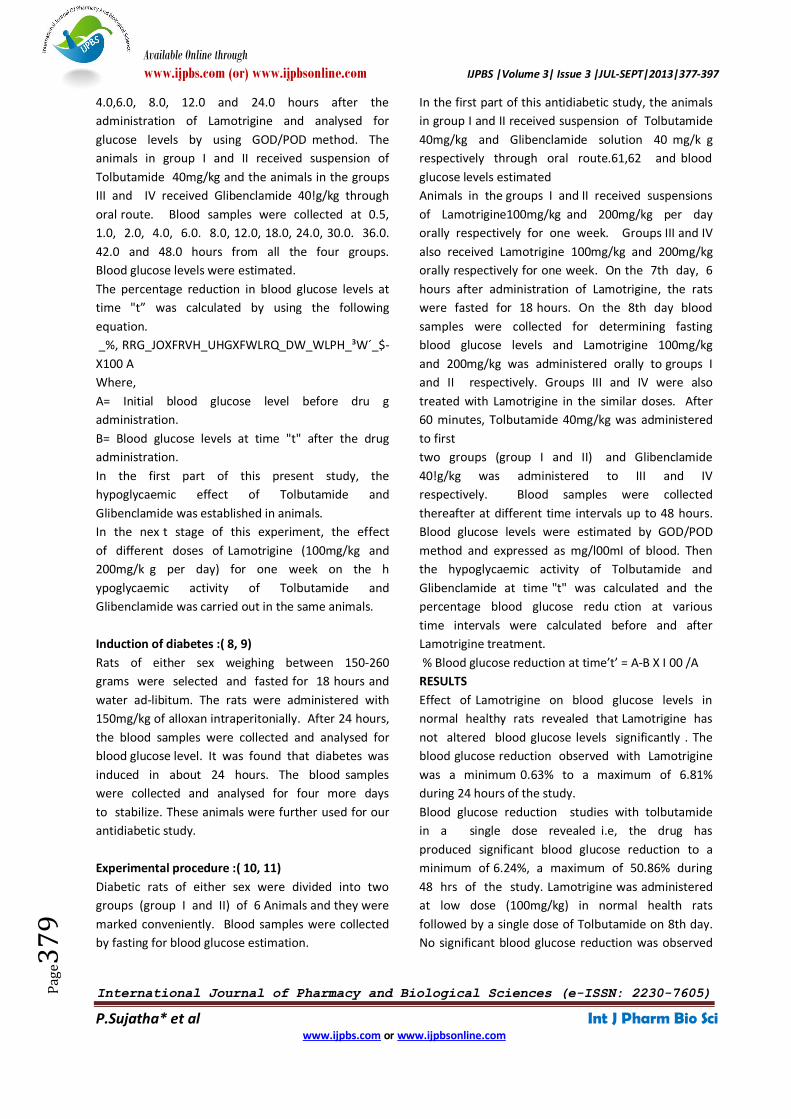
Blood glucose reduction studies with tolbutamide
in a single dose revealed i.e, the drug has
produced significant blood glucose reduction to a
minimum of 6.24%, a maximum of 50.86% during
48 hrs of the study. Lamotrigine was administered
at low dose (100mg/kg) in normal health rats
followed by a single dose of Tolbutamide on 8th day.
No significant blood glucose reduction was observed
Available Online through
www.ijpbs.com (or) www.ijpbsonline.com IJPBS |Volume 3| Issue 3 |JUL-SEPT|2013|377-397
International Journal of Pharmacy and Biological Sciences (e-ISSN: 2230-7605)
P.Sujatha* et al Int J Pharm Bio Sci www.ijpbs.com or www.ijpbsonline.com
Pag
e38
0
except at 0.5, 4.0, 6.0 and 24.0 hrs of in 48 hrs of
study.
Results are tabulated in TABLE: 1, TABLE -2 and graphically depicted in FIG NO: 1
Table-1:Blood Glucose levels with tolbutamide in healthy albino Rats before and after administration of
Lamotrigine (100mg/kg) treatment
Time(hrs) Blood Glucose Levels (mg%) mean+SEM with
Tolbutamide
Blood Glucose Levels (mg%) mean+SEM with
Tolbutamide& Lamotrigine (100mg/kg)
Fasting
0.5
1.0
2.0
3.0
4.0
6.0
8.0
12.0
18.0
24.0
30.0
36.0
42.0
48.0
92.67 ± 2.38
73.13 ± 2.03
65.52 ± 1.80
58.19± 1.71
52.01 ± 1.58
45.54 ± 1.39
54.16 ± 1.78
63.79 ± 1.99
71.98 ± 2.08
74.13 ± 2.21
76.15 ± 2.28
79.66± 2.36
83.19 ± 2.34
85.06 ± 2.23
86.78 ± 2.06
92.09 ± 2.03
80.31 ± 1.79
72.99 ± 1.56
61.49 ± 1.84
51.29 ± 1.24
55.89± 1.49
58.91± 1.24
66.23± 1.60
73.42 ± 1.62
76.43 ± 1.80
79.14 ± 1.94
81.58 ± 2.03
83.76 ± 2.09
85.34 ± 2.02
87.07± 2.26
Table-2: Percentage Blood Glucose Reduction with tolbutamide in healthy albino Rats before and after
administration of Lamotrigine (100mg/kg) treatment
Time(hrs) Percentage Blood Glucose reduction
mean+SEM with Tolbutamide
Percentage Blood Glucose reduction mean+SEM with
Tolbutamide and Lamotrigine (100mg/kg)
Fasting
0.5
1.0
2.0
3.0
4.0
6.0
8.0
12.0
18.0
24.0
30.0
36.0
42.0
48.0
-
21.10 ±0.19
27.36±2.53
37.20±0.91
43.88±0.72
50.86±0.65
43.23±1.19
31.19±0.82
22.81±0.66
20.15±0.66
17.87±0.58
13.99±0.51
10.25±0.50
8.23±0.53
6.24±0.32
-
12.76±0.90
20.74±0.38
33.26±1.19
44.25±0.40
39.33±0.77
36.02±0.62
27.91±0.91
20.27±0.62
17.82±1.33
14.09±0.76
11.4±0.59
9.07±0.73
7.34±0.62
5.49±0.71
Available Online through
www.ijpbs.com (or) www.ijpbsonline.com IJPBS |Volume 3| Issue 3 |JUL-SEPT|2013|377-397
International Journal of Pharmacy and Biological Sciences (e-ISSN: 2230-7605)
P.Sujatha* et al Int J Pharm Bio Sci www.ijpbs.com or www.ijpbsonline.com
Pag
e38
1
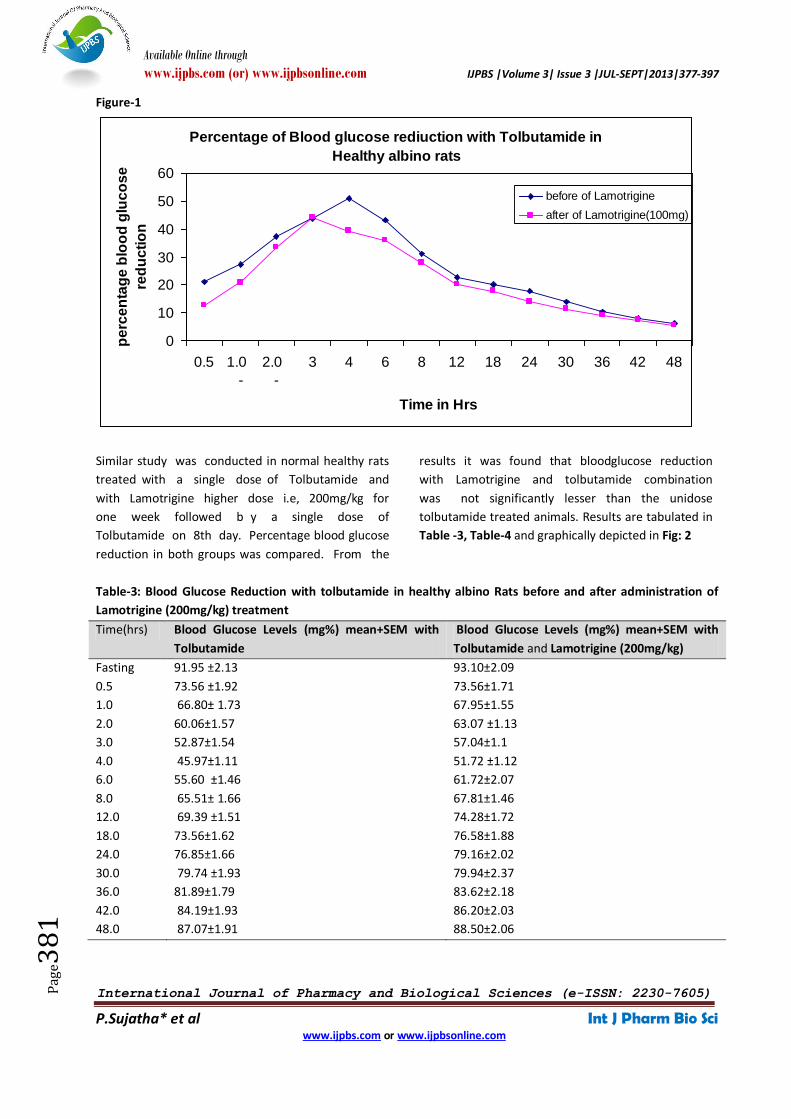
Figure-1
Similar study was conducted in normal healthy rats
treated with a single dose of Tolbutamide and
with Lamotrigine higher dose i.e, 200mg/kg for
one week followed b y a single dose of
Tolbutamide on 8th day. Percentage blood glucose
reduction in both groups was compared. From the
results it was found that bloodglucose reduction
with Lamotrigine and tolbutamide combination
was not significantly lesser than the unidose
tolbutamide treated animals. Results are tabulated in
Table -3, Table-4 and graphically depicted in Fig: 2
Table-3: Blood Glucose Reduction with tolbutamide in healthy albino Rats before and after administration of
Lamotrigine (200mg/kg) treatment
Time(hrs) Blood Glucose Levels (mg%) mean+SEM with
Tolbutamide
Blood Glucose Levels (mg%) mean+SEM with
Tolbutamide and Lamotrigine (200mg/kg)
Fasting
0.5
1.0
2.0
3.0
4.0
6.0
8.0
12.0
18.0
24.0
30.0
36.0
42.0
48.0
91.95 ±2.13
73.56 ±1.92
66.80± 1.73
60.06±1.57
52.87±1.54
45.97±1.11
55.60 ±1.46
65.51± 1.66
69.39 ±1.51
73.56±1.62
76.85±1.66
79.74 ±1.93
81.89±1.79
84.19±1.93
87.07±1.91
93.10±2.09
73.56±1.71
67.95±1.55
63.07 ±1.13
57.04±1.1
51.72 ±1.12
61.72±2.07
67.81±1.46
74.28±1.72
76.58±1.88
79.16±2.02
79.94±2.37
83.62±2.18
86.20±2.03
88.50±2.06
Percentage of Blood glucose rediuction with Tolbutamide in
Healthy albino rats
0
10
20
30
40
50
60
0.5 1.0
-
2.0
-
3 4 6 8 12 18 24 30 36 42 48
Time in Hrs
pe
rce
nta
ge
blo
od
glu
co
se
red
uc
tio
n
before of Lamotrigine
after of Lamotrigine(100mg)
Available Online through
www.ijpbs.com (or) www.ijpbsonline.com IJPBS |Volume 3| Issue 3 |JUL-SEPT|2013|377-397
International Journal of Pharmacy and Biological Sciences (e-ISSN: 2230-7605)
P.Sujatha* et al Int J Pharm Bio Sci www.ijpbs.com or www.ijpbsonline.com
Pag
e38
2
Table-4:Percentage Blood Glucose Reduction with tolbutamide in healthy albino Rats before and after
administration of Lamotrigine (200mg/kg) treatment
Time(hrs) Percentage Blood Glucose reduction
mean+SEM with Tolbutamide
Percentage Blood Glucose reduction
mean+SEM with Tolbutamide and Lamotrigine
(200mg/kg)
Fasting
0.5
1.0
2.0
3.0
4.0
6.0
8.0
12.0
18.0
24.0
30.0
36.0
42.0
48.0
-
20.02±0.44
26.23±1.15
34.69±0.63
42.53±0.59
50.00±0.34
39.54±0.60
28.74±0.90
24.35±0.57
19.98±0.29
16.39±0.19
13.17±0.16
10.95±0.16
8.43±0.26
5.59±0.26
-
20.99±0.42
26.95±0.65
32.88±1.13
38.70±1.09
44.44±0.45
35.49±0.56
27.16±0.46
20.22±0.20
17.10±0.77
15.00±0.26
12.40±0.59
10.22±0.48
7.44±0.35
4.54±0.44
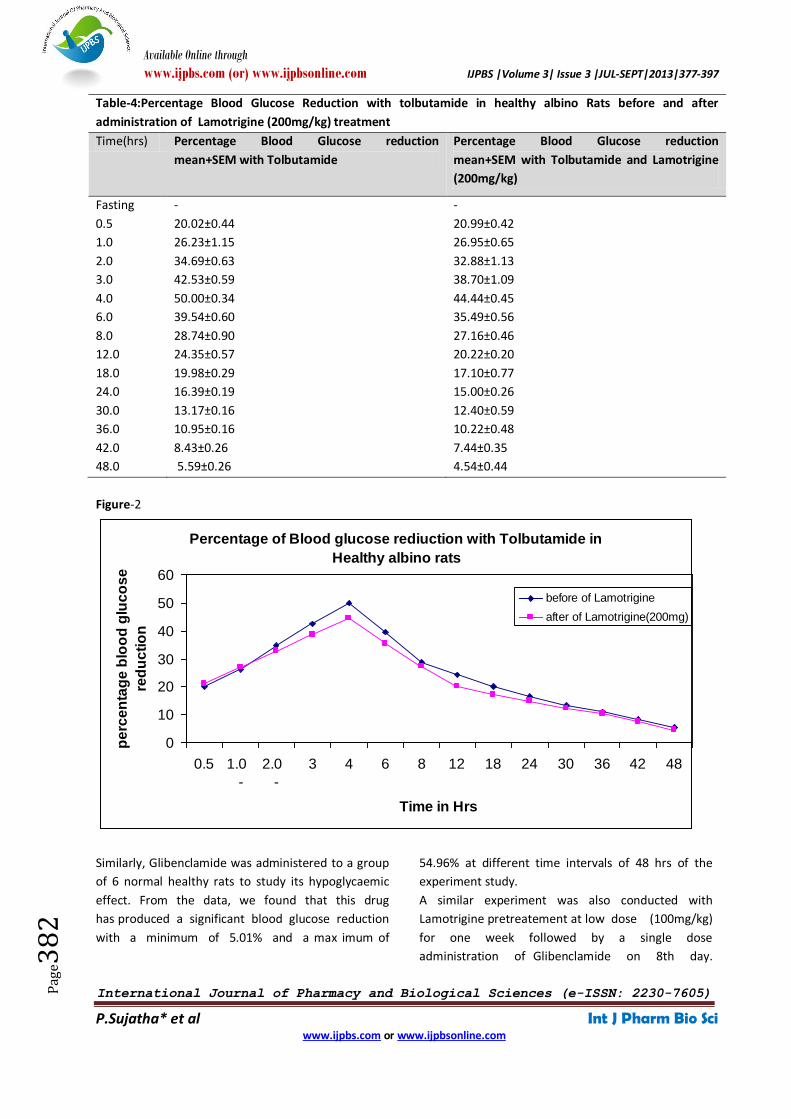
Figure-2
Similarly, Glibenclamide was administered to a group
of 6 normal healthy rats to study its hypoglycaemic
effect. From the data, we found that this drug
has produced a significant blood glucose reduction
with a minimum of 5.01% and a max imum of
54.96% at different time intervals of 48 hrs of the
experiment study.
A similar experiment was also conducted with
Lamotrigine pretreatement at low dose (100mg/kg)
for one week followed by a single dose
administration of Glibenclamide on 8th day.
Percentage of Blood glucose rediuction with Tolbutamide in
Healthy albino rats
0
10
20
30
40
50
60
0.5 1.0
-
2.0
-
3 4 6 8 12 18 24 30 36 42 48
Time in Hrs
pe
rce
nta
ge
blo
od
glu
co
se
red
uc
tio
n
before of Lamotrigine
after of Lamotrigine(200mg)

Available Online through
www.ijpbs.com (or) www.ijpbsonline.com IJPBS |Volume 3| Issue 3 |JUL-SEPT|2013|377-397
International Journal of Pharmacy and Biological Sciences (e-ISSN: 2230-7605)
P.Sujatha* et al Int J Pharm Bio Sci www.ijpbs.com or www.ijpbsonline.com
Pag
e38
3
Hypoglycaemic effect with these two drug
combination was compar ed with that of
Glibenclamide single dose treated group. From the
data , it was found that the combination has
always produced a lesser hypo glycaemic effect
than single dose treated group. The percentage
blood glucose reduction with Glibenclamide and
Lamotrigine combination at low dose was 2.23% to
7.43% during 48 hrs of the experimental study.
Results are tabulated in Table-5, Table-6 and
graphically depicted in Fig: 3
Table-5:Blood Glucose levels with Glibenclamide in healthy albino Rats before and after administration o f
Lamotrigine (100 mg/kg) treatment
Time(hrs)
Blood Glucose Levels (mg%) mean+SEM with
Glibenclamide
Blood Glucose Levels (mg%) mean+SEM with
Glibenclamide and Lamotrigine (100mg/kg)
Fasting
0.5
1.0
2.0
3.0
4.0
6.0
8.0
12.0
18.0
24.0
30.0
36.0
42.0
48.0
89.51±2.36
40.22±1.78
48.99±1.90
50.57±1.98
58.17±2.41
63.65±2.22
68.53±2.50
70.26±2.44
70.83±2.38
73.56±2.64
74.37±2.28
77.30±2.61
81.03±2.46
81.20±13.72
85.05±2.60
89.22±2.29
45.68±1.18
52.58±1.61
54.45 ± 1.76
59.19±1.64
64.80 ±1.66
61.92± 1.33
70.68±1.91
70.68±1.87
75.43±2.03
76.43± 2.14
79.88±2 .12
83.33±2.33
82.61± 2.29
86.35±2.36
Table-6:Percentage Blood Glucose Reduction with Glibenclamide in healthy albino Rats before and after
administration of Lamotrigine (1 00mg/kg) treatment
Time(hrs) Percentage Blood Glucose reduction mean+SEM
with Glibenclamide
Percentage Blood Glucose reduction
mean+SEM with Glibenclamide and
Lamotrigine (100mg/kg)
Fasting
0.5
1.0
2.0
3.0
4.0
6.0
8.0
12.0
18.0
24.0
30.0
36.0
42.0
48.0
-
7.88±0.40
17.04±0.51
20.94±0.70
23.53±0.80
43.36±2.50
54.96±2.13
45.22±1.83
135.23±1.67
29.56±1.38
21.57±1.04
17.89±1.10
14.38±0.94
9.48±1.05
5.01±0.85
-
7.40±0.29
14.33±0.40
20.64±0.55
30.55±0.84
39.02±0.55
48.80±0.28
41.10±0.41
33.62±0.34
27.38±0.44
20.79±0.46
15.470.52
10.58±0.55
6.40±0.43
3.20±0.35
Available Online through
www.ijpbs.com (or) www.ijpbsonline.com IJPBS |Volume 3| Issue 3 |JUL-SEPT|2013|377-397
International Journal of Pharmacy and Biological Sciences (e-ISSN: 2230-7605)
P.Sujatha* et al Int J Pharm Bio Sci www.ijpbs.com or www.ijpbsonline.com
Pag
e38
4
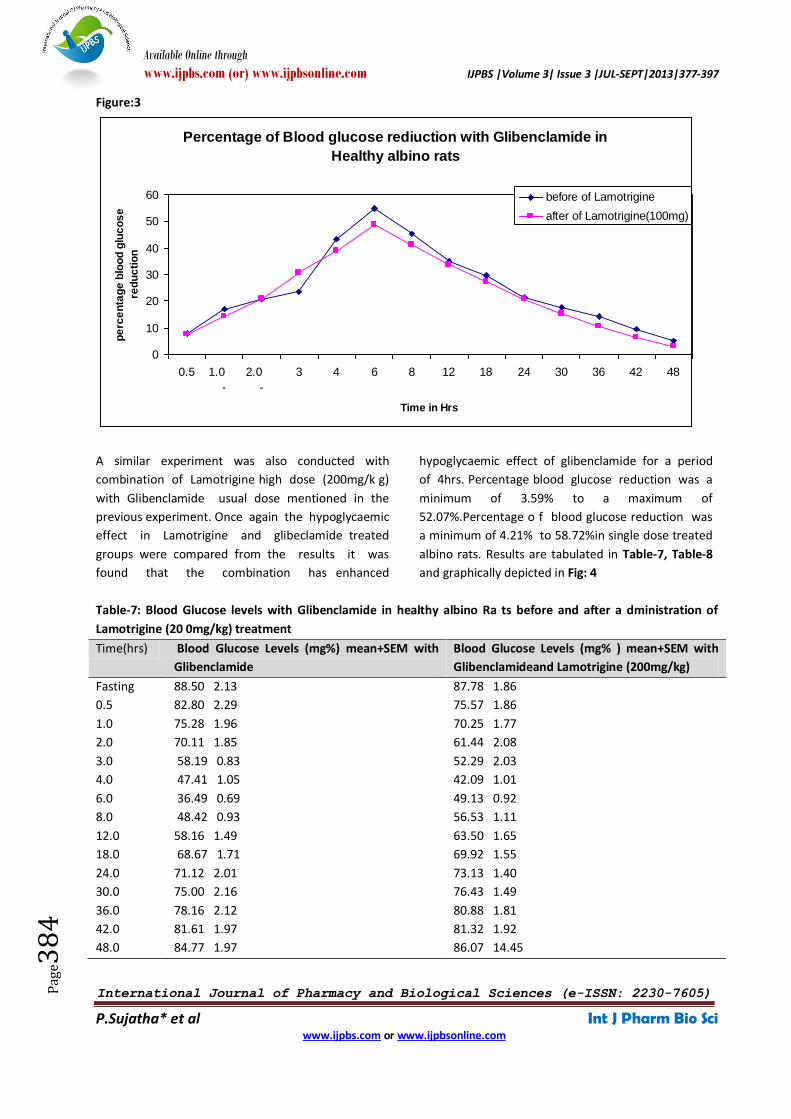
Figure:3
A similar experiment was also conducted with
combination of Lamotrigine high dose (200mg/k g)
with Glibenclamide usual dose mentioned in the
previous experiment. Once again the hypoglycaemic
effect in Lamotrigine and glibeclamide treated
groups were compared from the results it was
found that the combination has enhanced
hypoglycaemic effect of glibenclamide for a period
of 4hrs. Percentage blood glucose reduction was a
minimum of 3.59% to a maximum of
52.07%.Percentage o f blood glucose reduction was
a minimum of 4.21% to 58.72%in single dose treated
albino rats. Results are tabulated in Table-7, Table-8
and graphically depicted in Fig: 4
Table-7: Blood Glucose levels with Glibenclamide in healthy albino Ra ts before and after a dministration of
Lamotrigine (20 0mg/kg) treatment
Time(hrs) Blood Glucose Levels (mg%) mean+SEM with
Glibenclamide
Blood Glucose Levels (mg% ) mean+SEM with
Glibenclamideand Lamotrigine (200mg/kg)
Fasting
0.5
1.0
2.0
3.0
4.0
6.0
8.0
12.0
18.0
24.0
30.0
36.0
42.0
48.0
88.50 2.13
82.80 2.29
75.28 1.96
70.11 1.85
58.19 0.83
47.41 1.05
36.49 0.69
48.42 0.93
58.16 1.49
68.67 1.71
71.12 2.01
75.00 2.16
78.16 2.12
81.61 1.97
84.77 1.97
87.78 1.86
75.57 1.86
70.25 1.77
61.44 2.08
52.29 2.03
42.09 1.01
49.13 0.92
56.53 1.11
63.50 1.65
69.92 1.55
73.13 1.40
76.43 1.49
80.88 1.81
81.32 1.92
86.07 14.45
Percentage of Blood glucose rediuction with Glibenclamide in
Healthy albino rats
0
10
20
30
40
50
60
0.5 1.0
-
2.0
-
3 4 6 8 12 18 24 30 36 42 48
Time in Hrs
pe
rce
nta
ge
blo
od
glu
co
se
red
uc
tio
n
before of Lamotrigine
after of Lamotrigine(100mg)
Available Online through
www.ijpbs.com (or) www.ijpbsonline.com IJPBS |Volume 3| Issue 3 |JUL-SEPT|2013|377-397
International Journal of Pharmacy and Biological Sciences (e-ISSN: 2230-7605)
P.Sujatha* et al Int J Pharm Bio Sci www.ijpbs.com or www.ijpbsonline.com
Pag
e38
5
Table-8: Percentage Blood Glucose Reduction with Glibenclamide in healthy albino Rats before and after
administration of Lamotrigine (200mg/kg) treatment
Time(hrs) Percentage Blood Glucose reduction
mean+SEM with Glibenclamide
Percentage Blood Glucose reduction
mean+SEM with Glibenclamide and
Lamotrigine (200mg/kg)
Fasting
0.5
1.0
2.0
3.0
4.0
6.0
8.0
12.0
18.0
24.0
30.0
36.0
42.0
48.0
-
7.95±0.54
14.9±0.43
20.79±0.44
34.16±0.83
46.71±0.93
58.72±0.72
45.71±1.36
34.15±0.70
22.42±0.54
19.67±0.62
15.30±0.69
11.72±0.43
7.79±0.31
4.21±0.12
-
13.91±0.50
20.00±0.42
30.09±1.13
39.90±2.09
52.07±0.25
44.01±0.54
35.59±0.51
27.69±0.65
20.36±0.39
16.67±0.49
12.91±0.54
7.87±0.65
7.38±0.50
3.59±0.48
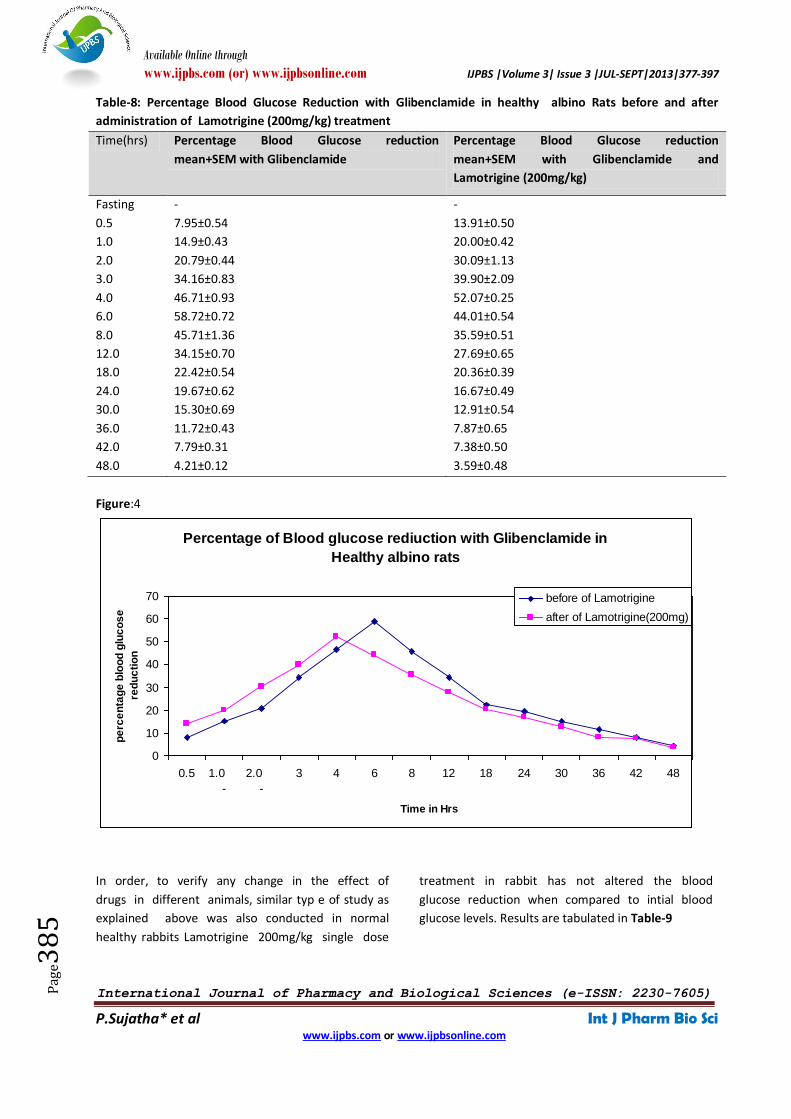
Figure:4
In order, to verify any change in the effect of
drugs in different animals, similar typ e of study as
explained above was also conducted in normal
healthy rabbits Lamotrigine 200mg/kg single dose
treatment in rabbit has not altered the blood
glucose reduction when compared to intial blood
glucose levels. Results are tabulated in Table-9
Percentage of Blood glucose rediuction with Glibenclamide in
Healthy albino rats
0
10
20
30
40
50
60
70
0.5 1.0
-
2.0
-
3 4 6 8 12 18 24 30 36 42 48
Time in Hrs
pe
rce
nta
ge
blo
od
glu
co
se
red
uc
tio
n
before of Lamotrigine
after of Lamotrigine(200mg)
Available Online through
www.ijpbs.com (or) www.ijpbsonline.com IJPBS |Volume 3| Issue 3 |JUL-SEPT|2013|377-397
International Journal of Pharmacy and Biological Sciences (e-ISSN: 2230-7605)
P.Sujatha* et al Int J Pharm Bio Sci www.ijpbs.com or www.ijpbsonline.com
Pag
e38
6
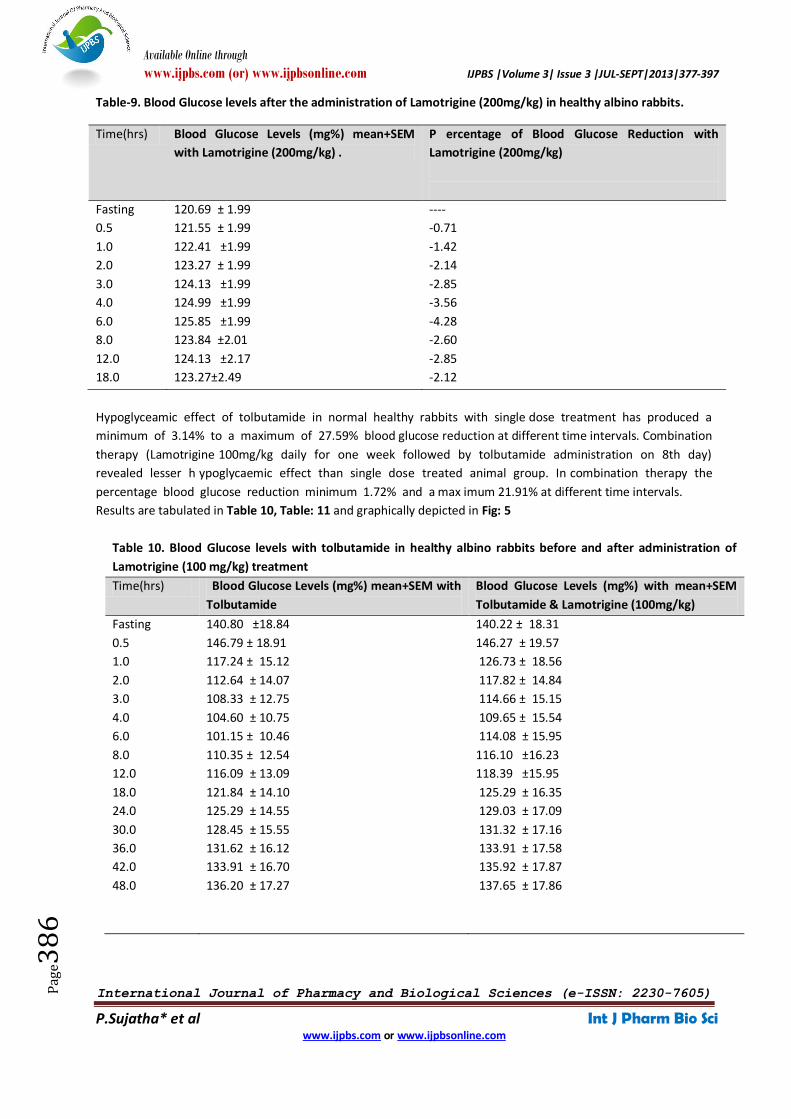
Table-9. Blood Glucose levels after the administration of Lamotrigine (200mg/kg) in healthy albino rabbits.
Time(hrs) Blood Glucose Levels (mg%) mean+SEM
with Lamotrigine (200mg/kg) .
P ercentage of Blood Glucose Reduction with
Lamotrigine (200mg/kg)
Fasting
0.5
1.0
2.0
3.0
4.0
6.0
8.0
12.0
18.0
120.69 ± 1.99
121.55 ± 1.99
122.41 ±1.99
123.27 ± 1.99
124.13 ±1.99
124.99 ±1.99
125.85 ±1.99
123.84 ±2.01
124.13 ±2.17
123.27±2.49
----
-0.71
-1.42
-2.14
-2.85
-3.56
-4.28
-2.60
-2.85
-2.12
Hypoglyceamic effect of tolbutamide in normal healthy rabbits with single dose treatment has produced a
minimum of 3.14% to a maximum of 27.59% blood glucose reduction at different time intervals. Combination
therapy (Lamotrigine 100mg/kg daily for one week followed by tolbutamide administration on 8th day)
revealed lesser h ypoglycaemic effect than single dose treated animal group. In combination therapy the
percentage blood glucose reduction minimum 1.72% and a max imum 21.91% at different time intervals.
Results are tabulated in Table 10, Table: 11 and graphically depicted in Fig: 5
Table 10. Blood Glucose levels with tolbutamide in healthy albino rabbits before and after administration of
Lamotrigine (100 mg/kg) treatment
Time(hrs) Blood Glucose Levels (mg%) mean+SEM with
Tolbutamide
Blood Glucose Levels (mg%) with mean+SEM
Tolbutamide & Lamotrigine (100mg/kg)
Fasting
0.5
1.0
2.0
3.0
4.0
6.0
8.0
12.0
18.0
24.0
30.0
36.0
42.0
48.0
140.80 ±18.84
146.79 ± 18.91
117.24 ± 15.12
112.64 ± 14.07
108.33 ± 12.75
104.60 ± 10.75
101.15 ± 10.46
110.35 ± 12.54
116.09 ± 13.09
121.84 ± 14.10
125.29 ± 14.55
128.45 ± 15.55
131.62 ± 16.12
133.91 ± 16.70
136.20 ± 17.27
140.22 ± 18.31
146.27 ± 19.57
126.73 ± 18.56
117.82 ± 14.84
114.66 ± 15.15
109.65 ± 15.54
114.08 ± 15.95
116.10 ±16.23
118.39 ±15.95
125.29 ± 16.35
129.03 ± 17.09
131.32 ± 17.16
133.91 ± 17.58
135.92 ± 17.87
137.65 ± 17.86
Available Online through
www.ijpbs.com (or) www.ijpbsonline.com IJPBS |Volume 3| Issue 3 |JUL-SEPT|2013|377-397
International Journal of Pharmacy and Biological Sciences (e-ISSN: 2230-7605)
P.Sujatha* et al Int J Pharm Bio Sci www.ijpbs.com or www.ijpbsonline.com
Pag
e38
7
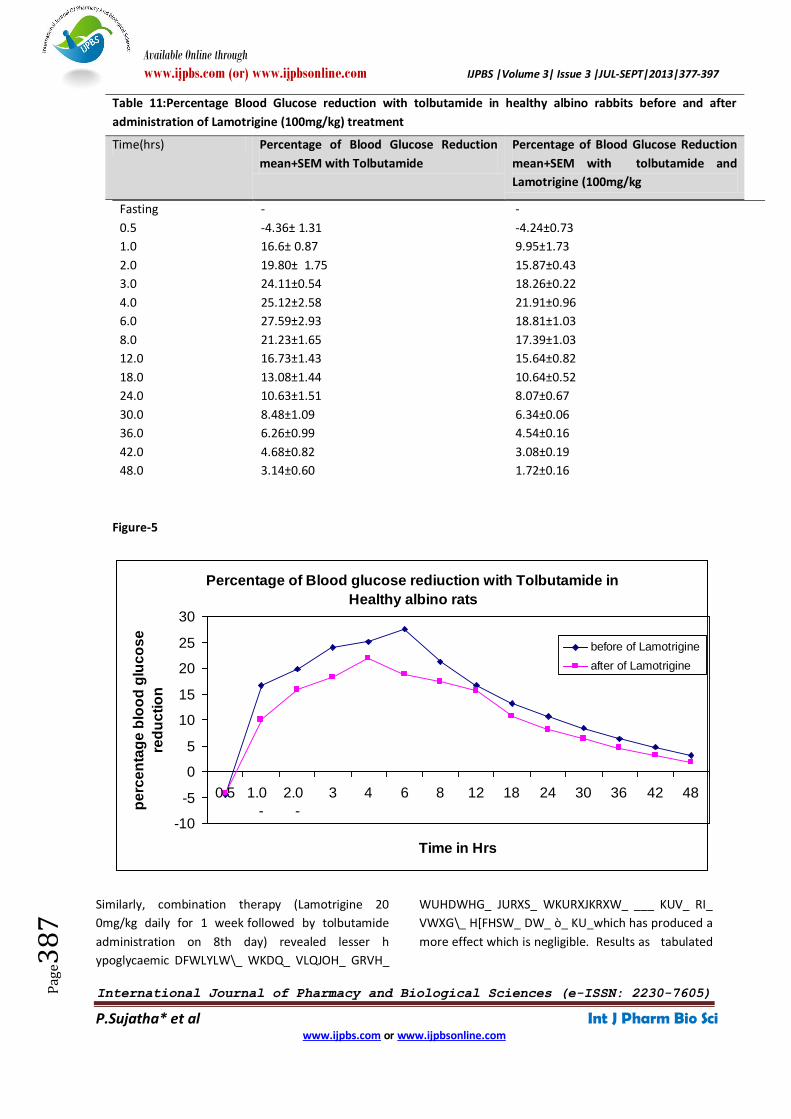
Table 11:Percentage Blood Glucose reduction with tolbutamide in healthy albino rabbits before and after
administration of Lamotrigine (100mg/kg) treatment
Time(hrs) Percentage of Blood Glucose Reduction
mean+SEM with Tolbutamide
Percentage of Blood Glucose Reduction
mean+SEM with tolbutamide and
Lamotrigine (100mg/kg
Figure-5
Fasting
0.5
1.0
2.0
3.0
4.0
6.0
8.0
12.0
18.0
24.0
30.0
36.0
42.0
48.0
-
-4.36± 1.31
16.6± 0.87
19.80± 1.75
24.11±0.54
25.12±2.58
27.59±2.93
21.23±1.65
16.73±1.43
13.08±1.44
10.63±1.51
8.48±1.09
6.26±0.99
4.68±0.82
3.14±0.60
-
-4.24±0.73
9.95±1.73
15.87±0.43
18.26±0.22
21.91±0.96
18.81±1.03
17.39±1.03
15.64±0.82
10.64±0.52
8.07±0.67
6.34±0.06
4.54±0.16
3.08±0.19
1.72±0.16
Similarly, combination therapy (Lamotrigine 20
0mg/kg daily for 1 week followed by tolbutamide
administration on 8th day) revealed lesser h
ypoglycaemic DFWLYLW\_ WKDQ_ VLQJOH_ GRVH_
WUHDWHG_ JURXS_ WKURXJKRXW_ ___ KUV_ RI_
VWXG\_ H[FHSW_ DW_ ò_ KU_which has produced a
more effect which is negligible. Results as tabulated
Percentage of Blood glucose rediuction with Tolbutamide in
Healthy albino rats
-10
-5
0
5
10
15
20
25
30
0.5 1.0
-
2.0
-
3 4 6 8 12 18 24 30 36 42 48
Time in Hrs
pe
rce
nta
ge
blo
od
glu
co
se
red
uc
tio
n
before of Lamotrigine
after of Lamotrigine
Available Online through
www.ijpbs.com (or) www.ijpbsonline.com IJPBS |Volume 3| Issue 3 |JUL-SEPT|2013|377-397
International Journal of Pharmacy and Biological Sciences (e-ISSN: 2230-7605)
P.Sujatha* et al Int J Pharm Bio Sci www.ijpbs.com or www.ijpbsonline.com
Pag
e38
8
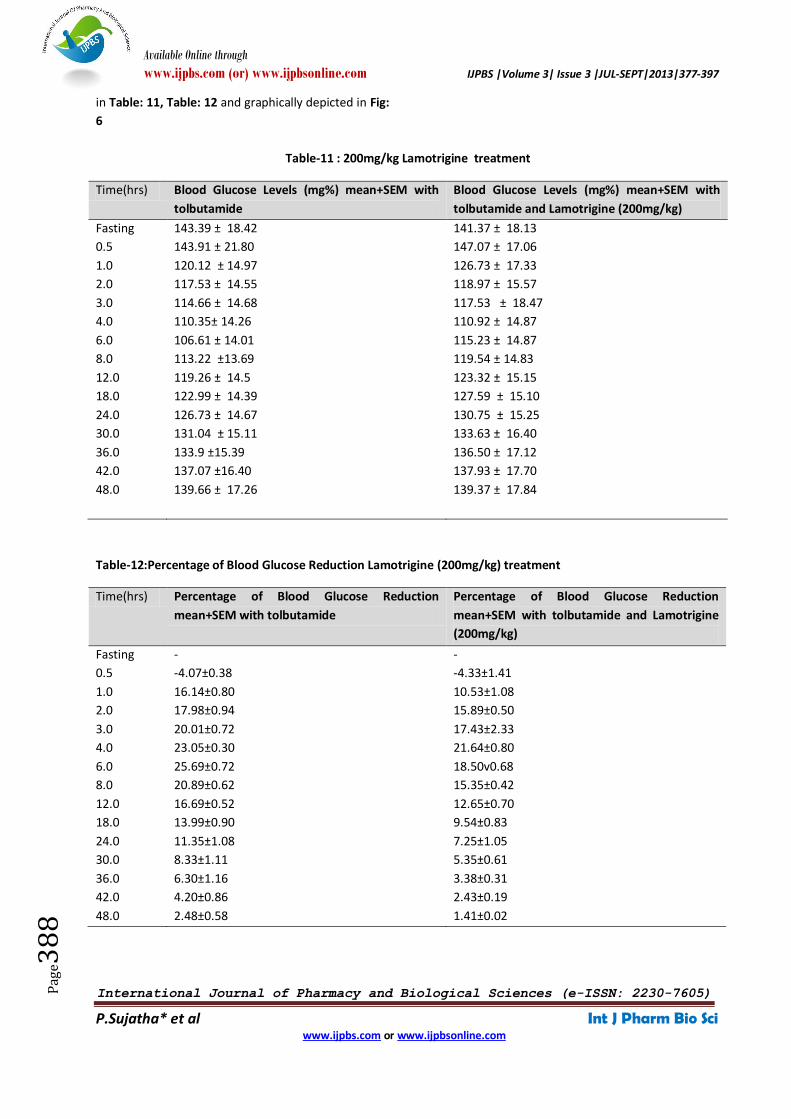
in Table: 11, Table: 12 and graphically depicted in Fig:
6
Table-11 : 200mg/kg Lamotrigine treatment
Time(hrs) Blood Glucose Levels (mg%) mean+SEM with
tolbutamide
Blood Glucose Levels (mg%) mean+SEM with
tolbutamide and Lamotrigine (200mg/kg)
Fasting
0.5
1.0
2.0
3.0
4.0
6.0
8.0
12.0
18.0
24.0
30.0
36.0
42.0
48.0
143.39 ± 18.42
143.91 ± 21.80
120.12 ± 14.97
117.53 ± 14.55
114.66 ± 14.68
110.35± 14.26
106.61 ± 14.01
113.22 ±13.69
119.26 ± 14.5
122.99 ± 14.39
126.73 ± 14.67
131.04 ± 15.11
133.9 ±15.39
137.07 ±16.40
139.66 ± 17.26
141.37 ± 18.13
147.07 ± 17.06
126.73 ± 17.33
118.97 ± 15.57
117.53 ± 18.47
110.92 ± 14.87
115.23 ± 14.87
119.54 ± 14.83
123.32 ± 15.15
127.59 ± 15.10
130.75 ± 15.25
133.63 ± 16.40
136.50 ± 17.12
137.93 ± 17.70
139.37 ± 17.84
Table-12:Percentage of Blood Glucose Reduction Lamotrigine (200mg/kg) treatment
Time(hrs) Percentage of Blood Glucose Reduction
mean+SEM with tolbutamide
Percentage of Blood Glucose Reduction
mean+SEM with tolbutamide and Lamotrigine
(200mg/kg)
Fasting
0.5
1.0
2.0
3.0
4.0
6.0
8.0
12.0
18.0
24.0
30.0
36.0
42.0
48.0
-
-4.07±0.38
16.14±0.80
17.98±0.94
20.01±0.72
23.05±0.30
25.69±0.72
20.89±0.62
16.69±0.52
13.99±0.90
11.35±1.08
8.33±1.11
6.30±1.16
4.20±0.86
2.48±0.58
-
-4.33±1.41
10.53±1.08
15.89±0.50
17.43±2.33
21.64±0.80
18.50v0.68
15.35±0.42
12.65±0.70
9.54±0.83
7.25±1.05
5.35±0.61
3.38±0.31
2.43±0.19
1.41±0.02
Available Online through
www.ijpbs.com (or) www.ijpbsonline.com IJPBS |Volume 3| Issue 3 |JUL-SEPT|2013|377-397
International Journal of Pharmacy and Biological Sciences (e-ISSN: 2230-7605)
P.Sujatha* et al Int J Pharm Bio Sci www.ijpbs.com or www.ijpbsonline.com
Pag
e38
9
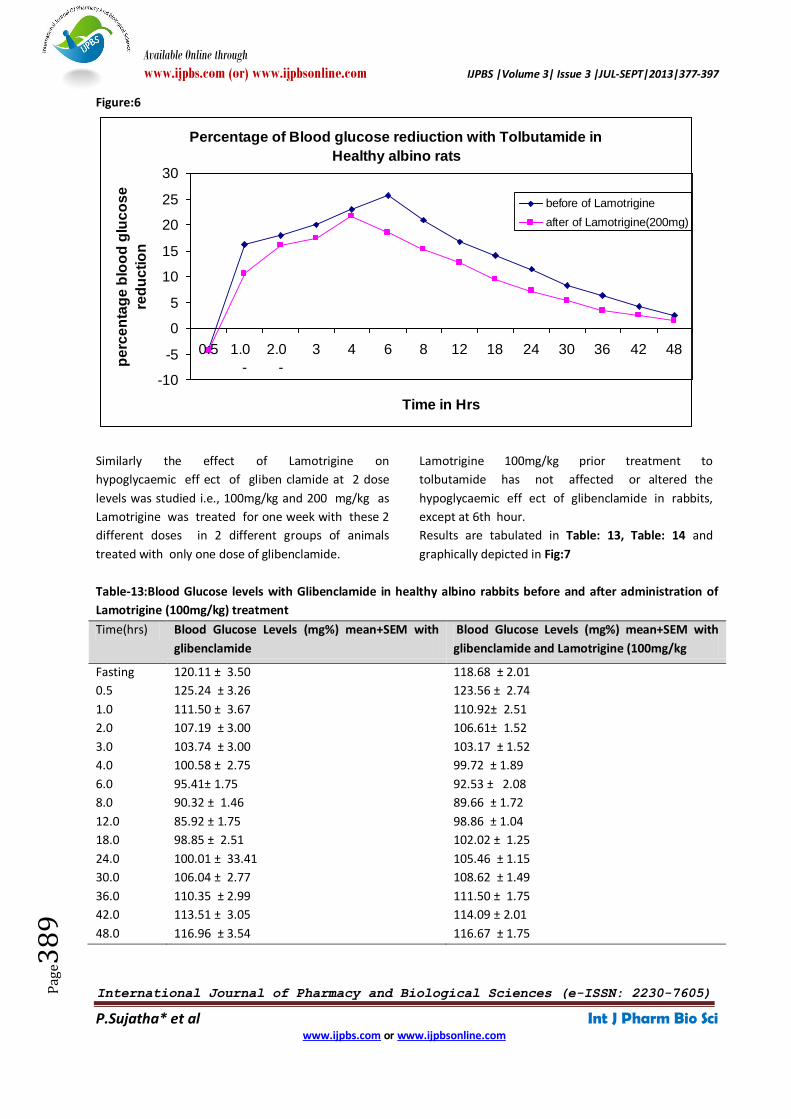
Figure:6
Similarly the effect of Lamotrigine on
hypoglycaemic eff ect of gliben clamide at 2 dose
levels was studied i.e., 100mg/kg and 200 mg/kg as
Lamotrigine was treated for one week with these 2
different doses in 2 different groups of animals
treated with only one dose of glibenclamide.
Lamotrigine 100mg/kg prior treatment to
tolbutamide has not affected or altered the
hypoglycaemic eff ect of glibenclamide in rabbits,
except at 6th hour.
Results are tabulated in Table: 13, Table: 14 and
graphically depicted in Fig:7
Table-13:Blood Glucose levels with Glibenclamide in healthy albino rabbits before and after administration of
Lamotrigine (100mg/kg) treatment
Time(hrs) Blood Glucose Levels (mg%) mean+SEM with
glibenclamide
Blood Glucose Levels (mg%) mean+SEM with
glibenclamide and Lamotrigine (100mg/kg
Fasting
0.5
1.0
2.0
3.0
4.0
6.0
8.0
12.0
18.0
24.0
30.0
36.0
42.0
48.0
120.11 ± 3.50
125.24 ± 3.26
111.50 ± 3.67
107.19 ± 3.00
103.74 ± 3.00
100.58 ± 2.75
95.41± 1.75
90.32 ± 1.46
85.92 ± 1.75
98.85 ± 2.51
100.01 ± 33.41
106.04 ± 2.77
110.35 ± 2.99
113.51 ± 3.05
116.96 ± 3.54
118.68 ± 2.01
123.56 ± 2.74
110.92± 2.51
106.61± 1.52
103.17 ± 1.52
99.72 ± 1.89
92.53 ± 2.08
89.66 ± 1.72
98.86 ± 1.04
102.02 ± 1.25
105.46 ± 1.15
108.62 ± 1.49
111.50 ± 1.75
114.09 ± 2.01
116.67 ± 1.75
Percentage of Blood glucose rediuction with Tolbutamide in
Healthy albino rats
-10
-5
0
5
10
15
20
25
30
0.5 1.0
-
2.0
-
3 4 6 8 12 18 24 30 36 42 48
Time in Hrs
pe
rce
nta
ge
blo
od
glu
co
se
red
uc
tio
n
before of Lamotrigine
after of Lamotrigine(200mg)
Available Online through
www.ijpbs.com (or) www.ijpbsonline.com IJPBS |Volume 3| Issue 3 |JUL-SEPT|2013|377-397
International Journal of Pharmacy and Biological Sciences (e-ISSN: 2230-7605)
P.Sujatha* et al Int J Pharm Bio Sci www.ijpbs.com or www.ijpbsonline.com
Pag
e39
0
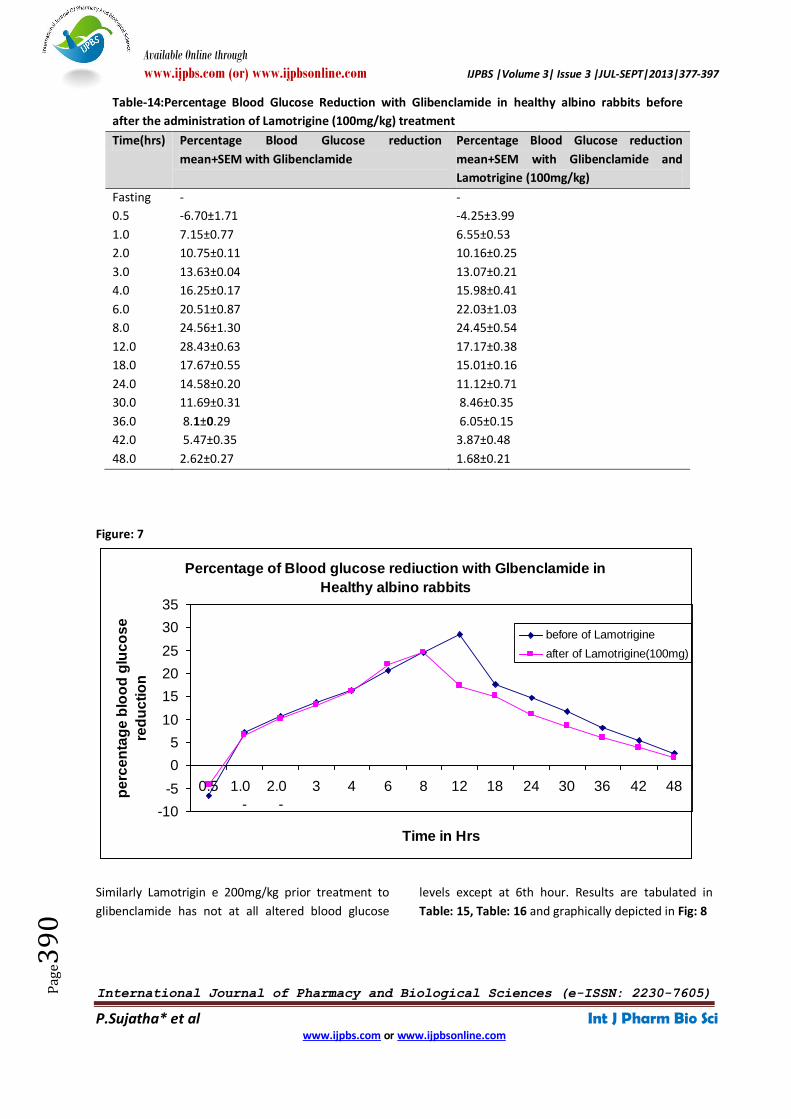
Table-14:Percentage Blood Glucose Reduction with Glibenclamide in healthy albino rabbits before
after the administration of Lamotrigine (100mg/kg) treatment
Time(hrs) Percentage Blood Glucose reduction
mean+SEM with Glibenclamide
Percentage Blood Glucose reduction
mean+SEM with Glibenclamide and
Lamotrigine (100mg/kg)
Fasting
0.5
1.0
2.0
3.0
4.0
6.0
8.0
12.0
18.0
24.0
30.0
36.0
42.0
48.0
-
-6.70±1.71
7.15±0.77
10.75±0.11
13.63±0.04
16.25±0.17
20.51±0.87
24.56±1.30
28.43±0.63
17.67±0.55
14.58±0.20
11.69±0.31
8.1±0.29
5.47±0.35
2.62±0.27
-
-4.25±3.99
6.55±0.53
10.16±0.25
13.07±0.21
15.98±0.41
22.03±1.03
24.45±0.54
17.17±0.38
15.01±0.16
11.12±0.71
8.46±0.35
6.05±0.15
3.87±0.48
1.68±0.21
Figure: 7
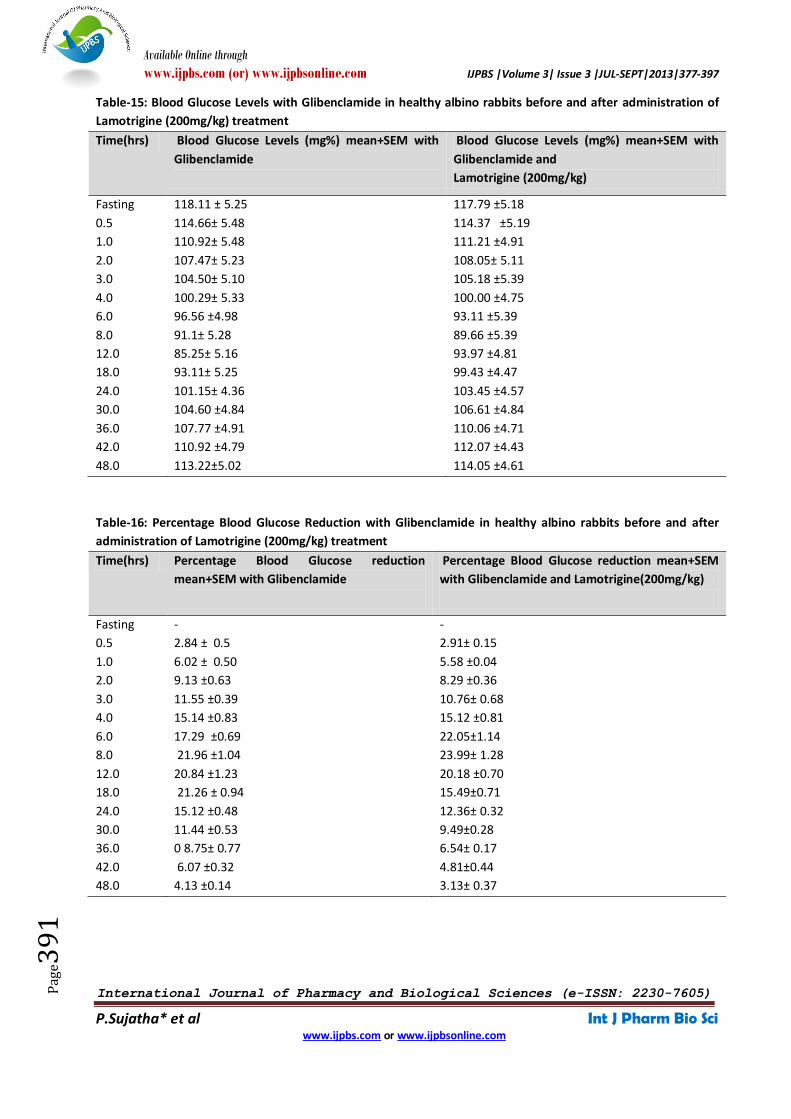
Similarly Lamotrigin e 200mg/kg prior treatment to
glibenclamide has not at all altered blood glucose
levels except at 6th hour. Results are tabulated in
Table: 15, Table: 16 and graphically depicted in Fig: 8
Percentage of Blood glucose rediuction with Glbenclamide in
Healthy albino rabbits
-10
-5
0
5
10
15
20
25
30
35
0.5 1.0
-
2.0
-
3 4 6 8 12 18 24 30 36 42 48
Time in Hrs
pe
rce
nta
ge
blo
od
glu
co
se
red
uc
tio
n
before of Lamotrigine
after of Lamotrigine(100mg)
Available Online through
www.ijpbs.com (or) www.ijpbsonline.com IJPBS |Volume 3| Issue 3 |JUL-SEPT|2013|377-397
International Journal of Pharmacy and Biological Sciences (e-ISSN: 2230-7605)
P.Sujatha* et al Int J Pharm Bio Sci www.ijpbs.com or www.ijpbsonline.com
Pag
e39
1
Table-15: Blood Glucose Levels with Glibenclamide in healthy albino rabbits before and after administration of
Lamotrigine (200mg/kg) treatment
Time(hrs) Blood Glucose Levels (mg%) mean+SEM with
Glibenclamide
Blood Glucose Levels (mg%) mean+SEM with
Glibenclamide and
Lamotrigine (200mg/kg)
Fasting
0.5
1.0
2.0
3.0
4.0
6.0
8.0
12.0
18.0
24.0
30.0
36.0
42.0
48.0
118.11 ± 5.25
114.66± 5.48
110.92± 5.48
107.47± 5.23
104.50± 5.10
100.29± 5.33
96.56 ±4.98
91.1± 5.28
85.25± 5.16
93.11± 5.25
101.15± 4.36
104.60 ±4.84
107.77 ±4.91
110.92 ±4.79
113.22±5.02
117.79 ±5.18
114.37 ±5.19
111.21 ±4.91
108.05± 5.11
105.18 ±5.39
100.00 ±4.75
93.11 ±5.39
89.66 ±5.39
93.97 ±4.81
99.43 ±4.47
103.45 ±4.57
106.61 ±4.84
110.06 ±4.71
112.07 ±4.43
114.05 ±4.61
Table-16: Percentage Blood Glucose Reduction with Glibenclamide in healthy albino rabbits before and after
administration of Lamotrigine (200mg/kg) treatment
Time(hrs) Percentage Blood Glucose reduction
mean+SEM with Glibenclamide
Percentage Blood Glucose reduction mean+SEM
with Glibenclamide and Lamotrigine(200mg/kg)
Fasting
0.5
1.0
2.0
3.0
4.0
6.0
8.0
12.0
18.0
24.0
30.0
36.0
42.0
48.0
-
2.84 ± 0.5
6.02 ± 0.50
9.13 ±0.63
11.55 ±0.39
15.14 ±0.83
17.29 ±0.69
21.96 ±1.04
20.84 ±1.23
21.26 ± 0.94
15.12 ±0.48
11.44 ±0.53
0 8.75± 0.77
6.07 ±0.32
4.13 ±0.14
-
2.91± 0.15
5.58 ±0.04
8.29 ±0.36
10.76± 0.68
15.12 ±0.81
22.05±1.14
23.99± 1.28
20.18 ±0.70
15.49±0.71
12.36± 0.32
9.49±0.28
6.54± 0.17
4.81±0.44
3.13± 0.37
Available Online through
www.ijpbs.com (or) www.ijpbsonline.com IJPBS |Volume 3| Issue 3 |JUL-SEPT|2013|377-397
International Journal of Pharmacy and Biological Sciences (e-ISSN: 2230-7605)
P.Sujatha* et al Int J Pharm Bio Sci www.ijpbs.com or www.ijpbsonline.com
Pag
e39
2
Figure: 8
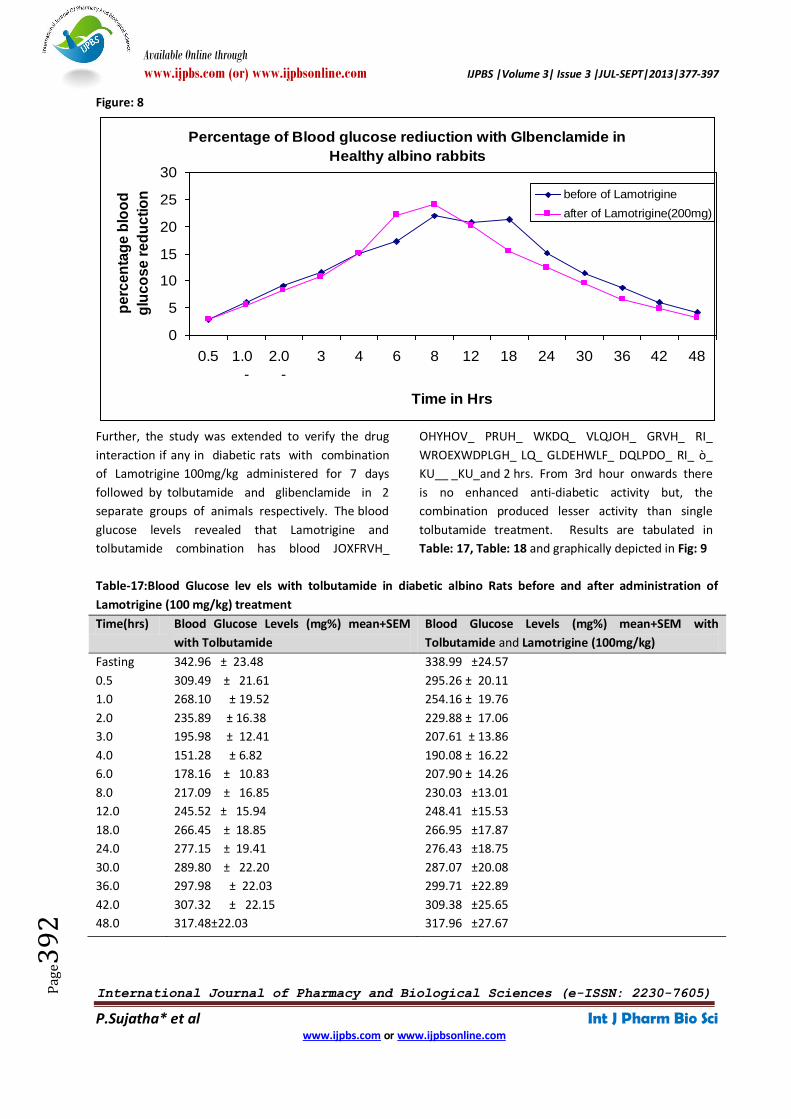
Further, the study was extended to verify the drug
interaction if any in diabetic rats with combination
of Lamotrigine 100mg/kg administered for 7 days
followed by tolbutamide and glibenclamide in 2
separate groups of animals respectively. The blood
glucose levels revealed that Lamotrigine and
tolbutamide combination has blood JOXFRVH_
OHYHOV_ PRUH_ WKDQ_ VLQJOH_ GRVH_ RI_
WROEXWDPLGH_ LQ_ GLDEHWLF_ DQLPDO_ RI_ ò_
KU__ _KU_and 2 hrs. From 3rd hour onwards there
is no enhanced anti-diabetic activity but, the
combination produced lesser activity than single
tolbutamide treatment. Results are tabulated in
Table: 17, Table: 18 and graphically depicted in Fig: 9
Table-17:Blood Glucose lev els with tolbutamide in diabetic albino Rats before and after administration of
Lamotrigine (100 mg/kg) treatment
Time(hrs) Blood Glucose Levels (mg%) mean+SEM
with Tolbutamide
Blood Glucose Levels (mg%) mean+SEM with
Tolbutamide and Lamotrigine (100mg/kg)
Fasting
0.5
1.0
2.0
3.0
4.0
6.0
8.0
12.0
18.0
24.0
30.0
36.0
42.0
48.0
342.96 ± 23.48
309.49 ± 21.61
268.10 ± 19.52
235.89 ± 16.38
195.98 ± 12.41
151.28 ± 6.82
178.16 ± 10.83
217.09 ± 16.85
245.52 ± 15.94
266.45 ± 18.85
277.15 ± 19.41
289.80 ± 22.20
297.98 ± 22.03
307.32 ± 22.15
317.48±22.03
338.99 ±24.57
295.26 ± 20.11
254.16 ± 19.76
229.88 ± 17.06
207.61 ± 13.86
190.08 ± 16.22
207.90 ± 14.26
230.03 ±13.01
248.41 ±15.53
266.95 ±17.87
276.43 ±18.75
287.07 ±20.08
299.71 ±22.89
309.38 ±25.65
317.96 ±27.67
Percentage of Blood glucose rediuction with Glbenclamide in
Healthy albino rabbits
0
5
10
15
20
25
30
0.5 1.0
-
2.0
-
3 4 6 8 12 18 24 30 36 42 48
Time in Hrs
pe
rce
nta
ge
blo
od
glu
co
se
re
du
cti
on before of Lamotrigine
after of Lamotrigine(200mg)
Available Online through
www.ijpbs.com (or) www.ijpbsonline.com IJPBS |Volume 3| Issue 3 |JUL-SEPT|2013|377-397
International Journal of Pharmacy and Biological Sciences (e-ISSN: 2230-7605)
P.Sujatha* et al Int J Pharm Bio Sci www.ijpbs.com or www.ijpbsonline.com
Pag
e39
3
Table-18:Percentage Blood Glucose Reduction with tolbutamide in diabetic albino Rats before and after
administration of Lamotrigine (100mg/kg) treatment
Time(hrs) Percentage Blood Glucose reduction
mean+SEM with Tolbutamide
Percentage Blood Glucose reduction
mean+SEM with Tolbutamide and Lamotrigine
(100mg/kg)
Fasting
0.5
1.0
2.0
3.0
4.0
6.0
8.0
12.0
18.0
24.0
30.0
36.0
42.0
48.0
-
9.79±0.65
21.92±0.90
31.21±0.77
42.65±1.26
55.50±1.26
52.18±4.98
36.79±1.22
29.34±0.96
22.74±0.86
19.20±0.68
15.59±1.63
13.12±1.67
10.38±1.40
7.29±1.18
-
12.44±2.83
24.52±3.91
34.22±2.60
41.76±1.59
48.42±0.35
41.98±0.89
34.74±1.45
28.43±0.93
21.39±0.68
18.13±0.62
14.32±1.00
10.35±0.78
7.63±0.81
4.35±0.99
Figure: 9
Similarly, Lamotrigine glibenclamide combined effect
on anti-diabetic activity was compared with single
dose glibenclamide effect in diabetic rats revealed
no enhanced anti-diabetic activity with
glibenclamide and Lamotrigine but a decreased
anti-diabetic effect was observed with combination
Percentage of Blood glucose rediuction with Tolbutamide in
Diabetic albino rats
0
10
20
30
40
50
60
0.5 1.0
-
2.0
-
3 4 6 8 12 18 24 30 36 42 48
Time in Hrs
pe
rce
nta
ge
blo
od
glu
co
se
red
uc
tio
n
before of Lamotrigine
after of Lamotrigine(100mg)
Available Online through
www.ijpbs.com (or) www.ijpbsonline.com IJPBS |Volume 3| Issue 3 |JUL-SEPT|2013|377-397
International Journal of Pharmacy and Biological Sciences (e-ISSN: 2230-7605)
P.Sujatha* et al Int J Pharm Bio Sci www.ijpbs.com or www.ijpbsonline.com
Pag
e39
4
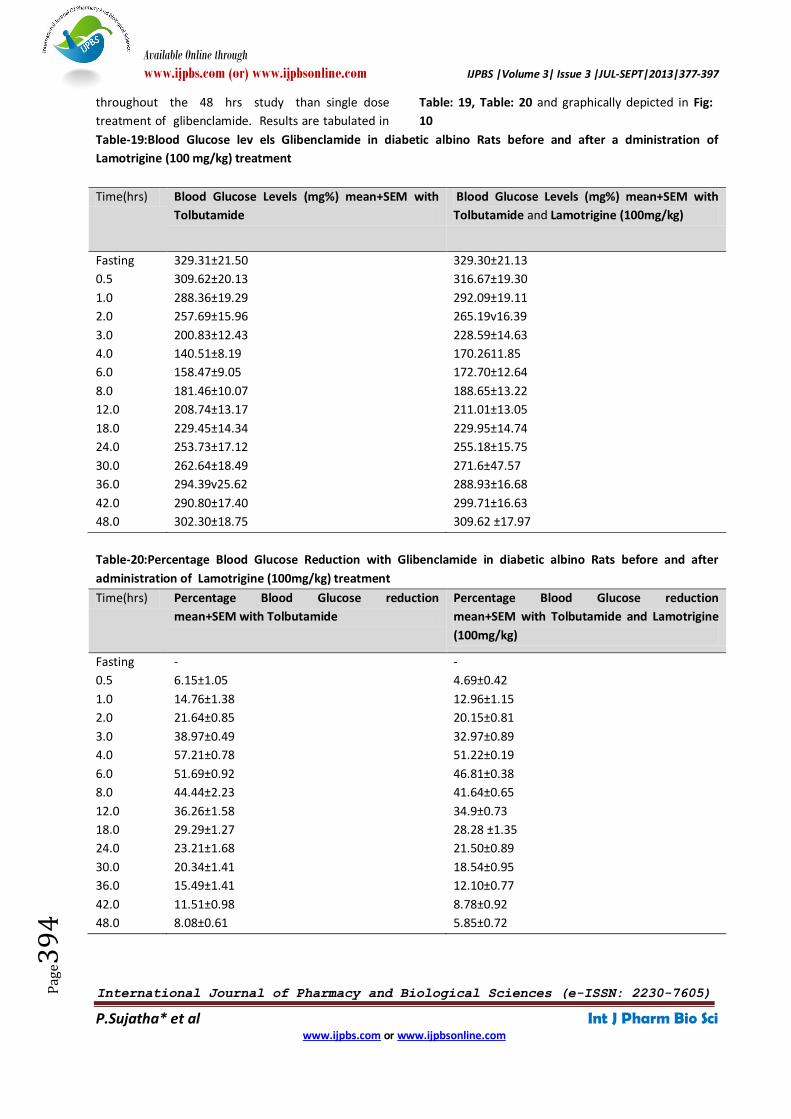
throughout the 48 hrs study than single dose
treatment of glibenclamide. Results are tabulated in
Table: 19, Table: 20 and graphically depicted in Fig:
10
Table-19:Blood Glucose lev els Glibenclamide in diabetic albino Rats before and after a dministration of
Lamotrigine (100 mg/kg) treatment
Time(hrs) Blood Glucose Levels (mg%) mean+SEM with
Tolbutamide
Blood Glucose Levels (mg%) mean+SEM with
Tolbutamide and Lamotrigine (100mg/kg)
Fasting
0.5
1.0
2.0
3.0
4.0
6.0
8.0
12.0
18.0
24.0
30.0
36.0
42.0
48.0
329.31±21.50
309.62±20.13
288.36±19.29
257.69±15.96
200.83±12.43
140.51±8.19
158.47±9.05
181.46±10.07
208.74±13.17
229.45±14.34
253.73±17.12
262.64±18.49
294.39v25.62
290.80±17.40
302.30±18.75
329.30±21.13
316.67±19.30
292.09±19.11
265.19v16.39
228.59±14.63
170.2611.85
172.70±12.64
188.65±13.22
211.01±13.05
229.95±14.74
255.18±15.75
271.6±47.57
288.93±16.68
299.71±16.63
309.62 ±17.97
Table-20:Percentage Blood Glucose Reduction with Glibenclamide in diabetic albino Rats before and after
administration of Lamotrigine (100mg/kg) treatment
Time(hrs) Percentage Blood Glucose reduction
mean+SEM with Tolbutamide
Percentage Blood Glucose reduction
mean+SEM with Tolbutamide and Lamotrigine
(100mg/kg)
Fasting
0.5
1.0
2.0
3.0
4.0
6.0
8.0
12.0
18.0
24.0
30.0
36.0
42.0
48.0
-
6.15±1.05
14.76±1.38
21.64±0.85
38.97±0.49
57.21±0.78
51.69±0.92
44.44±2.23
36.26±1.58
29.29±1.27
23.21±1.68
20.34±1.41
15.49±1.41
11.51±0.98
8.08±0.61
-
4.69±0.42
12.96±1.15
20.15±0.81
32.97±0.89
51.22±0.19
46.81±0.38
41.64±0.65
34.9±0.73
28.28 ±1.35
21.50±0.89
18.54±0.95
12.10±0.77
8.78±0.92
5.85±0.72
Available Online through
www.ijpbs.com (or) www.ijpbsonline.com IJPBS |Volume 3| Issue 3 |JUL-SEPT|2013|377-397
International Journal of Pharmacy and Biological Sciences (e-ISSN: 2230-7605)
P.Sujatha* et al Int J Pharm Bio Sci www.ijpbs.com or www.ijpbsonline.com
Pag
e39
5
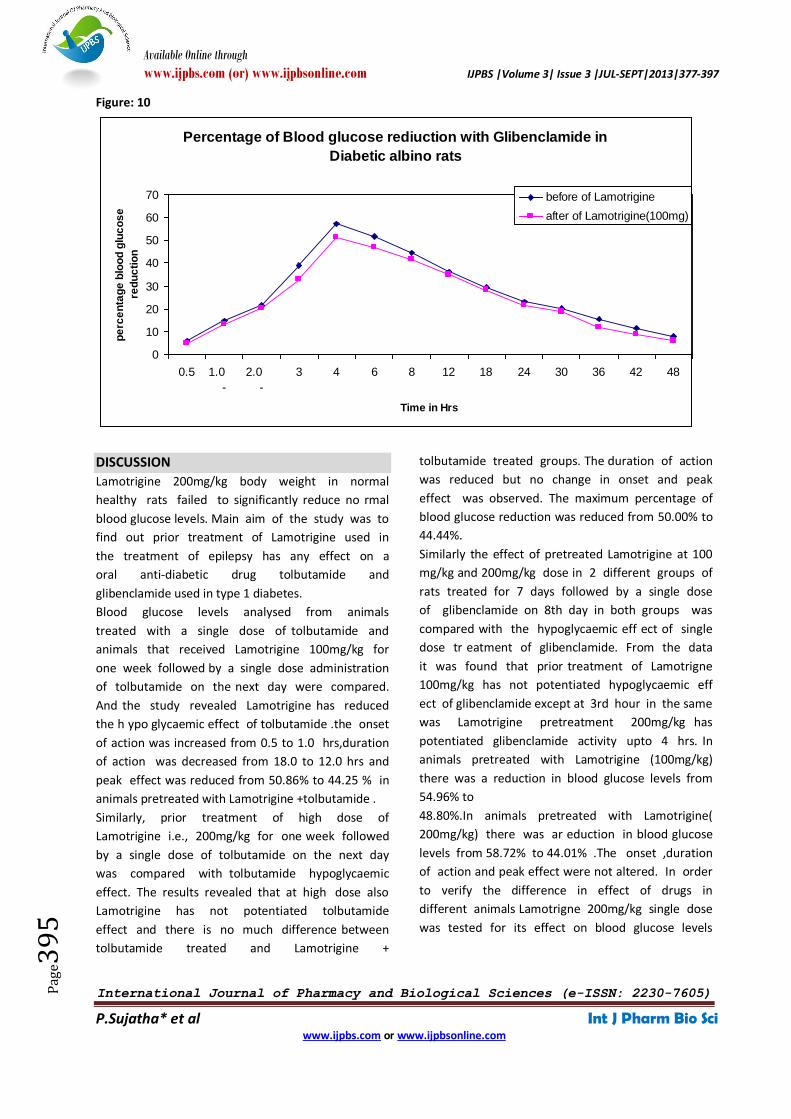
Figure: 10
DISCUSSION
Lamotrigine 200mg/kg body weight in normal
healthy rats failed to significantly reduce no rmal
blood glucose levels. Main aim of the study was to
find out prior treatment of Lamotrigine used in
the treatment of epilepsy has any effect on a
oral anti-diabetic drug tolbutamide and
glibenclamide used in type 1 diabetes.
Blood glucose levels analysed from animals
treated with a single dose of tolbutamide and
animals that received Lamotrigine 100mg/kg for
one week followed by a single dose administration
of tolbutamide on the next day were compared.
And the study revealed Lamotrigine has reduced
the h ypo glycaemic effect of tolbutamide .the onset
of action was increased from 0.5 to 1.0 hrs,duration
of action was decreased from 18.0 to 12.0 hrs and
peak effect was reduced from 50.86% to 44.25 % in
animals pretreated with Lamotrigine +tolbutamide .
Similarly, prior treatment of high dose of
Lamotrigine i.e., 200mg/kg for one week followed
by a single dose of tolbutamide on the next day
was compared with tolbutamide hypoglycaemic
effect. The results revealed that at high dose also
Lamotrigine has not potentiated tolbutamide
effect and there is no much difference between
tolbutamide treated and Lamotrigine +
tolbutamide treated groups. The duration of action
was reduced but no change in onset and peak
effect was observed. The maximum percentage of
blood glucose reduction was reduced from 50.00% to
44.44%.
Similarly the effect of pretreated Lamotrigine at 100
mg/kg and 200mg/kg dose in 2 different groups of
rats treated for 7 days followed by a single dose
of glibenclamide on 8th day in both groups was
compared with the hypoglycaemic eff ect of single
dose tr eatment of glibenclamide. From the data
it was found that prior treatment of Lamotrigne
100mg/kg has not potentiated hypoglycaemic eff
ect of glibenclamide except at 3rd hour in the same
was Lamotrigine pretreatment 200mg/kg has
potentiated glibenclamide activity upto 4 hrs. In
animals pretreated with Lamotrigine (100mg/kg)
there was a reduction in blood glucose levels from
54.96% to
48.80%.In animals pretreated with Lamotrigine(
200mg/kg) there was ar eduction in blood glucose
levels from 58.72% to 44.01% .The onset ,duration
of action and peak effect were not altered. In order
to verify the difference in effect of drugs in
different animals Lamotrigne 200mg/kg single dose
was tested for its effect on blood glucose levels
Percentage of Blood glucose rediuction with Glibenclamide in
Diabetic albino rats
0
10
20
30
40
50
60
70
0.5 1.0
-
2.0
-
3 4 6 8 12 18 24 30 36 42 48
Time in Hrs
pe
rce
nta
ge
blo
od
glu
co
se
red
uc
tio
n
before of Lamotrigine
after of Lamotrigine(100mg)
Available Online through
www.ijpbs.com (or) www.ijpbsonline.com IJPBS |Volume 3| Issue 3 |JUL-SEPT|2013|377-397
International Journal of Pharmacy and Biological Sciences (e-ISSN: 2230-7605)
P.Sujatha* et al Int J Pharm Bio Sci www.ijpbs.com or www.ijpbsonline.com
Pag
e39
6
of normal health y rabbits. Lamotrigine has not
significantly reduced blood glucose levels.
To know the acute treatment of Lamotrigine 100
mg/kg, 200mg/kg for 1 week in 2 different groups
followed by a single dose of tolbutamide on 8th
day was compared with hypoglycaemic effect of
tolbutamide single dose tr eated animals .From the
blood glucose reduction data it was found that
Lamotrigine pretreatment at low and high doses
has not potentiated the hypoglycaemic effect of
tolbutamide in normal healthy rabbits.In animals
pretreated with Lamotrigine (100mg/kg) onset,
duration of action and peak effect were not
significantly reduced.Maximum% of blood glucose
reduction was reduced from 27.58 to 21.91%.In
animals pretreated with Lamotrigine (200mg/kg)
maximum percentage of blood glucose reduction
was reduced from 25.69% to 21.64%.the onset,
duration of action and peak effect were slightly
altered.
Similar study was cond ucted in normal healthy
rabbits and tolbutamide was replaced by
glibenclamide. The results confirmed that
hypoglycaemic effect of glibenclamide was reduced
by Lamotrigine (100mg/kg and 200mg/kg)
throughout S the experimental study. The results
showed a decrease in peak effect and duration of
action.the maximum reduction in blood glucose
levels was found to be from 28.43% to 24.45% in
animals pretreated with Lamotrigine (100mg/k g). In
animals preated with Lamotrigine (200mg/kg)
showed a similar alterations as in case of low
dose treated animals ie., (100mg/kg) with a
reduction in maximum blood glucose reduction
from 27.84% to 23.99%.
Further, the study was extended to diabetic
albino rats with a single dose treatment of
tolbutamide and glibenclamide in two saperate
groups and prior treatment of Lamotrigine
(100mg/k g) for 7 days and on 8th day 2 groups
were administered with tolbutamide and
glibenclamide single dose.
The tolbutamide group did not show any alteration
in onset, duration of action and peak effect. The
maximum reduction in blood glucose levels was from
55.50% to 48.42%. Glibenclamide anti-diabetic
activity in diabetic rats also reduced due to prior
treatment of Lamotrigine throughout the
experimental study. The duration of action was
reduced where as onset and peak effects were not
altered. The maximum blood glucose reduction was
from 57.21% to 51.22%
BIBLIOGRAPHY
1. James O Mc Namara J. Drugs effective in the
treatment of the epilepsies. In:
*RRGPDQQ_DQG_*LOPDQV_7KH_3KDUPDFRORgical
Basis of Therapeutics 10 th ed. Hardmann JG,Limbard
JE,Molinoff PB,Ruddon RW,Gilmann AG, eds. New
York: Mc Graw Hill; 1996:521-5.
2. SatoskarRS,BhandarkarSD,AinapureeSS.Pharmacologya
ndPharmacotherapeutics.17thed.Mumbai:Popular
prakashan;
3. Badyal DK, Dadhich AP. Cyto chrome P450 and drug
Interactions. Indian Journal of Pharmacology 2001
March 10; 33:248-59.
4. Terri L Leviea, Danial E Baker. C ytochrome P 450
drug Interactions. Stockan,California: Therapeutic
Research centre1 999.
5. Rohit Singhal, Nagavi BG ,Adepu Ramesh. Drug
Interactions in community pharmacy.Pharma
Times2004;36:20-26.
6. 6.7KHRGRUD_0LFKDHO__(SLOHSV\_³7KH_'LVHDVH´_
__7KH_3KDUPDFHXWLFDO_-RXUQDO______Feb 27;
262(7034): 297-300.
7. Satyanarayana S , Prasad K, Nitin K.
Pharmocodynamic drug interaction of selegiline and
Tolbutamide in rats. Indian drugs 2003;40(6):366-8
8. Vinuthan MK .et.al.Effect of extracts of Murraya
koenigii leaves on the blood glucose and plasma
insulin in Alloxan-induced Diabetic rats. Indian J
Physiol Pharmacol 2004;48(3):3 48-52.
9. 9. Aruna Pai, Jalal Pure SS,Patil MB,Manvi Fv,
Shivaji Bamme.Antidiabetic activity of Cassia
auriculata linn.seeds.55th IPC Chennai 2003:231.
10. Goyal RK, Kulkarni J, Mehta AA, Santani DD. Effects of
chronic treatment with cromakalin and
glibenclamide in alloxan diabetic rats. Indian Journal
of Pharmacology1997; 29:36.
11. Syamala G, Subburaju T, Jhuma deb, Kumar EP,
Suresh B. Anti-diabetic activity of detoxified extract
Cascaria esculenta (Roxb).55th IPC Chennai 2003:254.
Available Online through
www.ijpbs.com (or) www.ijpbsonline.com IJPBS |Volume 3| Issue 3 |JUL-SEPT|2013|377-397
International Journal of Pharmacy and Biological Sciences (e-ISSN: 2230-7605)
P.Sujatha* et al Int J Pharm Bio Sci www.ijpbs.com or www.ijpbsonline.com
Pag
e39
7
*Corresponding Author: Dr.P.Sujatha, Department of Biochemistry, D D Institute of Medical Science and Research, Thiruvalluri,Chennai-631210 Email.:[email protected]

![arXiv:1606.02074v1 [stat.AP] 7 Jun 2016 · lamotrigine, an anticonvulsant. CEQUEL (Comparative Evaluation of QUEtiapine-Lamotrigine combination versus que-tiapine monotherapy in people](https://static.fdocuments.net/doc/165x107/5fd90bae4aaf4f15356701a8/arxiv160602074v1-statap-7-jun-2016-lamotrigine-an-anticonvulsant-cequel-comparative.jpg)