STUDY OF HYDROPOWER OPTIMIZATION IN SRI …open_jicareport.jica.go.jp/pdf/11750650.pdf · The Study...
107
JAPAN INTERNATIONAL COOPERATION AGENCY CEYLON ELECTRICITY BOARD(CEB) DEMOCRATIC SOCIALIST REPUBLIC OF SRI LANKA STUDY OF HYDROPOWER OPTIMIZATION IN SRI LANKA FINAL REPORT SUMMARY FEBRUARY 2004 ELECTRIC POWER DEVELOPMENT CO., LTD. NIPPON KOEI CO., LTD. TOKYO, JAPAN
Transcript of STUDY OF HYDROPOWER OPTIMIZATION IN SRI …open_jicareport.jica.go.jp/pdf/11750650.pdf · The Study...

JAPAN INTERNATIONAL COOPERATION AGENCY
CEYLON ELECTRICITY BOARD(CEB)DEMOCRATIC SOCIALIST REPUBLIC OF SRI LANKA
STUDYOF
HYDROPOWER OPTIMIZATIONIN
SRI LANKA
FINAL REPORT
SUMMARY
FEBRUARY 2004
ELECTRIC POWER DEVELOPMENT CO., LTD.NIPPON KOEI CO., LTD.
TOKYO, JAPAN
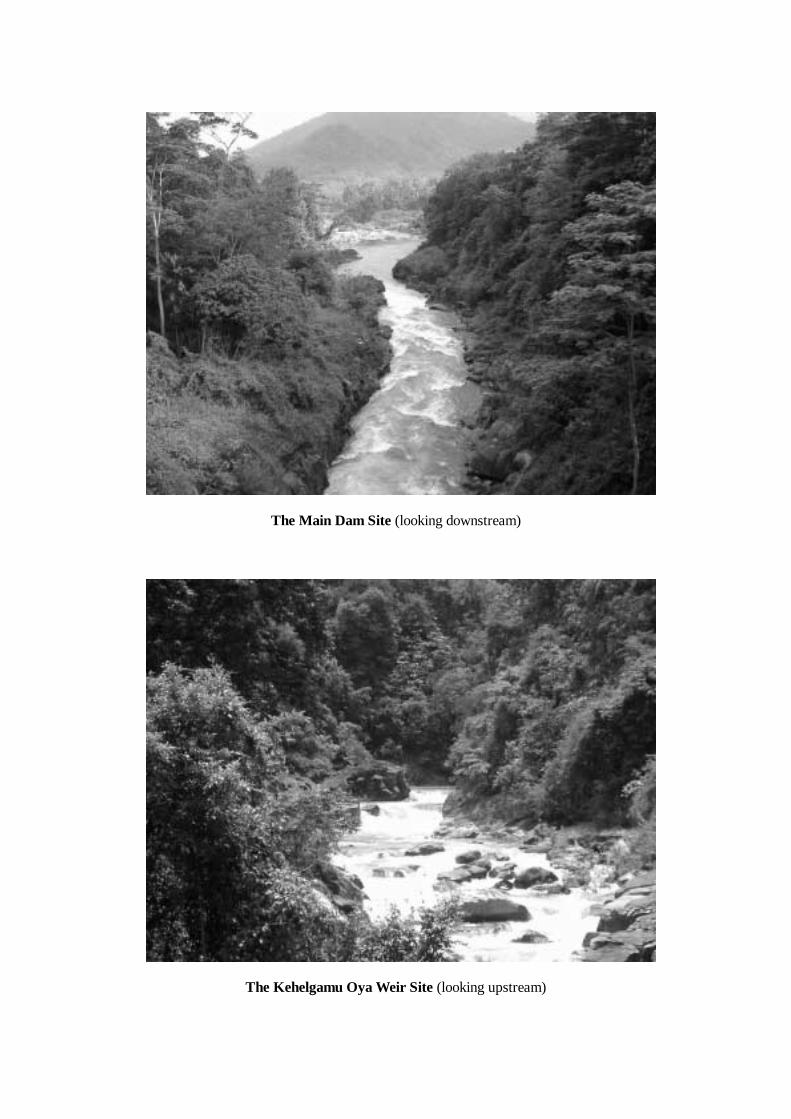
The Main Dam Site (looking downstream)
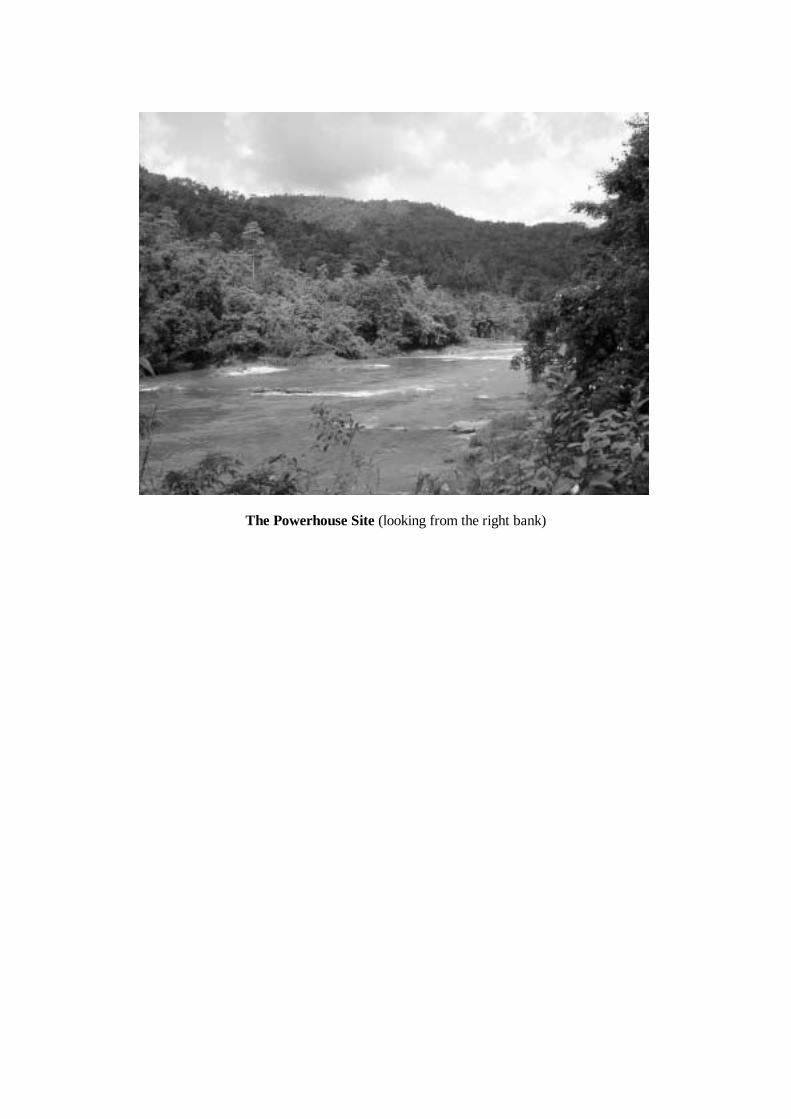
The Kehelgamu Oya Weir Site (looking upstream)
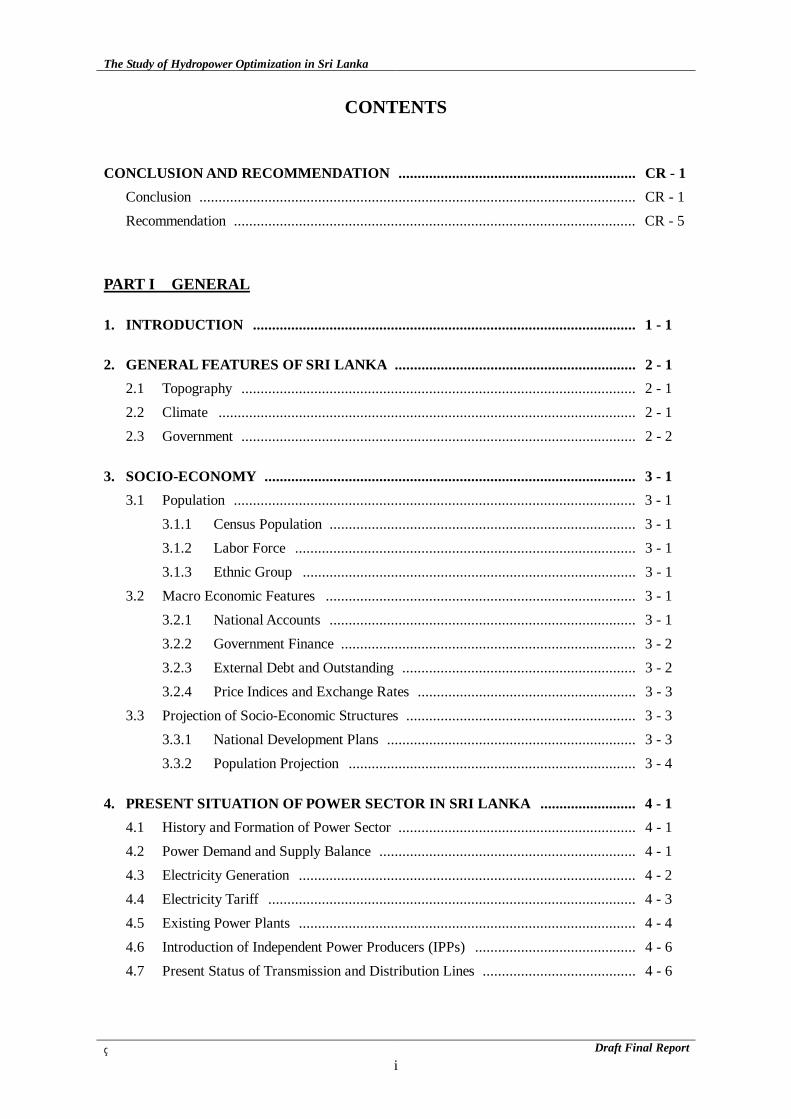
The Powerhouse Site (looking from the right bank)
The Study of Hydropower Optimization in Sri Lanka
Draft Final Reporti
CONTENTS
CONCLUSION AND RECOMMENDATION .............................................................. CR - 1 Conclusion .................................................................................................................. CR - 1 Recommendation ......................................................................................................... CR - 5
PART I GENERAL
1. INTRODUCTION .................................................................................................... 1 - 1
2. GENERAL FEATURES OF SRI LANKA ............................................................... 2 - 1 2.1 Topography ....................................................................................................... 2 - 1 2.2 Climate ............................................................................................................. 2 - 1 2.3 Government ....................................................................................................... 2 - 2
3. SOCIO-ECONOMY ................................................................................................. 3 - 1 3.1 Population ......................................................................................................... 3 - 1
3.1.1 Census Population ................................................................................ 3 - 1 3.1.2 Labor Force ......................................................................................... 3 - 1 3.1.3 Ethnic Group ....................................................................................... 3 - 1
3.2 Macro Economic Features ................................................................................. 3 - 1 3.2.1 National Accounts ................................................................................ 3 - 1 3.2.2 Government Finance ............................................................................. 3 - 2 3.2.3 External Debt and Outstanding ............................................................. 3 - 2 3.2.4 Price Indices and Exchange Rates ......................................................... 3 - 3
3.3 Projection of Socio-Economic Structures ............................................................ 3 - 3 3.3.1 National Development Plans ................................................................. 3 - 3 3.3.2 Population Projection ........................................................................... 3 - 4
4. PRESENT SITUATION OF POWER SECTOR IN SRI LANKA ......................... 4 - 1 4.1 History and Formation of Power Sector .............................................................. 4 - 1 4.2 Power Demand and Supply Balance ................................................................... 4 - 1 4.3 Electricity Generation ........................................................................................ 4 - 2 4.4 Electricity Tariff ................................................................................................ 4 - 3 4.5 Existing Power Plants ........................................................................................ 4 - 4 4.6 Introduction of Independent Power Producers (IPPs) .......................................... 4 - 6 4.7 Present Status of Transmission and Distribution Lines ........................................ 4 - 6
The Study of Hydropower Optimization in Sri Lanka
Draft Final Reportii
5. FORECAST OF POWER DEMAND AND POWER DEVELOPMENT PLAN ................................................. 5 - 1 5.1 Forecast of Power Demand and Supply .............................................................. 5 - 1 5.2 Power Development Plan ................................................................................... 5 - 1
6. POWER SECTOR REFORM .................................................................................. 6 - 1 6.1 Background and Objectives of Power Sector Reform .......................................... 6 - 1 6.2 Reform Plan and Its Issues ................................................................................. 6 - 1 6.3 Issues of Power Sector Reform .......................................................................... 6 - 2 6.4 Post-Reform Issues and Donor Assistance .......................................................... 6 - 3
PART II OPTIMIZATION OF HYDROPOWER IN SRI LANKA
7. METEOROLOGY AND HYDROLOGY ................................................................ 7 - 1 7.1 Topography and Climate Conditions of Study Area ............................................. 7 - 1
7.1.1 Topography in Target River System ...................................................... 7 - 1 7.1.2 Climate Conditions ............................................................................... 7 - 1
7.2 Data Collection and Analysis on Hydrology ........................................................ 7 - 1 7.3 Hydrological Data Analysis ............................................................................... 7 - 1 7.4 Estimation of Runoff Data for
Effective Operation of Existing Hydropower Station ............................. 7 - 2
8. EFFICIENT OPERATION OF EXISTING HYDROPOWER STATIONS ........... 8 - 1 8.1 Long Term Operation of Reservoir Type Power Stations ..................................... 8 - 1
8.1.1 Present Operational Status of Reservoir Type Power Stations ................ 8 - 1 8.1.2 Optimization Study on Reservoir Operation .......................................... 8 - 1
8.2 Efficient Operation of Regulating Pond Type Power Stations .............................. 8 - 2 8.3 Frequency Control ............................................................................................. 8 - 3
8.3.1 Present Situation of Frequency Control ................................................. 8 - 3 8.3.2 Problems of Frequency Control ............................................................ 8 - 3 8.3.3 Improvement of Frequency Control System ........................................... 8 - 4
9. STUDY ON EXPANSION OF EXISTING HYDROPOWER STATIONS ............ 9 - 1 9.1 New Laxapana and Polpitiya Hydropower Stations ............................................ 9 - 1 9.2 Victoria Hydropower Station .............................................................................. 9 - 2 9.3 Samanalawewa Hydropower Station .................................................................. 9 - 3

The Study of Hydropower Optimization in Sri Lanka
Draft Final Reportiii
PART III BROADLANDS HYDROPOWER PROJECT
10. HYDROLOGICAL ANALYSIS FOR BROADLANDS PROJECT ...................... 10 - 1 10.1 Low Flow Runoff Analysis ................................................................................ 10 - 1 10.2 Flood Analysis ................................................................................................... 10 - 2 10.3 Estimation of Design Sediment Yield .................................................................. 10 - 3
11. GEOLOGY AND SEISMICITY ............................................................................. 11 - 1 11.1 Geology ............................................................................................................. 11 - 1
11.1.1 Topography and Geology ...................................................................... 11 - 1 11.1.2 Physical and Mechanical Properties ...................................................... 11 - 1 11.1.3 Geo-Technical Assessment .................................................................... 11 - 2 11.1.4 Concrete Aggregates ............................................................................. 11 - 3
11.2 Seismicity .......................................................................................................... 11 - 4
12. OPTIMUM DEVELOPMENT PLAN .................................................................... 12 - 1 12.1 Broadlands Hydropower Project ......................................................................... 12 - 1 12.2 Basic Layout ..................................................................................................... 12 - 1 12.3 Comparison Study of Optimal Scale ................................................................... 12 - 2 12.4 Transmission Line Route ................................................................................... 12 - 3
13. DESIGN OF CIVIL STRUCTURES AND ELECTRO-MECHANICAL EQUIPMENT ..................................... 13 - 1
13.1 Dam and Ancillary Structures ............................................................................ 13 - 1 13.2 Waterway and Powerhouse ................................................................................ 13 - 1 13.3 Electrical and Mechanical Equipment ................................................................. 13 - 2
14. CONSTRUCTION PLAN AND CONSTRUCTION COST ESTIMATE ............. 14 - 1 14.1 Outline of Construction Works ........................................................................... 14 - 1 14.2 Construction Cost Estimate ................................................................................ 14 - 1
15. ENVIRONMENTAL IMPACT ASSESSMENT ..................................................... 15 - 1 15.1 Procedure of Environmental Impact Assessment ................................................. 15 - 1 15.2 Environmental Impact assessment for
the Broadlands Hydropower Project .......................................... 15 - 1 15.3 Consultation with the Stakeholders ..................................................................... 15 - 1
16. ECONOMIC AND FINANCIAL EVALUATION .................................................. 16 - 1 16.1 Economic Evaluation of Project ......................................................................... 16 - 1 16.2 Financial Evaluation of Project .......................................................................... 16 - 2 16.3 Analysis of Project Finance ................................................................................ 16 - 4

The Study of Hydropower Optimization in Sri Lanka
Draft Final Reportiv
17. APPLICATION OF CDM TO THE BROADLANDS HYDROPOWER PROJECT ............................. 17 - 1
17.1 International Circumstances of CDM ................................................................. 17 - 1 17.1.1 Kyoto Mechanism ................................................................................ 17 - 1 17.1.2 Marrakech Accord ................................................................................ 17 - 1 17.1.3 Recent Trends of CDM ........................................................................ 17 - 2
17.2 Circumstances of CDM in Sri Lanka ................................................................. 17 - 2 17.3 PDD of the Broadlands Project .......................................................................... 17 - 3

CONCLUSION AND
RECOMMENDATION
The Study of Hydropower Optimization in Sri Lanka
Final ReportCR - 1
CONCLUSION AND RECOMMENDATION
CONCLUSION
The conclusions described hereunder are based on the results of the Study of Hydropower Optimization in Sri Lanka (hereinafter referred as “the Study”), conducted from March 2002 to February 2004.
Efficient Operation of the Existing Hydropower Stations
Optimization of Reservoir Operation Rules
Optimization studies on reservoir operation rules were conducted by using Dynamic Programming (DP) targeting maximization of energy production by power station(s) located on the downstream reach of the relevant reservoir(s). The optimized operation rules of reservoirs in the Mahaweli and Walawe River systems were made not only to maximize energy production but to fulfill requirements for irrigation.
(1) Mousakelle and Castlereigh Reservoirs in the Kelani River System
Simulations with the current operation rule and optimized operation rule did not show any significant difference in the total energy production by the Canyon, Wimalasurendra, Old Laxapana, New Laxapana and Polpitiya power stations.
(2) Victoria, Randenigala and Rantambe Reservoir in the Mahaweli River System
A simulation with the optimized operation rule showed a 3.6% (54GWh) increase in the total energy production by the Victoria, Randenigala and Rantambe power stations. This increase is equivalent to the energy production of a typical 12MW-class hydropower station.
(3) Samanalawewa Reservoir in the Walawe River System
A simulation with the optimized operation rule showed a 1.3% increase in the energy production of Samanalawewa power station.
Effective Daily Operation
The Polpitiya hydropower station is operated for long periods even in off-peak times at night because it has problems on start-and-stop operations. If these problems are eliminated, the energy produced with the same volume of water can be increased by intermittent operation with a high-efficiency discharge.
Calculations based on the operation records in 1995 and 2001 show energy production increases of about 8GWh and 12GWh, respectively, corresponding to 2% and 3% of the annual average energy production (409GWh) described in the Long-Term Generation Expansion Plan. Though annual
The Study of Hydropower Optimization in Sri Lanka
Final ReportCR - 2
precipitation changes year by year, an average annual increase of about 10GWh is expected over the long term.
An increase in energy production is also expected from the Old Laxapana hydropower station with intermittent operation in the off-peak time. Regarding the New Laxapana hydropower station, however, it will be difficult to operate it intermittently with a high-efficiency discharge because this power station plays the role of frequency control in the power system in the off-peak time. Therefore, it has to be operated continuously.
Frequency Control
At present, 10 units in the Victoria, New Laxapana, Samanalawewa and Kotmale power stations have a power system frequency control function. But no units except for two in Samanalawewa have the function of coordinating frequency control with one or more other units.
In the near future, a 300MW-class coal-fired thermal power unit (steam turbine) is expected to be put into operation. In general, the tolerance of a steam turbine for power system frequency fluctuation is less than those of gas turbines and diesel generators. When the frequency of the power system exceeds the limits, the 300MW unit should be disconnected from the power system to protect it. The impact on the power system caused by the sudden dropout of a power source of this size is significant and could cause a power outage of the whole power system. The current frequency control capacity of the power system is not sufficient to prevent this kind of accident.
Expansion of the Existing Hydropower Stations
New Laxapana Power Station and Polpitiya Power Station
Among the five existing hydropower stations in the Kelani River basin, three power stations, the Old Laxapana, New Laxapana and Polpitiya, have possibilities for expansion from the view point of their high plant factors.
However, the expansion of one of them has little flexibility of operation because the storage capacity of the Laxapana pond, which is located between the Old/New Laxapana power stations and the Polpitiya power station, is small. And the expansion of both the Old and New Laxapana power stations has the same problem. Therefore, possible expansions are that of the Old Laxapana and Polpitiya power stations, and the New Laxapana and Polpitiya power stations. Among these two expansion plans, the latter has larger output.
The installed capacities of the existing New Laxapana power station and the Polpitiya power station are 100MW and 75MW, respectively. Additional capacities of these power stations possible with expansion are 72.5MW and 23.2MW, respectively, and the combined EIRR and B/C are 10.9% and 1.09, respectively.
The Study of Hydropower Optimization in Sri Lanka
Final ReportCR - 3
Victoria Power Station
At the feasibility study stage of the existing Victoria power station, a study of its expansion was also made. According the study, the scale of expansion was 210MW (70MW×3) with construction
of all civil structures from intak(1) to powerhouse. (1) The intake for expansion was constructed with the existing one.
In the current study, a comparison study was conducted on expansions of 140MW (70MW×2) and 210MW (70MW×3). The study showed that the construction cost of a 140MW expansion, its
EIRR and B/C would be US$96.25 million, 10.1% and 1.01, respectively, and those of a 210MW expansion would be US$142.84 million, 10.9% and 1.08, respectively.
Samanalawewa Power Station
Construction of the Samanalawewa power station has been planned in two phases. The existing power station (60MW×2) was constructed in the first phase, and part of the civil works for
expansion was carried out in the first stage.
In the current study, a comparison study was conducted on expansions of 60MW and 120MW (60MW×3). The study showed that the construction cost of a 60MW expansion, its EIRR and B/C
would be US$35.43 million, 10.5% and 1.04, respectively, and those of a 120MW expansion would be US$62.20 million, 11.4% and 1.13, respectively.
Timing of Expansion
Shutdowns of the existing power stations for their expansions are inevitable. Therefore, it is not advisable to implement these expansion projects under the current tight electricity balance between demand and supply; it is necessary to determine appropriate timing.
Moreover, regarding the New Laxapana and Polpitiya power stations, problems such as water leakage from the headrace tunnel of the New Laxapana power station should be resolved prior to the expansion.
Broadlands Hydropower Project
The Broadlands Hydropower Project is located on the middle reach of the Kelani River, about 65km east of Colombo. The location is near the confluence of Maskeliya Oya and Kehelgamu Oya, which are the two main tributaries of the upstream Kelani River basin. There are five existing hydropower stations in the river basin, the total cacity of which amounts to 335MW.
In 1986, a feasibility study was conducted by the Central Engineering Consultancy Bureau (CECB) and a development plan of 40MW was drafted. This development plan has been listed in the Long-Term Generation Expansion Plan as a future development candidate.
The Study of Hydropower Optimization in Sri Lanka
Final ReportCR - 4
Optimum Development Plan
In the above-mentioned study by the CECB, comparison studies on seven layouts were conducted, and Alternative 7 was finally selected as the optimum development plan for the project. However, at the commencement of the Study, the CEB requested a review of Alternative 5 because this alternative has more flexibility in operation than Alternative 7.
After a preliminary study, Alternative 5 was rejected because it requires more than 80 families to relocate, and there was concern that a landslide on the left bank of the reservoir might be triggered by storage of water on the foot of the slope. Subsequent studies were carried out only on Alternative 7.
Regarding development scale, five cases from 20MW up to 40MW were compared from the viewpoint of economical efficiency. The study concluded that 35MW is the optimum
Following the above-mentioned preliminary study, comparison studies on development scale were conducted, and the scale of 35MW was concluded as the optimum. The project cost of the optimum development plan is estimated at US$89.34 million, and the EIRR and B/C of the optimum development plan are 10.3% and 1.02, respectively.
Design of Civil Structures and Electro-mechanical Equipment
The main dam, which is a 24m-high concrete gravity dam, is located just downstream from the Polpitiya power station, on the Mousakelle Oya. The full supply water level of the reservoir is EL.121.0m, and the maximum flood water level for the design flood (1,910m3/sec, 10,000-year return period flood) is EL.122.0m.
The main waterway consists of an intake tunnel (L = 150m), a cut-and-cover conduit (L = 720m), a main tunnel (L = 2,535m), a surge chamber, a steel penstock (Lave = 246m), and a tailrace channel (L = 353m).
A maximum flow of 20m3/sec is diverted from the Kehelgamu Oya to the reservoir by the weir and a diversion tunnel (L = 811m).
The main electro-mechanical equipment consists of two units of vertical-shaft Francis-type turbines and three-phase synchronous generators, and two main transformer units. The installed capacity of the power station is 35MW with the maximum discharge of 70m3/sec and the rated effective head of 56.9m.
The power station is connected with the Polpitiya-Kolonnawa transmission line by 132kV overhead transmission lines (two circuits).
Environmental Impact Assessment
The Study has revealed that no serious impacts on the natural/social environment are expected by implementation of the project. This is partly because it is a relatively small development project in

The Study of Hydropower Optimization in Sri Lanka
Final ReportCR - 5
a limited project area and the number of households to be relocated is small (19 households/shops), but conducting proper mitigation measures is a precondition regarding some items. Therefore, proper compensation for relocation, various mitigation measures, proper monitoring and management of the environment should carried out during both construction and operation stages.
The Study of Hydropower Optimization in Sri Lanka
Final ReportCR - 6
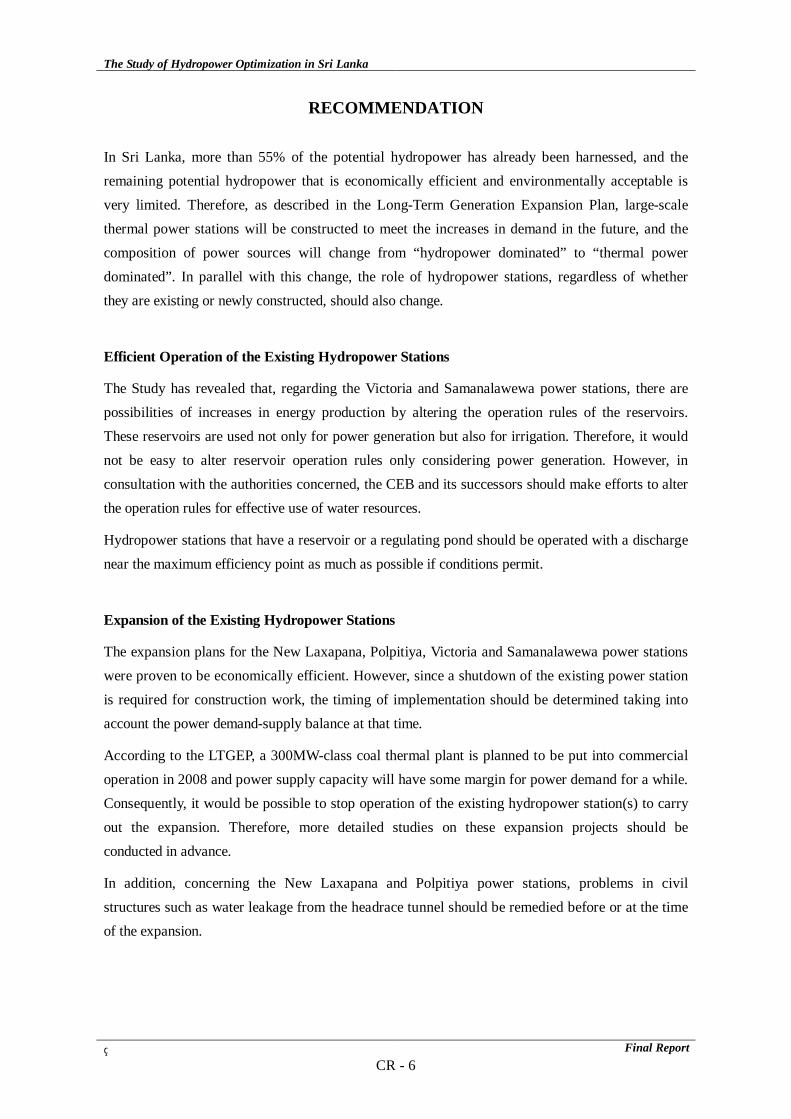
RECOMMENDATION
In Sri Lanka, more than 55% of the potential hydropower has already been harnessed, and the remaining potential hydropower that is economically efficient and environmentally acceptable is very limited. Therefore, as described in the Long-Term Generation Expansion Plan, large-scale thermal power stations will be constructed to meet the increases in demand in the future, and the composition of power sources will change from “hydropower dominated” to “thermal power dominated”. In parallel with this change, the role of hydropower stations, regardless of whether they are existing or newly constructed, should also change.
Efficient Operation of the Existing Hydropower Stations
The Study has revealed that, regarding the Victoria and Samanalawewa power stations, there are possibilities of increases in energy production by altering the operation rules of the reservoirs. These reservoirs are used not only for power generation but also for irrigation. Therefore, it would not be easy to alter reservoir operation rules only considering power generation. However, in consultation with the authorities concerned, the CEB and its successors should make efforts to alter the operation rules for effective use of water resources.
Hydropower stations that have a reservoir or a regulating pond should be operated with a discharge near the maximum efficiency point as much as possible if conditions permit.
Expansion of the Existing Hydropower Stations
The expansion plans for the New Laxapana, Polpitiya, Victoria and Samanalawewa power stations were proven to be economically efficient. However, since a shutdown of the existing power station is required for construction work, the timing of implementation should be determined taking into account the power demand-supply balance at that time.
According to the LTGEP, a 300MW-class coal thermal plant is planned to be put into commercial operation in 2008 and power supply capacity will have some margin for power demand for a while. Consequently, it would be possible to stop operation of the existing hydropower station(s) to carry out the expansion. Therefore, more detailed studies on these expansion projects should be conducted in advance.
In addition, concerning the New Laxapana and Polpitiya power stations, problems in civil structures such as water leakage from the headrace tunnel should be remedied before or at the time of the expansion.
The Study of Hydropower Optimization in Sri Lanka
Final ReportCR - 7
Broadlands Hydropower Project
The Study has revealed that the Broadlands Hydropower Project is economically efficient, and the impact on the environment by implementation of the project is not significant. In the situation that there are few remaining hydropower project sites that are economically and environmentally feasible, as mentioned above, it should be said this project is worth being developed. Therefore, following this feasibility study, detailed studies should be conducted taking into account the reduction of project cost and impact on the environment.
Other Issues
Issues regarding frequency control of the power system in the near future were pointed out in the Study. The CEB and its successors have to supply electricity to meet consumers’ demand not only considered quantitatively but also qualitatively. Therefore, detailed studies should be promptly conducted and steps should be taken for frequency stabilization.

Part I GENERAL
The Study of Hydropower Optimization in Sri Lanka
Final Repor1 - 1
1. INTRODUCTION
The Study of Hydropower Optimization in Sri Lanka (hereinafter referred to as the Study) was conducted under the Minutes of Meetings and the Scope of Work signed by the Department of External Resources (on behalf of the Ministry of Finance and Planning), the Ministry of Lands, Irrigation & Energy, the Ceylon Electricity Board (hereinafter referred to as the CEB) and the Japan International Cooperation Agency (hereinafter referred to as JICA) on November 16, 2001.
In Sri Lanka, no fossil fuel deposits have been found except a small amount of peat. Therefore, hydropower and biomass such as firewood are the main domestic energy sources in the country.
The economy of Sri Lanka has had an expanding tone since it escaped the stagnation of the 1980s. Electric power production has also increased in proportion to the growth of the economy.
However, the circumstances surrounding the development of new power projects have been worsening mainly because of environmental concerns. Moreover, combined with the effects of droughts, the power supply had not been able to meet the demand in the past few years, in the late 1990s and early 2000s, and scheduled power cuts had to be introduced. These circumstances, in which a stable power supply is not ensured, could cast a shadow on the economic growth of the county.
As of January 2003, the total capacity of generating facilities owned by the CEB was 1,615MW, which consisted of 1,135MW at 15 hydropower stations and 480MW at six thermal power stations. In addition to the CEB’s facilities, IPPs have, as of 2002, total hydropower capacity of 36.89MW and five thermal power stations with a total capacity of 172.5MW. As shown by these figures, the Sri Lankan power sector depends on hydropower, which accounts for 64% of the total generating capacity of the country.
According to the Long Term Generation Expansion Plan worked out in 2003, the growth of maximum power demand over the next 20 years are predicted to be 7 to 8% annually. However, expectations for future development of hydropower are low because of economic efficiency and environmental constraints. Thus, it is obvious that thermal power generation will necessarily take the major role in the long term.
Therefore, the role of hydropower in Sri Lanka should be altered from the power source for base demand to that for middle and/or peak demand.
In these circumstances, the Government of Sri Lanka in September 1999 requested the Government of Japan to conduct a feasibility study regarding the optimization of hydropower in Sri Lanka. In response to the request, the Government of Japan conducted a project formation study in December 2000 and a preliminary study in November 2001, and the Scope of Work was determined between the CEB and JICA on November 16 of the same year.
The Study of Hydropower Optimization in Sri Lanka
Final Repor1 - 2
JICA made a consultancy contract with Electric Power Development Co., Ltd. and Nippon Koei Co., Ltd. Subsequently, these companies set up a study team to carry out the study (hereinafter referred as the Study Team).
The purposes of the Study carried out under these circumstances are as follows.
The first purpose is to sort out the remaining potential hydropower, which consists of altering the operation of existing reservoirs and power stations, expanding existing facilities, and developing new hydropower projects.
The second purpose is to conduct a feasibility study on the Broadlands Hydropower Project, which has shown promise for development in previous studies. In the feasibility study, an assessment of impacts on the natural and social environment will be also conducted, taking into consideration the releasei of its results to the public.
In addition, the effects of the on-going power sector reform on future hydropower development will be analyzed, and measures to support the reform will be suggested.
The Study Team commenced the study in March 2002, and completed it in February 2004.
During this period, the Study Team carried out collection and analysis of basic data on hydrology, the environment, economy and finance, the power sector, etc.; it reviewed previous reports, topographical surveys, geological investigations and environmental studies. Based on these, the Study Team conducted a study on the effective operation of existing reservoirs and hydropower stations, a study on the possibility of expanding existing hydropower stations, and a feasibility study of the Broadlands Hydropower Project. This feasibility study includes the establishment of the optimum development plan, the conceptual design of the main facilities, an estimation of the project cost, the establishment of a construction plan, economic and financial analysis, an environmental impact assessment, and so on.

Fig. 1.1 Flow of the Study of Hydropower Optimization in Sri LankaNo. of Month 1 2 3 4 5 6 7 8 9 10 11 12 13 14 15 16 17 18 19 20 21 22 23 24
Year 2002 2003 2004Calendar Month Mar Apr May Jun Jul Aug Sep Oct Nov Dec Jan Feb Mar Apr May Jun Jul Aug Sep Oct Nov Dec Jan Feb
Stage of Study
Preparatory Work 1st Study Period in Japan 2nd Study Period in Japan 3rd Study Period in Japan
Works in Japan
1st Study Period in Sri Lanka 2nd Study Period in Sri Lanka (1st stage) 2nd Study Period in Sri Lanka (2nd stage) 3rd Study Period in Sri Lanka 4th Study Period in Sri Lanka 5th Study Period in Sri Lanka
(1st Stage) (2nd Stage)
Works in Sri Lanka
Topographical, Geological (1st stage), and Natural Environmental Survey Geological (2nd stage) and Social Environmental Survey
Inception Report Progress Report Interim Report Draft Final Report Final Report
1 2 3 4 5 6 7 8 9 10 11 12 13 14 15 16 17 18 19 20 21 22 23 24Assignment 2002 2003 2004
Mar Apr May Jun Jul Aug Sep Oct Nov Dec Jan Feb Mar Apr May Jun Jul Aug Sep Oct Nov Dec Jan Feb
Mimura
Ida
Nakahata
Miyazato
Momose
Inaba
Itoh
Uramoto
Tashino
Ooshima
MasudaOperation Coordination
CDM
Team LeaderHydropower Planning
Power Sector Restructuring
Power Development PlanHydropower Planning
Hydropower PlanningHydrological Analysis
Geology
Power Facilities
Power System Analysis
Environmental ImpactAssessment
Site Survey
Economic and FinancialAnalysis
Submission of Reportto CEB
TechnicalTransfer
In Sri LankaIn Japan
Preliminary Investigation Stage
1) Preparation of Progress Report 1) Preparation of Interim Report 1) Finalization of EIA for the Broadlands Hydropower Project2) Comprehensive Evaluation3) Preparation of Draft Final Report
1) Presentation of Inception Report2) Review on Data, Information and Reports3) Research of Power Sector Situation4) Review of Progress of Power Sector Reform5) General Site Reconnaissance6) Examination of Existing Topographical and Geological Data7) Geological Reconnaissance of the Broadlands Project Ssite8) Hydrological analysis9) Review of Ooperation Rule of the Existing Reservoirs10) Study on Expansion Project11) Study of the Layout of Broadlands Project12) Environmental Study13) Preparation of Subcontracts for Site Survey
1) Conclusion of Subcontracts for Site Surveys in 20022) Topographical and Geological Survey3) Environmental Survey4) Advice for Information Disclosure
1) Conclusion of Subcontracts for Site Survey in 20032) Collection of Additional Data3) Consultation with authorities concerned with EIA4) Assistance to CEB in Power Sector Reform5) Data Collection on the CDM in Sri Lanka
1) Presentation of Interim Report2) Additional Environmental Survey (if necessary)3) Expansion Plan of the Existing Hydropower Plant (structural design, cost estimate)4) Feasibility Study of the Broadlands Hydropower Project5) Economical and Financial Analysis6) Optimum Development Plan of Hydropower7) Preparing Mitigation and Monitoring Plan8) Acceptance Inspection of the Outcome of the Site Survey9) Assistance to CEB in Power Sector Reform10) Collection of Additional Data and Preparation of Project Design Documents for CDM
1) Presentation of Draft Final Report2) Seminar for Technology Transfer
Detailed Investigation Stage
Design and Comprehensive Evaluation Stage
1) Presentation of Progress Report2) Acceptance Inspection of the Outcome of the Site Surveys3) Power Sector Reform
1) Preparation of Inception Report
The Study of Hydropower Optimization in Sri Lanka
Final Report2 - 1
2. GENERAL FEATURES OF SRI LANKA
2.1 Topography
The Democratic Socialist Republic of Sri Lanka (hereinafter referred as “Sri Lanka”) is an island country in the Indian Ocean, located to the south of the Indian subcontinent. The main island lies between 5°55 ́and 9°55 ́north latitude and between 79°42 ́and 81°52 ́east longitude. The area of the country is 67,095 km2 including internal waters of 1,170 km2.
The administrative capital was relocated from Colombo to Sri Jayewardenepura in 1984, on the outskirts of Colombo. However, in practice, capital city functions remain in Colombo.
The topographic features of Sri Lanka are categorized in three zones on the basis of elevation: a central mountainous mass called the Central Highlands, the plains, and the coastal belt.
The Central Highlands area is in the south-central part of Sri Lanka. The core of this area is a high ridge, running north-south for approximately 65 km. This area includes some of Sri Lanka’s highest mountains. Mt. Pidurutalagala is the highest at 2,524 m.
Most of the island’s surface consists of plains between 30 and 200 m above sea-level. In the southwest, ridges and valleys rise gradually to merge with the Central Highlands, giving a dissected appearance to the plain. In the southeast, the transition from the plain to the Central Highlands is abrupt, and the mountains appear to rise like a wall. In the east and the north, the plain is flat, dissected by long, narrow ridges running from the Central Highlands.
A coastal belt about 30 m above sea-level surrounds the island. Much of the coast consists of sandy beaches indented by coastal lagoons. In the northeast and the southwest, rocky cliffs, bays, and offshore islands can be found: these conditions have created natural harbors at Trincomalee on the northeast coast and Galle on the southwest coast.
The rivers of Sri Lanka radiate from the Central Highlands to the sea. The longest river is the Mahaweli Ganga (335 km), and the Aruvi Aru (164 km) follows.
2.2 Climate
The climate of Sri Lanka is categorized as tropical as a whole. The annual average temperature in Colombo is about 27°C. At higher elevations, however, it is quite cool, and the annual average temperature goes down to about 15°C in Nuwara Eliya at about 1,800 m above sea-level.
The rainfall pattern is influenced by the monsoon winds of the Indian Ocean and Bay of Bengal and is marked by four seasons. The first season is from mid-May to October, when winds originate in the southwest, bringing moisture from the Indian Ocean. These winds unload heavy rains on the mountain slopes and the southwestern sector of the island. However, the leeward slopes in the east and northeast receive little rain. The second season occurs in October and November, the
The Study of Hydropower Optimization in Sri Lanka
Final Report2 - 2
intermonsoonal season. During this season, periodic squalls occur and sometimes tropical cyclones bring overcast skies and rains to the southwest, northeast and eastern parts of the island. During the third season, December to March, monsoon winds come from the northeast, bringing moisture from the Bay of Bengal, unloading heavy rains on the northwestern slopes of the mountains. Another intermonsoonal period occurs from March to mid-May.
2.3 Government
The president, who is elected directly for a six-year term, serves as the head of state. In Sri Lanka, the president also serves as the head of government and appoints cabinet ministers in consultation with the prime minister. As of the end of 2001, there were 25 ministries of cabinet rank; the CEB belongs to the Ministry of Power and Energy.
The legislative branch of the government is unicameral and the Parliament consists of 225 seats. The members of Parliament are elected by popular vote on the basis of a modified proportional representation system and serve six-year terms.
The administrative divisions of the country consist of nine provinces, and 25 districts under these provinces. The smallest administrative unit is the Assistant Government Agent of Divisions (AGA Division), and there are 247 AGA Divisions in the country. The Broadlands Hydropower Project is located on the boundary between Nuwara Eliya District in Central Province and Ratnapura District in Sabaragamuwa Province.
The Study of Hydropower Optimization in Sri Lanka
Final Report3 - 1
3. SOCIO-ECONOMY
3.1 Population
3.1.1 Census Population
The population of 14.8 million in 1981 increased from 12.7 million in 1971, the average annual growth rate was calculated at 1.58% for 10 years between the two censuses. The total population in the 2001 census was estimated at 18.7 million, so the average growth rate was calculated at 1.16% per annum during 20 years between 1981 and 2001. However, this family size was figured out without two provinces of Northern and Eastern. Population density was around 333 persons per km2 in 2001 as shown in Table 3.1.
3.1.2 Labor Force
A labor force was amounted as 7.0 million persons as of 2000, of which around 93 % was actually employed. Thus, an unemployed rate was 7 % in the same year. Since the unemployment rate was more than 12% in 1995, the rate in labor market has been improved by around 5% for five year.
Among the labor market, the agriculture sector absorbed 37% of the overall employed workforce. Following it, the personal services sector absorbed 19%, the manufacturing sector had 15%, and the trade and hotel sector, 13%.
3.1.3 Ethnic Group
Sri Lanka is essentially composed of three ethnic groups, i.e., the Sinhalese (74%), Tamil (19%) and Muslim, they make up more than 99% of the countries population.
3.2 Macro Economic Features
3.2.1 National Accounts
The gross domestic product (GDP) in Sri Lanka was Rs.1,253 million at current factor cost prices in 2001. Among major economic sectors, “wholesale & retail trade, restaurant & hotels” sector recorded the largest gross value added (GVA) of Rs.275 million, the highest contribution to the national economy, accounting for 22% of GDP.
An economic sector of “agriculture, livestock & fisheries” accounted for Rs.243 million or 19% of GDP, the second position in GDP contribution. Following them, the manufacturing sector occupied the third position, accounting for Rs.198 million or 16% of GDP.
In 2001, the national economy recorded the worst performance for recent ten years, with real negative GDP growth of -5.3%. On this account, GDP has grown at a low annual growth rate of 3.9% on average for the recent six years.
The Study of Hydropower Optimization in Sri Lanka
Final Report3 - 2
GDP per capita was Rs.67,000, equivalent to around US$750 applying the US Dollar exchange rate of Rs.89.36 as an annual average in 2001.
3.2.2 Government Finance
In 1999 and 2000, the Government finances of Sri Lanka amounted to Rs.195.9 billion and Rs.211.3 billion in revenue and Rs.279.2 billion and Rs.335.8 billion in expenditure. Thus, the balance of these fiscal operations was resulted in deficit as -83.3 billion in 1999 and -124.5 billion in 2000. These deficits were financed by borrowings and grants.
In 2000, the government invested Rs.13.3 billion for the energy and water supply sub-sector as a part of economic services in the national economy and Rs.0.5 billion for the same sub-sector as supporting expenses. The total capital and current expenses for the sub-sector accounted for Rs.13.8 billion or 4.1% of the total fiscal expenditure in 2000.
The debt services such as principal repayment and interest payment of loans amounted to Rs.85.6 billion in 2000, it accounted for 25% of the national expenditure in the same year.
3.2.3 External Debt and Outstanding
(1) Foreign Assistance
Gross receipts of official development assistance (ODA) from industrialized countries, member nations of OECD, and multilateral agencies aggregated to US$2.31 billion in total for the recent five years and averaged US$0.46 billion per year between 1996 and 2000. The receipts fluctuated year by year, as shown in the table below.
An annual receipt of ODA accounted for approximately 1.6% of GDP in 2000. The average annual receipt for the recent five years accounted for 2.8% of GDP. The percentage of this rate was more than 3% until 1998, but it gradually decreased to less than 2% to 2000. On the other hand, the average annual receipt accounted for around 11% of an annual expenditure of the central government for the same period.
(Unit: US$ Billion) Item 1996 1997 1998 1999 2000
Receipt of ODA 0.49 0.53 0.59 0.40 0.29 GDP 15.14 16.16 16.71 16.93 18.36 Expenditure of Central Government 3.96 3.99 4.15 3.97 4.43 Share of ODA (%) To GDP 3.2 3.3 3.5 2.4 1.6 To Expenditure of C. Gov. 12.3 13.4 14.2 10.2 6.7
(2) External Debt and Outstanding
In 2000, the total external debt was US$8.20 billion as shown in the table below, accounting for 45% of GDP. Since the outstanding of long-term debt was US$8.59 billion or 51% of
The Study of Hydropower Optimization in Sri Lanka
Final Report3 - 3
GDP in 1999, its conditions were considerably improved in 2000. The total debt-service in 2000 was US$0.74 billion.
(Unit: US$ billion) Item 1996 1997 1998 1999 2000
Debt Outstanding of Long-Term Debt 7.16 7.07 8.04 8.59 8.20 Total Debt Service 0.49 0.53 0.56 0.67 0.74 Principal Repayment 0.32 0.36 0.39 0.48 0.52 Interest Payment 0.17 0.17 0.17 0.19 0.22 Exports of Goods and Services 5.87 6.67 6.94 6.78 7.67 Debt Service Ratio (DSR)*1 8.4 8.0 8.0 10.0 9.6
Note: *1 A ratio of total debt service over exports of goods and services.
The debt-service ratio (DSR), a kind of country risk assessment factors, has been at almost the same condition, i.e., from 8.0% in 1997 to 10.0% in 1999. Thus, DSR has kept a sound position in terms of external debt problem, because those were always lower than the level of 20%, the critical level of DSR.
3.2.4 Price Indices and Exchange Rates
(1) Price Indices
The consumer price index (CPI) increased to 329 (base: 1990=100) in December 2002. Then, the CPI increased 329% during the past 12 years. Thus, an annual inflation rate was calculated at 10.4% on average. During the same period, the maximum inflation rate was 15.8% in 1996 and the minimum one was 6.2% in 2000.
(2) Foreign Exchange Rates
The value of Rupee dropped down from Rs.40.27 per US$ in 1990 to Rs.97.16 in June 2003.
3.3 Projection of Socio-Economic Structures
3.3.1 National Development Plans
The government has announced its national economic development policy in “Six Year Development Programme, Macro Framework & Sector Review”. In the program, the medium-term macroeconomic prospect in the country is projected as a national target. GDP is projected in the program as one of macroeconomic indicators. The Central Bank of Sri Lanka (CBSR) also indicates the GDP projection in its annual report, the projected figures of which are the same as in the program. The projection is summarized in the table below.
The Study of Hydropower Optimization in Sri Lanka
Final Report3 - 4
2001 Projection Item Provisional 2002 2003 2004 2005 2006 GDP (%) -1.4 3.7 5.5 6.0 6.5 6.5 GDP (Rs. Billion)*1 1,252.8 1,299.2 1,370.6 1,452.8 1,547.3 1,647.9 Population (Million)*2 18.7 18.9 19.0 19.2 19.4 19.6 GDP Per Capita *3 67.0 68.7 72.1 75.7 79.8 84.1 Growth of GDP/Capita -2.2 2.6 4.9 4.9 5.4 5.4 Note: *1 GDP at 2001 constant factor cost prices *2 Projected in “Annual Report 2001” by Central Bank
of Sri Lanka *3 Unit in Rs.1000
3.3.2 Population Projection
In 2001, the 13th census of population and housing was conducted after an interval of 20 years. The census enumeration is still in course of preparation as of July 2002. According to the preliminary estimate, the total census population was estimated to be 18.7 million and an average growth rate for the country was calculated at 1.13% per annum. On the other hand, the 2031’s populations were estimated as follows: 19.0 million under the standard scenario, 19.1 million under the high scenario and 18.7 million.
The Study of Hydropower Optimization in Sri Lanka
Final Report4 - 1
4. PRESENT SITUATION OF POWER SECTOR IN SRI LANKA
4.1 History and Formation of Power Sector
(1) Ministry of Power and Energy (MPE)
The MPE is the main government body handling power and energy policy in Sri Lanka.
(2) Ceylon Electricity Board (CEB)
The CEB is a state-owned vertically-integrated organization handling generation, transmission and distribution functions. There are seven divisions: the generation, transmission, distribution and operation, distribution development, commercial, human resources, and finance manager divisions, under the Chairman and General Manager and other board members. Though the CEB has been established as an independent organ, executives are to be assigned by the Ministry of Power and Energy, and approval by the Government is required for investments and setting tariffs. Unbundling of the CEB and Lanka Electricity Company Limited (LECO) into several independent companies is now under way.
(3) Energy Supply Committee
The Energy Supply Committee (ESC) under the Ministry of Power and Energy was set up in March 2002, based on the Energy Supply Act, No. 2 of 2002, with a two-year mandate to find immediate solutions to the existing problems of the energy sector.
(4) Board of Investment (BOI)
The Board of Investment (BOI) was originally established in 1978, and is structured to function as a central facilitation point for foreign and local private investors.
4.2 Power Demand and Supply Balance
In 2002, the total generated electricity in Sri Lanka at the generating end amounted to 6,810GWh (excluding captive power). Electricity sales amounted to 5,502GWh and the remaining electricity was station use and losses at transmission and distribution lines and so on.
In 1996, the maximum peak demand (968.4MW) in the country decreased compared to that in the previous year due to the effect of drought, but since then it has been growing steadily. The recorded maximum demand in 2001 was 1,445MW. The average annual growth rate over the five years prior to 2001 was about 10%. Then, rotating power cuts were conducted due to insufficient power supply capability in 2001 and in 2002.
The Study of Hydropower Optimization in Sri Lanka
Final Report4 - 2
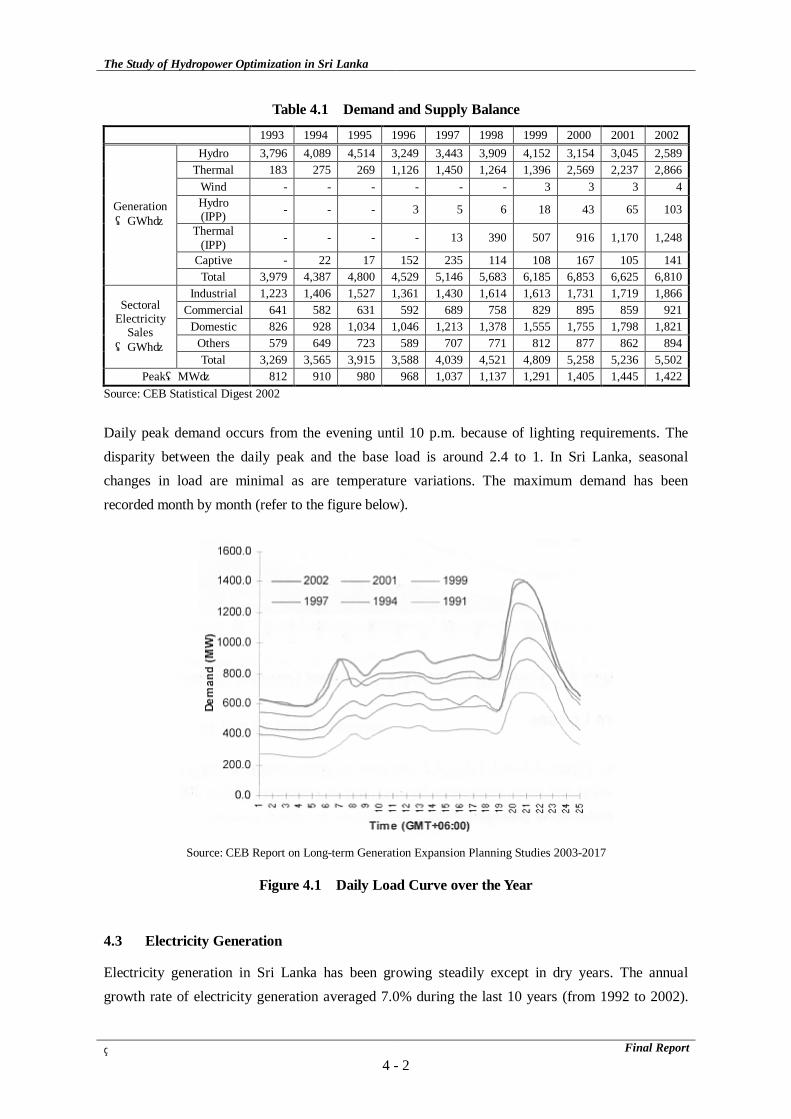
Table 4.1 Demand and Supply Balance
1993 1994 1995 1996 1997 1998 1999 2000 2001 2002Hydro 3,796 4,089 4,514 3,249 3,443 3,909 4,152 3,154 3,045 2,589
Thermal 183 275 269 1,126 1,450 1,264 1,396 2,569 2,237 2,866Wind - - - - - - 3 3 3 4Hydro (IPP) - - - 3 5 6 18 43 65 103
Thermal (IPP) - - - - 13 390 507 916 1,170 1,248
Captive - 22 17 152 235 114 108 167 105 141
Generation (GWh)
Total 3,979 4,387 4,800 4,529 5,146 5,683 6,185 6,853 6,625 6,810Industrial 1,223 1,406 1,527 1,361 1,430 1,614 1,613 1,731 1,719 1,866
Commercial 641 582 631 592 689 758 829 895 859 921Domestic 826 928 1,034 1,046 1,213 1,378 1,555 1,755 1,798 1,821
Others 579 649 723 589 707 771 812 877 862 894
Sectoral Electricity
Sales (GWh)
Total 3,269 3,565 3,915 3,588 4,039 4,521 4,809 5,258 5,236 5,502Peak(MW) 812 910 980 968 1,037 1,137 1,291 1,405 1,445 1,422
Source: CEB Statistical Digest 2002 Daily peak demand occurs from the evening until 10 p.m. because of lighting requirements. The disparity between the daily peak and the base load is around 2.4 to 1. In Sri Lanka, seasonal changes in load are minimal as are temperature variations. The maximum demand has been recorded month by month (refer to the figure below).
Figure 4.1 Daily Load Curve over the Year
4.3 Electricity Generation
Electricity generation in Sri Lanka has been growing steadily except in dry years. The annual growth rate of electricity generation averaged 7.0% during the last 10 years (from 1992 to 2002).
Source: CEB Report on Long-term Generation Expansion Planning Studies 2003-2017
The Study of Hydropower Optimization in Sri Lanka
Final Report4 - 3
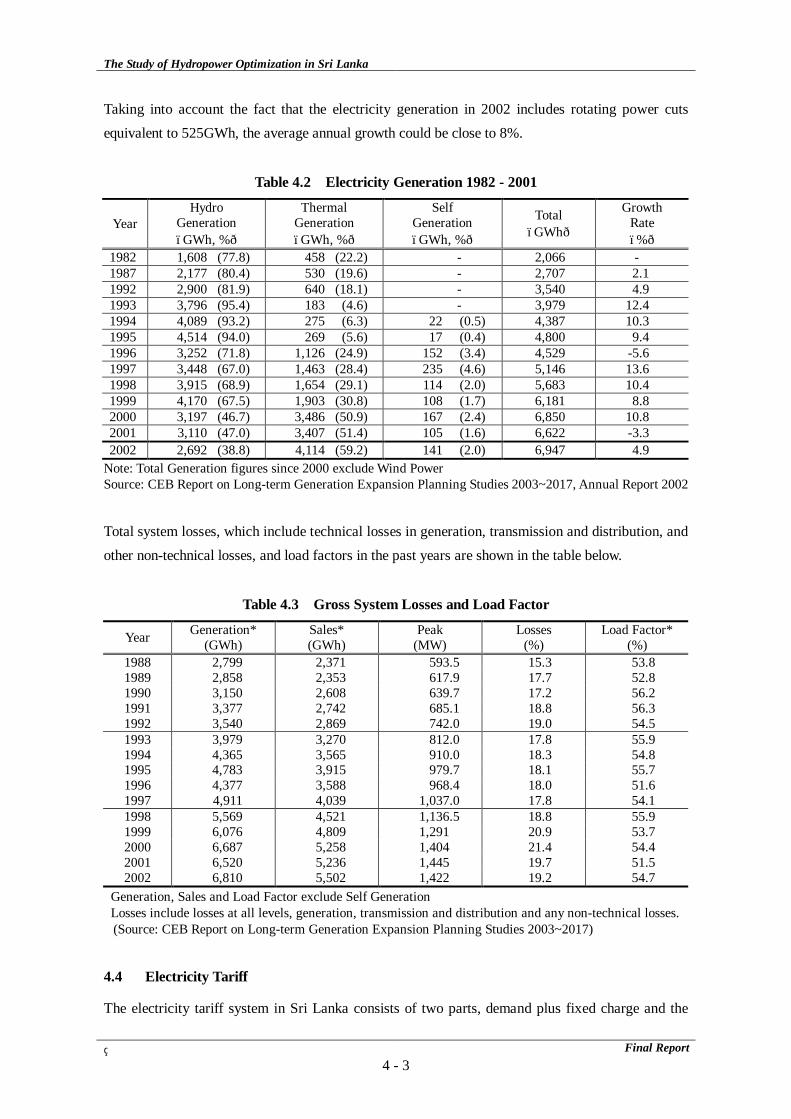
Taking into account the fact that the electricity generation in 2002 includes rotating power cuts equivalent to 525GWh, the average annual growth could be close to 8%.
Table 4.2 Electricity Generation 1982 - 2001
Year Hydro
Generation (GWh, %)
Thermal Generation (GWh, %)
Self Generation (GWh, %)
Total (GWh)
Growth Rate (%)
1982 1,608 (77.8) 458 (22.2) - 2,066 - 1987 2,177 (80.4) 530 (19.6) - 2,707 2.1 1992 2,900 (81.9) 640 (18.1) - 3,540 4.9 1993 3,796 (95.4) 183 (4.6) - 3,979 12.4 1994 4,089 (93.2) 275 (6.3) 22 (0.5) 4,387 10.3 1995 4,514 (94.0) 269 (5.6) 17 (0.4) 4,800 9.4 1996 3,252 (71.8) 1,126 (24.9) 152 (3.4) 4,529 -5.6 1997 3,448 (67.0) 1,463 (28.4) 235 (4.6) 5,146 13.6 1998 3,915 (68.9) 1,654 (29.1) 114 (2.0) 5,683 10.4 1999 4,170 (67.5) 1,903 (30.8) 108 (1.7) 6,181 8.8 2000 3,197 (46.7) 3,486 (50.9) 167 (2.4) 6,850 10.8 2001 3,110 (47.0) 3,407 (51.4) 105 (1.6) 6,622 -3.3 2002 2,692 (38.8) 4,114 (59.2) 141 (2.0) 6,947 4.9
Note: Total Generation figures since 2000 exclude Wind Power Source: CEB Report on Long-term Generation Expansion Planning Studies 2003~2017, Annual Report 2002
Total system losses, which include technical losses in generation, transmission and distribution, and other non-technical losses, and load factors in the past years are shown in the table below.
Table 4.3 Gross System Losses and Load Factor
Year Generation* (GWh)
Sales* (GWh)
Peak (MW)
Losses (%)
Load Factor* (%)
1988 2,799 2,371 593.5 15.3 53.8 1989 2,858 2,353 617.9 17.7 52.8 1990 3,150 2,608 639.7 17.2 56.2 1991 3,377 2,742 685.1 18.8 56.3 1992 3,540 2,869 742.0 19.0 54.5 1993 3,979 3,270 812.0 17.8 55.9 1994 4,365 3,565 910.0 18.3 54.8 1995 4,783 3,915 979.7 18.1 55.7 1996 4,377 3,588 968.4 18.0 51.6 1997 4,911 4,039 1,037.0 17.8 54.1 1998 5,569 4,521 1,136.5 18.8 55.9 1999 6,076 4,809 1,291 20.9 53.7 2000 6,687 5,258 1,404 21.4 54.4 2001 6,520 5,236 1,445 19.7 51.5 2002 6,810 5,502 1,422 19.2 54.7
Generation, Sales and Load Factor exclude Self Generation Losses include losses at all levels, generation, transmission and distribution and any non-technical losses. (Source: CEB Report on Long-term Generation Expansion Planning Studies 2003~2017)
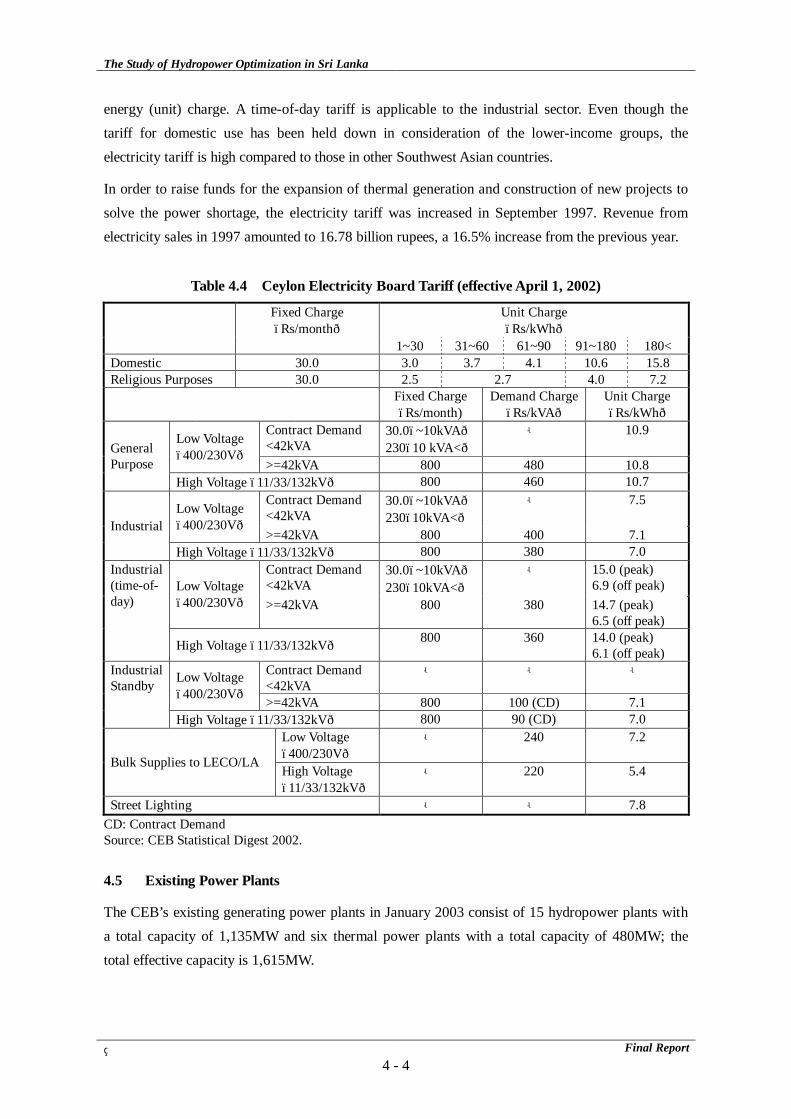
4.4 Electricity Tariff
The electricity tariff system in Sri Lanka consists of two parts, demand plus fixed charge and the
The Study of Hydropower Optimization in Sri Lanka
Final Report4 - 4
energy (unit) charge. A time-of-day tariff is applicable to the industrial sector. Even though the tariff for domestic use has been held down in consideration of the lower-income groups, the electricity tariff is high compared to those in other Southwest Asian countries.
In order to raise funds for the expansion of thermal generation and construction of new projects to solve the power shortage, the electricity tariff was increased in September 1997. Revenue from electricity sales in 1997 amounted to 16.78 billion rupees, a 16.5% increase from the previous year.
Table 4.4 Ceylon Electricity Board Tariff (effective April 1, 2002)
Fixed Charge (Rs/month)
Unit Charge (Rs/kWh)
1~30 31~60 61~90 91~180 180< Domestic 30.0 3.0 3.7 4.1 10.6 15.8 Religious Purposes 30.0 2.5 2.7 4.0 7.2 Fixed Charge
(Rs/month) Demand Charge (Rs/kVA)
Unit Charge (Rs/kWh)
Contract Demand <42kVA
30.0(~10kVA) 230(10 kVA<)
- 10.9 Low Voltage (400/230V)
>=42kVA 800 480 10.8 General Purpose
High Voltage (11/33/132kV) 800 460 10.7 Contract Demand <42kVA
30.0(~10kVA) 230(10kVA<)
- 7.5 Low Voltage (400/230V)
>=42kVA 800 400 7.1 Industrial
High Voltage (11/33/132kV) 800 380 7.0 Contract Demand <42kVA
30.0(~10kVA) 230(10kVA<)
- 15.0 (peak) 6.9 (off peak) Low Voltage
(400/230V) >=42kVA 800 380 14.7 (peak) 6.5 (off peak)
Industrial (time-of-day)
High Voltage (11/33/132kV) 800 360 14.0 (peak) 6.1 (off peak)
Contract Demand <42kVA
- - - Low Voltage (400/230V) >=42kVA 800 100 (CD) 7.1
Industrial Standby
High Voltage (11/33/132kV) 800 90 (CD) 7.0 Low Voltage (400/230V)
- 240 7.2
Bulk Supplies to LECO/LA High Voltage (11/33/132kV)
- 220 5.4
Street Lighting - - 7.8 CD: Contract Demand Source: CEB Statistical Digest 2002.
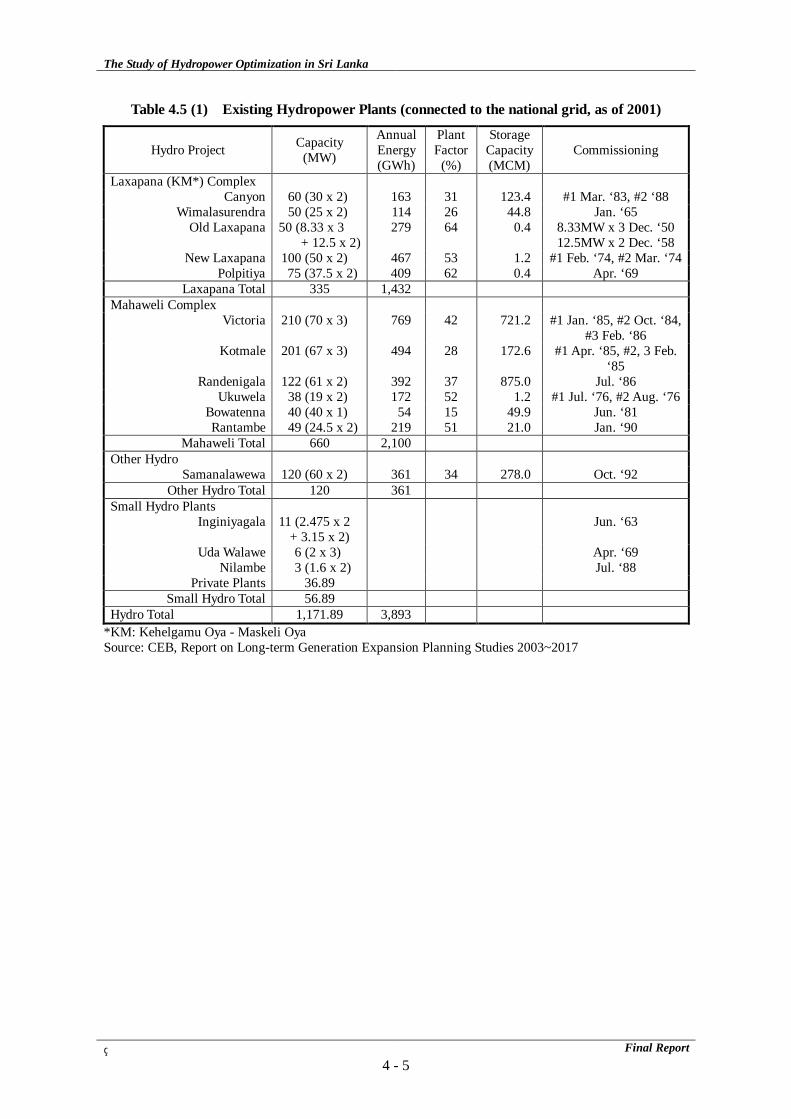
4.5 Existing Power Plants
The CEB’s existing generating power plants in January 2003 consist of 15 hydropower plants with a total capacity of 1,135MW and six thermal power plants with a total capacity of 480MW; the total effective capacity is 1,615MW.
The Study of Hydropower Optimization in Sri Lanka
Final Report4 - 5
Table 4.5 (1) Existing Hydropower Plants (connected to the national grid, as of 2001)
Hydro Project Capacity (MW)
Annual Energy(GWh)
PlantFactor
(%)
Storage Capacity(MCM)
Commissioning
Laxapana (KM*) Complex Canyon 60 (30 x 2) 163 31 123.4 #1 Mar. ‘83, #2 ‘88
Wimalasurendra 50 (25 x 2) 114 26 44.8 Jan. ‘65 Old Laxapana 50 (8.33 x 3
+ 12.5 x 2)279 64 0.4 8.33MW x 3 Dec. ‘50
12.5MW x 2 Dec. ‘58 New Laxapana 100 (50 x 2) 467 53 1.2 #1 Feb. ‘74, #2 Mar. ‘74
Polpitiya 75 (37.5 x 2) 409 62 0.4 Apr. ‘69 Laxapana Total 335 1,432
Mahaweli Complex Victoria 210 (70 x 3) 769 42 721.2 #1 Jan. ‘85, #2 Oct. ‘84,
#3 Feb. ‘86 Kotmale 201 (67 x 3) 494 28 172.6 #1 Apr. ‘85, #2, 3 Feb.
‘85 Randenigala 122 (61 x 2) 392 37 875.0 Jul. ‘86
Ukuwela 38 (19 x 2) 172 52 1.2 #1 Jul. ‘76, #2 Aug. ‘76Bowatenna 40 (40 x 1) 54 15 49.9 Jun. ‘81 Rantambe 49 (24.5 x 2) 219 51 21.0 Jan. ‘90
Mahaweli Total 660 2,100 Other Hydro
Samanalawewa 120 (60 x 2) 361 34 278.0 Oct. ‘92 Other Hydro Total 120 361
Small Hydro Plants Inginiyagala 11 (2.475 x 2
+ 3.15 x 2) Jun. ‘63
Uda Walawe 6 (2 x 3) Apr. ‘69 Nilambe 3 (1.6 x 2) Jul. ‘88
Private Plants 36.89 Small Hydro Total 56.89
Hydro Total 1,171.89 3,893 *KM: Kehelgamu Oya - Maskeli Oya Source: CEB, Report on Long-term Generation Expansion Planning Studies 2003~2017
The Study of Hydropower Optimization in Sri Lanka
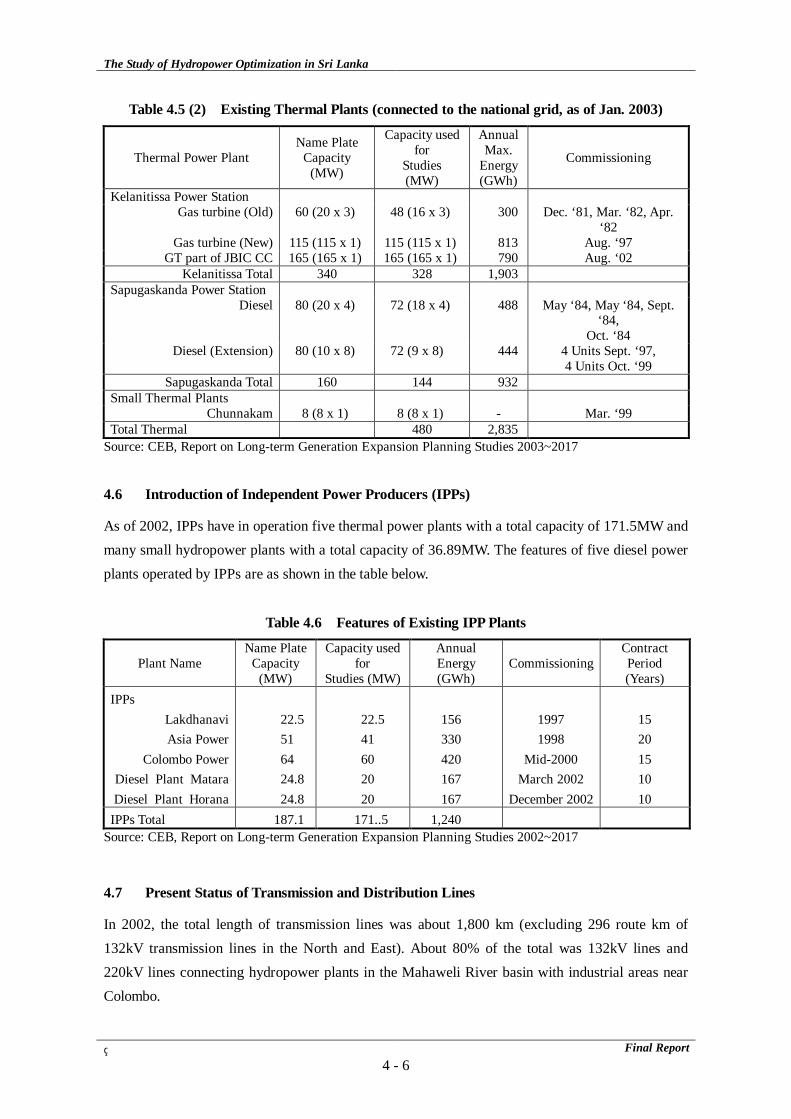
Final Report4 - 6
Table 4.5 (2) Existing Thermal Plants (connected to the national grid, as of Jan. 2003)
Thermal Power Plant Name Plate
Capacity (MW)
Capacity used for
Studies (MW)
AnnualMax.
Energy(GWh)
Commissioning
Kelanitissa Power Station Gas turbine (Old) 60 (20 x 3) 48 (16 x 3) 300 Dec. ‘81, Mar. ‘82, Apr.
‘82 Gas turbine (New) 115 (115 x 1) 115 (115 x 1) 813 Aug. ‘97
GT part of JBIC CC 165 (165 x 1) 165 (165 x 1) 790 Aug. ‘02 Kelanitissa Total 340 328 1,903
Sapugaskanda Power Station Diesel
80 (20 x 4)
72 (18 x 4)
488 May ‘84, May ‘84, Sept.
‘84, Oct. ‘84
Diesel (Extension) 80 (10 x 8) 72 (9 x 8) 444 4 Units Sept. ‘97, 4 Units Oct. ‘99
Sapugaskanda Total 160 144 932 Small Thermal Plants
Chunnakam 8 (8 x 1) 8 (8 x 1) - Mar. ‘99 Total Thermal 480 2,835
Source: CEB, Report on Long-term Generation Expansion Planning Studies 2003~2017
4.6 Introduction of Independent Power Producers (IPPs)
As of 2002, IPPs have in operation five thermal power plants with a total capacity of 171.5MW and many small hydropower plants with a total capacity of 36.89MW. The features of five diesel power plants operated by IPPs are as shown in the table below.
Table 4.6 Features of Existing IPP Plants
Plant Name Name Plate
Capacity (MW)
Capacity used for
Studies (MW)
Annual Energy (GWh)
Commissioning Contract Period (Years)
IPPs Lakdhanavi Asia Power
Colombo Power Diesel Plant Matara Diesel Plant Horana
22.5 51 64 24.8 24.8
22.5 41 60 20 20
156 330 420 167 167
1997 1998
Mid-2000 March 2002
December 2002
15 20 15 10 10
IPPs Total 187.1 171..5 1,240 Source: CEB, Report on Long-term Generation Expansion Planning Studies 2002~2017
4.7 Present Status of Transmission and Distribution Lines
In 2002, the total length of transmission lines was about 1,800 km (excluding 296 route km of 132kV transmission lines in the North and East). About 80% of the total was 132kV lines and 220kV lines connecting hydropower plants in the Mahaweli River basin with industrial areas near Colombo.
The Study of Hydropower Optimization in Sri Lanka
Final Report4 - 7
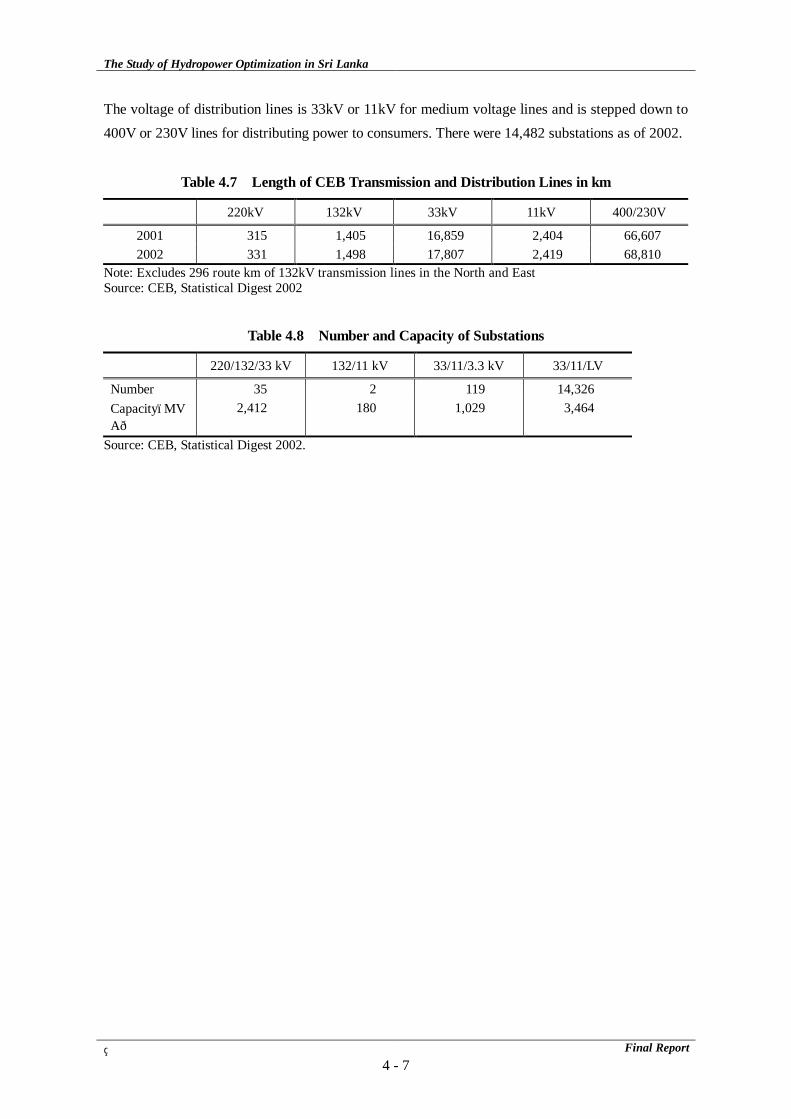
The voltage of distribution lines is 33kV or 11kV for medium voltage lines and is stepped down to 400V or 230V lines for distributing power to consumers. There were 14,482 substations as of 2002.
Table 4.7 Length of CEB Transmission and Distribution Lines in km
220kV 132kV 33kV 11kV 400/230V
2001 315 1,405 16,859 2,404 66,607 2002 331 1,498 17,807 2,419 68,810
Note: Excludes 296 route km of 132kV transmission lines in the North and East Source: CEB, Statistical Digest 2002
Table 4.8 Number and Capacity of Substations
220/132/33 kV 132/11 kV 33/11/3.3 kV 33/11/LV
Number 35 2 119 14,326 Capacity(MVA)
2,412 180 1,029 3,464
Source: CEB, Statistical Digest 2002.
The Study of Hydropower Optimization in Sri Lanka
Final Report5 - 1
5. FORECAST OF POWER DEMAND AND POWER DEVELOPMENT PLAN
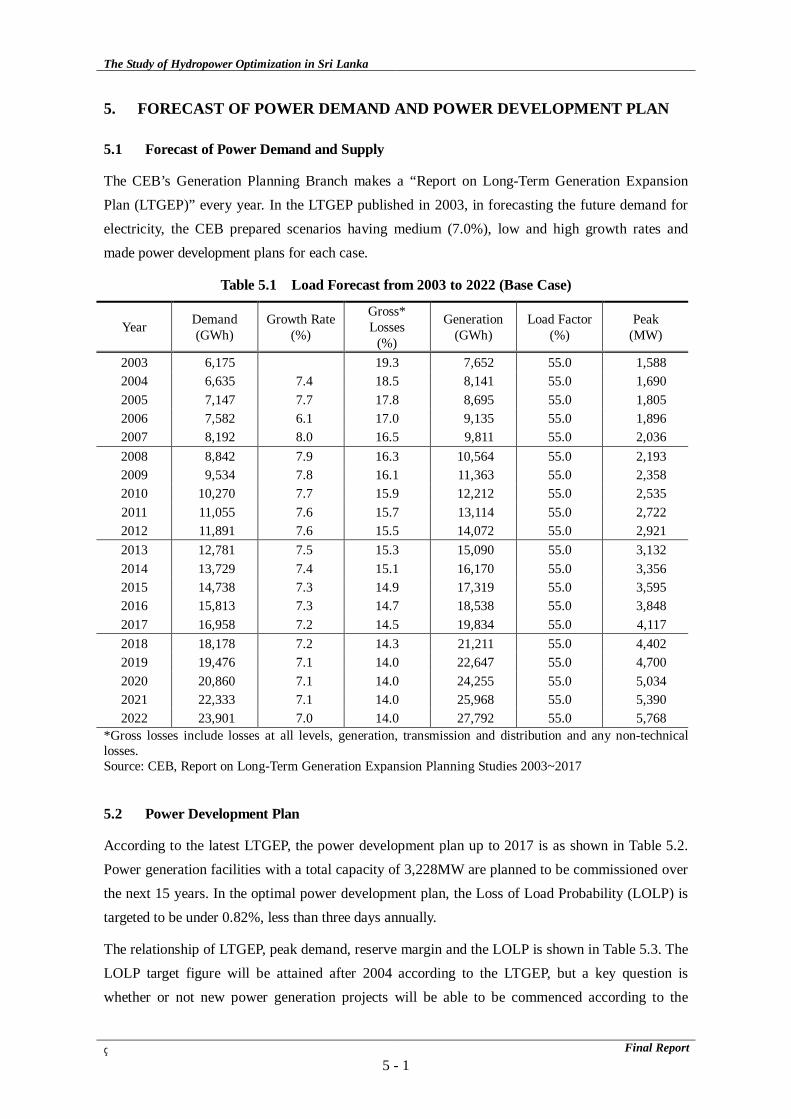
5.1 Forecast of Power Demand and Supply
The CEB’s Generation Planning Branch makes a “Report on Long-Term Generation Expansion Plan (LTGEP)” every year. In the LTGEP published in 2003, in forecasting the future demand for electricity, the CEB prepared scenarios having medium (7.0%), low and high growth rates and made power development plans for each case.
Table 5.1 Load Forecast from 2003 to 2022 (Base Case)
Year Demand (GWh)
Growth Rate (%)
Gross* Losses
(%)
Generation (GWh)
Load Factor (%)
Peak (MW)
2003 6,175 19.3 7,652 55.0 1,588 2004 6,635 7.4 18.5 8,141 55.0 1,690 2005 7,147 7.7 17.8 8,695 55.0 1,805 2006 7,582 6.1 17.0 9,135 55.0 1,896 2007 8,192 8.0 16.5 9,811 55.0 2,036 2008 8,842 7.9 16.3 10,564 55.0 2,193 2009 9,534 7.8 16.1 11,363 55.0 2,358 2010 10,270 7.7 15.9 12,212 55.0 2,535 2011 11,055 7.6 15.7 13,114 55.0 2,722 2012 11,891 7.6 15.5 14,072 55.0 2,921 2013 12,781 7.5 15.3 15,090 55.0 3,132 2014 13,729 7.4 15.1 16,170 55.0 3,356 2015 14,738 7.3 14.9 17,319 55.0 3,595 2016 15,813 7.3 14.7 18,538 55.0 3,848 2017 16,958 7.2 14.5 19,834 55.0 4,117 2018 18,178 7.2 14.3 21,211 55.0 4,402 2019 19,476 7.1 14.0 22,647 55.0 4,700 2020 20,860 7.1 14.0 24,255 55.0 5,034 2021 22,333 7.1 14.0 25,968 55.0 5,390 2022 23,901 7.0 14.0 27,792 55.0 5,768
*Gross losses include losses at all levels, generation, transmission and distribution and any non-technical losses. Source: CEB, Report on Long-Term Generation Expansion Planning Studies 2003~2017
5.2 Power Development Plan
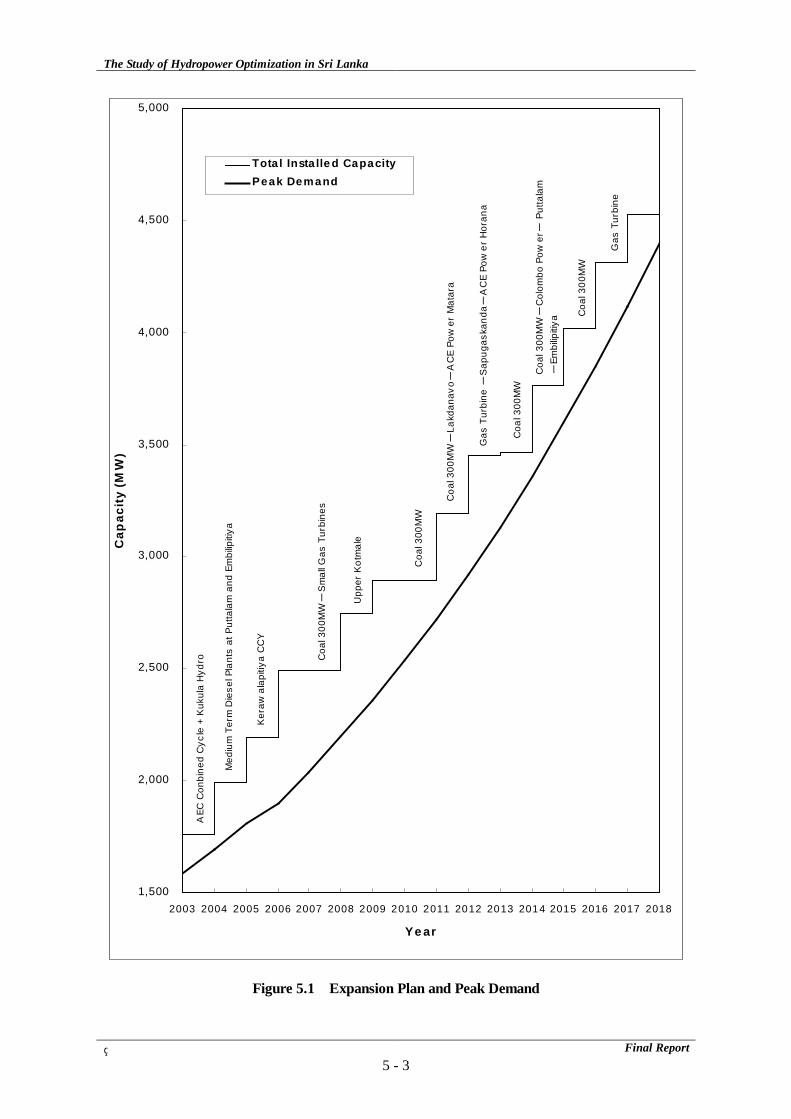
According to the latest LTGEP, the power development plan up to 2017 is as shown in Table 5.2. Power generation facilities with a total capacity of 3,228MW are planned to be commissioned over the next 15 years. In the optimal power development plan, the Loss of Load Probability (LOLP) is targeted to be under 0.82%, less than three days annually.
The relationship of LTGEP, peak demand, reserve margin and the LOLP is shown in Table 5.3. The LOLP target figure will be attained after 2004 according to the LTGEP, but a key question is whether or not new power generation projects will be able to be commenced according to the
The Study of Hydropower Optimization in Sri Lanka
Final Report5 - 2
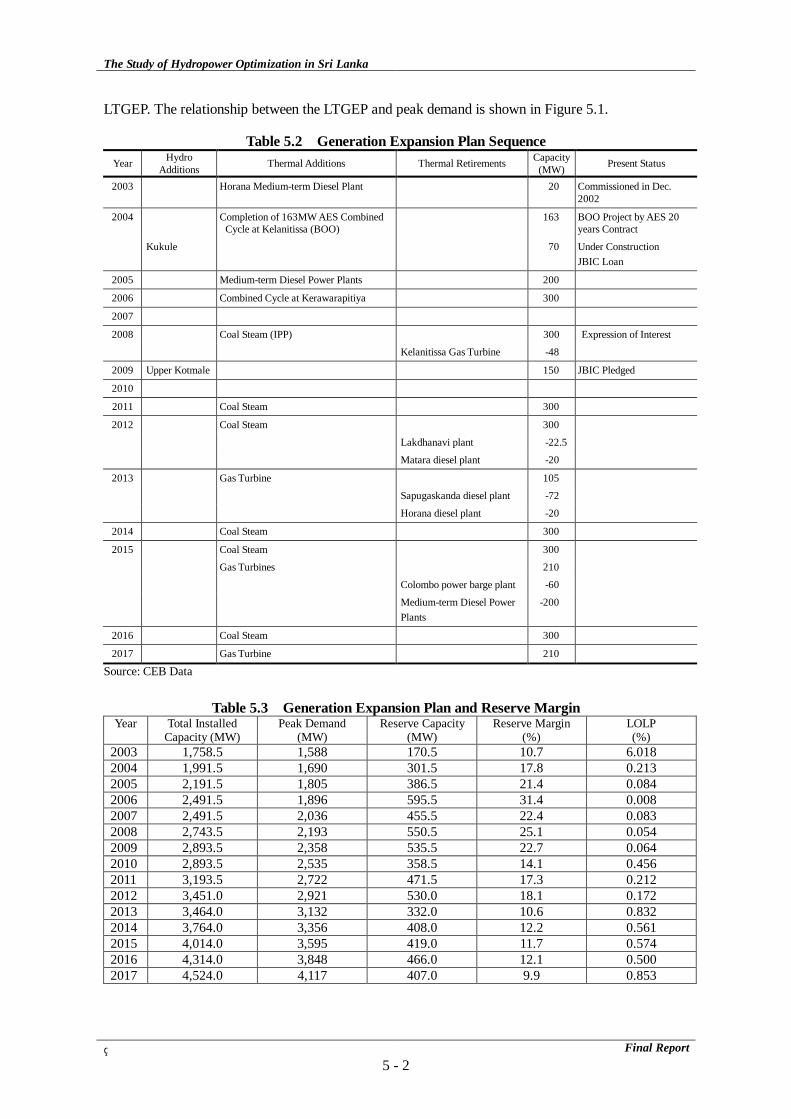
LTGEP. The relationship between the LTGEP and peak demand is shown in Figure 5.1.
Table 5.2 Generation Expansion Plan Sequence Year Hydro
Additions Thermal Additions Thermal Retirements Capacity (MW) Present Status
2003 Horana Medium-term Diesel Plant 20 Commissioned in Dec. 2002
2004 Completion of 163MW AES Combined Cycle at Kelanitissa (BOO)
163 BOO Project by AES 20 years Contract
Kukule 70 Under Construction JBIC Loan
2005 Medium-term Diesel Power Plants 200
2006 Combined Cycle at Kerawarapitiya 300
2007
2008 Coal Steam (IPP) 300 Expression of Interest
Kelanitissa Gas Turbine -48
2009 Upper Kotmale 150 JBIC Pledged
2010
2011 Coal Steam 300
2012 Coal Steam 300
Lakdhanavi plant -22.5
Matara diesel plant -20
2013 Gas Turbine 105
Sapugaskanda diesel plant -72
Horana diesel plant -20
2014 Coal Steam 300
2015 Coal Steam 300
Gas Turbines 210
Colombo power barge plant -60
Medium-term Diesel Power Plants
-200
2016 Coal Steam 300
2017 Gas Turbine 210
Source: CEB Data
Table 5.3 Generation Expansion Plan and Reserve Margin Year Total Installed
Capacity (MW) Peak Demand
(MW) Reserve Capacity
(MW) Reserve Margin
(%) LOLP (%)
2003 1,758.5 1,588 170.5 10.7 6.018 2004 1,991.5 1,690 301.5 17.8 0.213 2005 2,191.5 1,805 386.5 21.4 0.084 2006 2,491.5 1,896 595.5 31.4 0.008 2007 2,491.5 2,036 455.5 22.4 0.083 2008 2,743.5 2,193 550.5 25.1 0.054 2009 2,893.5 2,358 535.5 22.7 0.064 2010 2,893.5 2,535 358.5 14.1 0.456 2011 3,193.5 2,722 471.5 17.3 0.212 2012 3,451.0 2,921 530.0 18.1 0.172 2013 3,464.0 3,132 332.0 10.6 0.832 2014 3,764.0 3,356 408.0 12.2 0.561 2015 4,014.0 3,595 419.0 11.7 0.574 2016 4,314.0 3,848 466.0 12.1 0.500 2017 4,524.0 4,117 407.0 9.9 0.853
The Study of Hydropower Optimization in Sri Lanka
Final Report5 - 3
1,500
2,000
2,500
3,000
3,500
4,000
4,500
5,000
2003 2004 2005 2006 2007 2008 2009 2010 2011 2012 2013 2014 2015 2016 2017 2018
Ye ar
Cap
acit
y (M
W)
Tota l Insta lle d CapacityPeak Demand
Ker
awal
apiti
ya C
CY
AEC
Con
bine
d C
ycle
+ K
ukul
a H
ydro
Med
ium
Ter
m D
iese
l Pla
nts
at P
utta
lam
and
Em
bilip
itiya
Coa
l 300
MW-
Sm
all G
as T
urbi
nes
Upp
er K
otm
ale
Coa
l 300
MW
Coa
l 300
MW-
Lakd
anav
o -A
CE
Pow
er M
atar
a
Gas
Tur
bine
-S
apug
aska
nda -
AC
E Po
wer
Hor
ana
Coa
l 300
MW
Coa
l 300
MW
Gas
Tur
bine
Coa
l 300
MW-
Col
ombo
Pow
er-
Put
tala
m-
Embi
lipiti
ya
Figure 5.1 Expansion Plan and Peak Demand

The Study of Hydropower Optimization in Sri Lanka
Final Report6 - 1
6. POWER SECTOR REFORM 1
The Ceylon Electricity Board (CEB) was established as a government corporation in 1969. The structure of the power sector in Sri Lanka, in which the CEB plays a major role, is currently undergoing a critical reform process. The Government of Sri Lanka, in 1997, decided to restructure the power sector drastically in order to overcome accumulated inefficiencies in the CEB2. The principal features of the power sector reform are as follows:
- The CEB/LECO will be separated into generation, transmission, and distribution functions, with transactions based on a single-buyer model, and
- An independent regulator will be established to regulate the power sector.
6.1 Background and Objectives of Power Sector Reform
The power supply in Sri Lanka is high-cost compared with those of other developing countries, and has low supply reliability, and thus does not satisfy the needs of the country. The most urgent issues are (1) the deteriorating financial conditions of of the CEB, and (2) the slow expansion of power generation.
The need for power sector reform was recognized in the early 1990s. Following studies and debates, the Government issued a policy paper titled “Power Sector Policy Directions” in 1997. The objectives of the power sector reform are defined as: to lower the price to the consumer and ensure a high level of services and supply reliability, and to sustain an adequate level of investments in the power sector at all times. The strategies are: i) private-sector investment in thermal generation, ii) separation of the functions of generation, transmission, and distribution, iii) establishment of an independent regulatory authority, iv) commercialization, v) least-cost expansion planning with integrated resource planning method, vi) appropriate fuel mix, vii) cost-reflecting tariffs, viii) a publicly-owned transmission company, ix) distribution with regional franchises, and x) acceleration of rural electrification.
6.2 Reform Plan and Its Issues
The framework of power sector reform is given in the Electricity Reform Act and Public Utilities Commission Act, both of which were enacted in October 2002.
Based on these two Acts, the CEB and LECO will be reorganized into companies for generation, transmission, and distribution in 20033. The Public Utilities Commission of Sri Lanka is also established to regulate the power sector. IPPs play their roles as before. The policy on power sector
1 The contents of this report are based on the information up to October 2003. 2 Power Sector Policy Directions, Ministry of Irrigation and Power, August 1997 3 The unbundling of CEB/LECO is (was?) rescheduled on December 11, 2003. It is likely to be further delayed sometime in early 2004.
The Study of Hydropower Optimization in Sri Lanka
Final Report6 - 2
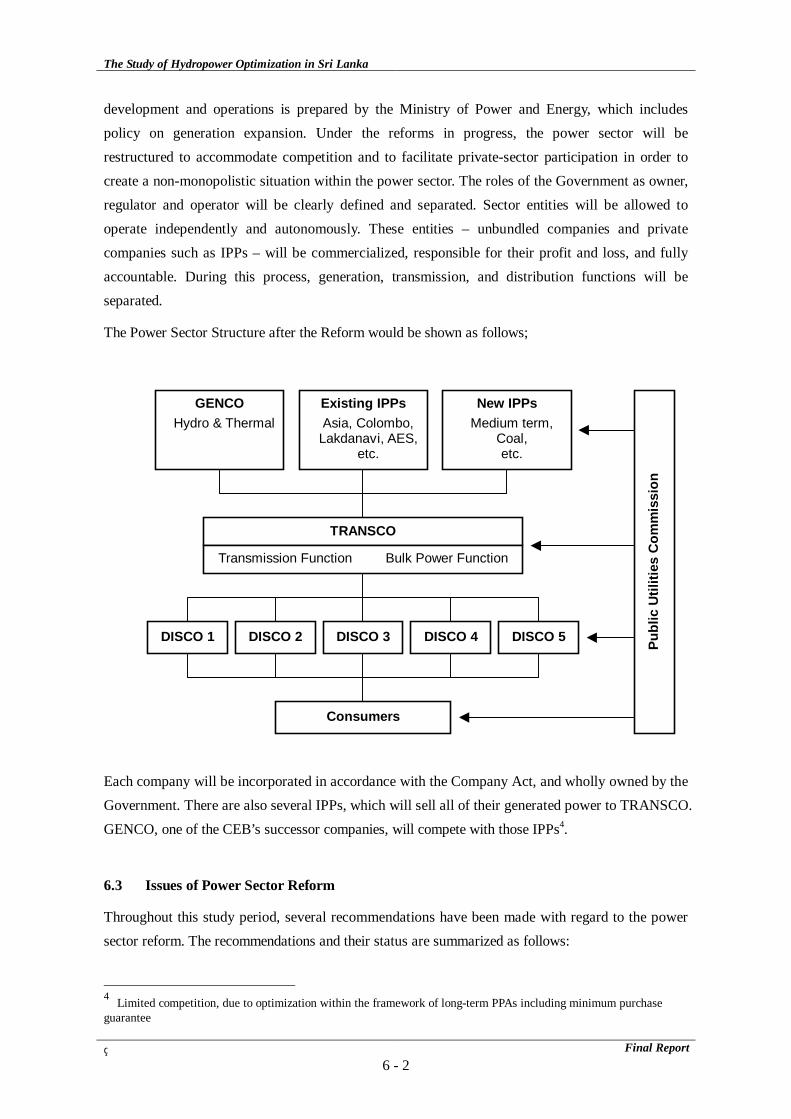
development and operations is prepared by the Ministry of Power and Energy, which includes policy on generation expansion. Under the reforms in progress, the power sector will be restructured to accommodate competition and to facilitate private-sector participation in order to create a non-monopolistic situation within the power sector. The roles of the Government as owner, regulator and operator will be clearly defined and separated. Sector entities will be allowed to operate independently and autonomously. These entities – unbundled companies and private companies such as IPPs – will be commercialized, responsible for their profit and loss, and fully accountable. During this process, generation, transmission, and distribution functions will be separated.
The Power Sector Structure after the Reform would be shown as follows;
Each company will be incorporated in accordance with the Company Act, and wholly owned by the Government. There are also several IPPs, which will sell all of their generated power to TRANSCO. GENCO, one of the CEB’s successor companies, will compete with those IPPs4.
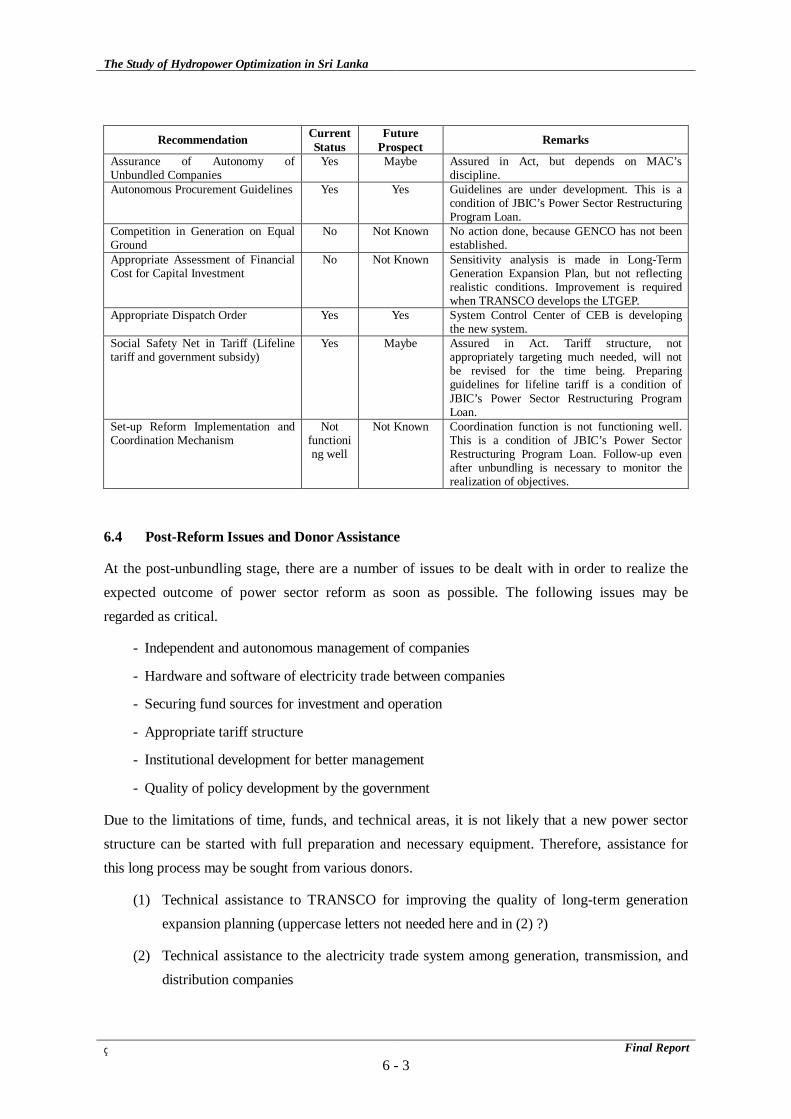
6.3 Issues of Power Sector Reform
Throughout this study period, several recommendations have been made with regard to the power sector reform. The recommendations and their status are summarized as follows:
4 Limited competition, due to optimization within the framework of long-term PPAs including minimum purchase guarantee
GENCO Hydro & Thermal
Existing IPPs Asia, Colombo,
Lakdanavi, AES, etc.
New IPPs Medium term,
Coal, etc.
TRANSCO
Transmission Function Bulk Power Function
DISCO 1 DISCO 2 DISCO 3 DISCO 4 DISCO 5
Consumers
Publ
ic U
tiliti
es C
omm
issi
on
The Study of Hydropower Optimization in Sri Lanka
Final Report6 - 3
Recommendation Current Status
Future Prospect Remarks
Assurance of Autonomy of Unbundled Companies
Yes Maybe Assured in Act, but depends on MAC’s discipline.
Autonomous Procurement Guidelines Yes Yes Guidelines are under development. This is a condition of JBIC’s Power Sector Restructuring Program Loan.
Competition in Generation on Equal Ground
No Not Known No action done, because GENCO has not been established.
Appropriate Assessment of Financial Cost for Capital Investment
No Not Known Sensitivity analysis is made in Long-Term Generation Expansion Plan, but not reflecting realistic conditions. Improvement is required when TRANSCO develops the LTGEP.
Appropriate Dispatch Order Yes Yes System Control Center of CEB is developing the new system.
Social Safety Net in Tariff (Lifeline tariff and government subsidy)
Yes Maybe Assured in Act. Tariff structure, not appropriately targeting much needed, will not be revised for the time being. Preparing guidelines for lifeline tariff is a condition of JBIC’s Power Sector Restructuring Program Loan.
Set-up Reform Implementation and Coordination Mechanism
Not functioning well
Not Known Coordination function is not functioning well. This is a condition of JBIC’s Power Sector Restructuring Program Loan. Follow-up even after unbundling is necessary to monitor the realization of objectives.
6.4 Post-Reform Issues and Donor Assistance
At the post-unbundling stage, there are a number of issues to be dealt with in order to realize the expected outcome of power sector reform as soon as possible. The following issues may be regarded as critical.
- Independent and autonomous management of companies
- Hardware and software of electricity trade between companies
- Securing fund sources for investment and operation
- Appropriate tariff structure
- Institutional development for better management
- Quality of policy development by the government
Due to the limitations of time, funds, and technical areas, it is not likely that a new power sector structure can be started with full preparation and necessary equipment. Therefore, assistance for this long process may be sought from various donors.
(1) Technical assistance to TRANSCO for improving the quality of long-term generation expansion planning (uppercase letters not needed here and in (2) ?)
(2) Technical assistance to the alectricity trade system among generation, transmission, and distribution companies
Part II OPTIMIZATION OF HYDROPOWER
IN SRI LANKA
The Study of Hydropower Optimization in Sri Lanka
Final Report7 - 1
7. METEOROLOGY AND HYDROLOGY
7.1 Topography and Climate Conditions of Study Area
7.1.1 Topography in Target River System
The “Central Highlands” region is located in the south-center of Sri Lanka Island and has an elevation of 750 m to 2,500 m. The major rivers of the island flow from the Central Highlands to the plains surrounding the highlands in all four compass directions.
The study area is divided into three river systems by the Southern Mountain wall, which consists of 2,300 m to 2,400 m high mountains and is located south of Nuwara Eriya. The Mahaweli river system flows north from the highlands, the Kelani river system flows west from the highlands, and the Walawe river system flows south from the highlands. Most of existing and planned hydropower stations are located in the upper reaches of these river systems.
7.1.2 Climate Conditions
The climate of Sri Lanka is marked by the southwest monsoon and northeast monsoon. The intermissions between these monsoon periods are called the “First Intermission Period” (from March to April) and the “Second Intermission Period” (form October to November), respectively.
These monsoons are due to the north and south seasonal movement of the equatorial low pressure belt called the “equatorial trough”.
In addition to the monsoon activities, the central highlands form a monsoon barrier, which leads to a variety of rainfall conditions in various regions of the island.
Thus there are two growing seasons in Sri Lanka characterized by two monsoon seasons.
“Yala” designates the south-west monsoon season period from May to September. “Maha”
designates the north-east monsoon season and the two intermission season periods from October to April.
7.2 Data Collection and Analysis on Hydrology
All of the rainfall and runoff records in Sri Lanka collected and summarized in Master Plan for the Electricity Supply of Sri Lanka in 1989. In this study, JICA study team collected supplemental records from October 1985 to September 2001 around the target area; Mahaweli, Kelani and Walawe river system.
7.3 Hydrological Data Analysis
The results of the hydrological data analysis were utilized to give an understanding of the

The Study of Hydropower Optimization in Sri Lanka
Final Report7 - 2
characteristics of the target river systems, verify runoff data, supplement missing data, and to undertake low flow and flood analyses. The hydrological data analysis consisted of:
- verifying rainfall data,
- supplementing missing data, and
- estimating average rainfall in each river system.
7.4 Estimation of Runoff Data for Effective Operation of Existing Hydro Power Station
In order to estimate daily runoff into all major reservoirs, low flow runoff analysis was carried out based on daily rainfall records around each reservoir and monthly average inflow records at each reservoir.
The results of low flow runoff analysis are summarized below and the results in Kelani river system are mentioned Chapter 10 with low flow runoff analysis of Broadlands hydro power project.
Results of Low Flow Runoff Analysis (Unit: m3/s)
Reservoir/Pond River Basin Jan Feb Mar Apr May Jun Jul Aug Sep Oct Nov Dec Ave
Kotmale Mahaweli 26.5 16.3 14.9 26.8 30.0 36.1 34.1 29.6 29.0 43.7 46.5 35.4 369.0
Polgolla Mahaweli 37.4 21.1 14.7 24.3 39.1 47.8 44.5 39.3 37.5 62.4 74.3 54.1 496.6
Victoria Mahaweli 43.4 33.9 22.2 16.6 16.4 15.6 12.8 10.7 10.6 18.8 32.9 43.4 277.2
Randenigala Mahaweli 39.4 28.8 17.8 13.2 12.1 9.1 6.3 4.8 4.7 11.8 24.6 37.2 209.7
Rantembe Mahaweli 35.1 26.7 21.6 20.0 19.0 14.9 12.7 10.9 10.0 14.3 23.8 31.9 240.8
Samanalawewa Walawe 13.8 9.2 7.9 12.9 19.4 21.5 21.3 21.0 18.7 21.8 23.1 18.0 208.6
The Study of Hydropower Optimization in Sri Lanka
Draft Final Report8 - 1
8. EFFICIENT OPERATION OF EXISTING HYDROPOWER STATIONS
8.1 Long Term Operation of Reservoir Type Power Stations
8.1.1 Present Operational Status of Reservoir Type Power Stations
Operation rules for existing reservoirs were examined in the “Mahaweli Water Resources Management Project” carried out under the financial assistance of the Canadian International Development Agency in 1985 (hereinafter referred to as “MWRMP”), and the “Master Plan for the Electricity Supply of Sri Lanka” supported by GTZ in 1989 (hereinafter referred to as “MPES’). Operation rules for the existing reservoir were formulated based on MWRMP, except for the Samanalawewa reservoir. Operation rules for the Samanalawewa reservoir were formulated based on MPES.
8.1.2 Optimization Study on Reservoir Operation
(1) Conditions of the Study
The conditions of the optimization study of reservoir operation are follows;
- There are several methods, the dynamic programming (DP) method is commonly adopted to optimize reservoir operations. In this JICA study, the reservoir operations are optimized by DP method.
- The function for evaluation was configured for maximizing the total annual energy of hydro power stations which are related to target reservoirs.
- Effects on optimized rule curve were validated by comparing the annual total energy using the original rule curve to the annual total energy using the optimized rule curve.
(2) Results of the Study
1) Kelani Rive System
Optimization of reservoir operations for Mousakelle and Castlereigh reservoir in Kelani river system were carried out using DP method in order to maximize the power generation at Canyon, Wimalasurendra, Old Laxapana, New Laxapana and Polpitiya power station. There was no significant increase of power generation, which would mean an increase of GWh, identified using optimized rule curve of those two reservoirs. It seems that the capacities of both reservoirs are relatively smaller than the amount of inflow into those reservoirs. Even if the reservoir will be operated in accordance with the rule curve, the water levels of the reservoirs are mainly affected by fluctuation of the reservoir inflow. The simulation results from the SYSIM program also showed the same tendency as the above results.
The Study of Hydropower Optimization in Sri Lanka
Draft Final Report8 - 2
It is recommended that these reservoirs should be operated in order to minimize the spill out from the reservoirs.
2) Mahaweli River System
The average number of days of irrigation demand deficit was six (6) days per year operating the Kotmale reservoir in accordance with the original rule curve. The original rule curve gives high priority to meet the irrigation demand and main purpose of the Kotmale reservoir is to meet the irrigation demand. Hence, there is no room to study of reservoir operation.
Victoria and Randenigala reservoir can be operated along any rule curve to meet the irrigation demand substantially. Therefore, optimization study for both reservoirs was carried out in order to maximize the power generation of Victoria, Randenigala, and Rantambe power station.
The annual total energy of Victoria, Randenigala, and Rantambe power station is increased by 3.6% with operating Victoria and Randenigala reservoir in accordance with optimized rule curve. Increased annual total energy is 54 GWh and the energy corresponds to energy production of hydro power station which plant capacity is12,000kW and assumed plant factor is 50%.
3) Walawe River System (Samanalawewa Reservoir)
The operation of the Samanalawewa reservoir with optimized rule curve can reduce the spill out discharge form the reservoir and power generation can be increased by 1.3% with optimized rule curve.
8.2 Efficient Operation of Regulating Pond Type Power Stations
(1) Polpitiya Power Station
The Polpitiya power station has two generating units, which have problems as follows: 1) it takes time to restart, and 2) vibration occurs between 5MW and 35MW operation. Therefore, the units are operated even during the semi-peak and off-peak periods at 5MW with low efficiency.
Increase in energy production was estimated on the assumption that the restart problem was resolved and it became possible to operate at 35MW for a short period with high efficiency instead of to operate at 5MW for a long period with low efficiency.
The estimation was done using the operation records of 1995 and 2001 on the assumption that it became possible to operate at 35MW with high efficiency for a short period instead of at 5MW for a long period.
The Study of Hydropower Optimization in Sri Lanka
Draft Final Report8 - 3
The results show that the increases from the actual energy production are about 8GWh and 12GWh in 1995 and 2000, respectively. These figures correspond to about 2 to 3% of the annual energy production (409GWh) described in the Long-Term Generation Expansion Plan.
(2) Old Laxapana Power Station and New Laxapana Power Station
Regarding the Old Laxapana power station, calculations based on the operation record were not carried out. However, increase in energy production is expected by operating effectively as well as the Polpitiya power station. The increasing rate will be less than the Polpitiya power station since the turbines of the Old Laxapana power station are a Pelton type, whose efficiency does not drop like a Francis type at a small discharge.
Similar increase is possible at the New Laxapana power station. However, the power station is expected to take on frequency control in the night, as described below, it is difficult to seek the increase of energy production by operating efficiently as mentioned above.
8.3 Frequency Control
8.3.1 Present Situation of Frequency Control
At present, 10 water turbines of 4 hydro power stations, Victoria (70MW×3, reservoir pond type), New Laxapana (50MW×2, regulating pond type), Samanalawewa (60MW×2, reservoir pond type) and Kotmale (67MW×3, reservoir pond type), are used for frequency control.
10 water turbines of 4 hydro power stations can be used for frequency control, but only one water turbines can be used at one time for frequency control except Samanalawewa. Two or three water turbines cannot absorb load changes together at the same time. Only two units of Samanalawewa can absorb load changes together at the same time. Of course, some water turbines at different power stations cannot absorb load changes together at the same time.
According to the frequency record of recent years, the frequency violation beyond 50.0 ± 0.5Hz was more than 100 times per year.
8.3.2 Problems of Frequency Control
Frequency control system in CEB power system has such problems as shown below;
(1) Problems caused by Present Frequency Control System (Governor Free Operation)
The frequency control system adopted by CEB is different from AFC (Automatic Frequency Control) system commonly used in Japan, USA and European countries. The AFC system control does not permit control offset. “Governor Free Operation with low governor droop setting” is used as frequency control system. This control system has some defects as
The Study of Hydropower Optimization in Sri Lanka
Draft Final Report8 - 4
follows,
1) The frequency deviation can not be cancelled perfectly
2) Some water turbines at different power stations can not absorb load changes together at same time. Therefore, it is not able to meet power demand increase.
(2) Shortage of Running Capacity for Frequency Control
It can be said that 70MW, rated capacity of one water turbine at Victoria is approaching operation limits needed as running capacity for frequency control. To increase running capacity for frequency control, governor joint operations at Victoria, Kotmale and New Laxapana .are needed. To be operated on governor joint operation mode, governors at these power stations are needed to be reconstructed or improved as soon as possible. It is evident that shortage of running capacity will occur in future under the present frequency control system, after 300MW unit is put into service.
(3) Inefficient Operation at Victoria
Characteristics of Victoria are as follows;
1) Unit capacity is the biggest
2) The yearly plant factor is the biggest among all of the six reservoir pond type power stations
3) There is less limitation imposed by irrigation demand and fluctuation. Hence, from the physical stand of view, Victoria is the most suited power station for frequency control. But, from now on, “Frequency Control with Economic Operation” must be promoted.
8.3.3 Improvement of Frequency Control System
To secure running capacity for frequency control in future, it is necessary to shift to a “Centralized AFC System” under which all of the water turbines operated for frequency control can absorb load changes together at the same time. An outline of a “Centralized AFC System” and policy for shift follows:
(1) Change of Frequency Control System
The frequency system should be shifted from present “Governor Free Operation” into “AFC System”, and base output of a power station for frequency control can be controlled automatically until frequency returns back to 50.0HZ perfectly within at latest one minute under this system
(2) Shift into “Centralized AFC System”
By connecting control center and hydro power stations through communication channels, main controller at control center can control all of water turbines operated for frequency
The Study of Hydropower Optimization in Sri Lanka
Draft Final Report8 - 5
control together at the same time.
(3) Operation Policy by using “Centralized AFC System”
1) AFC power stations at night peak and semi-peak period
Victoria, Kotmale and Samanalawewa should be united and operated at night peak and semi-peak. When all of eight water turbines absorb load changes together at night peak, all water turbines can be operated nearer maximum efficiency output than at semi-peak.
2) AFC power stations during mid-night period
Power stations for which yearly plant factor is very high are very often operated even during mid-night period. The New Laxapana (53.3%), Old Laxapana (63.7%) and Polpitiya (62.3%) are suitable for AFC during mid-night period (about 0:00 to 6:00). When all of water turbines running in parallel absorb load changes together, water turbines can be operated nearer maximum efficiency output.
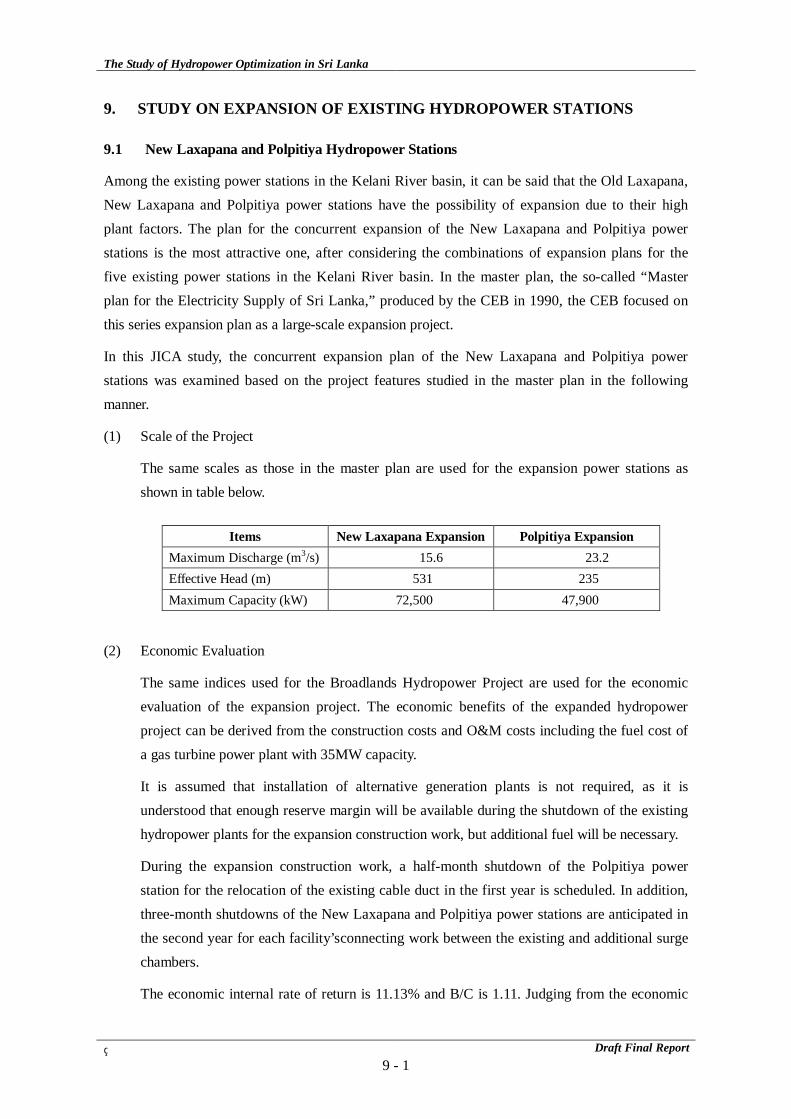
The Study of Hydropower Optimization in Sri Lanka
Draft Final Report9 - 1
9. STUDY ON EXPANSION OF EXISTING HYDROPOWER STATIONS
9.1 New Laxapana and Polpitiya Hydropower Stations
Among the existing power stations in the Kelani River basin, it can be said that the Old Laxapana, New Laxapana and Polpitiya power stations have the possibility of expansion due to their high plant factors. The plan for the concurrent expansion of the New Laxapana and Polpitiya power stations is the most attractive one, after considering the combinations of expansion plans for the five existing power stations in the Kelani River basin. In the master plan, the so-called “Master plan for the Electricity Supply of Sri Lanka,” produced by the CEB in 1990, the CEB focused on this series expansion plan as a large-scale expansion project.
In this JICA study, the concurrent expansion plan of the New Laxapana and Polpitiya power stations was examined based on the project features studied in the master plan in the following manner.
(1) Scale of the Project
The same scales as those in the master plan are used for the expansion power stations as shown in table below.
Items New Laxapana Expansion Polpitiya Expansion
Maximum Discharge (m3/s) 15.6 23.2 Effective Head (m) 531 235 Maximum Capacity (kW) 72,500 47,900
(2) Economic Evaluation
The same indices used for the Broadlands Hydropower Project are used for the economic evaluation of the expansion project. The economic benefits of the expanded hydropower project can be derived from the construction costs and O&M costs including the fuel cost of a gas turbine power plant with 35MW capacity.
It is assumed that installation of alternative generation plants is not required, as it is understood that enough reserve margin will be available during the shutdown of the existing hydropower plants for the expansion construction work, but additional fuel will be necessary.
During the expansion construction work, a half-month shutdown of the Polpitiya power station for the relocation of the existing cable duct in the first year is scheduled. In addition, three-month shutdowns of the New Laxapana and Polpitiya power stations are anticipated in the second year for each facility’sconnecting work between the existing and additional surge chambers.
The economic internal rate of return is 11.13% and B/C is 1.11. Judging from the economic
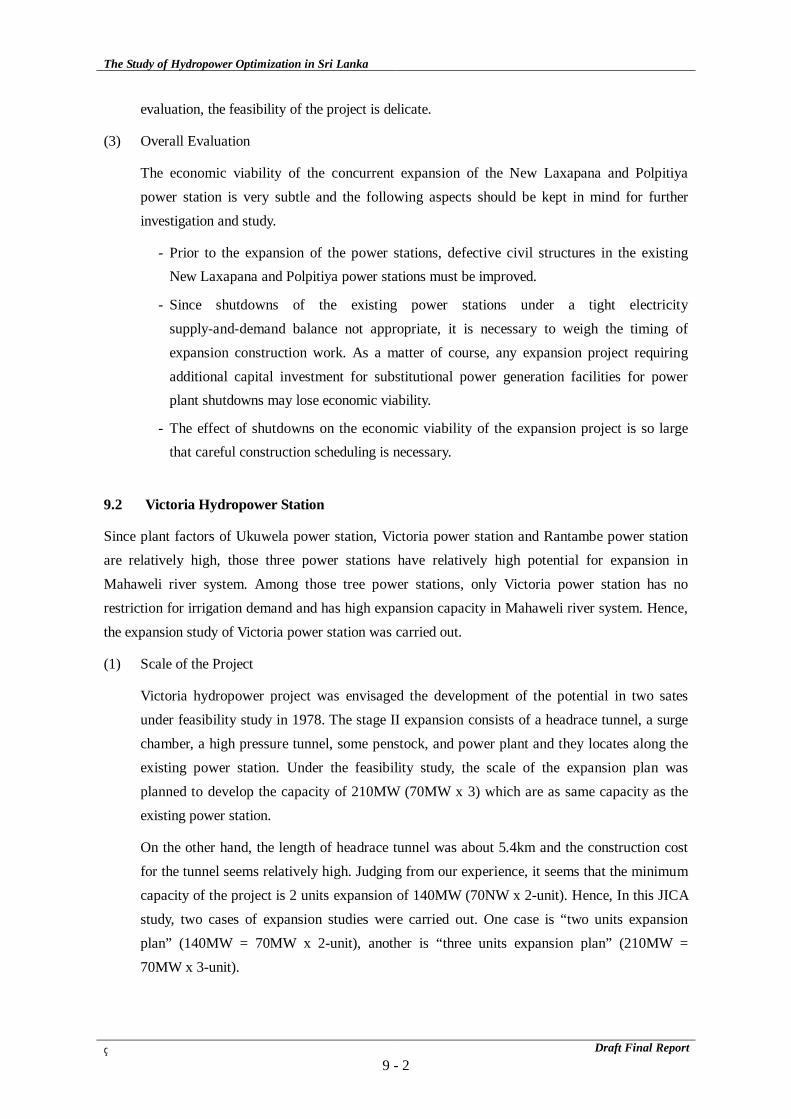
The Study of Hydropower Optimization in Sri Lanka
Draft Final Report9 - 2
evaluation, the feasibility of the project is delicate.
(3) Overall Evaluation
The economic viability of the concurrent expansion of the New Laxapana and Polpitiya power station is very subtle and the following aspects should be kept in mind for further investigation and study.
- Prior to the expansion of the power stations, defective civil structures in the existing New Laxapana and Polpitiya power stations must be improved.
- Since shutdowns of the existing power stations under a tight electricity supply-and-demand balance not appropriate, it is necessary to weigh the timing of expansion construction work. As a matter of course, any expansion project requiring additional capital investment for substitutional power generation facilities for power plant shutdowns may lose economic viability.
- The effect of shutdowns on the economic viability of the expansion project is so large that careful construction scheduling is necessary.
9.2 Victoria Hydropower Station
Since plant factors of Ukuwela power station, Victoria power station and Rantambe power station are relatively high, those three power stations have relatively high potential for expansion in Mahaweli river system. Among those tree power stations, only Victoria power station has no restriction for irrigation demand and has high expansion capacity in Mahaweli river system. Hence, the expansion study of Victoria power station was carried out.
(1) Scale of the Project
Victoria hydropower project was envisaged the development of the potential in two sates under feasibility study in 1978. The stage II expansion consists of a headrace tunnel, a surge chamber, a high pressure tunnel, some penstock, and power plant and they locates along the existing power station. Under the feasibility study, the scale of the expansion plan was planned to develop the capacity of 210MW (70MW x 3) which are as same capacity as the existing power station.
On the other hand, the length of headrace tunnel was about 5.4km and the construction cost for the tunnel seems relatively high. Judging from our experience, it seems that the minimum capacity of the project is 2 units expansion of 140MW (70NW x 2-unit). Hence, In this JICA study, two cases of expansion studies were carried out. One case is “two units expansion plan” (140MW = 70MW x 2-unit), another is “three units expansion plan” (210MW = 70MW x 3-unit).
The Study of Hydropower Optimization in Sri Lanka
Draft Final Report9 - 3
Items unit 2 units expansion plan 3 units expansion plan Maximum Discharge m3/s 90 135
Effective Head m 190 190
Expansion Capacity MW 140 210 Total Capacity with Existing Unit MW 350 (210+140) 420 (210+210)
(2) Economic Evaluation
Regarding the 2 unit expansion plan, the economic internal rate of return is 10.1 % and B/C is 1.01. Regarding the 3 unit expansion plan, the economic internal rate of return is 10.9% and B/C is 1.08. Judging form the economic evaluation, the feasibilities of both projects are delicate..
(3) Overall Evaluation
At the present time, the expansion project of the Victoria power station is delicate. However, this expansion plan has following merits. If the fuel cost rise suddenly with deficit of peak demand in feature, it is recommended to carry out more detail study that is mainly cost down for civil works and hydro-electrical woks.
- Since existing power station has already intake facilities including intake gates for expansion, shutdown of existing power station during construction is very few times, and draw down of Victoria reservoir is not necessary during the construction.
- The access road, tunnel work adit and any temporary facilities, which were constructed for stage I (existing power station), were utilized for the expansion.
9.3 Samanalawewa Hydropower Station
Regarding Samanalawewa power station, the addition of two 60MW units has been taken into consideration since the planning stage of the project to cope with the increase of peak demand. In the construction stage of the existing power station, a bifurcation with bulk head was installed in the penstock and a space for another two 60MW units was prepared for the addition.
Existing switchyard has also had space for new two feeders but one space is difficult to connect with generator feeder. Therefore GIS will be applied on the switchyard if two generators are added into Samanalawewa power station.
(1) Scale of the Project
The development of stage II with Diyawini Oya dam is not feasible. Hence, in this JICA study, study of 1 unit expansion plan and 2 units expansion plan were carried out under the conditions of eliminating the Diyawini Oya dam form these plans.
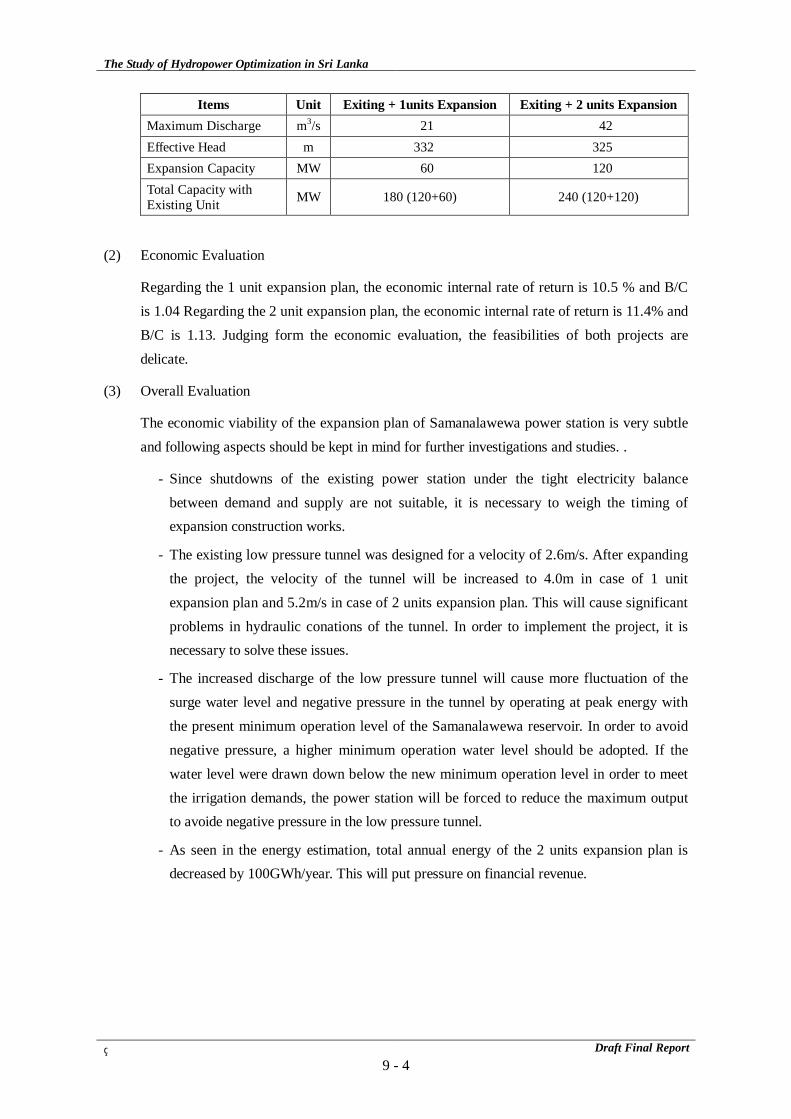
The Study of Hydropower Optimization in Sri Lanka
Draft Final Report9 - 4
Items Unit Exiting + 1units Expansion Exiting + 2 units ExpansionMaximum Discharge m3/s 21 42 Effective Head m 332 325 Expansion Capacity MW 60 120 Total Capacity with Existing Unit MW 180 (120+60) 240 (120+120)
(2) Economic Evaluation
Regarding the 1 unit expansion plan, the economic internal rate of return is 10.5 % and B/C is 1.04 Regarding the 2 unit expansion plan, the economic internal rate of return is 11.4% and B/C is 1.13. Judging form the economic evaluation, the feasibilities of both projects are delicate.
(3) Overall Evaluation
The economic viability of the expansion plan of Samanalawewa power station is very subtle and following aspects should be kept in mind for further investigations and studies. .
- Since shutdowns of the existing power station under the tight electricity balance between demand and supply are not suitable, it is necessary to weigh the timing of expansion construction works.
- The existing low pressure tunnel was designed for a velocity of 2.6m/s. After expanding the project, the velocity of the tunnel will be increased to 4.0m in case of 1 unit expansion plan and 5.2m/s in case of 2 units expansion plan. This will cause significant problems in hydraulic conations of the tunnel. In order to implement the project, it is necessary to solve these issues.
- The increased discharge of the low pressure tunnel will cause more fluctuation of the surge water level and negative pressure in the tunnel by operating at peak energy with the present minimum operation level of the Samanalawewa reservoir. In order to avoid negative pressure, a higher minimum operation water level should be adopted. If the water level were drawn down below the new minimum operation level in order to meet the irrigation demands, the power station will be forced to reduce the maximum output to avoide negative pressure in the low pressure tunnel.
- As seen in the energy estimation, total annual energy of the 2 units expansion plan is decreased by 100GWh/year. This will put pressure on financial revenue.
Part III BROADLANDS
HYDROPOWER PROJECT

The Study of Hydropower Optimization in Sri Lanka
Final Report10- 1
10. HYDROLOGICAL ANALYSIS FOR BROADLANDS PROJECT
10.1 Low Flow Runoff Analysis
The runoff records at Kitulugala gauging station have been influenced by artificial discharge release from Mousakelle reservoir and Castlereigh reservoir which have been located upstream of the gauging station since Mousakelle dam was constructed in 1968. The runoff released from Castlereigh reservoir is diverted form Norton pond on the Kehelgamu Oya to Maskeliya Oya via Old Laxapana hydro power station. The maximum diverted discharge is 14.42 m3/s, which is plant discharge of Old Laxapana hydro power station. In addition, there has been an absence of daily discharge records at these reservoirs and all power stations in the Kelani river system. Hence, under the existing conditions, it is impossible to establish a natural runoff records for site E on Maskeliya Oya and weir site on Kehelgamu Oya which are candidates dam site of Broadlands hydro power project. In order to estimate these runoff, 1) the natural runoff at sub basin of Kehelgamu Oya should be estimated by low flow runoff analysis 2) released discharge from Castlereigh reservoir should be estimated by reservoir operation, and 3) the flow of each dam site, site E and weir site, should be estimated by water balance model.
The results of inflow discharge at candidate dam site for the Broadlands project are summarized below.
Monthly Inflow at Candidate Dam Site of Broadlands Projects
Site CA (km2) type Oct Nov Dec Jan Feb Mar Apr May Jun Jul Aug Sep
Rain (mm) 380 311 184 102 108 184 306 355 396 330 275 301Kitulgala
GS Site 388 Runoff (m3/s) 56.4 44.4 27.8 21.9 19.6 20.1 22.9 41.7 63.4 55.4 50.2 50.8Rain (mm) 380 311 184 102 108 184 306 355 396 330 275 301Dam Site
A, D 388 Runoff (m3/s) 56.4 44.4 27.8 21.9 19.6 20.1 22.9 41.7 63.4 55.4 50.2 50.8Rain (mm) 429 331 186 103 112 193 327 418 494 410 348 367Dam Site
E 201 Runoff (m3/s) 42.7 36.2 22.7 18.3 16.2 15.2 13.9 31.8 50.3 41.2 37.4 45.1Rain (mm) 397 348 215 119 122 207 335 354 401 339 281 299
Weir Site 176 Runoff (m3/s) 12.7 7.3 4.8 3.2 3.2 5.1 9.1 9.2 11.9 13.8 12.3 13.1
Note: These results were estimated based on observed runoff from October 1950 to September 1998 at Kitulgala gauging Station.
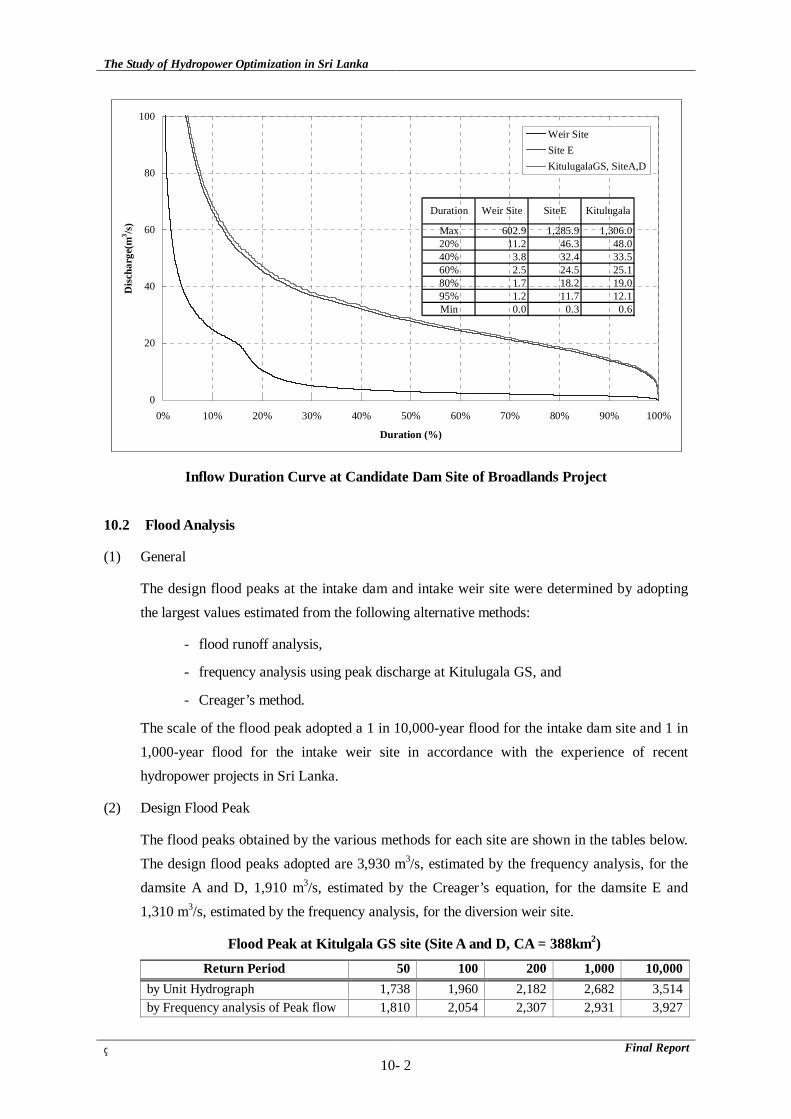
The Study of Hydropower Optimization in Sri Lanka
Final Report10- 2
Max 602.9 1,285.9 1,306.020% 11.2 46.3 48.040% 3.8 32.4 33.560% 2.5 24.5 25.180% 1.7 18.2 19.095% 1.2 11.7 12.1Min 0.0 0.3 0.6
KitulugalaSiteEWeir SiteDuration
0
20
40
60
80
100
0% 10% 20% 30% 40% 50% 60% 70% 80% 90% 100%
Duration (%)
Dis
char
ge(m
3 /s)
Weir SiteSite EKitulugalaGS, SiteA,D
Inflow Duration Curve at Candidate Dam Site of Broadlands Project
10.2 Flood Analysis
(1) General
The design flood peaks at the intake dam and intake weir site were determined by adopting the largest values estimated from the following alternative methods:
- flood runoff analysis,
- frequency analysis using peak discharge at Kitulugala GS, and
- Creager’s method.
The scale of the flood peak adopted a 1 in 10,000-year flood for the intake dam site and 1 in 1,000-year flood for the intake weir site in accordance with the experience of recent hydropower projects in Sri Lanka.
(2) Design Flood Peak
The flood peaks obtained by the various methods for each site are shown in the tables below. The design flood peaks adopted are 3,930 m3/s, estimated by the frequency analysis, for the damsite A and D, 1,910 m3/s, estimated by the Creager’s equation, for the damsite E and 1,310 m3/s, estimated by the frequency analysis, for the diversion weir site.
Flood Peak at Kitulgala GS site (Site A and D, CA = 388km2) Return Period 50 100 200 1,000 10,000
by Unit Hydrograph 1,738 1,960 2,182 2,682 3,514by Frequency analysis of Peak flow 1,810 2,054 2,307 2,931 3,927
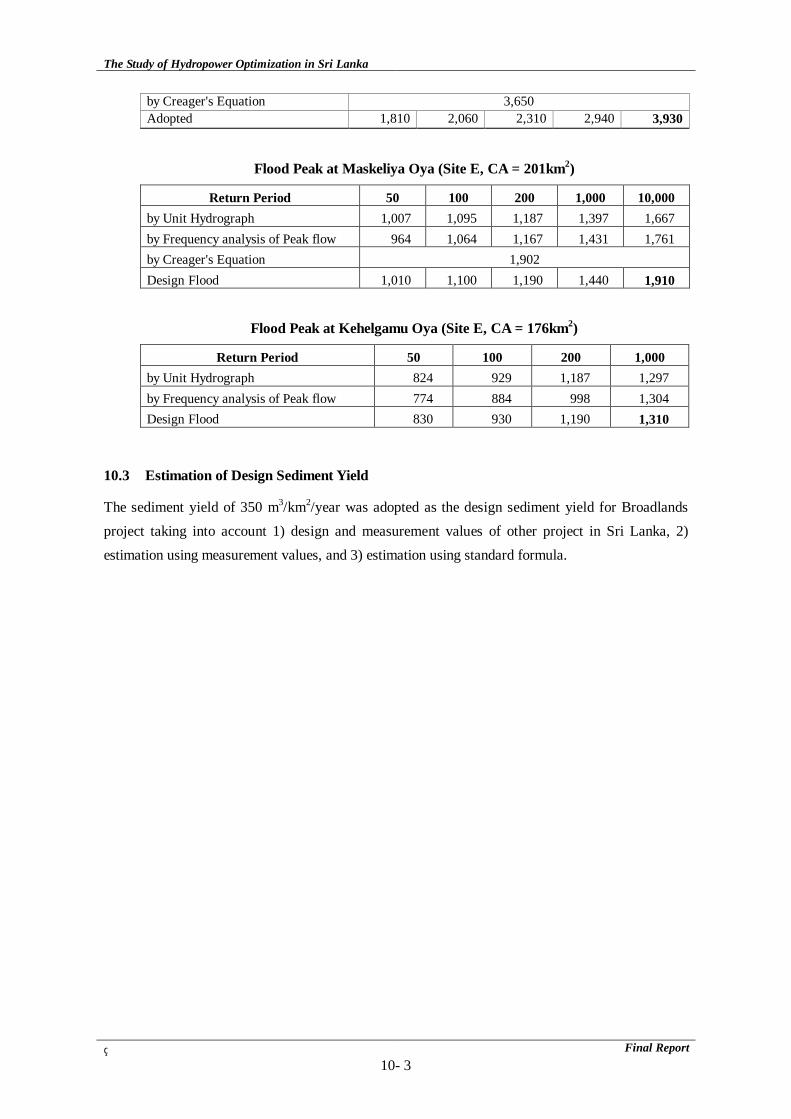
The Study of Hydropower Optimization in Sri Lanka
Final Report10- 3
by Creager's Equation 3,650 Adopted 1,810 2,060 2,310 2,940 3,930
Flood Peak at Maskeliya Oya (Site E, CA = 201km2)
Return Period 50 100 200 1,000 10,000 by Unit Hydrograph 1,007 1,095 1,187 1,397 1,667 by Frequency analysis of Peak flow 964 1,064 1,167 1,431 1,761 by Creager's Equation 1,902 Design Flood 1,010 1,100 1,190 1,440 1,910
Flood Peak at Kehelgamu Oya (Site E, CA = 176km2)
Return Period 50 100 200 1,000 by Unit Hydrograph 824 929 1,187 1,297 by Frequency analysis of Peak flow 774 884 998 1,304 Design Flood 830 930 1,190 1,310
10.3 Estimation of Design Sediment Yield
The sediment yield of 350 m3/km2/year was adopted as the design sediment yield for Broadlands project taking into account 1) design and measurement values of other project in Sri Lanka, 2) estimation using measurement values, and 3) estimation using standard formula.
The Study of Hydropower Optimization in Sri Lanka
Final Report11 - 1
11. GEOLOGY AND SEISMICITY
11.1 Geology
11.1.1 Topography and Geology
The Broadlands Hydropower Project area is located in the Central Highlands, approximately 50 km east of Colombo City. The area is widely underlain by Pre-Cambrian gneiss. Two tributaries of the Kelani River, the Maskeliya Oya and Kehelgamu Oya, originate from the southwest slope of Mt. Kerigalpota (2,395 m) and flow northwestward. They join each other immediately downstream of the dam site E forming the Kelani River. After the confluence, the Kelani River flows to the west, and thence flows into the Indian Ocean, about 5 km to the north of Colombo City.
The Kelani River forms a deep valley at the Project area. The riverbed is at an elevation of approximately 100 m in this area and the slopes on both banks rise to ridges of higher than 500 m in elevation. The Maskeliya Oya and Kehelgamu Oya form narrow valleys of about 50 meters wide at the riverbed, while the riverbed of the Kelani River ranges from 70 to 100 m in general.
The project area is located in the Central Highlands underlain by the Pre-Cambrian metamorphic rocks belonging to the Highland series. The bedrock of the project area consists mainly of Precambrian gneiss, intercalated with thin bands of quartzite and limestone lenses (marble).
The Precambrian rocks are complexly folded due to several episodes of metamorphism and deformation. The project area lies on the eastern limb of the Kitulgala syncline with a fold axis extending N-S to NNW-SSE. The foliation in the project area strikes mainly N-S, and dips steeply westward at the dam site E (80°) and gently dips in the vicinity of the powerhouse (30-40°).
Weathering is generally intense on the hillslopes of the project area, but it is less pronounced on the steep left bank of the Kelani River (the proposed tunnel route). The thickness of completely weathered rocks or residual soil reaches 20 to 30 m at the proposed dam site B, C and D.
Although no exposure of fault has been observed, two distinct lineaments considered as shear zones are clearly visible. One is a NNW-SSE lineament running through the cut-and-cover conduit, the portal of the main tunnel area and the proposed dam site A, and the other is an E-W lineament running through a saddle on the right bank downstream the proposed dam site D.
11.1.2 Physical and Mechanical Properties
In this study, rocks are classified on the basis of a criteria developed by CRIEP (Tanaka, 1964). The features and expectable physico-mechanical properties of the rock classes are shown in the following table.

The Study of Hydropower Optimization in Sri Lanka
Final Report11 - 2
Modulus of Deformation
Modulus of Elasticity Cohesion Int. Friction
Angle
P-wave Seismic Velocity Class
(MPa) (MPa) (MPa) (Degree) (km/sec) B 5,000 8,000 3.0 45+ 4.0+
CH 3,000 5,000 2.2 40 4.0+ CM 1,000 2,000 1.5 35 4.0 CL 300 800 0.7 30 2.5 D 50 150 0.2 25 1.5
11.1.3 Geo-Technical Assessment
Dam site E is situated on a narrow valley of about 60 m wide at the riverbed with steep slopes of about 40 degrees on the left bank and 50 degrees on the right bank. The bedrock that consists of charnockitic gneiss is adequate in bearing capacity and permeability for a concrete gravity dam.
No landslide was observed on the dam site or the reservoir. Core drilling DT-2 and detailed ground mapping revealed that a fractured zone of about 50 m thick extended through the col downstream on right bank toward the Kehelgamu Oya. Limestone was observed in the core BB15 on the right bank of the Maskeliya Oya. An additional detailed drilling survey and groundwater analysis to confirm the hydrogeology of the right bank will be necessary.
Although fresh and hard rocks are distributed through a large part of the intake tunnel, completely weathered rocks derived from a landslide are found around the outlet portal of the tunnel. A shift of the tunnel outlet toward the Kelani River side will be necessary to avoid the landslide.
The bedrock of the cut-and-cover conduit area is underlain by gneiss, limestone and fracture zone. Terrace deposits and talus deposits of 5-7 meters thick cover almost all of this area. Relatively thick sandy materials and fragments of weathered gneiss rocks were distributed on the cut-and-cover conduit area and the depth of hard bedrock averages about 15-20 m. Deep excavations for the foundation of the conduit will result in cost overruns and be unfeasible. An in-situ rock deformability test loading test will be required to confirm the foundation stability of the conduit on the weathered zone. An additional detailed drilling survey will also be required to confirm the depth of the excavation and to ensure the slope stability, and the geological condition of the landslide remains unclear, since the base of the conduit foundation in the tributaries and the fracture zone will not be even.
The inlet portal of the main tunnel is situated in a small valley. The inlet portal area is situated in the fracture zone, and the tunnel alignment from inlet portal to sp1012 will encounter highly weathered rocks (CL-D class). An additional drilling work will be required for the detailed design of the inlet portal, since the thickness and conditions of the fracture zone and overburden at the tunnel portal have remained unknown.
The main tunnel will be encountered to penetrate relatively hard rocks (B-CH class). Assessed weak zones along the main tunnel alignment are shown in the following table.
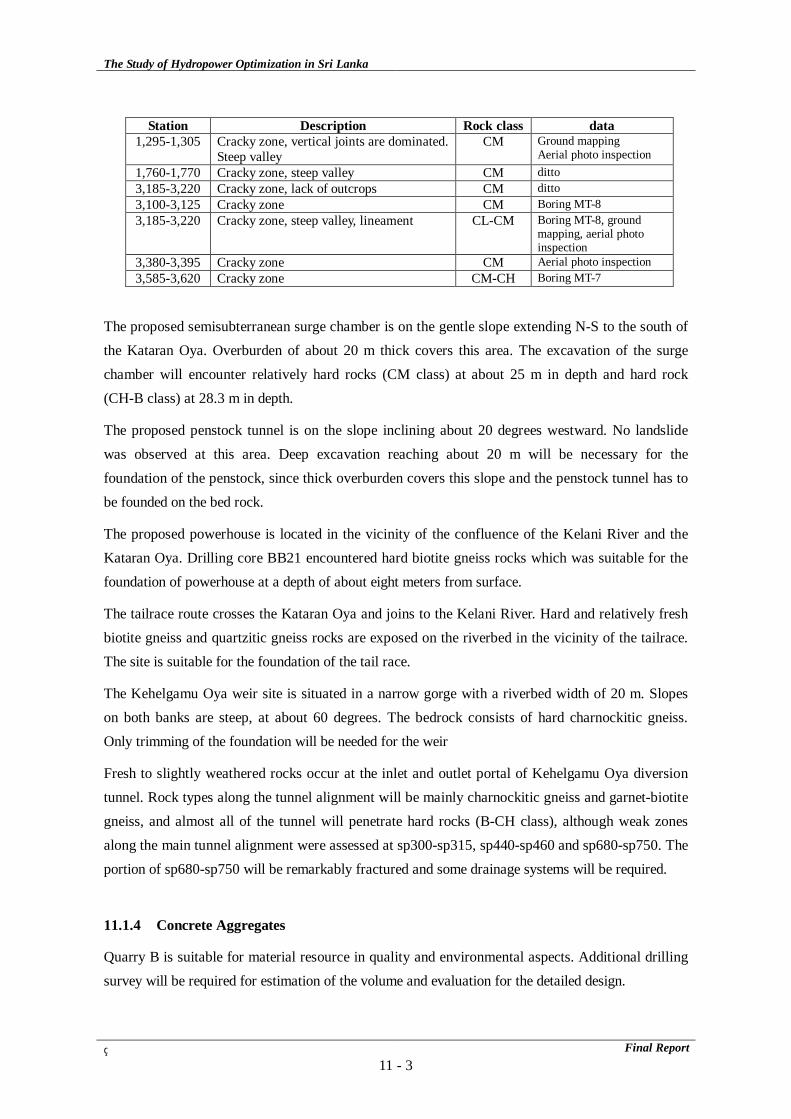
The Study of Hydropower Optimization in Sri Lanka
Final Report11 - 3
Station Description Rock class data
1,295-1,305 Cracky zone, vertical joints are dominated.Steep valley
CM Ground mapping Aerial photo inspection
1,760-1,770 Cracky zone, steep valley CM ditto 3,185-3,220 Cracky zone, lack of outcrops CM ditto 3,100-3,125 Cracky zone CM Boring MT-8 3,185-3,220 Cracky zone, steep valley, lineament CL-CM Boring MT-8, ground
mapping, aerial photo inspection
3,380-3,395 Cracky zone CM Aerial photo inspection 3,585-3,620 Cracky zone CM-CH Boring MT-7
The proposed semisubterranean surge chamber is on the gentle slope extending N-S to the south of the Kataran Oya. Overburden of about 20 m thick covers this area. The excavation of the surge chamber will encounter relatively hard rocks (CM class) at about 25 m in depth and hard rock (CH-B class) at 28.3 m in depth.
The proposed penstock tunnel is on the slope inclining about 20 degrees westward. No landslide was observed at this area. Deep excavation reaching about 20 m will be necessary for the foundation of the penstock, since thick overburden covers this slope and the penstock tunnel has to be founded on the bed rock.
The proposed powerhouse is located in the vicinity of the confluence of the Kelani River and the Kataran Oya. Drilling core BB21 encountered hard biotite gneiss rocks which was suitable for the foundation of powerhouse at a depth of about eight meters from surface.
The tailrace route crosses the Kataran Oya and joins to the Kelani River. Hard and relatively fresh biotite gneiss and quartzitic gneiss rocks are exposed on the riverbed in the vicinity of the tailrace. The site is suitable for the foundation of the tail race.
The Kehelgamu Oya weir site is situated in a narrow gorge with a riverbed width of 20 m. Slopes on both banks are steep, at about 60 degrees. The bedrock consists of hard charnockitic gneiss. Only trimming of the foundation will be needed for the weir
Fresh to slightly weathered rocks occur at the inlet and outlet portal of Kehelgamu Oya diversion tunnel. Rock types along the tunnel alignment will be mainly charnockitic gneiss and garnet-biotite gneiss, and almost all of the tunnel will penetrate hard rocks (B-CH class), although weak zones along the main tunnel alignment were assessed at sp300-sp315, sp440-sp460 and sp680-sp750. The portion of sp680-sp750 will be remarkably fractured and some drainage systems will be required.
11.1.4 Concrete Aggregates
Quarry B is suitable for material resource in quality and environmental aspects. Additional drilling survey will be required for estimation of the volume and evaluation for the detailed design.
The Study of Hydropower Optimization in Sri Lanka
Final Report11 - 4
11.2 Seismicity
No active fault or active structures have been identified in the Central Highlands of Sri Lanka by the previous survey or the data on earthquakes.
The biggest earthquake in Sri Lanka (within 500 km area of the project area) asince 1973 was magnitude 5.9, according to the U S Geological Survey. The said earthquake occurred in 1973 in the Indian Sea to the west of Sri Lanka. No earthquake of more than magnitude 4.0 has broken out within 100 kilometers of the project area.
A value of 0.1g may be adopted for Broadlands project. Vertical acceleration may be taken half of the horizontal.
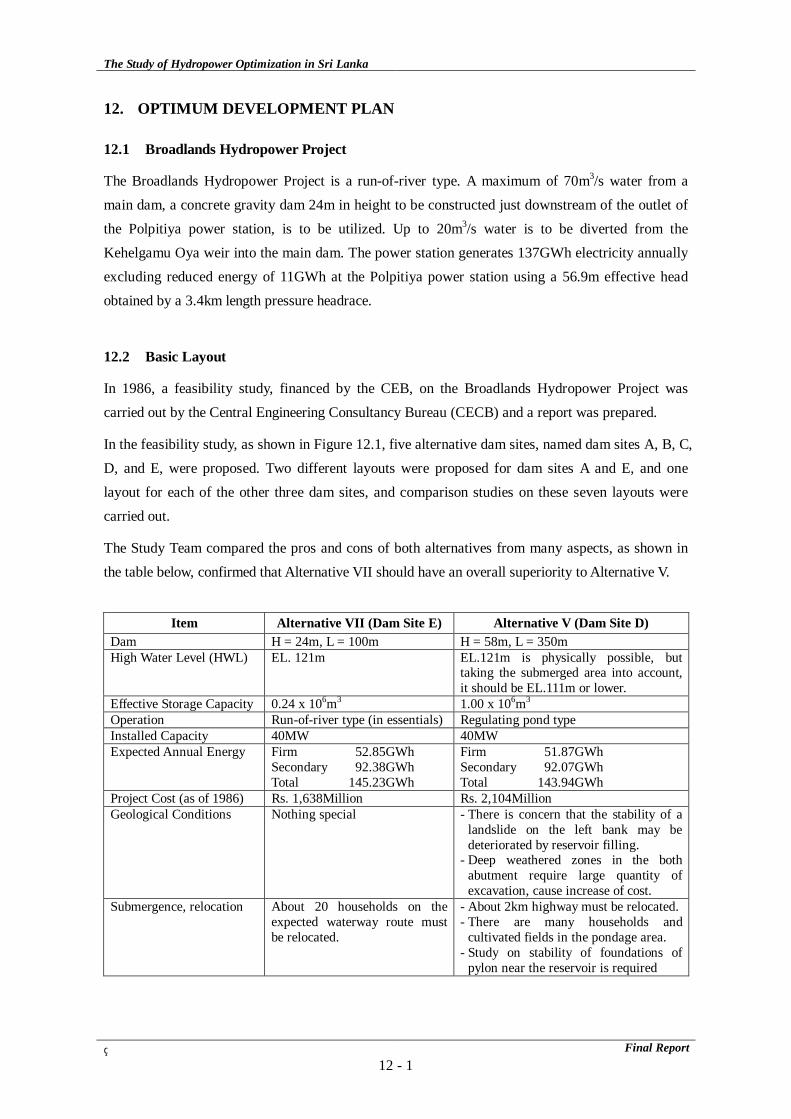
The Study of Hydropower Optimization in Sri Lanka
Final Report12 - 1
12. OPTIMUM DEVELOPMENT PLAN
12.1 Broadlands Hydropower Project
The Broadlands Hydropower Project is a run-of-river type. A maximum of 70m3/s water from a main dam, a concrete gravity dam 24m in height to be constructed just downstream of the outlet of the Polpitiya power station, is to be utilized. Up to 20m3/s water is to be diverted from the Kehelgamu Oya weir into the main dam. The power station generates 137GWh electricity annually excluding reduced energy of 11GWh at the Polpitiya power station using a 56.9m effective head obtained by a 3.4km length pressure headrace.
12.2 Basic Layout
In 1986, a feasibility study, financed by the CEB, on the Broadlands Hydropower Project was carried out by the Central Engineering Consultancy Bureau (CECB) and a report was prepared.
In the feasibility study, as shown in Figure 12.1, five alternative dam sites, named dam sites A, B, C, D, and E, were proposed. Two different layouts were proposed for dam sites A and E, and one layout for each of the other three dam sites, and comparison studies on these seven layouts were carried out.
The Study Team compared the pros and cons of both alternatives from many aspects, as shown in the table below, confirmed that Alternative VII should have an overall superiority to Alternative V.
Item Alternative VII (Dam Site E) Alternative V (Dam Site D)
Dam H = 24m, L = 100m H = 58m, L = 350m High Water Level (HWL) EL. 121m EL.121m is physically possible, but
taking the submerged area into account, it should be EL.111m or lower.
Effective Storage Capacity 0.24 x 10⁶m3 1.00 x 10⁶m3 Operation Run-of-river type (in essentials) Regulating pond type Installed Capacity 40MW 40MW Expected Annual Energy Firm 52.85GWh
Secondary 92.38GWh Total 145.23GWh
Firm 51.87GWh Secondary 92.07GWh Total 143.94GWh
Project Cost (as of 1986) Rs. 1,638Million Rs. 2,104Million Geological Conditions Nothing special - There is concern that the stability of a
landslide on the left bank may be deteriorated by reservoir filling.
- Deep weathered zones in the both abutment require large quantity of excavation, cause increase of cost.
Submergence, relocation About 20 households on the expected waterway route must be relocated.
- About 2km highway must be relocated.- There are many households and
cultivated fields in the pondage area. - Study on stability of foundations of
pylon near the reservoir is required
The Study of Hydropower Optimization in Sri Lanka
Final Report12 - 2
12.3 Comparison Study of Optimal Scale
(1) Method of Comparative Study
A study on dam height, that is, pondage storage capacity, is meaningless because the upper limit is obvious from the aspect of topographical feature of the project that is to avoid the effect to the Polpitiya power station located upstream.
Basically the tailwater level of the project should be located as far downstream as possible in order to obtain a more effective head, but this is not possible due to the limitations of the topography.
Therefore the optimization of the project can be integrated into that of the optimal scale, that is, the optimal maximum discharge.
(2) Energy Calculation
Daily energy calculations were done for 48-year using daily discharge data from October 1950 to September 1998. Output for required peak generation time with at least 95% probability by using 198,000m3 storage capacity was regarded as a firm output.
(3) Capacity of Diversion Tunnel from Kehelgamu Oya
The maximum capacity of the diversion tunnel from the Kehelgamu Oya was fixed at 20m3/s as the optimal capacity.
(4) Comparison Study of Alternative Scale
Alternatives for capacity scale are shown in table below. For all cases, the same layout, effective head and efficiencies are applied. Only the maximum discharge varies from 40m3/s to 80m3/s at intervals of 10m3/s.
Energy deduction at the Polpitiya power station was estimated to be 11.1GWh annually.
Study Case for Comparison Study
Case 1 Case 2 Case 3 Case 4 Case 5 Installed Capacity (MW) 20 25 30 35 40 Max. Discharge (m3/s) 40 50 60 70 80 Effective Head (m) 56.9
Project costs for five cases are shown in Table 12.3, and expected annual energy and firm peak output are shown in table below.
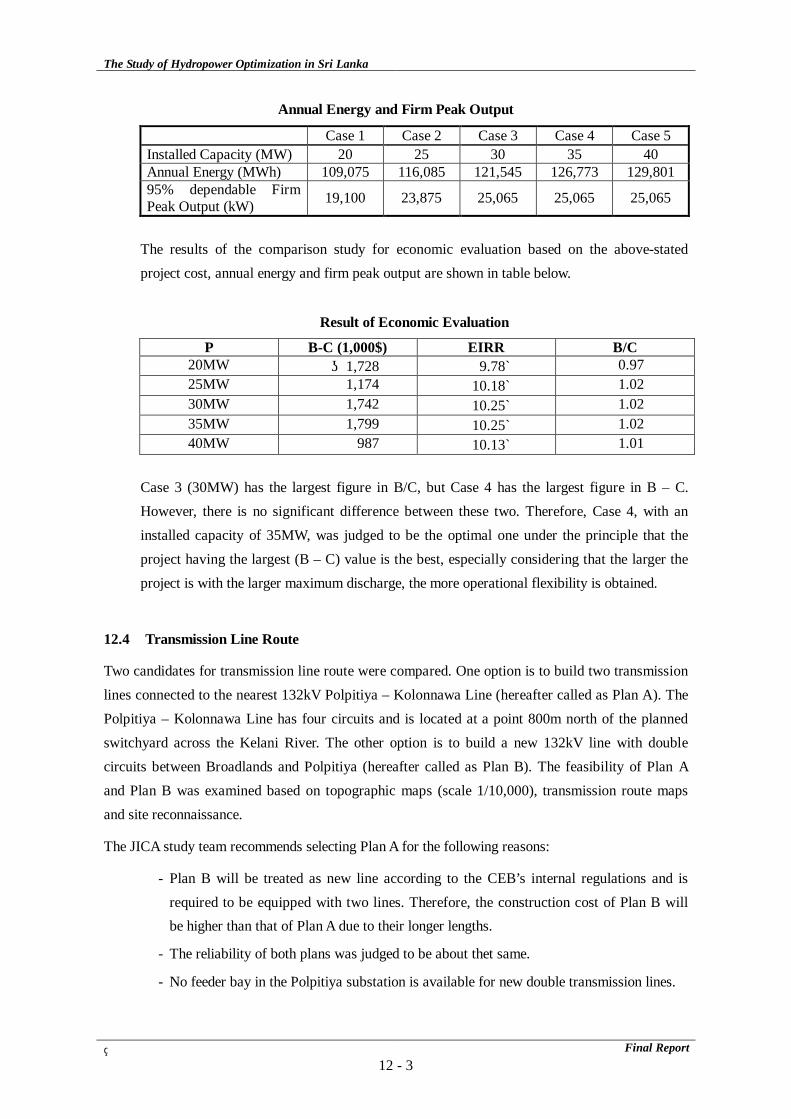
The Study of Hydropower Optimization in Sri Lanka
Final Report12 - 3
Annual Energy and Firm Peak Output
Case 1 Case 2 Case 3 Case 4 Case 5 Installed Capacity (MW) 20 25 30 35 40 Annual Energy (MWh) 109,075 116,085 121,545 126,773 129,801 95% dependable Firm Peak Output (kW) 19,100 23,875 25,065 25,065 25,065
The results of the comparison study for economic evaluation based on the above-stated project cost, annual energy and firm peak output are shown in table below.
Result of Economic Evaluation
P B-C (1,000$) EIRR B/C 20MW ‐1,728 9.78% 0.97 25MW 1,174 10.18% 1.02 30MW 1,742 10.25% 1.02 35MW 1,799 10.25% 1.02 40MW 987 10.13% 1.01
Case 3 (30MW) has the largest figure in B/C, but Case 4 has the largest figure in B – C. However, there is no significant difference between these two. Therefore, Case 4, with an installed capacity of 35MW, was judged to be the optimal one under the principle that the project having the largest (B – C) value is the best, especially considering that the larger the project is with the larger maximum discharge, the more operational flexibility is obtained.
12.4 Transmission Line Route
Two candidates for transmission line route were compared. One option is to build two transmission lines connected to the nearest 132kV Polpitiya – Kolonnawa Line (hereafter called as Plan A). The Polpitiya – Kolonnawa Line has four circuits and is located at a point 800m north of the planned switchyard across the Kelani River. The other option is to build a new 132kV line with double circuits between Broadlands and Polpitiya (hereafter called as Plan B). The feasibility of Plan A and Plan B was examined based on topographic maps (scale 1/10,000), transmission route maps and site reconnaissance.
The JICA study team recommends selecting Plan A for the following reasons:
- Plan B will be treated as new line according to the CEB’s internal regulations and is required to be equipped with two lines. Therefore, the construction cost of Plan B will be higher than that of Plan A due to their longer lengths.
- The reliability of both plans was judged to be about thet same.
- No feeder bay in the Polpitiya substation is available for new double transmission lines.

The Study of Hydropower Optimization in Sri Lanka
Final Report13 - 1
13. DESIGN OF CIVIL STRUCTURES AND ELECTRO-MECHANICAL EQUIPMENT
13.1 Dam and Ancillary Structures
The damsite is located just downstream from the Polpitiya power station.
Since the river width is narrow and the river cross section is V-shaped, and the foundation rock has satisfactory strength, a concrete gravity dam is most suitable for this damsite.
In addition to topographical and geological conditions, considering river diversion during construction and the small storage capacity for sediment, there is little choice but to construct a concrete gravity dam having a spillway with an overflow crest at a relatively low elevation, not only for flood discharge but for flushing of sediment.
The maximum water level of the reservoir should be set at a level at which serious damage to the Polpitiya power station by submergence of its main equipment is not a concern even when the design flood of the dam (10,000 year return period flood) hits the dam. Therefore, the maximum flood water level (MFL) was set at EL.122.0m, and the full supply water level (FSL) was set at EL.121.0m. The spillway has three radial (taintor) gates 15.0m in height and 7.2m in width, and is capable of releasing a discharge of 1,910m3/sec (10,000-year return period flood) at MFL (EL.122.0m). It is also capable of releasing a 1,000-year return period flood safely even in the case of one of the spillway gates not working.
13.2 Waterway and Powerhouse
The power intake is located on the left bank around 60m upstream from the dam; the sill of portal is set at EL.109.0m. Since it is 2.0m higher that the crest elevation of the spillway which has a sediment flushing function, there is little concern about sediment flowing into the intake.
The headrace consists of the following three parts, the intake tunnel, the cut-and-cover conduit and the main unnel, in order from the upstream side.
The intake tunnel is a standard horseshoe-shaped-type reinforced concrete-lined tunnel connecting the intake and cut-and-cover conduit. Its length is 150m and the inner diameter is 5.4m.
The intake tunnel and the main tunnel, described below, are connected with a 720m-long cut-and-cover reinforced concrete conduit, which has a circular cross section with an inner diameter of 5.0m. The conduit makes up around 20% of the total length of the headrace.
This conduit is constructed at a shallow depth below the ground surface. The surrounding groundwater level is expected lower than the water head in the conduit, so there is concern about water leakage through small cracks in the concrete. Steel lining is installed to eliminate this concern.
The Study of Hydropower Optimization in Sri Lanka
Final Report13 - 2
The main tunnel is the downstream part of the headrace with a length of 2,535m, connecting the cut-and-cover conduit and the surge chamber. Like the intake tunnel, this tunnel is a standard horseshoe-shape reinforced concrete-lined tunnel with a diameter of 5.4m.
The surge chamber is an orifice type. The diameters of the chamber and shaft were decided to be 18.0m and 5.4m, respectively.
A simulation of surging shows that the maximum water level in the surge chamber is EL.130.97m and the minimum water level is EL.103.35m.
The inner diameter of the penstock is 4.6m before bifurcation. It bifurcates into two 3.3m lines just upstream of the powerhouse. The total lengths, including the 4.6m section, are 243m and 248m.
The tailrace is a trapezoidal open channel with a length of about 350m and a bottom width of 24m. Just downstream of the powerhouse, the Kataran Oya runs across the route of the tailrace and flows into the Kelani Ganga. Therefore, an aqueduct crossing over the tailrace channel is constructed to make the Kataran Oya flow into the Kelani Ganga directly.
The Kehelgamu weir, which diverts the water of the Kehelgamu Oya to the Maskeliya Oya, is located about 700m upstream from the confluence of the Kehelgamu and the Maskeliya Oya. The weir is a concrete gravity type, 19m in height and 48m in crest length.
The Kehelgamu Oya diversion tunnel is a concrete-lined non-pressure tunnel having a flow capacity of 20m3/sec. Its cross section is a bonnet shape 2.7m in width and 2.7m in height, and the length is 811m.
The powerhouse is a typical semi-underground type, located on the left bank of the Kelani Ganga at the confluence of the Kataran Oya, about 4km downstream from the dam.
The powerhouse is 32m in length, 17m in width and 33.2m in height, and consists of a lower part and an upper part. The lower part below EL.66.0m is a reinforced concrete structure and contains the main electro-mechanical equipment. The upper part above EL.66.0m is an architectural structure, and an overhead traveling crane is installed for assembling equipment.
13.3 Electrical and Mechanical Equipment
The Broadlands Hydropower Station has two turbine-generator units and two main power transformer units.
The turbine type is a vertical-shaft, single-runner Francis type with steel spiral case and elbow-type draft tube. The output of the turbine is 18.1MW under a unit discharge of 35m3/sec (100% opening of guide vanes) and a rated effective head of 56.9m.
The material of the runner components should be stainless steel, and one spare runner should be provided for repair work.

The Study of Hydropower Optimization in Sri Lanka
Final Report13 - 3
The inlet diameter of the runner and the runner weight were estimated as 1.6m and 6.8 tons, respectively.
The rated speed of turbine was selected as 300rpm.
The type of generator is a vertical shaft, three-phase synchronous brushless machine with AVR. It has a rated continuous output of 21.9MVA and a lagging power factor of 0.8. The winding of the generator rotor and stator should be Class-F epoxy insulation type. The ventilation of the generator will be an enclosed-hood, air-cooled type with a rim-duct fan system.
The main electro-mechanical equipment of the power station, including the switchyard, should be able to be monitored and controlled both remotely from the Polpitiya power station and directly at the control room of the Broadlands power station.
Two main transformer units are installed at the transformer cage next to the powerhouse. The transformer is an outdoor type, and its rated capacity is 21.9MVA. Rated voltages are 11kV (primary) and 132kV (secondary), and the cooling system is OFAF (forced-oil, air-cooled) type.
The type of power transformer, single-phase or three-phase, will be decided at the detail design stage.
The switchyard consists of a 132kV single-bus system, including bus section circuit breakers, disconnecting switches and other necessary equipment. The outgoing lines from the switchyard are connected to the No. 3 line of the Kolonnawa-Polpitiya transmission line via the dead-end transmission tower in the switchyard.
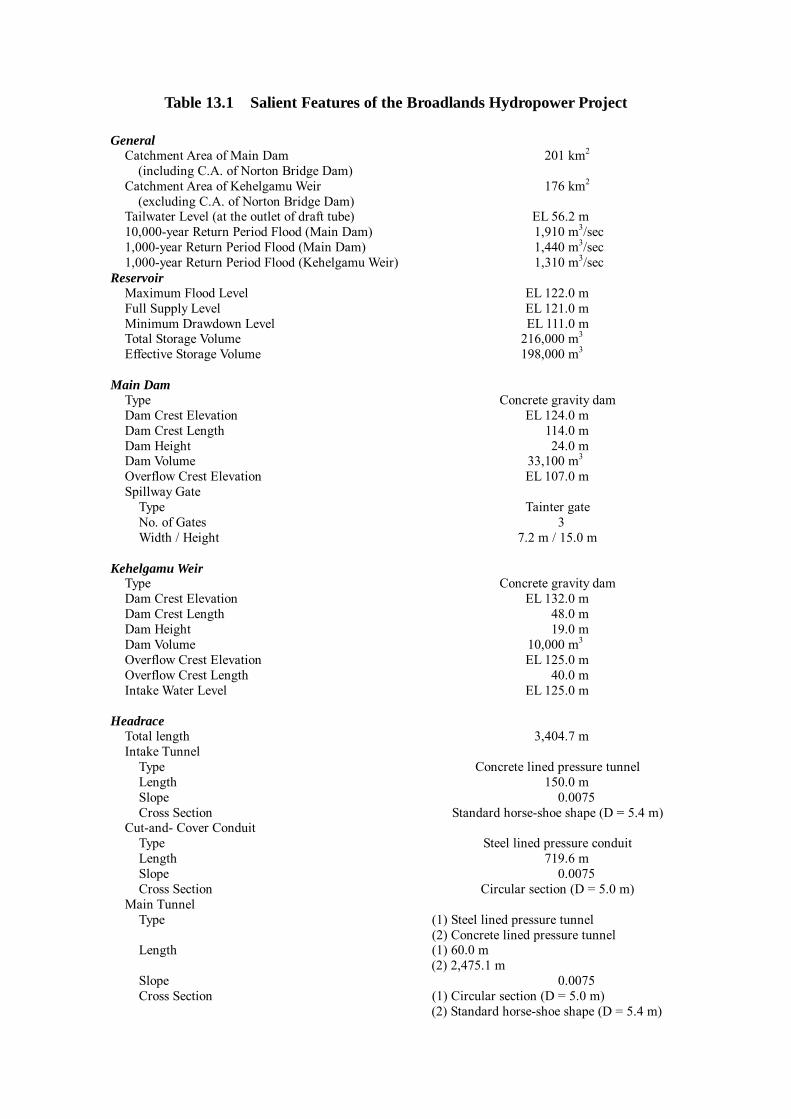
Table 13.1 Salient Features of the Broadlands Hydropower Project
General Catchment Area of Main Dam (including C.A. of Norton Bridge Dam)
201 km2
Catchment Area of Kehelgamu Weir (excluding C.A. of Norton Bridge Dam)
176 km2
Tailwater Level (at the outlet of draft tube) EL 56.2 m 10,000-year Return Period Flood (Main Dam) 1,910 m3/sec 1,000-year Return Period Flood (Main Dam) 1,440 m3/sec 1,000-year Return Period Flood (Kehelgamu Weir) 1,310 m3/sec
Reservoir Maximum Flood Level EL 122.0 m Full Supply Level EL 121.0 m Minimum Drawdown Level EL 111.0 m Total Storage Volume 216,000 m3 Effective Storage Volume 198,000 m3
Main Dam Type Concrete gravity dam Dam Crest Elevation EL 124.0 m Dam Crest Length 114.0 m Dam Height 24.0 m Dam Volume 33,100 m3 Overflow Crest Elevation EL 107.0 m Spillway Gate
Type Tainter gate No. of Gates 3 Width / Height 7.2 m / 15.0 m
Kehelgamu Weir
Type Concrete gravity dam Dam Crest Elevation EL 132.0 m Dam Crest Length 48.0 m Dam Height 19.0 m Dam Volume 10,000 m3 Overflow Crest Elevation EL 125.0 m Overflow Crest Length 40.0 m Intake Water Level EL 125.0 m
Headrace Total length 3,404.7 m Intake Tunnel
Type Concrete lined pressure tunnel Length 150.0 m Slope 0.0075 Cross Section Standard horse-shoe shape (D = 5.4 m)
Cut-and- Cover Conduit Type Steel lined pressure conduit Length 719.6 m Slope 0.0075 Cross Section Circular section (D = 5.0 m)
Main Tunnel Type (1) Steel lined pressure tunnel
(2) Concrete lined pressure tunnel Length (1) 60.0 m
(2) 2,475.1 m Slope 0.0075 Cross Section (1) Circular section (D = 5.0 m)
(2) Standard horse-shoe shape (D = 5.4 m)
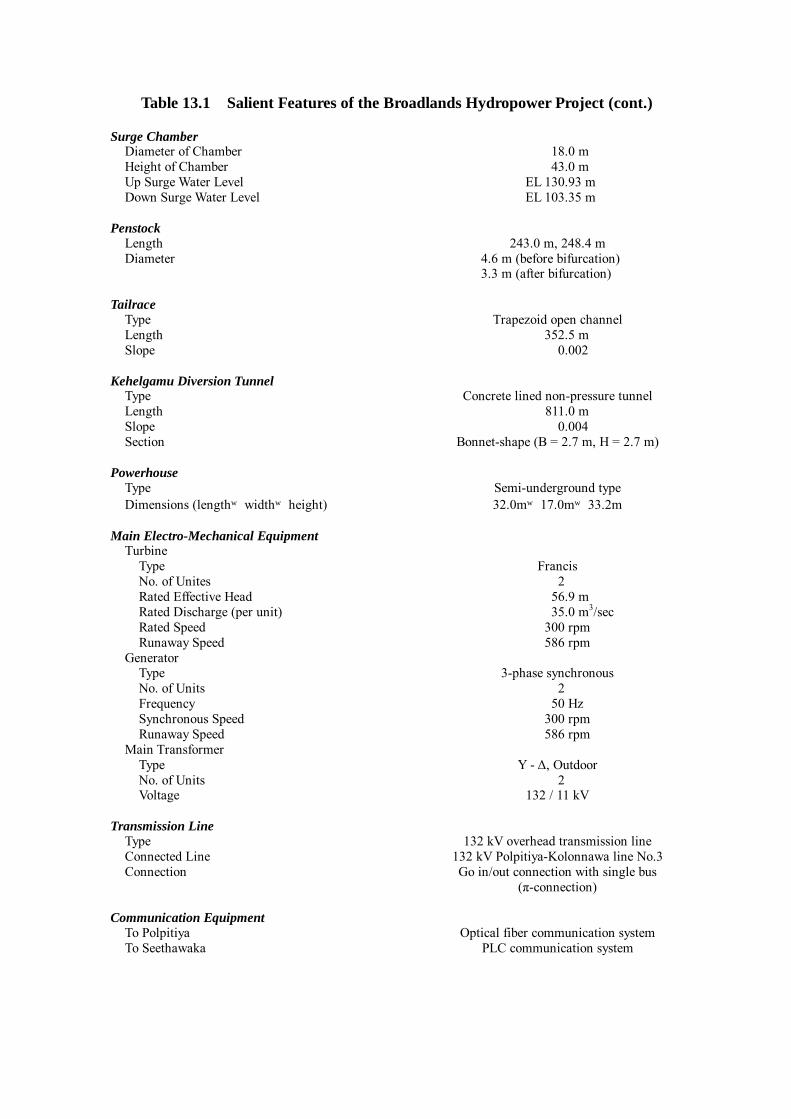
Table 13.1 Salient Features of the Broadlands Hydropower Project (cont.) Surge Chamber
Diameter of Chamber 18.0 m Height of Chamber 43.0 m Up Surge Water Level EL 130.93 m Down Surge Water Level EL 103.35 m
Penstock Length 243.0 m, 248.4 m Diameter 4.6 m (before bifurcation)
3.3 m (after bifurcation)
Tailrace Type Trapezoid open channel Length 352.5 m Slope 0.002
Kehelgamu Diversion Tunnel Type Concrete lined non-pressure tunnel Length 811.0 m Slope 0.004 Section Bonnet-shape (B = 2.7 m, H = 2.7 m)
Powerhouse Type Semi-underground type Dimensions (length×width×height) 32.0m×17.0m×33.2m
Main Electro-Mechanical Equipment Turbine
Type Francis No. of Unites 2 Rated Effective Head 56.9 m Rated Discharge (per unit) 35.0 m3/sec Rated Speed 300 rpm Runaway Speed 586 rpm
Generator Type 3-phase synchronous No. of Units 2 Frequency 50 Hz Synchronous Speed 300 rpm Runaway Speed 586 rpm
Main Transformer Type Y - ∆, Outdoor No. of Units 2 Voltage 132 / 11 kV
Transmission Line
Type 132 kV overhead transmission line Connected Line 132 kV Polpitiya-Kolonnawa line No.3 Connection Go in/out connection with single bus
(π-connection)
Communication Equipment To Polpitiya Optical fiber communication system To Seethawaka PLC communication system
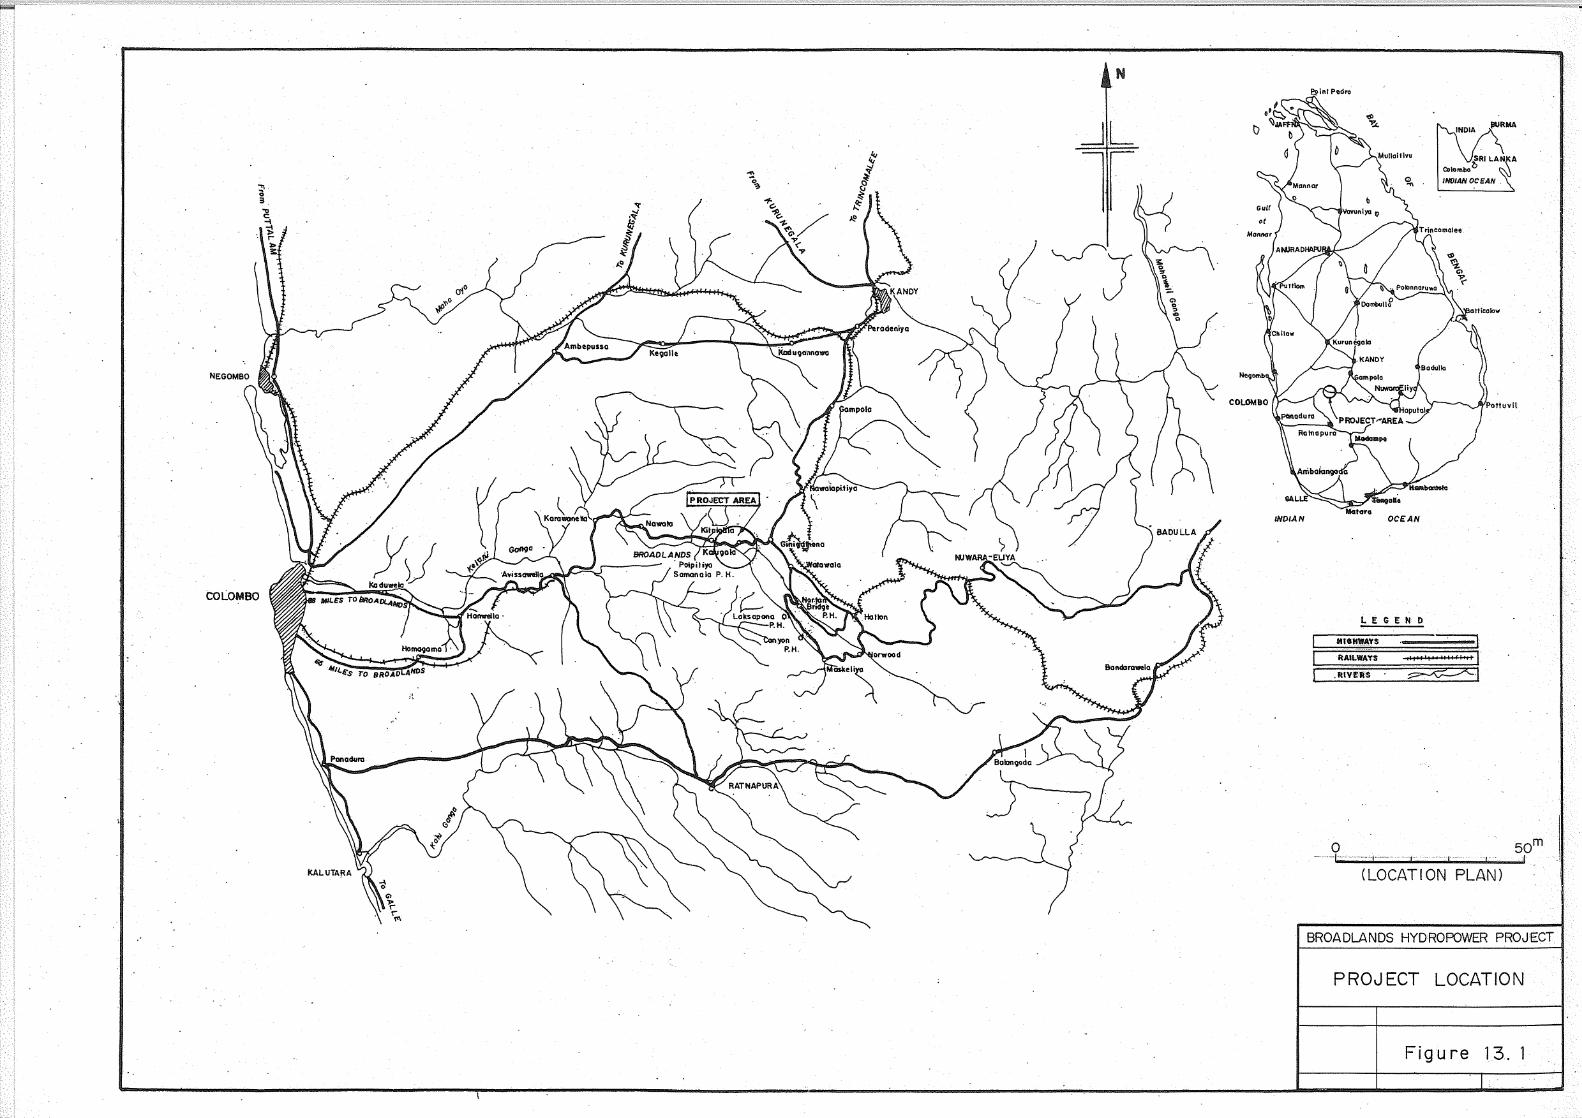
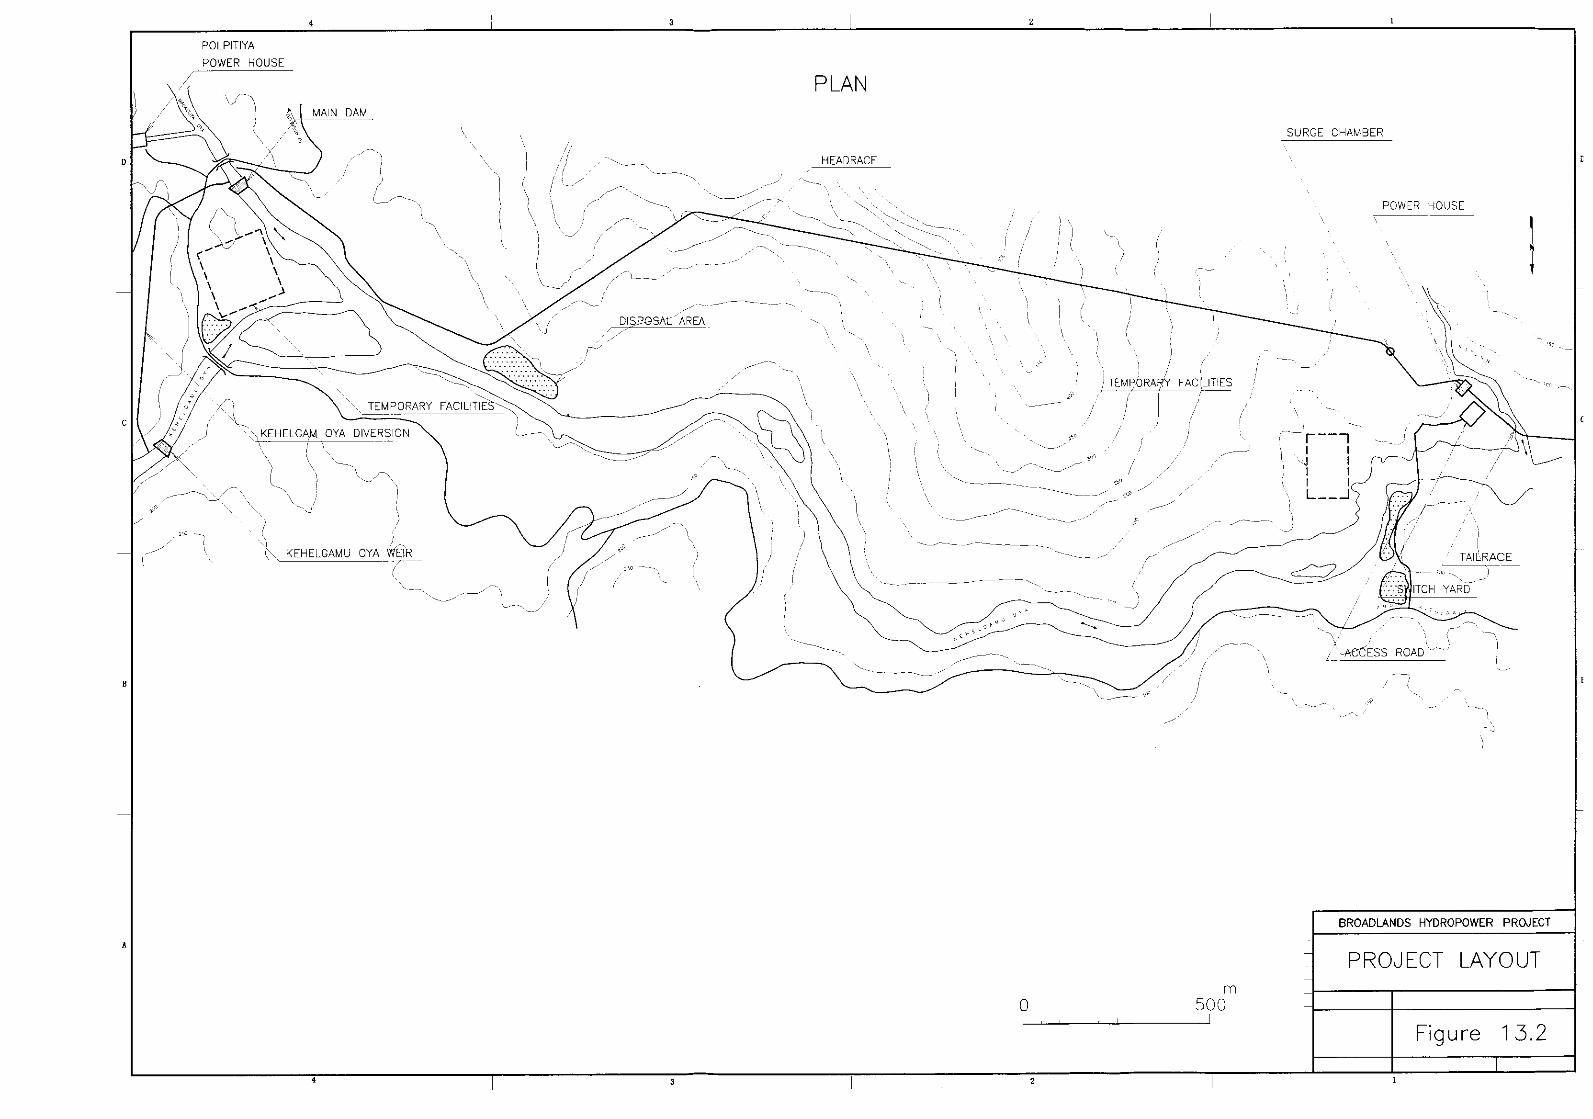
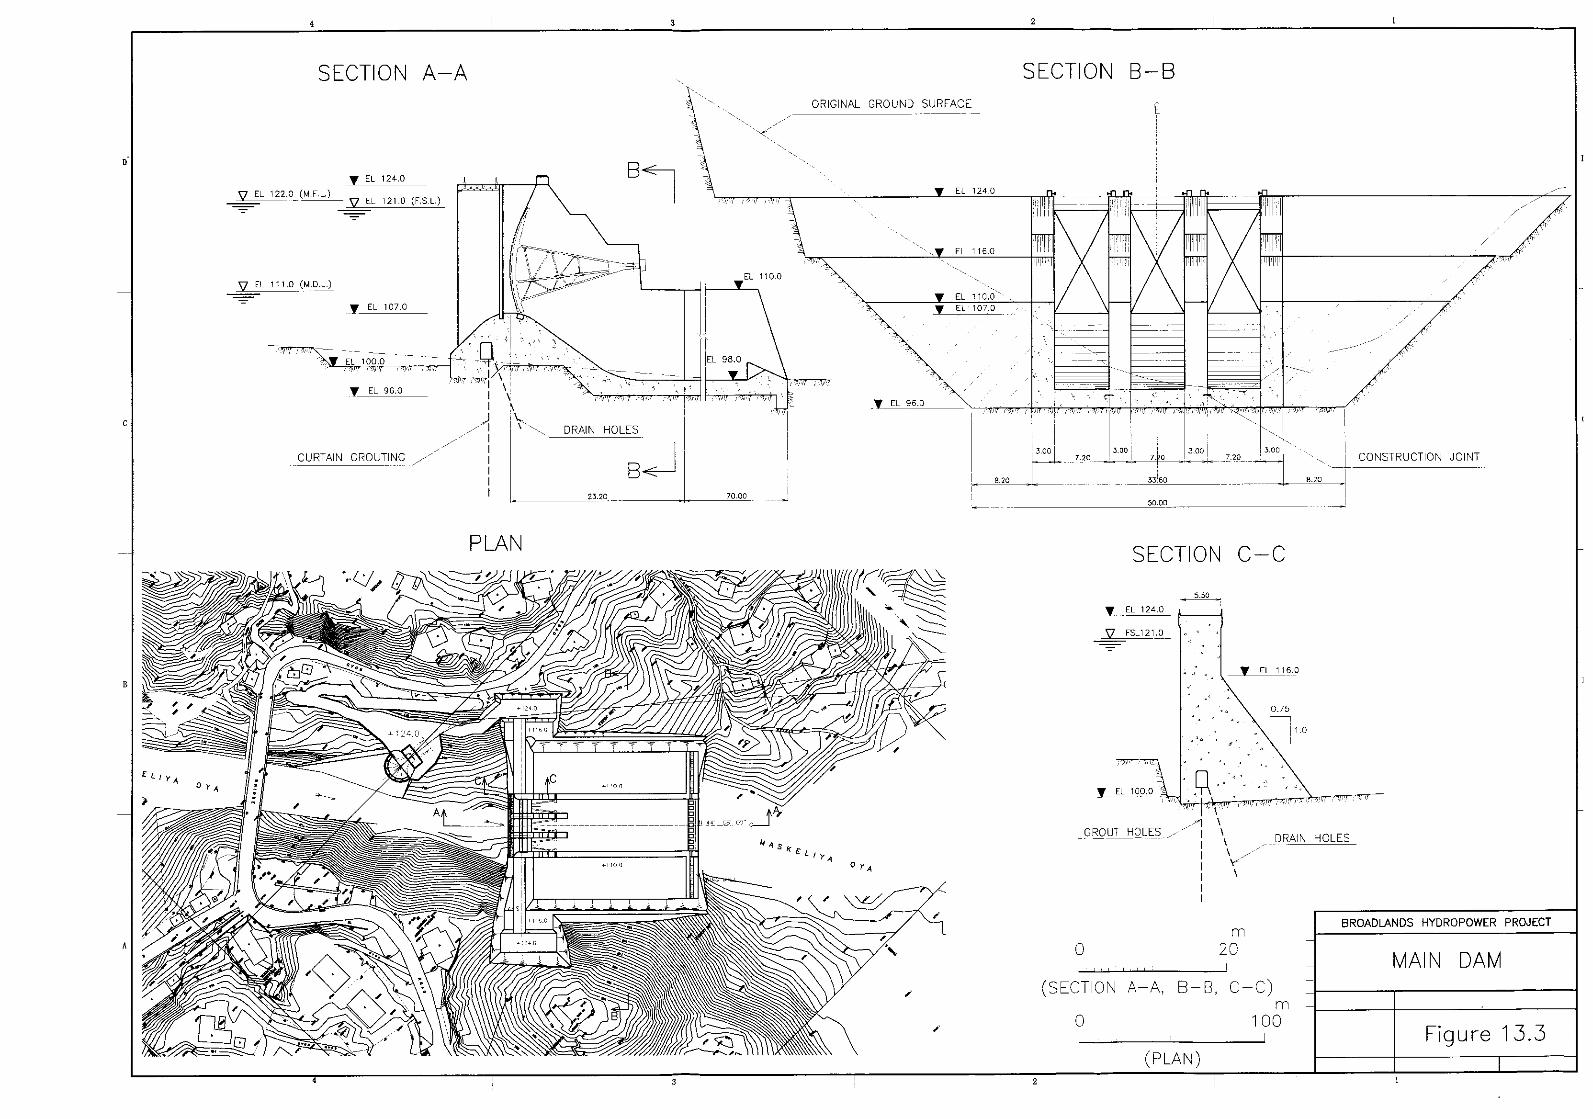
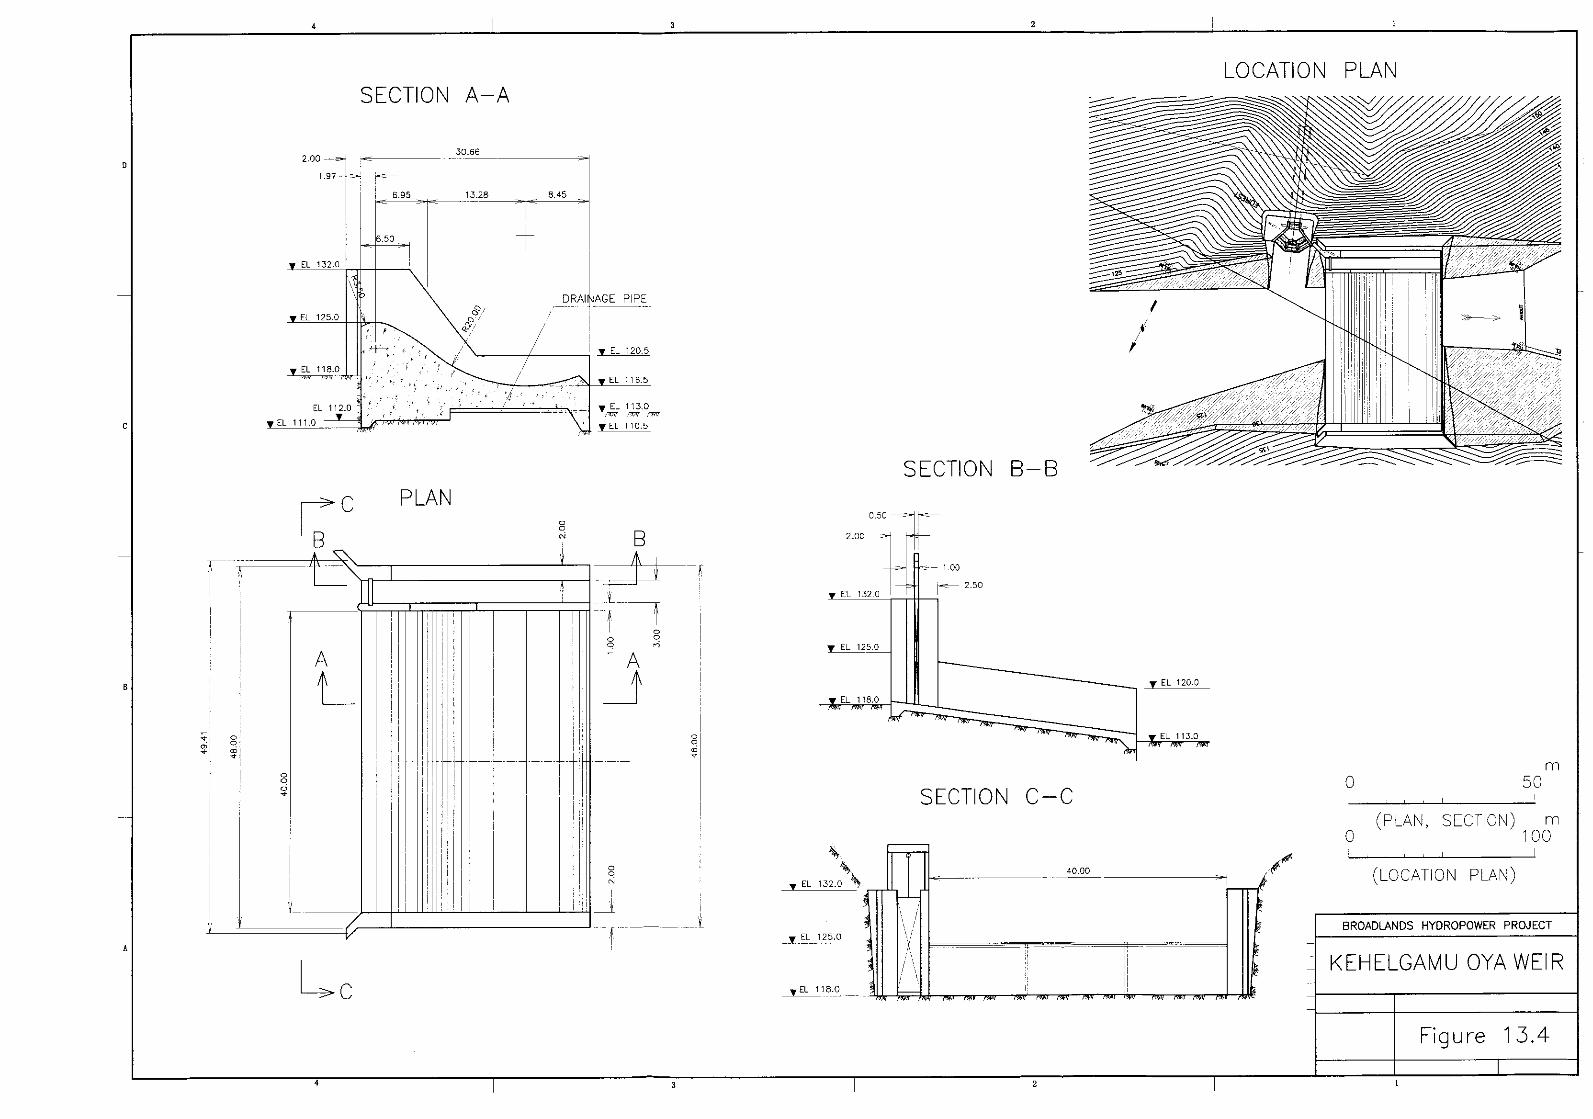
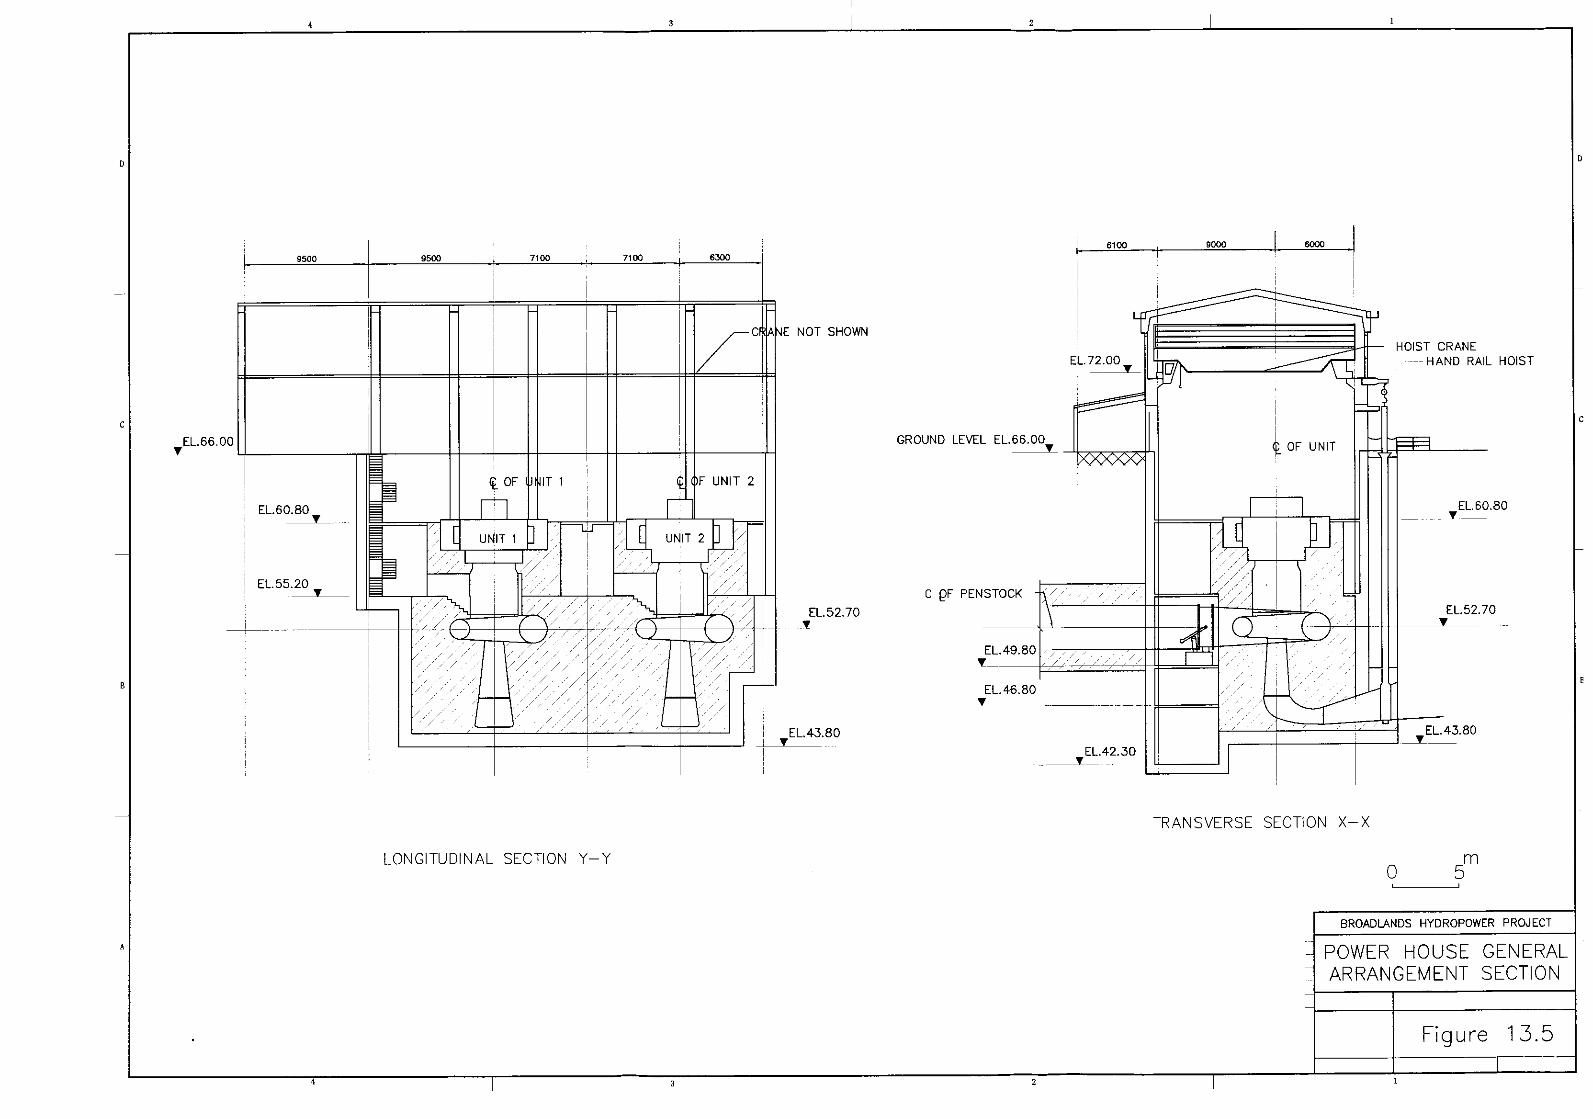

The Study of Hydropower Optimization in Sri Lanka
Interim Report14 - 1
14. CONSTRUCTION PLAN AND CONSTRUCTION COST ESTIMATE
14.1 Outline of Construction Works
The main structures to be established under the project comprise a 24m-high concrete gravity dam, a single-line waterway 5.00 to 5.40m in diameter, and an above-ground powerhouse. The total volume of excavation required in constructing these structures is approximately 700,000m3. Concrete volume for the main dam is roughly 33,000m3 while that for other main structures is roughly 62,000m3.
The construction plan and the construction schedule have been proposed based on the above basic criteria and construction quantities. The main tunnel construction work comprises the critical path under the project construction schedule. The project construction schedule is shown in Figure 14.1.
The structures to be constructed under the project are as follows.
Main Dam Concrete Gravity, Height: 24m, Crest Length: 114.0m Headrace (pressured)
Intake Tunnel Standard horse-shoe shape, D = 5.4m, L = 150.0m, Single line Cut-and-Cover Conduit Circular section, D = 5.0m, L = 719.6m, Single line Main Tunnel Circular section, D = 5.0m, L = 60m, Single line Standard horse-shoe shape, D = 5.4m, L = 2,475.1m, Single Line
Surge Chamber Restricted Orifice Type, D = 18.0m, Height = 43.0m Penstock Partially Embedded, one to two lines, L = 250m, D = 4.6m -3.3m Powerhouse Above-Ground Type, Width: 17.0m, Length: 32.0m, Height: 33.2m Switchyard Open, Width: 40m, Length 55m Tailrace Trapezoid open channel, Width: 7.40m, L = 352.5m Kehelgamu Weir Concrete Gravity, Height: 19m, Crest Length: 48.0m Kehelgamu Diversion Tunnel (non-pressure)
Bonnet-shape, D = 5.4m, L = 811.0m, Single Line
14. 2 Construction Cost Estimate
The construction cost has been estimated by applying the following basic criteria, and reflects site meteorology and geology, general area conditions and construction scale.
(1) Unit prices of materials, labor and equipment that constitute the unit cost of the work items are based on the price level in 2003.
The currency exchange rates in September 2003 are:

The Study of Hydropower Optimization in Sri Lanka
Interim Report14 - 2
US$1 = Rupees 96 = Yen 120
(2) The administration cost and engineering costs are estimated at 2% and 13% of the total direct cost, respectively.
(3) A physical contingency is provided to cope with unforeseen physical conditions. The physical contingency is assumed to be 10% for the foreign and local currency portion of the estimated items of preparatory works, environmental mitigation measures and civil works, and 5% for hydro-mechanical equipment, electro-mechanical equipment and transmission lines.
(4) All cost are given in local and foreign components and are expressed in US dollars.
(5) The unit prices and lump sum items include taxes incurred in the country of origin. For imported materials or equipment, local taxes and customs duties are not included.
(6) Price increases and interest during the construction period are not included in the project cost.
The project cost as estimated based on the above criteria is US$89,340,000.
A breakdown of the project cost is given in Table 14.1 and annual required funding (disbursement schedule) is indicated in Table 14.2.
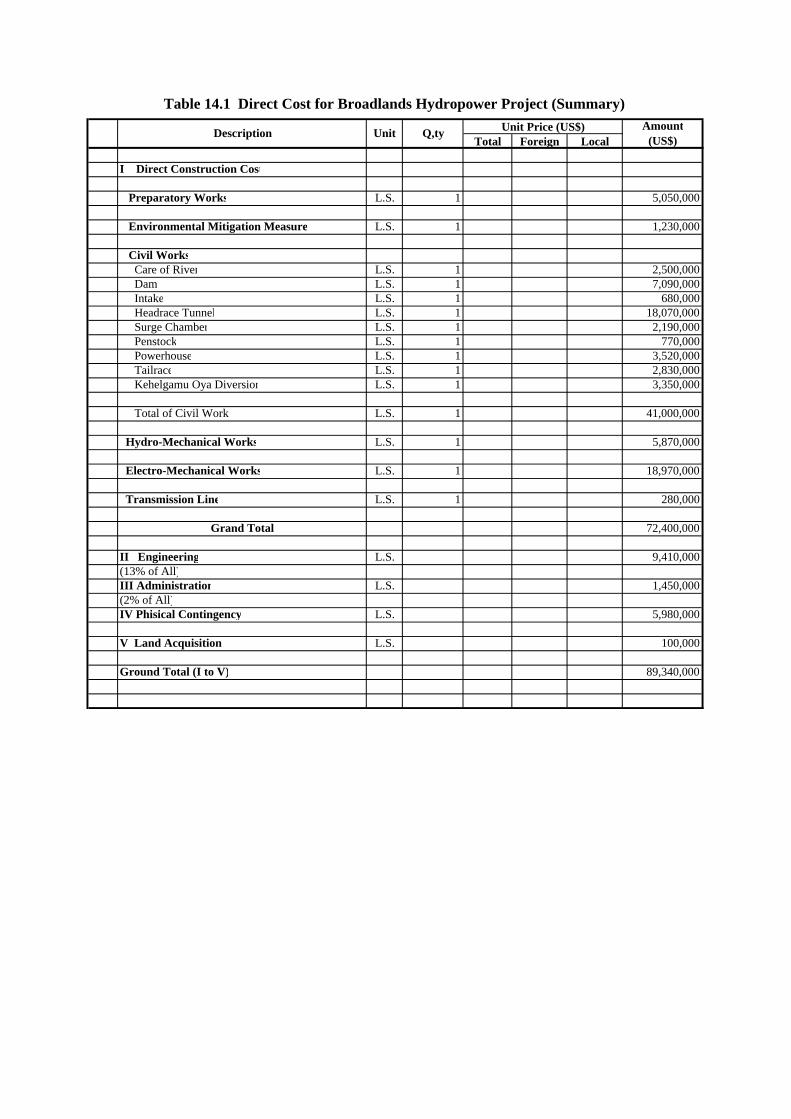
Table 14.1 Direct Cost for Broadlands Hydropower Project (Summary)
Total Foreign Local
I Direct Construction Cost
Preparatory Works L.S. 1 5,050,000
Environmental Mitigation Measure L.S. 1 1,230,000
Civil Works Care of River L.S. 1 2,500,000 Dam L.S. 1 7,090,000 Intake L.S. 1 680,000 Headrace Tunnel L.S. 1 18,070,000 Surge Chamber L.S. 1 2,190,000 Penstock L.S. 1 770,000 Powerhouse L.S. 1 3,520,000 Tailrace L.S. 1 2,830,000 Kehelgamu Oya Diversion L.S. 1 3,350,000
Total of Civil Works L.S. 1 41,000,000
Hydro-Mechanical Works L.S. 1 5,870,000
Electro-Mechanical Works L.S. 1 18,970,000
Transmission Line L.S. 1 280,000
Grand Total 72,400,000
II Engineering L.S. 9,410,000(13% of All)III Administration L.S. 1,450,000(2% of All)IV Phisical Contingency L.S. 5,980,000
V Land Acquisition L.S. 100,000
Ground Total (I to V) 89,340,000
Unit Price (US$) Amount(US$)Description Unit Q,ty
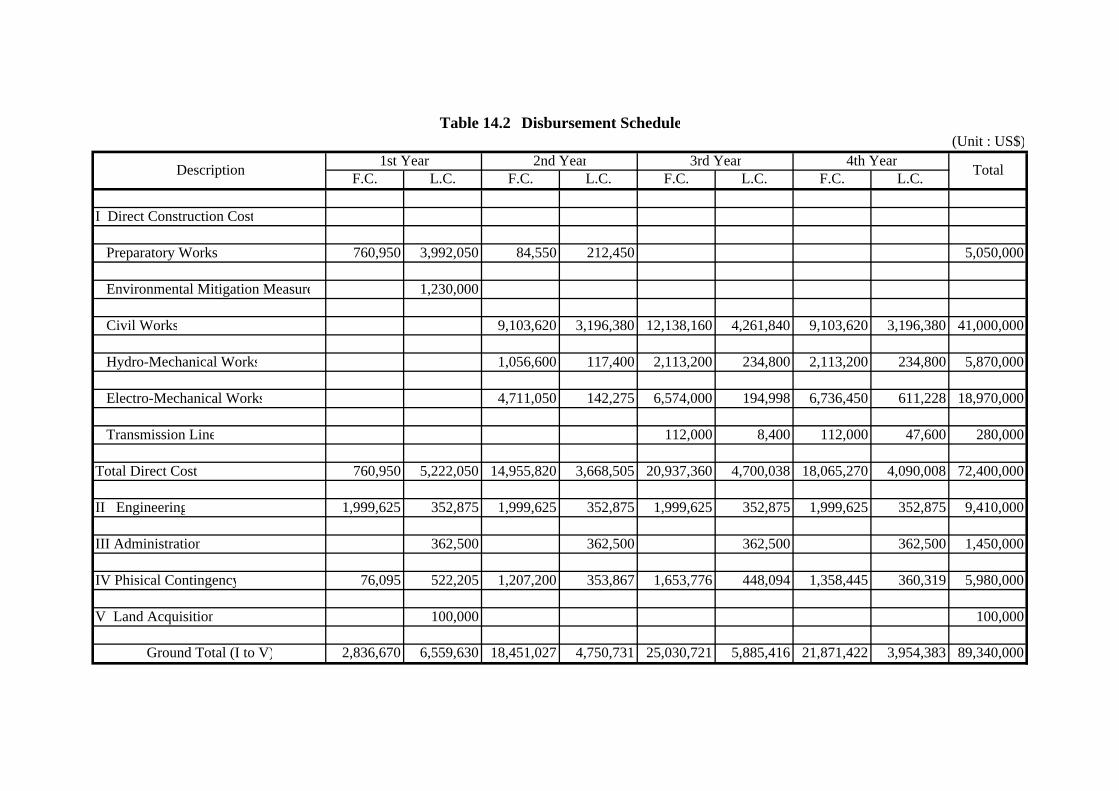
Table 14.2 Disbursement Schedule(Unit : US$)
1st Year 2nd Year 3rd Year 4th YearF.C. L.C. F.C. L.C. F.C. L.C. F.C. L.C.
I Direct Construction Cost
Preparatory Works 760,950 3,992,050 84,550 212,450 5,050,000
Environmental Mitigation Measure 1,230,000
Civil Works 9,103,620 3,196,380 12,138,160 4,261,840 9,103,620 3,196,380 41,000,000
Hydro-Mechanical Works 1,056,600 117,400 2,113,200 234,800 2,113,200 234,800 5,870,000
Electro-Mechanical Works 4,711,050 142,275 6,574,000 194,998 6,736,450 611,228 18,970,000
Transmission Line 112,000 8,400 112,000 47,600 280,000
Total Direct Cost 760,950 5,222,050 14,955,820 3,668,505 20,937,360 4,700,038 18,065,270 4,090,008 72,400,000
II Engineering 1,999,625 352,875 1,999,625 352,875 1,999,625 352,875 1,999,625 352,875 9,410,000
III Administration 362,500 362,500 362,500 362,500 1,450,000
IV Phisical Contingency 76,095 522,205 1,207,200 353,867 1,653,776 448,094 1,358,445 360,319 5,980,000
V Land Acquisition 100,000 100,000
Ground Total (I to V) 2,836,670 6,559,630 18,451,027 4,750,731 25,030,721 5,885,416 21,871,422 3,954,383 89,340,000
TotalDescription
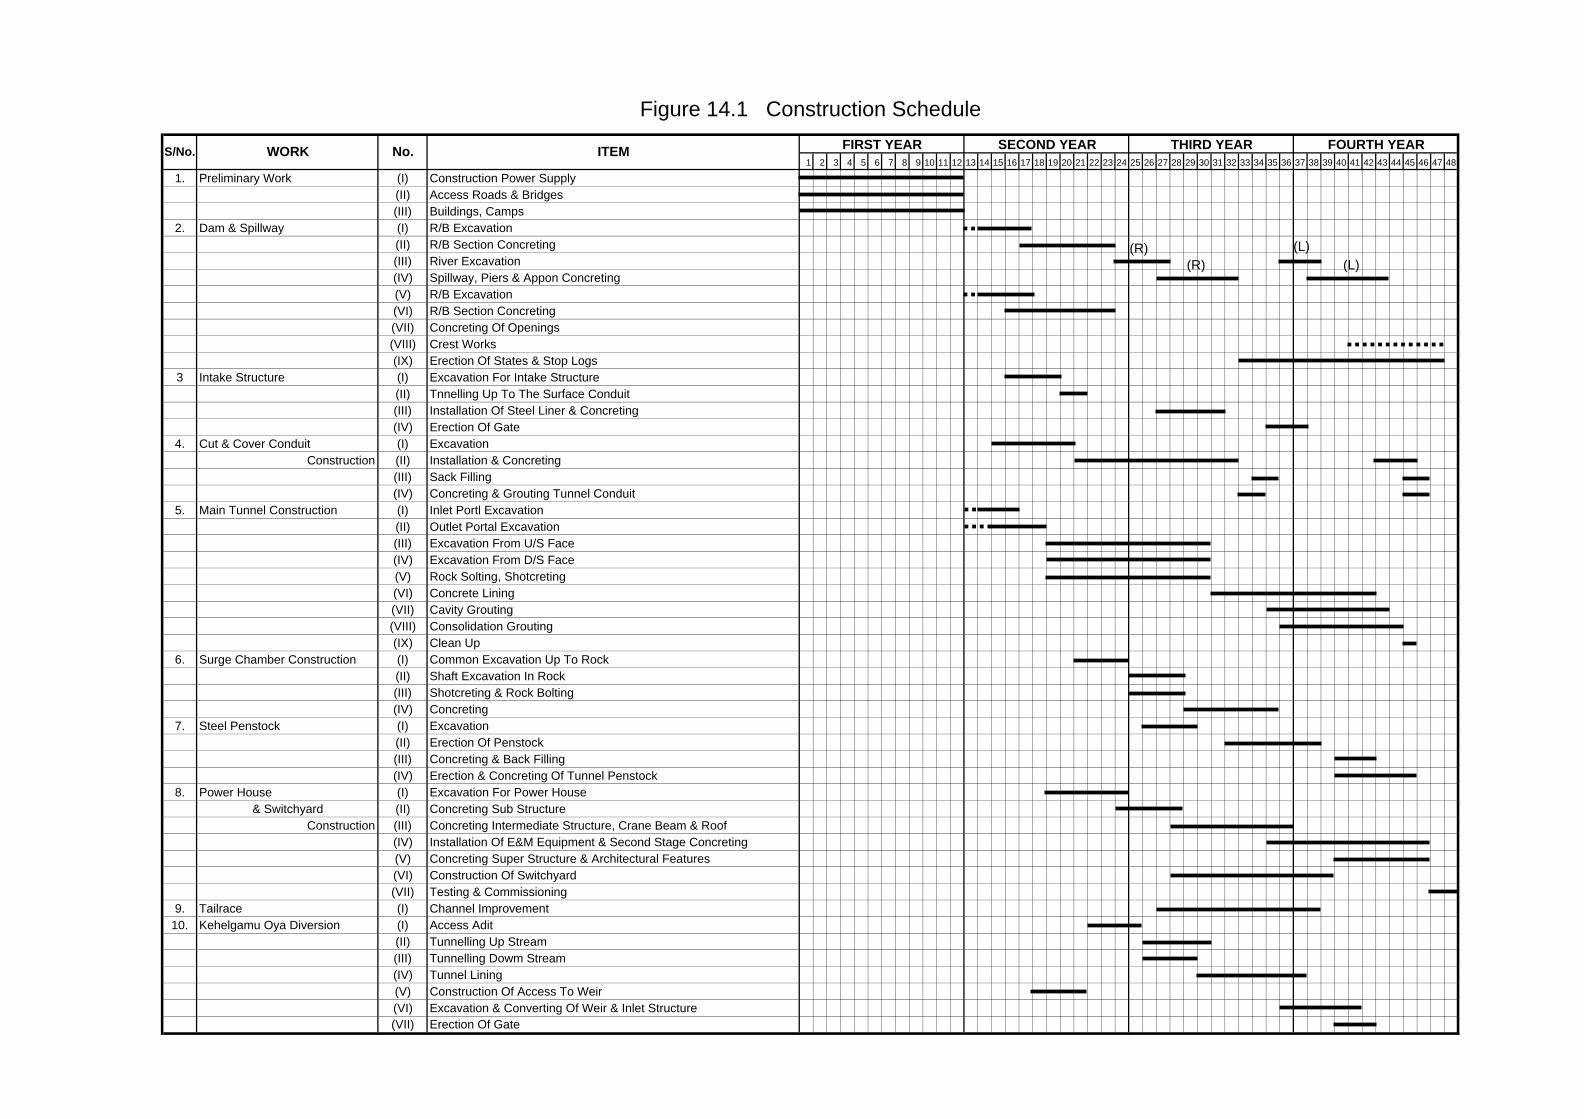
1 2 3 4 5 6 7 8 9 10 11 12 13 14 15 16 17 18 19 20 21 22 23 24 25 26 27 28 29 30 31 32 33 34 35 36 37 38 39 40 41 42 43 44 45 46 47 48
1. Preliminary Work (I) Construction Power Supply(II) Access Roads & Bridges(III) Buildings, Camps
2. Dam & Spillway (I) R/B Excavation(II) R/B Section Concreting(III) River Excavation(IV) Spillway, Piers & Appon Concreting(V) R/B Excavation(VI) R/B Section Concreting(VII) Concreting Of Openings(VIII) Crest Works(IX) Erection Of States & Stop Logs
3 Intake Structure (I) Excavation For Intake Structure(II) Tnnelling Up To The Surface Conduit(III) Installation Of Steel Liner & Concreting(IV) Erection Of Gate
4. Cut & Cover Conduit (I) ExcavationConstruction (II) Installation & Concreting
(III) Sack Filling(IV) Concreting & Grouting Tunnel Conduit
5. Main Tunnel Construction (I) Inlet Portl Excavation(II) Outlet Portal Excavation(III) Excavation From U/S Face(IV) Excavation From D/S Face(V) Rock Solting, Shotcreting(VI) Concrete Lining(VII) Cavity Grouting(VIII) Consolidation Grouting(IX) Clean Up
6. Surge Chamber Construction (I) Common Excavation Up To Rock(II) Shaft Excavation In Rock(III) Shotcreting & Rock Bolting(IV) Concreting
7. Steel Penstock (I) Excavation(II) Erection Of Penstock(III) Concreting & Back Filling(IV) Erection & Concreting Of Tunnel Penstock
8. Power House (I) Excavation For Power House& Switchyard (II) Concreting Sub Structure
Construction (III) Concreting Intermediate Structure, Crane Beam & Roof(IV) Installation Of E&M Equipment & Second Stage Concreting(V) Concreting Super Structure & Architectural Features(VI) Construction Of Switchyard(VII) Testing & Commissioning
9. Tailrace (I) Channel Improvement10. Kehelgamu Oya Diversion (I) Access Adit
(II) Tunnelling Up Stream(III) Tunnelling Dowm Stream(IV) Tunnel Lining(V) Construction Of Access To Weir(VI) Excavation & Converting Of Weir & Inlet Structure(VII) Erection Of Gate
Figure 14.1 Construction Schedule
S/No. ITEMNo.WORK FIRST YEAR SECOND YEAR THIRD YEAR FOURTH YEAR
(R)(R)
(L)(L)
The Study of Hydropower Optimization in Sri Lanka
Final Report15 - 1
15. ENVIRONMENTAL IMPACT ASSESSMENT FOR THE BROADLANDS HYDROPOWER PROJECT
15.1 Procedure of Environmental Impact Assessment
The procedure of the Environmental Impact Assessment (EIA) is as shown in the following page.
15.2 Environmental Impact Assessment for the Broadlands Hydropower Project
The Broadlands Hydropower Project needs the procedure of the EIA to be approved. The CEA was appointed as the Project Approval Agency (PAA) for the EIA for the Project. The fundamental study for the EIA was sub-contracted to a local consultant, the National Building Research Organization (NBRO), which had been selected through competitive bidding.
The study was phased as below.
- Phase 1 (Sept. 2002 – Feb. 2003, mainly the study on the natural environment)
- Phase 2 (May 2003 – Sept. 2003, mainly the study on the social environment)
The study has revealed that no serious impact on the natural/social environment is expected by the Project implementation. This is partly because the Project is a relatively small development project in a limited project area and the number of houses to be demolished is small (16). But conducting proper mitigation measures is a precondition regarding some items. Therefore, proper compensation for relocation, various mitigation measures, and proper monitoring and management of the environment should carried out during both the construction and operation stages.
15.3 Consultation with the Stakeholders
It is the CEB that is responsible for explaining the project to the stakeholders and having consultations. The CEB has been conducting briefings and consultations with the following stakeholders:
- Relevant officers of the central Government
- Relevant officers of the local governments
- Community leaders and the general public (village headmen, leaders of community-based organizations, entrepreneurs and people in general)
Of those, the consultation held on Nov. 13, 2003, was the largest. The participants raised questions about and made requests concerning the project, and the responses of the participants were nearly all positive.
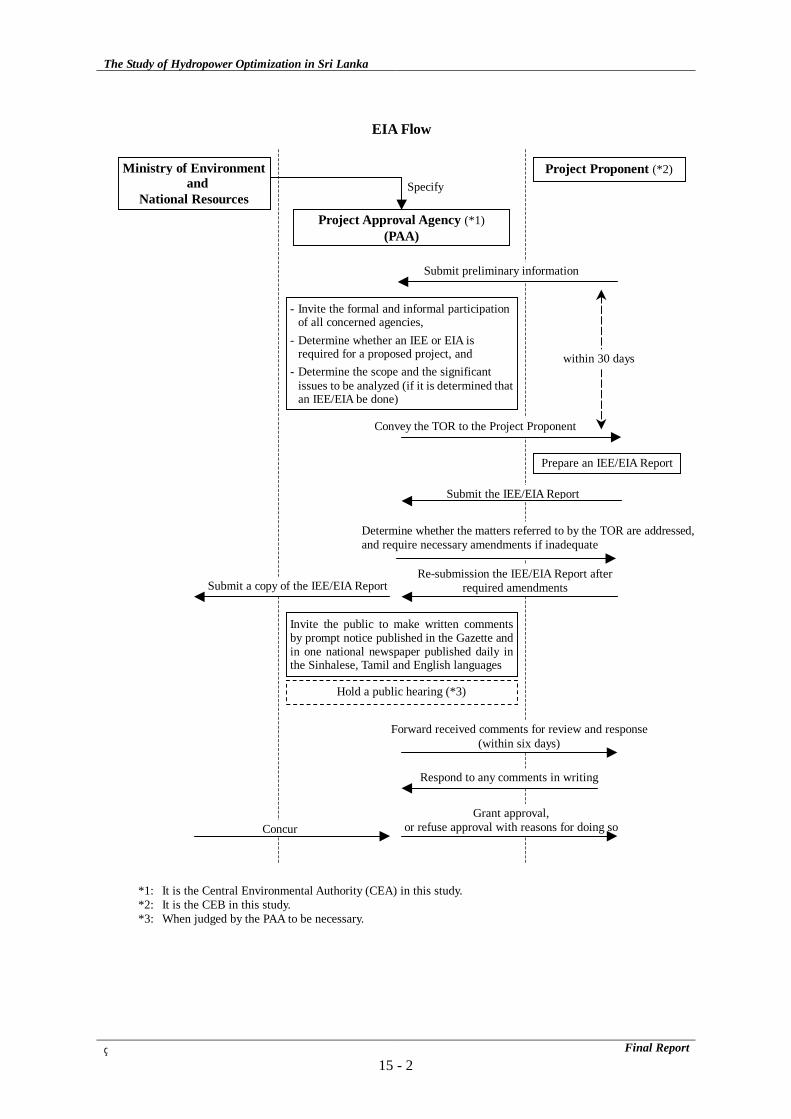
The Study of Hydropower Optimization in Sri Lanka
Final Report15 - 2
EIA Flow
Ministry of Environment and
National Resources Project Approval Agency (*1)
(PAA)
Specify Project Proponent (*2)
Submit preliminary information
- Invite the formal and informal participation of all concerned agencies,
- Determine whether an IEE or EIA is required for a proposed project, and
- Determine the scope and the significant issues to be analyzed (if it is determined thatan IEE/EIA be done)
Convey the TOR to the Project Proponent
within 30 days
Prepare an IEE/EIA Report
Submit the IEE/EIA Report
Determine whether the matters referred to by the TOR are addressed,and require necessary amendments if inadequate
Re-submission the IEE/EIA Report after required amendments Submit a copy of the IEE/EIA Report
Invite the public to make written commentsby prompt notice published in the Gazette andin one national newspaper published daily inthe Sinhalese, Tamil and English languages
Hold a public hearing (*3)
Forward received comments for review and response (within six days)
Respond to any comments in writing
Grant approval, or refuse approval with reasons for doing so Concur
*1: It is the Central Environmental Authority (CEA) in this study.*2: It is the CEB in this study. *3: When judged by the PAA to be necessary.
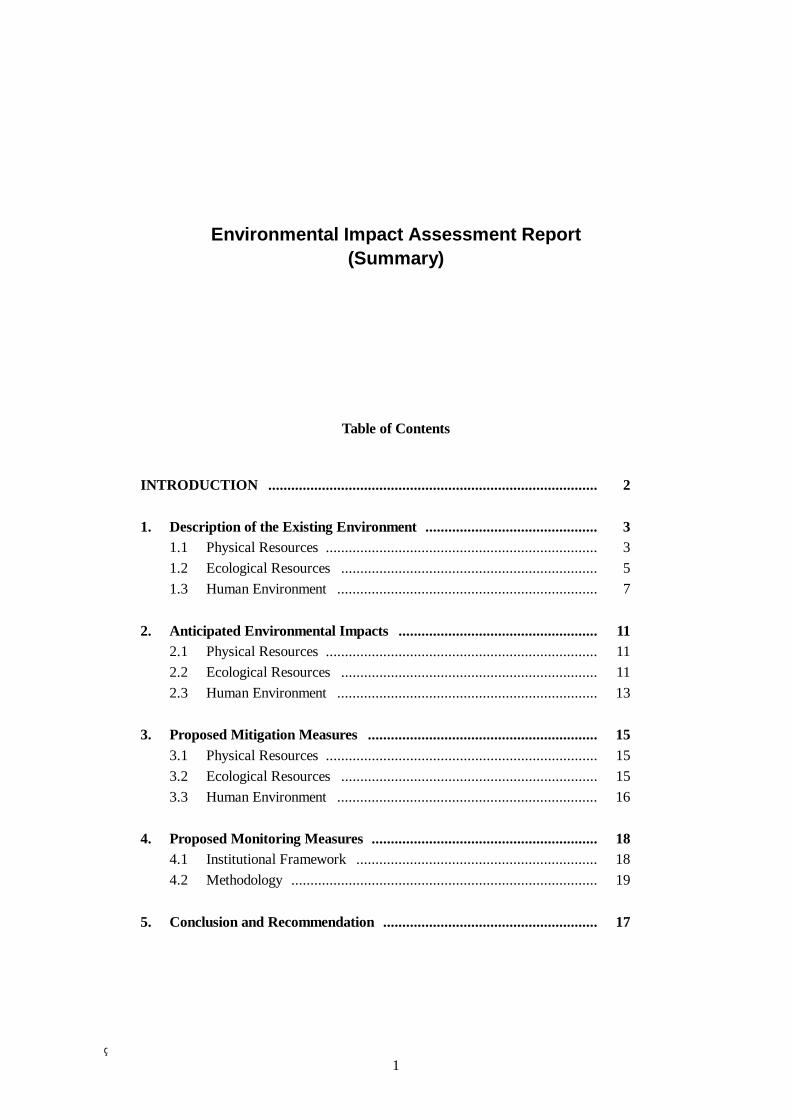
1
Environmental Impact Assessment Report (Summary)
Table of Contents
INTRODUCTION ...................................................................................... 2 1. Description of the Existing Environment ............................................. 3
1.1 Physical Resources ....................................................................... 3 1.2 Ecological Resources ................................................................... 5 1.3 Human Environment .................................................................... 7
2. Anticipated Environmental Impacts .................................................... 11 2.1 Physical Resources ....................................................................... 11 2.2 Ecological Resources ................................................................... 11 2.3 Human Environment .................................................................... 13
3. Proposed Mitigation Measures ............................................................ 15 3.1 Physical Resources ....................................................................... 15 3.2 Ecological Resources ................................................................... 15 3.3 Human Environment .................................................................... 16
4. Proposed Monitoring Measures ........................................................... 18 4.1 Institutional Framework ............................................................... 18 4.2 Methodology ................................................................................ 19
5. Conclusion and Recommendation ........................................................ 17

2
INTRODUCTION
The study area for the EIA for the Broadlands Hydropower Project is determined in the TOR as indicated below.
- The river area: from 2km upstream of the proposed dam site on the Maskeliya River and the proposed weir site in the Kehelgamu River to about 5km downstream of the powerhouse
- The bank area: both banks, with sections about 2km wide along the above-described river area
- The other area where a significant impact on the environment caused by the project is anticipated
The study area has been divided into three zones for the proper conduct of a study.
- Zone-1: the area that includes the proposed weir/dam and powerhouse where a direct impact may be anticipated
- Zone-2: the area around Zone-1 where a smaller impact than in Zone-1 or an indirect impact may be anticipated
- Zone-3: areas in the study area other than Zone-1 and Zone-2.
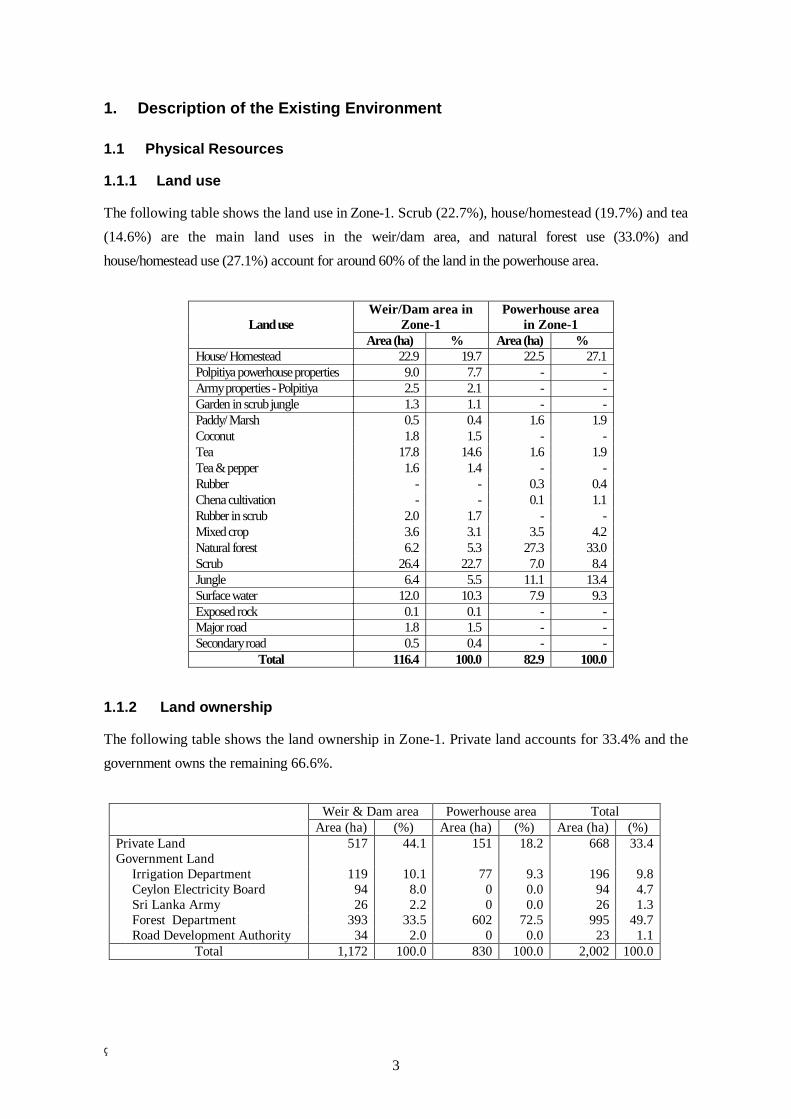
3
1. Description of the Existing Environment
1.1 Physical Resources
1.1.1 Land use
The following table shows the land use in Zone-1. Scrub (22.7%), house/homestead (19.7%) and tea (14.6%) are the main land uses in the weir/dam area, and natural forest use (33.0%) and house/homestead use (27.1%) account for around 60% of the land in the powerhouse area.
Weir/Dam area in
Zone-1 Powerhouse area
in Zone-1
Land use Area (ha) % Area (ha) %
House/ Homestead 22.9 19.7 22.5 27.1 Polpitiya powerhouse properties 9.0 7.7 - - Army properties - Polpitiya 2.5 2.1 - - Garden in scrub jungle 1.3 1.1 - - Paddy/ Marsh 0.5 0.4 1.6 1.9 Coconut 1.8 1.5 - - Tea 17.8 14.6 1.6 1.9 Tea & pepper 1.6 1.4 - - Rubber - - 0.3 0.4 Chena cultivation - - 0.1 1.1 Rubber in scrub 2.0 1.7 - - Mixed crop 3.6 3.1 3.5 4.2 Natural forest 6.2 5.3 27.3 33.0 Scrub 26.4 22.7 7.0 8.4 Jungle 6.4 5.5 11.1 13.4 Surface water 12.0 10.3 7.9 9.3 Exposed rock 0.1 0.1 - - Major road 1.8 1.5 - - Secondary road 0.5 0.4 - -
Total 116.4 100.0 82.9 100.0
1.1.2 Land ownership
The following table shows the land ownership in Zone-1. Private land accounts for 33.4% and the government owns the remaining 66.6%.
Weir & Dam area Powerhouse area Total
Area (ha) (%) Area (ha) (%) Area (ha) (%) Private Land 517 44.1 151 18.2 668 33.4 Government Land Irrigation Department 119 10.1 77 9.3 196 9.8 Ceylon Electricity Board 94 8.0 0 0.0 94 4.7 Sri Lanka Army 26 2.2 0 0.0 26 1.3 Forest Department 393 33.5 602 72.5 995 49.7 Road Development Authority 34 2.0 0 0.0 23 1.1
Total 1,172 100.0 830 100.0 2,002 100.0
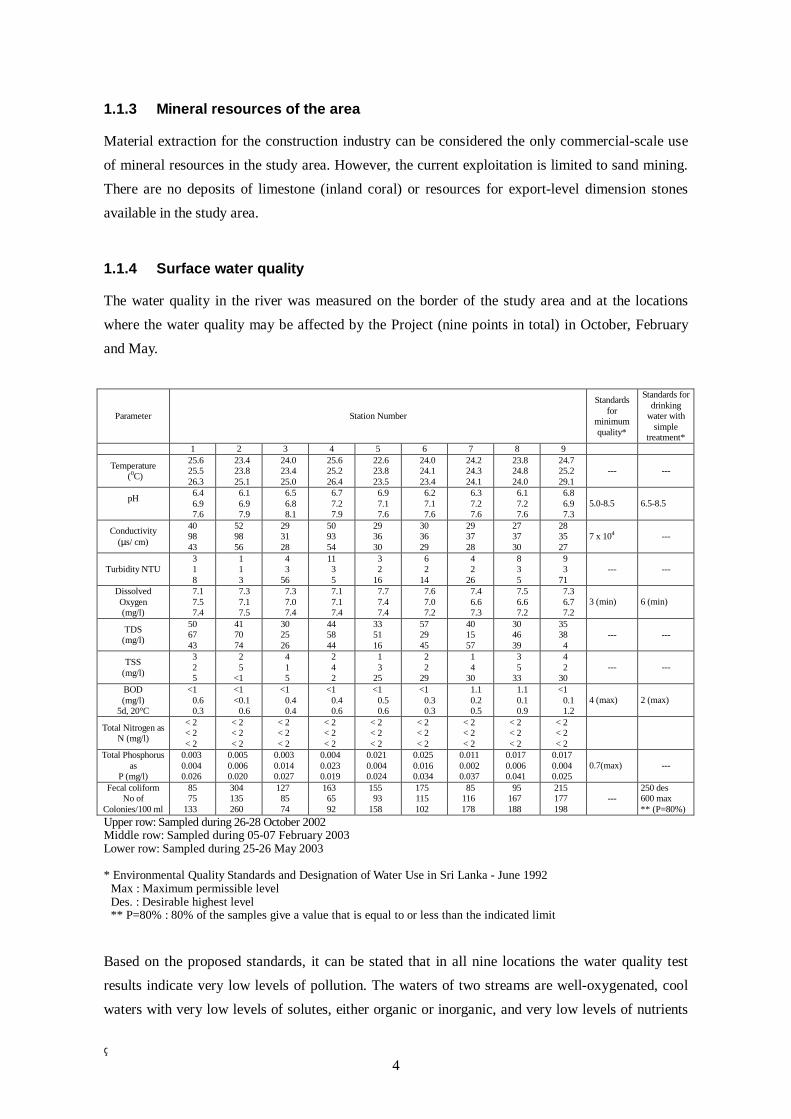
4
1.1.3 Mineral resources of the area
Material extraction for the construction industry can be considered the only commercial-scale use of mineral resources in the study area. However, the current exploitation is limited to sand mining. There are no deposits of limestone (inland coral) or resources for export-level dimension stones available in the study area.
1.1.4 Surface water quality
The water quality in the river was measured on the border of the study area and at the locations where the water quality may be affected by the Project (nine points in total) in October, February and May.
Parameter Station Number
Standards for
minimum quality*
Standards for drinking
water with simple
treatment* 1 2 3 4 5 6 7 8 9
Temperature (0C)
25.6 25.5 26.3
23.4 23.8 25.1
24.0 23.4 25.0
25.6 25.2 26.4
22.6 23.8 23.5
24.0 24.1 23.4
24.2 24.3 24.1
23.8 24.8 24.0
24.7 25.2 29.1
--- ---
pH
6.4 6.9 7.6
6.1 6.9 7.9
6.5 6.8 8.1
6.7 7.2 7.9
6.9 7.1 7.6
6.2 7.1 7.6
6.3 7.2 7.6
6.1 7.2 7.6
6.8 6.9 7.3
5.0-8.5 6.5-8.5
Conductivity (µs/ cm)
40 98 43
52 98 56
29 31 28
50 93 54
29 36 30
30 36 29
29 37 28
27 37 30
28 35 27
7 x 10⁴ ---
Turbidity NTU 3 1 8
1 1 3
4 3
56
11 3 5
3 2
16
6 2
14
4 2
26
8 3 5
9 3
71 --- ---
Dissolved Oxygen (mg/l)
7.1 7.5 7.4
7.3 7.1 7.5
7.3 7.0 7.4
7.1 7.1 7.4
7.7 7.4 7.4
7.6 7.0 7.2
7.4 6.6 7.3
7.5 6.6 7.2
7.3 6.7 7.2
3 (min) 6 (min)
TDS (mg/l)
50 67 43
41 70 74
30 25 26
44 58 44
33 51 16
57 29 45
40 15 57
30 46 39
35 38 4
--- ---
TSS (mg/l)
3 2 5
2 5
<1
4 1 5
2 4 2
1 3
25
2 2
29
1 4
30
3 5
33
4 2
30 --- ---
BOD (mg/l)
5d, 20°C
<1 0.6 0.3
<1 <0.1
0.6
<1 0.4 0.4
<1 0.4 0.6
<1 0.5 0.6
<1 0.3 0.3
1.1 0.2 0.5
1.1 0.1 0.9
<1 0.1 1.2
4 (max) 2 (max)
Total Nitrogen as N (mg/l)
< 2 < 2 < 2
< 2 < 2 < 2
< 2 < 2 < 2
< 2 < 2 < 2
< 2 < 2 < 2
< 2 < 2 < 2
< 2 < 2 < 2
< 2 < 2 < 2
< 2 < 2 < 2
Total Phosphorus as
P (mg/l)
0.003 0.004 0.026
0.005 0.006 0.020
0.003 0.014 0.027
0.004 0.023 0.019
0.021 0.004 0.024
0.025 0.016 0.034
0.011 0.002 0.037
0.017 0.006 0.041
0.017 0.004 0.025
0.7(max) ---
Fecal coliform No of
Colonies/100 ml
85 75
133
304 135 260
127 85 74
163 65 92
155 93
158
175 115 102
85 116 178
95 167 188
215 177 198
--- 250 des 600 max ** (P=80%)
Upper row: Sampled during 26-28 October 2002 Middle row: Sampled during 05-07 February 2003 Lower row: Sampled during 25-26 May 2003 * Environmental Quality Standards and Designation of Water Use in Sri Lanka - June 1992
Max : Maximum permissible level Des. : Desirable highest level ** P=80% : 80% of the samples give a value that is equal to or less than the indicated limit
Based on the proposed standards, it can be stated that in all nine locations the water quality test results indicate very low levels of pollution. The waters of two streams are well-oxygenated, cool waters with very low levels of solutes, either organic or inorganic, and very low levels of nutrients
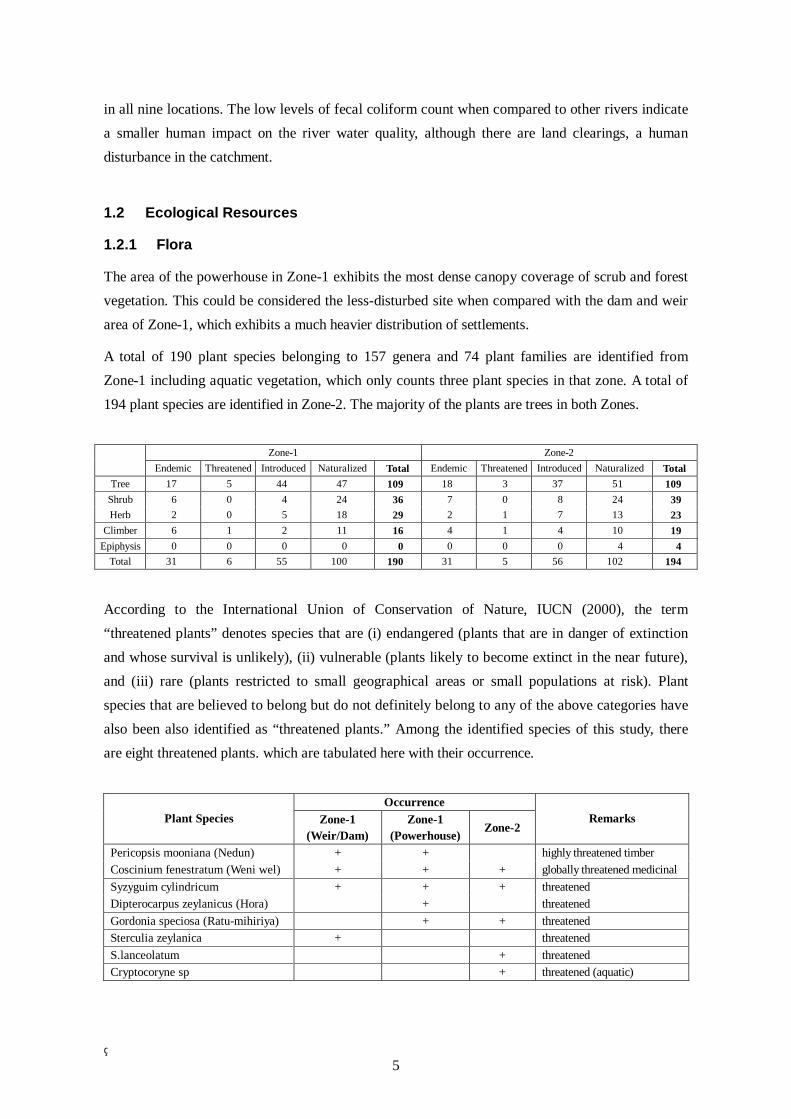
5
in all nine locations. The low levels of fecal coliform count when compared to other rivers indicate a smaller human impact on the river water quality, although there are land clearings, a human disturbance in the catchment.
1.2 Ecological Resources
1.2.1 Flora
The area of the powerhouse in Zone-1 exhibits the most dense canopy coverage of scrub and forest vegetation. This could be considered the less-disturbed site when compared with the dam and weir area of Zone-1, which exhibits a much heavier distribution of settlements.
A total of 190 plant species belonging to 157 genera and 74 plant families are identified from Zone-1 including aquatic vegetation, which only counts three plant species in that zone. A total of 194 plant species are identified in Zone-2. The majority of the plants are trees in both Zones.
Zone-1 Zone-2 Endemic Threatened Introduced Naturalized Total Endemic Threatened Introduced Naturalized Total
Tree 17 5 44 47 109 18 3 37 51 109 Shrub 6 0 4 24 36 7 0 8 24 39 Herb 2 0 5 18 29 2 1 7 13 23
Climber 6 1 2 11 16 4 1 4 10 19 Epiphysis 0 0 0 0 0 0 0 0 4 4
Total 31 6 55 100 190 31 5 56 102 194
According to the International Union of Conservation of Nature, IUCN (2000), the term “threatened plants” denotes species that are (i) endangered (plants that are in danger of extinction and whose survival is unlikely), (ii) vulnerable (plants likely to become extinct in the near future), and (iii) rare (plants restricted to small geographical areas or small populations at risk). Plant species that are believed to belong but do not definitely belong to any of the above categories have also been also identified as “threatened plants.” Among the identified species of this study, there are eight threatened plants. which are tabulated here with their occurrence.
Occurrence
Plant Species Zone-1 (Weir/Dam)
Zone-1 (Powerhouse) Zone-2
Remarks
Pericopsis mooniana (Nedun) + + highly threatened timber Coscinium fenestratum (Weni wel) + + + globally threatened medicinal Syzyguim cylindricum + + + threatened Dipterocarpus zeylanicus (Hora) + threatened Gordonia speciosa (Ratu-mihiriya) + + threatened Sterculia zeylanica + threatened S.lanceolatum + threatened Cryptocoryne sp + threatened (aquatic)
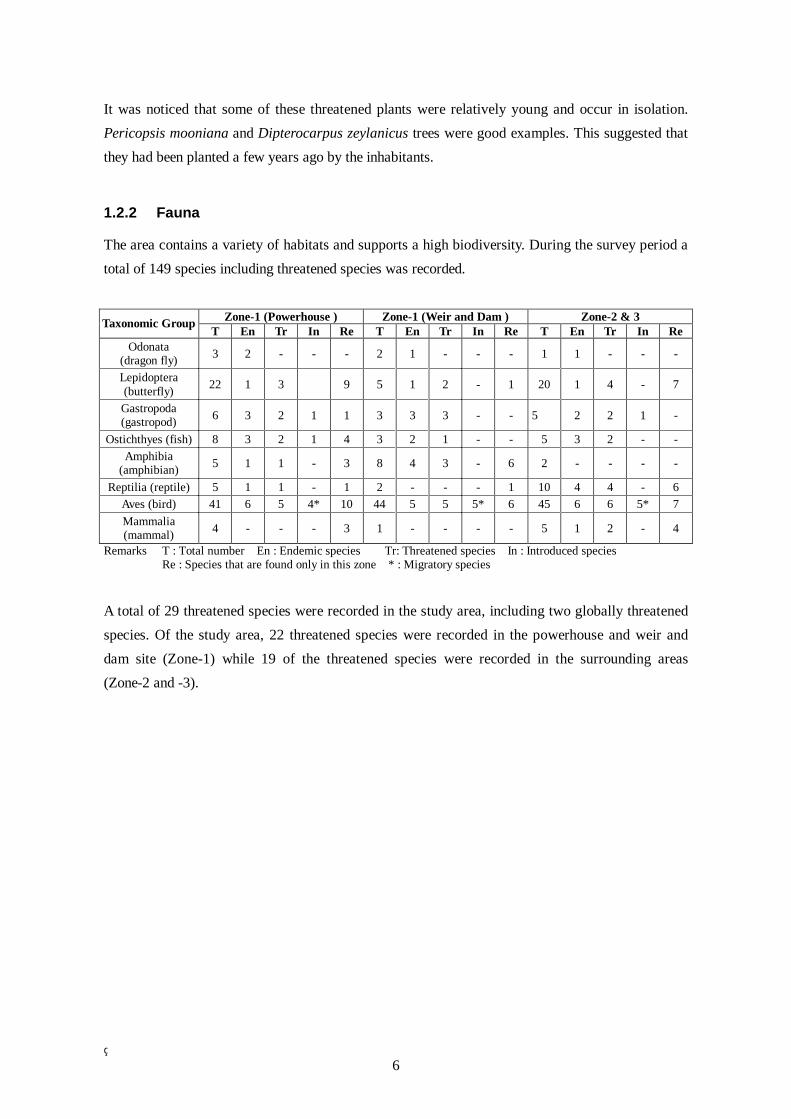
6
It was noticed that some of these threatened plants were relatively young and occur in isolation. Pericopsis mooniana and Dipterocarpus zeylanicus trees were good examples. This suggested that they had been planted a few years ago by the inhabitants.
1.2.2 Fauna
The area contains a variety of habitats and supports a high biodiversity. During the survey period a total of 149 species including threatened species was recorded.
Zone-1 (Powerhouse ) Zone-1 (Weir and Dam ) Zone-2 & 3 Taxonomic Group T En Tr In Re T En Tr In Re T En Tr In Re
Odonata (dragon fly) 3 2 - - - 2 1 - - - 1 1 - - -
Lepidoptera (butterfly) 22 1 3 9 5 1 2 - 1 20 1 4 - 7
Gastropoda (gastropod) 6 3 2 1 1 3 3 3 - - 5 2 2 1 -
Ostichthyes (fish) 8 3 2 1 4 3 2 1 - - 5 3 2 - - Amphibia
(amphibian) 5 1 1 - 3 8 4 3 - 6 2 - - - -
Reptilia (reptile) 5 1 1 - 1 2 - - - 1 10 4 4 - 6 Aves (bird) 41 6 5 4* 10 44 5 5 5* 6 45 6 6 5* 7 Mammalia (mammal) 4 - - - 3 1 - - - - 5 1 2 - 4
Remarks T : Total number En : Endemic species Tr: Threatened species In : Introduced species Re : Species that are found only in this zone * : Migratory species
A total of 29 threatened species were recorded in the study area, including two globally threatened species. Of the study area, 22 threatened species were recorded in the powerhouse and weir and dam site (Zone-1) while 19 of the threatened species were recorded in the surrounding areas (Zone-2 and -3).
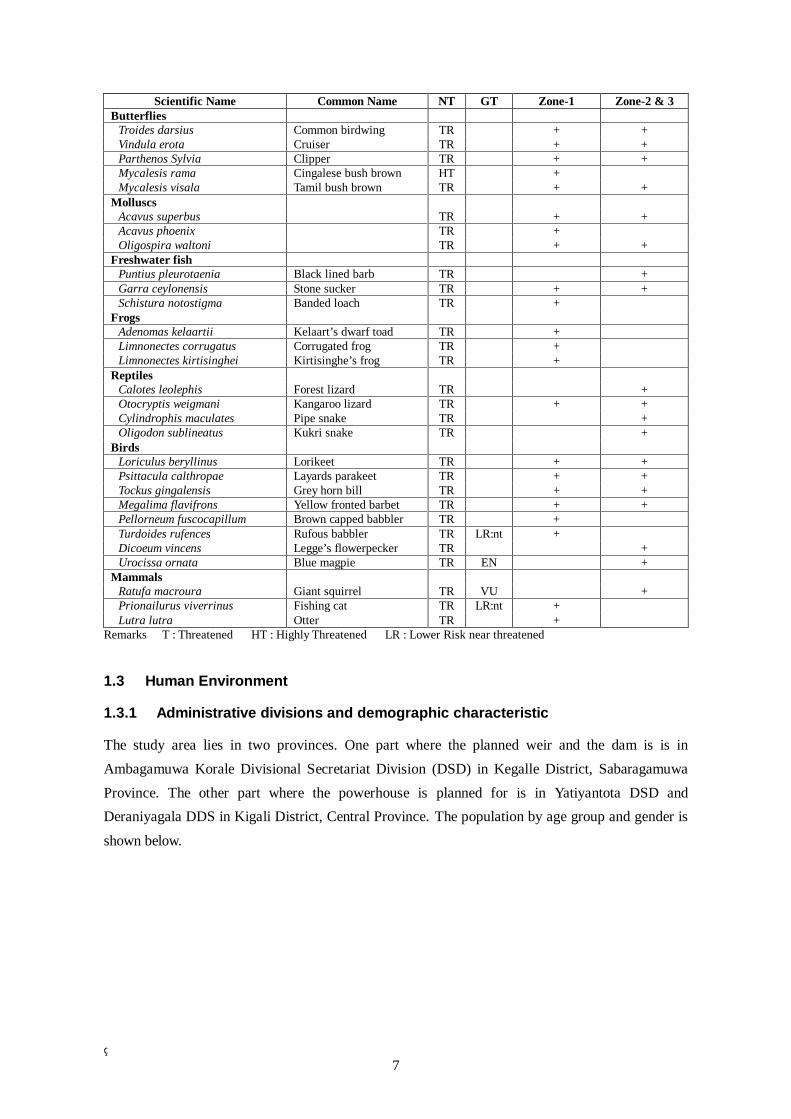
7
Scientific Name Common Name NT GT Zone-1 Zone-2 & 3 Butterflies
Troides darsius Common birdwing TR + + Vindula erota Cruiser TR + + Parthenos Sylvia Clipper TR + + Mycalesis rama Cingalese bush brown HT + Mycalesis visala Tamil bush brown TR + +
Molluscs Acavus superbus TR + + Acavus phoenix TR + Oligospira waltoni TR + +
Freshwater fish Puntius pleurotaenia Black lined barb TR + Garra ceylonensis Stone sucker TR + + Schistura notostigma Banded loach TR +
Frogs Adenomas kelaartii Kelaart’s dwarf toad TR + Limnonectes corrugatus Corrugated frog TR + Limnonectes kirtisinghei Kirtisinghe’s frog TR +
Reptiles Calotes leolephis Forest lizard TR + Otocryptis weigmani Kangaroo lizard TR + + Cylindrophis maculates Pipe snake TR + Oligodon sublineatus Kukri snake TR +
Birds Loriculus beryllinus Lorikeet TR + + Psittacula calthropae Layards parakeet TR + + Tockus gingalensis Grey horn bill TR + + Megalima flavifrons Yellow fronted barbet TR + + Pellorneum fuscocapillum Brown capped babbler TR + Turdoides rufences Rufous babbler TR LR:nt + Dicoeum vincens Legge’s flowerpecker TR + Urocissa ornata Blue magpie TR EN +
Mammals Ratufa macroura Giant squirrel TR VU + Prionailurus viverrinus Fishing cat TR LR:nt + Lutra lutra Otter TR +
Remarks T : Threatened HT : Highly Threatened LR : Lower Risk near threatened
1.3 Human Environment
1.3.1 Administrative divisions and demographic characteristic
The study area lies in two provinces. One part where the planned weir and the dam is is in Ambagamuwa Korale Divisional Secretariat Division (DSD) in Kegalle District, Sabaragamuwa Province. The other part where the powerhouse is planned for is in Yatiyantota DSD and Deraniyagala DDS in Kigali District, Central Province. The population by age group and gender is
shown below.
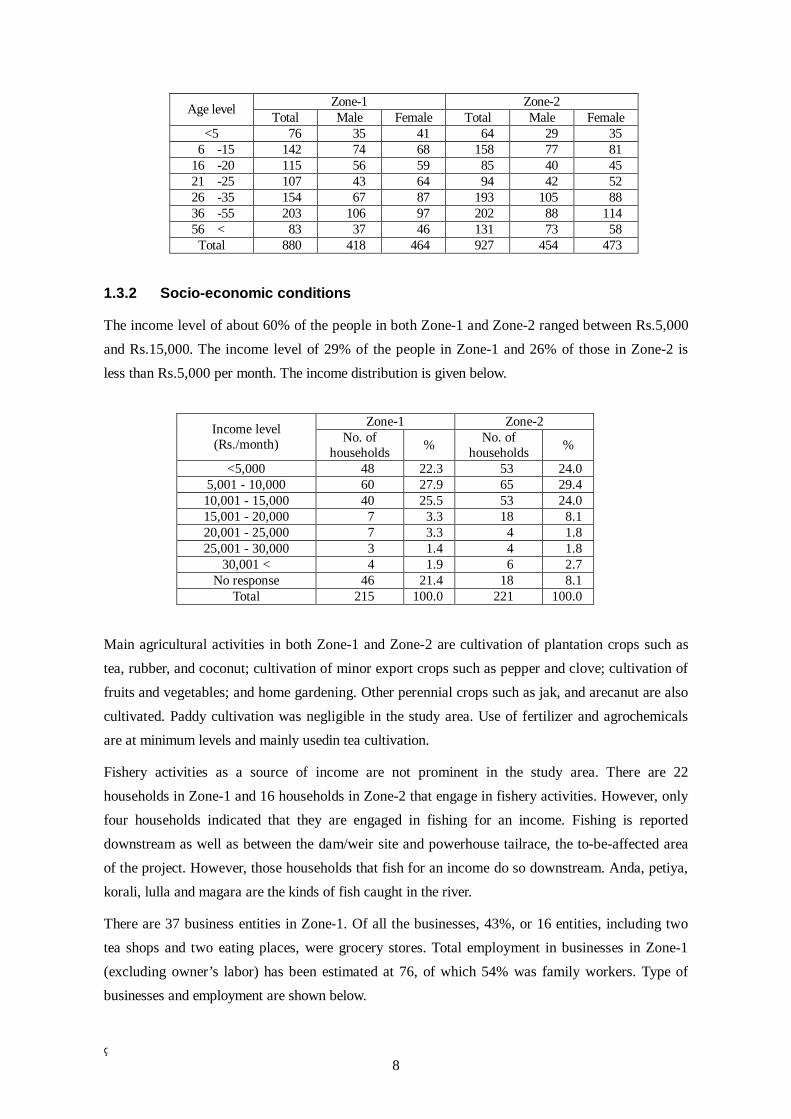
8
Zone-1 Zone-2 Age level Total Male Female Total Male Female <5 76 35 41 64 29 35
6 -15 142 74 68 158 77 81 16 -20 115 56 59 85 40 45 21 -25 107 43 64 94 42 52 26 -35 154 67 87 193 105 88 36 -55 203 106 97 202 88 114 56 < 83 37 46 131 73 58
Total 880 418 464 927 454 473
1.3.2 Socio-economic conditions
The income level of about 60% of the people in both Zone-1 and Zone-2 ranged between Rs.5,000 and Rs.15,000. The income level of 29% of the people in Zone-1 and 26% of those in Zone-2 is less than Rs.5,000 per month. The income distribution is given below.
Zone-1 Zone-2 Income level
(Rs./month) No. of households % No. of
households %
<5,000 48 22.3 53 24.0 5,001 - 10,000 60 27.9 65 29.4 10,001 - 15,000 40 25.5 53 24.0 15,001 - 20,000 7 3.3 18 8.1 20,001 - 25,000 7 3.3 4 1.8 25,001 - 30,000 3 1.4 4 1.8
30,001 < 4 1.9 6 2.7 No response 46 21.4 18 8.1
Total 215 100.0 221 100.0
Main agricultural activities in both Zone-1 and Zone-2 are cultivation of plantation crops such as tea, rubber, and coconut; cultivation of minor export crops such as pepper and clove; cultivation of fruits and vegetables; and home gardening. Other perennial crops such as jak, and arecanut are also cultivated. Paddy cultivation was negligible in the study area. Use of fertilizer and agrochemicals are at minimum levels and mainly usedin tea cultivation.
Fishery activities as a source of income are not prominent in the study area. There are 22 households in Zone-1 and 16 households in Zone-2 that engage in fishery activities. However, only four households indicated that they are engaged in fishing for an income. Fishing is reported downstream as well as between the dam/weir site and powerhouse tailrace, the to-be-affected area of the project. However, those households that fish for an income do so downstream. Anda, petiya, korali, lulla and magara are the kinds of fish caught in the river.
There are 37 business entities in Zone-1. Of all the businesses, 43%, or 16 entities, including two tea shops and two eating places, were grocery stores. Total employment in businesses in Zone-1 (excluding owner’s labor) has been estimated at 76, of which 54% was family workers. Type of businesses and employment are shown below.
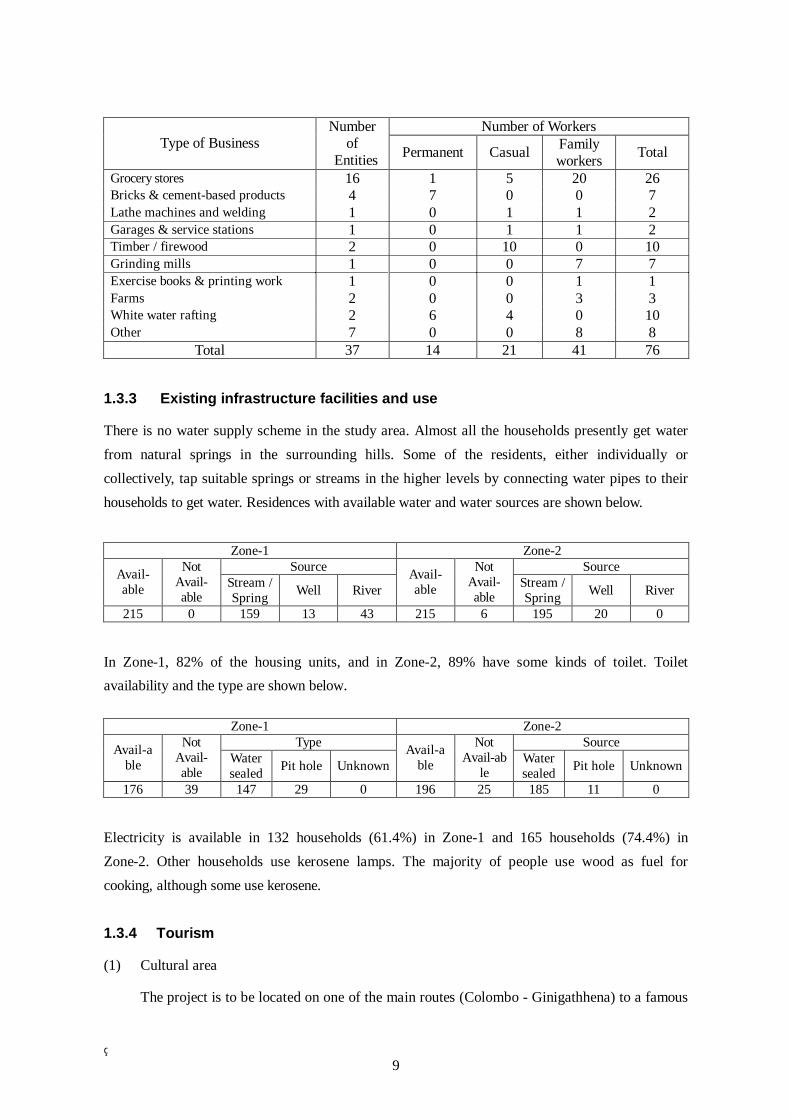
9
Number of Workers
Type of Business Number
of Entities Permanent Casual Family
workers Total
Grocery stores 16 1 5 20 26 Bricks & cement-based products 4 7 0 0 7 Lathe machines and welding 1 0 1 1 2 Garages & service stations 1 0 1 1 2 Timber / firewood 2 0 10 0 10 Grinding mills 1 0 0 7 7 Exercise books & printing work 1 0 0 1 1 Farms 2 0 0 3 3 White water rafting 2 6 4 0 10 Other 7 0 0 8 8
Total 37 14 21 41 76
1.3.3 Existing infrastructure facilities and use
There is no water supply scheme in the study area. Almost all the households presently get water from natural springs in the surrounding hills. Some of the residents, either individually or collectively, tap suitable springs or streams in the higher levels by connecting water pipes to their households to get water. Residences with available water and water sources are shown below.
Zone-1 Zone-2
Source Source Avail- able
Not Avail- able
Stream / Spring Well River
Avail- able
Not Avail- able
Stream / Spring Well River
215 0 159 13 43 215 6 195 20 0
In Zone-1, 82% of the housing units, and in Zone-2, 89% have some kinds of toilet. Toilet availability and the type are shown below.
Zone-1 Zone-2 Type Source Avail-a
ble
Not Avail- able
Water sealed Pit hole Unknown
Avail-able
Not Avail-ab
le Water sealed Pit hole Unknown
176 39 147 29 0 196 25 185 11 0
Electricity is available in 132 households (61.4%) in Zone-1 and 165 households (74.4%) in Zone-2. Other households use kerosene lamps. The majority of people use wood as fuel for cooking, although some use kerosene. 1.3.4 Tourism
(1) Cultural area
The project is to be located on one of the main routes (Colombo - Ginigathhena) to a famous
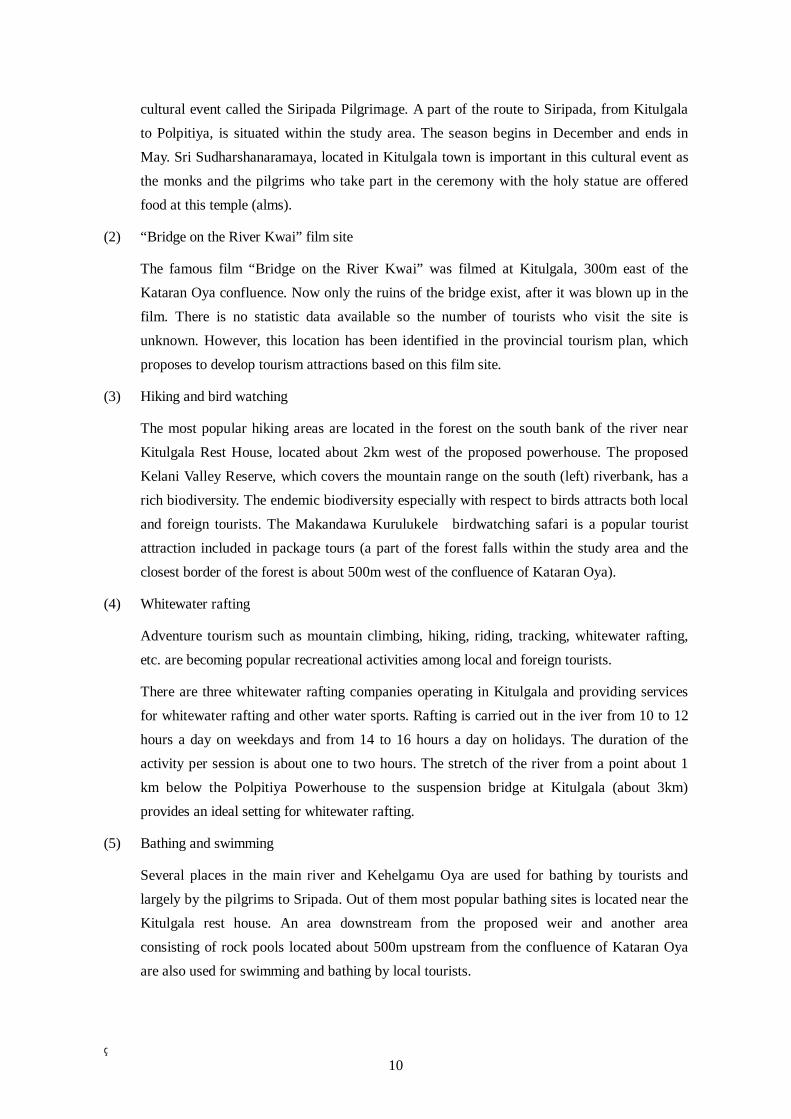
10
cultural event called the Siripada Pilgrimage. A part of the route to Siripada, from Kitulgala to Polpitiya, is situated within the study area. The season begins in December and ends in May. Sri Sudharshanaramaya, located in Kitulgala town is important in this cultural event as the monks and the pilgrims who take part in the ceremony with the holy statue are offered food at this temple (alms).
(2) “Bridge on the River Kwai” film site
The famous film “Bridge on the River Kwai” was filmed at Kitulgala, 300m east of the Kataran Oya confluence. Now only the ruins of the bridge exist, after it was blown up in the film. There is no statistic data available so the number of tourists who visit the site is unknown. However, this location has been identified in the provincial tourism plan, which proposes to develop tourism attractions based on this film site.
(3) Hiking and bird watching
The most popular hiking areas are located in the forest on the south bank of the river near Kitulgala Rest House, located about 2km west of the proposed powerhouse. The proposed Kelani Valley Reserve, which covers the mountain range on the south (left) riverbank, has a rich biodiversity. The endemic biodiversity especially with respect to birds attracts both local and foreign tourists. The Makandawa Kurulukele birdwatching safari is a popular tourist attraction included in package tours (a part of the forest falls within the study area and the closest border of the forest is about 500m west of the confluence of Kataran Oya).
(4) Whitewater rafting
Adventure tourism such as mountain climbing, hiking, riding, tracking, whitewater rafting, etc. are becoming popular recreational activities among local and foreign tourists.
There are three whitewater rafting companies operating in Kitulgala and providing services for whitewater rafting and other water sports. Rafting is carried out in the iver from 10 to 12 hours a day on weekdays and from 14 to 16 hours a day on holidays. The duration of the activity per session is about one to two hours. The stretch of the river from a point about 1 km below the Polpitiya Powerhouse to the suspension bridge at Kitulgala (about 3km) provides an ideal setting for whitewater rafting.
(5) Bathing and swimming
Several places in the main river and Kehelgamu Oya are used for bathing by tourists and largely by the pilgrims to Sripada. Out of them most popular bathing sites is located near the Kitulgala rest house. An area downstream from the proposed weir and another area consisting of rock pools located about 500m upstream from the confluence of Kataran Oya are also used for swimming and bathing by local tourists.
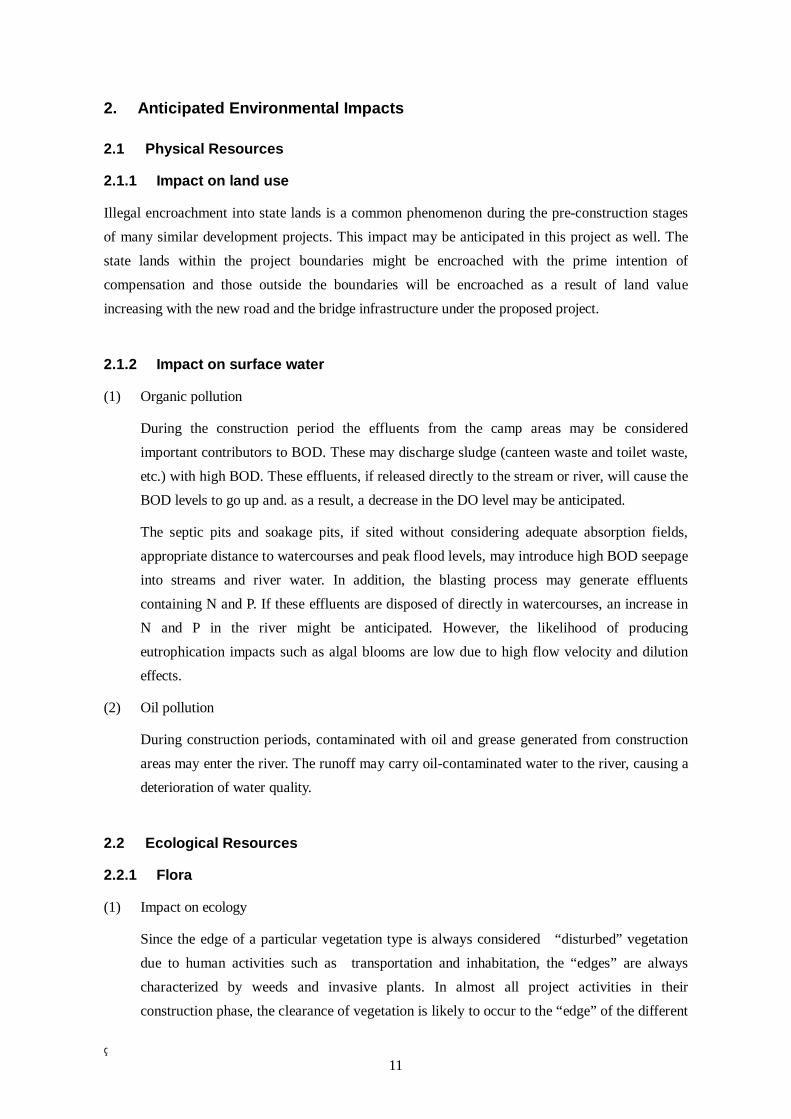
11
2. Anticipated Environmental Impacts
2.1 Physical Resources
2.1.1 Impact on land use
Illegal encroachment into state lands is a common phenomenon during the pre-construction stages of many similar development projects. This impact may be anticipated in this project as well. The state lands within the project boundaries might be encroached with the prime intention of compensation and those outside the boundaries will be encroached as a result of land value increasing with the new road and the bridge infrastructure under the proposed project.
2.1.2 Impact on surface water
(1) Organic pollution
During the construction period the effluents from the camp areas may be considered important contributors to BOD. These may discharge sludge (canteen waste and toilet waste, etc.) with high BOD. These effluents, if released directly to the stream or river, will cause the BOD levels to go up and. as a result, a decrease in the DO level may be anticipated.
The septic pits and soakage pits, if sited without considering adequate absorption fields, appropriate distance to watercourses and peak flood levels, may introduce high BOD seepage into streams and river water. In addition, the blasting process may generate effluents containing N and P. If these effluents are disposed of directly in watercourses, an increase in N and P in the river might be anticipated. However, the likelihood of producing eutrophication impacts such as algal blooms are low due to high flow velocity and dilution effects.
(2) Oil pollution
During construction periods, contaminated with oil and grease generated from construction areas may enter the river. The runoff may carry oil-contaminated water to the river, causing a deterioration of water quality.
2.2 Ecological Resources
2.2.1 Flora
(1) Impact on ecology
Since the edge of a particular vegetation type is always considered “disturbed” vegetation due to human activities such as transportation and inhabitation, the “edges” are always characterized by weeds and invasive plants. In almost all project activities in their construction phase, the clearance of vegetation is likely to occur to the “edge” of the different
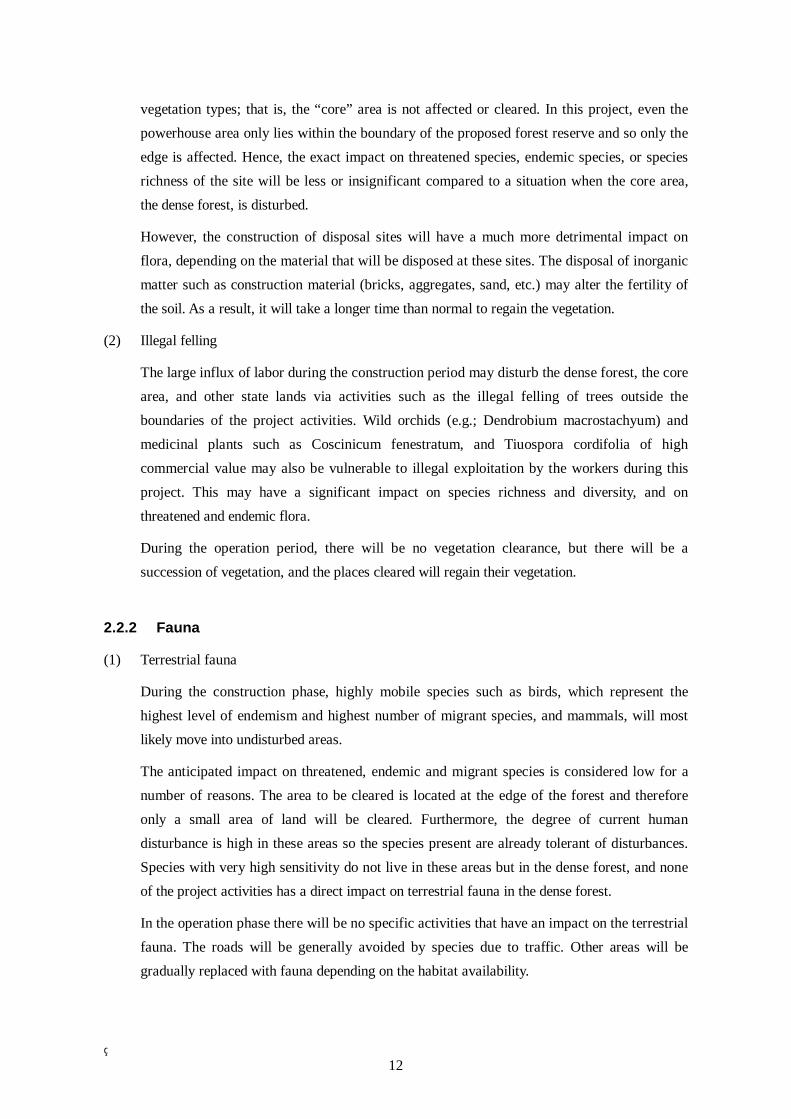
12
vegetation types; that is, the “core” area is not affected or cleared. In this project, even the powerhouse area only lies within the boundary of the proposed forest reserve and so only the edge is affected. Hence, the exact impact on threatened species, endemic species, or species richness of the site will be less or insignificant compared to a situation when the core area, the dense forest, is disturbed.
However, the construction of disposal sites will have a much more detrimental impact on flora, depending on the material that will be disposed at these sites. The disposal of inorganic matter such as construction material (bricks, aggregates, sand, etc.) may alter the fertility of the soil. As a result, it will take a longer time than normal to regain the vegetation.
(2) Illegal felling
The large influx of labor during the construction period may disturb the dense forest, the core area, and other state lands via activities such as the illegal felling of trees outside the boundaries of the project activities. Wild orchids (e.g.; Dendrobium macrostachyum) and medicinal plants such as Coscinicum fenestratum, and Tiuospora cordifolia of high commercial value may also be vulnerable to illegal exploitation by the workers during this project. This may have a significant impact on species richness and diversity, and on threatened and endemic flora.
During the operation period, there will be no vegetation clearance, but there will be a succession of vegetation, and the places cleared will regain their vegetation.
2.2.2 Fauna
(1) Terrestrial fauna
During the construction phase, highly mobile species such as birds, which represent the highest level of endemism and highest number of migrant species, and mammals, will most likely move into undisturbed areas.
The anticipated impact on threatened, endemic and migrant species is considered low for a number of reasons. The area to be cleared is located at the edge of the forest and therefore only a small area of land will be cleared. Furthermore, the degree of current human disturbance is high in these areas so the species present are already tolerant of disturbances. Species with very high sensitivity do not live in these areas but in the dense forest, and none of the project activities has a direct impact on terrestrial fauna in the dense forest.
In the operation phase there will be no specific activities that have an impact on the terrestrial fauna. The roads will be generally avoided by species due to traffic. Other areas will be gradually replaced with fauna depending on the habitat availability.
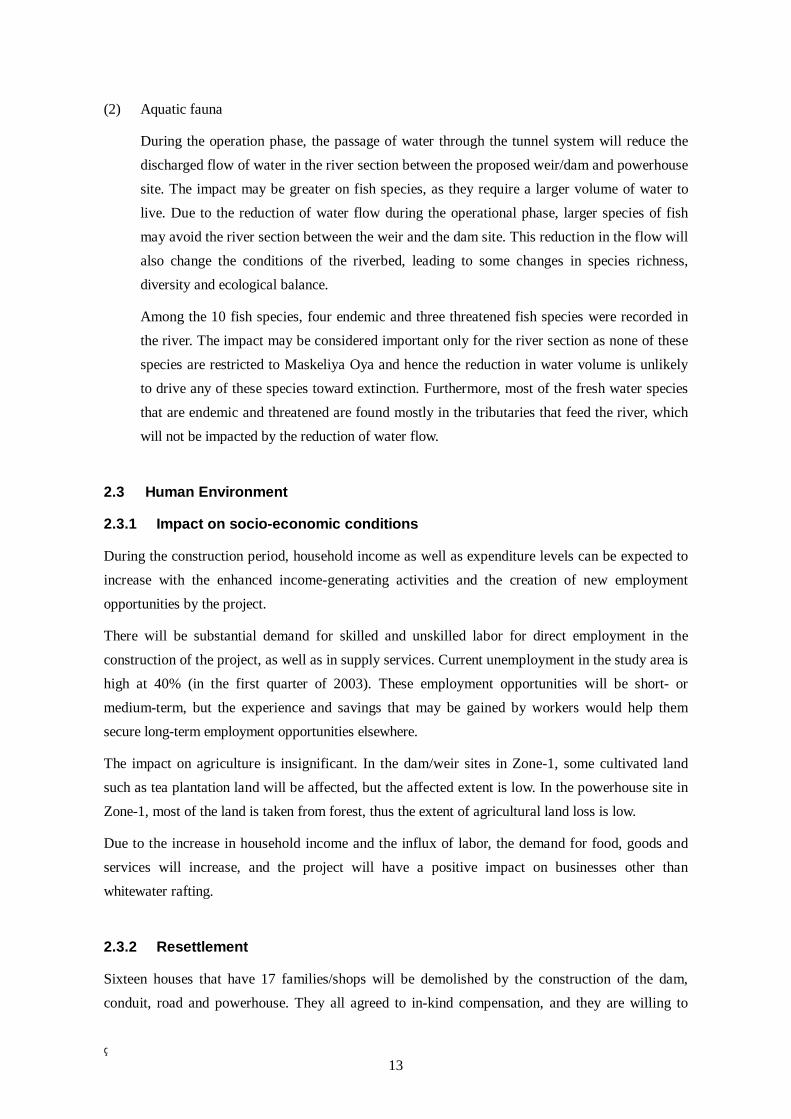
13
(2) Aquatic fauna
During the operation phase, the passage of water through the tunnel system will reduce the discharged flow of water in the river section between the proposed weir/dam and powerhouse site. The impact may be greater on fish species, as they require a larger volume of water to live. Due to the reduction of water flow during the operational phase, larger species of fish may avoid the river section between the weir and the dam site. This reduction in the flow will also change the conditions of the riverbed, leading to some changes in species richness, diversity and ecological balance.
Among the 10 fish species, four endemic and three threatened fish species were recorded in the river. The impact may be considered important only for the river section as none of these species are restricted to Maskeliya Oya and hence the reduction in water volume is unlikely to drive any of these species toward extinction. Furthermore, most of the fresh water species that are endemic and threatened are found mostly in the tributaries that feed the river, which will not be impacted by the reduction of water flow.
2.3 Human Environment
2.3.1 Impact on socio-economic conditions
During the construction period, household income as well as expenditure levels can be expected to increase with the enhanced income-generating activities and the creation of new employment opportunities by the project.
There will be substantial demand for skilled and unskilled labor for direct employment in the construction of the project, as well as in supply services. Current unemployment in the study area is high at 40% (in the first quarter of 2003). These employment opportunities will be short- or medium-term, but the experience and savings that may be gained by workers would help them secure long-term employment opportunities elsewhere.
The impact on agriculture is insignificant. In the dam/weir sites in Zone-1, some cultivated land such as tea plantation land will be affected, but the affected extent is low. In the powerhouse site in Zone-1, most of the land is taken from forest, thus the extent of agricultural land loss is low.
Due to the increase in household income and the influx of labor, the demand for food, goods and services will increase, and the project will have a positive impact on businesses other than whitewater rafting.
2.3.2 Resettlement
Sixteen houses that have 17 families/shops will be demolished by the construction of the dam, conduit, road and powerhouse. They all agreed to in-kind compensation, and they are willing to
14
accept an alternative site, bare land of about 10 hectares, close to their present location.
2.3.3 Impact on tourism
(1) Whitewater rafting
The river section between the dam/weir site the powerhouse site will be decreased, and therefore the rafting cannot be operated.
(2) “Bridge on the River Kwai” film site
A new bridge is proposed at the film site of “Bridge on the River Kwai”. And it is planned that a hole in the rock and concrete block that were parts of the foundation of the bridge in the film will be preserved with several square meters of surrounding rocks. And an access road to the powerhouse is planned to be connected to the new bridge.
During construction, tourists who intend to visit this site may have difficulties accessing the location, but after construction the new access road will enable convenient visits to the site. In addition, on the other side of the river is a forest to the east of the powerhouse that is expected to be designated a forest reserve. And there is a place where various kinds of birds can be seen, like a bird sanctuary, to the west of the powerhouse. The bridge will make the access to those places easy, and it may increase the number of tourists who visit the film site as well.
(3) Bathing and swimming
The bathing places located in the river between the proposed weir/dam and the powerhouse may experience water flow interruptions especially during dryer periods. However, the most popular bathing spots among tourists and pilgrims are located downstream of tailrace discharge point, and there will be little change in the flow there.
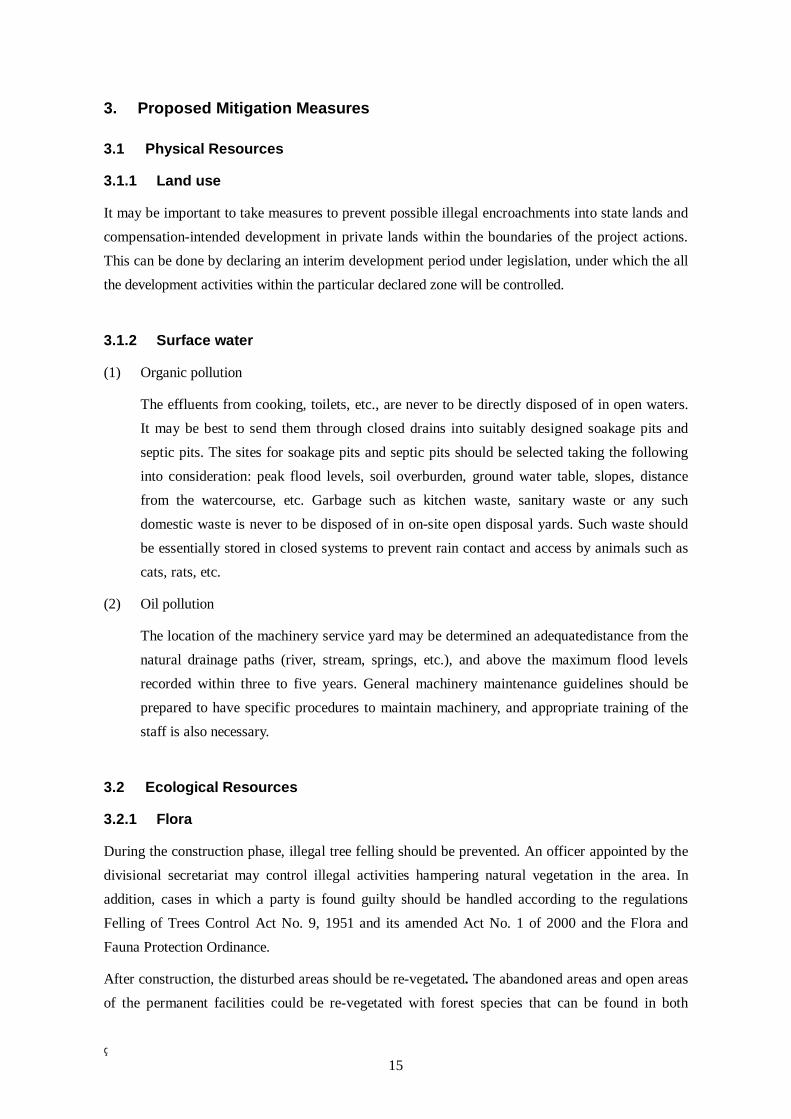
15
3. Proposed Mitigation Measures
3.1 Physical Resources
3.1.1 Land use
It may be important to take measures to prevent possible illegal encroachments into state lands and compensation-intended development in private lands within the boundaries of the project actions. This can be done by declaring an interim development period under legislation, under which the all the development activities within the particular declared zone will be controlled.
3.1.2 Surface water
(1) Organic pollution
The effluents from cooking, toilets, etc., are never to be directly disposed of in open waters. It may be best to send them through closed drains into suitably designed soakage pits and septic pits. The sites for soakage pits and septic pits should be selected taking the following into consideration: peak flood levels, soil overburden, ground water table, slopes, distance from the watercourse, etc. Garbage such as kitchen waste, sanitary waste or any such domestic waste is never to be disposed of in on-site open disposal yards. Such waste should be essentially stored in closed systems to prevent rain contact and access by animals such as cats, rats, etc.
(2) Oil pollution
The location of the machinery service yard may be determined an adequatedistance from the natural drainage paths (river, stream, springs, etc.), and above the maximum flood levels recorded within three to five years. General machinery maintenance guidelines should be prepared to have specific procedures to maintain machinery, and appropriate training of the staff is also necessary.
3.2 Ecological Resources
3.2.1 Flora
During the construction phase, illegal tree felling should be prevented. An officer appointed by the divisional secretariat may control illegal activities hampering natural vegetation in the area. In addition, cases in which a party is found guilty should be handled according to the regulations Felling of Trees Control Act No. 9, 1951 and its amended Act No. 1 of 2000 and the Flora and Fauna Protection Ordinance.
After construction, the disturbed areas should be re-vegetated. The abandoned areas and open areas of the permanent facilities could be re-vegetated with forest species that can be found in both
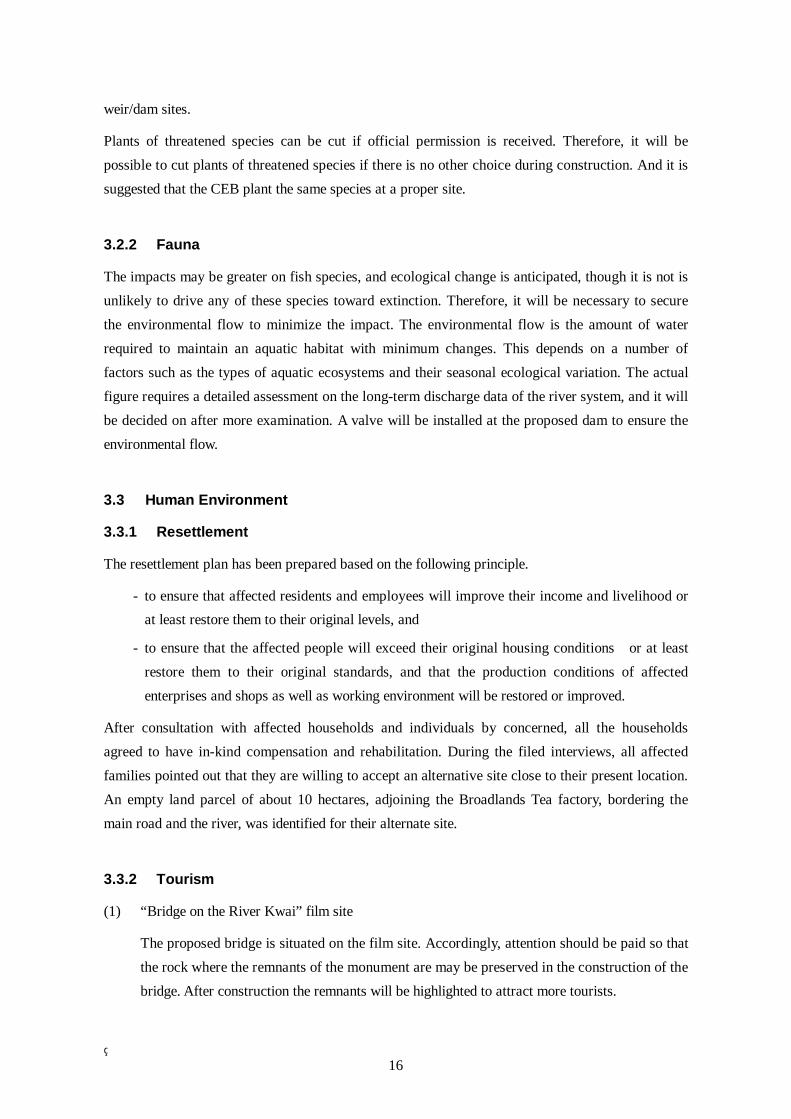
16
weir/dam sites.
Plants of threatened species can be cut if official permission is received. Therefore, it will be possible to cut plants of threatened species if there is no other choice during construction. And it is suggested that the CEB plant the same species at a proper site.
3.2.2 Fauna
The impacts may be greater on fish species, and ecological change is anticipated, though it is not is unlikely to drive any of these species toward extinction. Therefore, it will be necessary to secure the environmental flow to minimize the impact. The environmental flow is the amount of water required to maintain an aquatic habitat with minimum changes. This depends on a number of factors such as the types of aquatic ecosystems and their seasonal ecological variation. The actual figure requires a detailed assessment on the long-term discharge data of the river system, and it will be decided on after more examination. A valve will be installed at the proposed dam to ensure the environmental flow.
3.3 Human Environment
3.3.1 Resettlement
The resettlement plan has been prepared based on the following principle.
- to ensure that affected residents and employees will improve their income and livelihood or at least restore them to their original levels, and
- to ensure that the affected people will exceed their original housing conditions or at least restore them to their original standards, and that the production conditions of affected enterprises and shops as well as working environment will be restored or improved.
After consultation with affected households and individuals by concerned, all the households agreed to have in-kind compensation and rehabilitation. During the filed interviews, all affected families pointed out that they are willing to accept an alternative site close to their present location. An empty land parcel of about 10 hectares, adjoining the Broadlands Tea factory, bordering the main road and the river, was identified for their alternate site.
3.3.2 Tourism
(1) “Bridge on the River Kwai” film site
The proposed bridge is situated on the film site. Accordingly, attention should be paid so that the rock where the remnants of the monument are may be preserved in the construction of the bridge. After construction the remnants will be highlighted to attract more tourists.

17
(2) Whitewater rafting
Compensation should be paid to whitewater rafting companies based on the related laws and regulations if they are registered with the Ceylon Tourism Board. Hotels and other groups that depend on rafting tourism activities can be compensated as well if they satisfy certain conditions. Negotiation between the CEB and the related party will be held individually.
(3) Bathing and swimming
If there is an adverse effect on the most popular bathing spot, which is 2km downstream from the powerhouse site, the operation mode of the Broadlands power station will be altered in order to minimize the effect.

18
4. Proposed Monitoring Measures
4.1 Institutional Framework
The project proponent (the Ceylon Electricity Board) will establish an Environmental Management Office (EMO). It will be the body with overall responsibility for the implementation of the mitigation plan and monitoring plan, and it will function as a self-monitoring agency. It will instruct the contractor(s) so that they will follow the stipulated mitigation plan. An Environmental Manager (EM) will be appointed to be responsible for all the monitoring activities. And the EMO will be staffed with specialists to cover all important fields, such as flora, fauna, water quality, public health, etc.
The Resettlement Committee will be established as a part of the EMO. It will conduct all the resettlement work following the resettlement plan.
The Consultation Contact Office will be established as a part of the EMO as well. The residents can contact the office for consultation or make grievances on any issues related to the project.
The Monitoring Committee, of which the members will be appointed by the Project Approving Agency (the Central Environmental Authority), will consist of individuals from various line agencies and related local governments. They will monitor all of the EMO’s activities.
The project may accommodate the Public Monitoring Group. The group may consist of Grama Niladharies, CBO members, priests, school headmasters, divisional secretary members, etc.
The above Monitoring Committee and Public Monitoring Group will monitor all the activities of EMO and the Resettlement Committee and Consultation Contact Office.
In addition, the Advisory Committee, which will have two specialists (a natural environment specialist and a social environment specialist), will be established to give technical advice to the EMO from an independent position.
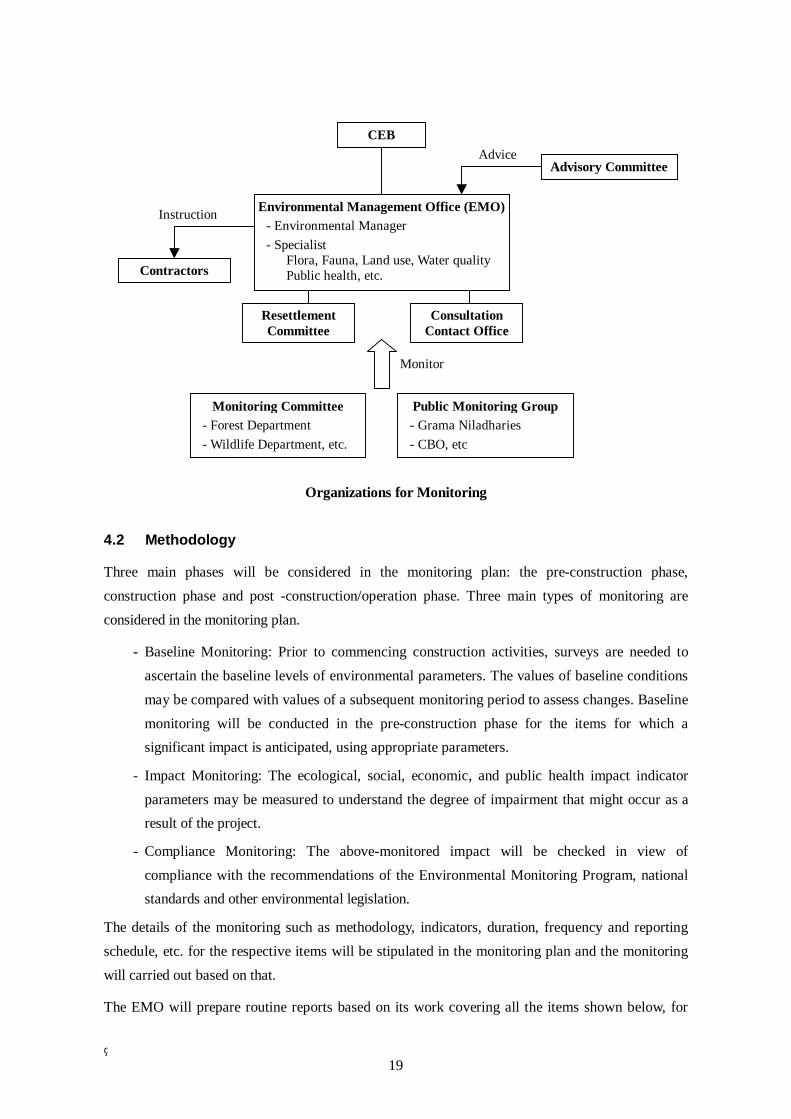
19
Organizations for Monitoring 4.2 Methodology
Three main phases will be considered in the monitoring plan: the pre-construction phase, construction phase and post -construction/operation phase. Three main types of monitoring are considered in the monitoring plan.
- Baseline Monitoring: Prior to commencing construction activities, surveys are needed to ascertain the baseline levels of environmental parameters. The values of baseline conditions may be compared with values of a subsequent monitoring period to assess changes. Baseline monitoring will be conducted in the pre-construction phase for the items for which a significant impact is anticipated, using appropriate parameters.
- Impact Monitoring: The ecological, social, economic, and public health impact indicator parameters may be measured to understand the degree of impairment that might occur as a result of the project.
- Compliance Monitoring: The above-monitored impact will be checked in view of compliance with the recommendations of the Environmental Monitoring Program, national standards and other environmental legislation.
The details of the monitoring such as methodology, indicators, duration, frequency and reporting schedule, etc. for the respective items will be stipulated in the monitoring plan and the monitoring will carried out based on that.
The EMO will prepare routine reports based on its work covering all the items shown below, for
Contractors
Environmental Management Office (EMO)- Environmental Manager - Specialist
Flora, Fauna, Land use, Water quality Public health, etc.
Advisory CommitteeAdvice
Instruction
CEB
Resettlement Committee
Public Monitoring Group- Grama Niladharies - CBO, etc
Monitoring Committee- Forest Department - Wildlife Department, etc.
Monitor
Consultation Contact Office

20
example, quarterly and annual reports and special reports which may be needed, and the CEB’s Project Office will arrange for the distribution of these report to related national and international agencies.

21
5. Conclusion and Recommendation
The study has revealed that no serious impacts on the natural/social environment are expected by the project implementation. This is partly because the project is a relatively small development project in a limited project area and the number of houses to be demolished is small (16). But conducting proper mitigation measures is a precondition regarding some items. Therefore, proper compensation for relocation, various mitigation measures, and proper monitoring and management of environment should carried out during both the construction and the operation stages.
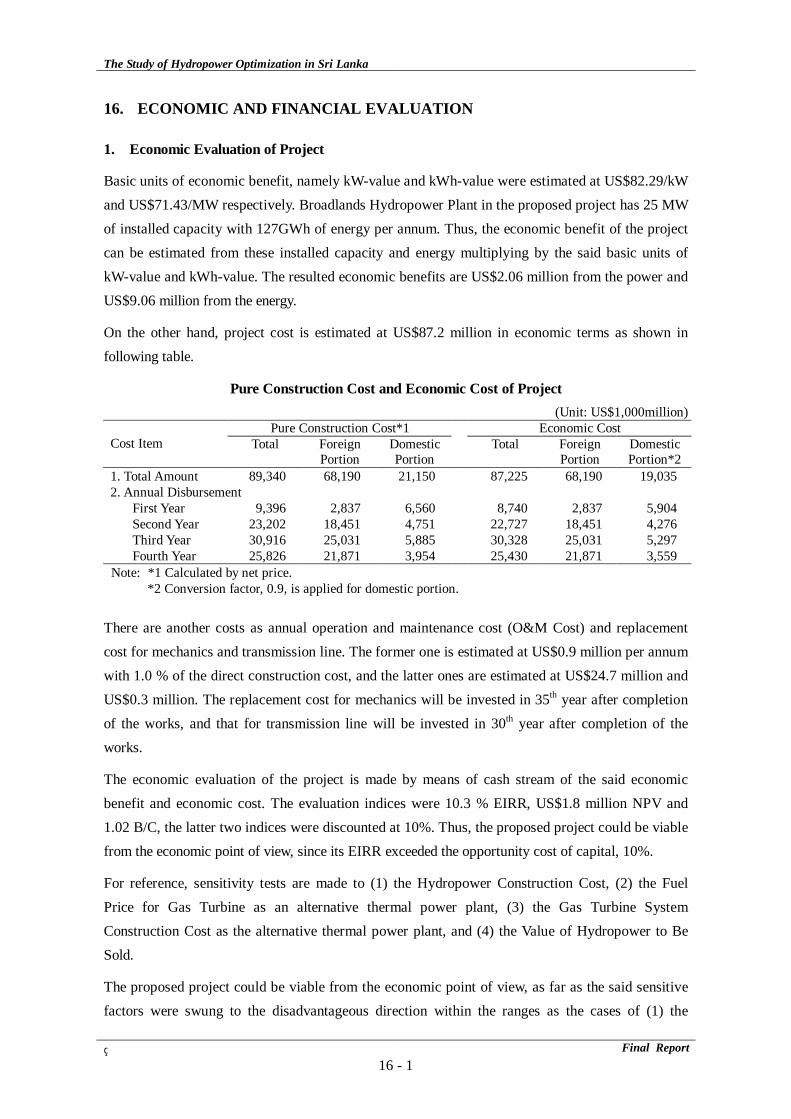
The Study of Hydropower Optimization in Sri Lanka
Final Report16 - 1
16. ECONOMIC AND FINANCIAL EVALUATION
1. Economic Evaluation of Project
Basic units of economic benefit, namely kW-value and kWh-value were estimated at US$82.29/kW and US$71.43/MW respectively. Broadlands Hydropower Plant in the proposed project has 25 MW of installed capacity with 127GWh of energy per annum. Thus, the economic benefit of the project can be estimated from these installed capacity and energy multiplying by the said basic units of kW-value and kWh-value. The resulted economic benefits are US$2.06 million from the power and US$9.06 million from the energy.
On the other hand, project cost is estimated at US$87.2 million in economic terms as shown in following table.
Pure Construction Cost and Economic Cost of Project (Unit: US$1,000million)
Pure Construction Cost*1 Economic Cost Cost Item Total Foreign
Portion Domestic Portion
Total Foreign Portion
Domestic Portion*2
1. Total Amount 89,340 68,190 21,150 87,225 68,190 19,035 2. Annual Disbursement
First Year 9,396 2,837 6,560 8,740 2,837 5,904 Second Year 23,202 18,451 4,751 22,727 18,451 4,276 Third Year 30,916 25,031 5,885 30,328 25,031 5,297 Fourth Year 25,826 21,871 3,954 25,430 21,871 3,559
Note: *1 Calculated by net price. *2 Conversion factor, 0.9, is applied for domestic portion.
There are another costs as annual operation and maintenance cost (O&M Cost) and replacement cost for mechanics and transmission line. The former one is estimated at US$0.9 million per annum with 1.0 % of the direct construction cost, and the latter ones are estimated at US$24.7 million and US$0.3 million. The replacement cost for mechanics will be invested in 35th year after completion of the works, and that for transmission line will be invested in 30th year after completion of the works.
The economic evaluation of the project is made by means of cash stream of the said economic benefit and economic cost. The evaluation indices were 10.3 % EIRR, US$1.8 million NPV and 1.02 B/C, the latter two indices were discounted at 10%. Thus, the proposed project could be viable from the economic point of view, since its EIRR exceeded the opportunity cost of capital, 10%.
For reference, sensitivity tests are made to (1) the Hydropower Construction Cost, (2) the Fuel Price for Gas Turbine as an alternative thermal power plant, (3) the Gas Turbine System Construction Cost as the alternative thermal power plant, and (4) the Value of Hydropower to Be Sold.
The proposed project could be viable from the economic point of view, as far as the said sensitive factors were swung to the disadvantageous direction within the ranges as the cases of (1) the
The Study of Hydropower Optimization in Sri Lanka
Final Report16 - 2
project cost is increased, (2) the fuel price of alternative thermal power plant is decreased by 3.1 %, (3) the construction cost of alternative thermal plant is 14 % cheaper than the base case, and (4) sending end energy volume is decreased by 2.9 %.
According to the “Long Term Generation Expansion Plan 2003-2017, CEB”, some gas turbine plants are planned for peaking power plants in the total of 525MW by 2017. In this context, the proposed Broadlands Hydropower Project could be worthy of execution in stead of these gas turbine plants in the near future from the economic viewpoint.
2. Financial Evaluation of Project
The project cost could be covered by revenue by collection of electricity charge. This revenue is to be the financial benefit. The revenue can be estimated from the electricity charge multiplying by the energy volume to be sold.
The average power price was set at Rs.7.25/kWh. The price was derived from the revenue of CEB’s electricity sales in 2002, quoted from “Statistical Digest 2002”. The revenue does not include VAT, so its virtual price was calculated Rs.7.98/kWh including 10% of VAT or US¢8.31/kWh at the exchange rate of Rs.96.00/US$.
Annual gross power generation of the proposed hydropower plant was expected to be 127 GWh at the plant. According to the CEB record in 2002, the system generation loss was estimated at 19.2% excluding station use, the total sales volume was estimated at 102GWh per annum. Accordingly, the sales revenue was calculated at US$8.5 million per annum.
In the financial evaluation, the project costs are estimated with actual market prices including taxes and duties. Since the cost was estimated in pure financial costs, the financial costs must include taxes and duties on the pure project cost.
The taxes and duties imposed on the project were composed as follows: 15% of customs duties including surcharge (20% of customs duty) and 12.5% of VAT for foreign portion; and 12.5% of VAT for local portion. The pure construction cost was estimated at US$89.3 million and the financial cost was calculated at US$112.0 million, as shown in the table below. Then, the taxes and duties around 25 % of the construction cost were added to the pure construction cost.
A transmission line was also estimated in financial terms in the same manner mentioned above. The financial cost was calculated at US$ 0.4 million.
As mentioned in the economic evaluation, the replacement costs have to be appropriated in accordance with their service lives. They were calculated in financial terms as follows: US$31.9 million for the machinery in 35 years after the completion of construction works, and US$ 0.4 million for the transmission line in 30 years. At the end of the evaluation period, these residual values were appropriated as negative figures of construction cost. The O&M cost was calculated at US$1.04 million in financial terms, 1% of the direct construction cost. Following table shows a

The Study of Hydropower Optimization in Sri Lanka
Final Report16 - 3
summary of the pure construction cost and the financial cost of the project.
Pure Construction Cost and Financial Cost (Unit: US$1000)
Pure Construction Cost*1 Financial Cost Item Total Foreign
Portion Local
Portion Total Foreign
Portion Local
Portion*2
1. Total Cost 89,346 68,190 21,150 112,015 88,221 23,794 2. Annual Disbursement
1st Year 9,396 2,834 6,560 11,050 3,670 7,380 2nd Year 23,202 18,451 4,751 29,216 23,871 5,345 3rd Year 30,916 25031 5,885 39,005 32,383 6,621 4th Year 25,826 21,871 3,954 32,745 28,296 4,449
Note: *1 Estimated at pure values.
The financial evaluation is also made by the cash stream of the said financial benefit and financial cost with the same manner in the case of the economic evaluation. The evaluation indices were 4.9 % % of FIRR, -US$42.1 million of NPV and 0.55 of B/C discounted at 10%. From the financial point of view, accordingly, the proposed project may not be said to be feasible in the case of discount rate of 10%.
Yet, a 4.9 % of FIRR means that the marginal efficiency of investment for the proposed project is 4.9 %. Thus, the project could be expected to have 4.9% of marginal efficiency for investment, if it were managed in the most efficient conditions. In other words, the project could be viable from the financial point of view, if a financial source of interest rate of less than 4.9 % were procured for execution of the project under favourable management conditions. In the actual management operation, some other management factors must be considered for execution, of course. Anyhow, FIRR generally indicates an interest rate which makes the management of the proposed project feasible.
For reference, also in the financial evaluation, sensitivity tests are made for the following factors as (1) hydropower construction cost, (2) power Rate, and (3) sending end energy volume to be sold. Following table shows its summarized results.
Summary of Result of Sensitivity Test
Construction Cost of Project Power Rate Sending End Volume of Energy FIRR NPV B/C FIRR NPV B/C FIRR NPV B/C +10% 4.2% -5,153 0.50 +10% 5.6 -3,685 0.61 +2% 5.0% -4,104 0.57 Base case 4.9% -4,209 0.55 Base
case 4.9% -4,209 0.55 Base case 4.9% -4,209 0.55
-10% 5.7% -3,264 0.62 -10% 4.1 4,733 0.50 -2% 4.7% -4,313 0.54 -20% 6.6% -2,319 0.69 -20% 3.3 5,256 0.44 -4% 4.6% -4,418 0.53 (Note) Unit of NPV is US$1,000. -6% 4.4% -4,523 0.52
As shown in the above table, in order that 10% higher hydropower construction cost than the base case makes the proposed project viable, the interest rate of financial source to the project must be lower than 4.2 % per annum from the financial point of view. And, in order that 20% lower power
The Study of Hydropower Optimization in Sri Lanka
Final Report16 - 4
rate than the base case makes the proposed project viable, the interest rate of financial source must be lower than 3.3 % per annum. Furthermore, in order that 6 % lower rate of power volume to be sold than the base case makes the proposed project is viable, the interest rate of financial source must be lower than 4.4 % per annum.
FIRR could show a marginal efficiency of investment, as discussed in the previous section. Thus, once the financial source of this rate is procured for the project execution, the project could be feasible from the financial viewpoint, i.e., the viewpoint of zero net present value. In the actual market, the management needs some other financial consideration in the actual operation and maintenance, though. Anyhow, this FIRR shows the level of financial feasibility resulting from various interest rates charged by the prospective financial sources. In accordance with the sensitivity analysis above, an appropriate interest rate from the financial sources could be suggested for the proposed project.
3. Analysis of Project Finance
A popular method of project profitability is generally accounting indices based on profit and loss table (PL-table). Its typical indices are a) Return on Equity (ROE)(it is generally expected at 10 % to 20 %) and b) Return on Investment (ROI) (it is also generally expected at 10 % to 20 %). In project finance, furthermore, solvency for capital input is inspected through cash flow. The most popular method for solvency verification is Debt Service Coverage Ratio (DSCR). It is a ratio of net profit before debt service payment in a certain year against total amount of loan. It verifies whether the cash flow has ability to meet debt payment due. This DSCR is also called as LLCR (= Loan Life Debt Service Coverage Ratio) for entire repayment period of the loan. So that, the solvency is verified mainly by this LLCR.
LLCR shows the multiple number of present value of net profit before debt service payment against principal amount of loans. It shows an index of testing solvency of project cash flow. It means an assessment rate of collateral. In other words, “LLCR=1.0” indicates that the project cash flow corresponds to the total amount of loans. Thus, if LLCR is below 1.0, the project could be difficult to cover its investment funds. It is said in general financial engineering that LLCR has to be 1.4 to 1.7 in order to make the loans secure solvency in project finance.
There are 2 cases for execution of the project as the cases of (1) using ODA finance, and (2) using private capital. Furthermore, the latter one has 2 types as 1) the cases that all the project cost is invested by private firms as IPP (alternative-1), and 2) the case of co-finance of private firm and public sector (alternative-2). For the former one, a case study was made by the following pre-conditions:
a) The Lending Conditions
Foreign finance: 75% of implementation cost, 1.5% of annual interest rate, and 30 years of repayment period including 10 years of grace period.
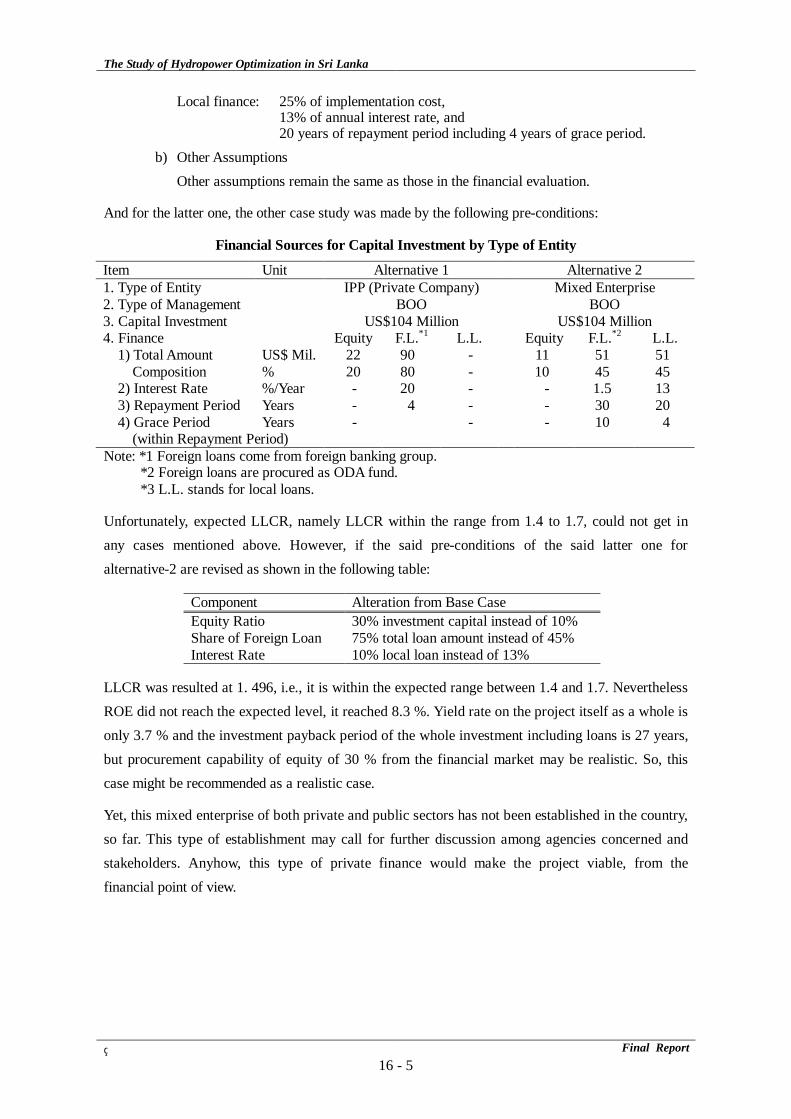
The Study of Hydropower Optimization in Sri Lanka
Final Report16 - 5
Local finance: 25% of implementation cost, 13% of annual interest rate, and 20 years of repayment period including 4 years of grace period.
b) Other Assumptions Other assumptions remain the same as those in the financial evaluation.
And for the latter one, the other case study was made by the following pre-conditions:
Financial Sources for Capital Investment by Type of Entity
Item Unit Alternative 1 Alternative 2 1. Type of Entity IPP (Private Company) Mixed Enterprise 2. Type of Management BOO BOO 3. Capital Investment US$104 Million US$104 Million 4. Finance Equity F.L.*1 L.L. Equity F.L.*2 L.L.
1) Total Amount US$ Mil. 22 90 - 11 51 51 Composition % 20 80 - 10 45 45
2) Interest Rate %/Year - 20 - - 1.5 13 3) Repayment Period Years - 4 - - 30 20 4) Grace Period Years - - - 10 4
(within Repayment Period) Note: *1 Foreign loans come from foreign banking group.
*2 Foreign loans are procured as ODA fund. *3 L.L. stands for local loans.
Unfortunately, expected LLCR, namely LLCR within the range from 1.4 to 1.7, could not get in any cases mentioned above. However, if the said pre-conditions of the said latter one for alternative-2 are revised as shown in the following table:
Component Alteration from Base Case Equity Ratio 30% investment capital instead of 10% Share of Foreign Loan 75% total loan amount instead of 45% Interest Rate 10% local loan instead of 13%
LLCR was resulted at 1. 496, i.e., it is within the expected range between 1.4 and 1.7. Nevertheless ROE did not reach the expected level, it reached 8.3 %. Yield rate on the project itself as a whole is only 3.7 % and the investment payback period of the whole investment including loans is 27 years, but procurement capability of equity of 30 % from the financial market may be realistic. So, this case might be recommended as a realistic case.
Yet, this mixed enterprise of both private and public sectors has not been established in the country, so far. This type of establishment may call for further discussion among agencies concerned and stakeholders. Anyhow, this type of private finance would make the project viable, from the financial point of view.

The Study of Hydropower Optimization in Sri Lanka
Final Report17 - 1
17. APPLICATION OF CDM TO THE BROADLANDS HYDROPOWER PROJECT
JICA decided to prepare a project design document (PDD) of the Clean Development Mechanism (CDM) in “The Study of Hydropower Optimization in Sri Lanka” using the Broadlands Hydropower Project as a model project.
The Study Team gathered data for the PDD, held interviews with parties concerned, and gathered information about the institutional structure and organizations for the CDM and their activities and status.
17.1 International Circumstances of CDM
In May 1992, the United Nations Framework Convention on Climate Change (UNFCCC) was adopted, and international negotiations on greenhouse gas (GHG) emission reduction were launched. In 1997, the Kyoto Protocol was adopted at the Conference of the Parties 3 (COP3). The target of GHG emission reduction and introduction of three additional mechanisms, which are called the “Kyoto Mechanisms,” were decided on as part of the Kyoto Protocol. The purpose of these additional mechanisms is to achieve the emission reduction target of each country using the market mechanism. In 2001, the Marrakech Accord was adopted at the Conference of the Parties 7 (COP7) and it defines the rule for administering the Kyoto Mechanisms.
17.1.1 Kyoto Mechanisms
The Kyoto Mechanisms are the following three methods established by the Kyoto Protocol to facilitate meeting emission reduction targets:
- Joint Implementation (JI)
- Clean Development Mechanism (CDM)
- Emissions Trading (ET)
The CDM is the method by which an Annex I country cooperates with a non-Annex I country to implement an emission reduction project in the non-Annex I country. As the result of the activity, a carbon credit based on the emission reduction by the project is issued and the credit is shared by the project participants.
Russia’s ratification is the final issue for the Kyoto Protocol to come into effect.
17.1.2 Marrakech Accord
According to the Marrakech Accord, project participants should get the approval of both the Annex I country (the investing country) and the host country (the receiving country). They should then
The Study of Hydropower Optimization in Sri Lanka
Final Report17 - 2
submit a project design document (PDD) to the Designated Operational Entity (DOE) that is designated by the COP and get its approval.
17.1.3 Recent Trends of CDM
The baseline methodology and monitoring methodology should be determined in the PDD. These methodologies have to be selected from those registered by the CDM Executive Board (EB). So far, two sets of baseline and monitoring methodologies have been registered by the EB formally and seven sets were approved. Many more new methodologies have been proposed by project participants in order to implement CDM projects, and have been considered by the EB.
There is no approved methodology for hydropower projects, and only two such methodologies have been proposed to the EB.
17.2 Circumstances of CDM in Sri Lanka
Sri Lanka declared accession to the Kyoto Protocol on Sept. 3, 2002; it qualifies as a host country for CDM projects.
The Department of Environmental Economics and Global Affairs in the Ministry of Environment and Natural Resources are in charge of the CDM in Sri Lanka at the moment. The key person in the department is Dr. Batagoda (1), who is also administrator of the CDM project.
(1) Director, Department of Environmental Economics and Global Affairs, Ministry of Environment and Natural Resources
The decision to adopt a project as a CDM project will be made according to the “National CDM Policy.” Dr. Batagoda has prepared a preliminary draft and it will be the formal national policy after receiving cabinet approval. It is in the final stage of preparation.
The institution the CDM in Sri Lanka has nearly been determined but it is not yet set up to work. The figure below shows established organizations and those to be established, and it also shows the framework for the CDM in Sri Lanka. In the figure, a heavy line indicates an established organization, and a dashed line indicates one that has not yet been established or whose establishment is under consideration.
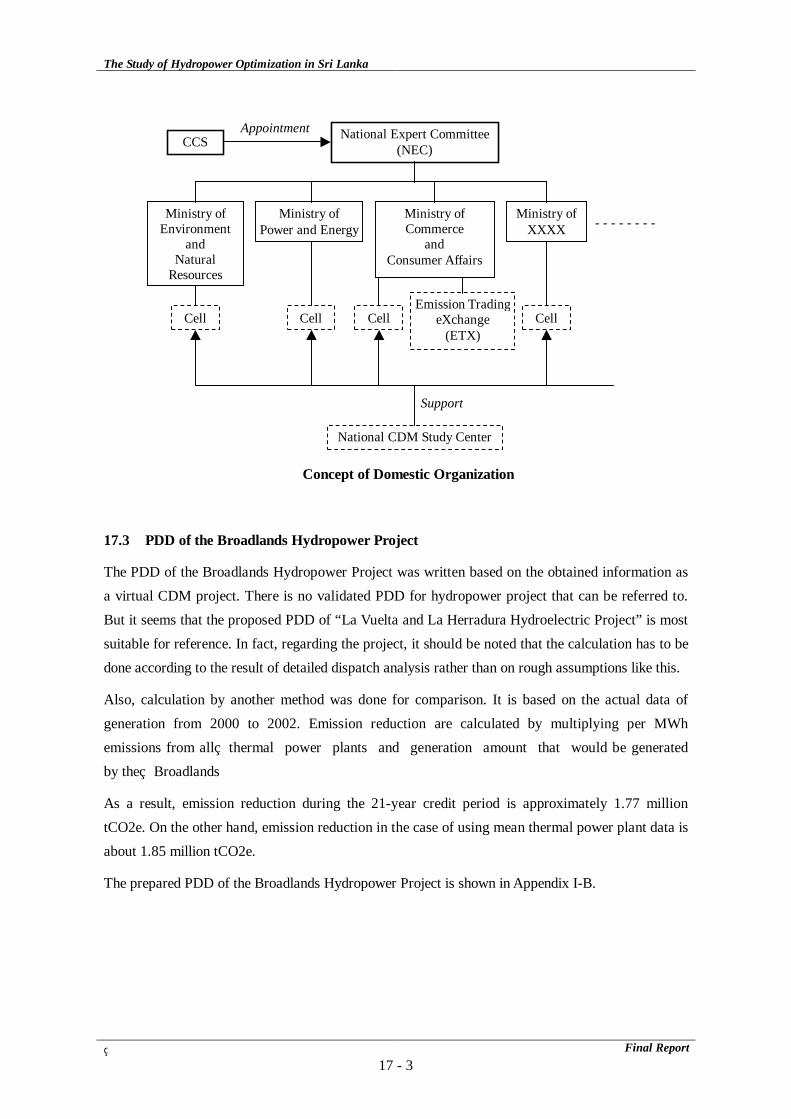
The Study of Hydropower Optimization in Sri Lanka
Final Report17 - 3
17.3 PDD of the Broadlands Hydropower Project
The PDD of the Broadlands Hydropower Project was written based on the obtained information as a virtual CDM project. There is no validated PDD for hydropower project that can be referred to. But it seems that the proposed PDD of “La Vuelta and La Herradura Hydroelectric Project” is most suitable for reference. In fact, regarding the project, it should be noted that the calculation has to be done according to the result of detailed dispatch analysis rather than on rough assumptions like this.
Also, calculation by another method was done for comparison. It is based on the actual data of generation from 2000 to 2002. Emission reduction are calculated by multiplying per MWh emissions from all thermal power plants and generation amount that would be generated by the Broadlands
As a result, emission reduction during the 21-year credit period is approximately 1.77 million tCO2e. On the other hand, emission reduction in the case of using mean thermal power plant data is about 1.85 million tCO2e.
The prepared PDD of the Broadlands Hydropower Project is shown in Appendix I-B.
National Expert Committee(NEC) CCS
Ministry of Environment
and Natural
Resources
Ministry ofPower and Energy
Ministry of Commerce
and Consumer Affairs
Ministry of XXXX - - - - - - - -
Emission Trading eXchange
(ETX)
Appointment
National CDM Study Center
Support
Concept of Domestic Organization
Cell Cell Cell Cell