STUDY GUIDE HL - Learn – Online IB exam revision by ib ... · PDF filebasically discuss...
140
2017. HL STUDY GUIDE
-
Upload
hoangnguyet -
Category
Documents
-
view
217 -
download
1
Transcript of STUDY GUIDE HL - Learn – Online IB exam revision by ib ... · PDF filebasically discuss...

2017.
HLS T U D Y G U I D E


TABLE OF CONTENTS
Introduction 5
1. Microeconomics 7– Demand and supply – Externalities – Governmentintervention – The theory of the firm – Market structures– Price discrimination
2. Macroeconomics 51– Overall economic activity – Aggregate demand andaggregate supply – Macroeconomic objectives – EconomicGrowth – Government Intervention
3. International Economics 77– Trade – Exchange rates – The balance of payments – Termsof trade
4. Development Economics 93– Economic development – Measuring development– Contributions and barriers to development – Evaluation ofdevelopment policies
5. Definitions 105– Microeconomics – Macroeconomics – InternationalEconomics – Development Economics
3

TABLE OF CONTENTS
6. Abbreviations 125
7. Essay guide 131– Time Management – Understanding the question – Essaywriting style – Worked example
4

INTRODUCTION
The foundations of economics
Before we start this course, we must first look at the foundations of economics. We willbasically discuss what the science of economics actually is and what the scope of thisscience might be.
• Economics is a social science on how to deal with scarcity.
• Scarcity is the problem of having infinite wants, or unlimited desires, while havingonly finite resources, or limited means, to fulfill these wants.
• A small scale example of scarcity: a person wants to buy a laptop and a phone, buthas only enough money to buy one of the two.
• In general we describe this problem of scarcity as the economic problem.
The solution to the economic problem
In order to solve the economic problem, we must make choices between the differentalternatives we are faced with. In a general economy these choices must be made on:
• What to produce?
• How to produce?
• For whom to produce?
When a choice is made, an alternative is always foregone. We call this the opportunity costof the choice.
Opportunity cost The value of the next best alternative that is lost whilemaking a choice.
5

INTRODUCTION
For example: A person has only enough money to buy one of three of the followingitems: a smartphone, a laptop, a tablet.
• He lists the items in order of how much he or she desires them: (1) laptop,(2) smartphone, (3) tablet.
• Because he or she desires the laptop the most, the laptop will be chosen.
• The next best alternative, in this case the smartphone which is next on the list, willbe the opportunity cost of the choice.
In the IB course we will look at the economic problem from different viewpoints and indifferent domains.
Structure of the course
In this course we will study the economic problem in four themes:
1. How can governments help solve the economic problem in different cases?
2. How is sustainability threatened, while people or companies are making an effortto solve their economic problem?
3. How does efficiency conflict with equity while people or companies are making aneffort to solve their economic problem?
4. How does economic growth conflict with economic development whilecompanies or governments are making an effort to solve their economic problem?
We will study these questions in each of the following four economic domains:
Microeconomics: the science of choosing on a small scale (individuals, companies).
Macroeconomics: the science of choosing on a big scale (regions, countries).
International economics: the science of choosing in interaction with other countries(continents, the entire world).
Development economics: the science of choosing in order to develop more welfare(developing countries).
During this economics course we will go through all four domains and discuss thematerial you need to understand for your IB exam. This guide contains a summary of thecontents of the course.
6

1MICROECONOMICS
1.1. Demand and supply 8– Demand – Supply – Equilibrium – Market efficiency
1.2. Externalities 19– Definitions – Economics of externalities – Externalities ofproduction – Externalities of consumption – Other sources ofmarket failure
1.3. Government intervention 24– Indirect taxes – Subsidies – Price controls
1.4. The theory of the firm 30– Production and costs – Revenues – Profit – Goals of the firm
1.5. Market structures 37– Perfect competition – Monopoly – Monopolisticcompetition – Oligopoly
1.6. Price discrimination 48– Definition and conditions – Three degrees of pricediscrimination
7

MICROECONOMICS Demand and supply
1.1 Demand and supply
1.1.1 Demand
Law of demand when price goes up, ceteris paribus, quantity demanded goesdown. Therefore, a negative relationship exists between price andquantity demanded.
This relationship makes sense because consumers will want to buy less of a good whenits price has risen.
Ceteris paribus means ‘when all else remains equal’. In this case it means that the law ofdemand only holds when everything except price and quantity demanded remains thesame.
The law of demand can also be written as a formula, the formula of the demandcurve, which has the following general form:
QD = a− bP
In this formula:
• QD =Quantity Demanded;• P= Price;• a = intersect; if the a in the formula changes, the demand curve will shift to
the left (if a decreases) or to the right (if a increases);• b = slope; the higher the b , the higher the slope of the demand curve; in
the case of the demand curve, b will be negative because of the negativerelationship between price and quantity demanded.
Figure 1.1: The demand curve.
Quantity Demanded
Pric
e
Q1
P1
Q2
P2
B
A
A move along the demand curve occurswhen the price of the product changes.If, for example, the price increases, ashift along the demand curve mayoccur from point B to point A.
A shift of the demand curve occurs incases in which any other factor thanprice changes.
8

MICROECONOMICS Demand and supply 1
Below the most important of these factors are listed along with their effect on thedemand curve:
The income of consumers In general when the income of consumersincreases (decreases), consumers will have more (less) money to spend. Theirdemand of the good of which the demand curve is drawn will increase (decrease).This will shift the demand curve to the right (left).
⇒ The shift above will only happen if the good in question is a normalgood (i.e. any good for which demand increases when income increases).Most goods on the market are normal goods.
⇒ In the case of inferior goods (i.e. goods for which demand decreases whenincome increases) the opposite will happen. When incomeincreases (decreases), the demand curve will shift to the left (right). Anexample of an inferior good is a hamburger from McDonald’s. When theincome of people increases, they will typically use the extra money to buybetter, healthier and more expensive types of food so demand for hamburgersgoes down.
Prices of complementary goods A complementary good is a good that is consumedalong with another good. Examples of complementary goods include cars withfuel, computers with computer software and christmas trees with christmasdecorations. When the price of a complementary good increases (decreases), thedemand for the original good will decrease (increase), shifting the demand curvefor the original good to the left (right).
Prices of substitute goods A substitute good is a good that is consumed instead ofanother good. Examples of substitute goods include iPhones vs. Samsung phones,Volkswagen vs. Opel cars and match sticks vs. lighters. When the price of asubstitute good increases (decreases), consumption of the original goodincreases (decreases) because it is now a relatively less expensive (more expensive)alternative. This will shift the demand curve for the original good to theright (left).
Population When the population increases (decreases) there will be more (less) peopleto demand the good. This will increase (decrease) demand, shifting the demandcurve to the right (left).
Taste when taste (e.g. in fashion) changes so will the demand for certain goods. Thisdepends on the change. If wearing a certain type of shoe suddenly becomes a trend,the demand for this type of shoe will increase, shifting the demand curve to theright.
9

MICROECONOMICS Demand and supply
1.1.2 Supply
Law of supply Higher prices will, ceteris paribus, increase quantity supplied.Therefore a positive relationship exists between price and quantitysupplied.
This relationship makes sense, because producers will want to make and sell moreproducts when the price on the market for these products has increased in order to makemore profit.
Ceteris paribus means ‘when all else remains equal’. In this case it means that the law ofsupply only holds when everything except price and quantity supplied remains the same.
The law of demand can also be written as a formula, the formula of the demandcurve, which has the following general form:
QS = c + dP
In this formula:
• QS = quantity supplied;• P= price;• c = intersect; if c in the formula changes, the demand curve will shift to the
left (if c decreases) or to the right (if c increases);• d = slope; the higher the d , the higher the slope of the supply curve; in the
case of the supply curve, d will be positive because of the positive relation-ship between price and quantity demanded.
Figure 1.2: The demand curve.
Quantity Supplied
Pric
e
Q1
P1
Q2
P2
B
A
A move along the supply curve occurswhen the price of the product changes.If, for example, the price increases, ashift along the supply curve may occurfrom point B to point A.
A shift of the supply curve occurs incases in which any other factor thanprice changes.
10
MICROECONOMICS Demand and supply 1
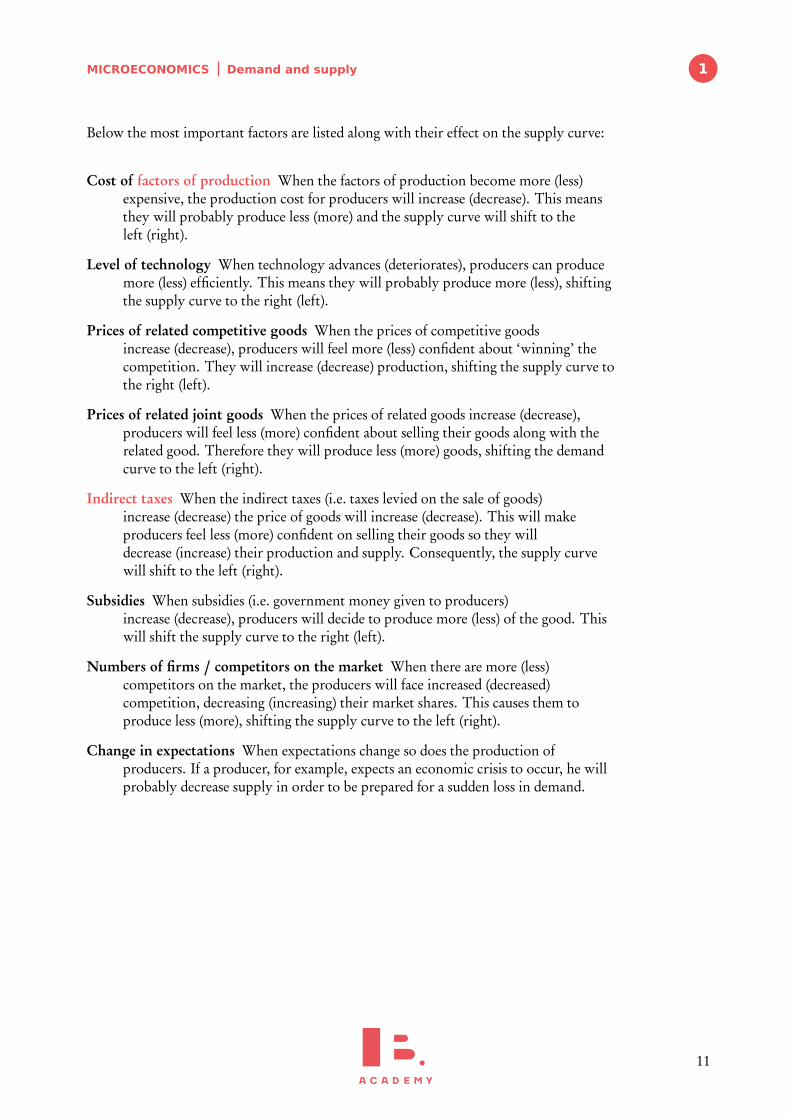
Below the most important factors are listed along with their effect on the supply curve:
Cost of factors of production When the factors of production become more (less)expensive, the production cost for producers will increase (decrease). This meansthey will probably produce less (more) and the supply curve will shift to theleft (right).
Level of technology When technology advances (deteriorates), producers can producemore (less) efficiently. This means they will probably produce more (less), shiftingthe supply curve to the right (left).
Prices of related competitive goods When the prices of competitive goodsincrease (decrease), producers will feel more (less) confident about ‘winning’ thecompetition. They will increase (decrease) production, shifting the supply curve tothe right (left).
Prices of related joint goods When the prices of related goods increase (decrease),producers will feel less (more) confident about selling their goods along with therelated good. Therefore they will produce less (more) goods, shifting the demandcurve to the left (right).
Indirect taxes When the indirect taxes (i.e. taxes levied on the sale of goods)increase (decrease) the price of goods will increase (decrease). This will makeproducers feel less (more) confident on selling their goods so they willdecrease (increase) their production and supply. Consequently, the supply curvewill shift to the left (right).
Subsidies When subsidies (i.e. government money given to producers)increase (decrease), producers will decide to produce more (less) of the good. Thiswill shift the supply curve to the right (left).
Numbers of firms / competitors on the market When there are more (less)competitors on the market, the producers will face increased (decreased)competition, decreasing (increasing) their market shares. This causes them toproduce less (more), shifting the supply curve to the left (right).
Change in expectations When expectations change so does the production ofproducers. If a producer, for example, expects an economic crisis to occur, he willprobably decrease supply in order to be prepared for a sudden loss in demand.
11

MICROECONOMICS Demand and supply
1.1.3 Equilibrium
Supply and demand interact to produce market equilibrium. This market equilibriumwill be at the intersection of the demand and the supply curve, where supply equalsdemand (see Figure 1.3).
At this equilibrium point, you can find the equilibrium quantity (Q∗) at the horizontalaxis and the equilibrium price or market price (P∗) at the vertical axis.
But in some cases the price is different from P∗:
• If the price lies above the market price, the quantity supplied will be higher thanthe quantity demanded (QS >QD). In this case there will be excess supply.
• If the price lies below the market price, the quantity demanded will be higher thanthe quantity supplied (QD >QS). In this case there will be excess demand.
Figure 1.3: Equilibrium.
Quantity
Pric
e
QS
QD
Q∗
P∗
Figure 1.4: Excess supply.
Quantity
Pric
e
QS
QD
Q∗
P∗
QD2QS2
P2
excess supply
Figure 1.5: Excess demand.
Quantity
Pric
e
QS
QD
Q∗
P∗
QS1QD1
P1excess demand
In general, price can be said to have two functions on a market:
Signalling function: A high price is a signal to producers that consumers want to buythe good.
Incentive function: A higher price is an incentive for producers to produce more toincrease profit.
12
MICROECONOMICS Demand and supply 1
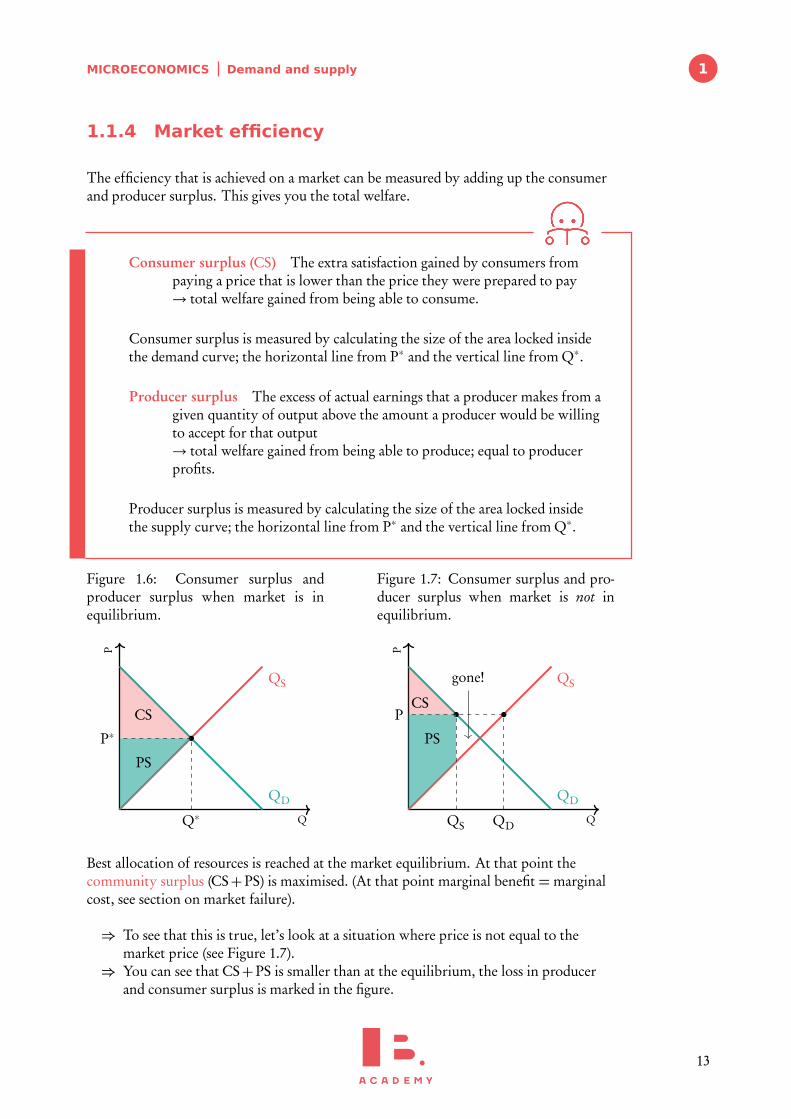
1.1.4 Market efficiency
The efficiency that is achieved on a market can be measured by adding up the consumerand producer surplus. This gives you the total welfare.
Consumer surplus (CS) The extra satisfaction gained by consumers frompaying a price that is lower than the price they were prepared to pay→ total welfare gained from being able to consume.
Consumer surplus is measured by calculating the size of the area locked insidethe demand curve; the horizontal line from P∗ and the vertical line from Q∗.
Producer surplus The excess of actual earnings that a producer makes from agiven quantity of output above the amount a producer would be willingto accept for that output→ total welfare gained from being able to produce; equal to producerprofits.
Producer surplus is measured by calculating the size of the area locked insidethe supply curve; the horizontal line from P∗ and the vertical line from Q∗.
Figure 1.6: Consumer surplus andproducer surplus when market is inequilibrium.
Q
P
QS
QD
Q∗
P∗
PS
CS
Figure 1.7: Consumer surplus and pro-ducer surplus when market is not inequilibrium.
Q
P
QS
QD
QS QD
P
PS
CS
gone!
Best allocation of resources is reached at the market equilibrium. At that point thecommunity surplus (CS+PS) is maximised. (At that point marginal benefit =marginalcost, see section on market failure).
⇒ To see that this is true, let’s look at a situation where price is not equal to themarket price (see Figure 1.7).
⇒ You can see that CS+PS is smaller than at the equilibrium, the loss in producerand consumer surplus is marked in the figure.
13
MICROECONOMICS Demand and supply
Elasticities
Elasticities are used to measure the effect a change in some factor (income, price of agood, price of another good etc.) has on supply and demand of a good. For your IB examyou must know of four different elasticities which we will discuss here.
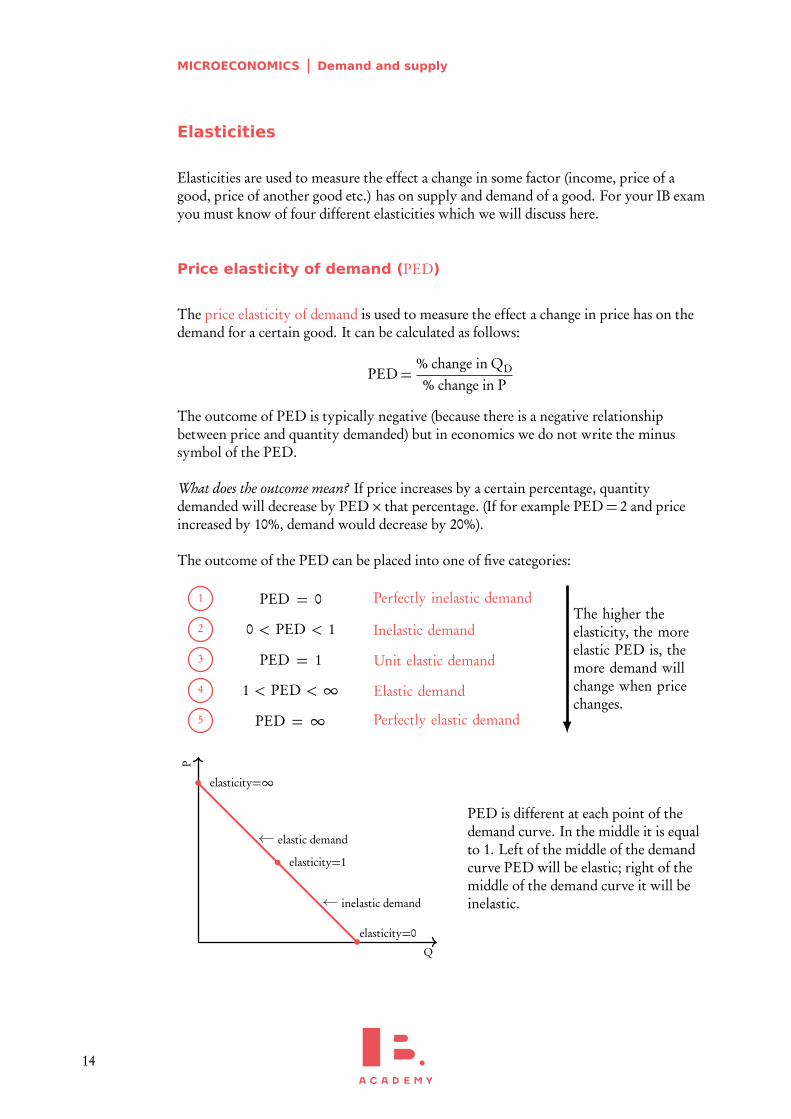
Price elasticity of demand (PED)
The price elasticity of demand is used to measure the effect a change in price has on thedemand for a certain good. It can be calculated as follows:
PED=% change in QD
% change in P
The outcome of PED is typically negative (because there is a negative relationshipbetween price and quantity demanded) but in economics we do not write the minussymbol of the PED.
What does the outcome mean? If price increases by a certain percentage, quantitydemanded will decrease by PED× that percentage. (If for example PED= 2 and priceincreased by 10%, demand would decrease by 20%).
The outcome of the PED can be placed into one of five categories:
PED = 0 Perfectly inelastic demand
0 < PED < 1 Inelastic demand
PED = 1 Unit elastic demand
1 < PED < ∞ Elastic demand
PED = ∞ Perfectly elastic demand
1
2
3
4
5
The higher theelasticity, the moreelastic PED is, themore demand willchange when pricechanges.
Q
P
•
•
•
elasticity=0
elasticity=1
elasticity=∞
inelastic demand
elastic demand
PED is different at each point of thedemand curve. In the middle it is equalto 1. Left of the middle of the demandcurve PED will be elastic; right of themiddle of the demand curve it will beinelastic.
14

MICROECONOMICS Demand and supply 1
There are two exceptions to the rule above:
On a completely horizontal demandcurve, PED=∞ at every point.
Q
P
PED=∞D
On a completely vertical demand curve,PED= 0 at every point.
QP
PED= 0
D
When PED is elastic, firms should lower their price to get more revenue because in thatcase demand will increase more than the price will decrease. The opposite will be thecase when PED is inelastic. When PED= 1, the firm should leave the price at thecurrent level; revenue is maximised at this point.
Governments want to tax goods with an inelastic PED because demand changes less thanthe price increase due to the tax, so they can make more tax revenue on these goods.
The size of the price elasticity of demand is influenced by the following factors:
The number and closeness of substitutes: The more substitutes, the higher PED. Ifthere are a lot of substitutes, consumers can easily switch to another product whenthe price of the product increases.
The degree of necessity: The higher the need for the product, the lower PED.Consumers will buy goods they need anyway, regardless of the price. Examplesinclude: food and gasoline.
The time period over which PED is measured: The longer this time period, thehigher PED. In the long run, consumers have more time to look for alternatives /substitutes for a good. They will switch more often if the price of the goodincreases.
The proportion of income spent on the good: The smaller this proportion, the lowerPED. When the proportion of income spent on a good is low, consumers will notnotice or care about a price change and still buy the same proportion of the good.
The type of good: Primary commodities (i.e. materials in raw unprocessed state) have alower PED than manufactured commodities. Primary commodities are necessaryfor producers in order to produce. They will buy them anyway, regardless of theprice that is asked for them.
15

MICROECONOMICS Demand and supply
Price elasticity of supply (PES)
The price elasticity of supply is used to measure the effect a change in price has on thesupply for a certain good. It can be calculated as follows:
PES=% change in QS
% change in P
The outcome of PES is typically positive (because there is a positive relationship betweenprice and quantity demanded).
What does the outcome mean? If price increases by a certain percentage, quantity suppliedwill increase by PES× that percentage. (If for example PES= 2 and price increased by10%, supply would increase by 20%).
The outcome of the PES can be placed into one of five categories:
PES = 0 Perfectly inelastic supply
0 < PES < 1 Inelastic supply
PES = 1 Unit elastic supply
1 < PES < ∞ Elastic supply
PES = ∞ Perfectly elastic supply
1
2
3
4
5
The higher theelasticity, the moreelastic PES is, themore supply willchange when pricechanges.
PES is different at each point of the supply curve, but there are two exceptions to the ruleabove:
On a completely horizontal supplycurve, PES=∞ at every point.
Q
P
PES=∞S
On a completely vertical supply curve,PES= 0 at every point.
Q
P
PES= 0
S
16
MICROECONOMICS Demand and supply 1
The size of the price elasticity of supply is influenced by the following factors:
Mobility of factors of production: The more mobile factors of production are, theeasier it is for producers to buy and sell them. This means it is easier for producersto increase or decrease production, therefore the PES will be more elastic.
Unused capacity: When producers have a lot of unused capacity, it will be easier toincrease production if necessary, therefore the PED will be more elastic.
Ability to store stocks: If a firm is able to store high levels of stock of their product,they will be able to react to price increases with swift supply increases andtherefore the PES for the product will be relatively high.
The time period over which PES is measured: PES will be higher when it is measuredin the long run since companies will have more time to adjust production to pricelevels. In the short run producers often can’t change supply by that much.
Type of goods: Primary commodities typically have a low PES while manufacturedcommodities often have a high PES. This is due to the higher necessity of primarygoods (in manufacturing and general usage) compared to manufactured goods.
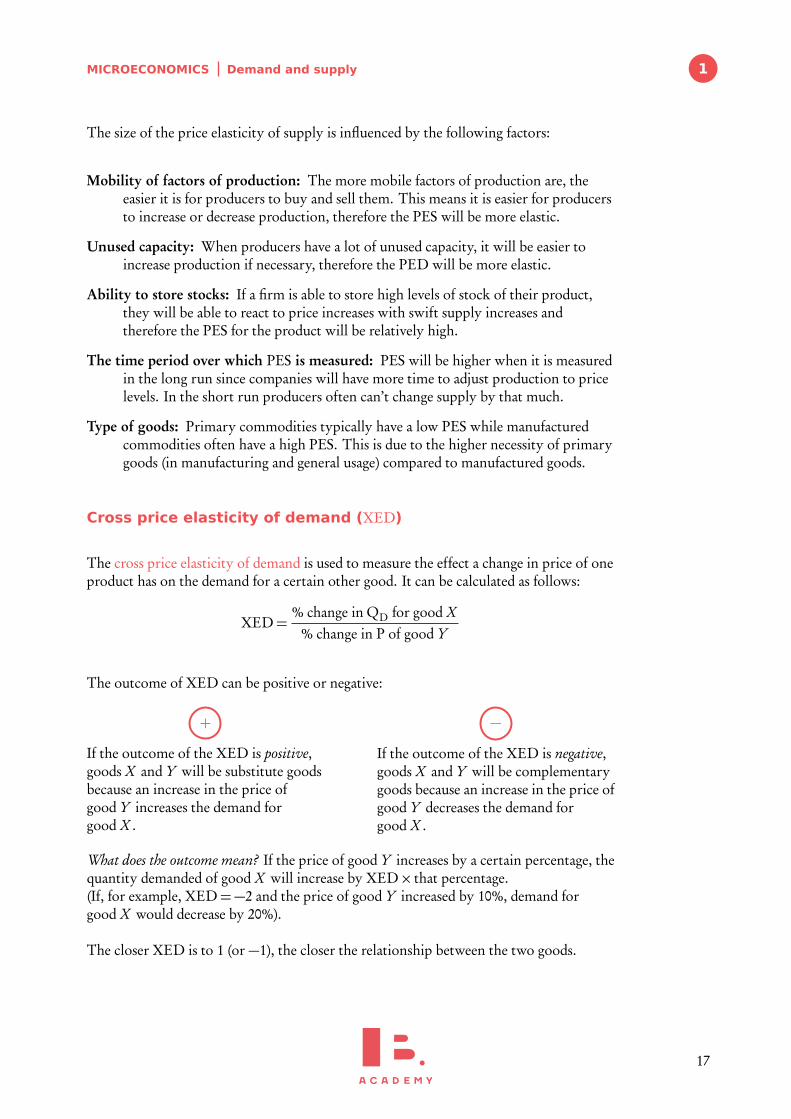
Cross price elasticity of demand (XED)
The cross price elasticity of demand is used to measure the effect a change in price of oneproduct has on the demand for a certain other good. It can be calculated as follows:
XED=% change in QD for good X
% change in P of good Y
The outcome of XED can be positive or negative:
+
If the outcome of the XED is positive,goods X and Y will be substitute goodsbecause an increase in the price ofgood Y increases the demand forgood X .
−
If the outcome of the XED is negative,goods X and Y will be complementarygoods because an increase in the price ofgood Y decreases the demand forgood X .
What does the outcome mean? If the price of good Y increases by a certain percentage, thequantity demanded of good X will increase by XED× that percentage.(If, for example, XED=−2 and the price of good Y increased by 10%, demand forgood X would decrease by 20%).
The closer XED is to 1 (or −1), the closer the relationship between the two goods.
17

MICROECONOMICS Demand and supply
Income elasticity of demand (YED)
The income elasticity of demand is used to measure the effect that a change in income ofconsumers has on the demand for a certain product. It can be calculated as follows:
YED=% change in QD
% change in income
The outcome of YED can be positive or negative:
+
If the outcome of the YED is positive,the good of which the YED iscalculated is a normal good. Whenincome increases, so does consumptionof the good.
−
If the outcome of the YED is negative,the good will be an inferior good.When income increases theconsumption of the good will decrease.
What does the outcome mean? If the income of consumers is increased by a certainpercentage, the quantity demanded the good will increase by YED× that percentage.(If, for example, YED=−2 and the income of consumers has increased by 10%, demandfor the good would decrease by 20%).
Goods can also be placed into two categories based on the size of the YED:
1. If YED> 1, YED is said to be income elastic and the good of which YED iscalculated is a luxury good because an increase in income will lead to a spectacularincrease in demand for these goods. Examples of luxury goods include jewelry andsports cars.
2. If YED< 1, YED is said to be income inelastic and the good of which YED iscalculated is a necessity good because an increase in income won’t change thedemand for these goods that much, consumers will need them anyway. Examplesof necessity goods include food and medicine.
18
MICROECONOMICS Externalities 1
1.2 Externalities
1.2.1 Definitions
Before discussing the economics of market failures and externalities, it is important tounderstand a few definitions:
Market failure failure of the market to achieve allocative efficiency resultingin an overallocation or underallocation of resources.
An externality occurs when production or consumption of a good has an effecton a third party for which the latter does not pay or does not get compensated.
• This effect can be positive (benefit) in which case we speak of positiveexternalities. Examples include getting educated. The third party thatwould benefit in this case would be the society in general.
• This effect can be negative (cost) in which case we speak of negativeexternalities. Examples include pollution from the production of a good,which hurts society (the third party).
Marginal private costs (MPC) costs of production that are taken intoaccount in a firm’s decision making process. The MPC curve is equal tothe supply curve.
Marginal private benefits (MPB) benefits the individual enjoys from theconsumption of an extra unit of a good. The MPB curve is equal to thedemand curve.
Marginal social cost (MSC) cost of production to society.
Marginal social benefit (MSB) benefit of consumption of one extra unit tosociety.
19

MICROECONOMICS Externalities
1.2.2 Economics of externalities
In the ideal situation, the marginal social costs are equal to the marginal private costs andthe marginal social benefits are equal to the marginal private benefits (so MPC=MSC,MPB=MSB). The price is determined at the intersection of the demand and supplycurves, which also means that the marginal social costs are equal to the marginal socialbenefits (so MSC=MSB).
Figure 1.8: The ideal situation in which MPC =MSC and MPB=MSB.
Q
P
social efficiency
QS =MPC=MSC
QD =MPB=MSB
Q∗
P∗PS
CS
Have a look at the graph: inthis situation the communitysurplus will be maximised,remember?
In reality, MPC and MSC and MPB and MSB are often not the same. In total fourdifferent scenario’s are possible:
MSC > MPC negative externality of production
MSC < MPC positive externality of production
MSB < MPB negative externality of consumption
MSB > MPB positive externality of consumption
1
2
3
4
In general we can say the following so the ideal situation is reached when the externalitiesare equal to zero:
MSC=MPC+ externalities MSB=MPB+ externalities
We will have a look at all four alternatives in the two sections that follow.
20

MICROECONOMICS Externalities 1
1.2.3 Externalities of production
Negative externalities ofproduction
Q
P
MSCMPC
MSBQ1
P1
Q∗
P∗
welfare loss
negative externalities
In this case MSC>MPC, the MSC curve liesabove the MPC curve. This can be caused bypolluting production.As you can see the negative externality leadsto a welfare loss (the shaded triangle).The government can end this by taxing thecompanies and thereby increasing their MPCshifting the MPC curve upwards.
Positive externalities ofproduction
Q
P
MPCMSC
MSBQ1
P1
Q∗
P∗
potential welfare gain
positive externalities
In this case MSC<MPC, the MSC curve liesbelow the MPC curve. This can be caused bygreen production.As you can see the positive externality leads toa potential welfare gain (the shaded triangle).The company produces at Q1 and P1, whilemax welfare could be achieved at Q∗, P∗.The government could achieve this bysubsidising the companies, shifting their MPCcurve downwards.
1.2.4 Externalities of consumption
Negative externalities ofconsumption
Q
P
MSC
MSB
MPBQ1
P1
Q∗
P∗
welfare loss
negative externalities
In this case MSB<MPB, the MPB curve liesabove the MSB curve. This can be caused byconsumption of demerit goods (goods ofwhich the consumption has negativeconsequences on society) such as gasoline.As you can see the negative externality leadsto a welfare loss (the shaded triangle).The government can end this by imposing atax on the consumption of this good, causingMPB to decrease so that the MPB curve shiftsdownwards.
Positive externalities ofconsumption
Q
P
MSC
MSB
MPBQ1
P1
Q∗
P∗
potential welfare gain
positive externalities
In this case MSB>MPB, the MSB curve liesabove the MPB curve. This can be caused byconsumption of merit goods (goods of whichthe consumption has positive consequenceson society) such as education.As you can see the positive externality leads toa potential welfare gain (the shaded triangle).People consume at P1Q1, while the optimumwould be P∗Q∗.The government could get there bysubsidising the consumption of the good,shifting the MPB curve upwards.
21

MICROECONOMICS Externalities
1.2.5 Other sources of market failure
In addition to the discussed sources of market failure the following sources can also benamed.
Lack of public goods
Public goods (e.g. dams) have the following two characteristics:
• They are non-rivalrous: more people can use the good at the same time e.g. a damprotects more people at the same time.
• They are non-excludable: people can’t be excluded from the use of the good e.g. inthe case of a dam, people living in the protected area can’t be excluded from theprotection by the dam.
In economics we also recognise private goods (e.g. tickets to a concert) which have thefollowing characteristics:
• They are rivalrous: the good can’t be used by more people at the same timee.g. tickets to a concert can only be used by one person to enter.
• They are excludable: people can be excluded from the use of the good e.g. someonechecking for tickets could deny people entry.
Private firms will not supply public goods because few people will pay for it if they canuse it anyway; this is called the free rider problem.
Governments can solve this by providing the public goods themselves paying for themusing taxes.
Common access resources, threat to sustainability
Common access resources are resources that everyone has access to so it is very hard toexclude people from using them (e.g. fishing grounds, fossil fuel reserves).
The lack of a pricing mechanism on these resources may cause overuse or depletion. Thisposes a threat to sustainability.
For example, poverty in developing nations often leads to overexploitation ofagricultural land.
22

MICROECONOMICS Externalities 1
What can the government do to solve this problem?• Legislation to forbid or limit the use of some common access resources.• Carbon taxes to make sure companies will use less common access resources that
eventually lead to the emission of carbon dioxide such as oil, coal and natural gas.• Cap and trading schemes for companies to trade rights to emit carbon dioxide. This
has the same effect as carbon taxes, but also limits the emission to a predeterminedlevel because there is a certain maximum of rights to be traded.
• Funding for clean technologies so companies will use fewer resources.
But government responses are limited because:• The problems have a global nature. They can only be solved if all countries and
governments act against them, otherwise companies will just move to countrieswhere the laws are less strict.
• There’s lack of ownership of the common access resources. Often no one feelsresponsible for solving the problem.
• Effective responses require international cooperation, see above.
Asymmetric information
One party in a transaction possesses more knowledge of the transacted product than theother party resulting in market failure because the price does not reflect the true value ofthe product. An example can be the difference in information between the seller of ahouse / the real estate agent and the buyer. The seller knows exactly where theshortcomings of the hous lie but the buyer does not unless he inspects the propertythoroughly.
The government can prevent this by providing:• Legislation / regulation: how much information to include when selling a product.• Information: the government can directly provide information on certain products
or help consumers make the right choice by providing brochures etc.
Abuse of monopoly power
Abuse of monopoly power creates a welfare loss because often a higher price is asked forthe product than the true value.
The government can prevent this by providing:• Legislation / regulation to prevent the monopolist from being able to set a higher
price.• Nationalisation of the company. The government can buy to company to make it
part of the government so the government now decides what the price shall be.• Trade liberalisation. Allowing foreign competitors enter the domestic market
creates more competition, which usually lowers the price level.
23

MICROECONOMICS Government intervention
1.3 Government intervention
1.3.1 Indirect taxes
Indirect taxes are taxes imposed on certain goods to discourage the consumption of goodsthat can create externalities (demerit goods).
Figure 1.9
Q
P
S+ ad valorem tax
S+ specific tax
S
Amount of Specific tax
These indirect taxes can be placed intotwo categories:
Specific taxes: the same amount of taxper unit sold (S+specific tax inthe graph).
Ad valorem taxes: a percentage of theprice of the good is taxed (S+advalorem tax in the graph).
Let’s look at what happens to the equilibrium when the government decides to install aspecific tax on a certain good:
Figure 1.10: Change in equilibrium dueto a tax.
Q
P
D
S1
S+ tax
Q∗
P∗
Q1
PC
PS
taxa
bc
d
eftax
• The tax makes the supply curve ofthe good shift upwards, because thegood will now be sold at a higherprice.
• There is also a difference in the priceconsumers pay (Pc which is the pricethe producers set + the tax) and theprice the suppliers receive (Ps whichis only the price they have set, andnot the tax, because they have to giveaway the tax money to thegovernment).
Now let’s take a look at what happens to the overall welfare level:
Consumer surplus before tax a + b + e
Consumer surplus after tax a
Producer surplus before tax c + d + f
Producer surplus after tax d
Extra government revenue b + c
In total the tax will result in a welfare loss of e + f
− Loss of b + e
− Loss of d + f
+ Gain of b + c
We call this welfare loss due to a tax the tax burden.
24

MICROECONOMICS Government intervention 1
Changes in price elasticity of demand and supply
In general we can say that if the general elasticity of demand and supply changes the slopeof the demand and supply curve also changes. In this section we will look at what willhappen to the changes in welfare when these elasticities change.
Supply becomes more elastic
When supply becomes more elastic, the supply curve will become less steep because achange in price will have a larger effect on quantity supplied.
Figure 1.11: A tax in the case of moreelastic supply.
Q
P
D
S1
S+ t
Q∗
P∗
Q1
PC
PS
tax
a
bcd
ef
tax
In the graph, the supply curve is shiftedupwards due to the tax. From theprevious section you can rememberthat:
• the decrease in consumer surplus isrepresented by b + e ;
• the decrease in producer surplus isrepresented by c + f .
As you can see in the graph, when thesupply curve is less steep, c and f arenow much smaller than b and e .
This results in the following general rule: the higher the elasticity of supply, the higher thetax incidence (welfare loss caused by the tax) will be on consumers and the lower it will be onproducers.
Of course exactly the opposite of the above will be the case when supply becomes lesselastic (and the supply curve has an increased slope).
25

MICROECONOMICS Government intervention
Demand becomes more elastic
When demand becomes more elastic, the demand curve will become less steep because achange in price will have a larger effect on quantity supplied.
Figure 1.12: A tax in the case of moreelastic demand.
Q
P
D
S1S+ t
Q∗
P∗
Q1
PC
PS
a
bc
d
eftax
In the graph the supply curve is shiftedupwards due to the tax. From theprevious section you can rememberthat:
• the decrease in consumer surplus isrepresented by b + e ;
• the decrease in producer surplus isrepresented by c + f .
As you can see in the graph, when thedemand curve is less steep, b and e arenow much smaller than c and f .
This results in the following general rule: the higher the price elasticity of demand, thelower the tax incidence (welfare loss caused by the tax) will be on consumers and the higher itwill be on producers.
Off course exactly the opposite of the above will be the case when demand becomes lesselastic (and the demand curve has an increased slope).
1.3.2 Subsidies
A subsidy is an amount of money paid by the government to a firm per unit of output.
Possible goals of the government for setting the subsidy may include:
• To lower the price of essential goods: producers of essential goods can lower theprice when receiving a subsidy.
• Guarantee the supply of certain goods: more producers will want to producecertain goods if they can get a subsidy in order to do so.
• Enable producers to compete with foreign competitors: domestic companies standstronger on the international market if they get money in the form of subsidiesfrom their government.
26

MICROECONOMICS Government intervention 1
Figure 1.13: Change in equilibrium dueto a subsidy.
Q
P
D
S2+ S
S1
PC ,S
Q∗
P∗
a
b
c d efgh
i
jk
subsidy
In the graph you can see the effect onthe equilibrium of a subsidy.
The subsidy will shift the supply curvedownwards / to the right becauseproducers will now produce more at alower price for every quantity.
Now let’s take a look at what happens to the overall welfare level:
Consumer surplus before tax a + b
Consumer surplus after tax a+ b + c + d + e
Producer surplus before tax c + h
Producer surplus after tax f + g + h + i
Extra government expense b + c + d +e + j + k
In total the tax will result in a welfare loss/gain of f + g + i− c− c− d − j − k
+ Gain of b + e
+ Gain of f + g + i + c
+ Loss of b + c + d + e + j + k
Whether the subsidy will result in a welfare loss or gain depends on the size of the areasinvolved. If f + g + i > c + c + d + j + k, there will be a welfare gain. If the opposite isthe case, there will be a welfare loss.
27

MICROECONOMICS Government intervention
1.3.3 Price controls
A price control is a measure by the government that forces producers to sell goods for afixed price or for a price within a certain range. In this section we will discuss two pricecontrols: (1) the maximum price (price ceiling) and (2) the minimum price (price floor).
Price ceiling (maximum price)
Figure 1.14: A price ceiling (maximum price) on the market causes excess demand.
Q
P
S
D
Pceiling
QS QD
excess demand
With a price ceiling the government sets a maximum price, which lies below theequilibrium price, beyond which producers are not allowed to raise the price.
The government can do so to protect consumers against high prices.
As you can see in the diagram, in the case of a price ceiling the demand will be greaterthan the supply. An excess demand will thus exist.
Possible consequences of setting a price ceiling may include:
Shortage: production falls short of demand.
Underground parallel markets: due to the excess demand some consumers who wantto buy the good cannot do so. They may go on the black market to still buy thegood in question.
Welfare loss: the market won’t be at equilibrium, consumer and producer surplus arenot maximised.
Inefficient resource allocation: the market won’t be at equilibrium, resources are notused most efficiently.
Non-price rationing: producers may start deciding who may buy and who may notbuy. They may do so by queuing: consumers who are willing to wait the longestin a queue may buy the good.
28

MICROECONOMICS Government intervention 1
Price floor (minimum price)
Figure 1.15: A price floor (minimum price) on the market causes excess supply.
Q
P
S
D
Pfloor
QSQD
excess supply
With a price floor, the government sets a minimum price which lies above theequilibrium price. Below, producers are not allowed to lower the price.
The government can do so to protect producers against large fluctuations inprices (e.g. agricultural products) or to protect workers (e.g. setting a minimum wage).
As you can see in the diagram, in the case of a price floor supply will be greater thandemand. An excess supply will thus exist.
Possible consequences of setting a price floor may include:
• Surpluses and government measures. As explained above in the case of a pricefloor, there will be excess supply and the government often sets a minimum pricewhile promising producers to buy the stock that they can’t sell on the market forthe higher price.
• Welfare loss. The market won’t be at equilibrium, consumer and producer surplusare not maximised.
• Inefficient resource allocation. The market won’t be at equilibrium, resources arenot used most efficiently.
29

MICROECONOMICS The theory of the firm
1.4 The theory of the firm
1.4.1 Production and costs
Let’s start with some definitions:
Short-run (SR) at least one factor of production is fixed and the firm cannotquickly change the quantity produced. All production takes place in theshort run.
Long-run (LR) all factors of production are variable in the long run but thestate of technology is fixed. All planning takes place in the long run.
Total product (TP) total output that the firm produces using its fixed andvariable factors in a given time period.
Average product (AP) output that is produced on average, by each unit ofthe variable production factor (V) e.g. 5 cars per tonne of iron ore.
AP=TPV
Marginal product (MP) extra output that is produced by using one extraunit of the variable factor e.g. when one tonne of iron ore is used inaddition, 3 more cars can be produced. The marginal product is equal tothe slope of the total product curve.
MP=∆TP∆V
30

MICROECONOMICS The theory of the firm 1
Total, average and marginal product curves
In Figures 1.16 and 1.17 the graphs for the total product, marginal product and averageproduct are drawn.
Figure 1.16: The total product curve.
Quantity of variable factor (labour)
Tota
lpro
duct
0 1 2 3 4 5 6 7 8
50
100
150TP
Figure 1.17: Average and marginal prod-uct curves.
Quantity of variable factor (labour)
Tota
lpro
duct
0 1 2 3 4 5 6 7 8
10
20
30
AP
MP
As you can see, TP is always rising but beyond a certain labour quantity (in this examplea labour quantity of 3.5), TP is rising less rapidly (the slope decreases).
In the other graph you can see that at a labour quantity of 3.5 MP starts to decrease,meaning that from a labour level of 3.5 one additional unit of labour will add less to thetotal product than the previous one.
This phenomenon is called the law of diminishing returns; as more of the variable factor isadded, there is a point beyond which TP only rises at a diminishing rate.
The AP curve will always intersect the MP curve at the highest point:
• When MP>AP, average product will be increasing.
• When MP<AP, average product will be decreasing.
• When MP=AP, average product will be at the maximum.
31

MICROECONOMICS The theory of the firm
Costs in the short run
Total costs (TC) the complete costs of producing output.
Marginal costs (MC) the increase in total cost when producing one moreunit of output (q). The marginal cost is equal to the slope of the totalcost curve.
MC=∆TC∆q
Average total costs (ATC) costs per unit of output.
ATC=TCq
These costs can be:
Fixed costs (FC) costs of fixed assets such as rent for company space. Thesecosts will always be a constant amount and they won’t change in theshort run.
Variable (VC) costs of variable assets. Variable costs increase whenproduction is increased.
In Figure 1.18 you can see the general form of the TC, MC and ATC curves.
Figure 1.18: The TC, MC andATC curves.
Quantity produced
€
AFC
AVCATC
MC
Some important notes on the TC, MC and ATCcurves:
• AFC=TFC
qand AVC=
TVCq
• ATC and AVC intersect with MC at theirlowest points.
• When MC<AVC or MC<ATC, AVCand ATC are decreasing.
• When MC>AVC or MC>ATC, AVCand ATC are increasing.
• The distance between ATC and AVCdecreases when q increases.
Next to the total cost there is also economic cost.
32

MICROECONOMICS The theory of the firm 1
Economic cost the opportunity cost of all resources employed by thefirm (including entrepreneurship).
These economic costs can be explicit or implicit:
Explicit cost the opportunity cost of the money spent on resources notcurrently owned by the company.
Implicit cost the opportunity cost of the usage of resources currently ownedby the company.
Costs in the long run
The long run average cost curve (LRAC) is a combination of all short run average costcurves (SRAC) that are present at fixed levels of production at fixed levels of factors ofproduction.
Figure 1.19: The long run average cost curve.
Quantity produced
€
LRACSRAB1
SRAB2
SRAB3 SRAB4 SRAB5
SRAB6
I II III
In the short run, a producer can’t change the factors of production but in the long run hecan. This shifts his SRAC curve along the LRAC curve.
The LRAC curve can be divided into three segments based on the returns to scale:
I. Increasing returns to scale (economies of scale): average cost is decreasing whenproduction is increased.
II. Constant returns to scale: average cost is constant when production is increased.
III. Decreasing returns to scale (diseconomies of scale): average cost is increasing whenproduction is increased.
33

MICROECONOMICS The theory of the firm
Factors giving rise to economies of scale
Specialisation: when firms grow they have the recourses to specialise their personnel incertain specific tasks of the production process, this decreases the average cost ofthe product, because the personnel has more expertise in the part of theproduction process that they are contributing to.
Efficiency: when firms grow they can afford more efficient productionmethods (machines, bulk buying etc.) this will lead to less average cost.
Marketing: when output increases the marketing cost typically will only increaseslightly or remain the same. This decreases average cost.
Indivisibilities: some production factors can’t be divided into smaller pieces, forexample large machines. Small firms will still have these large costs, even ifproduction is low. When production is increased these indivisible cost can bedivided by more products, lowering average cost.
Factors giving rise to diseconomies of scale
Problems of coordination: when the company grows larger, the company may needmore managers in order to manage the logistics of the production. This willincrease total costs and this increase average costs.
Problems of communication: when a firm grows larger it generally needs morepersonnel. Communication with all personnel may be difficult. The companymay need to hire more extensive management in order to streamline thiscommunication. This will lead to a higher average cost of production.
34

MICROECONOMICS The theory of the firm 1
1.4.2 Revenues
Total revenue (TR) total amount of money a firm receives from selling goodsor services in a given time period.
TR= p × q
Average revenue (AR) the revenue a firm receives per unit of sales.
AR=TRq=
p × qq= p
Marginal revenue (MR) the extra revenue that a firm gains by selling onemore product in a given time period.
MR=∆TR∆q
Figure 1.20: The total revenue, average revenue and marginal revenue curves.
Q
P
TR
TR max
AR
MR
In the graph you can see the general form of the TR, AR and MR curves. Take note ofthe following when drawing these curves:
• The MR curve intersects the Q axis when TR is at maximum. This also makessense: when MR> 0 every additional product will earn positive revenue, raisingTR. However, when MR< 0 every additional product will earn negativerevenue (a loss), decreasing TR.
• AR is downward sloping.
35

MICROECONOMICS The theory of the firm
1.4.3 Profit
In economics two different types of profit are distinguished:
Economic profit (abnormal profit) total revenues exceed totalcost (TR>TC).
Normal profit total revenue equals total cost (TR=TC, zero economicprofit).
In sum, economic profit is all profit that is made above normal profit.
Why will a firm continue to operate at normal profit?
At normal profit all costs are covered. Shutting down would mean not being able tocover fixed costs or not being able to pay off debt.
Loss negative economic profit, total cost exceeds total revenue (TC>TR).
1.4.4 Goals of the firm
The most common goal of firms is profit maximisation. This goal is achieved when thedifference between total cost and total revenue is maximised (TC−TR=max). This isthe case when the marginal costs are equal to the marginal revenue (MC=MR).
⇒ When MC>MR selling one more unit would lead to additional loss.⇒ When MC<MR, selling one more unit would lead to an additional profit.⇒ So profit is maximised when MC=MR.
In addition to profit maximisation, firms may also have some alternative goals:
Revenue maximisation.Growth maximisation: the firm may want to maximise the growth. This growth can
be measured in revenue, production, employment or market share.Satisficing: the firm tries to perform satisfactorily rather than to a maximum level.Corporate social responsibility (CSR): the business includes public interest in its
decision making. This may be that the company wants to produce asenvironmentally friendly as possible, provide good service for consumers, employworkers under favourable conditions etc. Different firms may adopt differentapproaches to CSR.
36

MICROECONOMICS Market structures 1
1.5 Market structures
1.5.1 Perfect competition
Characteristics of perfect competition:
There is a large number of firms.
There is perfect information, everyone knows everything.
The product is homogeneous, meaning every product is exactly the same.
There is perfect resource mobility, meaning resources can move fromlocation to location at zero cost.
Freedom of entry / exit. Firms can easily enter or leave the market if thewish to do so.
1
2
3
4
5
⇒ These characteristics imply that firms are price takers, they cannot influence theprice in the industry and must sell at whatever the market price is.
Figure 1.21: Market in perfect competition.
Q
P
S
DQ
P
AR=MR
⇒ The graphs on Figure 1.21 show the situation on the market when in perfectcompetition.
⇒ AR is the same as the market price (see the section on revenues).
⇒ MR is equal to AR because every extra good sold means an additional revenue of1×market price. Since the firms are price takers, their output does not influencethe market price leaving it constant.
37

MICROECONOMICS Market structures
Profit with perfect competition
First let’s explain how you can read / calculate profit diagrams depicting the cost curvesof a firm:
• The firm (which wants to maximise profits) will always produce at the intersectionof MC and MR.
• You can calculate the profit at this point by multiplying the difference between ARand AC with the production of the firm:
profit= (AR−AC)× q
In the short run, firms in a perfectly competitive market can make abnormalprofit (profit> 0), normal profit (profit= 0) or a loss (profit< 0) depending on the placeand shape of the AC curve. Let’s review the three situations in Figure 1.22.
Figure 1.22: In the short run firms in a perfectly competitive market can make abnormalprofit (profit> 0, left), a loss (profit< 0, middle), or normal profit (profit= 0, right).
Q
P
MC
ACp AR=MR
q
profit
Because at the productionlevel average cost lies belowaverage revenue, thecompany will make aprofit (the shaded area).
Q
P
MCAC
p AR=MR
q
loss
Because at the productionlevel average cost lies aboveaverage revenue the,company will make aloss (the shaded area).
Q
P
MC
ACpAR=MR
q
Because at the productionlevel average cost is equalto average revenue, thecompany won’t makeprofit or loss (normalprofit).
Figure 1.23: When in the short run profit is possible, firms will enter the market,increasing supply, decreasing MR=AR, eliminating any profits in the long run.
Q
P
S
S2
DQ
P
MC
AC
MR1 =AR1
MR2 =AR2
q1q2
p1p2
38

MICROECONOMICS Market structures 1
In the long run, firms in a perfectly competitive market will make normalprofit (profit= 0).
Starting in the short run situation where there is profit, firms from outside the marketwill know that there is a profit to be made and start entering the market.
This will shift the supply curve on the market to the right (increase in supply).
This causes the market price to decrease.
Since the market price is equal to the MR, the marginal revenue will also decrease.
Firms will keep entering the market until the MR curve has decreased to the point whereprofits will be zero.
Shut down and break even price
Figure 1.24: The break even and shut down price levels.
Q
P
MC
ATC
AVC
p1 AR1 =MR1
p2 AR2 =MR2
Shut down price when the price falls below this price, the company will shutdown in the short run (immediately), because the average variablerevenues are less than the average variable costs, meaning the companycan’t cover the variable cost. The shut down price thus lies atAR=AVC.
Break even price the price at which a firm is able to make normal profit inthe long run. When the price falls below this price, the company willshut down in the long run. The break even price thus lies at AR=ATC.
39

MICROECONOMICS Market structures
Allocative and productive efficiency
In firm theory we recognise two types of efficiency:
Allocative efficiency suppliers are producing the optimal mix of goods andservices required by consumers. Allocative efficiency occurs when thecompany produces at the point where
MC=AR(cost to producers)= (value to consumers)
Productive efficiency (technical efficiency) suppliers produce the product atthe lowest possible unit cost (AC). Occurs when production takes placeat minimum point of ATC.
⇒ If you take another look at the graphs of perfectly competitive firms, you will seethat in the long run both allocative (MC=AR) and productive (q at minimumAC) is achieved.
⇒ In the short run, when there is a profit or a loss, there will still be allocativeefficiency (MR=AR), but there won’t be productive efficiency (q is not atminimum AC).
1.5.2 Monopoly
Characteristics of a monopoly:
1. There’s a single or dominant firm.
2. There are no close substitutes of the good on the market.
3. There are significant barriers to entry the market.
Barriers to entry ways of preventing entry of a company to the industry.
40

MICROECONOMICS Market structures 1
Examples of barriers to entry include:
Economies of scale: firms entering the market cannot directly obtain the advantage ofeconomies of scale of the existing firms (because they start small and still need togrow) and therefore cannot compete against the low prices of the existing firm.
Branding: consumers may not be willing to leave the popular brands of existing firmson the market in order to switch to the product sold by the new firm.
Legal barriers: the government prevents entry into the market by law.
Natural monopoly: there are only enough economies of scale to support one firm. Inorder to understand this take a look at the graph in Figure 1.25.
Figure 1.25: Natural monopoly.
Q
P
LRAC
D1 =AR1
D2 =AR2
a
q1
b
q2
profit possibileAR ≥ LRAC
Suppose there is currently one firm in the market with the LRAC curve and D1 =AR1.This firm can make a profit when the production lies between q1 and q2. (Because in thatrange, the average revenue will exceed the average cost).
If another firm enters the market demand curve for the goods of the existing firm willshift to the left because less demand is left for the existing firm. The existing firm nowcan’t make a profit anymore, because there are no points where the average revenueexceeds average cost.
We will now review the graphs of a monopolist firm. It is important to note what themajor difference between the graphs of a monopolist firm and a firm in perfectcompetition are:
• The MC and AR (= D) curves are no longer one and the same.
• The monopoly is not a price taker but a price maker. It can determine the price allon itself. Therefore the the MC and AR (= D) curves are no longer vertical lines.For a monopolist firm they are downward sloping.
41

MICROECONOMICS Market structures
• Determining profit of monopolist firm can be done the same way as for a perfectlycompetitive firm:
profit= (AR−AC)× q
• The only difference is that you will need to determine price using theDemand (=AR) curve. When you have found the production quantity (dependingon the goal of the firm, see below), draw a vertical line at this quantity towards thedemand curve. The price on the market will be the vertical coordinate of theintersection point of this horizontal line and the demand curve.
Profit when the goal is maximum profit
Figure 1.26: Profit for a monopolistwhen pursuing maximum profit.
Q
P
MC
AC
MR D=ARQm
Pm
• Maximum profit is achieved whenproduction is at MC=MR.
• Draw a vertical line upward towardsthe demand curve to find theprice (Pm)
• The shaded area represents the profitto be made by the monopolist firm.
Profit when the goal is maximum revenue
Figure 1.27: Profit for a monopolistwhen pursuing maximum revenue.
Q
P
MC
AC
MR D=ARQm
Pm
• Maximum revenue is achieved whenproduction is ar MR= 0.
• Draw a vertical line upward towardsthe demand curve to find theprice (Pm)
• The shaded area represents the profitto be made by the monopolist firm.
42

MICROECONOMICS Market structures 1
Some notes on profit in the case of a monopoly
• A monopolist firm can make profit in both the long run and the short run,because new firms can’t enter the market due to entry barriers.
• When the monopolist firm pursues maximum profit:
– There will be no allocative efficiency because MC 6=MR at the productionlevel.
– There will be no productive efficiency because production is not at the levelwhere AC is at its minimum.
• Although monopolist firms will not attain allocative or productive efficiency,being able to make large profits does have some advantages:
– Monopolist firms have enough profit to finance research and development inorder to make better products in the future.
– Monopolist firms can grow large enough to fully exploit economies of scale,which could reduce the price eventually.
1.5.3 Monopolistic competition
Characteristics of monopolistic competition:
1. There’s a large number of firms.
2. The products sold are differentiated.
3. There are no barriers to entry or exit.
It is important to note that monopolistic firms do compete in the market becauseproducts are differentiated. Two different forms of competition are possible:
Price-competition rivalry between suppliers based solely on price.
Non-price competition rivalry between suppliers based on other aspectsthan price e.g. quality of service, packaging, advertising and productdevelopment.
The cost and revenue curves of monopolistic firms look the same as the cost and revenuecurves for monopolist firms. Monopolistic firms are, like monopolist firms, in somedegree price makers: because they sell differentiated products, they can decide what priceto ask.
43

MICROECONOMICS Market structures
Short run
Figure 1.28: Profit for monopolisticfirms in the short run.
Q
P
MC
AC
MR D=ARQm
Pm
abnormal profit
• In the short run, monopolistic firmshave some market power, due todifferentiated products the demandcurve is downward sloping: the firmcan influence price.
• This means that in the short termmaking a profit (like is drawn in thegraph in Figure 1.28) or a loss ispossible.
• When profit maximisation is the goalof the firm, the profit is the shadedarea found by using MC=MR usingthe demand curve to find the price.
Long run
Figure 1.29: Profit for monopolisticfirms in the long run.
Q
P
MC
AC
MR D=ARQm
Pn
• Due to the absence of entry and exitbarriers in the long run profit will benormal (profit= 0).
• If in the short term companies makea profit (loss) then in the long termcompanies will enter (leave) themarket.
• New firms will take awaybusiness (firms that left will leavetheir business for the old firms),which shifts the demand curve to theleft (right).
• Profit, found using MC=MR, usingthe demand curve to find the price,will be zero.
Some notes on profit in the case of monopolistic competition:
• In the short term, there will not be allocative or productive efficiency becauseMC 6=MR at the production level and the production level is not at the minimumof AC.
• In the long term, there will not be allocative or productive efficiency for the samereason.
44

MICROECONOMICS Market structures 1
1.5.4 Oligopoly
Characteristics of oligopoly:
1. Dominance by a small number of firms
• Dominance by a small number of firms can be measured using theconcentration ratio (CR) e.g. CR4 = 80% means the sum of the market shareof the 4 large firms in the industry is 80%. The higher this number, the morelikely it is that an oligopoly exists in this market.
2. Differentiated or homogeneous products. In an oligopoly either can be the case.
3. High barriers to entry (see monopoly).
4. Interdependence: decisions by one firm influence the other.
• For example two firms deciding on what price to set for a product (see thetable for the options they face). The firms currently offer $5.50.
• If only one firm lowers the price this would be the best scenario for that onefirm, but the worst for the other firm.
• In this example firms will most likely lower the price, in fear of the otherfirm doing it and leaving them with an extreme decrease in profit. This willhappen while remaining at a price $5.50 would be the mutually best option.
• If firms were able to collude they could be better off.
Firm A gets $6 millionFirm B gets $6 million
Firm A gets $8 millionFirm B gets $2 million
Firm A gets $2 millionFirm B gets $8 million
Firm A gets $4 millionFirm B gets $4 million
Set the price at $5.50 Set the price at $5.00
Set the priceat $5.50
Set the priceat $5.00
Firm A’s choices
Firm
B’sc
hoic
es
45

MICROECONOMICS Market structures
Collusion
Collusion the collaboration of firms to charge the same price; the firms willact together as one monopoly. When oligopolist firms collude, theirgraphs will be exactly the same as for monopolist firms.
Note that collusion is illegal in most countries. It can maximise the profit offirms but it goes at the expense of consumers who are faced with higher prices.
Cartel collusive oligopoly (group of firms making price arrangements).
Two forms of collusion can be recognised:
Formal collusion firms agree on a price, all firms participating in thecollusion know that they are participating and know the negotiatedprice.
It is important to note that a formal collusion is not openly communicated tothe general public or the government: collusive agreements are often handled insecrecy.
Tacit collusion firms charge the same price by looking at each other. There isno formal agreement involved.
But members of a cartel have an incentive to cheat. Asking for a price beneath thearranged one could boost profits.
Cartels are also hard to maintain due to fear of government penalties. Being part of acartel is, again, illegal.
Profit in an oligopoly
If an oligopoly is non-collusive, firms must act strategically in order to take account ofpossible actions by rivals.
The demand curve of non-collusive oligopolists is kinked. Suppose an oligopolist isoperating at point a. Raising price above point a will lead to demand rapidly decreasingbecause other firms are cheaper. This is why the demand curve left/above point a is veryflat (very price elastic). Vice versa for lowering the price.
46

MICROECONOMICS Market structures 1
Figure 1.30: The break even and shut down price levels.
Q
P
MC2
MC1
Qm
D=ARMR
pma
b
c
This kinked demand curve causes price rigidity (= prices stay the same over long periodsof time) for two reasons:
1. Firms won’t raise prices if competitors won’t follow because they will rapidly losedemand.
2. However, firms won’t lower their prices either, because they think other firms willfollow. This might result in a price war, where no producer ends up being betteroff.
Therefore, Firms often compete in other aspects than price (non-price competition, seeabove).
Summary Table
Market type Nr.
ofsu
pplie
rs
Barr
iers
toen
try
orex
it?
Product type Other characteristics Time Allo
cativ
e?(M
C=
AR
)Pr
oduc
tive?
(MC=
AC
)Po
ssib
leab
norm
alpr
ofit?
Perfect many no homogeneous perfect information SR 3 7 3
competition and resource mobility LR 3 3 7
Monopolistic many no differentiated SR 7 7 3
competition LR 7 7 7
Oligopoly some yes either interdependence SR 7 7 3
LR 7 7 3
Monopoly one yes differentiated no close substitutes SR 7 7 3
LR 7 7 3
47
MICROECONOMICS Price discrimination
1.6 Price discrimination
1.6.1 Definition and conditions
Price discrimination the practice of charging different prices to differentgroups of consumers for the same product, where the price difference isnot justified by differences in cost.
Conditions for price discrimination to work:
• The firm must possess some degree of market power so it can set prices withoutconsumers instantly moving to a competitor.
• There must be groups of consumers with differing price elasticity of demand forthe product so different groups of consumers react different to a change in price.
• The firm must be able to separate groups to ensure no resale of the product occurs.
1.6.2 Three degrees of price discrimination
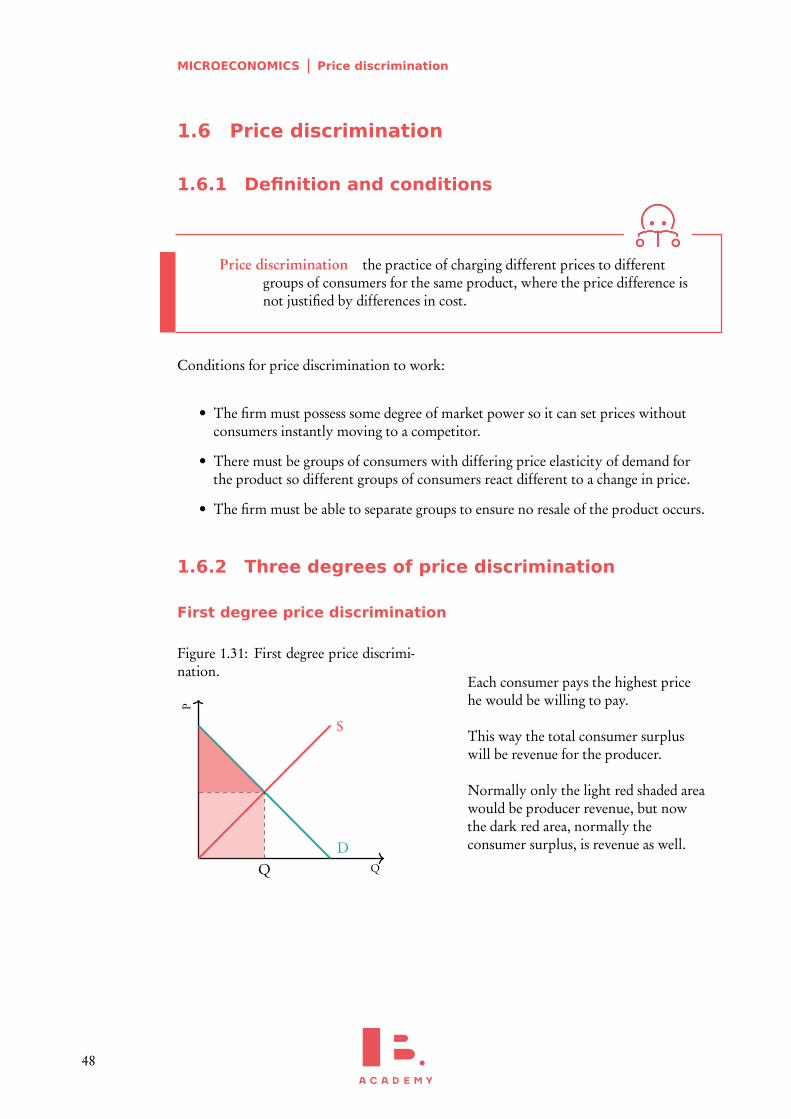
First degree price discrimination
Figure 1.31: First degree price discrimi-nation.
Q
P
S
DQ
Each consumer pays the highest pricehe would be willing to pay.
This way the total consumer surpluswill be revenue for the producer.
Normally only the light red shaded areawould be producer revenue, but nowthe dark red area, normally theconsumer surplus, is revenue as well.
48

MICROECONOMICS Price discrimination 1
Second degree price discrimination
Figure 1.32: Second degree price dis-crimination.
Q
P
D
$15
$10
This way producer surplus (the shadedarea in the graph) will be larger thanbefore but less than in the case of firstdegree price discrimination.
Third degree price discrimination
Figure 1.33: Third degree price discrimination.
Group I
Q
P
MC
DMRQ
P
Group II
Q
P
MC
DMRQ
P
Consumers are divided into market segments (e.g. adults and kids). As producersmaximise profit in each segment, the highest price is asked in the segment with thelowest price elasticity (steepest demand curve) because consumers in this segment won’treact that much to a high price.
49

MICROECONOMICS Price discrimination
50

2MACROECONOMICS
2.1. Overall economic activity 52– Circular flow of income model – Measures of EconomicActivity – The business cycle
2.2. Aggregate demand andaggregate supply
55
– Aggregate demand – Short Run Aggregate Supply – Longrun aggregate supply – Equilibrium
2.3. Macroeconomic objectives 61– Low unemployment – Low and stable rate of inflation
2.4. Economic Growth 67– Equity in the distribution of income
2.5. Government Intervention 72– Fiscal Policy – Monetary policy – Supply side policies– Evaluation of policies
51

MACROECONOMICS Overall economic activity
2.1 Overall economic activity
2.1.1 Circular flow of income model
Money, goods and services flow through the economy. The circular flow of incomemodel illustrates the exchange between households and firms:
Figure 2.1: Visualisation of the circular flow of income.
Households Firms
Injections (J)
Investment (I)
Governmentspending (G)
Exports (X)
Withdrawals (W)
Savings (S)
Taxes (T)
Import (M)
Goods and servicesFactors of production
Income
Consumer Expenditures (C)
=
+
+
=
+
+
Closed economy, no government, no financial sectorIncome = Expenditures =Output
Open economy with government, with financial sectorChange in net value of economic activity = J−W
Table 2.1: The factors of production and their respective income.
Factor of production Income Factor of production Income
Capital −→ Interest Land −→ RentEnterprise −→ Profit Labour −→Wage
Some important notices about the circular flow of income model:
• The middle part of the model is a closed economy (no international trade⇒ noimports and exports) that has no government (no taxes, no government spending)and no financial sector (no investment, no savings).
• In this economy, the income of consumers will always be the same as theirexpenditures because saving is impossible and there are no taxes.
• In this economy, the earnings of companies will always be the same as consumerexpenditure because consumers can’t spend their income on products from abroad(imports).
• In this economy, all earnings of companies will be the same as the value of theirdomestic outputs because companies can’t invest parts of their earnings, nor canthey export some of their output.
• Therefore, in a closed economy without a government and financial sector:Income= Expenditures=Output
52

MACROECONOMICS Overall economic activity 2
• When we add international trade, a government and a financial sector, injections(value added to the circular flow: investment, government spending and exports)and withdrawals (value removed from the circular flow: savings, taxes, imports) arepossible.
• In such an economy the change in the value of economic activity can be measuredas:
J−W= (I+G+X)− (S+T+M)
2.1.2 Measures of Economic Activity
The size of the ‘economic activity’ can be measured in different ways:
GDP — Gross Domestic Product total income earned by the factors ofproduction in a country, regardless the assets owner.
GNP/GNI — Gross National Product / Gross national income the totalincome earned by a country’s factors of production, regardless the assetslocation.
Green GDP GDP minus environmental costs, such as pollution, measuressustainability.
Each of these indicators can be measured:
• At nominal value = at current prices
• At real value = adjusted for inflation
• Per capita = per head of population
You need to be able to calculate the measures in the following ways:
GDP
• Output method: sum of value of all goodsand services produced in the economy.
• Income method: sum of all incomes earnedin the economy.
• Expenditure method: sum of expendituresby all sectors in the economy:
GDP(Y) =C+ I+G+X−M
GNP / GNI
GDP+ net property income from abroad
Real GDPNominal GDPGDP Deflator
× 100
53

MACROECONOMICS Overall economic activity
2.1.3 The business cycle
The economy tends to go through a cyclical pattern of Real GDP development. Thepattern is called the business cycle (Figure 2.2). The business cycle consists of differentphases of real GDP growth and decline, but in the long run GDP increases, hence theincreasing trend line drawn in the figure.
Figure 2.2: The business cycle.
Time
Rea
lGD
P
Recovery Boom Recession Trough
Table 2.2: Characteristics of the phases of the business cycle.
Phase Recovery Boom Recession Trough
GDP isincreasing
GDP increases less andreaches highest point
GDP starts to decrease GDP decreases lessand reaches lowestpoint
Consumption &Investment
Increasing Increasing to highestpoint
Decreasing Decreasing to lowestpoint
Unemployment Decreasing Decreasing to lowestpoint
Increasing Increasing to highestpoint
Price Level Increasing Increasing Stable or possibledecrease
Stable or possibledecrease
54

MACROECONOMICS Aggregate demand and aggregate supply 2
2.2 Aggregate demand and aggregate supply
2.2.1 Aggregate demand
Aggregate demand (AD) total demand for goods and services in an economyat a given time.
AD=C+ I+G+X−M
The AD curve is typically downward sloping: if the average price level increases,consumers will typically buy less goods and vice versa. There is a negative relationshipbetween price and demand.
Shifts of and moves along the AD curve
Figure 2.3: Aggregate Demand curve.
Real GDP (y)
Ave
rage
pric
ele
vel
AD
B
A
• A move along the AD curve occurswhen the average price level changes.If, for example, the average price levelincreases, a shift along the AD curvemay occur from point B to point A.
• A shift of the AD curve occurs whenone of the components that make upAD increase or decrease: when C, I,G or X increase (decrease) or Mdecreases (increases), the AD curvewill shift to the right = a generalincrease in demand (left = a generaldecrease in demand).
Table 2.3 contains different factors that influence Consumption, Investment,Government Spending, Exports and Imports.
Table 2.3: Factors that can influence, C, I, G, E and M.
Consumption(C)
Investment(I)
Governmentspending (G)
Net Exports(E −M)
+ Consumerconfidence
− Interest Rates+ Wealth+ Disposable
income− Income tax− Level of
household debt
− Interest rates+ Business
confidence+ Level of
technology− Business tax− Level of
corporate debt
+/− Policy choicesof thegovernment
+ Income oftrading partners
− Value of homecurrency
+ Value of foreigncurrencies
− Level ofprotectionism
(+) = positive relationship, (−) = negative relationship.
55

MACROECONOMICS Aggregate demand and aggregate supply
2.2.2 Short Run Aggregate Supply
Aggregate supply (AS) the total amount of goods and services that allindustries in the economy will produces at every given price level. Inthe short run (SRAS) or in the long run (LRAS).
The SRAS curve is typically upward sloping: if the average price increases, producerswill typically produce more to increase revenue or profit.
Shifts of and moves along the SRAS curve
Figure 2.4: Short Run Aggregate SupplyCurve.
Real GDP (y)
Ave
rage
pric
ele
vel SRAS
B
A
• A move along the SRAS curve occurswhen the average price level changes.If, for example, the average price levelincreases, a shift along the SRAScurve may occur from point B topoint A.
• A shift of the SRAS curve occurswhen one of the components thatmake up SRAS increase or decrease:when resource prices or businesstaxes decrease (increase) or subsidiesincrease (decrease) the SRAS curvewill shift to the right = a generalincrease in short run supply (left = ageneral decrease in short run supply).
56

MACROECONOMICS Aggregate demand and aggregate supply 2
2.2.3 Long run aggregate supply
In the long run the AS curve differs from the SRAS curve. But the exact difference isdisputed: neo-classical economists and keynesian economics both have a different viewon what the long run aggregate supply (LRAS) curve should look like:
Figure 2.5: The neo-classical LRAS curve and the Keynesian LRAS curve.
Neo-classical LRAS
Real GDP (y)
Ave
rage
pric
ele
vel
LRAS
In the opinion of neo-classicaleconomists, producers are producing atfull capacity, they cannot producemore, so a change in price doesn’t andcannot influence the LRAS. The LRAScurve only depends on the quantity andquality of factors of production. Whenthey increase (decrease) the LRAS willshift to the right (left).Quantity and quality of factors ofproduction are influenced by:• Changes in efficiency (+)• Technological development (+)• Changes in unemployment (−)• Institutional / government policy
changes (+/−)
Keynesian LRAS
Real GDP (y)
Ave
rage
pric
ele
vel
LRAS
I II III
The Keynesian LRAS curve consists ofthree parts:
I Producers are producing belowcapacity, so they can increaseoutput without raising the cost ofa product, the average price levelremains the same.
II When producers increase outputeven further, factors ofproduction will become scarce,increasing the price of theproduct.
III Producers are operating at fullcapacity, they cannot increaseoutput any further.
57

MACROECONOMICS Aggregate demand and aggregate supply
2.2.4 Equilibrium
The equilibrium point is the point at which demand is equal to supply. This pointdetermines the average price and quantity produced and sold on the market. Since wehave learned that there are three different supply curves, three possible equilibria exist:
Figure 2.6: Three equilibria: short run, long run neoclassical view and long run keynesianview.
Short run
y
Ave
rage
pric
ele
vel
SRAS
AD
Price and output aredetermined by theinteraction of AD andSRAS.
Long run – neoclassical
y
Ave
rage
pric
ele
vel
LRAS
AD
The impact of any changesin AD will be on priceonly, because LRAS is avertical line so output willnot change.
Long run – Keynesian
y
Ave
rage
pric
ele
vel LRAS
AD
The economy usuallyoperates at less thancapacity (as shown). Thiswill lead to slow growthand unemployment.
Changes in the long run neoclassical equilibrium
Two possible changes are possible: (1) an increase in AD and (2) a decrease in AD. Wewill illustrate both changes graphically:
Figure 2.7: Changes in the neoclassical equilibrium.
Increase in AD
Real Output Y
Ave
rage
pric
ele
vel
SRAS1
SRAS2
AD1 AD2
LRAS
Y f Y1
P1 E
P2 F
P3G
Decrease in AD
Real Output Y
Ave
rage
pric
ele
vel
SRAS2
SRAS1
AD2 AD1
LRAS
Y fY1
P1 EP2 BP3 C
58

MACROECONOMICS Aggregate demand and aggregate supply 2
Increase in AD• E is our starting point: long run
equilibrium, fullemployment (producers areproducing at full capacity)
• AD increases so we move from AD1to AD2. We end up at point F at ahigher average price and a higheroutput.
• But this means that the economy isnow producing beyond full capacity,this leads to a dramatic increase incosts.
• In order to solve this, firms willdecrease their SRAS, so SRAS shiftsto the left: SRAS1⇒ SRAS2. We endop at point G.
• Result: we end up at the same level ofreal output as before (again fullemployment) but at a higher averageprice.
Decrease in AD• E is our starting point: long run
equilibrium, fullemployment (producers areproducing at full capacity)
• AD decreases so we move from AD1to AD2. We end up at point B at alower average price and a loweroutput.
• But this means that the economy isnow producing below full capacity,this leads to a dramatic decrease incosts.
• In order to solve this, firms willincrease their SRAS, so SRAS shiftsto the right: SRAS1⇒ SRAS2. Weend op at point C.
• Result: we end up at the same level ofreal output as before (again fullemployment) but at a lower averageprice.
Changes in the long run Keynesian equilibrium
Again we will discuss what will happen when AD changes, but this time in the situationof a long run Keynesian equilibrium.
Figure 2.8: Change in the Keynesianequilibrium: increase in AD.
y
Ave
rage
pric
ele
vel
LRAS
AD1
AD2
AD3
y1 y2 y3
Deflationary gap
Increase in AD (decrease in AD: theopposite will happen)• We start at AD1, output is at y1. At
this point production is belowcapacity: there will beunemployment and slow growth.There is a deflationary gap: demandis less than potential output.
• AD increases so we move from AD1to AD2. This reducesunemployment (output increases),but also increases inflation (pricelevel increases).
• When AD increases even further toAD3, the same thing will happen.
• But with each increase of AD theincrease in output will be less big andthe inflation even higher.
59

MACROECONOMICS Aggregate demand and aggregate supply
Shifts in the LRAS curves
Another possibility is the increase of the neoclassical or Keynesian LRAS curve, whichcan shift either to the left or to the right. When this happens, all you have to do is findthe intersection of the new LRAS curve and the AD curve. Production and average pricelevel will be at this point.
The Keynesian Multiplier
If a government decides to increase spending (G), the change in GDP (Y) will be largerthan the increase in G. We call this the multiplier effect:
∆Y = k∆G
The change in GDP is equal to the multiplier (k) × the change in governmentspending (G).
The workings of the multiplier effect can be explained through the following flow-chart:
G AD Y
M
T
S
C↑ ↑ ↑
↑
↑
↑
↑
An increase in government spending (G), an injection, will lead to a higher level ofaggregate demand (AD) because people have more money to spend, this will increaseproduction (GDP, Y), which will cause incomes to go up, because more workers areneeded to produce the extra production. This increase in income will cause consumerexpenditure (C), Imports (M), Taxed income (T) and Savings (S) to increase.
The extra money that can be spent domestically (C) will again increase AggregateDemand, which will increase Y, which will increase M, T, S and C etc.
However, every time we move round this flowchart, some of the money will leak out ofthe economy: it will either be used to import (M) and therefore leave the country, usedto pay taxes (T) and therefore flow back to the government or used to save (S) andtherefore end up on a savings account, not being used to consume. These factors arecalled “leakages”.
The fraction of the extra income that causes AD to rise even more will, thus, slowlydecline, until eventually GDP stabilises at a new, higher, level.
60

MACROECONOMICS Macroeconomic objectives 2
Calculating the Keynesian Multiplier
There are two ways to calculate the size of the keynesian multiplier:
k =1
1−MPC
k =1
MPS+MRT+MPM
MPC — marginal propensity to consume the percentage of additionalgovernment expenditure that consumers use to consume.
MPS — marginal propensity to save the percentage of additionalgovernment expenditure that consumers save.
MPT — marginal rate of taxation the percentage of additional governmentexpenditure that consumers have to pay back in taxes.
MPM — marginal propensity to import the percentage of additionalgovernment spending that consumers use to import goods.
2.3 Macroeconomic objectives
2.3.1 Low unemployment
Unemployment all people of working age that are not working and areactively looking for a job.
Unemployment rateunemployed people
labour force× 100
Labour force everyone that can, wants to, and is allowed to work. Typicallythe labour force consists of all people that are currently employed + allunemployed people
61

MACROECONOMICS Macroeconomic objectives
Unemployment can be hard to measure, this has several reasons:
1. The existence of hidden unemployment: people not represented in theunemployment figures:
• people who have given up looking for a job;
• people in a parttime job that would want to work full time (which isn’tpossible);
• people who are overqualified for a job, but can’t find a better one.
2. Unemployment figures are an average: the unemployment figure ignores regional,ethnic, age and gender differences.
Consequences of unemployment
Economical Consequences
• Loss in GDP (drop in production).• Loss of tax revenue, because
unemployed people have less income topay taxes.
• Increased cost of unemploymentbenefits.
• Loss of income for individuals.• Greater differences in income
distribution.
Personal Consequences
• Increased crime rates, using crime toincrease money to spend.
• Increased stress levels; worries overmoney
• Increased indebtedness.• Being unable to pay for housing;
homelessness.• Family breakdown.
Table 2.4: Types of unemployment.Type Cause Possible solutions
Cyclical(demanddeficient)
Decrease in aggregate demand, causesproduction to go down and people to becomeunemployed
• Demand side policies to increase AD
Structural Permanent changes in demand and supply(e.g. change in taste, advance in technology)causes people in certain industries to becomeredundant
• Retraining employees to fit otherjobs
• Encourage people to move to otherregions
• Reduce unemployment benefits toencourage people to find a new job
• Less regulation so employment be-comes easier
Seasonal Lower labour demand at certain times of year(e.g. less labour demand for waitresses inwinter)
• Reduce unemployment benefits• Encourage to take other jobs in the
off-period
Frictional Imperfect information: it takes time to find anew job when you have left your old one
• Improve information flow(e.g. vacancy websites)
• Reduce unemployment benefits
62

MACROECONOMICS Macroeconomic objectives 2
Graphical depiction of unemployment
Figure 2.9: Graphical depiction of structural unemployment.
Quantity ofmanufactoringworkers
Man
ufac
tori
ngw
age SL
DL2DL1
w1
Q1
w2
Q2
Structuralunemployment
Structural unemployment
• Due to a change in AD (e.g. taste,technology) the labour demand (DL)decreases from DL1
to DL2.
• Employment decreases from Q1to Q2.
• Wages decrease from w1 to w2.
Figure 2.10: Graphical depiction of cyclical unemployment.
Number ofworkers
Wag
e
SL
DL2DL1
w1
w2
Cyclicalunemployment
1
3
2
Cyclical unemployment
• Due to economic recession labourdemand decreases from DL1
to DL2.
• But wages are sticky, it takes time forwages to adjust to a new situation.This can be because contractsdetermine wages over a longer timeperiod or people who are alreadyemployed won’t take a lower wage:they remain at w1 instead of fallingto w2.
• There is a surplus of labour: supplyof labour is at point 2, demand forlabour at point 1.
63

MACROECONOMICS Macroeconomic objectives
2.3.2 Low and stable rate of inflation
Inflation a sustained increase in the level of prices
Disinflation a persistent fall in the rate of inflation
Deflation a persistent fall in the level of prices
Inflation can be measured in two ways:
Consumer Price Index (CPI)
Economists compile a basket of goods that is representative for the economy, they thencompare the cost of this basket over time. The increase in price of the basket is theinflation rate.
CPI=Cost of a typical basket in year 2Cost of a typical basket in year 1
× 100
Cost of typical basket=Price of product category 1×weight factor1
+Price of product category 2×weight factor2+ . . .· · ·+Price of product category n×weight factorn
Inflation rate=new CPI− old CPI
old CPI× 100
Producer Price Index (PPI)
Economists compile a basket of factors of production representative for the economy,they then compare the cost of this basket over time. The increase in the price of thebasket is the inflation rate.
Changes in the PPI can predict future inflation: Higher resource prices eventually lead tohigher consumer good prices
64

MACROECONOMICS Macroeconomic objectives 2
Consequences
Consequences of inflation
• Greater uncertainty: what will pricesdo in the future?
• Decrease in purchasing power:people can buy less due to higherprices.
• Less savings: people want to spendmoney now, because it is decreasingin value.
• Damage to export competitiveness:foreign countries will buy less goodsfrom the country that has inflationdue to increasing prices in thiscountry.
Consequences of deflation
• Deferred consumption: consumerswill wait to spend money, becauseprices are decreasing: goods boughtin the future will be cheaper.
• High level of cyclicalunemployment: less consumptionwill lead to less production andtherefore causes unemployment.
• Bankruptcies: less consumption willcause profits of firms to decline. Thismay result in them having to shutdown.
Difficulties in measuring inflation
• Different income earners may experience a different rate of inflation when theirconsumption pattern is not accurately reflected in the CPI (it is an average).
• Inflation figures may not accurately reflect changes in consumption patterns andthe quality of the goods purchased.
• Sudden swings in the price level of food and oil can influence CPI heavily.Economists therefore also calculate an underlying rate of inflation.
• CPI only measures change in consumption prices, while changes in producerprices are also important (the PPI does use producer prices).
Two different forms of inflation
Figure 2.11: Graphical depiction of demand pull inflation (left) and cost-pushinflation (right).
Real GDP
Pric
ele
vel
SRAS
AD1
AD2P1
y1
P2
y2
As you can see in the graph an increase inAD (shift to the right) causes price level torise from P1 to P2.
Real GDP
Pric
ele
vel
SRAS1
SRAS2
ADP1
y1
P2
y2
When the cost of production for somereason increases, the SRAS curve will shiftto the left: production will decrease. Thiscauses price level to rise from P1 to P2.
65

MACROECONOMICS Macroeconomic objectives
How could the government reduce inflation?
Increase taxes / reduce government spending (fiscal policy): this will cause incomesof people to decrease, reducing spending and thus reducing demand pull inflation.
Raise interest rates: this will cause people to save more (they will get more interest) andspend less, this reduces demand pull inflation.
Reduce money supply (monetary policy): when there is less money in circulation, thevalue of money will increase. So less money is needed to buy something and theprice is reduced.
Supply-side policies – shift supply curve to the right: (e.g. education, invest intechnology etc.) this will reduce the cost for producers, reducing cost-pushinflation.
Inflation and unemployment trade-off
In the short run and the long run there is a connection between inflation andunemployment. This relationship is called the Phillips Curve.
Figure 2.12: Short run (left) and long run (right) Phillips curves.
Unemployment rate
Infla
tion
rate
Phillips curve (SR)
High unemployment +high inflation =stagflation due to ↓ SRAS
Short run
• At a low level of unemployment, wages will behigh (because at that point demand for labourwill be high), high wages will lead to highproduction cost and high cost-push inflation.
• At high levels of unemployment, wages will below (because at that point demand for labourwill be low), low wages will lead to lowproduction cost and a low cost-push inflation.
• If SRAS suddenly decreases (supply shock), thiscan cause the prices to rise (less supply, prices↑), but unemployment to remain at the samelevel (because firms can’t fire people in the shortrun). This causes the Phillips curve to shiftoutwards: stagflation.
Unemployment rate
Infla
tion
rate
Phillips curve (LR)
Natural rateof employment
Long run
• When the economy is at long run equilibrium,there will be full employment (see neoclassicalview).
• In this case the unemployment rate = naturalunemployment rate. Therefore inflation doesnot influence unemployment.
66

MACROECONOMICS Economic Growth 2
2.4 Economic Growth
[above=-2em,below=-3em]
Economic Growthnew GDP− old GDP
old GDP× 100
There are two possible sources of economic growth:
1. GDP increases due to an increase in output
2. GDP increases due to an increase in potential output
Increase in output
Good type x
Goo
dty
pey
A
B
y1
x1
y2
x2 Real GDP
Pric
ele
vel
LRAS
y2
SRAS
AD1 AD2
y1
Deflationary gap
The graph on the left shows the Production Possibilities Frontier (PPF) = A curve thatshows the theoretical maximal combination of two goods that an economy can produceif full use is made of all factors of production.
When AD increases (AD1⇒AD2 in the graph on the right), GDP will increaseaswell (y1⇒ y2).
In the PPF: a shift from point A to point B : a higher production of both goods can beattained.
67

MACROECONOMICS Economic Growth
Possible cause: the country is making better use of existing resources, resulting in a moreefficient production.
The gap between y1 and y2 is called a deflationary gap, because the economy was notproducing at capacity (a point on the LRAS) curve.
Increase in potential output
Good type x
Goo
dty
pey
Real GDPA
vera
gepr
ice
leve
l
LRAS1
y1
LRAS2
y2
AD
The theoretical maximum production is increased, the production at full capacity ishigher than before.
LRAS (= production at capacity) increases: LRAS1⇒ LRAS2.
PPF shifts outwards: the theoretical maximum production is increased, so more of bothgood y and good x can be made.
Possible cause: increases in the quantity and quality of resources due to investments in:
Human capital to increase productivity / skill of workers(e.g. through education).
Physical capital to increase quantity / quality of man-made resources(e.g. better machines, technological advance).
Natural capital to improve / increase the stock of natural resources(e.g. explore parts of the world for fossil fuels).
Consequences of economic growth
• Increase in living standards, due to higher GDP per capita, increase in wealth.• Decrease in unemployment, more workers needed for the increased production.• Possible increase in inflation; when caused by a higher demand prices may rise due
to demand pull inflation.• Possible reduction in inequality (using taxation). Governments can increase their
tax revenue and redistribute more.
68

MACROECONOMICS Economic Growth 2
• Increase in exports and imports: more production may lead to a higher exportpotential, more demand may lead to a higher import potential.
• Possible increase in sustainability. When GDP is growing there is more moneyavailable to work on sustainable technologies / when GDP growth is caused bytechnological advance, part of that technological advance may be used for a moresustainable production.
• Possible decrease in environment: a higher GDP means production has increased.Production may be polluting the environment.
69

MACROECONOMICS Economic Growth
2.4.1 Equity in the distribution of income
Equity fair distribution of income.
Equality equal distribution of income.
Due to unequal ownership of factors of production there is inequitabledistribution of income.
How to promote equity?
Taxation to redistribute income
• Direct vs. indirect taxes
– Direct: imposed directly on income, wealth and profit. (e.g. income tax)– Indirect: imposed over consumer spending (e.g. VAT)
• Progressive, regressive and proportional taxation
– Progressive: the higher the income, the higher the average tax rate.– Regressive: the higher the income, the lower the average tax rate.– Proportional: same tax rate for all incomes.
Direct government expenditures
• Provide money directly to people
• Subsidies (e.g. subsidise certain sectors in order to employ more people).
Transfer Payments (e.g. unemployment benefits, pensions).
Evaluation of redistribution of income policies
Arguments in favor of redistributions
• Taxes are important revenue for thegovernment
• Taxes can help reduce marketfailure (see microeconomics).
• Redistribution makes thedistribution of income more fair
Arguments against redistribution
• Full efficiency can only be reachedwithout government intervention
• Taxes may discourage people to workor engage in entrepreneurial activities
• Taxes have negative effects on growth• Transfer payments cost a lot of
money which could also be usedelsewhere
70

MACROECONOMICS Economic Growth 2
Lorenz curve
The degree of equity can be measured using the Lorenz curve. A Lorenz curve is shownon Figure 2.13, drawn on the basis of the fictional data in Table 2.5.
Table 2.5: Fictional data to draw a Lorenz Curve.
% of % of totalPerson Income population Cummulative income Cummulative
A 10,000$ 20% 20% 7% 7%B 20,000$ 20% 40% 13% 20%C 30,000$ 20% 60% 20% 40%D 40,000$ 20% 80% 27% 67%E 50,000$ 20% 100% 33% 100%
Figure 2.13: Lorenz curve.
Cummulative % of population
Cum
mul
ativ
e%
ofto
tali
ncom
e
20%
7%
40%
20%
60%
40%
80%
67%
100%
100%
Lorenz curveEqu
ality
line
The population of a country is divided into a number of income groups of equal size (inthis example: 5). The first group contains the 20% poorest people of the country, thefinal group the 20% richest people of the country. Of each group the percentage of totalincome which the people in the respective group earn is calculated.
The cumulative data of these percentages is used to draw the Lorenz curve.
The green line in the diagram represents the equality line: if every group earned the samepercentage of total income, the Lorenz curve would lie on this equality line. The furtheraway the Lorenz curve lies from the equality line, the less equal the income is distributedamong the people of the country.
Another measure of equality is the Gini-index. This is a number between 0 and 100. Thehigher this Gini-index the more unequal the distribution of income.
71

MACROECONOMICS Government Intervention
Poverty
In some cases income is distributed extremely unequal. In these cases poverty isimminent.
Absolute poverty the inability to fulfill the basic economic needs.
Relative poverty being poor relative to others around you.
Causes of poverty
• Low incomes• Unemployment• Lack of human capital, not having
enjoyed enough education may leadto unemployment and low incomes.
Consequences of poverty
• Low living standards• Lack of access to health care and
education
2.5 Government Intervention
2.5.1 Fiscal Policy
Fiscal policy government intervention by either adjusting taxes or adjustinggovernment spending
Figure 2.14
Real GDP
Pric
ele
vel
LRAS
AD3 AD1 AD2
y1 y2y3
72

MACROECONOMICS Government Intervention 2
Two types of fiscal policy
Expansionary fiscal policy
• Reducing taxes• Increasing government spending• AD increases: a move from AD1
to AD2.
Contractionary fiscal policy
• Increasing taxes• Decreasing government spending• AD decreases: a move from AD1
to AD3.
Fiscal policy also automatically stabilises short term fluctuations in GDP:e.g. unemployment benefits, progressive tax system. People suddenly losing their job in atime of crisis get benefits from the government, so their loss in income is manageable.Their purchasing power / expenditure doesn’t decrease that much, so GDP will notfluctuate dramatically.
Fiscal policy also promotes long term economic growth:
• Government expenditure can help to create an economic environment favourableto investment. (e.g. investing money in infrastructure).
• Direct investments by the government may lead to a more efficient production(e.g. by providing companies with the means to do more research & development).
The government budget
Government Revenue
• Taxes• Sale of goods and services
(e.g. by companies that belong to thegovernment).
• Sale of state owned enterprises
Government Expenditures
• Current expenditures = recurringexpenditures(e.g. wages of civil servants, intereston government debt).
• Capital expenditures = one-timepayments(e.g. building a new school).
• Transfer payments = payments tocitizens (e.g. welfare, pensions).
• Revenue> expenditures → surplus → government debt decreases• Revenue> expenditures → deficit → government debt increases• Revenue= expenditures → balanced budget → government debt remains the same
73

MACROECONOMICS Government Intervention
2.5.2 Monetary policy
Monetary policy government intervention by adjusting interest rates ormoney supply
Lowerinterest rates
Moreborrowing
Moreinvestment
Lesssaving
Morespending
AD ↑
Two types of monetary policy
Figure 2.15
Real GDP
Pric
ele
vel
LRAS
AD3 AD1 AD2
y1 y2y3
Expansionary / easy monetary policy
• Increasing the money supply, thiswill decrease the price paid formoney (which is interest) so interestwill decrease.
• AD increases: a move from AD1to AD2.
Contractionary / tight monetary policy
• Decreasing the money supply, thiswill decrease the price paid formoney (which is interest) so interestwill decrease.
• AD decreases: a move from AD1to AD3.
Note: Central banks are more guided by maintaining a stable rate of inflation than byinfluencing aggregate demand. Central banks will therefore seldom use their powers totry and increase AD.
74

MACROECONOMICS Government Intervention 2
The role of central banks
Figure 2.16
Money
Inte
rest
rate
m1
MS1
m2
MS2
MSD
R1
R2
Responsibilities of Central Banks
• Controlling inflation• Controlling money supply• Influencing exchange rates• Regulating commercial banks• Controlling interest rates
What can Central Banks Do?
• Increase money supply (releasingmoney from reserves). This willcause the Money Supply Curve (MS)to shift to the right (MS1⇒MS2).This measure will decrease the priceof money = interest rate.
• Change the interest rate directly, thiswill have the same effect.
2.5.3 Supply side policies
Supply side policies government intervention by affecting the productionside of the economy⇒ changing the quantity or quality of the factors of production.
Two types of supply side policy
Interventionist supply side policies(focuses on government intervention)
• Investment in humancapital (e.g. providing education).
• Investment in new technologies.• Investment in infrastructure.• Policies that favour industrial
companies, e.g. tax cuts, subsidies.
Market based supply side policies(reduce competition, encourage free markets)
• Reforming the labour market toincrease flexibility, this may make iteasier for companies to find the rightpersonnel.
• Incentivise working of labourers bycutting income tax. Incentiviseinvestment by firms by cuttingcorporate tax.
⇒ These policies allow companies toproduce more efficiently, which maylead to an increase in production. Inthe graph this will shift the LRAScurve to the right (LRAS1⇒ LRAS2).
⇒ These policies allow firms to producemore efficiently, which may lead toan increase in production. In thegraph this will shift the LRAS curveto the right (LRAS1⇒ LRAS2).
75

MACROECONOMICS Government Intervention
2.5.4 Evaluation of policies
Fiscal Policy Monetary Policy Supply-side policies
+ Positively affectsgrowth
+ Ability to target specificsectors
+ Direct impact on AD+ Works well in a
recession
+ Easy to increase interestrates
+ Interest rates can beincreased step-by-step (incrementally)
+ Positively affectsgrowth
+ Positively affectsgrowth
+ Creates employment+ Reduces inflationary
pressure
− It takes time towork (time lag)
− Can’t influence thesupply side of theeconomy
− Negatively influencesgovernment budget
− Raise in governmentspending can increaseinterest rates⇒ less consumptionand investment(crowding out)
− Takes time towork (time lag)
− Doesn’t work well in arecession
− Conflict of interestwith inflation targets
− Takes time towork (time lag)
− Can negativelyinfluence equity
− May be politicallyundesirable
− May negativelyinfluence theenvironment
76

3INTERNATIONALECONOMICS
3.1. Trade 78– Advantages of free trade – Absolute and comparativeadvantage – The World Trade Organisation – Tradeprotectionism – Arguments for and against protection– Economic integration
3.2. Exchange rates 85– Freely floating exchange rates – Fixed exchange rates– Managed exchange rates
3.3. The balance of payments 88– The structure of the balance of payments – Current accountdeficits and surpluses
3.4. Terms of trade 91– Measurement – Causes of changes – Consequences ofchanges
77

INTERNATIONAL ECONOMICS Trade
3.1 Trade
3.1.1 Advantages of free trade
International free trade may have the following advantages:
Lower prices for consumers: due to free trade consumers can import the goods theywant from the country that can make them the cheapest. They do not necessarilyhave to buy the good domestically.
Greater choice for consumers: consumers can choose from goods that are made allover the world, and not just in their own country.
The ability for producers to benefit of economies of scale: producers can sell to alarger market (the whole world instead of just one country) which allows them togrow and to further exploit economies of scale to produce more efficiently.
The ability to acquire needed resources: firms may now have access to resourceswhich cannot be found domestically.
A more efficient allocation of resources: resources can now be used in the countrythat can make most efficient use of them.
Increased competition: free trade opens up the world market to a large number of firmsthat will compete. Competition will lead to more diverse products, more qualityand lower price.
Source of foreign exchange: countries can use free trade to get foreign currency ormake dispose of domestic currency (foreign countries can pay for goods theyimport in their own currency).
3.1.2 Absolute and comparative advantage
In general, economists say that the country that has advantage in the production of agood should produce that good, rather than a country that does not have this advantage.There are two theories on how to determine which country has the advantage: (1) thetheory of absolute advantage and (2) the theory of comparative advantage:
1. A country has absolute advantage in the production of a good when it can produceit using fewer resources than another country.
2. A country has comparative advantage in the production of a good when it canproduce it at lower opportunity cost than another country.
78

INTERNATIONAL ECONOMICS Trade 3
Figure 3.1
Cars
Tru
cks
21
35
6
30
A
B
Country Bis 3.5 timesmoreproductiveat truckproduction
Country B isonly 1.17 times moreproductive at carproduction
On the left you can see theproduction possibilities frontiersof 2 countries A and B for cars andtrucks.Country A has the absoluteadvantage in both products,because it can make more trucksand more cars than country B .The opportunity cost of cars forcountry A is 0.2 trucks, theopportunity cost of cars forcountry B is 0.6 trucks; thereforecountry A has comparativeadvantage in cars.
The opportunity cost of trucks for country A is 5 cars, the opportunity cost of trucksfor country B is 1.67 cars; therefore country B has comparative advantage in trucks.
• The curve on the inside has comparative advantage in the good that is on the axiswith the smallest gap with the other curve.
• The curve that intersects with the axis the furthest away from the origin, hasabsolute advantage in the production of the good on that axis.
Limitations of the theory of comparative advantage
1. Perfect knowledge is assumed, but it is impossible that everyone knows everything.
2. It is assumed that there are no transport costs, while in reality this is not the case.
3. It is assumed that there are only two economies producing two goods, while inreality there are a lot of economies producing a lot of goods.
4. It is assumed that costs of production do not change and that the returns to scaleare constant, while in reality this won’t be the case.
5. It is assumed that the goods that are being traded are completely identical, while inreality differentiation within goods is possible.
6. It is assumed that factors of production remain in the country, while in realityfactors of production can travel between countries.
7. It is assumed that there is perfect free trade among countries, while in reality tradebarriers exist.
79

INTERNATIONAL ECONOMICS Trade
3.1.3 The World Trade Organisation
The World Trade Organisation (WTO) is an international organisation that sets the rulesfor global trading and resolves disputes between its member countries.
Objective
Increase international trade by lowering trade barriers and provide a forum fornegotiations.
Functions of the World Trade Organisation
• Administer WTO trade agreements that the WTO has set up between countries.• Be a forum for trade negotiations and facilitate in setting up trade deals.• Handle trade disputes among member states.• Monitor national trade policies.• Provide technical assistance and training for developing countries.• Cooperate with other international organisations in order to increase trade.
3.1.4 Trade protectionism
Different forms of trade protection exist. In this section we will first look at a graphicaldepiction of a free trade situation. Then, we will show what happens to the free tradeequilibrium in case of (1) a tariff, (2) a subsidy and (3) a quota.
Market with free trade
Figure 3.2
QD
P
O
SD
D
SWPw
Qr
Pr
Q1 Q2
I II
In this market with free trade the product isboth produced domestically and imported(world production).The domestic production is represented by theSD curve and the world production by the SWcurve.SW is a horizontal line, the world productionis not affected by the price on the domesticmarket, because the domestic market is only asmall fraction of the world market.In the case of free trade, producers willproduce 0Q1 (I).Beyond Q1, the price of world production willbe below the price of domestic production,Q1Q2 (II) will be imported.
80

INTERNATIONAL ECONOMICS Trade 3
Tariff tax charged on imported goods.
Figure 3.3
QD
P
O
SD
D
SwPw
Sw + tPw + t
Qr
Pr
Q1 Q2Q3 Q4
b ca d e f
g h i j k
• Sworld will shift upwards, because foreignproducers have to pay the tariff in orderto sell their goods in the country.Domestic consumers will face a highermarket price.
• Import is reduced from Q1Q2 to Q3Q4.• Foreign producer revenue is d + e + i + j
minus the tax of d + e , so i + j in total.• Domestic production increases from 0Q1
to 0Q3.• Domestic revenue increases from g to
a+ b + c + g + h.• Government revenue is represented by
d + e .• The tariff causes a welfare loss of c + f .
Subsidy sum of money given to producers.
Figure 3.4
QD
P
O
SD
SD + S
D
SwPw
Qr
Pe
Q1 Q3 Q4 Q2
a b c d
e f g
• The subsidy will increase the domesticproduction so SD will shift to the right toSD+S.
• Domestic production increases from 0Q1to 0Q3.
• Domestic revenue increases from a toa+ b + e + f + g of which e + f + g isthe subsidy.
• Import decreases from Q1Q2 to Q3Q2.• Foreign revenue decreases from b + c + d
to c + d .• The government spending on the subsidy
is represented by e + f + g .• The subsidy results in a welfare loss
represented by g . This area represents thenet loss in producer and consumersurplus.
81

INTERNATIONAL ECONOMICS Trade
Quota limit on imported goods.
Figure 3.5
QD
P
O
SD
SD+ S
D
SWPW
Qr
Pe
Q1 Q3 Q4 Q2
a b c d e
f gh
i j k
• A quota is imposed at Q1Q3, meaningthat the country can not import anyfurther than point Q3.
• Domestic production will be 0Q1 andQ1Q3 will be imported.
• Beyond this point, the excess demand willcause domestic producers to be willing toproduce more (at a higher price), SD willthus shift to the right.
• Domestic revenue increases from a toa+ c + d + f + i + y.
• Foreign revenue decreases fromb + c + d + e to b + g + h.
• The welfare loss is represented by j + k.
In addition to quota, tariffs and subsidies, countries can also set administrative barrierssuch as:
• Requiring a lot of paperwork before a good can be imported (this form ofadministrative barriers are often referred to as “red tape”).
• Setting high health and safety standards that products have to comply to in orderto be imported.
3.1.5 Arguments for and against protection
Arguments for protectionism
• Domestic jobs are protected because domestic consumers are more dependent ondomestic production.
• Protection can reduce dependence on international trade and can this way protectnational security.
• Infant industries can freely develop when they do not face competition fromforeign established producers.
• Maintenance of health, safety and environmental standards.
• Foreign producers can use the market of other countries to dump excessproduction at extremely low prices. Protectionism protects domestic producersfor this kind of unfair competition.
• Protectionism limits imports, this way a balance of payments deficit can beovercome.
• The government can profit out of tariff revenues.
82

INTERNATIONAL ECONOMICS Trade 3
Arguments against protectionism
• It raises prices because its limits free trade.
• Import is limited, which limits the diversity of goods being supplied on thedomestic market, limiting consumer choice.
• Competition diminishes, which reduces the positive effects of competition such asimproved quality and diversification of products.
• Foreign countries may retaliate with trade barriers of their own, harming theexporting companies of the domestic country (trade wars).
• Resources may not be used in the country that can make most efficient use ofthem: misallocation of resources
• Because governments can earn major sums of money by using tariffs there is greatpotential for corruption, especially in less developed countries.
• Domestic companies may focus more on the domestic market due to the barriers,thereby reducing their export competitiveness.
• Increased cost of imported factors of production, because tariffs and quota mayalso apply to these.
3.1.6 Economic integration
Economic integration the unification of economic policies between differentstates through the partial or full abolition of tariff and non-tariffrestrictions on trade taking place among them prior to their integration.
In general six degrees of economic integration can be recognised:
Preferential tradeagreements
Agreements that give preferential access to certainproducts from certain countries by reducing oreliminating tariffs or by other agreements related totrade. These agreements can be:Bilateral: between two countriesMultilateral: between three or more countries
1
Free trade areas Countries are able to trade freely among themselves,but are able to trade with countries outside the freetrade area in anyway they like.
2
Customs union Countries are able to trade freely among themselvesand also agree to adopt common external barriersagainst any country outside the union.
3
83

INTERNATIONAL ECONOMICS Trade
Common market A customs union with common policies on productregulation and free movement of goods, services, capitaland labour.
4
Monetary Union Common market with common currency and commoncentral bank.
5
Complete economicintegration
Countries have no control of economic policy, fullmonetary union with complete harmonisation of fiscalpolicy.
6
Advantages
• Lower transaction costs• Certainty• Price comparison• Trade creation (see later)• Transparency• Helps attract foreign direct
investment due to larger market
Disadvantages
• Loss of economic sovereignty• Interest rate might not fit the
situation of all countries involved• Asymmetrical shocks affect different
countries within the uniondifferently
The further down the road of economic integration, the higher the potential forcompanies to benefit of economies of scale.
Some notes to economic integration
In a customs union there can be trade diversion and trade creation:
Trade creation with the entry of the country into the customs union,countries can regain comparative advantage which was hindered byprevious trade barriers. Now this country can trade more by exploitingthis advantage and producing more of the good.
Trade diversion before entry into the customs union, the country importedfrom country x without barriers. With entry into the union, tariffs areimposed on country x (non-member) and the product is thereforeimported from member countries at higher price instead of fromcountry x.
84

INTERNATIONAL ECONOMICS Exchange rates 3
3.2 Exchange rates
3.2.1 Freely floating exchange rates
Figure 3.6: Demand and Supply for acurrency (the euro).
Quantity of€
Pric
eof€
in$
Supply of€
Demand for€
Figure 3.7: An increase in demand for thecurrency leads to an increase in the price(value of the currency): an appreciation.
Q.€
P.€
S
D
D′
Figure 3.8: A descrease in supply of thecurrency leads to a decrease in the price(value of the currency): a depreciation.
Q.€
P.€
S
S′
The exchange rate is the value ofone currency expressed in terms ofanother currency.(e.g. 1€= 1.15$).In a freely floating exchange rateregime, the value of an exchangerate is determined by the demandfor and supply of that currency. Atthe equilibrium point the price andquantity of the currency on themarket is determined (see graph).Demand for and supply ofcurrency can change due to shiftsin the supply and demand curves.This will lead to a change inexchange rate as well. Thesechanges in exchange rates due tomarket shocks are calleddepreciations and appreciations.If the supply of the€ decreases(supply curve shifts to the left) orthe demand for the€ increases(demand curve shifts to the right),the value of the€ will go up, andthe exchange rate will increase; wecall this an appreciation of the€.If the supply of the€ increases(supply curve shifts to the right) ordemand for€s decreases (demandcurve shifts to the left), the value ofthe€ will go down and theexchange rate will decrease; we callthis a depreciation of the€.Note: we only call it appreciationor depreciation if the shift indemand/supply is caused bymarket forces (and not when it iscaused by governmentintervention).
85

INTERNATIONAL ECONOMICS Exchange rates
What factors influence supply of and demand for a currency?
Foreign demand for exports: when foreign demand for exports increases, demand forthe currency will increase because foreign nations will need to buy the exports inthe domestic currency.
Domestic demand for imports: when domestic demand for exports increases, thesupply of the domestic currency increases because domestic consumers will needto buy the exports in the foreign currency. They will need to exchange thedomestic currency for the foreign currencies.
Domestic interest rates relative to foreign interest rates: when the domestic interestrate increases relative to the foreign interest rates, foreign investors will bring theirmoney into the domestic country. They can only deposit money of the domesticcurrency on the domestic country’s banks, so demand for domestic currency (inorder to exchange their foreign currencies) will increase.
Investment from overseas in domestic firms: when foreign investors invest more indomestic firms the demand for domestic currency will increase, because theseinvestments must be made in the domestic currency.
Speculation: investors may spread rumors about the future development of exchangerates and speculate on future value. Basically anything can happen to the value ofthe currency, depending on the content of the rumors.
What happens if the domestic currency appreciates?
• Domestic products will be more expensive to buy for foreign nations so exportswill decrease.
• This will result in decreased employment, because people producing goods forexports will be needed less, and less economic growth.
• Foreign products will be cheaper to buy for the domestic nations so imports willincrease.
• This will result in less inflation due to decrease in price of imports.
• Because exports decrease and imports increase the current account balance (X−M)decreases.
86

INTERNATIONAL ECONOMICS Exchange rates 3
3.2.2 Fixed exchange rates
Figure 3.9: The revaluation of a cur-rency.
Q. of Dkk
P.of
Dkk
in€
S1
S2
D1
D2
0.14
A fixed exchange rate regime is anexchange rate regime in which the valueof the currency is pegged to the value ofanother currency e.g. 1 Danish krone(DKK) will always be 0.14€.But what if due to a shock the price ofDKK decreases? e.g. due to an increasein supply of DKK because the Danessuddenly buy more? (S1⇒ S2).The government will have to increasedemand for DKK in order to keep theexchange rate fixed at 0.14€. (How thegovernment can do this is discussedlater on in this chapter).The demand curve for the currency willtherefore shift to the right (D1⇒ D2).This rise in value of the currency causedby government is called a revaluation; adecrease in value caused by thegovernment is called a devaluation.
3.2.3 Managed exchange rates
Under a managed exchange rate regime the exchange rate is freely floating but there isperiodic government intervention to influence the value of the exchange rate. Forexample there is a bandwidth within which the value of the currency can freely float butif the value of the currency goes outside this bandwidth, the government will intervene.
How does the government influence demand for and supply of a currency?
1. Using reserves of money (the central bank has in them in the vaults) to buy or sellforeign currencies:
• Selling foreign currencies in exchange for domestic currency decreases thesupply of and increases the demand for domestic currency.
• The opposite is true for buying foreign currency in exchange for domesticcurrency.
2. Changing interest rates:
• If a government were to increase the domestic interest rate this would draw(the money of) foreign investors to the country and they would have toexchange their foreign currency for domestic currency. This increasesdemand for domestic currency and decreases supply of domestic currency.
• The opposite is true for a decrease in interest rate.
87
INTERNATIONAL ECONOMICS The balance of payments
3.3 The balance of payments
3.3.1 The structure of the balance of payments
The balance of payment is a record of all money entering the country (debit, +) andleaving the country (credit, −). It consists of different sub-accounts, which can besummarised in the following schedule:
I Financial account
The inflows from investments from abroad (debit) against investment to abroad (credit).These investments can be placed into three categories:
• Direct investment: purchase of long-term assets (such as buildings or factories).
• Portfolio investment: purchases of stocks and bonds.
• Reserve assets: purchases of reserves of gold and foreign currencies.
II Capital account
Miscellaneous income (debit) or expenses (credit) that can’t be placed in any othercategory.
• Capital transfers: miscellaneous (e.g. death duties, debt forgiveness).
• Transactions in non-produced non-financial assets: purchases of intangible assets(trademarks, patents, rights etc.).
III Current account
Inflows of trade and income (debit) against outflows (credit)
• Balance of trade in goods: exports of goods minus import of goods.
• Balance of trade in services: exports of services minus import of services.
• Income: earnings from investment leaving (-) and entering (+) the country.
• Current transfers: net payments to governments without retribution(e.g. gifts, aid etc.).
88

INTERNATIONAL ECONOMICS The balance of payments 3
The financial account and capital account add up to the current account.
But it is almost impossible to measure exactly how much money is leaving and entering acountry. That is why the formula must also include ‘errors and omissions’. The finalformula will be as follows:
Current account financial account + capital account + net errors &omissions
3.3.2 Current account deficits and surpluses
A (persistent) current account deficit may cause:
Downward pressure on the domestic currency exchange rate: more imports thanexports lead to relatively more supply of than demand for the domestic currency.
Increase in indebtedness: to finance the net outflow of money the country mustborrow money, resulting in more indebtedness and higher interest rates. this canresult in declining international credit ratings.
More foreign ownership of domestic assets: a current account deficit can be financedwith a financial account surplus, meaning the net ownership of foreign countriesof domestic country’s assets will increase.
The opposite of the above may happen in case of a current account surplus.
A government can use several strategies to tackle a persistent current account deficit:
Expenditure switching methods: making sure people buy more domestic productsinstead of foreign goods so import is reduced. This can be achieved by usingprotectionist measures.
Expenditure reducing methods: making sure people spend less in general which willalso reduce imports. This can be achieved by using contractionary fiscal ormonetary policy.
Supply side policies: boosting supply and therefore exports. This can be achieved usingexpansionary supply side policies.
89

INTERNATIONAL ECONOMICS The balance of payments
Marshall-Lerner and the J-curve Effect
Figure 3.10: J-curve.
Time
CurrentAccountdeficit
CurrentAccountsurplus
x
y
z
When there is a Current Accountdeficit, the exchange rate depreciates(see above).Normally this would lead to moreexports and less imports which wouldfix the problem. In real life though, thisis often not the case.Why? Because demand for exports andimports are often inelastic, meaning aprice change (due to the depreciation ofthe currency) doesn’t affect them thatmuch.Depreciation of currency only workswhen the price elasticity of exports andimports are sufficiently elastic and theMarshall-Lerner condition holds:
PEDexports+PEDimports > 1
When this is the case we will see the J-curve effect, which is depicted in the graph inFigure 3.10:
• x: starting point, the currency will depreciate from this point because there’s acurrent account deficit.
• y: prices have fallen but it takes time for consumers to act on this due to delays incommunication and long term contracts.
• z: consumers start to act on new prices, the deficit disappears rapidly.
90

INTERNATIONAL ECONOMICS Terms of trade 3
3.4 Terms of trade
3.4.1 Measurement
Terms of trade (TOT) an index that shows the value of a country’s averageexport prices relatively to their average import prices.
TOT=Index average export price (AEP)Index average import price (AIP)
× 100
3.4.2 Causes of changes
Changes in the Terms of Trade can have different causes in both the long run and theshort run. The most relevant causes are listed below:
Short Run
• Shifts in the demand and supplycurve of imports and exports. Whenthe demand curves have shifted, theprice of imports and exports canchange, resulting in different TOT.
• Changes in global supply of keyinputs (production factors). Whenthe supply of these inputs change sodo their price. When the countryimports or exports these resources,this will influence the average importand export prices.
• Changes in relative inflation rates.For example when the domesticinflation increases relative to theforeign inflation rate, export priceswill be higher and import prices willbe lower, resulting in an increase inTOT.
• Changes in relative exchange rates.For example when exchange ratesincrease, the export price for foreigncountries will be higher and importprices for the domestic country willbe lower. This results in an increasein TOT.
Long Run
• Changes in world income levels. Forexample if income in the countryincreases, there will be more demandfor imports so the import price willincrease thereby decreasing TOT.
• Changes in productivity within thecountry. For example when thecountry becomes more productive, itcan produce more efficiently and theprices of domestic goods decrease.This decreases the average exportprice leading to a decrease in TOT.
• Technological developments. Forexample when the country has gonethrough technological advance, itbecomes more productive so it canproduce more efficiently and theprices of domestic goods decrease.This decreases the average exportprice, leading to a decrease in TOT.
91

INTERNATIONAL ECONOMICS Terms of trade
3.4.3 Consequences of changes
Changes of the TOT may have the following consequences:
Effect on global distribution of income: Countries with greater TOT get moreincome at the expense of countries with low TOT in the long term becausecountries with high TOT pay relatively less for their imports and receive moremoney for their exports.
Effect on current account:
• An improvement in TOT, caused by increase in demands for exports, willlead to an improved current account balance.
• An improvement in TOT, caused by inflation, will lead to an improvementof the current account balance when demand for exports is inelastic.
Effect on the economy of developing countries: Developing countries have low TOTbecause price of primary commodities (which they export) has fallen over the pastdecades. Furthermore, the price elasticity of demand for primary products is low(inelastic) and the demand for these products hasn’t increased much to cover theloss in revenue due to the decrease in price.
Consequences:
• Developing countries have to sell more exports to buy the same amount ofimports. This decreases price of exports even further.
• Falling export prices makes it harder to service national debt because the countryearns less money.
• Developing countries may want to boost their exports in order to earn moremoney but they may do so by over-exploiting their natural resources. This hasmany negative effects such as pollution.
92

4DEVELOPMENTECONOMICS
4.1. Economic development 94– Economic Development vs. Economic Growth– Characteristics of less developed countries
4.2. Measuring development 95– Economic indicators – Health indicators – Educationindicators – Composite indicators — HDI
4.3. Contributions and barriers todevelopment
97
– Domestic Factors – International trade – Foreign directinvestment – Foreign aid – Multinational developmentassistance – International debt
4.4. Evaluation of developmentpolicies
102
– Market oriented policies – Interventionist policies
93

DEVELOPMENT ECONOMICS Economic development
4.1 Economic development
4.1.1 Economic Development vs. Economic Growth
Economic growth increase in GDP.
Economic development increase in welfare. This includes wealth but alsoquality of life.
Limited economic development is possible without growth but on the long term growthis usually necessary to get economic development.
Sources of economic growth
• Increase in quantity of humanand physical capital allowscompanies to produce more /more efficiently.
• Development and use of newtechnologies allows companies toproduce more /more efficiently.
• Institutional changes (changes ingovernment, less corruption)may lead to a more favourableclimate for production.
Sources of economicdevelopment
• Reducing widespread povertyimproves welfare.
• Raising living standards improveswelfare.
• Reducing income inequalities thisincreases overall welfare.
• Increasing employmentopportunities which may increaseincomes and therefore welfare.
For your IB EconomicsExam you must knowthe current status of themillennium goals. Forpreparation you can lookup different examples ofthe level of progressmade on thedevelopment goals.
The United Nations (UN) have drawn up global goals for the development of developingnations known as “The Millennium goals”:
1. Eradicate extreme poverty and hunger.
2. Achieve universal primary education.
3. Promote gender equality and empower women.
4. Reduce child mortality.
5. Improve maternal health.
6. Combat HIV/AIDS, Malaria and other Diseases.
7. Ensure environmental sustainability.
8. Global partnership for development.
94

DEVELOPMENT ECONOMICS Measuring development 4
4.1.2 Characteristics of less developed countries
General characteristics:
1. Low levels of GDP per capita2. High levels of poverty3. Relatively large agricultural sectors4. Large urban informal sectors (black markets)5. High birth rates
These characteristics may lead countries to be caught into the ‘poverty trap’: poorcommunities are unable to invest in physical, human and natural capital due to low or nosavings⇒ poverty is being transmitted from generation to generation.
However, economically less developed countries, though sharing some characteristics,also differ greatly. These differences may arise from: For your IB Economics
Exam, you must knowsome examples of thesedifferences betweensome developingcountries.
1. Resource endowments (differences in natural resources).2. Climate (desert climate or otherwise).3. History (colonial or otherwise).4. Political systems (democracy, dictatorship or otherwise).5. Degree of political stability (generally peaceful or at war).
4.2 Measuring development
4.2.1 Economic indicators
In the following table, different economic indicators are listed that can be used todistinguish between developed countries and developing countries:
Indicator What does it measure? DevelopedCountry
DevelopingCountry
GDP perCapita
Total income earned by the factors ofproduction in a country regardless theassets owner per head of the population
Very High Very Low
GNI perCapita
Total income earned by a country’sfactors of production, regardless theassets location per head of thepopulation
Very High Very Low
GDP perCapita atPurchasingPower Parity
GDP per capita corrected fordifferences in prices and exchange ratesbetween countries; comparespurchasing power (how much can youbuy from your money) betweencountries
High Low
95

DEVELOPMENT ECONOMICS Measuring development
4.2.2 Health indicators
In the following table, different health indicators are listed that can be used to distinguishbetween developed countries and developing countries:
Indicator What does it measure? DevelopedCountry
DevelopingCountry
Lifeexpectancyat birth
The average number of years a personmay expect to live from the time thatthey are born
High Low
Infantmortalityrate
A measure of the number of deaths ofbabies under the age of one year per1000 births in a given year
Low High
4.2.3 Education indicators
In the following table, different education indicators are listed that can be used todistinguish between developed countries and developing countries:
Indicator What does it measure? DevelopedCountry
DevelopingCountry
Adultliteracy rate
The proportion of the adult population(15+) that knows how to read
High Low
Netenrolment inprimaryeducation
The ratio of children of primary schoolage enrolled in primary education tothe total number of children who are ofprimary school age in the country
High Low
4.2.4 Composite indicators — HDI
It is also possible to distinguish between developed countries and developing countriesby using composite indicators.
Composite indicators contain more than one measure and so are considered to be betterindicators of economic development.
The best example is the Human Development Index (HDI), a number between 0 and 1comprised of:
• Long and healthy life; measured by life expectancy.
96

DEVELOPMENT ECONOMICS Contributions and barriers to development 4
• Education; measured by literacy rate and school enrollment.
• Standard of living; measured by GDP per capita at PPP.
Economically developed countries have a very high HDI (> 0.900). Economicallydeveloping countries have a medium (0.500–0.799) or low (< 0.500) HDI.
Because HDI takes into account more than just GDP/GNI per capita, a country’s GNPranking may differ from its HDI ranking.
4.3 Contributions and barriers to development
4.3.1 Domestic Factors
In the following table, several domestic factors that can contribute to economicdevelopment are listed:
Domestic Factor Examples
Education and health Better education can lead to a more productive workforce.Better health care improves life expectancy
The use of appropriatetechnology
Using technology that fits the skills of the people maylead to higher employment levels
Access to credit andmicro credit
Small loans can give people the chance to start a business,which increases income and business productivity
The empowerment ofwomen
Emancipation of women can mean higher employmentof women or more educated women contributing todevelopment
Income distribution More equitable income distribution could lead to lessconflict, rebellion and wars, which is good for growth andstability
4.3.2 International trade
Contributions to development
In the following table, several international trade factors that can contribute to economicdevelopment are listed together with their advantages and disadvantages.
97

DEVELOPMENT ECONOMICS Contributions and barriers to development
InternationalTrade factor
Explanation Advantages Disadvantages
Importsubstitution
Producing goods yourself insteadimporting them + Protects jobs
+ Protects localculture
+ Less dependenceon foreignnations
− Doesn’t benefitfromcomparativeadvantage
− Higher prices− Danger of
retaliation
Exportpromotion
Focussing on exporting goodsand using the revenues from thisexport to boost aggregate demand
+ More efficiency+ Increased variety/ quality
+ Quick growth
− Strategy forgrowth, notdevelopment
− Inequality− Might not be
possible indevelopingcountries
Tradeliberalisation
More free trade (see internationaleconomics!) + Lower prices
+ Increased variety/ quality
+ Increasedefficiency
− May cut jobs insome sectors
− Increasesdependence
Help of theWorld TradeOrganisation
International organisation whichregulates international trade + Can help set up
trade deals+ All free trade
arguments
− Givesmultinationals achance to exploitcheap labour indevelopingcountries
Bilateral andregionalpreferentialtrade
Trade agreements betweencountries in a certain region (seeInternational Economics!)
+ Lower prices+ Increased variety/ quality
+ Increasedefficiency
− May cut jobs insome sectors
− Increasesdependence
Diversification To move from the productionand export of primarycommodities and to replace thesewith production and export ofmanufactured goods
+ Protection fromvolatile changesin primaryproduct
− Developingcountries oftendon’t have thesophisticatedworkforce forthis
98

DEVELOPMENT ECONOMICS Contributions and barriers to development 4
Barriers to development
In the following table several international trade factors that can be barriers for economicdevelopment are listed:
International TradeFactor
Explanation
Over specialisation on anarrow range ofproducts
This can cause too much dependence on the export of asmall set of goods. If the market of these goods collapses,the country may face economic catastrophe.
Price volatility ofprimary products
Since developing countries are very dependent on theexport of primary products, volatility in the price ofthese products (especially decreases in price) can hurt theeconomy.
Inability to accessinternational markets
Developing countries often can’t access the markets ofdeveloped countries due to protectionist measures, whichleads to less exports and thus limits growth anddevelopment potential.
Long term changes interms of trade
Often TOT is low in developing countries, long term lowTOT may lead to inability to buy imports, resourceoveruse and inability to finance debt (see Internationaleconomics)
4.3.3 Foreign direct investment
Another factor that may contribute to or form a barrier to development is ForeignDirect Investment:
Foreign Direct Investment (FDI) long term investments by multinationalcorporations (MNCs) in foreign countries by either building new plantsor expanding existing ones.
Why would companies want to invest in developing countries?
• Developing countries can often provide factors of production at a very low cost(e.g. low wages). This makes it possible to produce goods at a low price.
• Developing countries often have a favourable fiscal (tax) climate, allowingcompanies to produce while paying little to no taxes.
99

DEVELOPMENT ECONOMICS Contributions and barriers to development
• Developing countries often have a regulatory framework that makes it easy tobring made profits to the country of origin of the MNC (profit repatriation).
FDI can contribute to development, but can also form a barrier:
Advantages of FDI
• Provide employment and education.
• Provide greater access to Research &Development, technology andexpertise.
• Improves infrastructure of thecountry.
• Drop in consumer prices and morediversity in goods.
• More efficient allocation of worldresources.
Disadvantages of FDI
• MNCs may only uselow-wage/unskilled workers of thecountry.
• MNCs may exploit the favourabletax rules leading to less revenue forthe country’s government.
• MNCs may exploit the weaklegislation on pollution of thecountry, which may lead tounsustainable and pollutingproduction.
4.3.4 Foreign aid
Another factor that may contribute to or form a barrier to development is Foreign Aid.Aid can be extended by:
• Governments (we then call it “Official Development Assistance” (ODA)).
• Non-governmental organisations (NGO’s).
In general we can distinguish between humanitarian aid and development aid:
Humanitarian Aid
• Food aid
• Medical aid
• Emergency relief aid
Development Aid
• Grants, sums of money given to invest indevelopment.
• Concessional (= with favourable conditions)long-term loans.
• Project aid (e.g. support for schools and hospitals)
• Programme aid (e.g. support for sectors such aseducation and financial sector)
NGO’s mainly focus on providing aid on a small scale to achieve development objectives.
Aid may also be “tied aid” meaning that the receiving country must spend the aidaccording to guidelines of the donor country.
100

DEVELOPMENT ECONOMICS Contributions and barriers to development 4
Why do economically more developed countries give aid?
Social factors:
• To relieve the suffering in the developing country• To improve the standard of living in the developing country
Economic factors:
• Developed countries can benefit financially as a result of interest being paidon loans.
• Companies in developed countries may get better prices for product it buysfrom the recipient developing country, because the aid has helped thedeveloping country to produce more efficiently.
Political factors:
• The developed country can use the aid to encourage a preferred politicalsystem (democracy) in the developing country.
• The developed country can make a political ally out of the recipient country.• Providing foreign aid may give the donor country prestige within the
international community.
4.3.5 Multinational development assistance
Multilateral development assistance is mostly provided by two internationalorganisations: the International Monetary Fund and the World Bank. In the followingtable the most important characteristics of the two organisations are listed:
International Monetary Fund(IMF)
1. Surveillance
• Monitoring economicdevelopment.
• Providing policy advice todeveloping countries.
2. Loans
• To provide temporary financing.• To support policies to fix
underlying problems.• To reduce poverty.
3. Technical assistance & training
• To educate government officials.
World Bank
Goals:• End extreme poverty• Promote shared prosperity
1. Loans
• To support a wide array ofdevelopment projects(e.g. education, infrastructure)
2. Knowledge sharing
• Policy advice to governments ofdeveloping countries.
• Research and analysis of policiesand economic situations indeveloping countries.
• Technical assistance togovernments of developingcountries.
101

DEVELOPMENT ECONOMICS Evaluation of development policies
4.3.6 International debt
A final factor, which is mostly a barrier to economic development, is international debt.
Foreign debt outstanding loans that a country owes to other countries orother countries’ institutions.
Countries often borrow internationally in order to finance government expenditure, anegative balance of trade or fees for goods and services.
In some cases developing countries have become so heavily indebted that rescheduling ofdebt payments and/or conditional assistance from international organisations isrequired.
Debt is a barrier to development because it costs a lot of interest which could also bespent on development projects (opportunity cost of interest) and which can causebalance of payment problems.
The burden of debt often forces developed countries to cancel a part of the debt owed tothem by developing countries in order not to jeopardise repayment of the rest of thedebt.
4.4 Evaluation of development policies
4.4.1 Market oriented policies
Market oriented policies policies that minimise the role of government andmaximise free market operation (e.g. liberalised trade and capital flows,deregulation, privatisation).
102

DEVELOPMENT ECONOMICS Evaluation of development policies 4
Strengths
• More efficient allocation of resources
• Economic growth
Weaknesses
• No government intervention maystill lead to market failure (seemicroeconomics).
• No government intervention maylead to income inequalities
• Not intervening may lead to thecreations of dual economies withinthe country (= developing countrieswhere one sector focuses on localneeds and another on the globalexport market, the two economieshave different levels of developmentand technology).
4.4.2 Interventionist policies
Interventionist policies policies that promote an active role by thegovernment and manipulation of the workings of the market.
Strengths
• A strong government can provideinfrastructure.
• A strong government can invest inhuman capital (e.g. througheducation).
• A strong government can provide,monitor and maintain a stablemacroeconomic economy.
• A strong government can provide asocial safety net (e.g. unemploymentbenefits)
Weaknesses
• A large government may lead toexcessive bureaucracy
• A large government may lead to poorand inefficient planning because thegovernment does not face marketincentives.
• A large government in developingcountries which have a weak judicialsystem may lead to corruption.
When considering interventionist policies, good governance is crucial. You need a goodgovernment in power to make well informed decisions.
Due to strengths and weaknesses of both policies, the general view is that what’s best is acombination of market oriented and interventionist policies.
103

DEVELOPMENT ECONOMICS Evaluation of development policies
104

5DEFINITIONS
5.1 Microeconomics
Ad valorem tax A tax whose amount is based on the value of a transaction.
Allocative efficiency A state in which suppliers are producing the optimal mix of goodsand services required by consumers. Allocative efficiency occurs when thecompany produces at the point where cost and value to consumers is at the samelevel.
Asymmetric information A market failure in which one party in a transactionpossesses more knowledge of the transacted product than the other party.
Average product An output that is produced on average, by each unit of the variableproduction factor.
Average revenue The revenue a firm receives per unit of sales.
Average total costs Costs per unit of output.
Barriers to entry Ways of preventing entry of a company to the industry.
Branding A process in which a company develops a name, term, sign, symbol, designor any other feature that allows consumers to identify the goods and services of abusiness and to differentiate them from those of competitors.
Break even price The price at which a firm is able to make normal profit (zeroeconomic profit) in the long run.
Cap and trading schemes Government-mandated, market-based approach tocontrolling pollution by providing economic incentives for achieving reductionsin the emissions of pollutants: a central authority (usually a governmental body)allocates or sells a limited number of permits to discharge specific quantities of aspecific pollutant per time period. Polluters are required to hold permits inamount equal to their emissions. Polluters that want to increase their emissionsmust buy permits from others willing to sell them.
Carbon tax A tax on fossil fuels intended to reduce the emission of carbon dioxide.
Cartel A group of firms making price arrangements.
Ceteris paribus Latin expression meaning ‘when all else remains equal’.
Collusion The collaboration of firms to charge the same price.
Common access resources Resources that everyone has access to so it is very hard toexclude people from using them.
Community surplus Total welfare created in the economy; the sum of consumer andproducer surplus.
Complementary good A good that is consumed along with another good.
Concentration ratio A measure of the percentage market share in an industry held bythe largest firms within that industry.
105

DEFINITIONS Microeconomics
Constant returns to scale The situation in which an average cost is constant whenproduction is increased.
Consumer surplus The extra satisfaction gained by consumers from paying a price thatis lower than the price they were prepared to pay.
Corporate social responsibility (CSR) The responsibility that a business has towardsall stakeholders in which it follows a set of ethical guidelines on how thecompany should conduct its business.
Cross price elasticity of demand A measure for the effect a change in price of oneproduct has on the demand for a certain other product.
Decreasing returns to scale The situation in which an average cost is increasing whenproduction is increased.
Demand curve A curve showing how the demand for a commodity or service varieswith changes in its price.
Demerit goods Goods of which the consumption has negative consequences on society.
Differentiated products Products that do not have perfect substitutes.
Diseconomies of scale A situation that occurs when the long term average costs ofproduction increase as the scale of operations increases beyond a certain level.
Economic cost The opportunity cost of all resources employed by the firm (includingentrepreneurship).
Economic profit or abnormal profit A situation in which total revenues exceed totalcost.
Economies of scale A situation that occurs when an output increases due to ability tosell to a larger market, reducing the costs per unit of output.
Elastic demand The percent change in demand is more thant the percent change inprice.
Elastic supply The percent change in supply is larger than the percent change in price.
Equilibrium price The market price where the quantity of goods supplied is equal tothe quantity of goods demanded.
Equilibrium quantity The quantity of goods that will be demanded at the point ofmarket equilibrium.
Excess demand A situation in which the quantity of a good or service demanded ishigher than the quantity supplied.
Excess supply A situation in which the quantity of a good or service supplied is higherthan the quantity demanded.
Excludable characteristic of a good People can be excluded from the use of the good.
Explicit cost The opportunity cost of the money spent on resources not currentlyowned by the company.
Externality A situation in which production or consumption of a good has an effect ona third party for which the latter does not pay or does not get compensated.
Factors of production All the inputs that are used in the production of final goods andservices. They include land, labor, capital and enterprise.
106

DEFINITIONS Microeconomics 5
First degree price discrimination Charging consumers the maximum price that theyare willing to pay.
Fixed costs Costs that always remain constant and do not change in the short run.
Formal collusion When firms secretly agree on a price and all firms participating in thecollusion know that they are participating and know the negotiated price.
Free rider problem A market failure that occurs when people take advantage of beingable to use (public) goods without paying for it.
Homogeneous products Products that are exactly the same.
Implicit cost The opportunity cost of the usage of resources currently owned by thecompany.
Incentive function of a price A higher price is an incentive for producers to producemore to increase profit.
Income elasticity of demand is used to measure the effect that a change in income ofconsumers has on the demand for a certain product.
Income elastic The percent change in demand for a good is larger than the percentchange in income.
Income inelastic The percent change in demand for a good is smaller than the percentchange in income.
Increasing returns to scale The situation in which an average cost is decreasing whenproduction is increased.
Indirect taxes Taxes imposed on certain goods to discourage the consumption of goodsthat can create externalities (demerit goods).
Indirect taxes Taxes levied on the sale of goods.
Indivisibilities A state in which some production factors cannot be divided into smallerpieces.
Inelastic demand The percent change in demand is less than the percent change in price.
Inelastic supply The percent change in supply is less than the percent change in price.
Inferior good Goods for which demand decreases when income increases.
Interdependence Mutual dependence between two parties.
Law of demand The economic law that states that when price goes up, ceteris paribus,quantity demanded goes down.
Law of diminishing returns A phenomenon in which the more of the variable factor isadded, there is a point beyond which total product only rises at a diminishing rate.
Law of supply The economic law that states that higher prices will, ceteris paribus,increase quantity supplied.
Legal barriers The government’s attempts to prevent entry into the market by law.
Long-run Time period in which all factors of production are variable but the state oftechnology is fixed. All planning takes place in the long run.
Loss A negative economic profit, when total cost exceeds total revenue.
107

DEFINITIONS Microeconomics
Luxury good A good for which demand increases more than proportionally as incomerises.
Manufactured commodities Products that have been made (manufactured) from a rawmaterial.
Marginal costs The amount of the increase in total cost when producing one more unitof output.
Marginal private benefits Benefits the individual enjoys from the consumption of anextra unit of a good.
Marginal private costs Costs of production that are taken into account in a firm’sdecision making process.
Marginal product An extra output that is produced by using one extra unit of thevariable factor.
Marginal revenue The extra revenue that a firm gains by selling one more product in agiven time period.
Marginal social benefit The benefit of consumption of one extra unit to society.
Marginal social cost The cost of production of one extra unit to society.
Market equilibrium A state where the supply in the market is equal to the demand inthe market.
Market failure Failure of the market to achieve allocative efficiency resulting in anoverallocation or underallocation of resources.
Market price The current price at which goods or services can be bought or sold.
Market segment A group of people who share one or more common characteristics.
Merit goods Goods of which the consumption has positive consequences on society.
Monopolistic competition A market structure in which there is a large number offirms that sell similar, but slightly differentiated products. Barriers to entry andexit are absent.
Monopoly A market structure characterized by a single seller who has a completecontrol of the entire supply of goods or of a service in a certain area or market.There are significant barriers to entry and exit and there are no close substitutesto the good the monopolist firm sells.
Monopoly power A market failure in which one party (the monopolist) controlls alarge share (typically 25% or more) of a particular market.
Nationalisation The process of transforming private assets into public assets bybringing them under the public ownership of a national government.
Natural monopoly A situation in which there are only enough economies of scale tosupport one firm.
Necessity goods Goods whose consumption is essential to human survival.
Negative externalities The costs that are suffered by a third party (that does not getcompensated) as a result of an economic transaction.
Negative externality of consumption A negative externality (see: ‘negativeexternality’) caused by the concumption of goods.
108

DEFINITIONS Microeconomics 5
Negative externality of production A negative externality (see: ‘negative externality’)caused by the production of goods.
Non-excludable characteristic of a good People cannot be excluded from the use ofthe good.
Non-price competition The rivalry between suppliers based on other aspects thanprice e.g. quality of service, packaging, advertising etc.
Non-price rationing The use of methods other than price that have the effect oflimiting consumption or demand.
Non-rivalrous characteristic of a good More people can use the good at the same time.
Normal good Any good for which demand increases when income increases.
Normal profit A situation in which total revenue equals total cost.
Perfect competition A market structure in which there are a lot of producers that haveno market power and produce and sell a homogeneous product, barriers to entryor exit ar absent, there is perfect information and perfect secource mobility.
Perfect information A feature of perfect competition in which everyone knowseverything.
Perfectly elastic demand The percent change in demand is infinite when price changes;when price increases demand will drop to zero, when price decreases demand willincrease to infinity.
Perfectly elastic supply The percentage change in supply is infinite when price changes;when price decreases supply will drop to zero, when price increases supply willincrease to infinity.
Perfectly inelastic demand Demand does not change when price changes.
Perfectly inelastic supply Supply does not change when price changes.
Perfect resource mobility Resources can move from location to location at zero cost.
Positive externalities The benefits that are enjoyed by a third-party (that does not payfor them) as a result of an economic transaction.
Positive externality of consumption A positive externality (see: ‘positive externality’)caused by the consumption of goods.
Positive externality of production A positive externality (see: ‘positive externality’)caused by the productiion of goods.
Price ceiling A price set by the government above which the price may not rise.
Price-competition The rivalry between suppliers based solely on price.
Price control A measure by the government that forces producers to sell goods for afixed price of for a price within a certain range.
Price discrimination The practice of charging different prices to different groups ofconsumers for the same product, where the price difference is not justified bydifferences in cost.
Price elasticity of demand A measure of the effect a change in price has on the demandfor a certain good.
109

DEFINITIONS Microeconomics
Price elasticity of supply A measure of the effect a change in price has on the supplyfor a certain good.
Price floor A price (set by the government) above the equilibrium price below whichthe price may not fall.
Price maker A firm that has the power to influence the price on the market.
Price rigidity The situation in which prices stay the same over long periods of time.
Price taker An individual or company that must accept prevailing prices in a market.
Primary commodities Materials in a raw or unprocessed state.
Producer surplus The excess of actual earnings that a producer makes from a givenquantity of output above the amount a producer would be willing to accept forthat output. The producer surplus is equal to producer profits.
Productive efficiency A state in which suppliers produce the product at the lowestpossible unit cost.
Public goods Goods that one individual can consume without reducing its availabilityto another individual, and from which no one can be excluded.
Queuing Form of non-price rationing in the situation of a shortage in which the goodsare distributed to the consumers who were willing to wait the longest time in aqueue.
Rivalrous characteristic of a good The good can’t be used by more people at the sametime.
Satisficing A goal of a firm in which the firm tries to perform satisfactorily rather thanto a maximum level.
Second degree price discrimination Charging a different price for different quantitiesconsumed.
Shortage A situation in which demand for a good or service exceeds the availablesupply.
Short-run Time period in which at least one factor of production is fixed and the firmcannot quickly change the quantity produced. All production takes place in theshort run.
Shut down price A point of operations where a company experiences no benefit forcontinuing operations and earns just enough revenue to cover its total variablecosts. When the price drops below the shut down price, the company will shutdown its operations.
Signalling function of a price A signal to producers that consumers want to buy thegood.
Specialisation (1) A method of production where a business focuses on the productionof a limited scope of products or services to gain higher productive efficiency or(2) Division of labour, the specialization of cooperatice labour in specific,circumscribed tasks and roles.
Specific tax A tax that is defined as a fixed amount for each unit of a good or servicesold.
110

DEFINITIONS Microeconomics 5
Subsidy A sum of money given to producers by the government to encourageproduction and consumption.
Substitute good A good that is consumed instead of another good.
Supply curve A curve showing the relationship between the price of a good or serviceand the quantity supplied for a given period of time.
Tacit collusion When firms charge the same price by looking at each other and there isno formal agreement involved.
Tax burden (1) The amount of tax paid by a person, company, or country in a specifiedperiod considered as a proportion of total income in that period. or (2) The totalwelfare loss of society due to taxation.
Tax incidence The division of a tax burden between buyers and sellers; the tax burdenon a specific group in the economy.
Third degree price discrimination Charging different prices depending on a particularmarket segment.
Total costs The complete costs of producing output.
Total product The total output that the firm produces using its fixed and variablefactors in a given time period.
Total revenue The total amount of money a firm receives from selling goods or servicesin a given time period.
Trade liberalization Removing barriers to trade between different countries andencourage free trade.
Underground parallel market or black market A market where transactions occurwithout the knowledge of the government, letting participants to avoidgovernment price controls or taxes.
Unit elastic demand The percent change in demand is equal to the percent change inprice.
Unit elastic supply The percent change in supply is equal to the percent change in price.
Variable costs Costs that increase when production is increased.
111

DEFINITIONS Macroeconomics
5.2 Macroeconomics
Absolute poverty See ‘poverty’. The inability to fulfill the basic economic needs.
Aggregate demand curve The curve representing the relationship between aggregatedemand and the price level.
Aggregate demand The total demand for goods and services in an economy at a giventime.
Aggregate supply The total amount of goods and services that all industries in theeconomy will produce at every given price level.
Balanced budget A (government) budget in which revenues are equal to expenditures.
Boom The phase of a business cycle characterised by high economic activity and lowunemployment.
Business confidence The degree of optimism or pessimism that business managers feelabout the prospects of their companies.
Business cycle The fluctuation of economic activity around the long term growth path;consists of different phases of real GDP growth and decline.
Capital (1) The cash or goods used to generate income either by investing in a businessor a different income property, or (2) All man-made tools used in the productionprocess e.g. machines.
Capital expenditures One-time payments of governments (e.g. building a new school).
Central bank A bank which controls a country’s money supply and monetary policy.
Circular flow of income model The economic model that illustrates the exchangebetween households and firms.
Closed economy A self-sufficient economy, meaning no imports are brought in and noexports are sent out, the goal being to provide consumers with everything theyneed from within the economy’s borders.
Consumer confidence The degree of optimism of consumers on the current andexpected state of the economy, which determines their spending and savingdecisions.
Consumer expenditure The expenses incurred in consumption.
Consumer Price Index (CPI) An index that measures the purchasing power ofconsumers in a country, by comparing the prices of a basket of goods in differentyears.
Contractionary fiscal policy A form of fiscal policy that involves increasing taxes anddecreasing government expenditures.
Contractionary monetary policy A monetary policy which slows the rate of growthin the money supply in order to control inflation.
Cost-push inflation Inflation which occurs when an increase in the cost of productionpushes the average price level up.
Current expenditures The recurring expenditures of governments, such as wages ofcivil servants, interest on government debt.
112

DEFINITIONS Macroeconomics 5
Cyclical unemployment Unemployment that results when the overall demand forgoods and services in an economy cannot support full employment.
Deflationary gap Shows the difference between the full employment level of outputand actual output.
Deflation The persistent fall in the level of prices.
Demand deficient unemployment See ‘cyclical unemployment’.
Demand-pull inflation Infation which occurs when an increase in AD pulls up averageprice level.
Direct taxes Taxes that are imposed directly on income, wealth and profit.
Disinflation A persistent fall in the rate of inflation.
Disposable income Personal income actually available for spending.
Easy monetary policy A monetary policy that increases the money supply, usually bylowering interest rates.
Economic activity The production and consumption of goods and services.
Economic growth An increase in GDP.
Enterprise Entrepeneurship; the skillset of the entrepeneur to combine capital, landand labour in order to make a profit.
Equality The equal distribution of income.
Equilibrium The state in which demand is equal to supply.
Equity The fair distribution of income.
Expansionary fiscal policy A form of fiscal policy that involves reducing taxes andincreasing government expenditures.
Expansionary monetary policy A policy used to expand money supply and boosteconomic activity.
Exports The goods and services that are made in the domestic country and transmitted(sold) to foreigners (foreign countries).
Factors of production All the inputs that are used in the production of final goods andservices. They include land, labor, capital and enterprise.
Fiscal policy The government intervention by either adjusting taxes or adjustinggovernment spending.
Frictional unemployment Unemployment due to people changing jobs when somesectors of the economy grow and other contract.
Full capacity The maximum level of output that a company can sustain to make aproduct or provide a service.
Full employment A state in which producers are producing at full capacity andmaximum employment is reached.
GDP or Gross Domestic Product The total income earned by the factors ofproduction in a country, regardless the assets owner.
113

DEFINITIONS Macroeconomics
Gini index A measure of inequality of a distribution. A value of 0 (0%) for the Giniindex denotes complete equality, and a value of 1 (100%) denotes maximalinequality.
GNI or Gross national income The total income earned by a country’s factors ofproduction, regardless the assets location.
GNP or Gross national product The total market value of all final goods produced ina country.
Government debt Debt owed by the government.
Government deficit A government’s income is less than the money it spends.
Government spending The overall public spending carried out by the government.
Government surplus A government’s income is greater than the money it spends.
Green GDP GDP minus the environmental costs, such as pollution; it measuressustainability.
Hidden unemployment Unemployment of potential workers that is not captured inofficial unemployment statistics.
Human capital The stock of knowledge, skills and abilities that determine the labourproductivity of an individual or individuals.
Imports The goods and services that are made in a foreign country and transmittes(sold) to the domestic country.
Income Money received as a compensation for providing factors of production to firms.Income includes wage, rent, interest and profit.
Indirect taxes Taxes that are imposed over consumer spending.
Inflationary gap (1) The situation where the economy is (in equilibrium) at a level ofoutput that is greater than the full employment level of output or above potentialoutput; or (2) A situation in which an increase in aggregate demand (when theeconomy is at full employment) results in an increase in the average price levelwith no increase in real GDP.
Inflation A sustained increase in the level of prices.
Inflation rate A measure of how fast prices for goods and services rise over time.
Injections Additions to the value of economic activity due to investment, governmentspending or exports.
Interest A fee paid for the use of another party’s capital or money.
Interest rate The price or cost of borrowed money; the reward for saving; thepercentage paid on borrowed money.
Interventionist supply side policies Supply side policies focused on governmentintervention.
Keynesian economics The analysis of economic activity based on the fundamentalpremises that economic activity is largely based on aggregate demand and thatrecessions can be restrained by fiscal stimulus in order to increase aggregatedemand.
Labour force Everyone that can, wants to, and is allowed to work.
114

DEFINITIONS Macroeconomics 5
Labour Human resources; human beings as factors of production.
Land A natural resource employed as a factor of production.
Leakages Outflows from the circular flow of income model, due to saving, taxation andimports.
Long-run aggregate supply curve The curve representing the relationship betweenlong-run aggregate supply and the price level.
Lorenz curve A curve used to measure the degree of equity.
Marginal propensity to consume (MPC) The percentage of additional governmentexpenditure that consumers use to consume.
Marginal propensity to import (MPM) The percentage of additional governmentspending that consumers use to import goods.
Marginal propensity to save (MPS) The percentage of additional governmentexpenditure that consumers save.
Marginal rate of taxation (MPT) The percentage of additional governmentexpenditure that consumers have to pay back in taxes.
Market based supply side policies Supply side policies focused on encouraging freemarkets and reduce competition.
Monetary policy The macroeconomic policy laid down by the central bank whichinvolves management of money supply and interest rate to influence theeconomy.
Money demand The amount of money people wish to hold.
Money supply The amount of money that exists in an economy.
Natural capital The world’s stocks of natural resources.
Natural rate of employment The rate of unemployment when the labour market is inequilibrium.
Neoclassical economics The analysis of economic activity based on the fundamentalpremises that all participants on the market have rational preferences, allconsumers maximize utility, firms maximize profit and all choices are madetaking into account relevant constraints.
Nominal value At current prices.
Open economy An economy where goods and services are traded with other countries.
Output The amount of something produced.
Per capita Per head of the population.
Phillips curve A curve showing the connection between inflation and unemploymentin the short and long run.
Physical capital The capital in form of physical goods.
Potential output The output that could be produced by an economy if all its resourceswere fully employed.
Poverty The inability to fulfill the basic economic needs.
115

DEFINITIONS Macroeconomics
Producer Price Index (PPI) An index that measures the price of an average bundle ofinputs for producers in different years.
Production capacity The volume of products or services that can be produced by anenterprise using given resources.
Production-possibility frontier A curve which shows the maximum possible outputcombinations of two goods or services an economy can achieve when allresources are fully employed.
Profit Income received from enterprise; the financial gain occured when the amount ofrevenue gained from a business activity exceeds the expenses, costs and taxes.
Progressive tax scheme A tax scheme in which the higher the income, the higher theaverage tax rate.
Proportional tax scheme A tax scheme in which the same tax rate for all incomes ischarged.
Protectionism The restriction of international trade with the goal of preventing lossesin industries threatened by imports.
Purchasing power The amount of real goods and services each unit of money will buy.
Real value The nominal value adjusted for inflation.
Recession An overall decline in economic activity during which trade and industrialactivity are reduced; is often defined as real GDP falling for two successivequarters.
Recovery The phase of a business cycle when output and employment are moving backfrom their lowest point towards normal levels.
Regressive tax scheme A tax scheme in which the higher the income, the lower theaverage tax rate.
Relative poverty A Measure of poverty in relationship to other members of apopulation.
Rent A payment made for the use of land as a factor of production.
Saving Income not spent; deferred consumption.
Seasonal unemployment Unemployment due to seasonal variations in the demand forlabour.
Short-run aggregate supply curve The curve representing the relationship betweenshort-run aggregate supply and the price level.
Stagflation A state in which a country persistently suffers from both high inflation andhigh unemployment.
Structural unemployment Unemployment due to a lack of capital equipment whichunemployed workers could use; lack among unemployed workers of the skillsnecessary to produce.
Subsidy A sum of money given to producers by the government to encourageproduction and consumption.
Supply-side policy A policy intended to increase the aggregate supply available in aneconomy.
116

DEFINITIONS Macroeconomics 5
Sustainability Development that meets the needs of the present generation withoutcompromising the ability of future generations to meet their needs.
Taxes Fees levied by states upon their citizens and firms to finance governmentexpenditure.
The Keynesian multiplier The factor by which gains in total output are greater thanthe change in spending that caused it.
Tight monetary policy See ‘contractionary monetary policy’.
Transfer payments Payments made by the government as a way to redistribute moneythrough programs such as pensions, student grants etc.
Trough The phase of the business cycle in which the low point of GDP is reached.GDP is stable at this point.
Unemployment A phenomenon that describes all people of working age that are notworking and are actively looking for a job.
Unemployment benefits The income support payments to the unemployed.
Unemployment rate The total number of people unemployed as a percentage of thecorresponding total labour force.
Wage A payment for work performed by the workforce.
Wealth The total value of a person’s net assets.
Withdrawals Reductions to the value of econmomic activity due to savings, taxes orimports.
117

DEFINITIONS International Economics
5.3 International Economics
Absolute advantage The ability of a party (an individual, or firm, or country) toproduce a greater quantity of a good, product, or service than competitors, usingthe same amount of resources.
Administrative barriers Bureaucratic procedures and practices that make it moredifficult to trade.
Appreciation An increase in the value of a currency caused by market forces.
Balance of payments A record of all money entering the country and leaving thecountry.
Bilateral preferential trade agreements Preferential trade agreements formed betweentwo countries.
Capital account A financial statement which shows miscellaneous income or expensesthat cannot be placed in any other category. Part of the balance of payments.
Common market A customs union with common policies on product regulation andfree movement of goods, services, capital and labour between member states.
Comparative advantage The ability of a party (an individual, or firm, or country) toproduce a good, product of service at a lower opportunity cost than competitors.
Complete economic integration The form of economic integration where countrieshave no control of economic policy. It is the full monetary union with thecomplete harmonisation of fiscal policy.
Current account A financial statement which shows inflows of trade and incomeagainst outflows. Part of the balance of payments.
Customs union A degree of economic integration in which countries are able to tradefreely among themselves and also agree to adopt common external barriersagainst any country outside the union.
Depreciation A decrease in the value of a currency caused by market forces.
Devaluation A decrease in value of a currency caused by government intervention.
Economic integration The unification of economic policies between different statesthrough the partial or full abolition of tariff and non-tariff restrictions on tradetaking place among them prior to their integration.
Economies of scale The cost advantages that enterprises obtain due to size, output, orscale of operation, with cost per unit of output generally decreasing withincreasing scale as fixed costs are spread out over more units of output.
Exchange rate The value of one currency expressed in terms of another currency.
Expenditure reducing method A government strategy to tackle a persistent currentaccount deficit by making sure people spend less in general which will reduceimports. This can be achieved by using contractionary fiscal or monetary policy.
Expenditure switching method A government strategy to tackle a persistent currentaccount deficit by making sure people buy more domestic products instead offoreign goods and therefore reducing import. This can be achieved by usingprotectionist measures.
118

DEFINITIONS International Economics 5
Factors of production All the inputs that are used in the production of final goods andservices. They include land, labor, capital and enterprise.
Financial account A financial statement which shows the inflows from investmentsfrom abroad against investment to abroad. Part of the balance of payments.
Fixed exchange rate regime An exchange rate regime in which the value of thecurrency is pegged to the value of another currency.
Freely floating exchange rate regime An exchange rate regime in which the value ofan exchange rate is determined by the demand for and supply of that currency.
Free trade area A degree of economic integration in which countries are able to tradefreely among themselves, but are able to trade with countries outside the freetrade area in anyway they like.
Infant industry A new industry in its early stages of development, often in need ofprotection against international competitors.
J-curve effect is a “J” shaped section on a graph in which the curve falls into negativeterritory and then gradually rises to a higher level than before the decline. Thisshape can be seen when reviewing the development of the current accountbalance. Usually a current account balance that is negative will first slowlyworsen due to the time it takes for prices to adjust to the new situation. Aftertime, prices will have changed, making the current account balance positive again.
Managed exchange rate regime An exchange rate regime in which the exchange rate isfreely floating but there is periodic government intervention to influence thevalue of the exchange rate.
Marshall-Lerner condition An economical condition which states that a currencydevaluation will only lead to an improvement in the balance of payments if thesum of demand elasticity for imports and exports is greater than one.
Monetary union A common market with common currency and common centralbank.
Multilateral preferential trade agreements Preferential trade agreements formedbetween three or more countries.
Perfect knowledge The state in which a consumer, producer or government has allpossible information he needs in order to make a decision.
Preferential trade agreements Agreements between two or more countries that givepreferential access to the markets of the participating countries by reducing oreliminating tariffs or by other agreements related to trade.
Production-possibility frontier A curve which shows the maximum possible outputcombinations of two goods or services an economy can achieve when allresources are fully employed.
Quota A governmental restriction on the quantities of goods that may be importedinto the country within a specific period of time.
Revaluation A rise in value of a currency caused by government intervention.
Subsidy A sum of money given to producers by the government to encourageproduction and consumption.
119

DEFINITIONS International Economics
Supply side policy A government strategy to tackle a persistent current account deficitthrough boosting supply and therefore exports. This can be achieved usingexpansionary supply side policies.
Tariff A tax charged on imported goods.
Terms of trade An index that shows the value of a country’s average export pricesrelatively to their average import prices.
Trade creation Welfare gain of a country due to an increase in the volume of exports ofthe country due to becoming a member of a customs union in which tradebarriers are abolished. The abolition of trade barriers can make a country regainthe comparative advantage is lost due to the trade barriers.
Trade diversion Decrease in the welfare of a country due to an increase in the prices ofimported goods. Before entry into the customs union, the country importedfrom country x without barriers. With entry into the union, tariffs are imposedon country x (non-member) and the product is therefore imported from membercountries at higher price instead of from country x.
Trade protectionism The measures used by countries to limit competition fromforeign industries.
World Trade Organisation (WTO) An international organisation that sets the rulesfor global trading and resolves disputes between its member countries.
120

DEFINITIONS Development Economics 5
5.4 Development Economics
Adult literacy rate An education indicator used to measure the proportion of the adultpopulation (15+) that knows how to read.
Bilateral and regional preferential trade Trade agreements between countries in acertain region.
Composite indicators Indicators which contain more than one measure and so areconsidered to be better indicators of economic development.
Concessional long-term loans Loans that are extended on terms substantially moregenerous than market loans. The concessionality is achieved either throughinterest rates below those available on the market or by grace periods, or acombination of these.
Debt cancellation The process of a creditor canceling a debt previously owed by adebtor.
Development aid Aid given to support the economic, social and political developmentof developing countries.
Diversification Moving from the production and export of primary commodities tothe production and export of manufactured goods.
Economic development An increase in welfare, which includes wealth but also qualityof life.
Economic growth An increase in GDP.
Economic indicators Indicators that distinquish between countries using economicdata; used to distinguish between developed countries and developing countriesand to predict future economic activity.
Education indicators Indicators used to distinquish between countries on the basis ofeducation.
Export promotion Focussing on exporting goods and using the revenues from thisexport to boost aggregate demand.
Foreign aid Recources given from one country to another out of charity.
Foreign debt Outstanding loans that a country owes to other countries or othercountries’ institutions.
Foreign Direct Investment The long term investments by multinational corporations(MNCs) in foreign countries by either building new plants or expanding existingones.
GDP per Capita at Purchasing Power Parity GDP per capita corrected fordifferences in prices and exchange rates between countries; compares purchasingpower (how much can you buy from your money) between countries.
GDP per Capita Total income earned by the factors of production in a countryregardless the assets owner per head of the population.
GNI per Capita Total income earned by a country’s factors of production, regardlessthe assets location per head of the population.
121

DEFINITIONS Development Economics
Good governance A term used to describe how public institutions conduct publicaffairs and manage public resources. This should be done in a responsible, hence‘good’, way.
Health indicators Indicators used to distinquish between countries on the basis ofhealth or healthcare.
Human capital The stock of knowledge, skills and abilities that determine the labourproductivity of an individual.
Human Development Index (HDI) A composite indicator that measure country’soverall achievement in its social and economic dimensions, such as long andhealthy life, education and standard of living.
Humanitarian aid Aid provided for humanitarian purposes; it involves food aid,medical aid and emergency relief aid.
Import substitution refers to producing goods yourself instead importing them.
Infant mortality rate A health indicator used to measure the number of deaths ofbabies under the age of one year per 1000 births in a given year.
International Monetary Fund (IMF) An international organization created for thepurpose of standardizing global financial relations and exchange rates.
Interventionist policies Policies that promote an active role by the government andmanipulation of the workings of the market.
Life expectancy at birth A health indicator used to measure the average number ofyears a person may expect to live from the time that he is born.
Market oriented policies Policies that minimize the role of government and maximizefree market operation.
Multilateral development assistance Assistance provided by internationalorganizations, mostly the International Monetary Fund and the World Bank.
Net enrolment in primary education An education indicator used to measure theratio of children of primary school age enrolled in primary education to the totalnumber of children who are of primary school age in the country.
Non-governmental organisations Non-profit organizations that are independent fromstates and international governmental organizations.
Official Development Assistance (ODA) The foreign aid extended by the government.
Over specialization A narrow range of products can cause too much dependence onthe export of a small set of goods. If the market of these goods collapses, thecountry may face economic catastrophe.
Physical capital The capital in form of physical goods.
Poverty trap A situation in which poor communities are unable to invest in physical,human and natural capital due to low or no savings, thus poverty is beingtransmitted from generation to generation.
Price volatility The (relative) rate at which the prices move up and down. If prices arevolatile, they change rapidly over time.
Primary products Goods that are made of cultivating raw materials without amanufacturing process.
122

DEFINITIONS Development Economics 5
Profit repatriation Bringing profit earned in a foreign country into the borders ofone’s own country.
Programme aid Aid provided to accomplish tasks in a particular area or sector(e.g. support for sectors such as education and financial sector).
Project aid Aid provided to accomplish a specific purpose (e.g. support for schools andhospitals).
Resource endowment The amount of resources that a country possesses and canexploit.
Terms of trade An index that shows the value of a country’s average export pricesrelatively to their average import prices.
The Millennium goals Global goals for the development of developing nations,established by the United Nations.
Tied aid A type of aid that the receiving country must spend according to guidelines ofthe donor country.
Trade liberalization Removing barriers to trade between different countries andencouraging free trade.
World Bank An international organization dedicated to providing financing, adviceand research to developing nations to aid their economic advancement.
World Trade Organization An international organization which regulatesinternational trade.
123

DEFINITIONS Development Economics
124

6ABBREVIATIONS
CS Consumer surplus.The extra satisfaction gained by consumers from paying a price that is lower thanthe price they were prepared to pay total welfare gained from being able toconsume.
PS Producer surplus.The excess of actual earnings that a producer makes from a given quantity ofoutput above the amount a producer would be willing to accept for that output— total welfare gained from being able to produce; equal to producer profits.
PED Price elasticity of demand.It is used to measure the effect a change in price has on the demand for a certaingood.
PES Price elasticity of supply.It is used to measure the effect a change in price has on the supply for a certaingood.
XED Cross price elasticity of demand.It is used to measure the effect a change in price of one product has on thedemand for a certain other good.
YED Income elasticity of demand.It is used to measure the effect that a change in income of consumers has on thedemand for a certain product.
MPC Marginal Private Cost.Costs of production that are taken into account in a firm’s decision makingprocess.
MPB Marginal Private Benefits.Benefits the individual enjoys from the consumption of an extra unit of a good.
MSC Marginal Social Cost.Cost of production to society.
MSB Marginal Social Benefit.Benefit of consumption of one extra unit to society.
SR Short-run.At least one factor of production is fixed and the firm cannot quickly change thequantity produced. All production takes place in the short run.
LR Long-run.All factors of production are variable in the long run but the state of technologyis fixed. All planning takes place in the long run.
TP Total product.Total output that the firm produces using its fixed and variable factors in a giventime period.
125

ABBREVIATIONS
AP Average product.Output that is produced on average, by each unit of the variable productionfactor.
MP Marginal product.Extra output that is produced by using one extra unit of the variable factor.
V Variable production factor.
TC Total costs.The complete costs of producing output.
ATC Average total costs.Costs per unit of output.
MC Marginal costs.The increase in total cost when producing one more unit of output.
FC Fixed costs.Costs of fixed assets such as rent for company space. These costs will always be aconstant amount and they won’t change in the short run.
VC Variable costs.Costs of variable assets. Variable costs increase when production is increased.
TVC Total variable costs.
TFC Total fixed costs.
AVC Average variable costs.
AFC Average fixed costs.
LRAC Long run average cost curve.It is a combination of all short run average cost curves (SRAC) that are present atfixed levels of production at fixed levels of factors of production.
SRAC Short run average cost curve.
TR Total revenue.Total amount of money a firm receives from selling goods or services in a giventime period.
AR Average revenue.The revenue a firm receives per unit of sales.
MR Marginal revenue.The extra revenue that a firm gains by selling one more product in a given timeperiod.
CSR Corporate Social Responsibility.The business includes public interest in its decision making. This may be that thecompany wants to produce as environmentally friendly as possible, provide goodservice for consumers, employ workers under favourable conditions etc.Different firms may adopt different approaches to CSR.
126

ABBREVIATIONS 6
CR Concentration Ratio.
J Injections.Additions to the value of economic activity due to investment, governmentspending or exports.
I Investment.
G Government spending.The overall public spending carried out by the government.
X Exports.The goods and services that are made in the domestic country and transmitted(sold) to foreigners (foreign countries).
M Imports.The goods and services that are made in a foreign country and transmittes (sold)to the domestic country.
T Taxes.Fees levied by states upon their citizens and firms to finance governmentexpenditure.
S Savings.Income not spent; deferred consumption.
W Withdrawals.Reductions to the value of econmomic activity due to savings, taxes or imports.
C Consumer expenditures.The expenses incurred in consumption.
GDP Gross Domestic Product.Total income earned by the factors of production in a country, regardless theassets owner.
GNP/GNI Gross National Product / Gross National Income.The total income earned by a country’s factors of production, regardless theassets location.
AD Aggregate demand.Total demand for goods and services in an economy at a given time.
AS Aggregate supply.The total amount of goods and services that all industries in the economy willproduces at every given price level.
SRAS Short run aggregate supply.
LRAS Long run aggregate supply.
MPC Marginal propensity to consume.The percentage of additional government expenditure that consumers use toconsume.
MPS Marginal propensity to save.The percentage of additional government expenditure that consumers save.
127

ABBREVIATIONS
MPT Marginal rate of taxation.The percentage of additional government expenditure that consumers have topay back in taxes.
MPM Marginal propensity to import.The percentage of additional government spending that consumers use to importgoods.
CPI Consumer Price Index.Economists compile a basket of goods that is representative for the economy,they then compare the cost of this basket over time. The increase in price of thebasket is the inflation rate.
PPI Producer Price Index.Economists compile a basket of factors of production representative for theeconomy, they then compare the cost of this basket over time. The increase inthe price of the basket is the inflation rate.
PPF Production Possibilities Frontier.A curve that shows the theoretical maximal combination of two goods that aneconomy can produce if full use is made of all factors of production.
MS Money supply curve.
WTO The World Trade Organisation.Is an international organisation that sets the rules for global trading and resolvesdisputes between its member countries.
TOT Terms of Trade.An index that shows the value of a country’s average export prices relatively totheir average import prices.
AEP Index Average Export Price.
AIP Index Average Import Price.
UN The United Nations.
HDI Human Development Index.A composite indicator that measure country’s overall achievement in its socialand economic dimensions, such as long and healthy life, education and standardof living.
FDI Foreign Direct Investment.Long term investments by multinational corporations (MNCs) in foreigncountries by either building new plants or expanding existing ones.
MNCs Multinational corporations.
ODA Official Development Assistance.The foreign aid extended by the government.
NGO’s Non-governmental organisations.Non-profit organizations that are independent from states and internationalgovernmental organizations.
128

ABBREVIATIONS 6
IMF International Monetary Fund.An international organization created for the purpose of standardizing globalfinancial relations and exchange rates.
129

ABBREVIATIONS
130

7ESSAY GUIDEExam: Time: Marks: % of total: SectionsPaper 1 90 minutes 50 marks 30% A and B
This Economics paper 1 essay guide will walk you through how to give thewell-structured answer that the examiners are looking for! After briefly analysing thestructure of paper 1 and discussing time management, command terms are defined tohelp you understand the questions. Finally, successfully answer each question usingDEED and CLASPP strategies, which provide a concrete plan to answer the essayquestions on paper 1.
7.1 Time Management
Managing your time well guarantees that you can address each question at the exam, to atleast score the easier marks from each question. So when time allotted to the questionruns out, finish the sentence and leave some space to finish the question later. Then, ifyou have time left at the end of the exam you can go back to complete your answers.
Keeping to a strict schedule ensures that you will not waste time by getting stuck on(part of) a question, and securing enough time to answer each question. This will helpyou stay relaxed throughout the exam, especially if you also remember that you do nothave to write perfect answers to get a good grade: rather get in as many marks for eachquestion within the time you have. Plus, the answers to the question you are stuck onwill often come to you while working on a different question.
The next section lists how much time you should spend on each part of the exam. Do allyour practice from now on by sticking to these times, because doing so will familiarizeyou with how much and at what pace you need to be able to write for the paper 1 exam.
Section A (25 marks, 45 min) This section will focus on microeconomics.Within this section you will find question 1 and 2, choose one.
• Plan for 5 min• Part a) 10 marks, max. 15 min• Part b) 15 marks, max. 25 min
Section B (25 marks, 45 min) This section will focus on macroeconomics.Within this section you will find question 3 and 4, choose one.
• Plan for 5 min• Part a) 10 marks, max. 15 min• Part b) 15 marks, max. 25 min
Complete both parts a) and b) for two questions, one in section A and one in section B.Part a) in paper 1 is really to get you started, part b) is worth more marks and requiresmore detail!
131

ESSAY GUIDE Understanding the question
7.2 Understanding the question
The most important piece of advice is to read the question properly.
Really.
Before thinking about an answer, make sure you fully understand the topic and thequestion that is asked. By reading the question carefully and multiple times, you will notlose easy marks by missing to include information, while saving time by not includingtoo much information in your answer.
The command terms in the question tell you exactly what to include and exclude in youranswer. Knowing what the IB wants from you helps you to score points and save time,effectively killing two birds with one stone. Learn them well!
7.2.1 Common command words for part a)
The following command words question your knowledge and understanding.
Define: Give the precise meaning/definition.Describe: Present the characteristics of a particular topic.List: Give a sequence of brief answers with no explanation.Outline: Give a brief account and/or summary of the issues, principles, or
arguments in the question.State: Give a specific name, value or brief answer without explanation or
calculation.
Understanding is usually paired with ‘application and analysis’ terms. This means youneed to explain, apply and analyse a given situation with an example.
Analyse: Examine methodically and in detail the structure of theory.Apply: Use an example in relation to a given problem or issue provided.Comment: Give an explanation or judgment based on a given statement.
Judgement is very important and frequently forgotten.Distinguish: Make clear the differences between two or more concepts.Explain: Give a detailed account including reasons or causes; demonstrate that
you understand the theory and can use it.Suggest: Propose a solution, hypothesis, or other possible answer to an issue.
132

ESSAY GUIDE Essay writing style 7
7.2.2 Common command words for part b)
For Part B questions are worth more marks. Synthesis and Evaluation: Require studentsto rearrange component ideas into a new whole and make judgments based on evidence.
Compare: Give an account of similarities between two or more items orsituations, referring to both (all) throughout
Contrast: Give an account of differences between two or more items orsituations, referring to both (all) throughout
Discuss: Offer a considered and balanced review of a particular topic. Opinionsor conclusions should be stated clearly and supported by appropriateevidence.
Evaluate: Make an appraisal by weighing up the strength and limitations ofdifferent evidence and arguments.
Examine: Consider an argument or concept in a way that uncovers theassumptions and interrelationships of the issue.
Justify: Give valid reasons or evidence to support or defend a choice, decisionor action.
To what extent: Consider the merits or otherwise of an argument or concept.Opinions and conclusions should be presented clearly and supportedwith appropriate evidence and sound arguments.
7.3 Essay writing style
7.3.1 DEED
Define First, define any key terms that arise in the question itself and in your answer.Any key terms that are introduced by the question or that you introduce should bedefined! Remembering to do this is a really easy way to gain points. Also once youhave defined terms, and there is an abbreviated version, place this behind-e.g. Aggregate Demand (AD). This way now in your text you can save time by justwriting “AD”.
Explain Then after all is defined, explain your answer to the question. Make sure toproperly elaborate on the economic theory that you are using to answer thequestion.
Example Use a relevant example to underline your explanation. Sounds menial, but infact examiners actually mark whether you have provided an example todemonstrate your understanding. Make sure you justify why you have chosen theexample you have.
Diagram Provide a diagram. The diagram is there to help you explain the concept: souse it!You should draw a diagram next to where the theory is explained as you write it,or you can leave space for it and come back to it at the end.
133

ESSAY GUIDE Essay writing style
Some important things to remember about diagrams
• Always label everything (axes, curves, points etc. . . )
• Refer to diagram points in the text to make it extra clear to the examiner what youmean. For example: the demand curve shifts to the left (curve D1 to D2). Thisshift to the left decreases prices (P1 to P2) and reduces output (Q1 to Q2).
• Once you have finished drawing your diagram, just double check it is the correctgraph and is correctly labelled (easy marks are usually lost because of mistakes likeincorrect labelling happens to the best of us in a stressful exam!).
7.3.2 DEED & CLASPP
In question (b) of paper 1 you need to show the IB that you are capable of a more indepth analysis. Besides first using DEED to answer the question, CLASPP provides youwith the structure for a deeper analysis of the problem/question, that the examiners arelooking for. So after applying the steps from DEED, you then:
Conclude Make a weighted concluding statement e.g. So the best policy is acombination of Monetary policy and fiscal policy, rather than both in isolationetc. . . ) Justify/reason why this is the stance you have taken.
Limitations to the theory Provide insight into the drawbacks of your conclusion or analternate solution (i.e. this solution works, but it doesn’t work all the time, thisother solution would also be a good option, and which we choose depends onmore information). This will show the examiner that you have a thoroughunderstanding of the topic.
Assumptions of the theory Some economic theories rely on certain assumptions.Mention these assumptions and reflect on their significance for the conclusionsthat you make from them (e.g. we assume rational human behaviour, howeverhumans may not always act economically rational)
Stakeholders Mention the stakeholders involved in the problem and describe the effecton each of them.
Priorities Explain what is most important: which effect is most important, whichstakeholder is most important, etc.
Pros and Cons Evaluate the advantages and disadvantages of the theory.
134

ESSAY GUIDE Worked example 7
7.4 Worked example
a) Using two AD/AS diagrams, explain cost-push and demand-pull inflation.
D: Inflation
D: cost-push
E: production costs increaseprice increases, ripple effect
E: oil
diagram
D: demand-pull
E: AD higher then AS,price increases
E: exchange rates
diagram
Define: Inflation can be defined as a persistent increase in the average level of prices inan economy.
Define: There are two main types of inflation, namely cost-push inflation anddemand-pull inflation. Cost-push inflation is a situation in an economy wherethere is a persistent rise in prices due to production costs increasing.
Explain: When production costs of one firm increases, they may consequently have toincrease prices. If they increase prices, this means that a firm who depends on thisnow has higher costs. The increase in production costs thus ripples through theeconomy and results in persistent increases in prices across many industries.
Example: For example, if a raw material such as oil becomes more expensive, this meansthat many manufacturing firms (e.g. car manufacturers) will have to pay more forelectricity to produce, meaning that they may have to increase their prices to beable to cover their costs. If these car manufacturers indeed increase their prices,companies who buy cars will have to increase their prices accordingly. This willconsequently affect many industries and ripple through leading to cost-pushinflation.
135

ESSAY GUIDE Worked example
Diagram: In the case of cost-push inflation, the rise in the production costs will lead to aleftwards shift of the Aggregate Supply Curve (AS2 to AS1), effectively raising theprice level (from P2 to P1). This will also reduce output (Q2 to Q1). This can beseen in the diagram below.
Aggregate Output
Pric
e
AD1
AS2
AS1
P1
Q1
P2
Q2
All axes and curves are labelled and allpoints identified. Now you can justrefer to the points i.e. price decreases(P2 to P1). This will be very helpful inyour explanations and examiners lovethis!
Define: Demand-pull inflation is inflation caused by consistently higher levels ofaggregate demand over aggregate supply in the economy.
Define: Aggregate demand (AD) referring to the total demand for final goods andservices in an economy at a given time.
Explain: Here this means that as AD increases, because supply remains fixed, the pricehas to increase to keep up.
Example: An example of this would be that if the exchange rate depreciates. This meansthat, for the country in question, imports are now expensive, but exports arecheap. Other countries now start demanding the country in questions’ exports,thus increasing the aggregate demand in such a way that there is inflation in thegeneral level of prices.
Diagram: In the case of demand-pull inflation, the increase in AD will lead to arightwards shift of the AD curve (AD2 to AD1), effectively raising the price level(P2 to P1). This rise in general price level is in some ways counteracted by theincrease in output (Q2 to Q1). This is illustrated in the diagram below:
Aggregate Output
Pric
e
AD1 AD2
AS
P1
Q1
P2
Q2
136

ESSAY GUIDE Worked example 7
b) “The rate of inflation can be most effectively reduced through the use of monetary policy.”To what extent do you agree with this statement?
Note: Typically, it would be necessary to define ‘the rate of inflation’, but as it was alreadydefined in part (a) it is sufficient to simply refer to it.)
Define: Monetary policy can be defined as policies that the central bank makes tomanipulate the rate of interest, exchange rates and the quantity of money.Monetary policy is an example of a demand-side policy, which is policy thatattempts to alter the level of aggregate demand (AD) in an economy.
Define: Monetary policy is a very important tool to manage the economy. There aretwo general strategies- contractionary and expansionary monetary policy.Expansionary monetary policy mains to increase the total supply of money in theeconomy (or more rapidly than usual). On the other hand, contractionary policyexpands the money supply more slowly than usual or even shrinks it.
Explain: In this case to tackle high inflation, the central bank could implementcontractionary monetary policies. If the central bank implements contractionarypolicy, this will target increasing interest rates. If the interest rates increase, there isless demand for investment and more incentive for people to increase their savings.Contractionary monetary policy thus reduces AD, shifting the AD curve to theleft (AD1 to AD2). We experience the desired result of a lower general level ofprices (P1 to P2). A fall in the general price level is a fall in the rate of inflation, asdefined above in part (a).
Real GDP
Pric
ele
vel
AS
AD1
ADPL1
Q1
PL
Q
Example: A practical example of contractionary monetary policy would be for thecentral bank be for the central bank to directly increase its interest rates so that thecommercial banks have to follow suit (providing consumers with higher interest).They could also reduce the money supply, meaning that there is less to give out tocommercial banks and thus consumers if there is less money, the price of moneyincreases, so the interest rate increases.
Define: However, monetary policy is not the only tool that can be used to manage aneconomy. Fiscal policies a type of demand-side policy (also targets altering AD inthe economy as discussed earlier) that entails the government altering governmentexpenditure and/or taxes to influence the AD curve. The government can useexpansionary fiscal policy (to “expand” or increase AD) or contractionary (to“contract” or reduce AD).
137

ESSAY GUIDE Worked example
Example: If the government wishes to control inflation, it will have to enactcontractionary fiscal policies. This means raising taxes and/or cutting governmentexpenditure. An example of this is when the government reduces its budgets forown departments, this means that workers become unemployed and no longerhave the ability to spend.
Diagram: This means that there is less demand for goods and services, shifting AD tothe left (AD1 to AD2). This as a result, reduces the general price level (P1 to P2)and thus reduces inflation.
Define: The both above mentioned strategies are demand-side policies, but supply-sidepolicies could also be effective to control the level of inflation.. Supply-side policiesare policies aimed at influencing the long run aggregate supply (LRAS) in aneconomy.
Example: This can be done by improving the quality and/or the quantity of the factorsof production, such as for example training programs, which improves the qualityof labour.
Explain: So if labour is now more effective because of training programmes, this meansthat each person can produce more. This is what then causes the increase in LRAS,and therefore shift the curve to the right (LRAS1 to LRAS2). Shifting the LRAScurve means that the AD curve now intersects the LRAS curve at a much lowergeneral level of prices (P1 to P2), therefore again solving the problem of inflation.
We now continue writing in the CLASPP structure to get top marks in question b):
Conclude: Of these three methods possible, which is most effective depends on thecurrent state of the economy. Fiscal policy will reduce inflation, but higher taxesand less government expenditure may not be politically desirable and make thegovernment very unpopular. Monetary policy can also reduce inflation but harmsinvestments (higher interest rate), thus long term productivity/competitivenessdomestically and internationally. Supply-side policies can again reduce inflation,but does so with a focus on the long-run. Many of the supply-side policies such aseducation/training take time to accumulate and take effect. In the long run, this isthe only way to reduce inflation, however to address the immediate situation fiscaland monetary policy will me more pertinent. Thus, in conclusion a mix ofpolicies seems most appropriate.This conclusion however is dependent on thecountry in question and the current state of the economy.
Limitations to theory: Of course finding the right balance between these three policiesso that they all coordinate is often easier said than done.
Assumptions of Theory: When providing this mixed policy advice, we need to keep inmind that these assume that all individuals are rational, which is not the case inreality. They also assume that the country in question is not susceptible tointernational actions which may clash with this policy advice.
Stakeholder: To choose only short term solutions to inflation (monetary policy andfiscal policy) lowers the level of inflation immediately (or faster than supply-side
138

ESSAY GUIDE Worked example 7
policies would), but comes at the price of lower output. Lower output meanshigher levels of unemployment and potentially reductions in living standards.Choosing only the long term solution to inflation (supply-side policies) means thatinflation in the short term may spiral out-of-control and into hyper-inflation(inflation at a very high rate) and result in great depressions, thus also a reductionin living standards for all consumers and producers in an economy.
Therefore monetary policy alone would not be as effective as all three policiestogether. This means that fiscal contractions need not be too strong (small increasein taxes that keeps people happy), Monetary policy can be less extensive (smallincreases in interest rates will not harm investment too much), and supply-sidepolicies can ensure that LRAS increases and the problem of inflation will be solvedfor in the long run.
Priorities, Pros and Cons: Combining all these methods does have drawbacks becausethe economy will experience spread symptoms rather than one, and thecoordination of these methods may require much effort in a country with a weakgovernment/ institution, coordination can be ineffective. However a small spreadof problems (small group of dissatisfied citizens in regard to taxes, small investmentdiscouragement, small drop in output because long-term is addressed etc. . . ) seemsto be preferred than one extreme (large increase in interest rates, large drop ininvestment).
139

ESSAY GUIDE Worked example
140