
Cross-Sectional, Cohort and Case-Control Studies HSS4303B – Intro to Epidemiology.
Upload
vuongkhuongCategory
view
219download
0
Study DesignCross-sectional, case-control and cohort studies
Katharina KranzerLondon School of Hygiene and Tropical Medicine
Biomedical Research and Training Institute
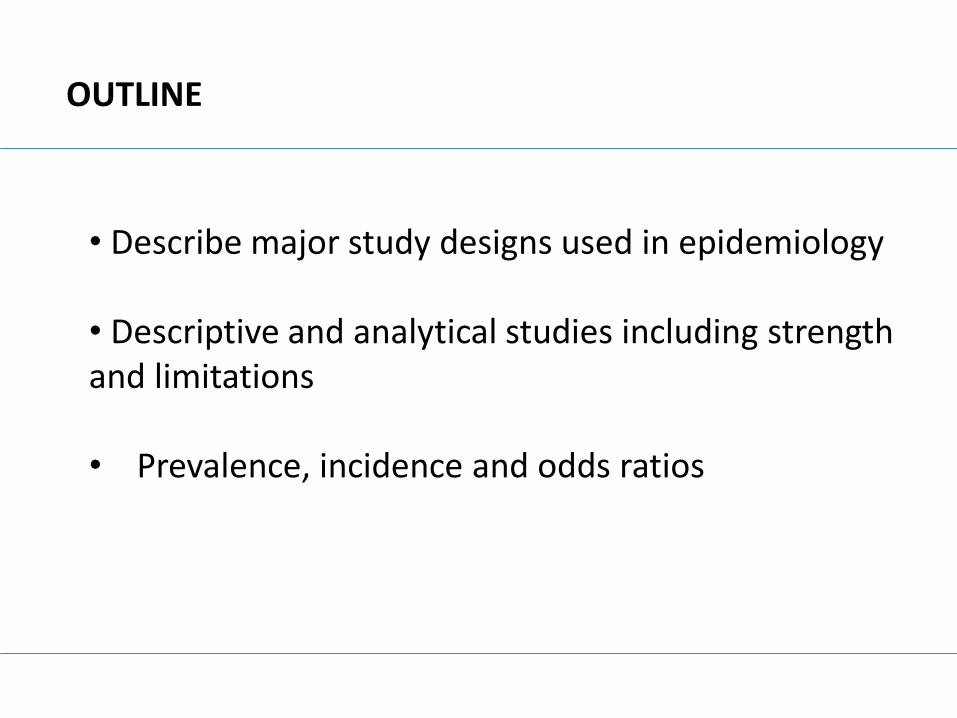
OUTLINE
• Describe major study designs used in epidemiology
• Descriptive and analytical studies including strength and limitations
• Prevalence, incidence and odds ratios
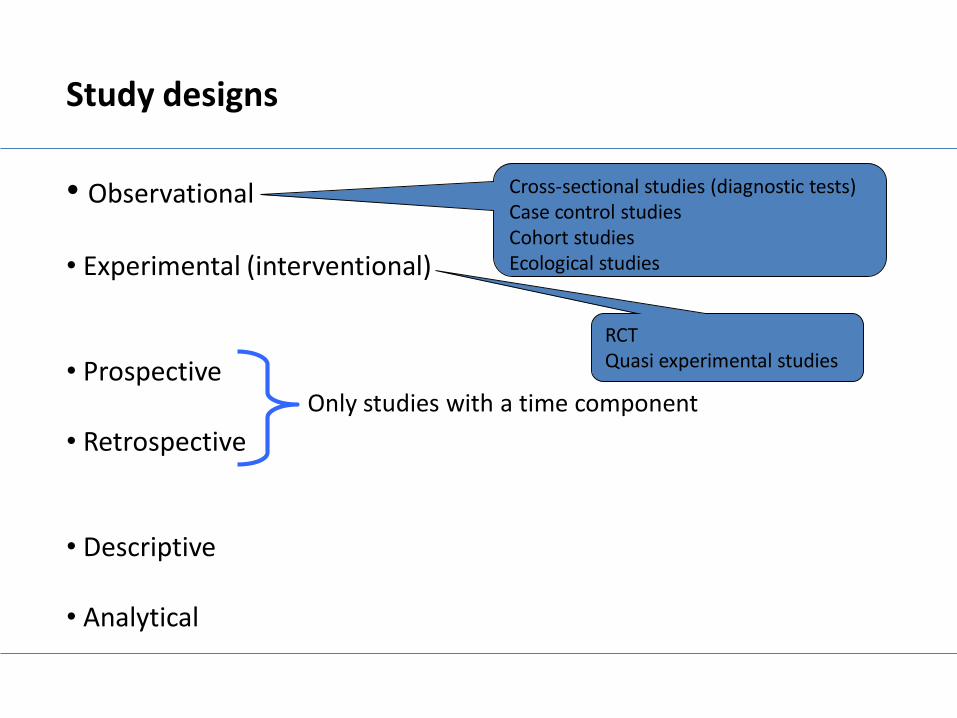
• Observational
• Experimental (interventional)
• Prospective
• Retrospective
• Descriptive
• Analytical
Study designs
Cross-sectional studies (diagnostic tests)Case control studiesCohort studiesEcological studies
RCTQuasi experimental studies
Only studies with a time component
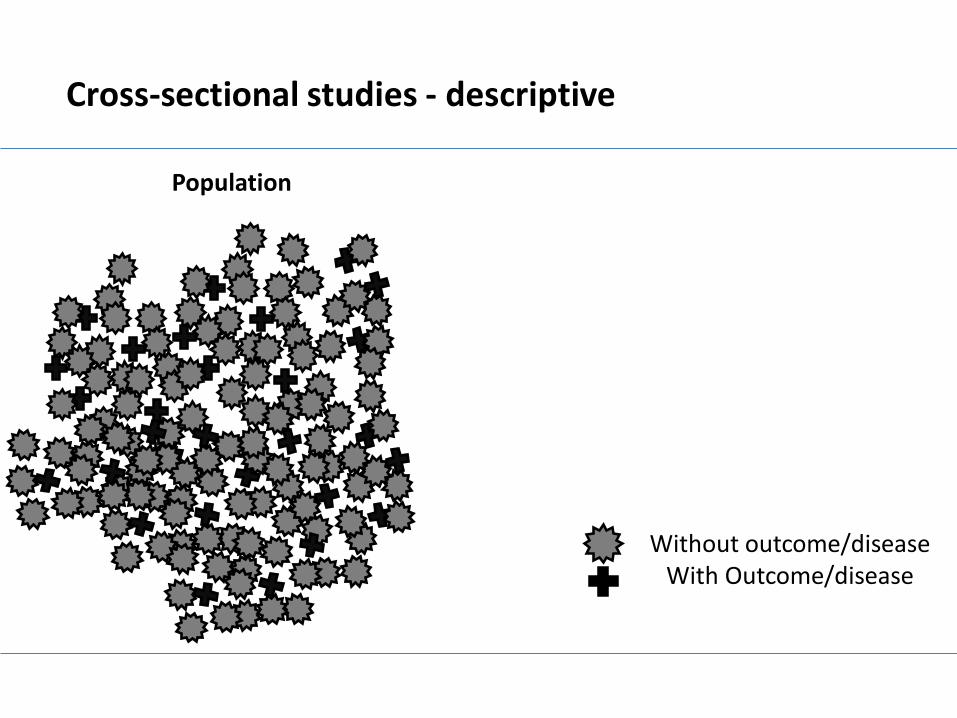
Cross-sectional studies - descriptive
Without outcome/diseaseWith Outcome/disease
Population
Without outcome/diseaseWith Outcome/disease
Population
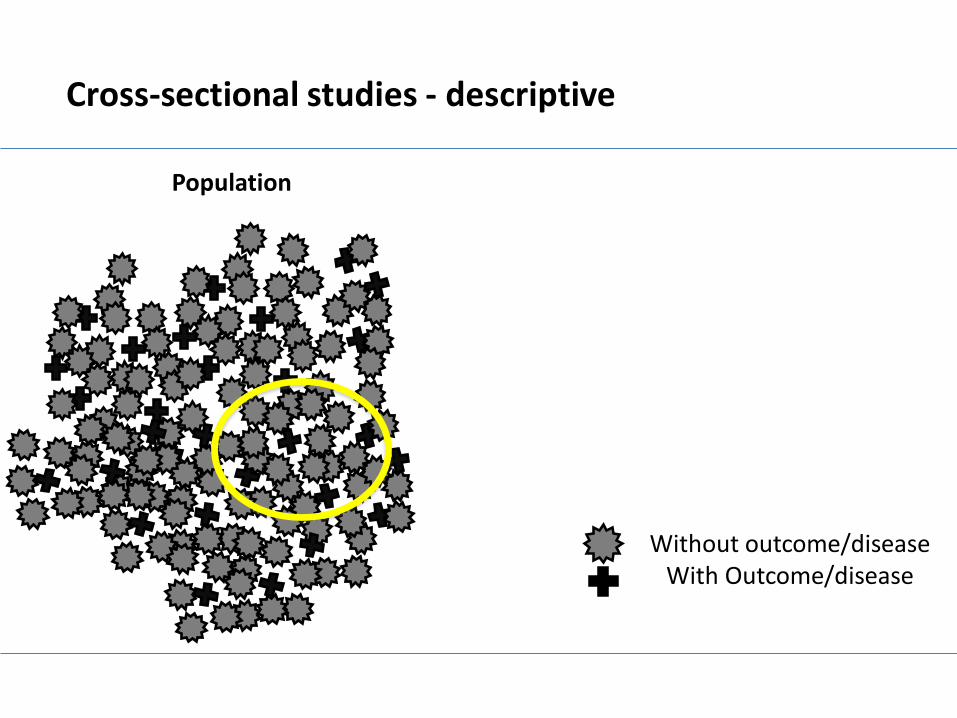
Cross-sectional studies - descriptive

Without outcome/diseaseWith Outcome/disease
Population Sample
Cross-sectional studies - descriptive
12 without outcome3 with outcome
What are we measuring? What is the result of the study?
Cross-sectional studies - descriptive
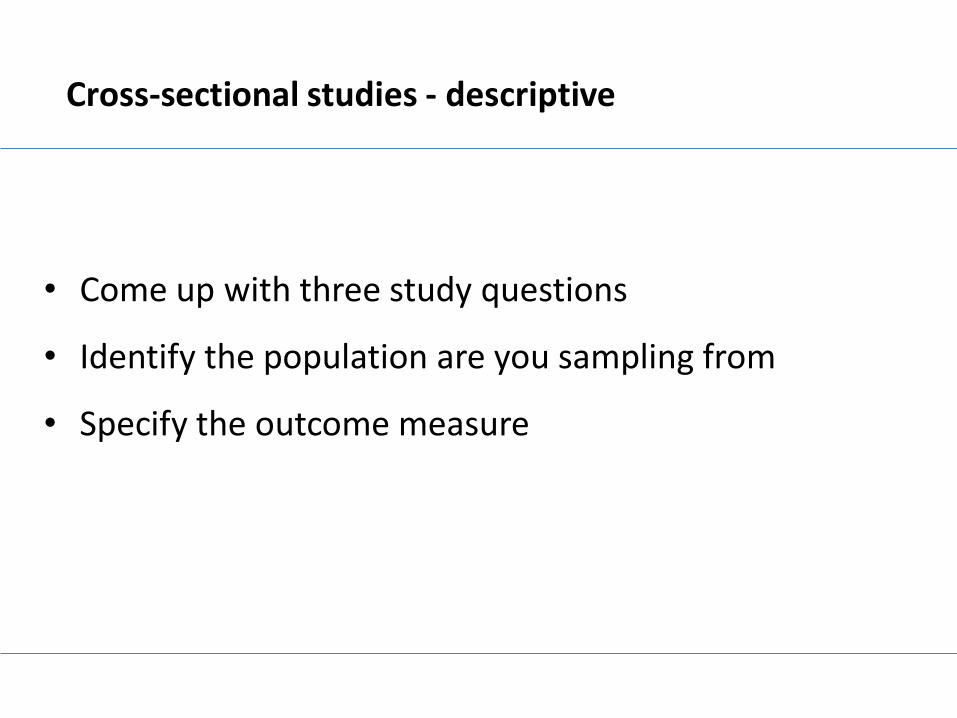
• Come up with three study questions
• Identify the population are you sampling from
• Specify the outcome measure
Cross-sectional studies - analytical
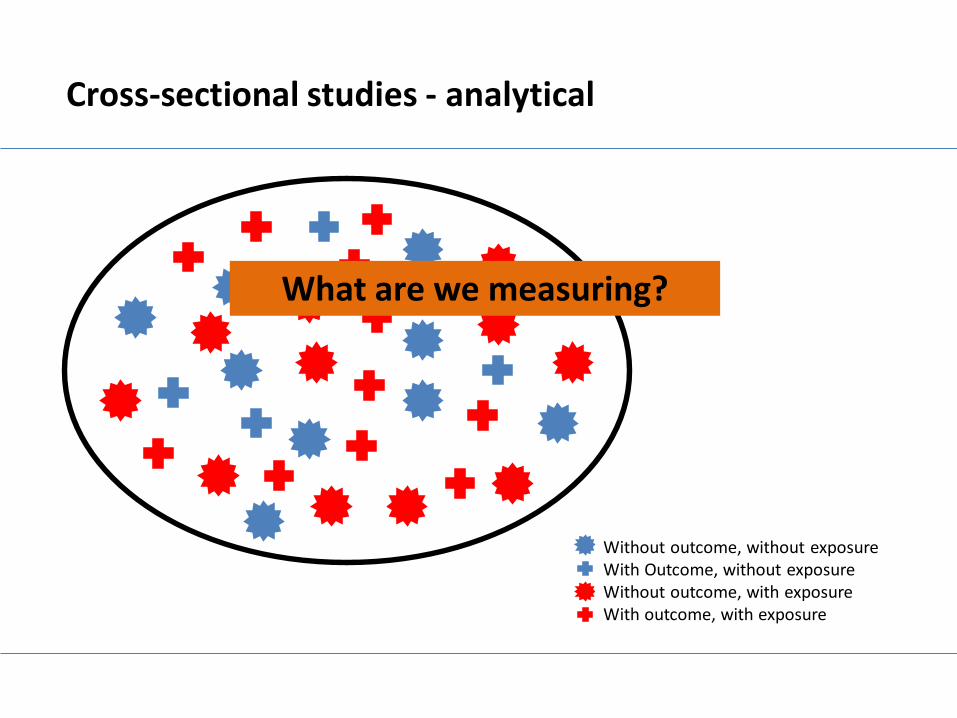
Without outcome, without exposureWith Outcome, without exposureWithout outcome, with exposureWith outcome, with exposure
What are we measuring?
Cross-sectional studies - analytical
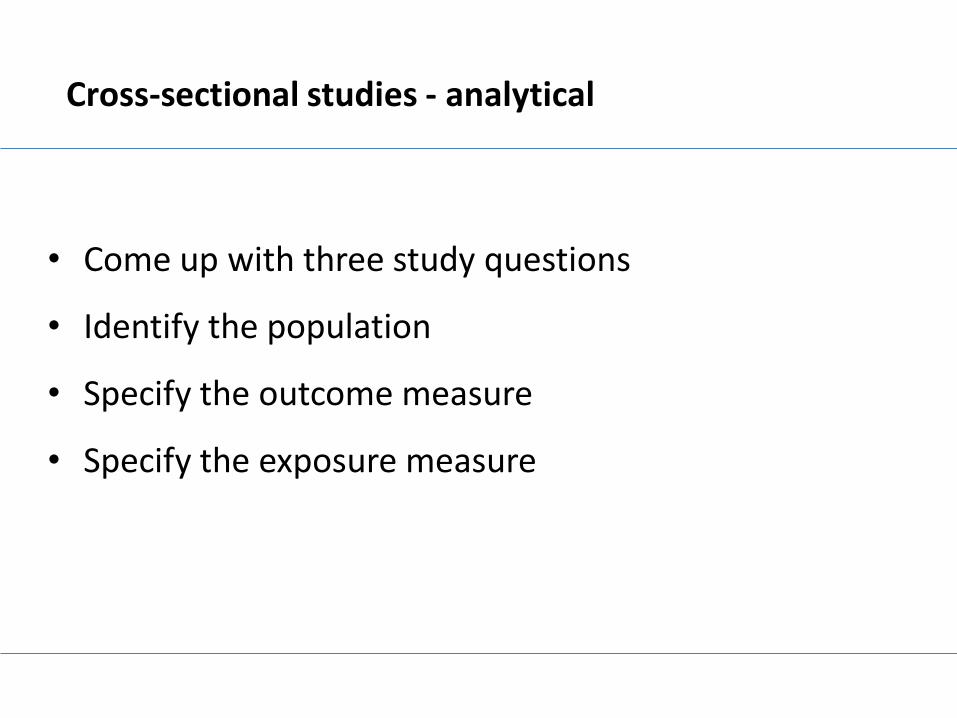
• Come up with three study questions
• Identify the population
• Specify the outcome measure
• Specify the exposure measure
Cross-sectional studies
• Measure the frequency of an outcome and/or exposure(s) in a defined population at a particular point in time
• Descriptive: measuring the burden of disease
• Analytical: comparing the frequency of disease in people exposed and unexposed to a risk factor

Cross-sectional studies
Pros:• Relatively quick and cheap
• Used to: determine the burden of diseaseevaluate diagnostic testgenerate hypothesis
Cons:• Difficult to establish that the exposure preceded the diseases (e.g. reverse causality)• Difficult to establish that a risk factor causes diseases (and not improves survival)

Cross-sectional studies – descriptive or analytic
1. What proportion of the population has hepatitis C?
2.What is the burden of HIV infection in antenatal care clients?
3. Is Vitamin D deficiency more prevalent in men compared to women?
4. What is the sensitivity and specificity of the “MAGIC test” for TB?
5. Are people recently admitted to hospital more likely to have colonisation with resistant organisms?
6. Is stunting more prevalent in children living in the rural compared to urban areas?
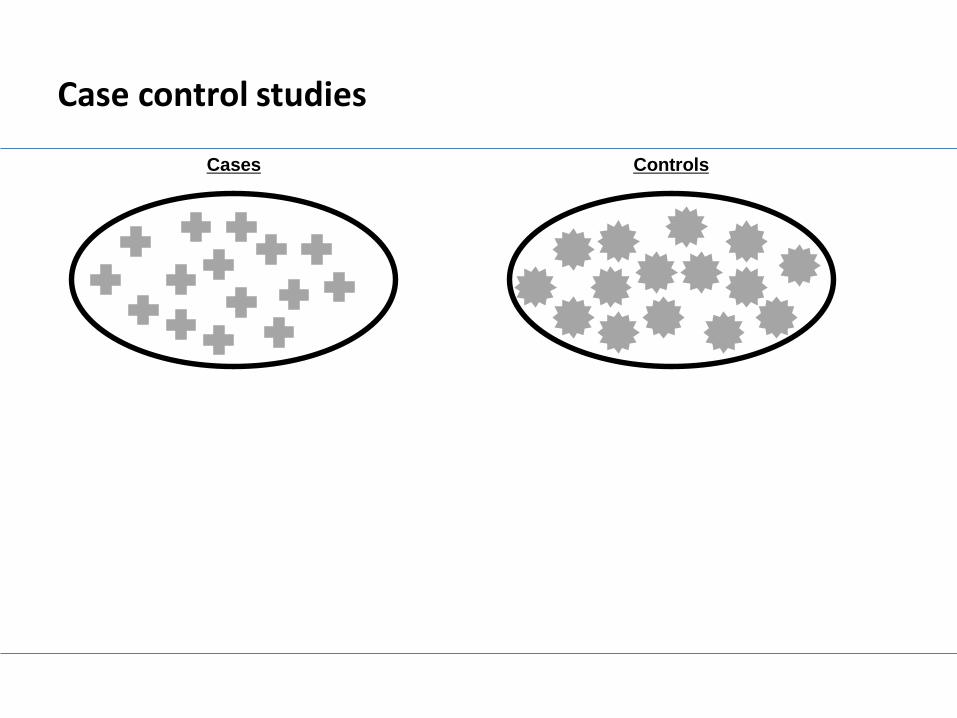
Case control studies
Cases Controls

Case control studies
Cases Controls
Exposure status is determined
Case control studies
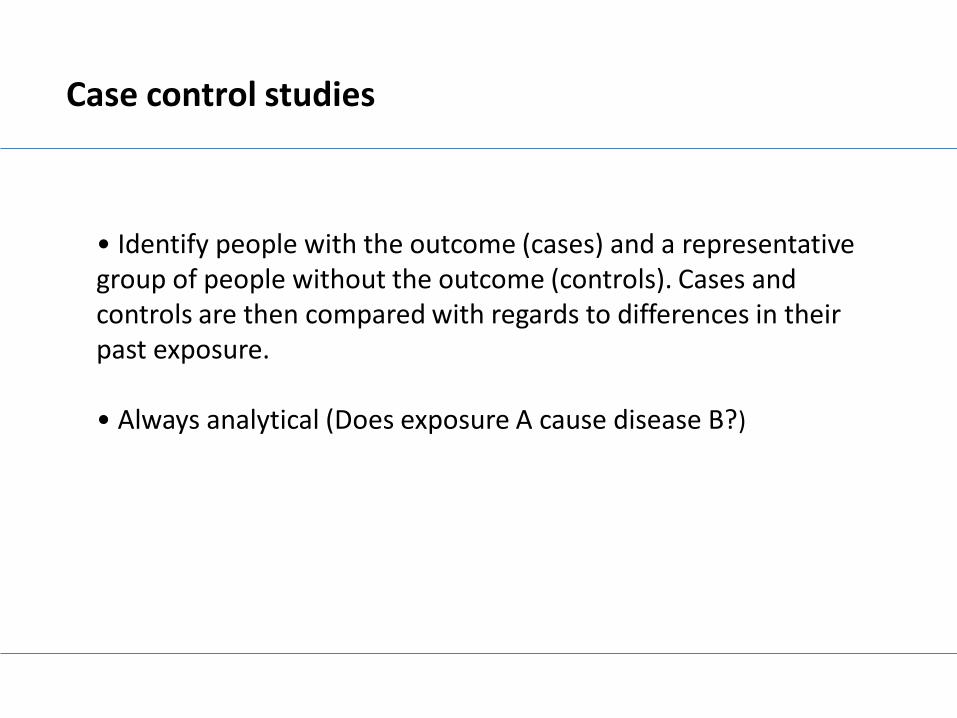
• Identify people with the outcome (cases) and a representative group of people without the outcome (controls). Cases and controls are then compared with regards to differences in their past exposure.
• Always analytical (Does exposure A cause disease B?)
Case control studies
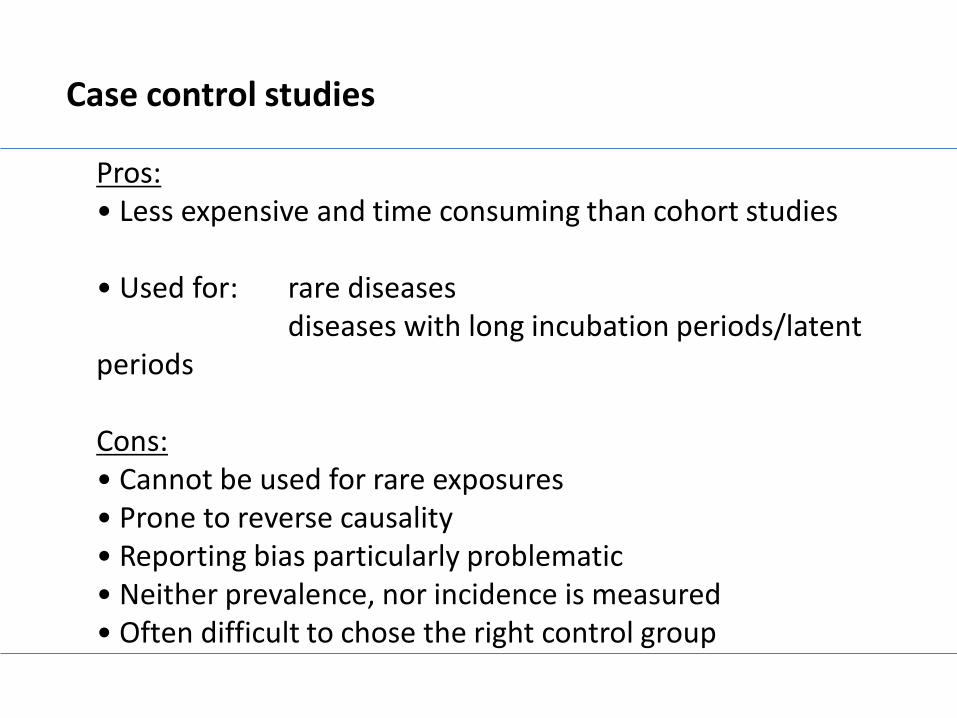
Pros:• Less expensive and time consuming than cohort studies
• Used for: rare diseasesdiseases with long incubation periods/latent
periods
Cons:• Cannot be used for rare exposures• Prone to reverse causality• Reporting bias particularly problematic• Neither prevalence, nor incidence is measured• Often difficult to chose the right control group
Case control studies
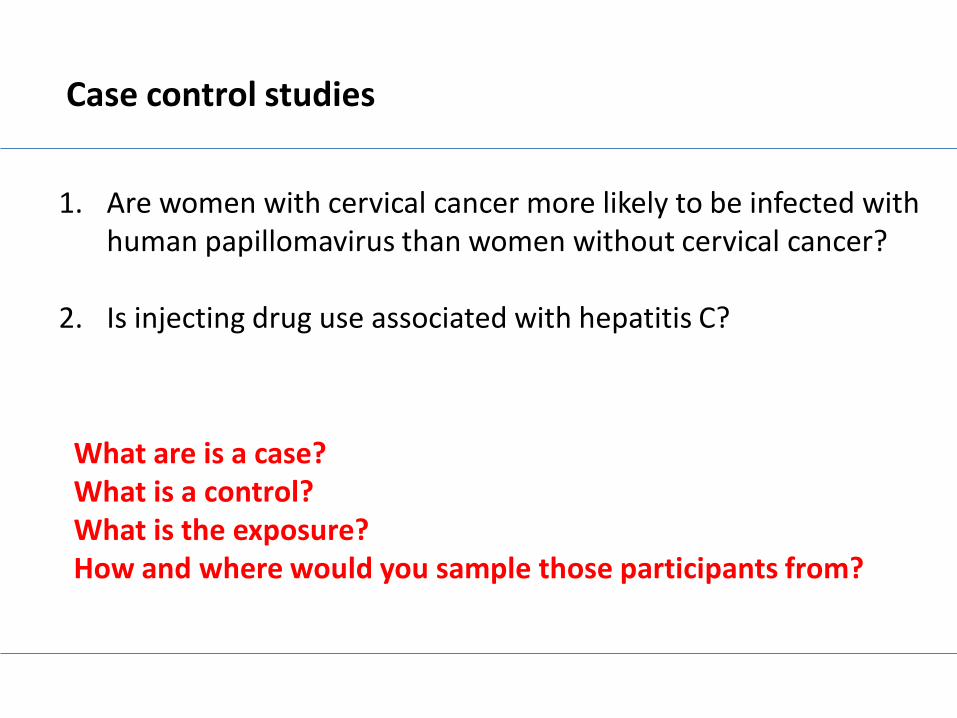
1. Are women with cervical cancer more likely to be infected with human papillomavirus than women without cervical cancer?
2. Is injecting drug use associated with hepatitis C?
What are is a case?What is a control?What is the exposure?How and where would you sample those participants from?
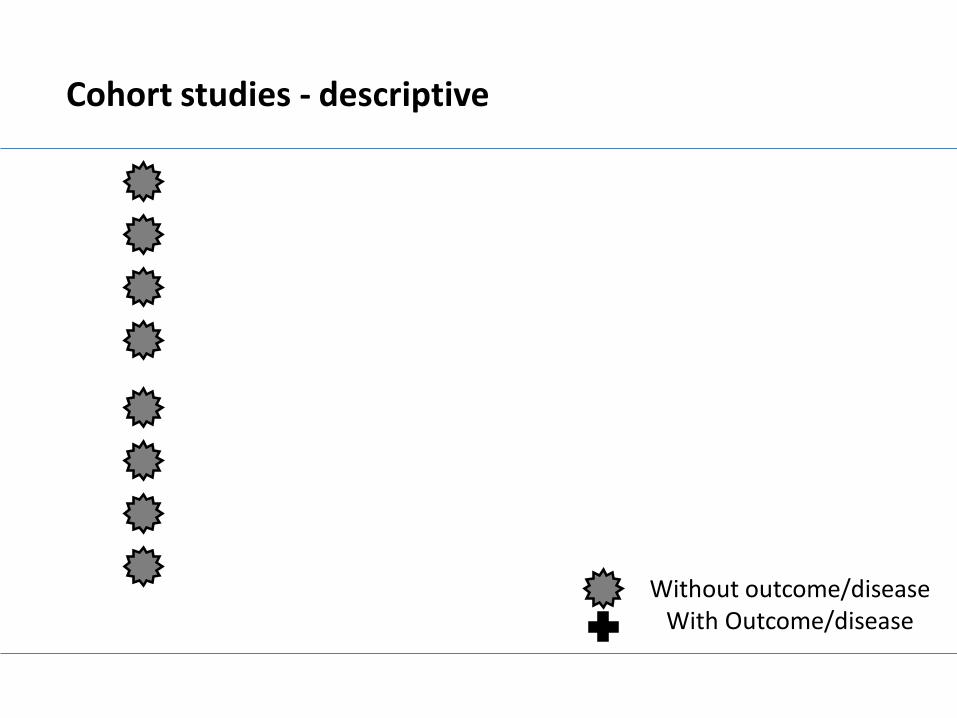
Cohort studies - descriptive
Without outcome/diseaseWith Outcome/disease

Cohort studies - descriptive
Without outcome/diseaseWith Outcome/disease
What are we measuring?
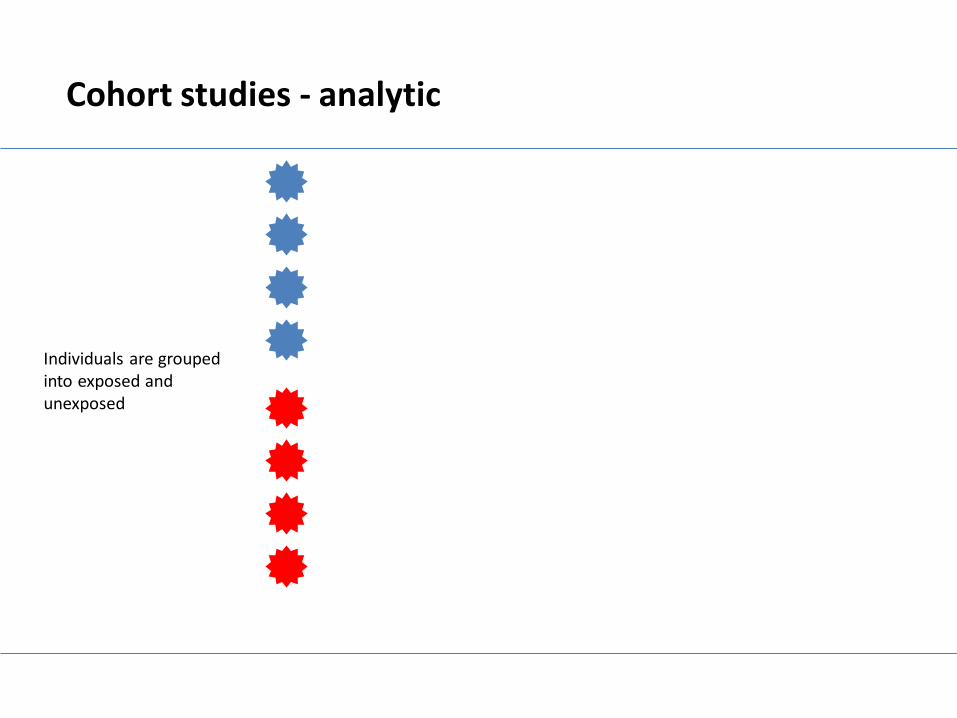
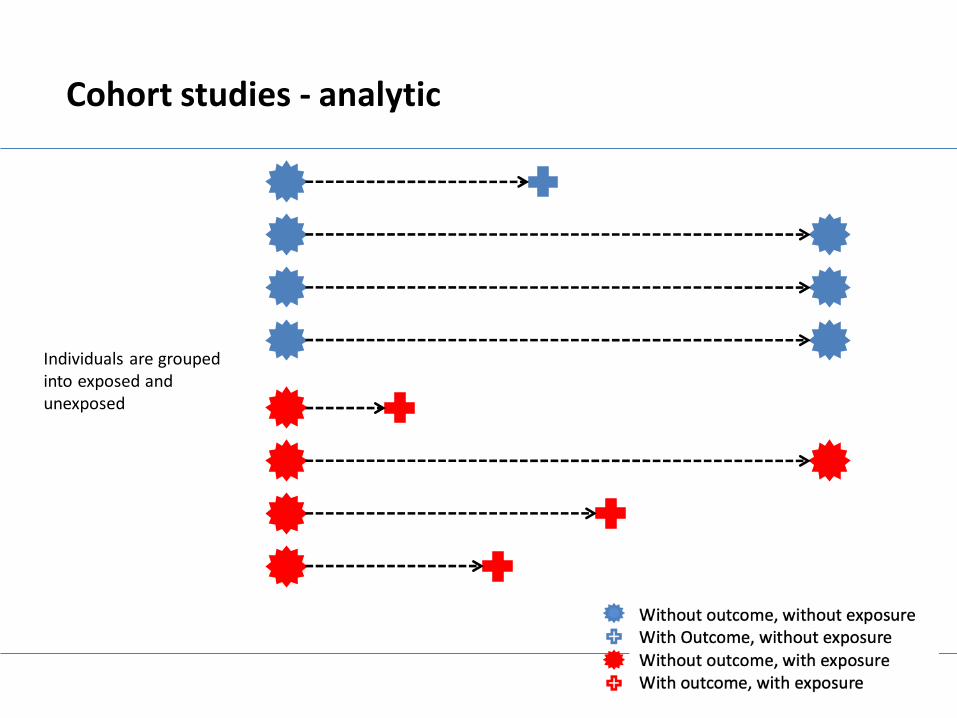
Cohort studies - analytic
Individuals are grouped into exposed and unexposed
Cohort studies - analytic
Individuals are grouped into exposed and unexposed
Cohort studies
• Follow a group of people who do not initially have the outcome of interest and determine whether they develop the disease.
• Descriptive cohort studies measure disease incidence.
• Analytic cohort studies classify people at the start of the study as exposed or unexposed to a certain risk factor.

Cohort studies
Pros:• Measure disease incidence• Measure exposure before the outcome• Good for rare exposures
Cons:• Not useful for rare diseases• Minimizing loss to follow-up sometimes challenging• Expensive and time consuming (huge sample size required)

Cohort studies
1. What is the mortality among patients with methicillin-resistant Staphylococcus aureus septicaemia?
2. Does infection with human herpesvirus-8 cause Kaposisarcoma in HIV-infected individuals?
Where would you enroll from?What is the exposure?How long would you plan to follow the participants?
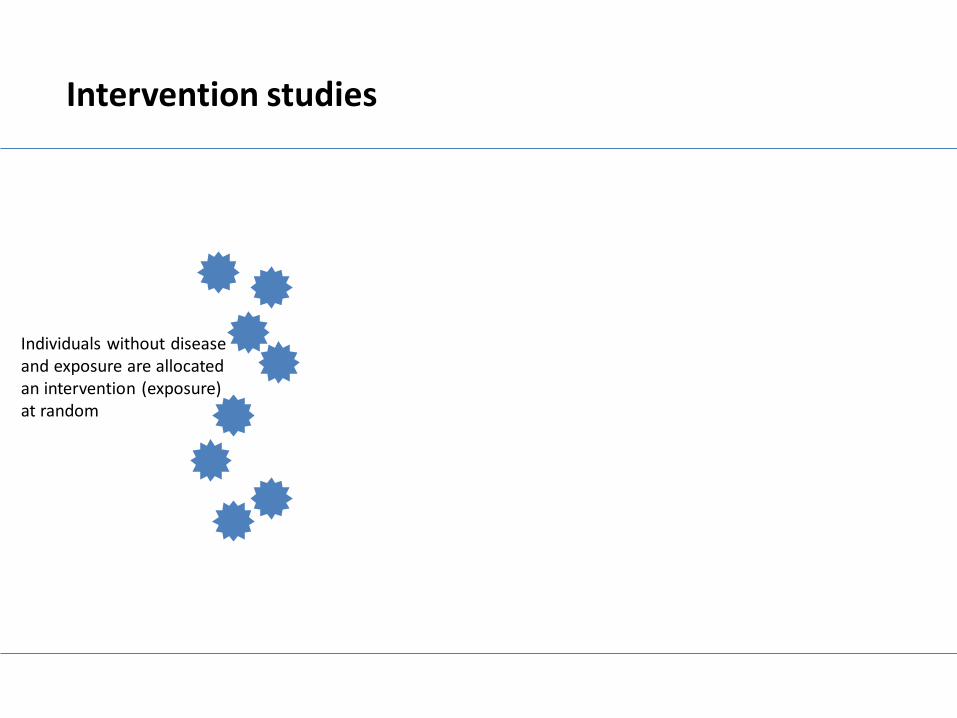
Intervention studies
Individuals without disease and exposure are allocated an intervention (exposure) at random

Intervention studies
Individuals without disease and exposure are allocated an intervention (exposure) at random

Intervention studies
Individuals without disease and exposure are allocated an intervention (exposure) at random

Intervention studies
• Disease-free and exposure-free individuals are actively allocated an exposure and followed over time.
• If the exposure is allocated at random it is a randomised trial.
• If there is a group without exposure (control group) it is a controlled trial.
• If the control group gets a placebo it is a placebo controlled trial.
• If neither the investigator (treating clinician) nor the participant know if they get the intervention or not it is double blinded trial.

Intervention studies
Pros:• Produces the highest level of evidence• Randomisation ensures that confounding is not an issue• Bias is reduced by blinding and placebo-controlled design
Cons:• Expensive and time-consuming• Ethical considerations
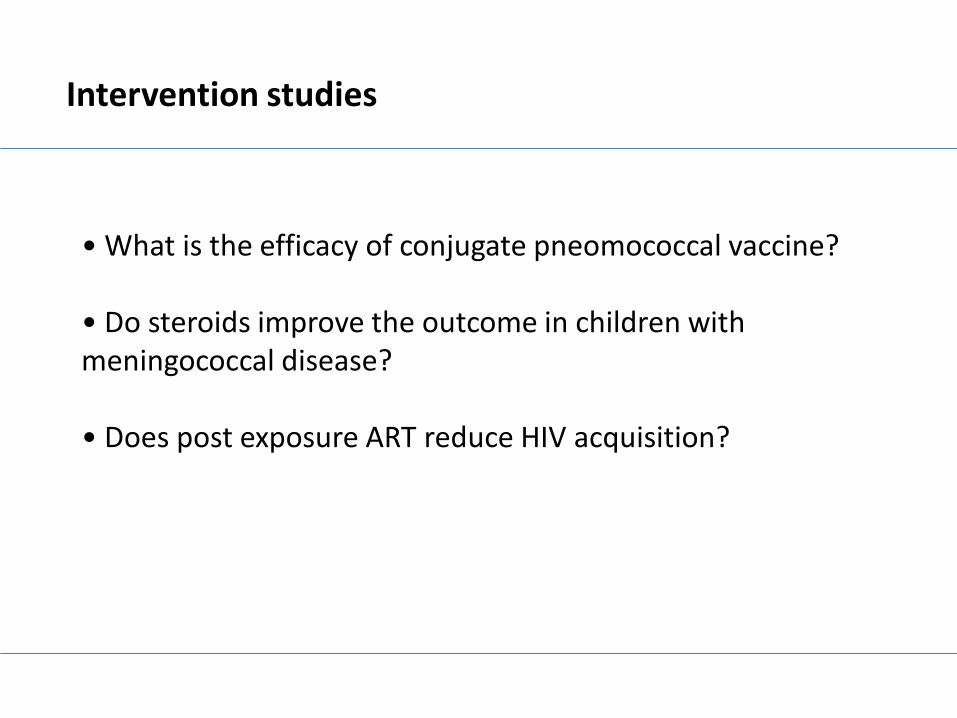
Intervention studies
• What is the efficacy of conjugate pneomococcal vaccine?
• Do steroids improve the outcome in children with meningococcal disease?
• Does post exposure ART reduce HIV acquisition?


Outcome estimates
Prevalence: the proportion of individuals with a diseases at a given point in time in a given population
Incidence: the number of new cases in a given population over a certain time period
What is the denominator?
What is the denominator?

What influences the prevalence of disease?
Prevalence = incidence * duration of disease

Effect estimates – relative and absolute
Risk ratio = prevalence in exposed/prevalence in unexposed
Rate ratio = incidence in exposed/incidence in unexposed
Relative
Risk difference = prevalence in exposed-prevalence in unexposed
Rate difference = incidence in exposed-incidence in unexposed
Absolute
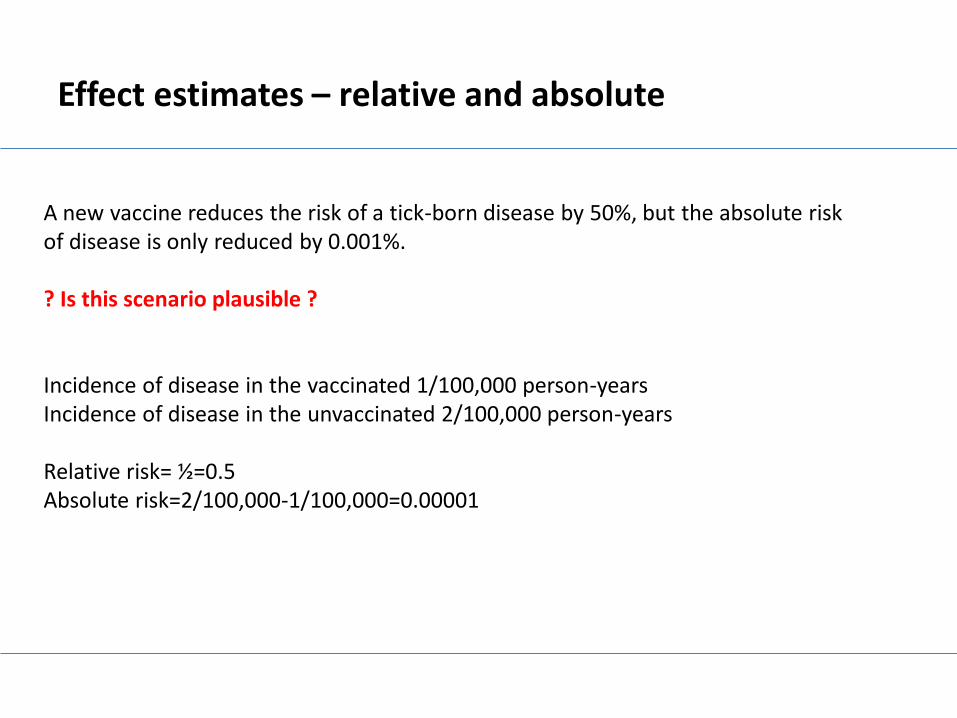
Effect estimates – relative and absolute
A new vaccine reduces the risk of a tick-born disease by 50%, but the absolute risk of disease is only reduced by 0.001%.
? Is this scenario plausible ?
Incidence of disease in the vaccinated 1/100,000 person-yearsIncidence of disease in the unvaccinated 2/100,000 person-years
Relative risk= ½=0.5Absolute risk=2/100,000-1/100,000=0.00001
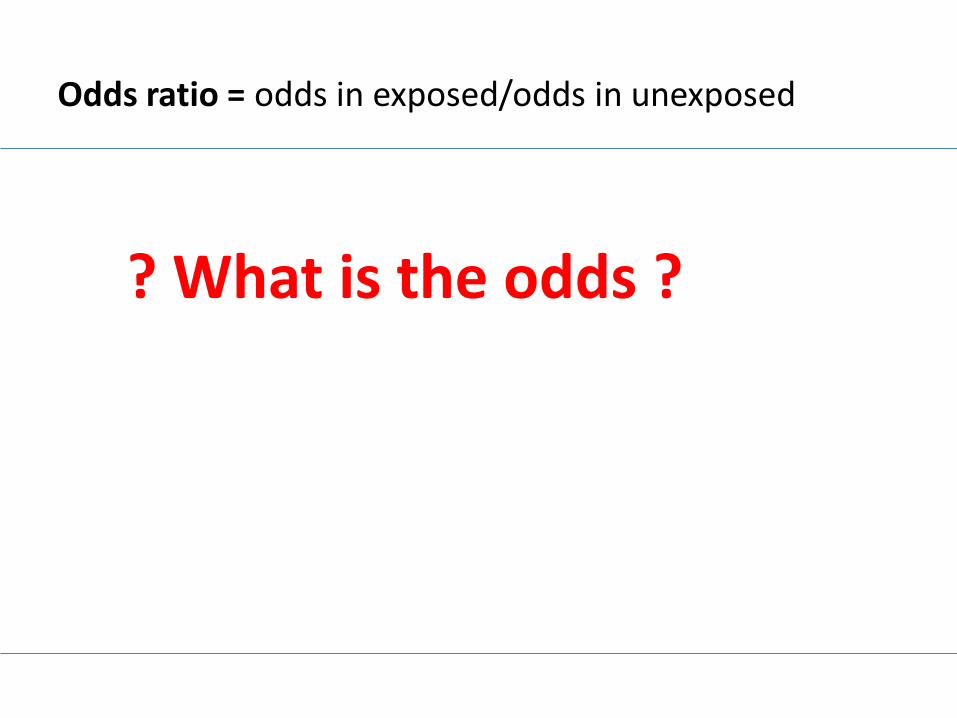
Odds ratio = odds in exposed/odds in unexposed
? What is the odds ?

Odds ratio = odds in exposed/odds in unexposed
Diseased Non-diseased Total
Unexposed a b a+b
Exposed c d c+d
Total a+c b+d a+b+c+d
Odds of the unexposed = a/bOdds of the exposed = c/d What would the risk/prevalence be?

Odds ratio = odds in exposed/odds in unexposed
Diseased Non-diseased Total
Unexposed a b a+b
Exposed c d c+d
Total a+c b+d a+b+c+d
Odds of the unexposed = a/bOdds of the exposed = c/d
Risk of the unexposed = a/(a+b)Odds of the exposed = c/(c+d)
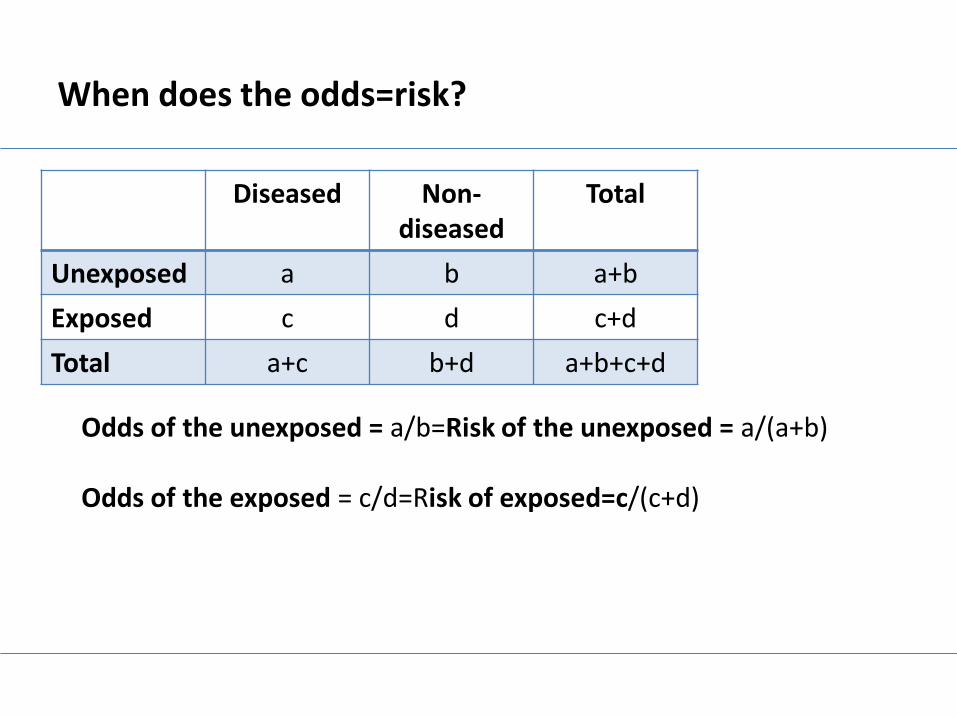
When does the odds=risk?
Diseased Non-diseased
Total
Unexposed a b a+b
Exposed c d c+d
Total a+c b+d a+b+c+d
Odds of the unexposed = a/b=Risk of the unexposed = a/(a+b)
Odds of the exposed = c/d=Risk of exposed=c/(c+d)

When does the odds=risk?
Diseased Non-diseased Total
Unexposed a b a+b
Exposed c d c+d
Total a+c b+d a+b+c+d
Odds of the unexposed = a/b=Risk of the unexposed = a/(a+b)
Odds of the exposed = c/d=Risk of exposed=c/(c+d)
If the number of individuals with diseases is small (low
prevalence of disease).
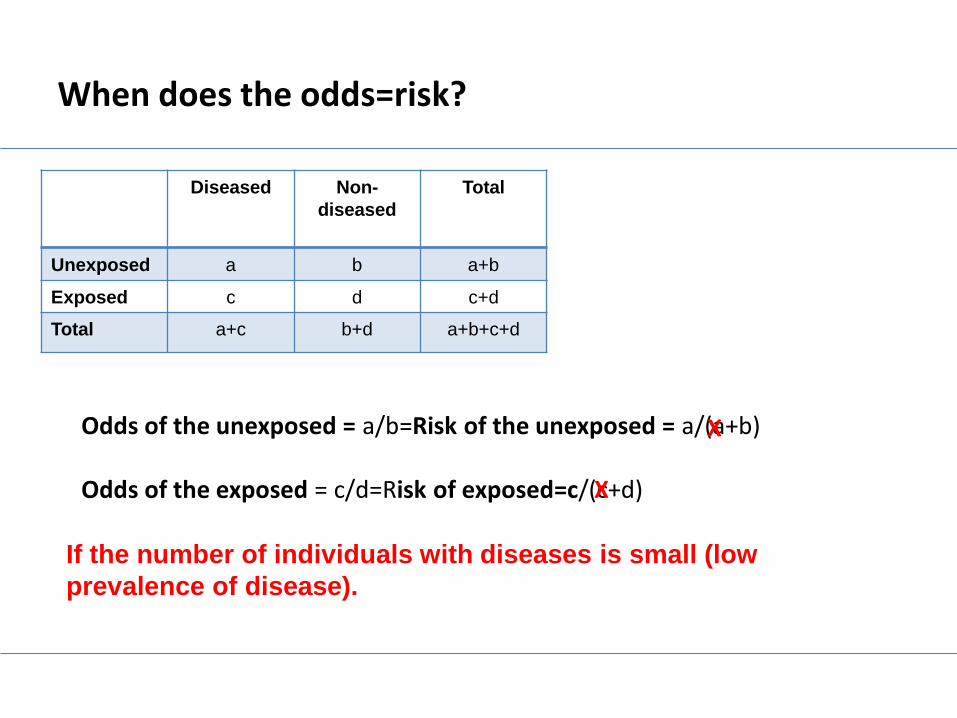
When does the odds=risk?
Diseased Non-
diseased
Total
Unexposed a b a+b
Exposed c d c+d
Total a+c b+d a+b+c+d
Odds of the unexposed = a/b=Risk of the unexposed = a/(a+b)
Odds of the exposed = c/d=Risk of exposed=c/(c+d)
X
X
If the number of individuals with diseases is small (low
prevalence of disease).
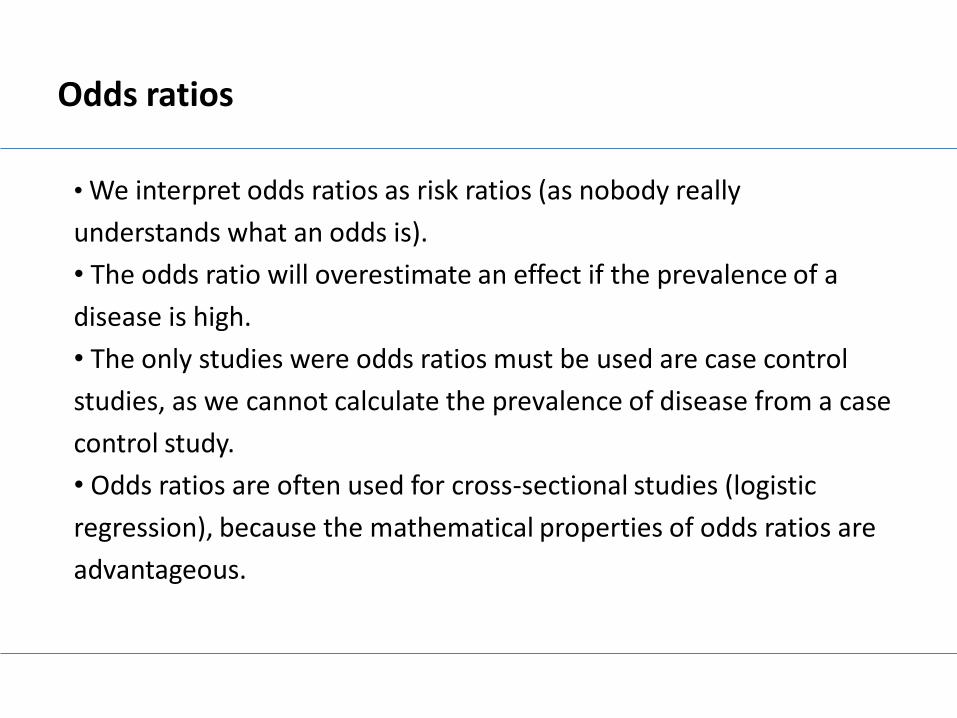
Odds ratios
• We interpret odds ratios as risk ratios (as nobody really
understands what an odds is).
• The odds ratio will overestimate an effect if the prevalence of a
disease is high.
• The only studies were odds ratios must be used are case control
studies, as we cannot calculate the prevalence of disease from a case
control study.
• Odds ratios are often used for cross-sectional studies (logistic
regression), because the mathematical properties of odds ratios are
advantageous.


95% Confidence intervals
• 95% CI give you a range around an outcome measure (e.g. prevalence) or an effect estimate (e.g. risk ratio), which has to do with precision or in other words it tells you how confident you could be that YOUR estimate is the TRUE population estimate.
• 95% CI are calculated on the basis of the hypothetical scenario that you would repeat your experiment unlimited times selecting the same number of people randomly. You would then end up with a sampling distribution.
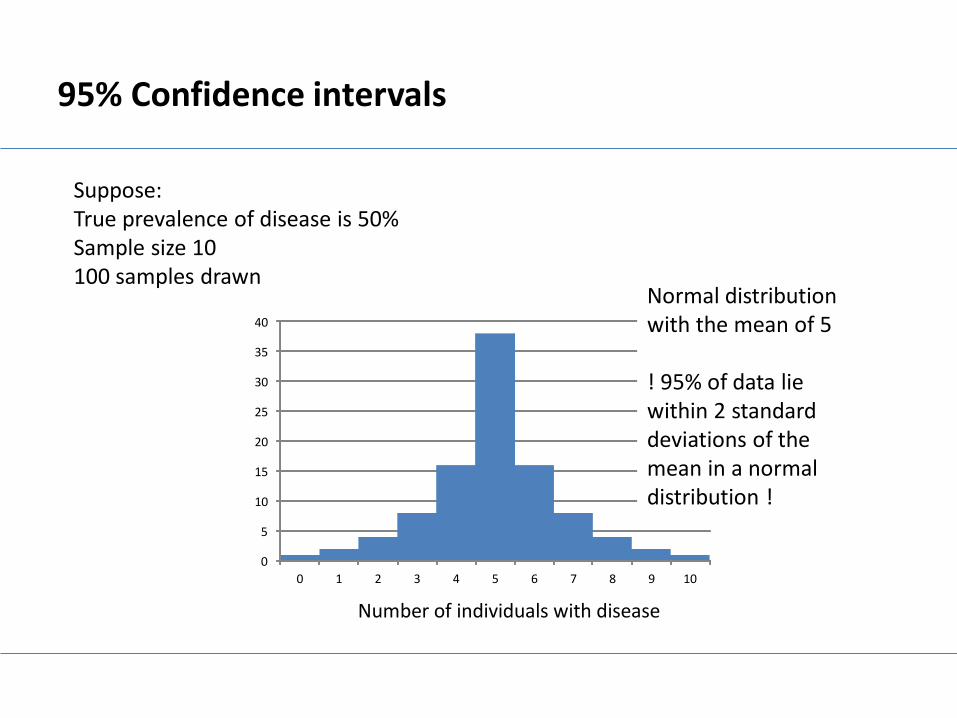
95% Confidence intervals
Suppose:True prevalence of disease is 50%Sample size 10100 samples drawn
0
5
10
15
20
25
30
35
40
0 1 2 3 4 5 6 7 8 9 10
Number of individuals with disease
Normal distribution with the mean of 5
! 95% of data lie within 2 standard deviations of the mean in a normal distribution !

95% Confidence intervals
• The 95%CI calculation assumes the measured estimate is the true effect estimate
• The sampling distribution will be much narrower around the mean if you increase your sample size (because chance will be of less importance), thus the standard deviation of the sampling distribution decreases the larger the sample size
• 95%Cis are only important if you want to make inferences about the population (if you are sampling the whole population, they are not meaningful)
P values
• probability that the null hypothesis is true
• examples of null hypothesis are:Prevalence of disease in population A is the same as prevalence in population BThere is no effect of drug X (risk ratio=1)
• a p value of 0.05 means that there is a 5% chance that the null hypothesis is true
• p values are based on the same principle as 95%CI (and in fact you will know if the p values is >0.05 by looking at the 95%CI), but they do not provide information about the difference or the effect estimate
• people are obsessed about p values, but the only information they provide is how big the sample size was, they do not give information about how meaningful a result is

P values
A new drug decreases pain significantly (p value <0.001).
What do you think? – good, bad, no opinion
What would you like to know?
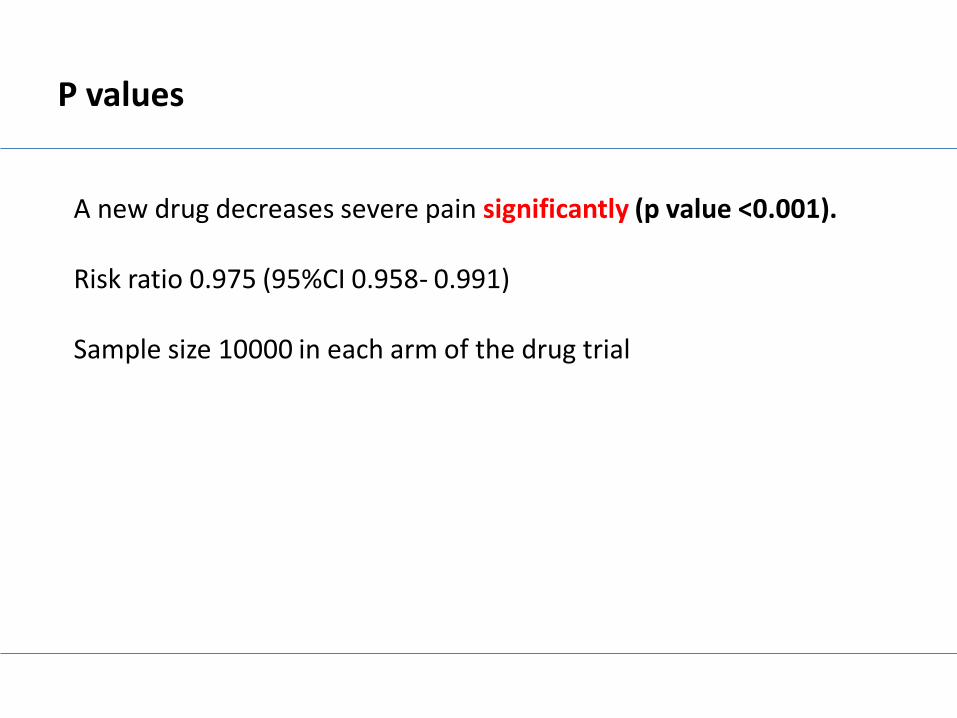
P values
A new drug decreases severe pain significantly (p value <0.001).
Risk ratio 0.975 (95%CI 0.958- 0.991)
Sample size 10000 in each arm of the drug trial