Study DEMAND, CONSUMPTION, REUSE AND RECYCLING OF …
27
DEMAND, CONSUMPTION, REUSE AND RECYCLING OF CLOTHING AND TEXTILES IN GERMANY POWERFUL COMPETENT UNITED UMBRELLA ORGANISATION OF THE RECYCLING AND WASTE MANAGEMENT INDUSTRY Study
Transcript of Study DEMAND, CONSUMPTION, REUSE AND RECYCLING OF …

DEMAND, CONSUMPTION, REUSE AND RECYCLING OF CLOTHING AND TEXTILES IN GERMANY
DEMAND, CONSUMPTION, REUSE AND RECYCLING OF CLOTHING AND TEXTILES IN GERMANY
POWERFUL COMPETENT UNITED
UMBRELLA ORGANISATION OF THE RECYCLING AND WASTE MANAGEMENT INDUSTRY
Study

1
Textile Study 2020
German Federal Association for Secondary Raw Materials and Waste Management
(bvse e.V.)
“Demand, Consumption,
Reuse and Recycling of Clothing and
Textiles in Germany”
Submitted by:
B.A. Sebastian Forbrig
Dipl.-Ing. Thomas Fischer
Ass. Jur. Beate Heinz
Contents may only be used by third parties if the source „bvse“ is indicated.
Division for Textile Recycling
I

2
The contents of this study are based on a member survey presented by the bvse-Specialist
Association for Textile Recycling and interviews with member-company officials thereof as
well as cooperation with the working group “High-Quality Textile Recycling.”
Working Group - High-Quality Textile Recycling.
Chairperson: Ms Martina Forbrig
Participating Companies:
East-West Textilrecycling Kursun GmbH; U. Kursun, S. Voigt
FWS GmbH / (Boer Group); R. Binger
Kolping Recycling GmbH; S. Kowoll
Lorenz Wittmann GmbH; M. Wittmann
Reinhard Juraschek Handels- und Organisations GmbH; R. Juraschek, J. Juraschek
SOEX Collecting Germany GmbH; M. Fühßer
TEREC GmbH; U. Freudling
Division for Textile Recycling
II
3
Contents
1 Introduction ........................................................................................................................ 5
2 Abstract .............................................................................................................................. 6
3 Quantity Calculations ......................................................................................................... 7
3.1 Actual Collection Quantities - absolute ...................................................................... 7
3.2 Actual Collection Quantities - per inhabitant per year .............................................. 9
4 Textile Market Indicators ................................................................................................. 10
4.1 Fast Fashion .............................................................................................................. 10
4.2 Internet und C2C circulation of goods ..................................................................... 12
5 Sector Indicators .............................................................................................................. 14
5.1 Quality ...................................................................................................................... 14
5.2 Recycling Options ..................................................................................................... 16
6 Conclusion ........................................................................................................................ 18
List of references ...................................................................................................................... 20
Division for Textile Recycling
III

4
List of Abbreviations
ACQ Actual Collection Quantities
bvse e.V. Bundesverband Sekundärrohstoffe und Entsorgung e.V.
(German Federal Registered Association for Secondary Raw Materials
and Waste Management)
C2C Consumer-to-Consumer
EUWID Europäischer Wirtschaftsdienst GmbH (European Economic Service)
kg Kilogramm
KrWG Kreislaufwirtschaftsgesetz (German Closed Substance Cycle and Waste
Management Act)
LLC Company with limited liability
SEK Swedish Krona
SF Substitute Fuel
t Metric tonnes
Division for Textile Recycling
IV

5
1 Introduction
The textile research study from 2015, compiled by the German Federal Association for Sec-
ondary Raw Materials and Waste Management (bvse e.V.), recorded key figures, framework
conditions and trends in the light of the amendments to the implementation of the German
Closed Substance Cycle and Waste Management Act (KrWG) of 01.06.2012. Example compar-
isons were made to the results of the bvse-study in 2008 and the general mood in relation to
the amended framework conditions was recorded. Following on from the study presented in
2015, this study will again reflect upon fundamental developments, whereby progressive phe-
nomena will be observed, qualified and quantified, based on the knowledge (other than in a
few exceptions) obtained from the completed financial year 2018. In addition, current devel-
opments will be discussed in the analysis.
In the light of the significance of fast fashion and the internet and their associated difficulties
when considering closed substance cycles and compliance with waste hierarchy according to
KrWG, the already observed tendency towards increasingly more difficult economic condi-
tions for general textile recycling and for high-quality textile recycling, in particular, will be-
come apparent. This situation will be analysed and conclusions drawn that are not only eco-
nomically relevant, but also allow a critical analysis of the notion of circular economy in society
as a whole. Furthermore, it will become apparent, how significant established textile recycling
structures are, and which challenges these structures face regarding textile product manufac-
turing methods, consumer behaviour and reformed legal frameworks.
Initially, to enable scientific evaluation, domestic availability and actual collection quantities
in 2015 and 2018 will be calculated, whereby specific features, common features and differ-
ences to previous calculations will be explained and justified. The calculated values will be
interpreted using current explanatory approaches and, subsequently, the market outlook for
the coming years will be critically analysed.
Division for Textile Recycling
5

6
2 Abstract
Consumer behaviour regarding textiles has fundamentally changed in recent years. The once
longer use of shoes, clothing and household textiles has given way to an increasingly rapid
consumption thereof. Alone in the period between 2015 and 2018 an average increase of col-
lected textiles of 2.2 % to 15.3 kg per inhabitant per year was seen; this represents an increase
of actual collection quantities during this period of over 90,000 tonnes, thus reaching a total
of 1,271,242 tonnes during 2018. The majority of this increase can be attributed to imported
textiles from low-wage countries, so much so that the German textile industry is becoming
increasingly less significant.
The increase in available collection quantities suggests an improved market situation for tex-
tile recycling. However, the opposite effect is observed, as an increase in quantity of the orig-
inally collected textiles does not necessarily correspond to an increase in quality thereof. Cost
pressure on producers, increasing market shares of fast fashion and private circulation of
goods, a contaminant and impurity ratio of 10.8 % before sorting as well as a doubling of the
ratio of textiles no longer suitable for recycling are representative of a rapid reduction in qual-
ity, which coupled with the overall increase in the original collection quantities has recently
manifested itself in a slump in prices to under € 200/t for originally collected textiles. At first
glance, this appears to be counteracted by the increase in the reuse ratio at the recycling
plants, from 54 % in 2015 to 62 % in 2018. However, this should be viewed from an economic
standpoint, where the best possible added value achieved by increasing both specialisation
and hand-sorting needs to be considered; the latter of which still cannot be technically auto-
mated in a competitively viable manner. This last point is particularly critical for Germany in
the light of developments on the labour market regarding workforce costs.
Textile recycling must, and will, adapt in coming years; on this point there is complete consen-
sus amongst those players involved in the textile circular economy. However, there is discord
as to the manner and method of the transition and where the responsibility lies for the imple-
mentation thereof. The figures presented in this study can be seen as a call on all participants
to overcome differences regarding the problems involved in textile recycling, and, now more
than ever, to work together to develop a sustainable, but also fair concept for the future to
ensure that high-quality textile recycling survives within the framework of the German Closed
Substance Cycle and Waste Management Act. Ultimately, only in this manner is it possible to
even meet, let alone with efficiency, the social demands for future sustainability.
Division for Textile Recycling
6
7
3 Quantity Calculations
3.1 Actual Collection Quantities - absolute
The same formula which was used in the bvse - Textile Study 2015 for the calculation of actual
collection quantities as well as for the reserve and weight loss quantities is applied. There is,
without doubt, the need to revise these values or provide an up-to-date analysis to verify their
validity for future studies. Data is collected from the current waste balance sheet for each
individual federal state and subsequently analysed to obtain disposal quantities. Data validity
could not be verified, due to differing reference years (2016 - 2018) of each individual federal
state’s waste balance figures, the failure in some cases to separate textiles from domestic
waste, the differing types of textiles and their collection methods as well as missing reports
from the administrative districts within each federal state and in the federal state comparison.
Feedback to enquiries on this topic revealed that the lack of uniformity in the collection and
presentation of the differing waste ratios in the total waste collection quantities were respon-
sible for the, in parts, inferior data base. Admittedly, there are endeavours to implement struc-
tures in the near future for the separate collection of textile waste to meet the new regula-
tions coming into force in 2025, but progress at the moment is not yet deemed to be sufficient.
Uniformity in the collection and presentation of differing textile ratios in the collected resi-
dential waste is urgently required, so that valid quantities and reference values for textile
waste ratios and suchlike can be generated. For these reasons, the disposal value used in 2015
of 3 kg per inhabitant per year is once again used in the following calculations, even though a
different value could de facto be assumed.
Division for Textile Recycling
7

8
It is evident that both the previous and current study indicate identical developments. In 2015,
compared to the 2008 study, an increase in collection quantities was revealed. This corre-
sponds with the comparison of the figures from 2015 and 2018.
ACQ = domestic availability – disposal quantity - reserve – weight loss
According to recent calculations, the absolute quantity of actual available textiles for collec-
tion has increased by 90.210 tonnes between 2015 and 2018 in Germany. Compared to 2015,
domestic production has increased by 6.5 %, whilst the proportion of foreign trade has in-
creased by 8 %. The trend towards imported clothing still continues, whilst German domestic
clothing and household textile production is steadily decreasing. Furthermore, following the
method used in the 2008 and 2015 studies to calculate actual collection quantities, an increase
in available absolute collection quantities and an increase in per inhabitant per year quantities
are revealed - the latter being particularly relevant in the light of forecasted population
growth.
1.181.0321.271.242
0
100.000
200.000
300.000
400.000
500.000
600.000
700.000
800.000
900.000
1.000.000
1.100.000
1.200.000
1.300.000
1.400.000
2015 2018
Am
ou
nt
in t
Division for Textile Recycling
8

9
3.2 Actual Collection Quantities - per inhabitant per year
For the last 3 years, the average annual increase for the actual collection quantities per inhab-
itant per year is 2.2 %. Alongside the absolute increase in population, higher amounts of waste
generated per inhabitant per year is also seen. The absolute increase between 2015 and 2018
amounts to 0.94 kg per inhabitant per year; this means that with an average weight of 0.3 kg
per piece of clothing or household textile and 0.6 kg per pair of shoes, approximately 3 more
pieces of clothing/household textiles or 1.5 more pairs of shoes are being disposed of by every
inhabitant compared to 2015.
According to the German Federal Statistical Office (Destatis), the population of Germany,
when considering the average of all calculation methods, is expected to reach 83,723,470 by
2025. Based on the average linear increase of actual collection quantities of 2.2 % per inhab-
itant per year, an increase in collection quantities of 2.21 kg per inhabitant is anticipated in
2025.
Actual collection quantities - per Inhabitant per year in kg
14,37
15,31
17,52
0 1 2 3 4 5 6 7 8 9 10 11 12 13 14 15 16 17 18
2015
2018
2025
Division for Textile Recycling
9

10
4 Textile Market Indicators
4.1 Fast Fashion
Feedback effects and explanatory correlation for the above calculated figures should be seen
in the context of the fast fashion phenomenon. This describes a business model in the textile
trade, in which fashion collections are constantly being changed and the time taken for the
newest catwalk designs to become mass-produced clothing on the shop floor is greatly re-
duced. Zara now introduces up to 24 new collections and H&M as many as 16 new collections
per year. According to Statista, approximately 4.7 billion pieces of clothing were turned over
in 2018 in Germany; this represents an increase of 183,700 individual items, compared to
2015.
Meanwhile, all large fast fashion retailers and textile discounters are ambitiously expanding.
For example, by the end of 2018 Germany‘s largest textile discounter, KiK, registered an an-
nual turnover of almost € 1.45 billion in its 2,607 branches; compared to the financial year
2015, this represents an increase in turnover of € 70 million (5.1 %) and an increase in the
number of branches by 66 throughout Germany. According to Primark’s annual financial re-
port last year, their total turnover was almost £ 7.48 billion Europe-wide. Unfortunately, their
annual financial report does not include any figures that explicitly refer to turnover on the
German market. The specialist magazine Textilwirtschaft (Textile Economy) estimates that
Primark’s turnover on the German market was € 776 in 2015 and € 800 in 2018. Worthy of
note is that from the 16 new branches opened Europe-wide during 2018, 5 of them alone
were located in Germany, which in total represents a sum of 27 branches in Germany for the
financial year 2017/2018. Especially as the first store was only opened in 2009 in Bremen, this
reveals a very rapid development on the German domestic market. As far as H&M is con-
cerned, a slight reduction in gross turnover on the German market is shown, from 36.94 billion
SEK in 2015 down to 36.79 billion SEK in 2017, whereby during the same period an increase in
the number of branches from 449 to 463 is shown. Noteworthy is the fact that in comparison
with their international market, H&M turned over their largest sales volume on the German
market - in 2017 their turnover on the German market was larger than their turnover on the
French, Spanish and UK markets combined, where an aggregate gross revenue of € 36.38 bil-
lion was generated. Unfortunately, Inditex S.A., the parent company of Zara, Pull&Bear etc.,
also provides no explicit figures for the German market. Their nett turnover increase Europe-
wide is stated at € 3.1 billion between 2015 and 2018. TextilWirtschaft estimates that turno-
ver on the German market was € 781 million in 2015 and € 1 billion in 2018.
Division for Textile Recycling
10

11
In view of the general increase in turnover volume and branch numbers occasional sales
slumps can be disregarded, especially as financial indicators are influenced by other factors,
such as exchange rates; however, a detailed analysis of these factors is beyond the scope of
this study. The turnover values serve to present and order the markets with regard to dimen-
sion and relation to one another. The highly competitive market and the presence of low sales
prices, in general, allow conclusions to be drawn concerning the quality of the products. Re-
sults from a survey of members support the supposition that the declining quality of collected
goods can be attributed, in particular, to the increasing numbers of fast fashion suppliers and
textile discounters on the market. This also correlates with an increasing use of chemical fi-
bres.
These key figures can be compared to private household consumer spending for clothing and
shoes in Germany. It is important to point out that higher expenditure does not necessarily
correspond to an increase in purchased quantities, as typically higher expenditure can also
point to higher inflation rates, where consumers spend more money for the same quantities.
In addition, the increase in absolute consumer spending and the increase in consumer spend-
ing per inhabitant per year could also be explained by increased expenditure on more expen-
sive products of higher quality. However, this is in contradiction to the increasing market
share by fast fashion and cheap textile suppliers in the textile sector, especially as favourable
purchasing prices for the end consumer lead to considerably more incentive to buy in the
lower price segments. Furthermore, these assumptions are supported through analysis of the
above mentioned figures.
Consumer expenditure per inhabitant per year
€854,15 €941,63
€0
€100
€200
€300
€400
€500
€600
€700
€800
€900
€1.000
2015 2018
Division for Textile Recycling
11
12
Fast fashion is associated with a chain of causative problems, which are mutually attributed
to the other market participants. For example, producers and retailers are always quick to
point out consumer demand, whereas others are quick to point out the use of perfidious ad-
vertising strategies to create artificial incentive to buy. A survey carried out amongst well-
known international textile concerns, such as H&M, Kering, Target, amongst others, revealed
that consumers carry the largest responsibility for more sustainability in the textile industry,
before shareholders, legislators, NGOs, governments and other organisations with influence.
In reverse, this implies that consumers make a major contribution towards respective produc-
tion conditions. Notwithstanding a clarification of cause for fast fashion, this phenomenon
must therefore be seen as a nexus between structures and functional logic of production,
turnover and consumption.
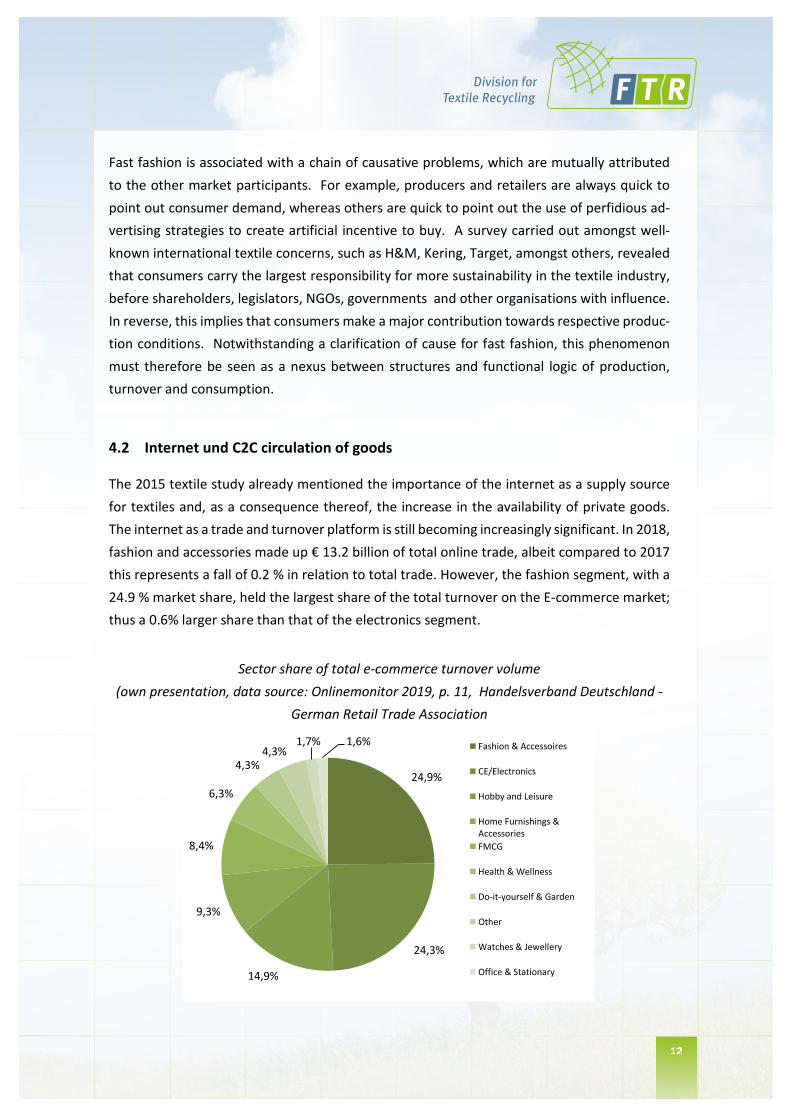
4.2 Internet und C2C circulation of goods
The 2015 textile study already mentioned the importance of the internet as a supply source
for textiles and, as a consequence thereof, the increase in the availability of private goods.
The internet as a trade and turnover platform is still becoming increasingly significant. In 2018,
fashion and accessories made up € 13.2 billion of total online trade, albeit compared to 2017
this represents a fall of 0.2 % in relation to total trade. However, the fashion segment, with a
24.9 % market share, held the largest share of the total turnover on the E-commerce market;
thus a 0.6% larger share than that of the electronics segment.
Sector share of total e-commerce turnover volume
(own presentation, data source: Onlinemonitor 2019, p. 11, Handelsverband Deutschland -
German Retail Trade Association
24,9%
24,3%
14,9%
9,3%
8,4%
6,3%
4,3%4,3%
1,7% 1,6% Fashion & Accessoires
CE/Electronics
Hobby and Leisure
Home Furnishings &Accessories
FMCG
Health & Wellness
Do-it-yourself & Garden
Other
Watches & Jewellery
Office & Stationary
Division for Textile Recycling
12

13
As far as the textile recycling sector Is concerned, not only are fast fashion, the increase in e-
commerce and the associated increase in quantities problematic, but also the general trend
towards the skimming off of higher quality textiles before collection, which has come about
by the changes in merchandise circulation. C2C business models have now established them-
selves with a wide degree of consumer acceptance; so that, consumers now have the oppor-
tunity to pass on their no longer needed textiles in a more sustainable and lucrative manner,
compared to simple disposal thereof. As such, this business model is in line with the aspira-
tions of the KrWG. However, the textile recycling of used textile quantities needs to be con-
sidered in its entirety, as although the quantity of private goods sold on is only a small per-
centage of the total, when seen as a value percentage this amount is not insignificant. Fur-
thermore, it is of great economic significance for the textile recycling industry, as the relatively
high proceeds from the higher quality textiles are fundamental to cross-subsidisation within
the sector.
When these high-quality quantities are no longer present in the total quantities of the origi-
nal collected textiles, the cost of handling lower quality goods becomes in effect more ex-
pensive, as subsidisation through higher quality goods is lacking; in effect with the absence
of higher quality goods the whole handling process of used textiles for recycling becomes
more difficult. In association with the fact that the quality of the collected textiles is gener-
ally now more inferior due to the issues explained previously, a multi-dimensional worsening
of quality can be spoken of. With regard to the above mentioned interdependencies, the up
until now gratuitous recycling of high quality textiles is particularly affected. On the one
hand, these issues have to be accepted as the status quo for textile recycling. On the other,
performance limits of the recycling economy should always be viewed in the light of the
origin of the issue and the causative interdependencies thereof. It is obvious, that practical
recycling concepts can only make sense if they take these causative factors into account in
their implementation. Fast fashion, the internet trading platform and the increasing pres-
ence of C2C circulation of used textiles are negatively impacting the already difficult market
situation.
Division for Textile Recycling
13

14
5 Sector Indicators
5.1 Quality
In 2015, quality development was still varied; whereas half of the businesses asked reported
that quality had remained stable, the other half reported a decline in quality. A similar split
was forecast for quality development in the following year. However, in the 2019 survey
87 % of the participating bvse member companies reported an average decline in quality of
approximately 15.6 % since 2012; only 13 % of the participants reported that the quality had
remained unchanged. The decline was attributed to the increased percentage of ruined and
inferior quality textiles as well as increased quantities of textile waste, and an increased pres-
ence of contaminants and/or impurities therein. According to the participating companies in-
volved in the collection of used textiles, the latter made up 10.8 %, of the total collected quan-
tities. As manual evaluation of containers concentrates on the sorting out of contaminants
and impurities, further textile waste can only be expected when sorting commences.
The proportion of waste textiles that can no longer be marketed, encountered both at the
collection and sorting stage, is becoming increasingly problematic during high-quality sorting.
From the middle of 2016 onwards, retailers have been obligated to charge consumers for plas-
tic bags and, according to EUWID, since this came into force considerably more loose textiles
are found in the clothing and textile recycling banks, thus increasing the risk of cross-contam-
ination. Consequently, collectors can expect increasing amounts of non-recyclable waste at
the point of collection and, according to bvse member companies, disposal costs therefor of
up to € 200 per tonne and in some regions even up to € 300 per tonne. The plastic bags that
do actually land in the disposal bins/banks can now only be disposed of at a cost or sometimes
cannot be marketed at all, so that storage capacity is negatively affected. The situation is fur-
ther exacerbated by continuing difficulties concerning the marketability of different types of
recycling in general. In addition, shortcomings in collection methods lead to further loss in
quality and, at times, higher waste ratios per collection. Through the use of unsuitable collec-
tion systems, such as bottom-hinged containers, personnel costs may be reduced, albeit at
the cost of depreciation in value of the collected textiles due to system-related increased con-
tamination of used textiles. Textile sorters are being forced to come to terms with ever-in-
creasing quantities of inferior quality textiles. Moreover, yet a further increase in waste quan-
tities is plausible, which will cause the same problems for both the collection and sorting of
textiles. Admittedly, the price for collected used textiles remained more or less stable be-
tween 2015 and 2017; however, a drastic fall in prices has been observed since 2018.
Division for Textile Recycling
14

15
Price range developments for original collected textiles (in cent/kg)
in Germany 2015 -2019
This puts pressure on both the collecting and sorting segments, as in order to successfully and
economically market textiles, the above-mentioned high-quality share is vital in both the orig-
inal collected textiles and in the sorted textiles. As a result of the reduction in high-quality
textiles in the ever-increasing absolute amount, doubt is now being cast on the cross-subsidi-
sation model for used textiles, per se. This problem is not only apparent in the reuse segment;
this is also made clear by the changing ratios and amounts in various other available recycling
options.
Jan Mar May Jul Sep Nov Jan Mar May Jul Sep Nov Jan Mar May Jul Sep Nov Jan Mar May Jul Sep Nov Jan Mar May Jul Sep Nov
2015 2016 2017 2018 2019
Max. 35 35 35 35 35 35 35 35 38 38 38 38 34 34 36 37 37 36 35 36 35 34 33 32 30 29 28 28 26 26
Min 25 25 25 25 25 25 25 25 27 27 27 27 25 25 26 26 26 25 25 25 25 25 24 23 22 22 20 20 20 20
18
20
22
24
26
28
30
32
34
36
38
40
Ct/
kg
Division for Textile Recycling
15

16
5.2 Recycling Options
As early as 2015 an increase in the proportion of reused textiles was observed and this positive
trend continues. In comparison with the figures from the 2015 textile study, the reuse of used
textiles increased by 8 % to 810,000 tonnes, representing 62 % of total collection quantities.
This can, without doubt, be attributed to recycling expertise, as the development of the reuse
ratio is contrary to the general trend of a decline in quality of textile products. Recycling com-
panies are being forced to generate the highest possible return from the collected textiles
available. However, this can only be achieved by increasing specialisation and manual sorting
expenditure. This, in the end, results in a zero-sum situation, as larger quantities generating
lower margins have to be sorted. This in turn necessitates that the highest possible quantities
are directed towards reuse, as herein lies the largest economic potential.
In contrast, the proportion of downcycled or upcycled textiles fell by 7 % to the present level
of 14 % of the total quantity. The recycling quota has fallen by 20 %, a 3 % reduction on the
2015 figures. Here, the discrepancy between the decrease of 5 % in secondary (material) re-
cycling and the increase of 2 % in thermic (tertiary) recycling is particularly noticeable. The
increase in thermic recycling can be partially explained by the increase in the energy value
created by the increased use of mainly mineral oil based chemical fibres and by the increase
in the ratio of textiles not suitable for further processing, which is coherent with the general
reduction in quality, as mentioned above. However, the increase in thermic recycling could
also be explained by the fact that material recycling has become increasing difficult and thus
less lucrative. According to the participants asked in the 2018 textile study, material recycling
made up only 12 % of the recycled textiles. However, as material recycling is seen as the basis
for recycled fibres, this development must be viewed with concern; whereas, according to the
2015 study, material recycling made up 21 % of the actual collected quantities, that is 172,000
tonnes, by 2018 this was down to almost 157,000 tonnes.
The percentage of waste to be disposed of during sorting has doubled since 2015 and now
represents 4 % of the total amount. In absolute quantities this means almost 52,000 tonnes,
whereas in 2015 only 20,000 tonnes were registered; thus, absolute quantities have more
than doubled. In addition, there is the marked increase in the proportion of contaminants and
impurities extracted at the time of container emptying, these quantities also need to be added
to the actual collection quantities, as this relates explicitly to non-textile materials which have
to be disposed of by the recycling companies at their own expense and as such compromise
the added net value.
Division for Textile Recycling
16

17
Admittedly, the reuse ratio has increased, however this increase does not correspond with a
higher net added value. On the contrary, as explained above, this increase is directly linked to
falling margins as a result of inferior quality textiles and the increase in the recycling costs
thereof. Alongside the above-mentioned factors, there is also the cost for disposal of the in-
creased proportion of textiles that are no longer directly marketable which also need to be
subsidised and covered.
62%14%
12%
8%4%
2018
54%
21%
17%
6%
2%
2013
Reuse
downcycling / upcycling
Secondary recycling(material)
Tertiary recycling(SF/thermic)
Waste for disposal
Division for Textile Recycling
17

18
6 Conclusion
Since the 2015 bvse textile study, the general market situation along the whole high-quality
recycling chain has worsened. The entrance of public waste management authorities into used
textile collections did not have the desired effects, such as a stabilisation or even reduction of
waste collection charges. Illegal market participants are increasingly withdrawing from the
market, presumably as a result of price inflation. Control and quantification of illegal trading
through law enforcement is still complicated, as ongoing workload issues in the responsible
administrative bodies are impeding enforcement. Particularly precarious for the economic
functional ability of the recycling sector is the increasing market share of textiles from fast
fashion suppliers and textile discounters; the associated increased consumption and disposal
behaviour of the population; the skimming off of the relevant high-quality goods through the
passing on or sale of used textiles by private individuals/companies and, from the sum of the
above, the resulting increase in overall collection quantities, especially those of inferior qual-
ity.
Meanwhile, the increasingly difficult framework conditions are revealing problematic situa-
tions that necessitate consideration from the perspective of society as a whole. Consequently,
it is necessary that stakeholders throughout society develop a comprehensive understanding
of the issues involved. It follows that responsibilities in relation to the problems concerning
refuse and waste will need to be assigned, provided that they do not develop within the func-
tional logic of the free market and, unfortunately, the current picture reveals this to be the
case. However, when doing so, it is important that the pressure is not increased on the pro-
fessional already-established recycling structures, but rather is directed towards those at the
root of these issues.
Furthermore, it must be ensured that preconditions are achieved which, in the light of the
current forecasts on market development, will enable high-quality textile recycling in Ger-
many in the future. In the first instance, the main focus must be the reuse of textiles, according
to the waste hierarchy set out in the KrWG. The proportion of reused textiles in this closed
loop cycle will be dependent on the quality and quantity of the collected textiles. The end-of-
life scenario for consumer products must also be taken into account, as it will remain an inte-
gral part of the recycling environment for the foreseeable future, despite attempts made to
make it obsolete by the implementation of a cradle-to-cradle approach. As it is, real closed
loop cycles for textile products should be understood more as a perspective, rather than a
near term market-ready option, especially in the light of the different types of fibres being
used and the recycling potential thereof. Indeed, the increasing use of chemical fibres, as op-
posed to the more traditional natural fibres (e.g. cotton), theoretically brings with it a larger
recycling potential after end-of-use; practically, however, the technical means for efficient fi-
bre recovery are still lacking, especially on a large industrial scale. Even now, the already ex-
isting requirements cannot be met, so that theoretically recycling capacities are not yet being
Division for Textile Recycling
18

19
used to their full potential. Furthermore, due to the more complex production and/or recov-
ery process of recycled fibres, they are usually more cost intensive than traditionally produced
fibres, which are often the preferred choice in production for this reason. By contrast, thermic
recycling can and should only be understood, at most, as the last resort.
Exactly because of and especially with regard to resource conservation and energy efficiency,
high-quality textile recycling is highly significant. However, the political demands to increase
these two factors and the incentives offered for doing so must be coupled with the political
responsibility to ensure compliance with a sustainable economic model. In this respect the
demands set out in the KrWG (§33, paragraph 3, sentence 1, point 1) are extremely question-
able, as it is not clear how economic growth can be de-coupled from the presented waste
agreement when the reuse of textile products is becoming increasingly more difficult, and as
far as quantity developments are concerned, the recovery methods for recyclable material
cannot be considered market-ready and/or financially viable, at least for the short and middle
term. The existing functional interlacing of caritative, municipal and private recycling service
providers must be conserved in its present form, as it fundamentally contributes to adherence
to the waste hierarchy laid out in the KrWG. However, for this to function as such, protection
of the already fragile and crisis-susceptible market is vital, rather than the opening-up thereof.
In the light of the ascertained figures, it is already questionable as to how long high-quality
textile recycling in general will remain feasible in Germany. Therefore, as a sign for the self-
conception of our consumer society before the back drop of ubiquitous slogans, such as the
climate crisis, a rejection of the existing model for the reuse of used textiles is neither worthy
of support nor credibly justifiable.
All considered, a conflicting situation dependent on a number of factors and circumstances de
facto exists, which when viewed from both an ecologic and economic perspective can only be
described as problematic. This too makes the continued existence of high-quality textile recy-
cling absolutely essential, in view of the ambitions set out in the KrWG.
Division for Textile Recycling
19

20
List of references
Literature sources
§ 1 Abs. 2 Satz 1 MiLoG in the version of 11.08.2014 (BGBl I 2014, S. 1348)
§ 1 Abs. 2 Satz 2 MiLoG in conjunction with §1 MiLoV vom 15.11.2016 (BGBl I 2016, S. 2530)
§ 1 Abs. 2 Satz 2 MiLoG in conjunction with §1 Satz 1 a) MiLoV2 vom 13.11.2018 (BGBl I 2018,
S. 1876)
§ 1 Abs. 2 Satz 2 MiLoG in conjunction with §1 Satz 1 b) MiLoV2 vom 13.11.2018 (BGBl I 2018,
S. 1876)
Amann, Susanne/Nezik, Ann-Kathrin: „Billig ist nicht gleich böse“. Spiegel-Gespräch mit Pri-
mark Nordeuropa-Chef Wolfgang Krogmann. In: Spiegel Ausgabe 33/2015; Hamburg 2015, S.
66-70.
Associated British Foods plc (Hrsg.): Annual Reports and Accounts 2009; London 2009.
Associated British Foods plc (Hrsg.): Annual Reports and Accounts 2018; London 2018.
Bundesministerium der Finanzen (Hrsg.): Datensammlung zur Steuerpolitik 2018; Berlin 2018.
Cobbing, Madeleine/Vicaire, Yannick: Konsumkollaps durch Fast Fashion. Hrsg. von Green-
peace e.V. Deutschland; Hamburg 2017.
Cobbing, Madeleine/Vicaire, Yannick: Fashion at the Crossroads. Hrsg. von Greenpeace e.V.
Deutschland; Hamburg 2017.
EUWID Europäischer Wirtschaftsdienst GmbH (Hrsg.): Marktbericht für Alttextilien; Gernsbach
2015-2019.
Global Fashion Agenda/The Boston Consulting Group (Hrsg.): Pulse of the Fashion Industry;
Boston u.a. 2017.
Gu, Yinan: Textilrecycling in Deutschland; Aachen 2008.
Division for Textile Recycling
20
21
H & M Hennes & Mauritz AB (Hrsg.): H&M Group Annual Report 2015; Stockholm 2015.
H & M Hennes & Mauritz AB (Hrsg.): H&M Group Annual Report 2018; Stockholm 2018.
Handelsverband Deutschland (Hrsg.): Onlinemonitor 2019; Berlin 2019.
Inditex S.A. (Hrsg.): Annual Report 2018; Arteixo 2019.
Korolkow, Julia: Konsum, Bedarf und Wiederverwendung von Textilien in Deutschland. Hrsg.
von bvse - Bundesverband Sekundärrohstoffe und Entsorgung e.V.; Bonn 2015.
KrWG vom 24. Februar 2012 (BGBl. I, S. 212), das zuletzt durch Art. 2 Abs. 9 des Gesetzes vom
20. Juli 2017 (BGBl. I, S. 2808) geändert worden ist.
Lindstrom, Martin: Brandwashed: Was du kaufst, bestimmen die anderen; Frankfurt/M. u.a.
2012.
Lindstrom, Martin: Buyology: Warum wir kaufen, was wir kaufen; Frankfurt/M. u.a. 2009.
Remy, Nathalie/Speelman, Eveline/Swartz, Steven: Style that’s sustainable: A new fast-fashion
formula. Hrsg. von McKinsey&Company; Paris u.a. 2016.
Statistisches Bundesamt (Hrsg.): Produzierendes Gewerbe. Produktion des Verarbeitenden Ge-
werbes sowie des Bergbaus und der Gewinnung von Steinen und Erden - Fachserie 4 Reihe 3.1;
Wiesbaden 2016/2019.
Statistisches Bundesamt (Hrsg.): Tourismus. Tourismus in Zahlen 2017; Wiesbaden 2018.
Statistisches Bundesamt (Hrsg.): Verkehr. Luftverkehr auf allen Flugplätzen 2015-2018 - Fach-
serie 8 Reihe 6.2; Wiesbaden 2016-2019.
Statistisches Bundesamt (Hrsg.): Volkswirtschaftliche Gesamtrechnungen. Inlandsproduktbe-
rechnung - Detaillierte Jahresergebnisse 2018 - Fachserie 18 Reihe 1.4; Wiesbaden 2019.
Unternehmensgruppe Tengelmann (Hrsg.): Folgerichtig. Bericht über das 152. Geschäftsjahr;
Mülheim/Ruhr 2018.
Unternehmensgruppe Tengelmann (Hrsg.): Weichenstellungen. Bericht über das 149. Ge-
schäftsjahr; Mülheim/Ruhr 2015.
Division for Textile Recycling
21

22
Internet sources
Abfallbilanzen der Bundesländer.
1) Baden-Württemberg, visit website:
https://www.statistik-bw.de/Umwelt/Abfall/
2) Bayern, visit website:
https://www.lfu.bayern.de/abfall/abfallbilanz/index.htm
3) Berlin, visit website:
https://www.berlin.de/senuvk/umwelt/abfall/bilanzen/de/archiv.shtml
4) Brandenburg, visit website:
https://mluk.brandenburg.de/mluk/de/start/ueber-uns/presse-und-oeffentlichkeitsar-
beit/veroeffentlichungen/detail/~01-11-2019-abfallbilanzen-der-oeffentlich-rechtlichen-ent-
sorgungstraeger
5) Bremen, visit website:
https://www.die-bremerstadtreinigung.de/detail.php?template=20_search_d&search%5 B
send%5D=true& lang=de&search%5Bvt%5D=Abfallbilanz
6) Hamburg, visit website:
https://www.hamburg.de/recycling/4793242/statistik-siedlungsabfaelle/
7) Hessen, visit website:
https://umwelt.hessen.de/umwelt-natur/kreislauf-abfallwirtschaft/abfallmengenbilanz
8) Mecklenburg-Vorpommern, visit website:
https://www.lung.mv-regierung.de/insite/cms/umwelt/abfall/info_abfall/dza_2002.htm
9) Niedersachsen, visit website:
https://www.umwelt.niedersachsen.de/themen/abfall/bilanzen_plaene/abfallbilanzen/nie-
dersaechsische-abfallbilanzen-94725.html
10) Nordrhein-Westfalen, visit website:
https://www.umwelt.nrw.de/umwelt/umwelt-und-ressourcenschutz/abfall-und-kreislauf-
wirtschaft/siedlungsabfaelle/
Division for Textile Recycling
22

23
11) Rheinland-Pfalz, visit website:
https://mueef.rlp.de/de/themen/klima-und-ressourcenschutz/kreislaufwirtschaft/abfallbi-
lanzen/
12) Saarland, visit website:
https://www.saarland.de/6874.htm
13) Sachsen, visit website:
https://www.wertstoffe.sachsen.de/aufkommen-von-siedlungsabfallen-9884.html
14) Sachsen-Anhalt, visit website:
https://mule.sachsen-anhalt.de/umwelt/abfall/bilanzen-plaene/#c82887
15) Schleswig-Holstein, visit website:
https://www.schleswig-hol-
stein.de/DE/Fachinhalte/A/abfallwirtschaft/siedlungsabfallbilanz.html
16) Thüringen, visit website:
https://umwelt.thueringen.de/themen/kreislauf-u-abfallwirtschaft/
Absatz von Bekleidungsstücken in Deutschland
visit website:
https://de-statista-com.wwwdb.dbod.de/outlook/90000000/137/bekleidung/deutschland
Anschaffung von Bekleidungstextilien.
visit website:
https://www.bmu.de/themen/wirtschaft-produkte-ressourcen-tourismus/produkte-und-
konsum/produktbereiche/mode-und-textilien/
Aus- und Einfuhr (Außenhandel): Deutschland, Jahre, Warenverzeichnis (8-Steller), Code
51000-0013.
visit website:
https://www-genesis.destatis.de/genesis/online
Bekleidungs-und Textilimporte nach Einfuhrwert:
https://de-statista-com.wwwdb.dbod.de/statistik/daten/studie/1859/umfrage/deutschlands
-textilimporte-nach-herkunftslaendern/
Division for Textile Recycling
23

24
Bevölkerung: Deutschland, Stichtag; Code 12411-0001:
https://www-genesis.destatis.de/genesis/online
C2C-Nutzungsanteile der Gesamtbevölkerung in Deutschland 2008-2018.
visit website:
https://ec.europa.eu/eurostat/tgm/table.do?tab=table&init=1&plugin=1&langu-
age=de&pcode=tin00098
Informationen zu Cradle-to-Cradle.
visit website:
https://c2c-ev.de/c2c-konzept/kreislaeufe/
Definition zu Fast Fashion.
visit website:
https://de.wikipedia.org/wiki/Fast_Fashion
Einführung einer Pauschale für Plastiktüten im Einzelhandel.
visit website:
https://www.bundesregierung.de/breg-de/aktuelles/plastiktueten-ab-juli-kostenpflichtig-
474674
Branchenmindestlohn Abfallwirtschaft 2014-2020:
https://www.euwid-recycling.de/news/wirtschaft/einzelansicht/Artikel/mindestlohn-fuer-
abfallwirtschaft-soll-wiederbelebt-werden.html
Peter Altmaiers Plädoyer zu mehr Wirtschaftswachstum angesichts gedämpfter Konjunk-
turerwartungen.
visit website:
https://www.merkur.de/wirtschaft/altmaier-erwartet-fuer-2019-moderates-wirtschafts-
wachstum-zr-12975287.html
Umsatzanteil des eCommerce im Einzelhandel in Deutschland in den Jahren 2005 bis 2017.
visit website:
https://de-statista-com.wwwdb.dbod.de/statistik/daten/studie/261395/umfrage/umsatzan-
teil-des-ecommerce -im-einzelhandel-in-deutschland/
Division for Textile Recycling
24

25
TextilWirtschaft (Hrsg.): Die größten Modehändler in Deutschland 2016.
visit website:
https://www.textilwirtschaft.de/news/media/10/Rangliste-2016-95371.pdf
TextilWirtschaft (Hrsg.): Die größten Bekleidungseinzelhändler in Deutschland 2018.
visit website:
https://www.textilwirtschaft.de/news/media/16/Rangliste-2018-158962.pdf
Statistik zur Produktion von verschiedenen Textilfaserarten von 1965 bis 2015.
visit website:
https://www.cirfs.org/statistics/key-statistics/world-production-fibre
Vorausberechneter Bevölkerungsstand: Deutschland, Stichtag, Varianten der Bevölkerungs-
vorausberechnung, Code 12421-0001.
visit website:
https://www-genesis.destatis.de/genesis/online
All internet sources were last accessed on January 13, 2020.
Division for Textile Recycling
25

UMBRELLA ORGANISATION OF THE RECYCLING AND WASTE MANAGEMENT INDUSTRY
Fränkische Straße 2 · 53229 Bonn · Germany · Phone +49 228 98849-0 Fax +49 228 98849-99 · [email protected] · www.bvse.de