Study and Implementation of Total Productive Maintenance ... · The techniques of 5S, Poka yoke,...
7
Study and Implementation of Total Productive Maintenance in Turbocharger Plant Chandrashekar G 1 , Dr. N. V. R. Naidu 2 1 Student, M. Tech, Department of Industrial Engineering and Management 2 Vice Principal, 2 Professor & Head, Department of Mechanical Engineering, 2 Professor, Department of Industrial Engineering and Management 1,2 M. S. Ramaiah Institute of Technology, Bangalore-560054, India. Abstract – Production System has undergone the major changes in recent years. In the highly competitive environment, to be successful and to achieve world class manufacturing, organizations must possess both effective maintenance and efficient manufacturing strategies. Overall Equipment Effectiveness (OEE) quantifies how well a manufacturing unit performs relative to its designed capacity, during the periods when it is scheduled to run. The data and the behavior of the machines in the cell were analysed and the bottleneck points were identified. The Overall Equipment Effectiveness (OEE) of NU-600 turning centre, MGT-50 turning centre and S-66 milling centre was found to be 60%, 43% and 65% respectively from the data collected in the month of December 2013, January and February 2014. The techniques of 5S, Poka yoke, Preventive Maintenance and Kaizen which are elements of Total Productive Maintenance are applied effectively on the machines in the cell. The result obtained from the TPM approach showed that the Overall Equipment Effectiveness (OEE) of NU – 600 turning centre, MGT – 50 turning centre and S – 66 milling centre are increased to 71.95%, 69.55% and 75.05% respectively. To sum up, there was an increase in income of Rs.353 per hour from the cell due to effective implementation of TPM technique. Key Words -- Overall Equipment Effectiveness (OEE); Total Productive Maintenance (TPM); Kaizen; Poka yoke; 5S. I. INTRODUCTION The study is focusing on the machining process of shaft before it is assembled with the turbowheel through auto assembly process. The shafts with two different diameters are machined in the plant that is 50.mm and 60.mm for turbocharger. The tools and products are to be changed frequently due to which the setup time is getting larger. There are five machines in the cell and the turbo shaft machining process is described as follows. NU – 600 turning centre is performing the operations of Turning, Taper turning and facing on one side of the shaft where turbo wheel is assembled. MGT – 50 turning centre is performing Threading on other side where compressor wheel is assembled. The end milling and peripheral milling is performed on the S – 66 milling centre. The holes on the shaft to place the fasteners are drilled using conventional drilling machine. The burrs on the surface of the shaft are finally removed by deburring machine. II. PROBLEM STATEMENT The data collected for the 3.months period of December 2013, January 2014 and February 2014 revealed that the Overall Equipment Effectiveness (OEE) value of the machines in the cell are 60%, 43%, 66% which are very low compared to the general manufacturing scenario(OEE – 85%). Due to the low OEE, the machines are not effectively utilized. Hence the production is affected and in turn not able to reach the requirements of customer. Figure 2.1 OEE of the machines from data collected for 3.months The bar chart in the figure 2.1 clearly represents the OEE values of the machines for the data collected for 3.months of December 2013, January 2014 and February 2014. The NU-600 turning centre has OEE value of around 60%, MGT-50 turning centre has OEE value of around 43% and S-66 milling centre has OEE value of around 66%. The world class performance of machines has the OEE value of 85% which is far away from any of the machines in the cell. The project focuses on improving the 0 50 100 Dec/13 Jan/14 Feb/14 % of OEE Dec/13 Jan/14 Feb/14 NU 600 59.355 60.195 60.555 MGT-50 42 42.395 45.955 S-66 66 66.5 66 Vol. 3 Issue 6, June - 2014 International Journal of Engineering Research & Technology (IJERT) ISSN: 2278-0181 www.ijert.org IJERTV3IS060941 International Journal of Engineering Research & Technology (IJERT) 776
Transcript of Study and Implementation of Total Productive Maintenance ... · The techniques of 5S, Poka yoke,...

Study and Implementation of Total Productive
Maintenance in Turbocharger Plant
Chandrashekar G1, Dr. N. V. R. Naidu
2
1Student, M. Tech, Department of Industrial Engineering and Management
2Vice Principal,
2Professor & Head, Department of Mechanical Engineering,
2Professor, Department of Industrial Engineering and Management
1,2 M. S. Ramaiah Institute of Technology, Bangalore-560054, India.
Abstract – Production System has undergone the major
changes in recent years. In the highly competitive
environment, to be successful and to achieve world class
manufacturing, organizations must possess both effective
maintenance and efficient manufacturing strategies. Overall
Equipment Effectiveness (OEE) quantifies how well a
manufacturing unit performs relative to its designed capacity,
during the periods when it is scheduled to run. The data and
the behavior of the machines in the cell were analysed and the
bottleneck points were identified. The Overall Equipment
Effectiveness (OEE) of NU-600 turning centre, MGT-50
turning centre and S-66 milling centre was found to be 60%,
43% and 65% respectively from the data collected in the
month of December 2013, January and February 2014.
The techniques of 5S, Poka yoke, Preventive Maintenance and
Kaizen which are elements of Total Productive Maintenance
are applied effectively on the machines in the cell. The result
obtained from the TPM approach showed that the Overall
Equipment Effectiveness (OEE) of NU – 600 turning centre,
MGT – 50 turning centre and S – 66 milling centre are
increased to 71.95%, 69.55% and 75.05% respectively. To
sum up, there was an increase in income of Rs.353 per hour
from the cell due to effective implementation of TPM
technique.
Key Words -- Overall Equipment Effectiveness (OEE);
Total Productive Maintenance (TPM); Kaizen; Poka
yoke; 5S.
I. INTRODUCTION
The study is focusing on the machining process of
shaft before it is assembled with the turbowheel through
auto assembly process. The shafts with two different
diameters are machined in the plant that is 50.mm and
60.mm for turbocharger. The tools and products are to be
changed frequently due to which the setup time is getting
larger.
There are five machines in the cell and the turbo shaft
machining process is described as follows. NU – 600
turning centre is performing the operations of Turning,
Taper turning and facing on one side of the shaft where
turbo wheel is assembled. MGT – 50 turning centre is
performing Threading on other side where compressor
wheel is assembled. The end milling and peripheral milling
is performed on the S – 66 milling centre. The holes on the
shaft to place the fasteners are drilled using conventional
drilling machine. The burrs on the surface of the shaft are
finally removed by deburring machine.
II. PROBLEM STATEMENT
The data collected for the 3.months period of
December 2013, January 2014 and February 2014 revealed
that the Overall Equipment Effectiveness (OEE) value of
the machines in the cell are 60%, 43%, 66% which are very
low compared to the general manufacturing scenario(OEE
– 85%). Due to the low OEE, the machines are not
effectively utilized. Hence the production is affected and in
turn not able to reach the requirements of customer.
Figure 2.1 OEE of the machines from data collected for 3.months
The bar chart in the figure 2.1 clearly represents the
OEE values of the machines for the data collected for
3.months of December 2013, January 2014 and February
2014. The NU-600 turning centre has OEE value of around
60%, MGT-50 turning centre has OEE value of around
43% and S-66 milling centre has OEE value of around
66%. The world class performance of machines has the
OEE value of 85% which is far away from any of the
machines in the cell. The project focuses on improving the
0
50
100
Dec/13 Jan/14 Feb/14
% o
f O
EE
Dec/13 Jan/14 Feb/14
NU 600 59.355 60.195 60.555
MGT-50 42 42.395 45.955
S-66 66 66.5 66
All dimensions are in mm
Vol. 3 Issue 6, June - 2014
International Journal of Engineering Research & Technology (IJERT)
IJERT
IJERT
ISSN: 2278-0181
www.ijert.orgIJERTV3IS060941
International Journal of Engineering Research & Technology (IJERT)
776

OEE of each machine to around 70%, which increases the
productivity and improves the delivery time.
A. Defining the problem
To study and implement the Total Productive
Maintenance (TPM) and 5S techniques in order to improve
the Overall Equipment Effectiveness (OEE) of the CNC
machining cell present in the turbocharger plant. [1]
describes the TPM as a Lean tool to optimize the
effectiveness of manufacturing equipment and tooling.
B. Objectives
1. To review the literature on TPM related activities
and case studies implemented in companies for
improving the productivity.
2. To find out the bottleneck machines in the cell.
3. To analyse the breakdown data and to identify the
critical components.
4. To form the TPM team to resolve the issues.
5. To turn around the bottleneck machines into the
model machines.
6. To standardize 5S activities in the cell.
7. To validate and report the TPM and 5S practices
performed.
III. METHODOLOGY
A. Data collection
The data for measuring the performance of the cell was
collected for the period of three months from December
2013 to February 2014 for all 3.shifts. The data pertaining
to breakdown, setup time, speed loss, minor stoppages,
scrap and rework rate were collected and analysed.
The project focuses on an improving the Overall
Equipment Effectiveness (OEE) of the machines as it is the
major concern for lower productions and loss of time and
money.
The breakdown details of the three machines for the month
of December 2013, January 2014 and February 2014 is as
shown in the figure 3.1.
The total breakdown time in minutes of each machine for
three months in total is given below:
NU-600 turning centre is 7159 minutes.
MGT-50 turning centre is 16255.minutes.
S-66 milling centre is 6115.minutes.
Figure 3.1 Break down data from data collected for 3. months
B. Setup details of 3.machines for a lot of 450 units.
The total setup time for NU- 600 turning centre, MGT
– 50 turning centre and S – 66 milling centre for machining
a lot of 450.units was found to be 185.minutes,
410.minutes and 155. minutes respectively as shown in the
figure 3.2. In all the machines second setup was taking
more time than first setup.
Figure 3.2 Setup details for the period of 3.months
Table 3.1 represents the parameters of OEE which are
critical and need to be focused on each machine in order to
increase the Effectiveness. The parameters which are
represented in colored blocks are to be focused in order to
bring the operations to the normal conditions.
Table 3.1 Comparison of critical parameters of 3.machines
Machine
Parameters to be focused (%)
Availabilit
y
Performanc
e
Quality OEE
NU – 600 84 75 96 60
MGT- 50 66 66 95 43
S – 66 86 77 96 65
0
2000
4000
6000
8000
Dec/13 Jan/14 Feb/14
Bre
akd
ow
n m
inu
tes
Dec/13 Jan/14 Feb/14
NU-600 2765 2489 1905
MGT-50 5975 6040 4245
S-66 2335 2185 1605
NU - 600 MGT -50 S - 66
1st setup 85 185 66
2nd setup 95 225 89
Total 175 410 155
0100200300400500
Tim
e in
min
ute
s
Vol. 3 Issue 6, June - 2014
International Journal of Engineering Research & Technology (IJERT)
IJERT
IJERT
ISSN: 2278-0181
www.ijert.orgIJERTV3IS060941
International Journal of Engineering Research & Technology (IJERT)
777

C. System Analysis through Simulation
Figure 3.3 Utilisation factor of different machines in the cell through
simulation
From the simulation Analysis of the system as shown
in the figure 3.3, it is clear that the MGT – 50 turning
centre is the bottleneck because of its high cycle time and
breakdowns. There is a queue of 2.parts on an average all
the time before MGT – 50 turning centre and waiting time
is around 7.minutes/part. We can conclude that MGT – 50
turning centre needs more focus and necessary actions to
be taken to bring it to the normal conditions.
D. Capacity and existing condition of cell
Figure 3.4 Process parameters of all machines in the cell
As it can be observed in the flow chart in figure 3.4,
the MGT – 50 turning centre is in the middle of the cell.
The parts processed from the NU_ 600 turning centre were
piled up before MGT- 50 as the cycle time of NU- 600 is
3.minutes and MGT – 50 is 4.minutes. Due to slow cycle
rate and breakdowns, the parts are not sufficiently passed
on to the next centre for processing and therefore causing
the stoppage of line. Thus, hindering the production and
reduces the effectiveness and efficiency of the line.
E. Implementation phase
Figure 3.5 Cause and Effect Diagram for low OEE of the machines
The figure 3.5 shows how the 4M – Man, Machine,
Material and Method are affecting the OEE of the machine.
The causes which are highlighted in the diagram are found
to be major causes from the analysis. The cleaning kit was
effectively used by each team and necessary cleaning
actions were taken to efficiently perform 5S activities and
to identify the abnormalities in and around the machines.
After the cleaning was completely performed on the
machines, the abnormalities identified and it was recorded
in a pareto for an observation and an analysis. It is
observed that around 80% of occurrences of abnormalities
are due to Coolant leakage, Chipping problems, Loosed
fasteners and screws, unwanted materials and dirt. [2] The
primary goal of the technique is to determine the root
cause of a defect or problem.
The checklist which involved daily activities such as
greasing chuck, checking the oil level, cleaning AC filter
etc. was provided so the machine was maintained after the
cleaning activity was performed and all the spare parts
were replaced and repaired. Few Kaizen approaches were
also performed in and around the cell. In Japan, the concept
of Kaizen is so deeply engrained in the minds of both
managers and workers that they often do not even realize
they are thinking Kaizen as a customer-driven strategy for
improvement [3].
1. To eliminate the extra setting by providing a rigid
clamping in the first setup
The idea was incorporated as the processing time was
more due to the second setting taking long time due to low
parameters. A revised process plan was made for single
setup with holding at the bigger ends of the parts so that the
pressure applied can be high and the cutting area could be
increased. The second setup causes the higher cycle time
due to low parameters specified in the process. The idea
was to eliminate the second setup as it could be done in the
first setup itself with some clamping alterations. The
setting time is reduced from 410.minutes to 90.minutes.
The above clamping modification helped in decreasing the
cycle time from an average of 4 minutes to around
3.3minutes.
Vol. 3 Issue 6, June - 2014
International Journal of Engineering Research & Technology (IJERT)
IJERT
IJERT
ISSN: 2278-0181
www.ijert.orgIJERTV3IS060941
International Journal of Engineering Research & Technology (IJERT)
778

F. Quality Approach
The quality aspect of the machine had no problems as
the quality was maintained at 95%. To improve the quality
level, the TPM team decided to implement Poka yoke on
all the three .machines of interest which would fool proof
the process. The team implemented poka yoke on each
centres which is discussed in common to all the three
machines.
Poka yoke - 1
Figure 3.6 Poka yoke modifications
Parts were placed with wrong orientation, which
caused the parts to fell down from the storage space and
become scraped. In order to avoid this, the TPM team
provided the side plate with the fixtures is as shown in the
figure 3.6 which blocks the space if the parts are placed
wrongly. It avoids the slipping of parts placed in the space
provided.
Poka yoke – 2
Pre machined parts length is not controlled, which
resulted in tool breakage while turning in MGT - 50
turning centre. This problem was occurred 6.times in
3.months. In order to avoid the tool breakage, the height
guage is placed next to the machine and was made part of
the inspection, where the operators had to inspect the piece
and if oversize parts are there, they must be machined to
required size and then turn it.
G. Improving OEE of NU– 600 turning centre and S- 66
milling centre
As we incorporated the tagging system for MGT- 50
machine, the tags were hanged to NU – 600 turning centre
and S- 66 milling centre similarly. The white tags and red
tags were hanged based on the normal techniques as done
in the MGT- 50 turning centre. All the data was recorded
and then analysed, action was taken to see that it was
rectified. The missing parts were replaced and the faulty
parts were repaired based on the tagging system. All the
steps are followed similar to that followed on MGT- 50
turning centre.
H. Design modifications in NU – 600 turning centre
Quick Change Jaw Concept Design
The traditional jaws were used initially and the
replacement time of the jaw is considerably high. Due to
the high number of part count, also trial and error
alignment of bolts and tightening and loosening the bolt
time was more. To avoid the trial and errors and to
eliminate the whole chuck replacement theory the new
quick change jaws were designed. And the jaws were
designed to accommodate both the products on to the
single chuck.
Earlier the operator had load two different chucks to
run both products due to the product geometry variation
and now the larger existing chuck is used and only the top
soft jaws are going to be changed. The figure 3.7 shows the
schematic arrangement of changeover process on turning
centers. The special jaws arrangement is shown in figure
3.8 for individual products which were designed to reduce
the Change Over Time.
Figure 3.7 Quick change jaw Concept
Figure 3.8 Quick change jaw Process
IV. RESULTS AND DISCUSSION
The results obtained by implementing the TPM
methods are explained step wise, the individual
improvements obtained are shown on the three parameters
separately.
A. Availability results
The major problems of coolant leakage and the chip
fall out due to which hydraulic motor was failing regularly
and the lead screw getting damaged frequently from the
chips accumulation was avoided. The above parts are
replaced immediately which reduced the breakdown by
3.hours per day. The breakdown details after the
implementation of TPM techniques are as shown in the
figure 4.1.
Plate provided
Vol. 3 Issue 6, June - 2014
International Journal of Engineering Research & Technology (IJERT)
IJERT
IJERT
ISSN: 2278-0181
www.ijert.orgIJERTV3IS060941
International Journal of Engineering Research & Technology (IJERT)
779
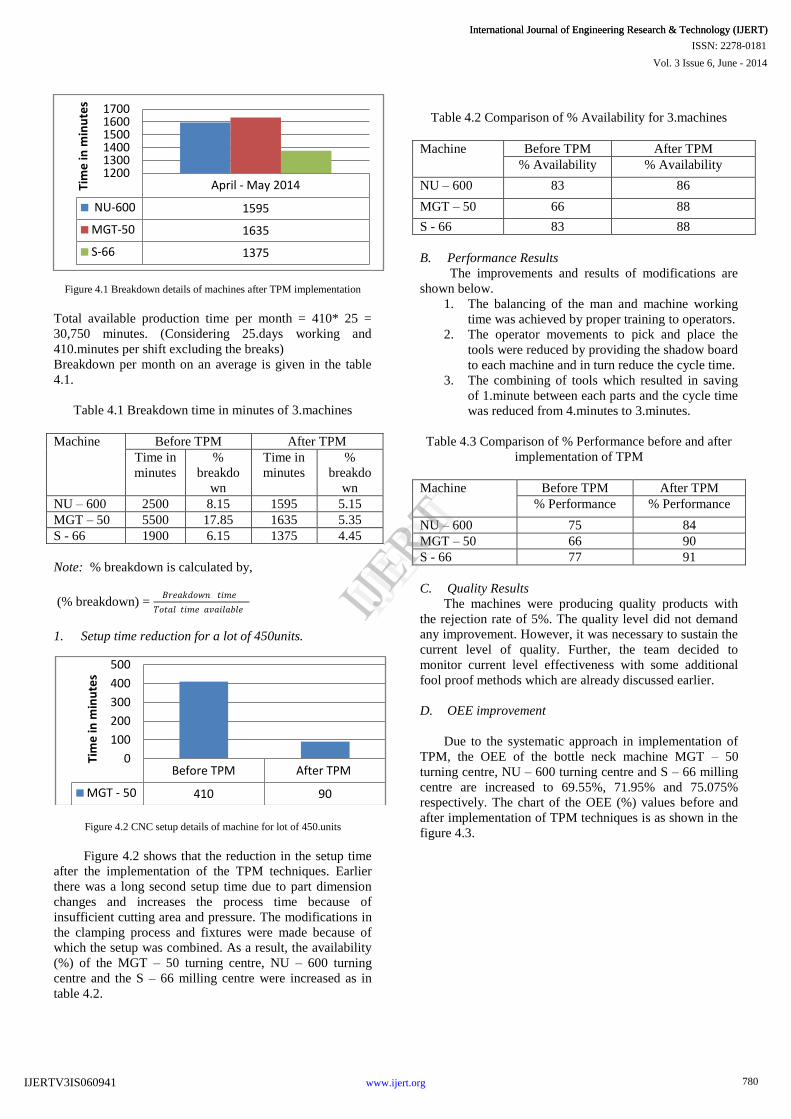
Figure 4.1 Breakdown details of machines after TPM implementation
Total available production time per month = 410* 25 =
30,750 minutes. (Considering 25.days working and
410.minutes per shift excluding the breaks)
Breakdown per month on an average is given in the table
4.1.
Table 4.1 Breakdown time in minutes of 3.machines
Machine Before TPM After TPM
Time in
minutes
%
breakdo
wn
Time in
minutes
%
breakdo
wn
NU – 600 2500 8.15 1595 5.15
MGT – 50 5500 17.85 1635 5.35
S - 66 1900 6.15 1375 4.45
Note: % breakdown is calculated by,
(% breakdown) = 𝐵𝑟𝑒𝑎𝑘𝑑𝑜𝑤𝑛 𝑡𝑖𝑚𝑒
𝑇𝑜𝑡𝑎𝑙 𝑡𝑖𝑚𝑒 𝑎𝑣𝑎𝑖𝑙𝑎𝑏𝑙𝑒
1. Setup time reduction for a lot of 450units.
Figure 4.2 CNC setup details of machine for lot of 450.units
Figure 4.2 shows that the reduction in the setup time
after the implementation of the TPM techniques. Earlier
there was a long second setup time due to part dimension
changes and increases the process time because of
insufficient cutting area and pressure. The modifications in
the clamping process and fixtures were made because of
which the setup was combined. As a result, the availability
(%) of the MGT – 50 turning centre, NU – 600 turning
centre and the S – 66 milling centre were increased as in
table 4.2.
Table 4.2 Comparison of % Availability for 3.machines
Machine Before TPM After TPM
% Availability % Availability
NU – 600 83 86
MGT – 50 66 88
S - 66 83 88
B. Performance Results
The improvements and results of modifications are
shown below.
1. The balancing of the man and machine working
time was achieved by proper training to operators.
2. The operator movements to pick and place the
tools were reduced by providing the shadow board
to each machine and in turn reduce the cycle time.
3. The combining of tools which resulted in saving
of 1.minute between each parts and the cycle time
was reduced from 4.minutes to 3.minutes.
Table 4.3 Comparison of % Performance before and after
implementation of TPM
Machine Before TPM After TPM
% Performance % Performance
NU – 600 75 84
MGT – 50 66 90
S - 66 77 91
C. Quality Results
The machines were producing quality products with
the rejection rate of 5%. The quality level did not demand
any improvement. However, it was necessary to sustain the
current level of quality. Further, the team decided to
monitor current level effectiveness with some additional
fool proof methods which are already discussed earlier.
D. OEE improvement
Due to the systematic approach in implementation of
TPM, the OEE of the bottle neck machine MGT – 50
turning centre, NU – 600 turning centre and S – 66 milling
centre are increased to 69.55%, 71.95% and 75.075%
respectively. The chart of the OEE (%) values before and
after implementation of TPM techniques is as shown in the
figure 4.3.
April - May 2014
NU-600 1595
MGT-50 1635
S-66 1375
120013001400150016001700
Tim
e in
min
ute
s
Before TPM After TPM
MGT - 50 410 90
0
100
200
300
400
500
Tim
e in
min
ute
s
Vol. 3 Issue 6, June - 2014
International Journal of Engineering Research & Technology (IJERT)
IJERT
IJERT
ISSN: 2278-0181
www.ijert.orgIJERTV3IS060941
International Journal of Engineering Research & Technology (IJERT)
780

Figure 4.3 OEE (%) before and after implementation of TPM techniques
E. Cost aspects
The income to the company relative to the increase in
the OEE of the machines in the cell is as shown in the table
4.4. Total increase in the income of Rs. 2825/ shift was
achieved due to the effective implementation of TPM
techniques in and around the cell.
Table 4.4 Comparison of income from the cell before and
after TPM implementation
Machines Income from the cell in Rs./shift Increase
in
income
in
Rs./shift
Before TPM
implementation
After TPM
implementation
NU – 600 2700 3250 550
MGT –
50
2900 4725 1825
S – 66 2925 3375 450
Total 8525 11350 2825
V. CONCLUSION
In general the focus of almost all the industries is on
downtime losses especially breakdowns. Many losses are
not targeted enough today i.e, planned downtime, cycle
time losses and minor stoppages. It is beneficial to change
the focus and use a comprehensive model of losses. In
order to utilize the OEE measure effectively, it must be
convincing and credible to production management. In
order to achieve the target performance, efficient
maintenance was installed in the workplace, Autonomous
maintenance teams were developed and the better
communication with team work was promoted. Efficient
data recording system was installed in order to provide the
upto date and accurate information to the management. The
increase in an income of Rs. 353 per hour was achieved
because of the effective implementation of the TPM and
the 5S techniques in the plant.
AKNOWLEDGMENT
The author wishes to express his gratitude towards Mr.
Nittala Srinivas and Mr. Venkata Ravisankar, XYZ
organisation, Bangalore for their constant help and
encouragement.
REFERENCES
[1] Dave Hoyte , “ Total Productive Maintenance Overview”,
Available from http://fisher.osu.edu/~ward_1/BM840/tpm.ppt,
2005. [2] Taiichi Ohno; foreword by Norman, “Toyota production system:
beyond large-scale production”., Portland, Or: Productivity Press.,
1988, ISBN 0-915299-14-3.
[3] Imai,M., “Kaizen :The key to Japan’s competitive success”,
McGraw Hill, 1986,USA,pp.xxix
NU -600
MGT -50
S - 66
OEE (%) Before TPM
60 43 65
OEE (%) After TPM
72 70 75
01020304050607080
OEE
in (
%)
Vol. 3 Issue 6, June - 2014
International Journal of Engineering Research & Technology (IJERT)
IJERT
IJERT
ISSN: 2278-0181
www.ijert.orgIJERTV3IS060941
International Journal of Engineering Research & Technology (IJERT)
781