STUDIES ON ULTRASONIC WELDING OF...
11
41 STUDIES ON ULTRASONIC WELDING OF POLYCARBONATE AND ACRYLONITRILE BUTADIENE STYRENE BLENDS Chinnadurai T. 1 , Arungalai Vendan S. 1 , Mohan Raj N. 2 , Prakash N. 3 1 School of Electrical Engineering (SELECT) VIT University, Vellore, India E-mail: [email protected] 2 Mechanical Engineering Shri Krishna College of Technology, Coimbatore 3 Department of Chemistry St. Martin’ s Engineering College, Dullapally, Secunderabad ABSTRACT Polycarbonate and arylonitrile butadiene styrene materials have several beneficial characteristics which facilitate their application in various industrial sectors. While developing products based on these polymers it is essential to enable the scope of its weld ability feature. Considering this critical factor, researchers are involved in investigating the weld ability behavior of the above mentioned polymers. This study reports an effective methodology developed to determine the optimum welding condition that maximizes the strength of joints produced by ultrasonic welding through the response surface method. A response surface methodology is employed to develop an effective model to predict the weld strength by incorporating process parameters such as pressure, weld time and amplitude. Experimental trials are conducted based on experiments design. An effective second order response surface model is developed based on the values measured. Subsequently, an analysis of the variances and inferences drawn from scanning electron microscope images are discussed. The research emphasizes that the pressure and welding time have a significant impact on the weld strength. Keywords: PC-ABS blend, ultrasonic plastic welding, a response surface method, a weld strength. Received 07 December 2015 Accepted 07 October 2016 Journal of Chemical Technology and Metallurgy, 52, 1, 2017, 41 - 51 INTRODUCTION The polymers have found enormous applications in domestic use, packaging, food and beverages, auto- motive industry and various other industrial purposes. Advanced, hybrid plastics and polymer blends are play- ing an important role in producing vehicles interior and exterior, body and structural components. Ultrasonic welding (USW) is a solid state welding process in which similar or dissimilar metallic components are joined by the application of high frequency vibrations under high pressure. The high frequency relative motion between the parts facilitates the solid progressive shearing and plastic deformation providing localized joining in a few seconds in absence of any significant amount of heat at the work pieces. One of the parts in ultrasonic welding has to be light as an excessive amount of energy is re- quired for the high frequency vibration. This in fact is a noticeable lacuna of the method and limits its applica- bility. Ultrasonic plastic welding plays a prominent role in the manufacturing of accessories used in automotive, aerospace, defense and electrical applications. There are several research studies pertaining to the mechanism of joint formation, the temperature distribution analysis at the weld interface, the joint strength, etc. Specific joint designs are the major concerns of USW process employment as high ultrasonic energy is focused at the welding interfaces. Furthermore, the welding parameters are highly coupled and show high sensitivity to toler- ances and clamping of the parts to be welded. Ultrasonic welding typically provides a low-energy bonding tech- nique as compared with the conventional process. Two
Transcript of STUDIES ON ULTRASONIC WELDING OF...

Chinnadurai T., Arungalai Vendan S., Mohan Raj N., Prakash N.
41
STUDIES ON ULTRASONIC WELDING OF POLYCARBONATE AND ACRYLONITRILE BUTADIENE STYRENE BLENDS
Chinnadurai T.1, Arungalai Vendan S.1, Mohan Raj N.2, Prakash N.3
1 School of Electrical Engineering (SELECT) VIT University, Vellore, India E-mail: [email protected] Mechanical Engineering Shri Krishna College of Technology, Coimbatore3 Department of Chemistry St. Martin’ s Engineering College, Dullapally, Secunderabad
ABSTRACT
Polycarbonate and arylonitrile butadiene styrene materials have several beneficial characteristics which facilitate their application in various industrial sectors. While developing products based on these polymers it is essential to enable the scope of its weld ability feature. Considering this critical factor, researchers are involved in investigating the weld ability behavior of the above mentioned polymers. This study reports an effective methodology developed to determine the optimum welding condition that maximizes the strength of joints produced by ultrasonic welding through the response surface method. A response surface methodology is employed to develop an effective model to predict the weld strength by incorporating process parameters such as pressure, weld time and amplitude. Experimental trials are conducted based on experiments design. An effective second order response surface model is developed based on the values measured. Subsequently, an analysis of the variances and inferences drawn from scanning electron microscope images are discussed. The research emphasizes that the pressure and welding time have a significant impact on the weld strength.
Keywords: PC-ABS blend, ultrasonic plastic welding, a response surface method, a weld strength.
Received 07 December 2015Accepted 07 October 2016
Journal of Chemical Technology and Metallurgy, 52, 1, 2017, 41 - 51
INTRODUCTION
The polymers have found enormous applications in domestic use, packaging, food and beverages, auto-motive industry and various other industrial purposes. Advanced, hybrid plastics and polymer blends are play-ing an important role in producing vehicles interior and exterior, body and structural components. Ultrasonic welding (USW) is a solid state welding process in which similar or dissimilar metallic components are joined by the application of high frequency vibrations under high pressure. The high frequency relative motion between the parts facilitates the solid progressive shearing and plastic deformation providing localized joining in a few seconds in absence of any significant amount of heat at the work pieces. One of the parts in ultrasonic welding
has to be light as an excessive amount of energy is re-quired for the high frequency vibration. This in fact is a noticeable lacuna of the method and limits its applica-bility. Ultrasonic plastic welding plays a prominent role in the manufacturing of accessories used in automotive, aerospace, defense and electrical applications. There are several research studies pertaining to the mechanism of joint formation, the temperature distribution analysis at the weld interface, the joint strength, etc. Specific joint designs are the major concerns of USW process employment as high ultrasonic energy is focused at the welding interfaces. Furthermore, the welding parameters are highly coupled and show high sensitivity to toler-ances and clamping of the parts to be welded. Ultrasonic welding typically provides a low-energy bonding tech-nique as compared with the conventional process. Two

Journal of Chemical Technology and Metallurgy, 52, 1, 2017
42
thin polymer sheets/plates having compatibility may be welded by ultrasonic vibrations. Generally, amorphous polymers are preferred over crystalline one aiming to achieve a good joint quality. It is worth adding that the application of high power ultrasonic energy creates oscil-lating shear forces that break the polymer chains, while the static force present produces high strength solid-state bonds. Besides, the ultrasonic welding technology is also the most appropriate method for producing hybrid joints for multi functional components. Fig.1 shows a scheme of an ultrasonic plastic welding machine [1].
Ultrasonic heat is created during the vibration phase of the process upon the application of pressure and a vibration frequency ranging from 10 kHz - 70 kHz to 10 - 250 mm perpendicular to the parts to be welded [2]. The process is realized through surface- and viscoelastic friction [3]. During the solidification phase, the weld is allowed to cool down under pressure below the glass transition temperature (Tg) of the thermoplastic resin. Energy directors are embedded on the specimens to concentrate the heat generated at the interface between the parts to be joined, which in turn results in uniform energy distribution through the material solidification. But they can also bring about protrusions on the weld-
ing surface as illustrated in ref. [4]. In fact the energy directors are linear ridges with triangular, semicircular or rectangular cross sections. Their number, shape, size and orientation have a significant effect on the welding process and its output parameters, as they influence heat generation and resin flow at the welding interface [5 - 6]. Other important parameters of the USW process refer to the holding pressure, the weld time, and the amplitudes of the vibration tip.
The study of joining a polymer blend containing polycarbonate (PC) and acrylonitrile–butadiene–styrene (ABS) is imperative as it is of great practical impor-tance. PC is a ductile thermoplastic when compared to other polymeric materials such as nylon, polyesters, etc. ABS is classified as rubber toughened thermoplastics with scope for a wide industrial application. Due to the complementary properties of the components, PC-ABS alloy has drawn considerable interest in engineering applications requiring a high degree of toughness, as in the automotive industry. Notomi et al. [7] investigate the tensile properties of PC-ABS alloy. Wang et al. [8] examine the effect of tri-axial stress constraint on the de-formation and fracture of PC, ABS and PC-ABS alloys.
Machmud et al. [9] report the strain, strain rate and
Fig.1. Schematic presentation of ultrasonic plastic welding equipment [1].

Chinnadurai T., Arungalai Vendan S., Mohan Raj N., Prakash N.
43
temperature dependent deformation behavior of PC-ABS alloy on the ground of quasi-static uniaxial tension tests carried out. Yin, Z. N. et al [10] study further the viscoelastic deformation of PC-ABS blend with the application of dynamic mechanical analysis (DMA) techniques. Yin, Z. N., and T. J. Wang [11] evaluate experimentally the deformation of PC-ABS blend in case of application of strain rates of 8.0 × 10² s-1, 2.7 × 10³ s-1 and 1.0 × 10⁴ s-1. The study reveals that ABS fractional content and strain rate play a vital role in the joining process. O’Connell et al. [12] perform tests to study the creep tension properties and the slow crack growth. The joining of two dissimilar polymers namely ABS and PC becomes an essential process in the auto-mobile industry. The front and tail lights of several car types are made of components containing PC and ABS [13]. The stress cracking is an important mode of fail-ure in joining PC-ABS. Internal tensile stresses induce temperature in the range of 230°C–420°C, which leads to cracks. Hence, the attainment of high weld strength for these types of polymers is significant, especially for the automobile industry.
There are discussions in the literature on polymer hybrids and the need of joining them. Experimental investigations on the strength aspects and failure modes are also reported. The techniques applied, especially the response surface methodology (RSM) used for paramet-ric analysis, are further discussed. RSM is a combination of mathematical and statistical tools for modeling and analysis of problems where the response expected is influenced by several variables and the objective is to optimize this response [14]. The process modeling by RSM uses a statistical design of the experiments. It is based on the central composite face centered design. This method not only reduces the cost and time but also gives the required information about the main and
interaction effects. The general model equation of RSM is as follows:
2
11 110 i
b
iiiji
b
i
b
ijiji
b
ii xxxxy ∑∑∑∑
== +==
+++= εεεε (1)
where y is the response or the weld strength in this case, xi stands for the pressure, the weld time and the ampli-tude, while ε 0, ε i, ε ij and ε ii represent the constant, linear, quadratic and interaction terms respectively.
In engineering and allied industries it becomes imperative to find regions of response improvement instead of defining those providing an optimum re-sponse [15]. Gaitonde et al. [16] develop second order mathematical models for minimization of burr height and burr thickness using RSM. In this investigation, five-level, half replicate, second order rotatable central composite designs are adopted to study the interactions effect. The RSM model developed is evaluated on the ground of the variance analysis (ANOVA) and is found adequate. The study carried out by N. Bradley [17] focuses on the design, modeling and analysis of RSM and elucidates in depth the first-order, the second-order, and three-level fractional factorial. Kumar et al. [18] propose a methodology to improve the mechanical properties of AA 5456 aluminum alloy welds obtained by the magnetic arc oscillation welding process. The authors use the Taguchi’s method to optimize the pro-cess parameters. The percentage of error between the experimental and predicted values is found negligible. The welds microstructures are investigated and cor-related with the mechanical properties displayed. Fang et al. [19] investigate the large deformation of PC-ABS plastics using digital image correlation (DIG) methods. They find a relationship between the necking ratio and the tensile strain, which depends on the geometry but not on the loading ratios.
Fig. 2. Prior to joining PC/ABS blend in presence and absence of an energy director.

Journal of Chemical Technology and Metallurgy, 52, 1, 2017
44
A second order RSM model is developed in this study for predicting the weld strength of PC-ABS joints. The model developed is employed to determine the optimum welding conditions leading to maximum weld strength.
EXPERIMENTAL
The trials were carried out using PC/ABS hybrid specimens to determine the range of ultrasonic welding parameters.
The experiments were planned as per Central Com-posite Face Centered (CCF) design with the star points at the center of each face of the factorial space. This design fits accurately [20] the second order response surface. The appropriate parametric ranges were identified and listed in Table 1.
of inclination and positioning are illustrated in Fig. 2. Fig. 3 shows the equipment and positioning of speci-
mens in a lap configuration. There were four phases of ultrasonic welding. During the welding itself, the horn vibration was perpendicular to the joint surface and the point of the energy director. The latter melted and flew into the interface. The heat generation was high. The second phase corresponded to the meeting of the part surfaces, while the melting rate increased. Steady-state melting occurred during phase 3 and a melt layer formed at the interface. A maximum displacement was reached during phase 4, and an additional melt was squeezed
Table 1. Variable levels used for the experiments conducted.
Factor Unit Levels Level 1 Level 2 Level3
Pressure (P) Bar 3.5 4 4.5 Weld time (T) Sec 4 4.5 5 Amplitude (A) µsec 30 40 50
The welding experiments were carried out using a
conventional ultrasonic welding machine (4800 W, 40 kHz) providing different ranges of weld parameters. The design matrix presented in Table 1 was used.
The PC-ABS grains were procured in a 60 % - 40 % ratio using Chennai.chemicals. They were subjected to preheating followed by mould preperation using an injection moulding equipment. Two sets of mould specimens were prepared. They differred on account of the energy directors presence. The specimens of the first series contained triangular energy directors. Their angle
Fig. 3. Illustration of a digitally controlled ultrasonic plastic welding machine (40 KHz).
Fig. 4. Welded PC/ABS blend specimen.

Chinnadurai T., Arungalai Vendan S., Mohan Raj N., Prakash N.
45
out of the joint interface in the form of a spruce. The intermolecular diffusion during the melt flow resulted in new polymer chain entanglements between the two parts being welded, serving to produce high weld strength. After a set weld time, and/or power level, and/or dis-tance was reached, the welder was turned off but the horn pressure was maintained as the weld cooled [13]. Fig. 4 shows PC-ABS weld metes after the welding. The corresponding welding input relations and output values are summarized in Table 2. Twenty experiments were
conducted at different levels of parameters (Table 1) aim-ing to obtain ultrasonic welded joints of PC-ABS blends. The values of weld strength obtained from experiments and those predicted from the response surface model are tabulated in Table 4.
RESULTS AND DISCUSSIONS
The ANOVA technique [22] is employed to check the adequacy of the models developed at 95% confidence
Table 2. ANOVA for PC-ABS weld meets with 95% confidence interval.
Analysis of Variance
Source DF Adj SS Adj MS F-Value P- Value Model 9 8.1198 0.9022 7.75 0.002 Linear 3 4.2731 1.4243 12.23 0.001 Pressure(bar) 1 3.6445 3.6445 31.30 0.000 Weld time (sec) 1 0.2099 0.2099 1.80 0.009 Amplitude (µm) 1 0.4186 0.4186 3.60 0.087 Square 3 0.1236 0.0412 0.35 0.787 Pressure (bar)*Pressure (bar) 1 0.0944 0.0944 0.81 0.389 Weld time (sec)*Weld time (sec) 1 0.0000 0.0000 0.00 0.999 Amplitude (µm)*Amplitude (µm 1 0.009 0.0096 0.08 0.780 2-Way Interaction 3 0.7230 1.2410 10.66 0.002 Pressure (bar)*Weld time (sec) 1 0.7527 0.7527 6.47 0.029 Pressure (bar)*Amplitude (µm) 1 0.2278 0.2278 1.96 0.192 Weld time (sec)*Amplitude (µm) 1 2.7424 2.7424 23.55 0.001 Error 10 1.1643 0.1164 Lack of Fit 5 0.8725 0.1745 2.99 0.127 Pure error 5 0.2917 0.0583 Total 19 9.2841
Coded Coefficients Term Effects Coef SE Coef T- Value P-Value VIF Constant 3.449 0.117 29.40 0.000 Pressure (bar) 1.207 0.604 0.108 5.59 0.000 1.00 Weld time (sec) 0.290 0.145 0.108 1.34 0.009 1.00 Amplitude (µm) 0.409 0.205 0.108 1.90 0.087 1.00 Pressure (bar)*Pressure (bar) 0.371 0.185 0.206 0.90 0.389 1.82 Weld time (sec)*Weld time (sec) 0.001 0.000 0.206 0.00 0.999 1.82 Amplitude (µm)*Amplitude (µm) -0.118 -0.059 0.206 -0.29 0.780 1.82 Pressure (bar)*Weld time (sec) -0.614 -0.307 0.121 -2.54 0.029 1.00 Pressure (bar)*Amplitude (µm) -0.338 -0.169 0.121 -1.40 0.192 1.00 Weld time (sec)*Amplitude (µm) -1.171 -0.585 0.121 -4.85 0.001 1.00
Table 3. Coded coefficients for PC-ABS weld meets.

Journal of Chemical Technology and Metallurgy, 52, 1, 2017
46
interval. As per the ANOVA technique, the model is ade-quate within the confidence level, provided the calculated value of the F ratio of the lack of fit to the pure error does not exceed the standard tabulated value of F-ratio [16]. Here, the pressure, weld time and amplitude models are adequate in a non-linear form as illustrated in Table 4.
Regression Equation
Weld strength (N mm-2) = = - 41.1 + 2.15 Pressure (bar) + 9.87 Weld time (Sec) + 0.730 Amplitude (µm) + 0.741 Pressure (bar)*Pressure (bar) + 0.001 Weld time (Sec)*Weld time (Sec) - 0.00059 Amplitude (µm)*Amplitude (µm) - 1.227 Pressure (bar)*Weld time (Sec) - 0.0337 Pressure (bar)*Amplitude (µm) - 0.1171 Weld time (Sec)*Amplitude (µm)
It is essential to perform tests for significance of the regression model, a test for significance of individual model coefficients and a test for lack-of-fit. ANOVA table is used to compare the tests performed. Table 2 shows the ANOVA table for the surface roughness. The value of F in Table 2 for the model is less than 0.05, which indicates that the model is significant. It emphasizes that the terms
in the model have a significant effect on the response. Similarly, the main effect of the pressure (p), the weld time (s), the two-level interaction pressure*weld time, weld time*amplitude and pressure*amplitude are significant model terms. Other model terms have an insignificant contribution. These insignificant model terms (not counting those required for the hierarchy support) may be eliminated to evolve an improved model. The lack-of-fit appears also insignificant. This is a desirable model to achieve a proper fit. The pressure and the weld time are the most significant factors associated with PC-ABS welding. The results presented in Table 3 show the coefficient of determination used to examine the weld strength with respect to the pres-sure and weld time. That provides a measure of variability in the observed response values and may be explained by the controllable factors and their interactions. The final mathematical model in coded forms used to predict better welding conditions for PC-ABS blends is presented as:Y = -41.1 + 2.15 X1 + 9.87 x2 + 0.730 x3 + 0.741 X1
* X1 + 0.001 x2* x2 - 0.00059 x3* x3 - 1.227 X1 * x2
- 0.0337 X1* x3 - 1171 x2* x3
where Y is the weld strength, X1 is the pressure (bar), x2
is the weld time (sec), while x3 is the amplitude (µsec).
Ex. No Pressure
(bar) Weld time (Sec) Amplitude (µm) Weld strength Experiments (N mm-2)
1 3.5 5 30 3.548 2 3.5 4 30 1.451 3 4 4.5 40 3.365 4 4 4.5 50 3.846 5 4.5 4.5 40 4.165 6 4.5 5 50 3.482 7 4 4.5 40 3.154 8 3.5 4.5 40 3.486 9 4.5 5 30 4.764
10 4 4.5 40 3.128 11 4.5 4 50 4.954 12 4 4.5 40 3.357 13 4 4.5 40 3.159 14 3.5 5 50 3.246 15 4 4 40 3.846 16 4 4.5 30 3.316 17 3.5 4 50 3.186 18 4 5 40 3.435 19 4 4.5 40 3.765 20 4.5 4 30 3.589
Table 4. Experimental weld strength values.

Chinnadurai T., Arungalai Vendan S., Mohan Raj N., Prakash N.
47
The juxtaposition of the predicted and the experimen-tal values referring to the weld strength shows that the deviation is insignificant. The optimum weld strength obtained from the experiments carried out and the RSM model are shown in Table 5. A plot of the means of the response variable for each level of a factor provides elucidating the main effects of interdependent process parameters. The main effect is calculated by subtract-ing the overall mean for the factor considered from the mean for each level. Fig. 5 shows the locations of the main effects referring to the input parameters and the weld strength achieved. It is seen that the pressure, the
weld time and the amplitude increase when they move from a low level to a high level. Each level of the factors affects the response differently. Each factor at its high level results in higher mean response compared to that at the low level. Alternatively, the factor pressure appears to have a greater effect on the responses, compared with the slope. The main effect plots facilitate the visualiza-tion of the factors that affect the response.
The normal probability plots of the residuals and the plots of the residuals versus the predicted response in respect to the experimental weld strength is shown in Fig. 6. Residuals generally fall on a straight line imply-
Pressure
(bar)
Weld Time (sec)
Amplitude (µm)
Experimental Weld strength
(N mm-2)
RSM Weld strength
(N mm-2) 4 4 40 3.846 3.846
Table 5. Juxtaposition of the optimum experimental and model values of PC-ABS specimens weld strength.
Fig. 5. Main effect plot referring to the experimental weld strength.
Fig. 6. A probability plot referring to the experimental weld strength.

Journal of Chemical Technology and Metallurgy, 52, 1, 2017
48
ing that the errors are normally distributed. This implies that the model proposed is adequate and excludes any possibility of independence violation or a constant vari-ance assumption.
The surface plot facilitates attaining the shape of the response surface, the corresponding hills, valleys, and ridge lines. That is why the function f (p, a) from Eq. 2 is plotted versus the levels of p and a as shown as Fig. 7. In this graph, each value of p and a generate a y-value. This three-dimensional graph illustrates the response surface obtained. The contour plots (Fig. 8) are derived using Eq.1. The fitted coefficient is calculated by maintaining one of the variables constant.This is visualized by the “hold values” in Fig. 8. The contour plot shows a significant variation in the weld strength as a function of the amplitude and the pressure. This is seen in case of weld strength increase by moving along the pressure axis in respect to a given amplitude value. The curve representing the weld strength at different amplitude and pressure values are self explanatory. In addition, the slope of weld strength curve with respect to the pressure values indicates a minimal change in the amplitude.
The dependence of the response on the pressure and the amplitude can be described by the following equation:
eapfy += ),( (2)
where, Y is the response, p denotes the pressure, a de-notes the amplitude, while e stands for the error term
The function f (p, t) versus the levels of p and t can be described in accordance with:
etpfy += ),( (3)
where, Y is the response, p denote pressure, t denote weld time, e denote error term.
The surface plot of the weld strength vs. the pressure and the weld time presented in Fig. 9 indicates the presence of hold values. It is clearly evident that the pressure and the weld time affect significantly the weld strength. The fit coefficient is calculated by maintaining the other variable Fig. 7. Surface plot of weld strength vs. pressure and amplitude.
Fig. 8. Contour plot of weld strength vs. pressure and amplitude.
Fig. 9. Surface plot of the weld strength vs. the pressure and the weld time.
Fig. 10. Contour plot of the weld strength vs. the pressure and the weld time.

Chinnadurai T., Arungalai Vendan S., Mohan Raj N., Prakash N.
49
constant. This is shown as “hold values” in Fig. 10. The weld strength increase is observed along the pressure axis as well as the weld time axis. The ANOVA table expresses the same observation as well. The plot pre-sents the weld strength in different pressures and weld time ranges. Besides, the slope of curve shows that the pressure values change considerably as a result of small changes of the weld time.
The function f (t, a) can be plotted versus the levels of t and a in correspondence with Eq. 4:
eatfy += ),( (4)The plots obtained are presented in Fig. 11. In this
graph, each value of t and a generates a y-value. Surface plots “hold value” is shown in Fig. 11. Weld strength is not affected largely as compared to the previous plots. Weld strength will have minimal changes. The fitted coefficient by maintaining one of the variables constant is shown as “hold values” in Fig. 12. The contour plot indicates that there is the significant difference in weld strength as a result of amplitude and weld time. ANOVA table also validate the observation that the amplitude values are not significant and weld time play a significant role. Analysis shows that pressure contributes more to the weld strength. The curve representing weld strength at different ampli-tude and different weld time ranges are shown.
Response surface analysisThe developed second order RSM-based models for
weld strength are used to analyze the factor interaction effects on pressure, weld time and amplitude by plotting 3D-response surface plots. Since the main objective of the present investigation is to get the optimum values
of the weld strength for specified input parameters, the influence of a combination of the pressure along with the remaining process parameters, namely, the weld time and the amplitude is predicted. Fig. 13 shows that the weld strength appears to be high for amplitude values of 30, 40 and 50. However, it is not the amplitude, but the corresponding pressure and weld time that lead to weld strength increase. In fact the amplitude has a negligible contribution to the weld strength.
SEM analysis
The study of the deformed polymer morphology is essential in understanding the form and structure of the welded polymer interface. The deformed ridges are prominent features of the welded samples. Their
Fig. 11. A surface plot of the weld strength vs. the weld time and the amplitude.
Fig. 12. A contour plot of the weld strength vs. the weld time and the amplitude.
Fig. 13. A dependence of the weld strength on. the pressure, the weld time and the amplitude.
Journal of Chemical Technology and Metallurgy, 52, 1, 2017
50
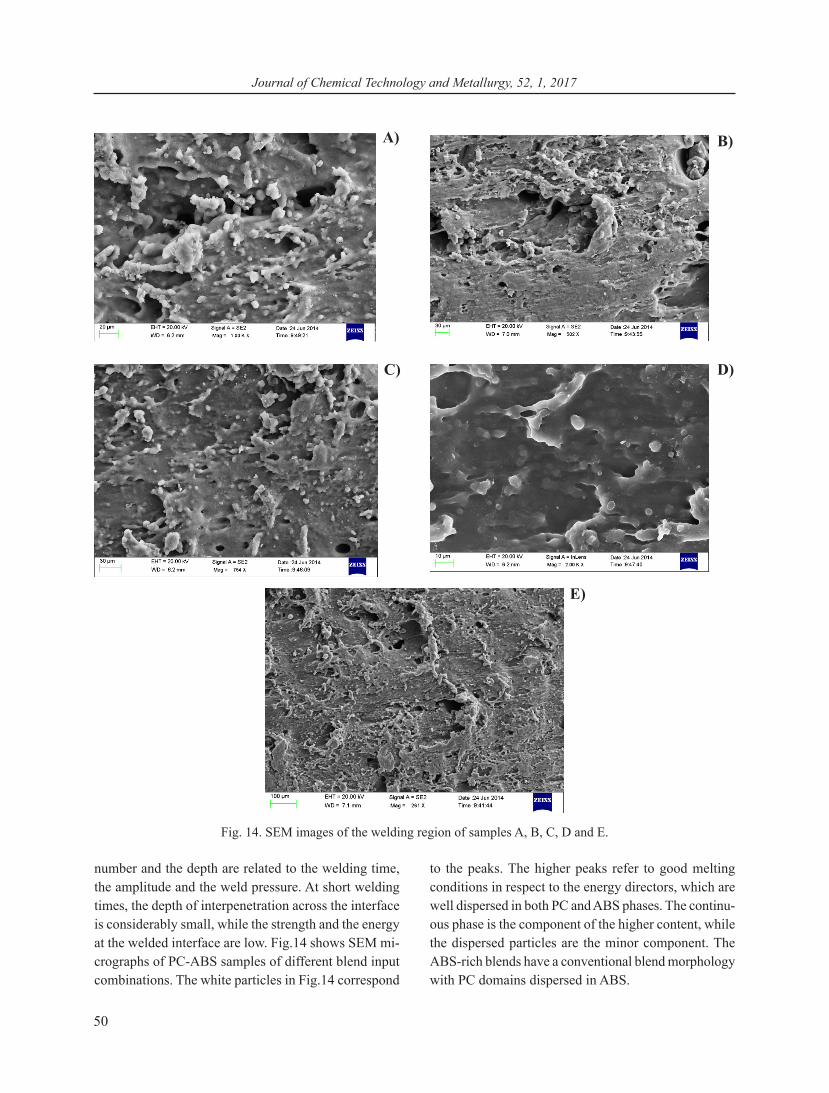
number and the depth are related to the welding time, the amplitude and the weld pressure. At short welding times, the depth of interpenetration across the interface is considerably small, while the strength and the energy at the welded interface are low. Fig.14 shows SEM mi-crographs of PC-ABS samples of different blend input combinations. The white particles in Fig.14 correspond
to the peaks. The higher peaks refer to good melting conditions in respect to the energy directors, which are well dispersed in both PC and ABS phases. The continu-ous phase is the component of the higher content, while the dispersed particles are the minor component. The ABS-rich blends have a conventional blend morphology with PC domains dispersed in ABS.
Fig. 14. SEM images of the welding region of samples A, B, C, D and E.
A)a B)
C) D)
E)

Chinnadurai T., Arungalai Vendan S., Mohan Raj N., Prakash N.
51
CONCLUSIONS
This study reports the development of a second order mathematical model using RSM aiming to predict the maximum weld strength of PC-ABS specimens with em-bedded energy directors. Ultrasonic welding is applied. Experiments are carried out to identify the parameters affecting the weld strength and to optimize the range of all parameters studied. RSM is further employed to investigate the parametric interdependency. The results reveal that the weld strength depends primarily on the pressure and the weld time. The good coherence between the model and the experimental data indicates valida-tion, which may be extrapolated to studies of joining processes with the participation of other materials.
REFERENCES
1. A. Norouzi, M. Hamedi, V.R. Adineh, Strength modeling and optimizing ultrasonic welded parts of ABS-PMMA using artificial intelligence methods, The International Journal of Advanced Manufacturing Technology, 61,1-4, 2012, 135-147.
2. A. Grewell David, A. Benatar, J.B. Park. Plastics and composites welding handbook, v. 10, 2003.
3. Z. Zhang, X. Wang, Y. Luo, Z. Zhang, L. Wang, Study on heating process of ultrasonic welding for thermoplastics, Journal of Thermoplastic Composite Materials, 23, 5, 2010, 647-664.
4. S.J. Liu, I.T. Chang, S.W. Hung, Factors affecting the joint strength of ultrasonically welded polypropylene composites, Polymer Composites, 22, 1, 2001,132-141.
5. I.F. Villegas, Strength development versus process data in ultrasonic welding of thermoplastic compos-ites with flat energy directors and its application to the definition of optimum processing parameters, Com-posites Part A: Applied Science and Manufactur-ing, 65, 2014, 27-37.
6. A. Levy, S. Le Corre, A. Poitou, Ultrasonic welding of thermoplastic composites: a numerical analysis of the mesoscopic scale relating processing parameters, flow of polymer and quality of adhesion. Int. J. Mater. Form., 7, 1, 2014, 39-51.
7. M. Notomi, K. Kishimoto, T.J. Wang, T. Shibuya. Ten-sile and fracture behaviors of PC/ABS polymer alloy, In Key Engineering Materials, 183, 2000, 779-784.
8. T. Wang, K. Kishimoto, M. Notomi, Effect of triaxial
stress constraint on the deformation and fracture of polymers, Acta Mechanica Sinica, 18, 5, 2002, 480-493.
9. M.N. Machmud, M. Omiya, H. Inoue, K. Kishimoto, Rubber particle size effect on impact characteristics of PC/ABS (50/50) blends. In Fracture of Nano and Engineering Materials and Structures, 2006, 505-506, Springer Netherlands.
10. Z.N. Yin, L.F. Fan, T.J. Wang, Experimental inves-tigation of the viscoelastic deformation of PC, ABS and PC/ABS alloys, Materials Letters, 62, 17, 2008, 2750-2753.
11. Z.N. Yin, T.J. Wang, Deformation of PC/ABS alloys at elevated temperatures and high strain rates, Materials Science and Engineering: A, 494, 1, 2008, 304-313.
12. P.A. O’connell, M.J. Bonner, R.A. Duckett, I.M. Ward, The relationship between slow crack propa-gation and tensile creep behavior in polyethylene, Polymer, 36,12, 1995, 2355-2362.
13. Troughton, J. Michael, Handbook of plastics joining: a practical guide, William Andrew, 2008.
14. Montgomery, C. Douglas, Design and Analysis of Experiments: Response surface method and designs, New Jersey: John Wiley and Sons, Inc., 2005.
15. M.H. Raymond, A.I. Khuri, W.H. Carter, Response surface methodology, 1966–l988, Technometrics 31, 2, 1989, 137-157.
16. V.N. Gaitonde, S.R. Karnik, B.T. Achyutha, B. Siddeswarappa. Genetic algorithm-based burr size minimization in drilling of AISI 316L stainless steel, Journal of materials processing technology, 197, 1, 2008, 225-236.
17. N. Bradley, The Response Surface Methodology, Dissertation, Indiana University South Bend, 2007.
18. A. Kumar, P. Shailesh, S. Sundarrajan, Optimization of magnetic arc oscillation process parameters on mechani-cal properties of AA 5456 Aluminum alloy weldments, Journal of Materials and Design, 29, 2008, 1904-1913.
19. Q.Z. Fang, T.J. Wang, H.G. Beom, H.P. Zhao, Rate-dependent large deformation behavior of PC/ABS, Polymer, 50, 1, 2009, 296-304.
20. G. Padmanaban, V. Balasubramanian, Optimization of laser beam welding process parameters to attain maximum tensile strength in AZ31B magnesium alloy, Journal of Optics and Laser Technology, 42, 2010, 1253-1260.
22. W.G. Cochran, G.M. Cox, Lattice designs, Ex-perimental designs, John Wiley and Sons, New York, 1992, 396-438.