Studies on Nucleotide levels and Electron transport genes ...
230
University of Cape Town Studies on nucleotide levels and electron transport genes of Clostridium acetobutylicum P262 Joseph D. Santangelo In partial fulfillment of the requirements for the degree of Doctor of Philosophy in the Faculty of Science, University of Cape Town. CAPETOWN APRIL 1991
Transcript of Studies on Nucleotide levels and Electron transport genes ...

Univers
ity of
Cap
e Tow
n
Studies on nucleotide levels and electron transport genes of
Clostridium acetobutylicum P262
Joseph D. Santangelo
In partial fulfillment of the requirements for the degree of
Doctor of Philosophy in the Faculty of Science,
University of Cape Town.
CAPETOWN
APRIL 1991

The copyright of this thesis vests in the author. No quotation from it or information derived from it is to be published without full acknowledgement of the source. The thesis is to be used for private study or non-commercial research purposes only.
Published by the University of Cape Town (UCT) in terms of the non-exclusive license granted to UCT by the author.
Univers
ity of
Cap
e Tow
n
Dedicated to my Grandmothers,
Helen Caputo Tribuiani and
Maria Josephine Malatesta Santangelo

CERTIFICATION OF SUPERVISOR
In terms of paragraph 9 of "General regulations for the degree of Ph.D." I as
supervisor of the candidate Joseph D. Santangelo, certify that I approve of the
incorporation in this thesis of material that has already been published or
submitted for publication.
Professor D.R. Woods
Deputy Vice-Chancellor (Research)
University of Cape Town
Acknowledgements
This thesis could not have been completed without help from others.
First, I must thank Gary Husted (formerly of the University of Vermont), a
friend, colleague and former supervisor who convinced me to go to South Africa
to study under David Woods.
I am greatly indebted to my supervisor, Professor D.R. Woods, for his
enthusiastic guidance and support, even when things were not going that well.
The same gratitude extends to Prof. D.T. Jones, who was co-supervisor for the
first years of this study.
Many thanks are due to past and present members of the "Anaerobe Unit" for
providing a terrific working environment. Special thanks to Dr. Susan Long for
showing "the new kid" the ropes, to Dr. Harold Zappe for expert and reliable
technical advice, and to Dr. Heide Goodman and Dr. Valerie Abratt for their
helpful discussions.
I greatly appreciate the technical assistance given to me by Ernest Clark,
Mary-Lou Henderson, Wyn Jones and Di James. I owe a great debt to Professor
Jennifer Thomson and Dr. Joan Parker for organizing the Department of
Microbiology such that it runs like a well oiled machine.
A very deep and personal thanks goes to Julie McKay for her love,
understanding and patience, especially during the lengthy process of writing
and revising of this thesis. Likewise, I can not forget my parents, Sal and Sylvia,
as well as my brother and his wife, Andrew and Karen, for the love they
expressed in their letters and phone calls. I probably would not have gotten
through the first year without these reminders from home. Mom and Dad, I
must also express my greatest gratitude for your unfailing spiritual support and
financial assistance throughout my academic career.
Last, but certainly not least, I must somehow thank Alex and Nandi for keeping
me company during the long days of writing, and for never complaining about
not being taken to the beach or along the contours of Table Mountain.
I gratefully acknowledge the financial assistance received from the C.S.I.R.,
Sentrachem Ltd., and Glaxo Pharmaceuticals.

"I don't know what you mean by 'glory,"' Alice said. Humpty Dumpty smiled contemptuously. "Of course
you don't-till I tell you!. I meant 'there's a nice knockdown argument for you!'"
"But 'glory' doesn't mean 'a nice knock-down argument,"' Alice objected.
"When I use a word," Humpty Dumpty said, in rather a scornful tone, "it means just what I choose it to mean -neither more nor less."
Humpty Dumpty to Alice, In: Through the Looking Glass, by Lewis Carroll.

i
Contents
Abstract .............................................. ii
Abbreviations . ......................................... v
Chapter 1 General introduction and literature review ............. .1
Chapter 2 Development of a chromatographic analysis system with particular application for measuring nucleoside phosphate levels in C. acetobutylicum P262 . . . . . . . . . . . . . . . . . . . .. 46
Chapter 3 Nucleoside triphosphate levels in C. acetobutylicum P262 wild type, sporulation deficient and solvent deficient strains ..... 60
Chapter 4 Metronidazole activation and E.coli . ................ 76
Chapter 5 Isolation and classification of C. acetobutylicum genes which activate metronidazole .......................... 91
Chapter 6 Nucleotide sequencing and sequence analysis of selected metronidazole sensitive clones .................... 111
Chapter 7 General Conclusions ........................... 138
Appendix A Media, buffers, and solutions ..................... 144
Appendix B General Techniques ........................... 156
Appendix C E. coli strains, genotypes, and references .............. 164
Appendix D One- and three-letter codes used for amino acids ........ 165
Appendix E Plasmid vectors and phage restriction maps ........... 166
Appendix F Source code for chromatographic analysis system ....... .171
Literature Cited . . . . . . . . . . . . . . . . . . . . . . . . . . . . . . . . . . . . ... 184

ii
Abstract
Clostridium acetobutylicum P262 is an endospore-forming Gram positive anaerobic
bacterium, and for many years this organism has been used in the industrial
fermentation for the production of acetone and butanol from carbohydrate
substrates. The aims of this thesis included studies on small phosphorylated
molecules involved in energy metabolism and cell differentiation, and an
investigation into the genetics and molecular biology of C. acetobutylicum electron
transport genes.
To facilitate quantitation of nudeoside triphosphates in extracts of C.
acetobutylicum, a chromatographic data acquisition and analysis system was
constructed. Samples were prepared from C. acetobutylicum cultures by
treatment with formic acid, and nucleotides contained in these extracts were
separated by strong anion exchange HPLC. The developed manual integration
system features the ability to collect and store chromatographic data, allowing
for multiple integration using different calibration curves.
Nucleoside triphosphate profiles were obtained from batch fermentations of the
C. acetobutylicum P262 wild type, sporulation deficient (spo-1) and solvent
deficient (ds-1) strains. The nucleoside triphosphate profiles of the wild type
and spo-1 mutant were similar and were characterized by a trough in nucleotide
levels which occurred just prior to the pH break point, the onset of the stationary
growth phase, clostridial stage formation and the transition from the acidogenic
to the solventogenic phase. The nucleoside triphosphate concentrations during
the exponential growth phase were much lower than those found during the
stationary phase. Exponential phase nucleotide levels in the cls-1 mutant were
comparable to those observed in the wild type and spo-1 mutant. Unlike the wild
type and spo-1 strains, the cls-1 mutant, which does not switch to
solventogenesis, did not demonstrate an increase in nucleotide levels after the
cessation of cell division. The involvement of nucleotide levels, particularly that

iii
of GTP, in the differentiation of C. acetobutylicum was indicated by the effect of
inhibitors, which have been shown to decrease ribonucleotide levels in other
organisms and cause an increase in sporulation.
The antibacterial agent metronidazole, was used as a tool for the isolation of C.
acetobutylicum electron transport genes. Since it was desired to clone these genes
in Escherichia coli, and investigation into the activation of metronidazole by E.coli
strains was necessary. E. coli strains with lesions in their DNA repair systems
were more susceptible to metronidazole than wild type strains. However, it has
been reported that DNA repair deficient strains of E. coli that also had a
diminished ability to reduce chlorates and nitrates were no more susceptible to
metronidazole than their wild type parents (Jackson et al., 1984; Yeung et al.,
1984). To isolate a suitable E. coli cloning host for the selection of C.
acetobutylicum electron transport genes which activated metronidazole,
transposon mutagenesis of the recA E.coli strain CC118 with TnphoA, was used
to construct the recA, metronidazole resistant E.coli strain Fl9. F19 was shown to
have diminished nitroreductase activity, which was presumed to be responsible
for the metronidazole resistant phenotype. However, the recA mutation renders
E. coli F19 highly susceptible to the reduced toxic intermediates of
metronidazole.
The E.coli F19 recA, nitroreductase deficient mutant was used for the isolation of
C. acetobutylicum genes on recombinant plasmids which activated metronidazole.
Twenty five E. coli F19 clones which contained different recombinant plasmids
were isolated. The clones were tested for nitroreductase, pyruvate-Fd
oxidoreductase and hydrogenase activities. Nitroreductase and pyruvate-Fd
oxidoreductase activity was not demonstrated in any of the isolated clones, and
only one clone tested positive for hydrogenase activity.
DNA hybridization and restriction endonuclease mapping revealed that four of
the C. acetobutylicum insert DNA fragments on recombinant plasmids were
linked in an 11.1 kb chromosomal fragment. It was determined that this 11.1 kb

iv
fragment contained at least two regions responsible for activating metronidazole.
The one gene responsible for making E. coli F19 extremely sensitive to
metronidazole was localized to a 2 kb region. The nucleotide sequence of this
2 kb region was determined and two truncated open reading frames and one
complete open reading were present. The complete open reading frame was
shown to be responsible for activating metronidazole. The deduced amino acid
sequence of this open reading frame was determined to be 160 amino acids in
length, and database searches showed good similarity to flavodoxin proteins
from many organisms. Based on alignments to the amino acid sequences of
these flavodoxins, as well as the fact that Chen and Blanchard (1979) reported
that reduced flavodoxin can transfer electrons to metronidazole, the sequence
corresponding to this C. acetobutylicum metronidazole activating gene was
identified as coding for a flavodoxin gene.
The role of flavodoxin in C. acetobutylicum and other organisms is presented.
Possible relationships between the cloned C. acetobutylicum flavodoxin gene and
metronidazole sensitivity are discussed.

A A254 aa(s) ABE
1¥cc ATP
bp(s)
C CAMM CBM cfu Cm CoA CsCl CTP
dNTP DNA DNAse
Em ECAM EDTA EtBr
Fd
G GTP
h
kb Km
LB
min mRNA Mr
NAD NADH NADP NADPH nt NTP
OD600 ORF ori ox
Abbreviations
adenosine absorbance at 254 nm amino acid(s) acetone-butanol-ethanol ampicillin American Type culture collection adenosine 5 -triphosphate
base pair(s)
cytidine Clostridium acetobutylicum minimal medium Clostridium basal medium colony forming units chloramphenicol coenzyme A cesium chloride cytosine 5'-triphosphate
deoxynucleotide triphosphate deoxyribonucleic acid deoxyribonuclease
erythromycin E.coli anaerobic medium ethylenediaminetetra-acetic acid eth1di um bromide
ferredoxin
guanosine guanosine 5'-triphosphate
hour(s)
kilobase pairs kanamyan
Luria-Bertani broth
minute(s) messenger RN A relative molecular mass
nicotinamide adenine dinucleotide nicotinamide adenine dinucleotide (reduced) nicotinamide adenine dinucleotide phosphate nicotinamide adenine dinucleotide phosphate (reduced) nucleotides nucleotide triphosphate
optical density at 600 nm open reading frame origin of replication oxiaized
V

~AGE Pho phoA Pollk PR
r red RBS RNA
s s SDS sp(p)
T TAE Tc Tn Tris
u UV UTP
v/v
w/v
XGal XP
[ ]
plasmid polyacrylamide gel electrophoresis alkaline phosphatase gene coding for alkaline phosphatase Klenow fragment of E.coli DNA polymerase I rightward promoter (A)
(superscript) resistance reduced ribosome binding site ribonucleic acid
second(s) (superscript) sensitivity sodium dodecyl sulfate specie(s)
thymidine tris-acetate EDTA buffer tetracycline transposon Tris(fi.ydroxymethyl)aminomethane
units of enzyme activity ultraviolet (light) uridine 5'-triphosphate
volume/ volume
weight/volume
5-bromo-4-chloro-3-indolyl-J3-D-galactopyranoside 5-bromo-4-chloro-3-indolyl phosphate
novel joint (fusion)
plasmid carrier state
deletion
Vl

Chapter 1
General introduction and literature review
1.0 History of the Acetone-Butanol-Ethanol fermentation ............... 1
1.1 Overview of the ABE fermentation ........................... 5
1.2 Biochemistry and physiology of C. acetobutylicum . ................. 8 1.2.1 Central pathways ................................... 8 1.2.2 Acid producing pathways . . . . . . . . . . . . . . . . . . . . . . . . .... .11 1.2.3 Solvent producing pathways .......................... .12 1.2.4 Energy and electron distribution ........................ 14
1.3 Triggers and regulation in C. acetobutylicum .................... .15 1.3.1 Regulation of solvent production ........................ 16 1.3.2 Regulation of electron flow ............................ 18 1.3.3 Sporulation and stationary phase events ................... 22
1.4 Genetic studies of C. acetobutylicum .......................... 24 1.4.1 Cloned C. acetobutylicum genes ......................... 24 1.4.2 Genetic manipulation of C. acetobutylicum .................. 26 1.4.3 Cloning vectors for C. acetobutylicum . ..................... 29
1.5 Future prospects for the ABE fermentation ..................... 31
1.6 Overview of metronidazole . . . . . . . . . . . . . . . . . . . . . . . . . . . . . . . 32 1.6.1 History and development of metronidazole . . . . . . . . . . . . . . . . . 32 1.6.2 Spectrum of metronidazole activity ...................... 36
1.7 Mode of action of metronidazole ............................ 38 1.7.1 Metronidazole entry ................................ 38 1.7.2 Metronidazole activation ............................. 38
1.7.2.1 Role of electron carriers ......................... .39 1.7.2.2 Role of enzymes . . . . . . . . . . . . . . . . . . . . . . . . . . . . . . 40
1.7.3 Cytotoxicity ..................................... .42 1.7.4 Inactive end products ............................... 43
1.8 Aims and overview of this thesis ............................ 44
1
Chapter 1
General introduction and literature review
In many countries, the development of chemical industries based on abundant
supplies of inexpensive fossil fuels has led to the relinquishment of traditional
fermentation routes employed for chemical production. In the consumer
oriented western world, the economies of many nations are reliant on the
abundance of inexpensive fossil fuels. Since the advent of the oil shortage in the
early 1970's, there has been fresh interest in the production of chemicals by the
fermentation of renewable resources, and the acetone-butanol-ethanol (ABE)
fermentation by Clostridium acetobutylicum has often been included (Spivey,
1978).
1.0 History of the Acetone-Butanol-Ethanol fermentation
The history and development of the ABE fermentation was recently review by
Jones and Woods (1986a), and this review provided the basis for the majority of
the history presented below.
A shortage of natural rubber in the early 1900's led to investigations on the
feasibility of producing synthetic rubber. Butyl or isoamyl alcohol could be used
as substrates for the production of butadiene or isoprene respectively (Killeffer,
1927; Gabriel, 1928). Chaim Weizmann was a chemist working at Manchester
University, who chose to research the preparation of synthetic rubber. Not long
after the start of his work, Weizmann realized that such a process could not
succeed without an abundant supply of butanol (Hastings, 1978).
The production of butanol by microbial fermentation was first reported by
Pasteur in 1861, whereas the production of acetone by microbial fermentation
was only reported later (Schardinger, 1905). Although Chaim Weizmann was
not a bacteriologist, he investigated the feasibility of butanol production via a

Introduction 2
microbial route for use in the manufacture of synthetic rubber. Between 1912
and 1914, Weizmann isolated an organism which he called BY (Gabriel, 1928),
later to be named C. acetobutylicum, which was able to breakdown a variety of
starchy substrates and produce good yields of acetone and butanol (McCutchan
and Hickey, 1954).
Concurrent with Weizmann's investigations, the British firm of Strange and
Graham Ltd. filed an English patent application for the production of acetone
and butanol by microbial fermentation. This process was based on an organism
isolated in 1911 by Fernbach, that had the ability to ferment potatoes, but not
maize starch, to produce butanol (Gabriel, 1928; Gabriel and Crawford, 1930). In
1914, Strange and Graham Ltd. built a plant in King's Lynn, for the production of
butanol from potatoes (Gabriel, 1928).
The start of World War I in August of 1914, gave impetus to further develop the
ABE fermentation. Acetone, aside from being a general solvent, was required for
the manufacture of cordite which is used in small arms munitions (Killeffer,
1927). Necessary quantities of acetone were not available to the British army,
and so the British War Office contracted Strange and Graham Ltd. to produce
acetone at their King's Lynn plant (Gabriel and Crawford, 1930). The process of
manufacturing acetone from potatoes using the Fernbach strain was inefficient
and hence production did not meet the requirements of the British army
( Gabriel, 1928).
In his laboratory at Manchester University, Weizmann was very successful at
producing quantities of butanol sufficient for his research (Hastings, 1978). The
British government requested all scientists to undertake work that would
contribute to the war effort. Although Weizmann considered acetone to be a
by-product of the fermentation, he soon realized its importance and quickly
brought his work to the attention of the proper authorities (Hastings, 1978). In
due course, an official research team was assembled to work under Weizmann's
guidance, and all supplies and materials were provided by the British
government for the production of acetone from maize using the Weizmann

Introduction 3
process (Weizmann, 1963; Walton and Martin, 1979). Pilot scale fermentation
plants were developed at a number of sites in southern England (see Jones and
Woods, 1986a), and eventually a full scale production facility was built at the
Royal Naval Cordite factory where six distilleries were adapted for the
production of acetone from maize using the Weizmann process (Gabriel, 1928).
The Strange and Graham Ltd. plant at King's Lynn was also converted to the
Weizmann process, resulting in increased production of acetone (Ross, 1961).
In 1916, the British government could not afford to supply cereal grains used for
the production of acetone via fermentation (Hastings, 1978). The fermentation
was therefore transferred to Canada, and was operated under the guidance of
Herbert Speakman with Weizmann remaining in London as the principal adviser
(Gabriel, 1928; Weizmann, 1963; Hastings, 1978). The year 1917 saw the entry of
the United States of America into the war, and ABE fermentation plants were
initiated at two distilleries located in Terre Haute, Indiana (Ross, 1961). The
cessation of hostilities in November of 1918, brought with it a decreased demand
for acetone which resulted in the closure of these North American fermentation
facilities.
The Allied War Board auctioned the two distilleries in Terre Haute, and they
were purchased in 1919 by a consortium of American businessmen operating
under the name of the Commercial Solvents Corporation of Maryland (Gabriel,
1928). At this time the E.I. DuPont de Nemours Co. of Wilmington Delaware
was developing quick drying nitrocellulose lacquers for use in the rapidly
recovering automobile industry (Walton and Martin, 1979). Butanol and its
ester, butyl-acetate were necessary solvents used in the production of these
nitrocellulose lacquers. Butanol production was re-initiated in 1920 at the Terre
Haute plants which were now operating under the control of the Commercial
Solvents Corporation. The Commercial Solvents Corporation obtained the
Majestic Distillery of Peoria Illinois in 1923, where further expansion of the ABE
fermentation took place (Gabriel, 1928). By the end of 1927 there were 96
fermentors in operation at the Peoria plant with an additional 52 fermentors at
the Terre Haute plants.

Introduction 4
Economics eventually led to a joint venture between the Commercial Solvents
Corporation and the Distiller's Co. of Great Britain where a fermentation facility
was built in Brombrough England based on molasses as the fermentation
feedstock (Gibbs, 1983). Under the guidance of J. Hastings, the ABE
fermentation became operational at this site in 1935 using a phage immunized
strain of C. saccharoacetobutylicum (Gibbs, 1983). Due to the success of this
fermentation facility, the relatively inexpensive substrate, molasses, became the
feedstock of choice for the ABE fermentation.
The worldwide patent for the Weizmann process, in which the Commercial
Solvents Corporation had sole licence, expired in 1936 (McCutchan and Hickey,
1954). In the United States, the production of acetone and butanol from molasses
expanded, with companies other than the Commercial Solvents Corporation
building fermentation plants in the port cities of Philadelphia Pennsylvania and
Baltimore Maryland where molasses could be obtained via waterways from
sugar cane growing regions. Fermentation facilities for the production of
solvents were also built in other countries including Australia, Brazil, Egypt,
Formosa (Taiwan), India, Japan and South Africa (Rose, 1961; Ross, 1961;
Abou-Zeid et al., 1978; Spivey, 1978).
The Second World War brought with it another increase in the demand for
acetone to be used in the manufacture of munitions (Hastings, 1971). Production
of solvent containing fermentation liquor exceeded the capacity of the batch
distillation processes employed for harvesting the solvents, and successful efforts
were made to use multiple column continuous distillations facilities which were
built for the industrial alcohol plants (Hastings, 1978). Difficulties in the
importation of molasses during the Second World War, led to the demise of this
fermentation in Great Britain (Hastings, 1971). The demand for acetone used in
the war effort was therefore met by the production facilities in North America,
which were operating at capacity (Wynkoop, 1943).
The demise of this fermentation in the western world began in the late 1940's,
when the importance of propylene and ethylene, which were by-products of the

Introduction 5
cracking of petroleum, was realized by the petrochemical industry (Gibbs, 1983).
Although the production of acetone and butanol by fermentation continued
through the 1950's, the contribution made by fermentation to the total output
diminished rapidly (Rose, 1961). Breakthroughs in catalysis enabled excellent
yields of a wide variety of industrially important chemicals from petroleum,
which were much less expensive than those derived from fermentation (Gibbs,
1983). The incorporation of molasses into cattle feed caused an escalation in the
price of this substrate, hence providing the final devastating blow to this
fermentation (Hastings, 1978).
Acetone and butanol were also produced via fermentation in eastern block
countries including China, Czechoslovakia and the USSR (Dyr et al., 1958;
Nakhmanovich and Shcheblykina, 1959; Yarvenko, 1964; Lukina, et al., 1972;
Herrero, 1983). Information concerning these production facilities is however
scattered and incomplete.
In a few countries, a combination of political, economic and climatic factors
enabled the survival of some ABE fermentation plants. China currently
produces 50% of its acetone requirements using this fermentation process (J.S.
Chiao, personal communication). In South Africa an economically viable process
for the production of acetone and butanol from molasses operated from 1937 to
1981 (Jones and Woods, 1986a). This plant was reopened for a short period in
1982, however technical problems along with the quality, cost and availability of
molasses resulted in closure of this fermentation facility (Jones and Woods,
1986a).
1.1 Overview of the ABE fermentation
The bacterium, C. acetobutylicum, is a strictly anaerobic, Gram positive spore
forming rod (O'Brien and Morris, 1971), and microscopic observations of actively
growing cells reveal motile, straight rods with rounded ends, occurring singly
and in pairs (Spivey, 1978). This microorganism can be isolated from many
natural sources, including soil, corn and potatoes (Volesky et al., 1981).

Introduction 6
Carbohydrates from a wide variety of sources are readily fermented to acetic and
butyric acid intermediates, which are converted to the neutral end products,
acetone, butanol and ethanol. The morphological (Jones et al., 1982),
physiological (Prescott and Dunn, 1959; Walton and Martin, 1979) and
biochemical (Duong et al., 1983; Zeikus, 1983) changes which occur during the
course of this fermentation have been well documented (Jones and Woods,
1986a; Rogers, 1986).
The conventional batch ABE fermentation carried out by C. acetobutylicum
features two distinct physiological stages (Jones et al., 1982). The initial
acidogenic growth phase is characterized by highly motile phase dark rod
shaped cells which are rapidly dividing. During this logarithmic phase of
growth, sugars are converted to acetic and butyric acids, resulting in a decrease
in the available carbohydrate nutrient supply and a drop in the pH of the
medium (Fig. 1.1). The relative amounts of acetic and butyric acids present
during this growth phase have been shown to be related to the ratio of acetone
and butanol produced during the second or solventogenic growth phase (Martin
et al., 1983).
A switch in the carbon flow from the acid producing pathways to the solvent
producing pathways is correlated with the onset of the solventogenic growth
phase. At this point, the acid concentration in the medium reaches a maximum
which corresponds to the "pH breakpoint" (Jones et al., 1982). This pH
breakpoint was identified early on as being crucial for solventogenesis to occur
(Speakman, 1920; Davies and Stephenson, 1941). During the solventogenic stage,
cell division ceases and the reassimilation of organic acids begins. Continued
uptake and consumption of carbohydrate occurs, resulting in the production of
the neutral solvents acetone, butanol and ethanol.
Granulose is a high molecular weight storage polyglucan containing mainly 1-4
linked D-glucopyranose units (Reysenbach et al., 1986). Just prior to the pH
breakpoint, there is an intracellular accumulation of granulose and a slowing of
cell motility. The cellular morphology associated with the solventogenic phase is

Introduction 7
5 10 10 10
A 4 9
.,...._ .... D 8 > 8
()
> Q.)
"' .D a. Ul
~ E 3 ::::, 8 -
6 U) 6 ~ z '--" -
Q.) Q) /. (/) 2 u 7 0
u CJI /. ::::, 0 <.'.) ....J ·--· 6
0
< "O Cl) I ::::,
4 - 4 Ul
.,...._
• <.Q
"' 2 '--" 2
• I 0 5 0 0
20 30 40 50 60 70 100
90 •-• I '• B
80 ~ • .,...._ 70 I ~ '--" 60
Q.)
a. 50 ... >. f-
I - 40 Q) u 30
20 ... 10 I
0 20 30 40 50 60 70
Time (h)
Figure 1.1 Physiological (A) and morphological (B) profiles for a typical C. acetobutylicum batch fermentation. Symbols Tor graph: (A) corresf-ond to the following: •, glucose concentration (%, w /v); •, total acids (g -1); e, total solvents (g 1-1); D, log10 cell number; 0, pH. Symbols for graph (B) correspond to the following: •, motility; •, phase bnght dostridial cells; e, phase dark rods; 0, forespore containing cells; D, mature spores. All data in plot (B) are expressea as a percentage of the total cell count. (Data from Santangelo et al., 1989).
characterized by phase bright, encapsulated, granulose filled, non-motile cells.
These cells have a swollen rod, cigar shaped morphology, and are commonly
referred to as clostridial forms (Jones et al., 1982; Long et al., 1984a; Reysenbach
et al., 1986). Spivey (1978) reported that by monitoring these morphological
changes associated with the stages of the ABE fermentation, an experienced
observer can assess the progress of the fermentation to within a few hours.
Introduction 8
A typical industrial ABE fermentation is carried out with a relatively low starting
concentration of fermentable sugars (approximately 6.0 to 6.5% w /v) (Spivey,
1978; McNeil and Kristiansen, 1985). Solvent toxicity, particularly that of
butanol, begins at a concentration of approximately 2% (w /v)
(van der Westhuizen et al., 1982). Since one third of the available carbohydrates
are converted to solvents, the use of sugar levels greater than 6.0 to 6.5% (w /v) is
futile. A typical batch ABE fermentation yields 15 to 22 g 1-1 of solvents with an
acetone:butanol:ethanol ratio of 3:6:1 (Spivey, 1978; Jones et al., 1982).
Industrial batch fermentations were generally stopped prior to sporulation,
when the concentration of solvents had reached maximum levels. The loss of
spore forming capability during continuous culture has been associated with the
loss of ability to make solvents (Gottschal and Morris, 1981a). Similar results
were obtained by Long et al. (1983, 1984b) who studied the relationship between
sporulation and solvent production in batch culture. However, reports
concerning sporulation in industrial batch fermentations show that only a small
proportion of the cells proceed to produce mature spores (Jones et al., 1982). In
fermentations where high solvent levels were reached, clostridial forms did not
develop towards sporulation, but degenerated into non-viable cells.
1.2 Biochemistry and physiology of C. acetobutylicum
The conversion of carbohydrates to acids, gases and neutral solvents by C.
acetobutylicum has been extensively recorded (Doelle, 1975; Gottschalk, 1979;
Hartmanis and Gatenbeck, 1984). Reviews by Rogers (1986) and Jones and
Woods (1986a) have outlined the general relationship between the biochemical
pathways and the fermentation profiles of the clostridia, whereas a review by
Haggstrom (1985) has focused primarily on energy metabolism.
1.2.1 Central pathways
In C. acetobutylicum, the breakdown of sugars to pyruvate proceeds via the same
pathways in both the acidogenic and solventogenic stages of growth (Fig. 1.2).
The catabolism of hexose sugars to pyruvate proceeds via the glycolytic pathway

Introduction 9
where 1 mol of hexose yields 2 mol of pyruvate with the net production of 2 mol
of ATP and 2 mol of NADH. C. acetobutylicum, is able to metabolize pentose
sugars via the pentose phosphate pathway (Zeikus, 1980; Volesky and Szczesny,
1983). Three mol of pentose are phosphorylated to pentose 5-phosphate at the
expense of 3 mol of ATP. Three mol of pentose 5-phosphate are converted to
2 mol of fructose 6-phosphate plus 1 mol of glyceraldehyde 3-phosphate by the
action of phophopentose isomerase, phophopentose epimerase, transketolase
and transaldolase enzymes. Fructose 6-phosphate and glyceraldehyde
3-phosphate are intermediates of the glycolytic pathway which can be further
metabolized to pyruvate. Hence the breakdown of 3 mol of pentose yields 5 mol
of pyruvate with the net production of 5 mol of ATP and 5 mol of NADH
(Fig. 1.2).
The phosphoroclastic breakdown of pyruvate is accomplished by the enzyme
pyruvate ferredoxin (Fd) oxidoreductase in the presence of coenzyme A (CoA)
and oxidized Fd to yield carbon dioxide, acetyl-CoA and reduced Fd.
Acetyl-CoA is one of three key intermediates for the branched fermentation
pathways leading to both acid and solvent production. Acetyl-CoA
acetyltransferase is the enzyme responsible for the formation of another key
intermediate, acetoacetyl-CoA, which is formed in a single step by the
condensation of 2 molecules of acetyl-CoA. Butyryl-CoA, the third key
intermediate, is formed from acetoacetyl-CoA by the action of 3 enzymes:
3-hydroxybutyryl-CoA dehydrogenase, crotonase and butyryl-CoA
dehydrogenase. Both 3-hydroxybutyryl-CoA dehydrogenase and butyryl-CoA
dehydrogenase consume reducing power in the form of NADH. The presence of
these 5 enzymes responsible for the breakdown of pyruvate to butyryl-CoA has
been demonstrated in C. acetobutylicum (Waterson et al., 1972; Hartmanis and
Gatenbeck, 1984; Wiesenbom et al., 1988). The fate of these 3 intermediates
differs during the acidogenic and solventogenic growth stages as discussed
below.

Figure 1.2 (Facing page) Biochemical eathways in C. acetobutylicum. Reactions which predominate cfurmg the acidogemc phase are represented by arrows with thick slashed lines, whereas reactions which predominate during the solventogenic phase are represented by arrows with thick solid lines. Reactions common to both pathways are reeresented by arrows with thin lines. The thick dashed solid line for the oxidation of reduced Fd represents a reduction in enzyme activity during the solventogenic growth phase. The thin dash-dot-dot line for the conversion of pyruvate to lactate represents an inducible pathway not normally operating in C. acetobutylicum. All end products of the fermentation (including gases) are enclosed in boxes. Enzymes are indicated by circled numbers as follows: (1) hexokinase; (2) phosphoglucose isomerase; (3) phosphofructokinase; (4) aldolase; (5) triose phosphate isomerase; (6) glyceraldehyde 3-phosphate dehydrogenase; (7) pnospnoglycerate kinase; (8) phosphoglyceromutase; (9) enolase; (10) pyruvate kinase; (11) pyruvate-Fdoxidoreductase; (12) NADH-Fd-oxidoreductase; (13) NADPH-Fdoxidoreductase; (14) hydrogenase; (15) thiolase (acetyl-CoA acetyl transferase); (16) 3-hydroxybutyryl-CoA dehydrogenase; (17) crotonase; (18) butyryl-CoA dehydrogenase; (19) phosphate acety1transferase (phosphotransacetylase); (20) acetate kinase; (21) acetalaehyde dehydrogenase; (22) ethanol dehydrogenase; (23) acetoacetyl-CoA:acetate/butyrate:CoA transferase; (24) acetoacetate decarboxylase; (25) phosphate butyltransferase (phosphotransbutyrylase); (26) butyrate kinase; (27) butyraldehyde dehydrogenase; (28) butanol dehydrogenase; (29) phosphoglucomutase; (30) ADP-glucose pyrophosphorylase; (31) granulose (glycogen) synthase; (32) granulose phosphorylase; {33) pentokinase; (34) a combination of phophopentose isomerase, phophopentose epimerase, transketolase and transaldolase; (35) lactate dehydrogenase.

Introduction
GLUCOSE
:~CD GRANULOSE .. -->r,f' GLUCOSE .---GLUCOSE-1-P <1111i,,-... a GlUCOSE-6-P
® l® c===;.;; FRUCTOSE-6-P
:~@ FRUCTOSE-1,6-DIPHOSPHA TE
(3)A1P ADP(J) ~ (3) PENTOSE Ill ~b (3) PENT0SE-P~(2) GlYCERAL.DEHYOE-3-P®OIHYOROXYACETONE-P
@ @ ~(2) NAO+ 5
@~(2) NAOH
(2) 1,3-DIPHOSPHOGL YCERA TE
(2) ADP~
(2) AlP~(Z}
(2) 3-PHOSPHOGL YCERA TE
11® (2) 2-PHOSPHOCI..YCERATE
lt® (2) PHOSPHOCN<l.PYRUVAT[
NAO+ NAOH (2) ADP~@ + J (2}A1P~
!LACTATE!4-··- .. ----··-:~ • .-.::. .. _ .. ____ .. _ .. _ (2) PYRUVATE
® (2) CoA ~!1!1!!!11!!!!1 FD Ox a~ NAOH ~ NAllPH ® NAO+~ NAllP+
!(2) CO2! ~lililili-~FD Red PROTONS
A 1P Iii' CoA NAllH NAO+ ? NAOPH NAOP+ ? · NAOH NAO+ •
10
~Acn11..-P4ec:z::m>@tzz:z:1=(2) ~F:-\t~r- l J • !ETHANOL! @
.,..IIIIJI .. _ ... ._ ___ A<uoACETYL-CoA
@~: 3-HYOROX'IBUMY\.-CoA
®t¥ CROTONYL-CoA
,o. ~ NAllH ? NAOH NAO+ ? AlP ADP CoA ll.9'~NAO+ NAOH NAO+ · NAOPH NAOP+ ·
--.... c:z:a=~~Jr:zz:z:z:aaeuTYRYL-P-<i~i::z:=!tzzzz:zz:1:z:1eumYL-CoA l La eumALDEHYDE l I a !BUTANOL! ® ® @t @
CoA

Introduction 11
1.2.2 Acid producing pathways
Acetyl-CoA and butyryl-CoA are the two key intermediates in the production of
acetic and butyric acids. The respective formation of acetate and butyrate from
acetyl-CoA and butyryl-CoA occurs via an analogous set of reactions. However,
the enzymes involved in these reactions have been shown to be unique to each
branched pathway (Andersch et al., 1983; Hartmanis and Gatenbeck, 1984; Jones
and Woods, 1986a; Rogers, 1986). The CoA containing intermediates are
converted to their corresponding acyl-phosphates, acetyl phosphate and butyryl
phosphate, by the action of phosphate acetyltransferase and phosphate
butyryltransferase respectively. These acyl-phosphates are metabolized to
acetate and butyrate by the action of acetate kinase and butyrate kinase with the
generation of one ATP for each acyl-phosphate converted. A CoA-transferase
has been shown to be responsible to butyrate formation in C. kluyveri (Stadtman,
1952) and C. aminobutyricum (Hardman and Stadtman, 1963), however no such
transferase involved in butyrate synthesis has been detected in either C.
acetobutylicum or C. beijerinckii (Andersch et al., 1983).
Apart from the production of acetic and butyric acids, C. acetobutylicum can also
convert pyruvate to lactate under certain conditions (Jones and Woods, 1986a).
The production of lactic acid does not occur under ideal conditions. This
pathway operates as a less efficient alternative to the acetate and butyrate
producing pathways, to allow for energy generation and the oxidation of NADH
to continue when the mechanism for proton and electron disposal by the
generation of hydrogen gas is inhibited (Eliasberger, 1930; Simon, 1947; Kim et
al., 1984; Kim and Zeikus, 1985). Although not an acid, acetoin has also been
shown to accumulate when electron disposal is blocked (Doremus et al., 1985).
While the biosynthetic pathway for the production of acetoin in C. acetobutylicum
remains to be elucidated, it has been suggested that this compound could be
produced as an intermediate under conditions in which the lactate pathway
becomes operational (Doremus et al., 1985). Acetoin production is critical in that
it is a structural analog of acetoacetate which can reduce the efficiency of acetone
production.

Introduction 12
1.2.3 Solvent producing pathways
While acetic and butyric acids are produced from the intermediates acetyl-CoA
and butyryl-CoA, a switch in the carbon flow directs these same two
intermediates towards the production of ethanol and butanol respectively
(Fig. 1.2). Like the production of acetate and butyrate, the production of ethanol
and butanol proceeds via a set of analogous reactions. Acetyl-CoA and
butyryl-CoA are converted to their respective aldehydes, acetaldehyde and
butyraldehyde, via a dehydrogenation step. It is not known whether two unique
and independent aldehyde dehydrogenases exist, although this seem likely as
ethanol production has been shown to occur independent of acetone and butanol
production (Jones and Woods, 1986a; Bertram et al., 1990). Ethanol production
may not be regulated by the same mechanisms as butanol production, and it is
possible that ethanol is produced constitutively during both acidogenesis and
solventogenesis. At least two separate alcohol dehydrogenases are responsible
for the metabolism of acetaldehyde and butyraldehyde to ethanol and butanol
respectively. It has been demonstrated in both C. acetobutylicum and C.
beijerinckii, that butanol production occurs via a NADPH dependent butanol
dehydrogenase (George and Chen, 1983; Rogers, 1986), whereas ethanol
production appeared to be carried out via the action of a NADH dependent
ethanol dehydrogenase. However, Welch et al. (1989) have recently purified and
characterized a NADH dependent butanol dehydrogenase from C.
acetobutylicum, indicating that multiple alcohol dehydrogenases may exist in this
organism, and hence may function independently under various growth
conditions. While it has been assumed for some time that a specific NADPH
dependent alcohol dehydrogenase was responsible for the production of butanol,
the isolation of solvent minus mutants (Bertram et al., 1990) indicates that an
NADH specific enzyme is involved (Grupe and Gottschalk, 1990).
The production of acetone from the third key intermediate, acetoacetyl-CoA, is a
two step process where the enzyme acetoacetate decarboxylase carries out the
irreversible conversion of acetoacetate to acetone with the concurrent production
of carbon dioxide (Andersch et al., 1983; Ballongue et al., 1985). Acetoacetate is

Introduction 13
provided by the acetoacetyl-CoA:acetate/butyrate:CoA transferase which acts
upon acetoacetyl-CoA (Hartmanis et al., 1984; Wiesenborn et al., 1989a; Cary et
al., 1990).
Acetic and butyric acids are reassimilated during the solventogenic phase,
resulting in an increase in the pH of the medium. This reassimilation only occurs
with an accompanying consumption of sugars (Davies and Stephenson, 1941;
Hartmanis et al., 1984). Early studies showed that the addition of extraneous
acetate and butyrate enhanced the yields of acetone and butanol (Reilly et al.,
1920; Bernhauer and Kurschner, 1935). A later study by Wood et al. (1945),
showed that when 14C labeled acetate was added to solvent producing cultures
of C. acetobutylicum, 55% of the label was recovered in butanol and 15% of the
label was recovered in acetone. Similarly, the addition of 14C labeled butyrate
resulted in 85% and 2% of the label being recovered in butanol and acetone
respectively. More recent studies also employing 14C labeled butyrate showed
almost identical results. In these experiments, the half life of butyrate in the
medium was determined to be approximately 20 min and a complete turnover of
acids occurred within 2 h (P. Rogers, personal communication). Therefore, the
majority of the acetate and butyrate taken up by C. acetobutylicum is rapidly
converted to butanol. The effect of short chain fatty acids on the fermentation
yields of C. acetobutylicum, has continued to be the focus of more recent studies
(Gottschal and Morris, 1981b; Bahl et al., 1982a; Martin et al., 1983; Clark et al.,
1989; Wiesenborn et al., 1989a; Husemann and Papoutsakis, 1990).
Although a number of different mechanisms have been postulated for the uptake
of acetic and butyric acids (see Jones and Woods, 1986a), recent results indicate
that this reassimilation is directly coupled to the production of acetone by way of
acetoacetyl-CoA:acetate/butyrate:CoA transferase. A study by Andersch et al.
(1983) clearly showed that acetate and butyrate can both act as a CoA acceptor
during the conversion of acetoacetyl-CoA to acetoacetate resulting in the
conservation of the CoA unit by the simultaneous production of acetyl-CoA or
butyryl-CoA. The decarboxylation of acetoacetate by the acetoacetate

Introduction 14
decarboxylase has been postulated to pull the transferase reaction toward the
formation of acetoacetate (Hartmanis et al., 1984).
1.2.4 Energy and electron distribution
Ferredoxin (Fd) is a major electron carrier in the metabolic pathways of C.
acetobutylicum. It is a small acidic iron-sulfur containing protein that is capable of
accepting and donating electrons at a very low potential (Jones and Woods,
1986a). In C. acetobutylicum 4 enzymes are known to require Fd for complete
functionality. As mentioned above, the pyruvate-Fd-oxidoreductase transfers
electrons from the phosphoroclastic breakdown of pyruvate to oxidized Fd to
yield reduced Fd. The hydrogenase enzyme in turn utilizes the electrons carried
by reduced Fd and together with protons, forms molecular hydrogen. The
enzyme NADPH-Fd-oxidoreductase can also utilize reduced Fd in the controlled
production of NADPH. This may be the only route for the production of
NADPH, which is required for biosynthesis, since most clostridia appear to lack
the enzymes required for the oxidation of glucose 6-phosphate that produce
NADPH (Jungermann et al., 1973). The analogous yet separate enzyme, NADH
Fd-oxidoreductase, cycles electrons between Fd and NADH, and hence is key to
the electron distribution in this organism (Jungermann et al., 1973; Petitdemange
et al., 1976).
The growth of anaerobes is limited by the rate of energy producing reactions
(Thauer et al., 1977). In C. acetobutylicum the glycolytic breakdown of 1 mol
glucose to 2 mol pyruvate yields a net production of 2 mol ATP and 2 mol of
NADH. During acidogenesis, 1 mol of ATP is produced per mole of acyl
phosphate converted to acid end product. Therefore, the net energy yield
obtained when 1 mol of glucose is converted to 2 mol of acetate is 4 mol of ATP.
Since 2 mol of acetyl-CoA are require for the production of 1 mol of butyryl-CoA,
the net energy yield obtained when 1 mol of glucose is converted to 1 mol of
butyrate is 3 mol of ATP. In a normal batch fermentation, the acetate to butyrate
ratio is approximately 2:3 (mol:mol) (Jones and Woods, 1986a). Accounting for
the acetate to butyrate ratio, Rogers (1986) calculated the ATP yield for the
Introduction 15
acidogenic growth phase to be about 3.25 mol ATP per mol of glucose consumed,
with a thermodynamic efficiency of approximately 62%. Apart from ATP
produced during glycolysis, no further ATP production occurs during
solventogenesis via the synthesis of acetone, butanol and ethanol. Therefore, the
ATP balance for the solventogenic growth phase drops to 2 mol ATP per mol of
glucose consumed.
The energetically more favourable production of acetate results in a net
generation of 2 mol NADH. During both acidogenesis and solventogenesis
2 mol of reducing power, in the form of NADH, are consumed in the conversion
of 2 mol of acetyl-CoA to 1 mol of butyryl-CoA. Therefore, even though butyrate
production yields less ATP than does acetate production, it is redox neutral.
Since the breakdown of glucose to acetyl-CoA yields 2 mol of NADH, and
considering that only a portion of the resulting acetyl-CoA is converted to
butyrate, excess NADH must either accumulate, or be cycled through Fd via the
NADH-Fd-oxidoreductase. The latter would result in reduced Fd and hence
require increased hydrogen production for electron disposal and recycling of Fd
to its oxidized state. The solvent producing pathways, but not the acid
producing pathways, provide additional routes for the disposal of NADH, where
both aldehyde dehydrogenases, as well as the alcohol dehydrogenases, each
consume 1 mol of NADH per mol of substrate converted to product. This
indicates that any accumulation of NADH and hence the activities of the NADH
Fd-oxidoreductase and hydrogenase enzymes, all play a role in the switching of
the carbon flow from acid production to solvent production.
1.3 Triggers and regulation in C. acetobutylicum
Both the induction of solventogenesis and the induction of sporulation appear to
be linked to the inhibition of vegetative growth and normal cell division (Jones
and Woods, 1986a). The development of chemically defined media that support
the complete life cycle of C. acetobutylicum (Andersch et al., 1982; Long et al.,
1983; Monot and Engasser, 1983) has greatly facilitated studies involved in the
elucidation of the external triggers that influence differentiation to solvent

Introduction 16
production and to sporulation. Furthermore, the development of mutagenic
systems and the isolation of C. acetobutylicum mutants (Jones et al., 1982; Long et
al., 1984a; Bowring and Morris, 1985; Jones and Woods, 1986b) has also aided this
area of research. However, the mechanisms by which these signals are
interpreted to molecular events which adjust specific enzyme activities are only
just starting to be realized.
1.3.1 Regulation of solvent production
The external catalysts that trigger the metabolic shift from acid production to
solvent production have been extensively studied. A number of significant
changes in the fermentation pattern are associated with the end of the initial
phase of growth. A decrease in the pH of the medium, which is related to an
increase in the concentration of acid end products, cessation of cell division and a
decrease in the rate of hydrogen production all characterize the onset of the
solventogenic growth phase.
The role of pH has long been recognized as being important to the outcome of
the ABE fermentation. Almost all studies concerning the ABE fermentation
mention the importance of a "pH breakpoint" in allowing the fermentation to
proceed to solventogenesis. Studies have shown that cultures which are
maintained at a high pH produce mainly acids, whereas cultures maintained at a
low pH produce solvents (Jones and Woods, 1986a; Rogers, 1986). The pH
optima for solvent production does however vary from strain to strain (see Jones
and Woods, 1986a). While attainment of a low pH is necessary for solvent
production, it has been shown that this low pH is not in itself a sufficient trigger
for solvent production (Gottschal and Morris, 1981b; Long et al., 1984a).
The fall in the pH of the medium is a consequence of the production of acetate
and butyrate. These organic acids are toxic, and in their undissociated form they
are able to partition in the cell membrane and behave as uncouplers which
permit the entry of protons into the cell (Kell et al., 1981; Husemann and
Papoutsakis, 1986). A recent study showed that a transition from a neutral pH to
an acidic pH resulted in the formation of transmembrane lipids that increase the

Introduction 17
rigidity of the cell membrane which in turn alters the bioelectrochemical
processes that occur across this membrane (G. Zeikus, personal communication).
At sub-critical concentrations, the accumulation of acid end products results in a
decrease in the specific growth rate of the cell, although substrate utilization and
cell metabolism continue (Herrero, 1983). It has been suggested that the switch
to solvent production is a detoxification mechanism which allows the cell to
avoid the inhibitory effects that would occur if acid end products were allowed
to reach critical levels (Jones and Woods, 1986a).
The pH of the cell environment determines the percentage of acids which are in
their undissociated form. Undissociated butyric acid in particular, was shown to
be essential in the regulation of solvent production (Bahl et al., 1982a). If the
critical level of undissociated butyric acid was not obtained because of either too
high a pH or too low an initial substrate concentration, solvent production did
not occur (Bahl et al., 1982a; Bahl and Gottschalk, 1985).
Monot et al. (1984) showed that blocking the function of the membrane bound
ATPases results in a decrease in the internal pH of the cell. By decreasing the
internal pH, the concentration of undissociated acids is increased. Under these
conditions, there was a reduction in the maximum biomass levels with an
enhancement of solvent production. Unlike most other organisms, bacteria that
produce weak acids are not able to maintain a constant internal pH (Riebeling et
al., 1975; Baronofsky et al., 1984). In these organisms, the proton translocating
A TPase is used to control the internal pH in response to fluctuations in the
external pH. By altering the internal pH at the expense of ATP, C. acetobutylicum
is able to maintain a more or less constant pH gradient across it's membrane as
the pH of the external medium decreases (Bowles and Ellefson, 1985; Gottwald
and Gottschalk, 1985; Huang et al., 1985; Andreesen et al., 1989). The shift to
solvent production and the reassimilation of acids may therefore be a necessary
event so that the cell is able to maintain this pH gradient across its membrane. If
the concentration of undissociated acids was allowed to rise, the cost to the cell
in terms of ATP, would eventually be greater than the amount of ATP produced
by the generation of these acids.

Introduction 18
Solvent production only occurs with accompanying glucose consumption.
Studies of fermentations where the carbon source was limited showed that
solvent production did not occur and hence only acids were produced (Gottschal
and Morris, 1981a; Bahl et al., 1982a; Fond et al., 1984; Long et al., 1984a). In these
studies, the concentration of acid end products did not reach the threshold
concentration required for the initiation of solvent production. Attempts to
produce solvents under conditions of nitrogen limitation in the presence of
excess glucose, yielded similar results. Using batch cultures, Long et al. (1984a)
showed that low concentrations of ammonia (9.0 mM) resulted in the
consumption of less than one-third of the available glucose and no solvent
production. Studies using ammonium limited chemostat cultures also showed
that solvent production did not occur (Gottschal and Morris, 1981a; Andersch et
al., 1982). Apparently the threshold level of acids was not reached and therefore
no induction of solventogenesis occurred. Limiting the concentration of
phosphate or sulfate in batch and continuous cultures displayed more success at
inducing solvent production than did glucose or ammonium limitation (Bahl et
al., 1982b; Bahl and Gottschalk, 1985). High yields of acetone and butanol were
obtained in a phosphate limited two-stage continuous culture, and apparently
this process was uninterrupted for 1 year without a change in cell activity (Bahl
et al., 1982b).
1.3.2 Regulation of electron flow
In the solvent producing clostridia, the pathways for acid production alone do
not provide for the disposal of excess NADH produced during glycolysis. These
clostridia have the ability to produce hydrogen and therefore can process both
excess electrons and protons through this route. During acidogenesis, a major
portion of the electron flow is directed to hydrogen production, whereas the
carbon flow is directed to acid production. Recent studies have shown that
during this growth phase more hydrogen is produced than is theoretically
possible from the phosphoroclastic breakdown of pyruvate alone (Martin et al.,
1982; Kim and Zeikus, 1985).

Introduction 19
The 2 enzymes NADH-Fd-oxidoreductase and hydrogenase play a pivotal role in
controlling the direction of electron flow, as well as the acetate:butyrate ratio
(Jones and Woods, 1986a). Hydrogenase activity is reduced when the partial
pressure of hydrogen is high, and studies with C. butyricum showed that an
increase in the partial pressure of hydrogen resulted in an increase in the amount
of butyrate produced with respect to acetate (Crabbendam et al., 1985). An
increase in the carbon flow through the glycolytic pathway results in an increase
in the level of acetyl-CoA, and this increase has been shown to stimulate the
activity of NADH-Fd-oxidoreductase in the clostridia (Jungermann et al., 1976).
Therefore, an efficient route for the disposal of excess NADH is provided,
allowing for the more energy favourable production of acetate.
In C. acetobutylicum the shift from acidogenesis to solventogenesis is
accompanied by a decrease in hydrogen production and an increase in CO2
production. Less hydrogen is produced than would be expected from the
oxidation of pyruvate, indicating that during this growth phase both carbon and
electron flow are primarily directed to solvent production. This switch in carbon
flow appears to be directly linked to the reduction of hydrogen production, and
Kim and Zeikus (1985) observed that the specific rate of hydrogen production
decreased in stages during the course of a batch fermentation. As expected, the
highest rate of hydrogen production occurred during the initial growth phase,
which could be correlated with a high rate of glucose consumption. A decrease
in the metabolic activity resulted in a decrease in hydrogen production, however
specific hydrogenase activity associated with the whole cell did not alter. It was
concluded that this decrease in hydrogen production was due to a decline in the
availability of reduced Fd resulting from a decrease in glucose consumption.
These authors noted a second, more significant, decrease in the rate of hydrogen
production which correlated with the shift from acid production to solvent
production. In this case the specific hydrogenase activity with respect to the
whole cell did decrease.
The specific hydrogenase activity in whole cells from acid producing cultures
was shown to be approximately 2.2 times higher than that measured from

Introduction 20
solvent producing cultures (Kim and Zeikus, 1985). Kim and Zeikus (1985)
demonstrated that hydrogenase activity was not affected by either pH or acid
concentration, and concluded that a decrease in hydrogen production during
solventogenesis is a result of regulation of hydrogenase production as opposed
to an inhibition of enzyme activity. In contrast to these findings, Andersch et al.
(1983) reported that hydrogenase activity was similar in both acid and solvent
producing cells. However, hydrogenase activity in solvent producing cells could
only be detected in the assay after an initial lag period of 10 to 15 min. These
authors concluded that the hydrogenase from the solvent producing cells was
present in an inactive form and the conditions used for the assay activated the
enzyme after a lag period.
Hydrogenase activity, and therefore solvent production, could be altered by
changing the partial pressure of hydrogen in the culture vessel. It was shown
that by using hydrogen to increase the headspace pressure to between 100 and
250 kPa, the yields of butanol and ethanol could be increased (Gapes et al., 1982).
Increasing the partial pressure of hydrogen in the headspace resulted in a
decrease in hydrogenase activity. A similar study was carried out by Yerushalmi
et al. (1985), where the headspace of the fermentation vessel was pressurized
with either hydrogen .or helium. When hydrogen was used to pressurize the
fermenter to between 270 and 1 500 kPa, butanol and ethanol yields were
increased by an average of 18 and 13% respectively. A much lower increase in
butanol and ethanol production was noted when helium was used to pressurize
the culture vessel. A similar, yet weaker effect was noted when C. acetobutylicum
cultures were not agitated, allowing for the partial pressure of hydrogen to rise
naturally (Doremus et al., 1985; Yerushalmi and Volesky, 1985). Together, these
results verify that when conditions are reached where the partial pressure of
hydrogen is increased, there is a resulting decrease in hydrogen production and
a stimulation of butanol and ethanol production, but not acetone production.
Under these conditions, the H+ /H2 redox potential is lowered and the flow of
electrons from reduced Fd to molecular hydrogen is thermodynamically
unfavourable (Jungermann et al., 1971b). Because the hydrogenase was

Introduction 21
inhibited, the flow of electrons from reduced Fd was shifted to the generation of
NADH and NADPH via the actions of the respective Fd-oxidoreductase.
Stimulation of ethanol and butanol production was therefore necessary for the
disposal of electrons carried by these reduced pyridine nucleotides.
Carbon monoxide (CO) is known to reversibly inhibit the function of
hydrogenases by reacting with iron present in the active site of the enzyme
(Thauer et al., 1974; Mortenson and Chen, 1975). Sparging cultures of C.
acetobutylicum with CO has been shown to alter the fermentation balance,
resulting in an increase in the butanol yield (Kim et al., 1984; Datta and Zeikus,
1985; Meyer et al., 1985). Acetate and butyrate uptake can also be enhanced
when cultures are sparged with CO. Increasing the partial pressure of the
culture vessel with CO to between 100 and 150 kPa resulted in a 50% decrease in
hydrogen production, a 50 to 200% increase in butyrate uptake and a 10 to 15%
increase in butanol yield (Datta and Zeikus, 1985). It is also important to note
that CO has been shown the inhibit the acetoacetate decarboxylase enzyme
which is responsible for the formation of acetone. Therefore, the ratio of solvents
can be controlled by a combination of CO sparging and the addition of organic
acids (Datta and Zeikus, 1985).
The fate of reduced Fd determines the electron distribution in the cell in that it
can either transfer electrons via hydrogenases to produce hydrogen, or electrons
can be transferred via the appropriate Fd-oxidoreductase to yield reduced
pyridine nucleotides. Therefore, the activities of NADH-Fd-oxidoreductase,
NADPH-Fd-oxidoreductase and hydrogenase in effect control the direction of
carbon flow by controlling the electron flow within the cell (Jungermann et al.,
1973, 1976; Jones and Woods, 1986a). Glyceraldehyde 3-phosphate
dehydrogenase and NADH-Fd-oxidoreductase both function in controlling the
levels of NAD+ and NADH in the cell. Furthermore, CoA and acetyl-CoA are
known to act as allosteric inhibitors and activators of NADH-Fd-oxidoreductase
respectively (Jungermann et al., 1973). Since a high concentration of NADH
inhibits the production of NADH via the NADH-Fd-oxidoreductase, and
considering the role of CoA and acetyl-CoA in controlling this enzyme, the ratios

Introduction 22
of acetyl-CoA:CoA and NAD+:NADH must play a principal role in the
regulation of electron flow, and hence carbon flow, in C. acetobutylicum (Datta
and Zeikus, 1985; Jones and Woods, 1986a). In addition, it has been postulated
that the ratios of these compounds can function as sensors for both ATP
regeneration and hydrogen production (Datta and Zeikus, 1985).
1.3.3 Sporulation and stationary phase events
Bacillus subtilis has been the organism of choice for studying the metabolic and
genetic events associated with endospore formation in bacteria. From these
studies the process of endospore formation has been simplified as occurring in
two discrete phases: (i) the initiation phase where growing cells recognize and
respond to changes in the environment where rapid growth is no longer
supported, and (ii) the differentiation phase where genes whose products are
required for sporulation are expressed in a defined and genetically determined
order (Sonenshein, 1985). It has been extensively demonstrated that in B. subtilis
spore formation can be initiated by exposing rapidly multiplying cells in a liquid
medium to a nutritionally poor medium (Sterlini and Mandelstam, 1969; Losick
et al., 1986; Sonenshein, 1989). Unfortunately, similar nutrient shift down
procedures do not induce sporulation in the clostridia, and it has been shown
that these organisms sporulate only under conditions where growth is limited in
the presence of an exogenous carbon and energy source (Murrell, 1967; Hickey
and Johnson, 1981; Woods and Jones, 1986). In C. acetobutylicum in particular,
neither glucose nor ammonium limitation succeeded in the induction of
solventogenesis or sporulation (Long et al., 1983, 1984a). In fact, these studies
showed that at intermediate concentrations of glucose or ammonia, the yield of
endospores was proportional to the substrate concentration.
It appears that in C. acetobutylicum, sporulation is initiated by the same factors
which induce solvent formation, which include a decrease in pH and the
accumulation of acid end products. This suggests that a parallel switch for both
solventogenesis and sporulation exists. As mentioned previously, the findings of
Gottschal and Morris (1981a) that correlated a loss of spore forming ability with a
Introduction 23
loss of the ability to produce solvents, support this idea of a parallel switch.
However, the isolation of asporogenous mutants that maintain the ability to
produce solvents, demonstrates that initiation of spore formation is not a
prerequisite for solvent production. Asporogenous C. acetobutylicum mutants
blocked before (SPO 0) or after (SPO II-VD forespore septum initiation, retained
the ability to produce solvents (Jones et al., 1982; Long et al., 1984b).
Gottschal and Morris (1981a) and Jones et al. (1982) both reported the isolation of
a second class of asporogenous C. acetobutylicum mutants. Apart from being
asporogenous, these isolates, termed els mutants (Jones et al., 1982), did not
develop into clostridial forms and therefore lacked all the stationary phase
characteristics associated with solventogenesis. Solvent production, capsule
production, granulose production and endospore formation were all absent in
these els mutants (Long et al., 1984a, 1984b). The els mutants derived from C.
acetobutylicum P262, were isolated after treatment with ethyl methane sulfonate
(EMS). EMS is a direct mutagenic agent know to cause point mutations by
alkylating purine bases (Birge, 1981). Assuming that the els mutants were
derived from single point mutations, the observation that normal wild type
characteristics are restored by reversion of such mutations suggests that the
induction of the stationary phase events is linked by some common regulatory
mechanism. However, it is not known if the els mutation is a result of a defect in
coordinate induction of the events associated with solventogenesis or if it is
related to . an inability to attain or maintain a particular physiological state
necessary for the onset of solventogenesis (Jones and Woods, 1986a).
Apart from the solvent producing asporogenous mutants mentioned above,
mutants lacking other individual stationary phase events have been isolated
(Jones and Woods, 1988). These include mutants that are unable to produce
granulose or extracellular capsule material, as well as mutants that produce
altered levels of solvents (Long et al., 1984b; Durre et al., 1986; Reysenbach et al.,
1986; Rogers, 1986). The isolation of these mutants demonstrates that although
the induction of stationary phase events may be linked, the individual pathways
leading to these events function independently. While solvent production,

Introduction 24
granulose accumulation and capsule formation do not appear to be sporulation
specific events (Long et al., 1984b), the initiation of these events may be a
prerequisite for initiation of sporulation. Definitive experimental support for
this hypothesis is limited, however it is interesting to note that a single
mutagenic treatment has never been reported to lead to the isolation of a C.
acetobutylicum mutant that lacks all stationary phase events except sporulation.
1.4 Genetic studies of C. acetobutylicum
The development of systems for the transfer of nucleic acids into C.
acetobutylicum has lagged behind the ability to study genes from this bacterium
in other organisms such as E.coli and B. subtilis. High levels of extracellular and
cell bound deoxyribonuclease (DNAse) activity are associated with the majority
of C. acetobutylicum strains (see Jones and Woods, 1986b). This has hampered
attempts at transferring DNA into C. acetobutylicum via many methods such as
protoplast fusion and transfection. Recent advances in the construction of
suitable cloning vectors and transformation techniques for C. acetobutylicum,
have provided the much needed basis for future genetic manipulations of this
organism. The rapid progress in these areas has been the subject of recent
publications (Jones and Woods, 1986b; Jones and Woods, 1988; Young et al.,
1989a, 1989b; Minton et al., 1990a, 1990b).
1.4.1 Ooned C. acetobutylicum genes
Apart from chemical mutagenesis, the initial approach used for genetic studies of
C. acetobutylicum, was to clone and study clostridial genes in well characterized
bacteria such as E.coli (Jones and Woods, 1986b).
The first genes cloned from C. acetobutylicum included an endoglucanase, a
xylanase and some amino acid utilization genes (Efstathiou and Truffant, 1986;
Zappe et al., 1986, 1987, 1988). These genes appeared to be expressed from their
own promoters, thereby demonstrating that C. acetobutylicum genes could
function in E.coli. The importance of nitrogen metabolism in the life cycle of C.
acetobutylicum led to the cloning of a glutamine synthetase gene (Usdin et al.,

Introduction 25
1986). This glnA gene was also expressed from its own promoter and was
regulated by nitrogen levels in E.coli (Janssen et al., 1988, 1990). Other C.
acetobutylicum genes that have been cloned into E.coli include a lactate
dehydrogenase (Contag et al., 1990), an a-amylase (J. van der Leyden, personal
communication) and the endonuclease Cac824I (E.T. Papoutsakis, personal
communication).
Attainment of a molecular level understanding of acidogenic and solventogenic
pathway gene regulation has focussed most efforts towards cloning of these
genes. Genes coding for the central pathway enzymes thiolase (G.N. Bennett,
personal communication) and 3-hydroxybutyryl CoA dehydrogenase
(Youngleson et al., 1989a) have been cloned and studied in E.coli. Initial reports
(Youngleson et al., 1989a, 1989b) indicated that the 3-hydroxybutyryl CoA
dehydrogenase formed part of a but operon which included an alcohol
dehydrogenase. However, recent experiments reveal that while these two genes
are linked on the C. acetobutylicum chromosome, they may function
independently. (D.R. Woods, personal communication).
Acidogenic pathway genes coding for the two enzymes, butyrate kinase and
phosphotransbutyrylase which are responsible for the conversion of
butyryl-CoA to butyrate, have been cloned and were also found to be linked on a
contiguous stretch of C. acetobutylicum chromosomal DNA (Cary et al., 1988;
Wiesenborn et al., 1989b).
A NADPH dependent alcohol dehydrogenase was the first solvent pathway gene
to be cloned (Youngleson et al., 1988, 1989b). Recently a NADH dependent
butanol dehydrogenase has been cloned (G.N. Bennett, personal
communication), indicating that more than one enzyme may be able to carry out
the conversion of butyraldehyde to butanol. Other cloned solvent pathway
genes include the acetoacetate decarboxylase (Gerischer and Durre, 1990;
Petersen and Bennett, 1990) and the acetoacetyl-CoA:acetate/butyrate:CoA
transferase (Cary et al., 1990). Both of these genes were cloned in two
independent laboratories, with each group isolating these genes from unique C.

Introduction 26
acetobutylicum strains. Both groups showed that these two genes were linked on
a contiguous piece of C. acetobutylicum chromosomal DNA (G.N. Bennett and P.
Durre, personal communications).
1.4.2 Genetic manipulation of C. acetobutylicum
The development of efficient gene transfer systems for C. acetobutylicum is
essential for future genetic manipulations of this organism. Protoplast fusion
and regeneration using C. acetobutylicum strain P262 (Allcock et al., 1982; Jones et
al., 1985) and C. saccharoperbutylacetonicum strain Nl-4080 (Reysset et al., 1987,
1988) has been reported. The efficiency of these systems was however low, most
likely due to the high nuclease and autolysin activities associated with these
organisms (Jones and Woods, 1986b). An autolysin deficient mutant (Nl-4081) of
strain Nl-4080 was isolated, and proved to be more easily regenerated (Reysset
et al., 1988).
Conjugal transfer of DNA into C. acetobutylicum was first reported by Reysset
and Sebald (1985), who showed that the streptococcal plasmid pAM~l could be
transferred to C. acetobutylicum strains 903 and A TCC 824 at a frequency
approaching lQ-6 per donor. The plasmid pAM~l was also shown to be
conjugatively transferred to C. acetobutylicum strain NCIB 8052 using either
Streptococcus lactis or B. subtilis as the donor (Oultram and Young, 1985; Oultram
et al., 1987). Several other broad host range plasmids such as pIP501, pJH4, and
pVA797 have been transferred to C. acetobutylicum via conjugation (Young et al.,
1989a, 1989b). Furthermore, plasmids pVA797 and pAT187 have been shown to
mobilise non conjugative plasmids such as pAM610 into C. acetobutylicum strains
P262 (Yu and Pearce, 1986) and NCIB 8052 (Young et al., 1989a, 1989b)
respectively. Recently, Williams et al. (1990) developed a conjugative transfer
system using E. coli as the donor and C. acetobutylicum NCIB 8052 as the
recipient. However, these authors reported that they were unable to successfully
apply this system to other C. acetobutylicum strains such as DSM 1731, ATCC 824
and P262. Since E.coli has generally been utilized as the standard organism for
genetic manipulations, this conjugation system is very attractive.

Introduction 27
Transposons have been extensively employed in genetic studies of many
organisms. In E.coli transposons have been used to identify promoters, to test
for export mechanisms, to clone genes and to generate specific and polar
mutations (de Bruijn and Lupski, 1984). Conjugative transposons are able to
function in a wide variety of Gram positive hosts (Clewell and Gawron-Burke,
1986) including C. acetobutylicum (Young et al., 1989a, 1989b). Yu and Pearce
(1986) reported the successful expression of the streptococcal transposon Tn917
in C. acetobutylicum, however these authors did not demonstrate whether the
tran'sposon was incorporated into the host chromosome, or remained on the
plasmid used for transfer. Woolley et al. (1989) demonstrated that the
conjugative transposons Tn916 and Tn1545 could be transferred from
Enterococcus faecalis to C. acetobutylicum NCIB 8052. Both of these transposons
harbour a tetracycline resistance (TcR) marker, and while Tn1545 was able to
insert into the C. acetobutylicum chromosome at multiple sites, Tn916 had
favoured sites of insertion. Bertram and Durre (1989) showed that the
conjugative transposons Tn925, Tn916 and Tn925:Tn917 could also be efficiently
transferred from E. faecalis to the chromosome of C. acetobutylicum. Exemplifying
the differences amongst C. acetobutylicum strains, these authors demonstrated
that Tn916 could insert at multiple sites in the chromosome of strains ATCC 824,
DSM 792 and DSM 1731.
Using the Tn916 conjugation/mutagenesis system, Bertram et al. (1990) isolated
three types of mutants of C. acetobutylicum DSM 792, by selecting for colonies that
were resistant to either allyl alcohol or 2-bromobutyrate. The type I mutant
lacked the ability to produce acetone and butanol, type II produced reduced
levels of solvents and type III showed an increase in butanol production. These
mutants were asporogenous and lacked the ability to accumulate granulose.
These latter characteristics could however be due to an effect of tetracycline
(transposon marker), in an analogous fashion to the effect of chloramphenicol
which inhibits sporulation in B. subtilis. These authors showed that the type I
mutant contained only one copy of Tn916, and considering that both acetone and
butanol production was absent, the hypothesis that there is global regulation for

Introduction 28
the initiation of solventogenesis is strongly supported. The ability of the type I
mutant to produce ethanol suggests that ethanol production may be independent
from the induced solvent pathways for acetone and butanol production.
Subculturing the above transconjugants 15 times in the absence of selective
pressure (Tc) for the transposon, resulted in approximately 50% of the colonies
becoming sensitive to tetracycline while maintaining the mutant phenotype.
Hybridization studies revealed that these Tcs revertants did not contain the
Tn916 transposon. This suggests that transposon excision in C. acetobutylicum is
not precise, which is in contrast to results obtained with Tn916 in E.coli
(Gawron-Burke and Clewell, 1984).
As an alternative to conjugation, lytic and lysogenic phages known to infect C.
acetobutylicum could be developed into possible cloning vectors. Bacteriophages
have been identified as the cause of abnormal fermentations (McCoy et al., 1944),
and the initial characterization of some of these phages has been carried out
(Hongo et al., 1968; Ogata and Hongo, 1979; Nieves et al., 1981). Although whole
cell transduction of C. acetobutylicum has not been reported, the successful
development of lysogenic phages such as q,105 as cloning vectors for B. subtilis
(Errington, 1984) indicates that an analogous system could be developed for C.
acetobutylicum. Further efforts to characterize and develop C. acetobutylicum
phages are currently in progress (D.T. Jones, personal communication).
A procedure by which a high voltage electric discharge through a cell suspension
facilitates the introduction of DNA into the cells, offers yet another alternative to
conjugation. This procedure, known as electroporation, is believed to induce
transient pores in the cell membrane through which exogenous DNA can enter
the cell (reviewed by Fiedler and Wirth, 1988; Wirth et al., 1989). Successful
transformation via electroporation has been reported for a number of Gram
positive bacteria including members of the genera Streptomyces, Streptococcus,
Lactobacillus and Bacillus (see Lucansky et al., 1988). Recently, Oultram et al.
(1988) reported that C. acetobutylicum NCIB 8052 could be transformed by
electroporation at frequencies approaching 3 X 10³ transformants per µg DNA.

Introduction 29
The convenience of transforming naked DNA and the ease of use of this
procedure, may render it the method of choice for the introduction of foreign
DNA into C. acetobutylicum.
1.4.3 Cloning vectors for C. acetobutylicum
Concurrent with developments concerning the introduction of DNA into C.
acetobutylicum was the construction of suitable cloning vectors for use in this
organism. While the occurrence of plasmids in the clostridia has been noted,
none of these plasmids contain selectable markers suitable for genetic
manipulations (Minton and Thompson, 1990). This has necessitated the in vitro
construction of vectors by combining replicons and antibiotic resistance genes
known to function in C. acetobutylicum (Truffaut et al., 1989; Minton et al., 1990a,
1990b; Yoshino et al., 1990).
As a starting point, Minton and co-workers cloned the antibiotic resistance genes
for Erythromycin (Em), Tetracycline (Tc) and Chloramphenicol (Cm) into the
pUC like cloning vectors pMTL20 and pMTL21 (Chambers et al., 1988) to yield
pMTL20/21E, pMTI20/21T and pMTL20/21C respectively. The next step was
to include replicons known to function in the clostridia. Four different sources of
clostridial replicons were cloned into these vectors, and provided resultant
plasmids that were able to function in C. acetobutylicum (Minton et al., 1990a).
Interestingly, none of these replicons supported efficient plasmid replication in
B. subtilis, indicating that clostridial replicons are functionally distinct from those
found in aerobic Gram positive bacteria (Gruss and Ehrlich, 1989).
Features such as a broad host range and structural stability, led these workers to
base further C. acetobutylicum vector construction on the streptococcal plasmid
pAMj31, and therefore a detailed study of the replication region of this plasmid
was performed (Swinfield et al., 1990). As a result of this analysis, a 2.9 kb
EcoRl-HpaI fragment carrying the replication region of pAMj31 was cloned into
the plasmid pMTL20E resulting in plasmid pMTLSOOE (Swinfield et al., 1990;
Minton et al., 1990b). Plasmid pMTLSOOE retains all of the desirable features of
the pUC like cloning vector pMTI20. These features include a multiple cloning

Introduction 30
site polylinker which resides within the lacZ' region, the bla gene for ampicillin
selection in E.coli and an E.coli origin of replication. Due to the broad host range
of pAM~l, the vector pMTLSOOE is also able to replicate in B. subtilis as well as
C. acetobutylicum. Analogous procedures led to the construction of plasmids
pMTLSOOC and pMTLSOOT (from pMTL20C and pMTL20T) where the Gram
positive antibiotic resistance markers were chloramphenicol and tetracycline
respectively.
Segregational instability in the absence of selective pressure, has been shown to
be a problem with vectors constructed for use in C. acetobutylicum (Truffaut et al.,
1989; Yoshino et al., 1990). In the absence of Em, pMTLSOOE also showed
segregational instability in both B. subtilis and C. acetobutylicum (Minton et al.,
1990a). Janniere et al. (1989) showed that certain pAM~l derived cloning vectors
for use in B. subtilis also showed segregational instability. However, one of these
B. subtilis vectors, pHV1431, contained an additional 2.12 kb of pAM~l DNA and
was much more stable in the absence of selective pressure. Insertion of this
2.12 kb fragment into the multiple cloning site of pMTLSOOE (=pMTL531E)
significantly improved the segregational stability in both B. subtilis and C.
acetobutylicum (Minton et al., 1990a). Molecular analysis of the 2.12 kb region
revealed 2 open reading frames, one of which coded for a protein that showed
good similarity to the resolvases of the Gram positive transposon Tn917 (Minton
et al., 1990a). It has been suggested that the resolvase like proteins present on
other Gram positive plasmids such as pI524 and pIP404, can mediate plasmid
stability by maintaining the plasmid population in the monomeric state (Gamier
et al., 1987; Rowland and Dyke, 1988). A similar role may be carried out by the
resolvase like protein identified on pMTL531E (Minton et al., 1990a). Since the
multiple cloning site of pMTL531E was disrupted by the resolvase containing
DNA, the plasmid pMTLSOOE(res+) was constructed such that the multiple
cloning site of pMTLSOOE remained intact (Minton et al., 1990a). This plasmid
had a similar segregational stability to pMTL531E.
To further enhance the usefulness of the pMTLSOO series of vectors, the lac
promoter element of pMTLSOOE was replaced with the C. pasteurianum Fd

Introduction 31
promoter element, such that the AUG start codon of Fd became that of the lacZ'
gene. To allow for regulatory control, a synthetic lac operator was inserted
between the -10 region and the ribosome binding site of this promoter element
(at position +1) (Minton et al., 1990b). The resulting plasmid was designated
pMTLSOOF, and it was shown that in E.coli, transcription from the Fd promoter
could be regulated by a lac! repressor protein produced from a coexisting
plasmid (Minton et al., 1990a). A similar control mechanism for pMTLSOOF in C.
acetobutylicum is currently being developed (Minton et al., 1990a) analogous to a
system that was developed for B. subtilis (Peschke et al., 1985).
1.5 Future prospects for the ABE fermentation
The lack of economic competitiveness of the ABE fermentation for the
production of chemical feedstocks currently inhibits exploitation of this process.
Knowledge gained with respect to the biochemistry, physiology, molecular
biology and genetics of C. acetobutylicum has just about moved the prospects for
this fermentation from being future to being current.
Marketing techniques in the western world have altered the perceptions of the
consumer, such that the purchase of naturally derived products is desirable at all
costs. With particular respect to the ABE process, there may be a small niche for
products which contain solvents derived via fermentation. One example is
fingernail polish remover, where the acetone content is low enough that the
additional cost for the naturally derived solvent may not prohibitively increase
the price of the final product.
The utilization of inexpensive alternative substrates such cellulosic waste, are of
concern to many fermentations. However, application of future developments in
this area to the ABE process will depend on the ability to genetically introduce
these systems into C. acetobutylicum. Methods for the genetic manipulation of C.
acetobutylicum have been successfully developed, and indeed Minton et al.
(1990a, 1990b) have shown good expression of C. thermocellum celA and celC genes
in C. acetobutylicum.

Introduction 32
Complementing the genetic manipulation of C. acetobutylicum by introduction of
foreign DNA, the development of conjugative transposon mutagenesis systems
provides a powerful and convenient route for the isolation of C. acetobutylicum
strains with desirable fermentation characteristics.
Although it was not discussed in this introduction, advances in the areas of
process technology and downstream processing will no doubt have a marked
affect on the re-emergence of the ABE fermentation (Gottschalk and Bahl, 1981).
Despite the current abundance of oil, it is a non-renewable resource. If nations
truly want to eliminate oil as the basis for their economies, fundamental and
applied research on the ABE fermentation must be welcomed and encouraged.
1.6 Overview of metronidazole
Metronidazole was used extensively in this study, thereby necessitating a brief
discussion on this compound. This introduction is not intended to be a
comprehensive review of the scientific literature, but rather provides enough
information to allow for an understanding of why and how it was used as a
research tool.
1.6.1 History and development of metronidazole
Similar to the history and development of the ABE fermentation, the history and
development of metronidazole is colourful and a joy to discover.
Catteral (1976) wrote that in the 1950's, "at the majority of clinics there were
queues of sad looking unhappy women ... with wet and stained underwear and
poor morale ... nor was there any satisfactory treatment to offer them". The
disease was known as trichomoniasis, and the causative agent had been shown
to be Trichomonas vaginalis. Infection could persist for many years, making life a
misery for the patient.
In 1954, the laboratories of Rhone-Poulenc in Paris, France instituted a research
programme to search for a compound effective against T. vaginalis (McFadzean,
1986). Many compounds were tested, and in 1956, Despois et al. reported that a

Introduction 33
crude extract from a streptomycete was active against the parasite. The active
antibiotic was shown to be azomycin (Fig. 1.3) which had been discovered two
years previously by Japanese workers (McFadzean, 1986). Following this lead,
many derivatives of azomycin were synthesized and eventually in 1957,
metronidazole was born (Fig. 1.3). Of all the compounds developed,
metronidazole provided the best balance between activity and toxicity. Using
mice infected with T. vagina/is, Cosar and Julou (1959) were the first to report the
effectiveness of orally administered metronidazole. Clinical trials were instituted
shortly thereafter (Durel et al., 1959), and metronidazole was introduced for
prescription use in 1960 in France and the UK.
It is common for more active or better tolerated drugs to overtake their
predecessors in the marketplace. This has not occurred with metronidazole
(McFadzean, 1986) and after 30 years, it is still the drug of choice for the
treatment of trichomoniasis.
This may have been the end of the story for metronidazole if it was not for the
careful observations of certain people such as a dental surgeon named David
Shinn. Shinn was a registrar at King's College Dental School in London, and in
1962 he had been treating a female patient with acute ulcerative gingivitis
(McFadzean, 1986). The patient received the normal treatment of chromic acid
and peroxide which was applied to the ulcers. On her next consultation, the
patient's gingivitis was cured. Not believing that the miraculous results were
due to his treatments, Shinn questioned this patient and discovered that she was
receiving metronidazole treatment for trichomoniasis. Intrigued by his
discovery, he treated six more ulcerative gingivitis cases with metronidazole,
and all were rapidly cured. Shinn reported his results and encouraged others to
test the effectiveness of metronidazole against acute ulcerative gingivitis (Shinn,
1962).
It had previously been established that large numbers of two organisms, Borrelia
vincenti and Bacteroides fusiformis, were present in the ulcerative lesions of this
gingivitis. In conjunction with May and Baker pharmaceuticals, who distributed

Introduction 34
N
I H
Azomycin Metro n id a zo I e
Figure 1.3 A comparative drawing showing the chemical composition of azomycin, and the chemical composition of its derivative, metronidazole.
metronidazole in the UK, Shinn was able to show in vitro killing of B. fusiformis
by metronidazole. A confirmation of these results was published (Davies et al.,
1964), and Shinn became one of the best known dentists in the world. Sponsored
by May and Baker, Shinn visited dental schools in Canada and the USA with a
view of moving there to practise dentistry. On his return to the UK, he
announced his decision to remain in England as he was not prepared to give up
the pleasure of watching Arsenal play football on a Saturday (McFadzean, 1986).
It was also shown that in vitro, metronidazole was active against Entamoeba
histolytica, the causative agent of amoebic dysentery (Powell, et al., 1966). This
amoeba, the trichomonad and the two bacteria associated with ulcerative
gingivitis all had one thing in common; they grew anaerobically. May and Baker
decided to test metronidazole against other anaerobic bacteria, particularly
members of the genus Clostridium. Again, metronidazole was show to have in
vitro activity which was at least as effective as reference antibiotics used as
controls (Freeman et al., 1968).
It had been shown that 98% of the viable bacteria of the large intestine were
anaerobic, and were primarily members of the genus Bacteroides (Drasar et a1.,
Introduction 35
1966). Furthermore, clostridial infections were known to be a problem in causing
gas gangrene shortly after limb amputation, and the source of the infection was
believed to be from the patients own faeces (Parker, 1969). It was proposed to
administer metronidazole to prevent this auto-infection, however this proposal
did not gain acceptance for quite a number of years (McFadzean, 1986).
Advances were made in the ability to culture anaerobic bacteria, and so the
realization of their importance in disease was becoming clear. However, this
realization was only being recognized by small groups of people willing to
challenge common medical opinion (McFadzean, 1986). Studies had shown that
prophylactic metronidazole treatment was virtually 100% effective in controlling
post operative sepsis by Bacteroides species following elective gynaecological
surgery (Willis et al., 1974, 1975). These and other reports were viewed with
great scepticism by the medical community, and even the highly regarded New
England Journal of Medicine published a somewhat cynical report entitled "Beware
- the anaerobe bandwagon" (Page, 1974). More and more results showed the
efficacy of metronidazole in the treatment of post operative sepsis. Eventually
institutions such as the Luton and Dunstable Hospital north of London, where
many of the initial metronidazole studies were performed, concluded that it was
unethical to withhold metronidazole prophylaxis when undertaking
hysterectomy operations. In 1978, the Luton group stated that after 618
hysterectomies where metronidazole treatment was included, there had been no
post operative anaerobic infections (McFadzean, 1986).
Similar results and conclusions were found when using prophylactic
metronidazole treatment prior to and after other types of abdominal surgery.
Metronidazole treatment was shown to be effective in controlling post operative
sepsis after colonic surgery (Goldring et al., 1975; Willis et al., 1977),
appendicectomy (Leigh et al., 1974; Willis et al., 1976) and obstetric surgery
(Willis et al., 1978).
Since anaerobic bacteria are the principal agents behind sepsis following
abdominal surgery, it is not surprising that metronidazole was found to be very

Introduction 36
effective at treating other, non-surgically induced anaerobic infections.
Metronidazole treatment has been effective against brain abscesses (Ingham et
al., 1975, 1977), dental infections (Hood, 1978; Rood and Murgatroyd, 1979),
bacterial meningitis (Berman et al., 1978), lung infections (Tally et al., 1975) and
many other important and miscellaneous infections (see Kucers and Bennett,
1987). In fact, the number of reports demonstrating the medical usefulness of
metronidazole numbers well into the thousands (McFadzean, 1986).
Because of their specific role in the development and production of Flagyl
(metronidazole), May and Baker Ltd. was presented with the Queen's Award for
Technological Achievement in 1982. It is virtually impossible to determine the
world usage of metronidazole today, particularly in light of the expiration of
most patents in 1974. However, one can form an idea by observing that between
April 1984 and March 1985, a total of 8.6 tonnes of metronidazole preparations
were used in the U.K. alone (McFadzean, 1986).
1.6.2 Spectrum of metronidazole activity
Metronidazole, 1- (~ -hydroxyethyl)- 2- methyl-5 - nitroimidazole, is a
nitroimidazole drug similar to tinidazole, nimorazole, ornidazole, carnidazole
and secnidazole (Edwards, 1980; Kucers and Bennett, 1987). From the history
and development of metronidazole, it is clear that this compound is highly toxic
to organisms growing in anaerobic environments.
Metronidazole is active against some anaerobic protozoa. T. vaginalis, E.
histolytica, Giardia lamblia and Balantidium coli all show some degree of
susceptibility to metronidazole (Kucers and Bennett, 1987). Despite some initial
reports that metronidazole could be used to treat leishmaniasis (Long, 1973;
Jones, 1979) and trypanosomiasis (Davies, 1967), it appears that this compound
has little or no effect on the responsible aetiological agents (Keithly and
Langreth, 1983).
Investigations have clearly shown that metronidazole is active against most
obligately anaerobic bacteria (Tally et al., 1981; Noble and Tally, 1984). Most

Introduction 37
Bacteroides species, Fusobacterium species and Clostridium species are uniformly
susceptible to metronidazole and other nitroimidazoles. Anaerobic organisms
such as Peptococcus, Peptostreptococcus and Eubacterium species are generally
susceptible to metronidazole, however occasional resistance is known (Tally et
al., 1981; Dubreuil et al., 1984). The two medically important capnophilic
organisms, Campylobacter fetus and Haemophilus vaginacola have also been shown
to be susceptible to metronidazole (Chow et al., 1978; Pheifer et al., 1978).
Generally, most aerobic and microaerophilic bacteria show uniform resistance to
metronidazole, however recent evidence suggests that certain facultative
anaerobes are susceptible to metronidazole if grown under anaerobic conditions
(see Chapter 4).
Resistance to metronidazole among susceptible species is rare (Miiller, 1982),
however resistant strains of T. vaginalis have been isolated from patients with
refractory trichomoniasis (Thurner and Meingassner, 1978; Forsgren and
Forssman, 1979; Heyworth et al., 1980; Lossick, 1981; Waitkins and Thomas, 1981;
Kulda et al., 1982). Ingham et al. (1978) isolated a metronidazole resistant strain
of B. fragilis from a patient who was on long term therapy with metronidazole for
Chron's disease. No extrachromosomal DNA was found in this strain and there
was no transfer of resistance determinants using filter mating techniques which
have been successful for intraspecies transfer of clindamycin, erythromycin and
tetracycline resistance in B. fragilis (Tally et al., 1981). Using radiolabelled
metronidazole, it was shown that this resistant strain had a reduced ability to
take up the drug (Tally et al., 1979). This was confirmed in a later study where
metronidazole resistant B. fragilis strains were selected after mutagenic treatment
with N-methyl-N-nitro-N-nitrosoguanidine (Britz and Wilkinson, 1979). Five
metronidazole resistant mutants were isolated from different B. fragilis strains.
In all cases, the mechanism of resistance was a reduced ability to take up the
drug.

Introduction 38
1.7 Mode of action of metronidazole
The mechanisms behind the mode of action of metronidazole have not been
completely elucidated, however a good understanding is available. Muller
(1983) described the essential action of metronidazole to occur in four steps:
1) entry of the drug into the cell, 2) reductive activation of the drug, 3) the toxic
effects of the reduced product or products, and 4) release of the inactive end
products.
1.7.1 Metronidazole entry
It is generally assumed that entry of metronidazole into the cell occurs via
passive diffusion, however the supporting evidence is indirect and therefore
active transport can not be totally ruled out (Ings et al., 1974). Using 14<: labelled
metronidazole, Ings et al. (1974) showed that T. vaginalis cells rapidly
accumulated the 14<: label. Non sensitive cells such as Tetrahymena pyriformis did
not accumulate the 14<: label, although it was shown that metronidazole can
diffuse into these cells. Various imidazoles and biologically active or inactive
nitroimidazole derivatives in high concentrations do not inhibit this
accumulation (Edwards, 1980; Muller, 1983). Because metronidazole undergoes
metabolic modification after entry into sensitive cells, it has been suggested that
this modification decreases the intracellular concentration of the unchanged drug
and thus forms a transmembrane concentration gradient which promotes further
drug uptake (Ings et al., 1974; Muller and Lindmark, 1976; Tally et al., 1978).
Muller (1983) pointed out that because studies using 14<: labelled metronidazole
showed that labelled products leave the cell, it is likely that the measured
accumulation of the label in these studies underestimates the total drug entry.
1.7.2 Metronidazole activation
The fact that metronidazole is a prod.rug is fortuitous, and was never envisioned
when the drug was first synthesized and used (McFadzean, 1986). It has been
suggested repeatedly that reduction of the nitro group of metronidazole is
necessary for drug activation. The actual mechanisms of reduction of
metronidazole have not been directly elucidated. Possible theories on how

Introduction 39
metronidazole is reduced include direct electron transfer via reduced electron
carriers, as well as active reduction via enzymatic routes. These possibilities are
discussed in the next two sections.
Metronidazole reduction most likely occurs in single electron steps, assumed to
lead firstly to the formation of a free radical anion, which can be reoxidized by
oxygen to the original compound with the production of superoxide (Muller,
1983). Further reduction can yield a nitroso derivative, a nitroso free radical and
a hydroxylamine derivative (Muller, 1983). These reduced intermediates are
very short lived, and none of these compounds have been isolated. Using anoxic
mammalian liver microsome preparations and electron paramagnetic resonance
spectroscopy, Perez-Reyes et al. (1979) demonstrated the existence of the one
electron free radical.
1.7.2.1 Role of electron carriers
O'Brien and Morris (1972) showed that when sub-lethal concentrations of
metronidazole were added to exponentially growing C. acetobutylicum cultures,
the drug rapidly disappeared from the culture medium. When metronidazole
was added to crude extracts of C. acetobutylicum, hydrogen production was
halted until no metronidazole remained in the assay flask. The production of
CO2 was not altered, indicating that the phosphoroclastic breakdown of pyruvate
to acetyl-CoA continued. The effect of metronidazole on the uptake of hydrogen
by the purified C. pasteurianum hydrogenase was also examined. It was shown
that metronidazole caused no inhibition of the hydrogenase, and in fact extended
the phase of rapid consumption of hydrogen. For each µmol of metronidazole
supplied, approximately 3 µmol of additional hydrogen was utilized. These
authors therefore concluded that, in C. acetobutylicum, metronidazole did not
directly inhibit the hydrogen production, but inhibited the action of the
hydrogenase by serving as an alternative and preferred acceptor of electrons
from reduced Fd.
Non-enzymatic transfer of electrons to metronidazole was implied to occur in a
hydrogenase linked assay system developed by Chen and Blanchard (1979). In

Introduction 40
the reverse reaction, a purified hydrogenase consumes hydrogen gas forming
reduced Fd (or flavodoxin), which in turn transfers electrons to metronidazole
forming it's reduced intermediate(s). Therefore the concentration of the electron
carrier (Fd or flavodoxin) determines the amount of metronidazole that is
reduced. After stopping the reaction, the amount of unreduced metronidazole
was measured spectrophotometrically. Critical to the design and working of this
assay are the facts that the reduction of metronidazole is irreversible and that
once reduced, metronidazole loses its absorption peak at 320 nm.
Lockerby et al. (1984) clearly demonstrated the requirement of Fd for the
activation of metronidazole. Cell free extracts of C. pasteurianum were capable of
reducing metronidazole as measured by the uptake of hydrogen gas. The uptake
of hydrogen gas only occurred in the presence of metronidazole. However,
removal of Fd from the cell free extracts by DEAE cellulose treatment eliminated
hydrogen uptake in the presence of metronidazole. These authors concluded
that metronidazole preferentially scavenges electrons from reduced Fd, thereby
depriving other Fd linked systems of essential reducing equivalents. The
existence of a "metronidazole reductase" system that enzymatically transfers
electrons from reduced Fd to metronidazole was suggested, however no
evidence or speculation was provided concerning the components of this system.
1.7.2.2 Role of enzymes
The role of enzymes in the reduction of metronidazole has been postulated for a
number years. Unfortunately, many reports simply cite the responsible enzyme
or enzymes as being "nitroreductases" (Edwards et al., 1973; Rosenkranz and
Speck, 1975; Wardman and Clarke, 1976; Tally et al., 1978; Chrystal et al., 1980;
McLafferty et al., 1982). This term most likely arose from the fact that the nitro
group of metronidazole needs to be reduced in order for activation, and may not
refer to specific nitroreductase systems found in many microorganisms.
Since metronidazole inhibits anaerobic organisms and not aerobic organisms, it
has been postulated that metronidazole interacts with enzymes present only in
the biochemical pathways found of obligate anaerobes (Edwards et al., 1973; Ings

Introduction 41
et al., 1974; Noble and Tally, 1984). Edwards and Mathison (1970) first noted that
metronidazole inhibited hydrogen production in T. vaginalis, and similar results
were found when metronidazole was added to cultures of C. acetobutylicum
(O'Brien and Morris, 1972).
With particular reference to the clostridia, the production of hydrogen gas is the
final step of a major pathway for the disposal of electrons. Electrons derived
from the catabolism of pyruvate are transferred to oxidized Fd to form reduced
Fd with the concomitant production of acetyl-CoA and CO2 (see section 1.2.4).
Electrons carried by reduced Fd are in turn transferred to protons to form
hydrogen gas. Since the redox potential of metronidazole has been estimated to
be very close to that of Fd (O'Brien and Morris, 1972), it can be postulated that
enzymes capable of transferring electrons to Fd can also transfer electrons to
metronidazole. In the clostridia the two principal enzymes that require Fd for
complete functionality are the pyruvate-Fd-oxidoreductase and the hydrogenase.
The implication of pyruvate degrading enzymes in the activation of
metronidazole was noted by Britz and Wilkinson (1979). Using chemical
mutagenesis, these authors isolated metronidazole resistant mutants of B. fragilis.
All of the metronidazole resistant mutants showed reduced levels of pyruvate
dehydrogenase, which is an analogous enzyme to the pyruvate-Fd
oxidoreductase found in the clostridia (Narikawa and Nakamura, 1987).
Narikawa (1986) correlated pyruvate-Fd-oxidoreductase activity with
metronidazole susceptibility. Metronidazole uptake, p-nitro benzoic acid
reduction, pyruvate-Fd-oxidoreductase activity and metronidazole sensitivity,
was determined for 41 different species covering 19 different genera. All of the
obligate anaerobes tested and 4 of the facultative anaerobes were capable of
reducing p-nitro benzoic acid. The ability to reduce p-nitro benzoic acid
correlated directly with an ability to decrease the concentration of metronidazole
in the culture medium. However, only the obligate anaerobes were identified as
being susceptible to metronidazole, and this susceptibility correlated with
pyruvate-Fd-oxidoreductase activity.

Introduction 42
Lockerby et al. (1985) studied the effects of metronidazole reduction on the
phosphoroclastic breakdown of pyruvate. It was shown that the addition of
metronidazole to cell free extracts of C. pasteurianum caused an increase in acetyl
phosphate production. It was also shown that Fd removal from the cell free
extracts resulted in the complete loss of acetyl phosphate production. It was
concluded that the role of the phosphoroclastic reaction with respect to
metronidazole activation was to provide electrons through reduced Fd that
would normally be evolved as hydrogen gas. Furthermore, stimulation of
phosphoroclastic activity was presumed to be due to the fact that the reduction
of metronidazole recycles Fd to its oxidized state more rapidly than the
hydrogenase. This indicates that hydrogenase activity is the rate limiting step in
the phosphoroclastic breakdown of pyruvate. Again, the presence of a
"metronidazole reductase" system was assumed to carry out the transfer of
electrons from reduced Fd to metronidazole, however no evidence was provided
as to the components of this system.
In an elegant study Church et al. (1988) demonstrate that the bidirectional
hydrogenase-1 of C. pasteurianum is in fact the "metronidazole reductase" that
these authors (nee Lockerby) mentioned previously. Strong stoichiometric
evidence was presented indicating that metronidazole replaces protons as the
substrate for the hydrogenase enzyme. Together with reduced Fd, the
hydrogenase transfers electrons to metronidazole yielding oxidized Fd and
reduced metronidazole. In this case no hydrogen gas would be produced, which
is in agreement with previous reports that showed hydrogen production was
inhibited in the presence of metronidazole (Edwards and Mathison, 1970;
O'Brien and Morris, 1972). A similar role for this hydrogenase enzyme has been
shown in reducing 2-, 4-, and other 5-nitroimidazole drugs (Church et al., 1990).
1.7.3 Cytotoxicity
Because the biologically active reduction products of metronidazole have never
been isolated, the actual mechanisms involved in the cytotoxic action of this drug
remain largely unknown. Although the existence of multiple targets within

Introduction 43
sensitive cells has been suggested (Buchner and Edwards, 1975; Carosi et al.,
1977; Miiller, 1983), an interaction with DNA is the most widely held explanation
for metronidazole's cytotoxicity (Ings et al., 1974; Goldstein et al., 1977). Model
experiments where metronidazole was reduced in the presence of various target
macromolecules showed primary interaction with DNA (Edwards, 1977;
LaRusso et al., 1977). Neither the unreduced drug nor the drug reduced prior to
macromolecule addition reacted with DNA. Surprisingly, no interaction with
RNA has been observed (Muller, 1983). Although there is some binding of the
drug to nucleic acid (LaRusso et al., 1977), it is more important to note the
occurrence of single strand and double strand breaks in the DNA and the release
of nucleotide phosphates (Knight et al., 1978; Rowley et al., 1979, 1980; Edwards
et al., 1980).
1. 7.4 Inactive end products
The end products of reduction of metronidazole, such as acetamide (Koch et al.,
1979) and 2-hydroxyethyl oxamic acid (Koch and Goldman, 1979), represent
fragments of the parent molecule (Chrystal et al., 1980; Beaulieu et al., 1981;
Muller, 1983). No cytotoxic activity has been demonstrated for any of these end
products (Ings and Constable, 1975).
Chrystal et al. (1980) proposed that the amount of acetamide accumulated by the
reduction of metronidazole is proportional to the amount of reduced toxic
intermediate(s). This allowed for kinetic studies correlating the rate of
metronidazole reduction by various bacteria with a decrease in the number of
viable cells (Chrystal et al., 1980; McLafferty et al., 1982). The results suggested
that the microbicidal activity of metronidazole depends not only on the capacity
of the microorganism to produce the toxic intermediates, but also on the
microorganism's specific susceptibility to these reduced toxic intermediates. In
particular, the efficiency of a cell's DNA repair mechanisms partly determines it's
sensitivity towards metronidazole. Studies by Jackson et al. (1984) and Yeung et
al. (1984), where the in vitro activity of metronidazole against DNA repair
mutants of E.coli was measured, verified this hypothesis (see also Chapter 4).

Introduction 44
1.8 Aims and overview of this thesis
C. acetobutylicum is an important industrial microorganism with tremendous
potential for the fermentative production of solvents. Although this organism
has been utilized for solvent production for a number of decades in this century,
only recently have the mechanisms behind the regulation of these solvent
producing pathways started to become clear.
The fundamental goals of this thesis are essentially divided into two parts. First,
it was considered important to develop and utilize a suitable extraction and
assay procedure for the measurement of nucleotide levels in C. acetobutylicum
P262. As mentioned previously, fluctuations in nucleotide levels have been
shown to be important in the regulation of other differentiating bacteria such as
B. subtilis. Furthermore, ATP is the currency by which one measures energy in a
cell and therefore following the concentration of this molecule through the
course of a C. acetobutylicum fermentation was desired. While the content is far
removed from the subject of microbiology, the second chapter describes the
development of an analysis system for chromatographic data. The application of
this system is demonstrated throughout the third chapter, where nucleotide
profiles were obtained and analysed with an insight into how nucleotide levels
affect or are affected by changes in the fermentation pattern of C. acetobutylicum.
The second part of this thesis shows a move from physiological studies into the
realm of molecular genetic analysis of C. acetobutylicum. The biochemistry of the
C. acetobutylicum fermentation clearly shows the importance of electron transport
in determining the direction of carbon flown. Little is known about these
electron transport genes, and the same is true for their regulation. The fourth
chapter describes the development of a metronidazole based negative selection
screening system for C. acetobutylicum electron transport genes in E.coli. The
fifth chapter demonstrates the application of this system and the isolation of
E.coli clones containing possible C. acetobutylicum electron transport genes which
activate metronidazole. The sixth chapter describes the molecular genetic

Introduction 45
analysis of C. acetobutylicum DNA from selected clones. Throughout this half of
the study, efforts are made to relate the results to the activation of the medically
important drug metronidazole.
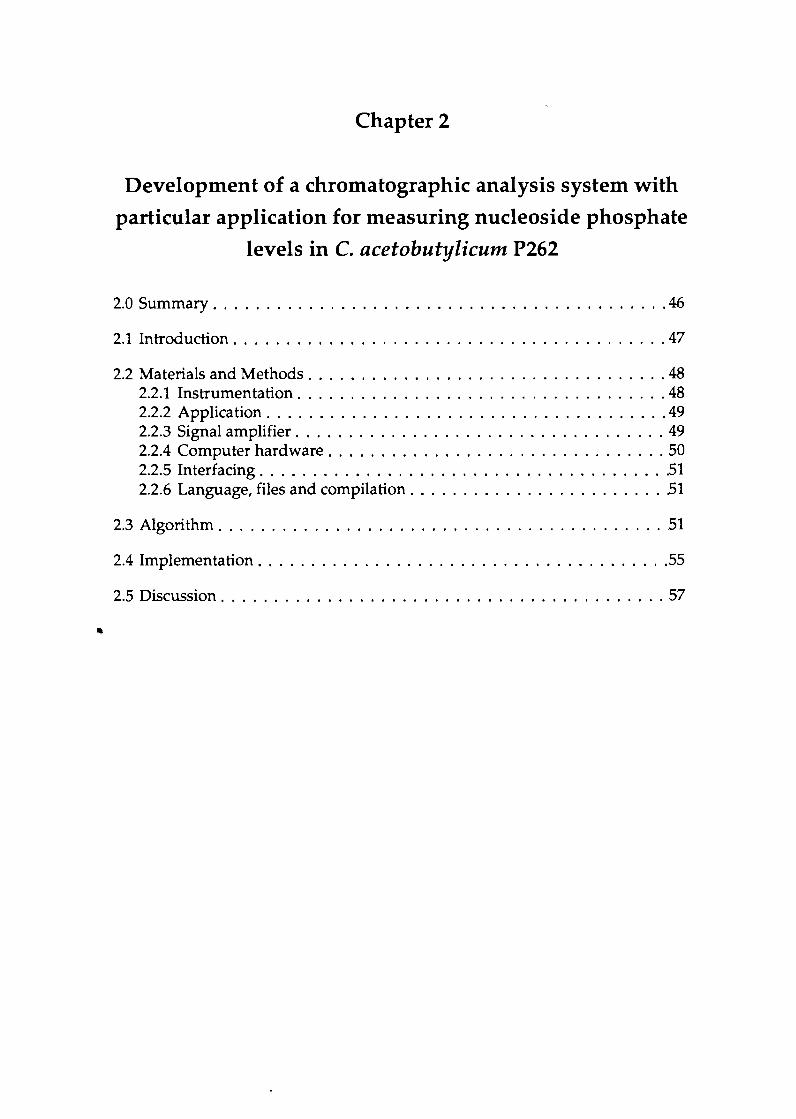
•
Chapter 2
Development of a chromatographic analysis system with
particular application for measuring nucleoside phosphate
levels in C. acetobutylicum P262
2.0 Summary ........................................... 46
2.1 Introduction ......................................... 47
2.2 Materials and Methods .................................. 48 2.2.1 Instrumentation ................................... 48 2.2.2 Application ...................................... 49 2.2.3 Signal amplifier ................................... 49 2.2.4 Computer hardware ................................ 50 2.2.5 Interfacing ....................................... 51 2.2.6 Language, files and compilation ........................ 51
2.3 Algorithm .......................................... 51
2.4 Implementation ....................................... 55
2.5 Discussion . . . . . . . . . . . . . . . . . . . . . . . . . . . . . . . . . . . . . . . . . . 57

46
Chapter 2
Development of a chromatographic analysis system with
particular application for measuring nucleoside phosphate
levels in C. acetobutylicum P262
2.0 Summary
A chromatographic data acquisition and analysis system was developed for
measuring the concentrations of ribonucleotides in bacterial cell extracts. The
availability of multi-channel analog to digital converters provides a platform for
application of this system to many types of gaussian analog output, which
encompasses most analytical chromatographic techniques.
A manual integration system for the analysis of chromatographic data is
described. The system features the ability to collect and store chromatographic
data allowing for uninterrupted sequential runs to proceed. The data can be
integrated many times using different calibration curves, permitting multiple
analyses. The long term storage of data allows the user to assess changes in the
system being employed, an important feature in chromatography systems where
the columns and reagents are subject to constant change. The analog output
produced by an absorbance monitor is passed to a non-inverting signal amplifier.
This amplified signal is sent to an IBM PC where an analog to digital converter is
used to digitize the data. A set of six computer programs which collect, store
and analyze these data are discussed. This system was used to analyze the
nucleotide content C. acetobutylicum P262 by strong anion-exchange HPLC.

Computer analysis of chromatographic data 47
2.1 Introduction
Since their introduction into universities and research establishments in the early
1960s, computers have been widely used by biologists (Ireland and Long, 1985).
This has been facilitated by the use of analog to digital (A/D) converters, which
take an analog input (a current or voltage) and convert it into a representative
digital value. Because the analog signal is digitized into discrete values, the total
number of values represents a subset of the total range of possible values
generated by the analog source. The more bits available to digitize the analog
signal, the greater the, number of discrete values, and hence the greater the
accuracy of the conversion. For example 8-bit resolution permits the
decomposition of an analog signal into 256 (28) discrete units, whereas 12 bit
resolution permits the same analog range to be divided into 4096 (212) discrete
units. This translates into a resolution of 0.39% for an 8-bit A/D converter and
0.02% for a 12-bit AID converter. In comparison, a good quality chart recorder
has a mechanical resolution around 0.1 to 0.2% (Beynon, 1985).
High performance liquid chromatography (HPLC) is an important technique in
the biological sciences. Most HPLC applications produce output via a detector
that generate an analog signal. This analog signal is typically directed to a chart
recorder which may be associated with an integrator. A number of automated
microprocessor-controlled integration systems are commercially available for
HPLC applications. In general, these automated analysis systems rely on the
presence of a flat and stable baseline and peaks that are sharp and gaussian.
When relying on quantitation by peak height, adherence to these parameters is of
utmost importance. Quantitation by peak area is more flexible, but is still
sensitive to sloping baselines and trailing peaks, which are common when a
gradient mobile phase is used.
Many methods for separating and quantitating nucleoside phosphates by anion
exchange HPLC have been reported (Hartwick and Brown, 1975; Khym, 1975;
Payne and Ames, 1982; Freese et al., 1984a). Bacterial cell extracts contain many
UV absorbing compounds (Khym et al., 1977; Khym et al., 1978). Separation of

Computer analysis of chromatographic data 48
nucleoside phosphates in these complex bacterial extracts by anion exchange
HPLC generally involves the use of a gradient buffer system, which inherently
results in a chromatogram with a sloping baseline. Nucleotide triphosphates
elute on or just prior to the most sloped region of the baseline. Measurement of
nucleotide phosphate levels in cell extracts of C. acetobutylicum was a goal in this
study. Therefore it was necessary to develop a reliable chromatographic analysis
package for separation and quantitation of nucleotide triphosphates in these cell
extracts
This chapter presents a system for interfacing a HPLC detector to an IBM PC or
compatible microcomputer via an A/D converter, and a set of six computer
programs which collect, store and manipulate the HPLC data.
These programs can be conveniently utilized to manually integrate complex
chromatograms. The programs are written to be highly flexible and can be
applied to many different types of chromatographic data (including other types
of flow cell monitoring chromatography as well as densitometry). Raw data is
collected, stored on disk and can be immediately integrated or integrated at a
later stage, allowing for sequential runs to proceed without data analysis. Once
integrated, the quantitation data is stored and the chromatogram can be re
integrated at any time.
2.2 Materials and Methods
2.2.1 Instrumentation
A diagram of the chromatographic and computer hardware systems is shown in
Fig. 2.1. The HPLC system (Beckman Instruments Inc., Berkely, CA, USA)
consisted of two solvent delivery modules (mod.el 114M), a flow rate and
gradient controller (mod.el 421), a mixer-organizer (mod.el 340), a constant
volume injector (model 210A) and a fixed wavelength absorbance detector
(mod.el 160). The analytical column (25 mm long X 4.6 mm i.d.) used on this
HPLC system contained the strong anion-exchanger Partisil 10-SAX (Whatman
Inc., Clifton, NJ, USA). The analytical column was protected by a guard column

Computer analysis of chromatographic data
.-----------, INJECTOR 1-------, MIX ER
GUARD COLUMN
SAX COLUMN
ABSORBANCEl-------19'1 SIGNAL DETECTOR AMPLIFIER
WASTE
A/D
PUMP A
PUMP B
GRADIENT CONTROLLER
PRINTER i.-------, l'------94 DISPLAY IBM-PC
49
BUFFER A
BUFFER B
Figure 2.1 A diagrammatic representation of the computer and HPLC hardware systems.
containing Pellionex SAX media. The details of the chromatographic conditions
are described in section 3.2.5.
2.2.2 Application
The HPLC-computer integration system was designed for evaluating the
ribonucleotide composition of cell extracts of C. acetobutylicum P262. The
nucleotides of interest were ATP, CTP, GTP and UTP, as well as the 5'-di and 5'
monophophates of these purine and pyrimidine bases. Nucleotide extracts of C.
acetobutylicum cells were prepared as described in section 3.2.4.
2.2.3 Signal amplifier
The low output signal (0-20 mV) from the fixed wavelength detector necessitated
the use of a signal amplifier. The circuit shown in Fig. 2.2 was used to amplify
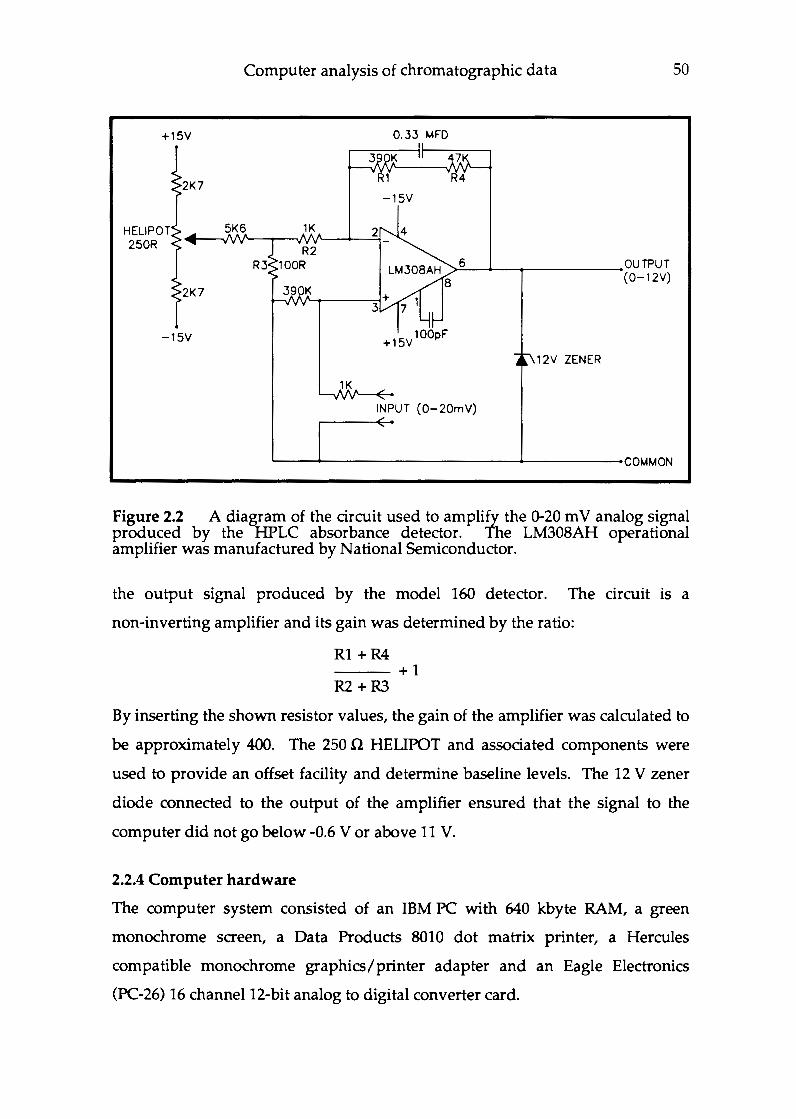
+15V
HELIPOT 250R
Computer analysis of chromatographic data 50
0.33 MFD
>6~_.,_ ________ ..... 0UTPUT (0-12V)
12V ZENER
INPUT (0-20mV)
Figure 2.2 A diagram of the circuit used to amplify the 0-20 m V analog signal produced by the HPLC absorbance detector. The LM308AH operational amplifier was manufactured by National Semiconductor.
the output signal produced by the model 160 detector. The circuit is a
non-inverting amplifier and its gain was determined by the ratio:
Rl +R4 ---+1 R2+R3
By inserting the shown resistor values, the gain of the amplifier was calculated to
be approximately 400. The 250 n HELIPOT and associated components were
used to provide an offset facility and determine baseline levels. The 12 V zener
diode connected to the output of the amplifier ensured that the signal to the
computer did not go below -0.6 V or above 11 V.
2.2.4 Computer hardware
The computer system consisted of an IBM PC with 640 kbyte RAM, a green
monochrome screen, a Data Products 8010 dot matrix printer, a Hercules
compatible monochrome graphics/printer adapter and an Eagle Electronics
(PC-26) 16 channel 12-bit analog to digital converter card.

Computer analysis of chromatographic data 51
2.2.5 Interfacing
The amplified analog signal from the HPLC was connected to channel one of the
AID card in the IBM PC. The HPLC controller has four internal relays which
can be programmed to be open or closed during the chromatographic run. One
of these relays was used to send a 9 V signal (external trigger) to channel zero of
the AID card which initiated the computer to sample the incoming data on
channel one.
2.2.6 Language, files and compilation
Two versions of these programs were written. The first version was written for
the Hercules HBASIC interpreter. This allowed for normal IBM BASIC graphics
commands to be implemented on the monochrome monitor; however this
version was found to be too slow for routine use. Although it has not been
tested, this version could be compiled and run on and IBM PC with a color
graphics adapter and monitor, with little or no modification.
The second version of these programs was written in IBM BASIC using edition
1.1 of the Hercules GRAPH-X on screen utilities package (Hercules Computer
Technology Inc., Berkeley, CA, USA), and was compiled using version 1.0 of the
Microsoft QuickBASIC compiler (Microsoft corporation, Redman, WA, USA).
The Hercules GRAPH-X subroutines were CALLed from within the main
program and the GRAPHIX library was linked to the compiled object modules
using the Microsoft Link program provided with the QuickBASIC compiler. The
complete source code for this second version of these is located in appendix F.
2.3 Algorithm
Six computer programs were written to handle the interfacing and data
collection from the HPLC: STARTUP, HPLC, MANINT, MANINTST, DISPLAY
and CALIBRA T.
The STARTUP program was included to load the compiler runtime module and
the GRAPHIX runtime module. This program puts a logo on the screen and
CHAINed the HPLC program.

Computer analysis of chromatographic data 52
The HPLC program was the menu generating program that provided the main
entry and exit mechanism for the software system. Menu choices were (i) data
collection and manual integration, (ii) manual integration of a stored
chromatogram, (iii) display a stored chromatogram, (iv) record calibration
chromatograms and (v) exit to DOS.
MANINT (data collection and manual integration) and MANINTST (manual
integration of a stored chromatogram) were the two quantitation programs in the
series. MANINT was the data collection - integration program and the user
could select if the raw data was to be immediately integrated, or integrated at a
later time. The MANINTST program was used for integrating these stored
chromatograms, as well as re-integrating stored chromatograms.
Selecting the MANINT program from the HPLC menu initialized the 8255
programmable peripheral interface on the PC-26 AID card. It prompted the user
for the name of a file for data storage and asked if an external trigger was being
used to initiate sampling. The time versus absorbance axes were drawn on the
display and sampling of the A/D card began. If an external trigger was being
used to initiate data input, channel zero of the A/D card was sampled until a
value greater than 2 500 (approximately 7 V) was read. Once channel zero was
high (> 7 V) sampling of the incoming data on channel one was initiated. The
digitized data was stored in an integer array and the corresponding sample time
was stored in a double precision array. The display was set to mimic a chart
recorder and the incoming data was actively plotted on the screen during the
course of the chromatographic run. To encompass the part of the chromatogram
of interest for this application, the total sampling time was set to 30 min. The
maximum sampling rate of the PC-26 card was 2 500 Hz and this sampling rate
would generate an impractical 4.5 million samples. Therefore the program was
designed to sample channel one every 0.36 sec., which yielded approximately
5 000 samples per chromatogram. For nucleotide analysis, the average peak
width at the baseline was approximately 2 min. Therefore, each peak was
characterized by approximately 300 samples which was more than adequate for
integration. During a run, the date, time of day, runtime and number of samples

Computer analysis of chromatographic data 53
taken were displayed in a menu area at the bottom of the display. After the 30
min sampling period the raw data was stored on disk along with the date,
injection time (real time) and the total number of samples taken. The user could
then continue with manual integration, perform another chromatographic run or
exit to the HPLC program. If the option to quantitate the data was chosen, the
chromatogram remained displayed and manual integration continued as
described below.
MANINTST prompted the user for the file name containing the raw data. The
data was read from disk, the absorbance versus time axes were drawn and the
data was plotted. From this point on, the MANINT and MANINTST programs
were identical.
An integration command menu describing the control keys appeared below the
displayed chromatogram. A vertical marker line could be moved left or right
using the cursor keys on the numeric keypad. This vertical marker was used to
locate the peak starts and peak ends. When this was positioned at a peak start
and the 'S' key was depressed, a mark was made on the chromatogram indicating
a selected peak start. Similarly, if the 'E' key was depressed a mark was made on
the chromatogram indicating a selected peak end. Other options included
CLEAR entry which removed an incorrectly selected peak start or peak end,
REDO from start which removed all selected peak starts and peak ends, QUIT
integration which abandoned the integration procedure and returned control to
the HPLC program and finally PROCESS data which integrated the selected
peaks.
When the PROCESS data option was chosen, selected peak starts and peak ends
were sorted with respect to time. The starts and ends were checked for pairs and
checked that they were in the correct order. If no errors were found, the area
under each peak as well as the peak retention time were calculated. The peak
retention time was determined using the Savitzky and Golay (1964) method of
calculating a smoothed first derivative. The baseline was calculated using the
'rubber band' technique of Caesar and Klier (1974). The peak area was

Computer analysis of chromatographic data 54
determined as the sum of trapezoids from data point to data point between the
selected peak start and peak end.
Peak start and peak end marks were removed from the display and the retention
times were written above each selected peak as they were calculated. Upon
completion of these calculations, a hardcopy of the chromatogram was obtained
using the graphics dump facility provided with the Hercules GRAPH-X package.
A short assembly language subroutine, PRTSCH, was written to invoke this
graphics dump from within the program.
The calculated retention times were then compared to the retention times of
known compounds (standards) which had been stored on disk using the
CALIBRAT calibration program. If the calculated retention time fell within a
pre-set threshold level surrounding the mean retention time for the standard, the
peak was presumed to be the same as the standard. Using the stored standard
curve, the calculated peak area was extrapolated to the same units of
measurement used when creating the standard curve. These data were printed
in tabular form on the dot matrix printer and all quantitated data were stored on
disk. The user then had the option to repeat the program or return to the HPLC
program.
The DISPLAY program read the raw data from disk and drew the chromatogram
on the screen. If the chromatogram had been integrated, this data was also read
from disk and was presented in tabular form on the second graphics page of the
Hercules card. By toggling between graphics pages, both the chromatogram and
the quantitated data could be viewed on the display. A hardcopy of the
chromatogram and the quantitated data could also be obtained if desired. The
user then had the option to view another chromatogram or return to the HPLC
program.
For the entire package to work a calibration file must be created using the
CALIBRA T program. This file, contained the names and retention times of
known compounds, and the standard curves (least square regression lines) of the
Computer analysis of chromatographic data 55
quantity of material versus the peak area for each known compound. A mixture
of known compounds was injected into the HPLC and recorded by the
CALIBRAT program. At the end of the chromatographic run, the user selected
peak starts and peak ends from which the retention times and peak areas were
calculated. In this respect the CALIBRA T program was similar to the MANINT
and MANINTST programs. The user was prompted for the peak (compound)
name and the quantity injected. The quantity injected could be expressed in any
units the user desired. A hardcopy of the chromatogram as well as the entered
data could be obtained at this point. This process was repeated and all the
information entered was stored in a temporary file. When desired, this data
could be processed and mean retention times and least square regression lines
calculated. The standards file used by the MANINT and MANINTST programs
was updated with these new values. This was a very powerful feature of this
system, since it allowed the user to re-integrate chromatograms using different
calibration files. If desired, the user had the option to halt the calibration
procedure and save the temporary file, thus freeing the computer for other uses.
Upon starting the CALIBRA T program, the presence of a saved temporary file
was searched for. The user also had the option to abandon the calibration
procedure in which case the temporary file was destroyed. The date of
calibration was stored in the standards file and was noted on chromatograms
integrated with the MANINT and MANINTST programs.
2.4 Implementation
The programs and system described above were used to analyze the
ribonucleotide composition of cell extracts of C. acetobutylicum P262. The
chromatographic run time was approximately 45 min, with the nucleotide di
and tri-phosphates eluting from 20 min onwards. Since the beginning of the
chromatogram was not of interest, sampling of absorbance data was initiated
from the model 421 controller (external trigger) 15 min after injection of the
sample. Absorbance was measured at a wavelength of 254 nm, which is near
optimal for most nucleotide phosphates (Freese et al., 1984a). The absorbance

Computer analysis of chromatographic data
20
a. C ::,
30
Time (mins)
a. tC!)
40
56
Figure 2.3 Chromatograms of (A) a standard mixture of nucleotides and (B) an extract of C. acetobutylicum. The absorbance (0.04 OD units = full scale) was measured at 254 nm.
range of the model 160 detector was set so that 0.04 OD units equaled the full
scale value on the analog output (20 m V).
The computer section was initiated from DOS through the STARTUP program
which gives control to the menu generating HPLC program. Data collection was
carried out with the MANINT program, unless the system was being calibrated,
in which case the CALIBRA T program was utilized. Data collection started at 15
min after injection when the external trigger from the 421 controller went high
(approximately 9 V). At 45 min, data collection was stopped and the raw data
stored on disk. This was followed by manual integration which generated the
quantitated data which was also stored on disk. Fig. 2.3 shows a typical
hardcopy output of a chromatogram obtained on the dot matrix printer. All data

Computer analysis of chromatographic data 57
stored on disk could be accessed for re-integration by using the MANINTST
program or could be viewed with the DISPLAY program. If the calibration
program, CALIBRA T, had been run, the standards file was updated and control
was returned to the HPLC program. Access to DOS was obtained through the
HPLC program, thereby assuring restoration of the graphics card and the
operating system to their default values.
2.5 Discussion
A program for analyzing chromatograms has been written for use on a
mainframe computer (Caesar and Klier, 1974). Although this program was
originally developed for use with gas chromatography, the algorithm is
applicable to liquid chromatography. Furthermore, Freese et al. (1984a) reported
a full spectrum analysis package for analyzing liquid chromatograms on a DEC
PDP 11/10 microcomputer (Digital Equipment Corp., Maynard, MA, USA)
which allows for the manual integration of data. These two algorithms were
used to form the basis of a general purpose data collection and manual
integration package for use with analog output chromatography systems.
In designing this system, it was important to maintain accuracy while being
frugal. The use of a 12-bit AID converter divides the analog signal produced by
the fixed wavelength detector into 4096 (212) discrete units. This yields a
resolution of approximately 0.02% (Beynon, 1985), which was more than
adequate for this application. Since microcomputers have become standard
items in the scientific laboratory, this system did not require a large capital
expenditure. The equipment required to assemble this system cost far less than
the purchase price of an automatic integrator.
In any chromatography system, peak identification is of utmost importance.
Peaks are often identified by comparing their retention times with retention
times of known compounds. In order to identify compounds with some degree
of certainty, more than one identification method should be employed. In

Computer analysis of chromatographic data 58
biological extracts where there are numerous compounds present, retention time
comparison alone is not an adequate means of identification (Brown et al., 1980).
The system described here does not provide a foolproof computer analysis for
the identification of unknown compounds. It is assumed that the user fully
understands the analytical methods being employed. Although these programs
used retention time to identify peaks, this identification was only tentative.
Fractions were routinely collected from the absorbance detector and a full
spectrum scan was performed for comparison to scans of known compounds.
Not only did this provide a method of peak identification, it also allowed for the
determination of peak purity. If the scan demonstrated the presence of a
co-eluting compound that absorbed strongly at or near 254 nm, the quantitation
data for that peak was assumed invalid. In this system, the user can choose
which peaks are to be integrated by selecting the appropriate peak starts and
peak ends. Therefore, preliminary identification is carried out by the user prior
to any retention time comparison by the computer. This is a major advantage of
this system in contrast to automatic integrators, since it requires the user to make
the initial decision as to peak identification.
Once a peak has been identified, it is normally required to quantitate the amount
of material represented by that peak. The quantity of the eluted compound is
generally expressed in terms of some property of the curves produced by the
detector. Peak area was chosen to measure the quantity of the substance
represented by a peak since it was found to be more accurate than peak height.
Peak area is a widely used method for quantitation of chromatographic data and
many techniques are available for estimating this value. Peak area was estimated
geometrically by summation of the trapezoids formed from data point to data
point produced by digitizing the amplified analog signal of the absorbance
detector.
The system was routinely calibrated by injection of at least seven different
concentrations of a standard nucleotide mixture containing the 5'-di and
5'-triphosphates of adenosine, cytosine, uridine and thymidine. In an experiment

Computer analysis of chromatographic data 59
where the standard curves calculated by the CA LIBRA T program were
challenged with 40 different known quantities of nucleotides, the mean deviation
of estimated concentration versus known concentration was 3.68% of the known
concentration. Furthermore, the largest deviation of an estimated concentration
from the known concentration in an individual case was 6.51 % of the known
concentration.
Least squares regression line calculations (Snedecor and Cochran, 1980) were
used in the CALIBRAT program to derive the standard curves. The correlation
coefficients for peak area versus amount were found to be 0.94, 0.93, 0.96 and
0.91 for ATP, GTP, CTP and UTP, respectively. Similarly high (>0.9) correlation
coefficients were found for the nucleotide di-phosphates. It was found that all
calibration curves were linear in the absorbance range (0.04 OD units full scale)
used on the model 160 detector. Since access to an automatic integration system
was not available, an appropriate experimental comparison could not be
performed. It is believed that the advantages of this manual analysis system far
outweigh the conveniences of automated integration for analyzing complex
biological materials. It has been reported that manual integration is more
reliable when compared to automatic integration (Freese et al., 1984a) and this
conclusion is supported by these results.

Chapter 3
Nucleoside triphosphate levels in C. acetobutylicum P262
wild type, sporulation deficient and solvent deficient
strains
3.0 Summary ........................................... 60
3.1 Introduction ......................................... 61
3.2 Materials and Methods .................................. 62 3.2.1 Bacterial strains . . . . . . . . . . . . . . . . . . . . . . . . . . . . . . . .... 62 3.2.2 Media and culture conditions .......................... 63 3.2.3 Growth, morphology and end product determination .......... 63 3.2.4 Preparation of nucleotide extracts . . . . . . . . . . . . . . . . . . . ..... 64 3.2.5 Chromatographic conditions . . . . . . . . . . . . . . . . . . . . . . ..... 65 3.2.6 Analysis of nucleotide extracts ......................... .65 3.2.7 Nucleotide synthesis inhibitors ......................... 65
3.3 Results ............................................. 66 3.3.1 Growth, physiology and morphology . . . . . . . . . . . . . . . . . . . . . 66 3.3.2 Nucleotide profiles ................................. 67 3.3.3 Nucleotide synthesis inhibitors ......................... 71
3.4 Discussion . . . . . . . . . . . . . . . . . . . . . . . . . . . . . . . . . . . . . . . . . . 71

Chapter 3
Nucleoside triphosphate levels in C. acetobutylicum
P262 wild type, sporulation deficient and solvent
deficient strains
3.0 Summary
60
The role of GTP and other ribonucleoside phosphates in the differentiation of C.
acetobutylicum and two sporulation deficient mutants was investigated. The
clostridial stage (cls-1) mutant was unable to produce the clostridial stage,
solvents, granulose, capsules or endospores, whereas the sporulation deficient
(spo-1) mutant produced the clostridial stage, solvents, granulose and capsules,
but did not form a forespore septum. The nucleoside triphosphate profiles of the
wild type and spo-1 mutant were similar and were characterized by a trough in
nucleotide levels which occurred just prior to the pH break point, the onset of the
stationary growth phase, clostridial stage formation and the transition from the
acidogenic to the solventogenic phase. The nucleoside triphosphate
concentrations during the exponential growth phase were much lower than
those found during the stationary phase. The nucleotide levels in the cls-1
mutant during the exponential phase were comparable to those observed in the
wild type and spo-1 mutant. However, the nucleotide levels in the cls-1 mutant
did not increase during the stationary growth phase. The involvement of
nucleotide levels, particularly that of GTP, in the differentiation of C.
acetobutylicum was indicated by the effect of inhibitors, which have been shown
to decrease ribonucleotide levels in other organisms and cause an increase in
sporulation.

Nucleotide levels in C. acetobutylicum 61
3.1 Introduction
In B. subtilis sporulation occurs when the cells encounter certain adverse
nutritional conditions which no longer allow rapid growth. Nutrient deprivation
causes the cells to divide asymmetrically, and the two membranes separating the
smaller cell compartment from the larger mother cell, envelope the smaller
compartment thus producing a forespore. Synthesis of spore specific proteins is
derepressed which may be a result of an altered metabolic environment within
the forespore caused by a membrane that does not allow for normal active
transport (Freese, 1981). Freese and co-workers developed the theory that there
is ultimately one compound of low molecular weight which in combination with
a protein, suppresses sporulation. The theory being that when the concentration
of this compound reaches critical levels, sporulation is induced.
Early studies analyzed the initiation of sporulation by using sporulation minus
mutants and chemical inhibitors. Mutants that were auxotrophic for certain
amino acids led to the conclusion that amino acid limitation, which initiated
sporulation, also evoked the stringent response (Ochi et al., 1981). This response
included the synthesis of guanosine tetraphosphate (ppGpp) and guanosine
pentaphosphate (pppGpp), which resulted in a decrease of GTP and GDP (Lopez
et al., 1981). Ochi et al. (1981) showed that relaxed mutants (relA) which lacked
the stringent response did not demonstrate a sufficient decrease in the level of
GTP to initiate sporulation. This evidence implicated GTP as the low molecular
weight compound that suppresses sporulation in B. subtilis.
GTP was further implicated as the trigger for sporulation by the observation that
sporulation could be induced in a nutrient rich environment by the partial
reduction in synthesis of purine nucleotides (Freese et al., 1978). This condition
of sporulation was achieved by purine removal in leaky purine requiring
mutants or by the· addition of inhibitors of the purine biosynthetic pathway. A
preferential decrease of GTP, but not ATP, was observed in the sporulating
cultures. It has been proposed that the partial starvation for purine creates a new

Nucleotide levels in C. acetobutylicum 62
biosynthetic balance which is conducive to the positioning of a septum in a polar
rather than a central position within the cell (Mitani et al., 1977).
A similar decrease in GTP or S-adenosylmethionine content was shown to be
associated with differentiation (meiosis and sporulation) in Saccharomyces
cerevisiae (Freese et al., 1984b). Aerial mycelium formation in Streptomyces
MA406-A-1 has also been linked with a decrease in GTP content (Ochi, 1986).
In some strains of C. acetobutylicum, such as the industrial strain P262, the onset
of solvent production and sporulation is characterized by a change in
morphology from a highly motile, acid producing, vegetative rod to a swollen,
granulose containing, phase-bright, cigar shaped, solvent producing, 'clostridial'
cell (Long et al., 1983; Jones and Woods, 1986a). An understanding of the
triggers which lead to the onset of solvent production and differentiation is
important for developments aimed at improving the acetone butanol
fermentation.
Since the role of GTP and other ribonucleoside phosphates in the differentiation
of C. acetobutylicum has not been reported prior to this investigation (Santangelo
et al., 1989) a study into the changes in ribonucleoside phosphate pools of the
wild type strain P262 and two sporulation deficient mutants was undertaken.
The clostridial stage (ds-1) mutant is unable to form the clostridial stage and can
not produce solvents, capsule, granulose or endospores (Jones et al., 1982). The
second mutant (spo-1) forms the clostridial stage and produces solvents, capsule
and granulose but does not form a forespore septum (Jones et al., 1982).
3.2 Materials and Methods
Commonly used materials and techniques are presented in the Appendices. The
details provided below are included for completeness.
3.2.1 Bacterial strains
The wild-type C. acetobutylicum strain P262 was obtained from National
Chemical Products (NCP), Germiston, South Africa, and has been described

Nucleotide levels in C. acetobutylicum 63
previously (Jones et al., 1982). The cls-1 and spo-1 mutants were isolated from
this strain by mutagenesis with ethyl methanesulphonate as described by Jones
et al. (1982).
3.2.2 Media and culture conditions
The C. acetobutylicum strains were grown in the C. acetobutylicum minimal
medium (CAMM) of Long et al. (1983), with the glucose concentration reduced
from 60 g 1-1 to 50 g 1-1 and the nitrogen source changed from ammonium
phosphate to ammonium nitrate (7.2 g 1-I). The clostridial basal medium (CBM)
of O'Brien and Morris (1971) was inoculated with spores activated by heat shock
at 75 ·c for 2 min and then cooled on ice for 45 sec. A 5 µl sample of the heat
shocked spore suspension was used to inoculate 10 ml of medium. Cultures
were incubated at 34 ·c until the cells reached mid exponential phase (OD600 0.45
to 0.50). CAMM (400 ml) was inoculated with 40 ml exponential phase cells
harvested from CBM and washed once with distilled water. Cultures were
incubated at 34 ·c and shaken gently every 6 h. All manipulations and
incubations were carried out under stringent anaerobic conditions in an
anaerobic glove box containing an atmosphere of oxygen-free N2, CO2 and H2
(85:10:5 by volume).
3.2.3 Growth, morphology and end product determination
Total cell counts, clostridial stage counts, forespore counts and spore counts were
determined with a Thoma counting chamber (Weber Scientific International, UK)
and a Zeiss photomicroscope fitted with phase- and interference-contrast optics.
Growth was measured turbidometrically at 600 nm with a Corning colorimeter
(model 252) using Hungate tubes. Acetate, butyrate, acetone, butanol and
ethanol were determined by gas chromatography on a Hewlett Packard 5880A
gas chromatograph fitted with a flame ionization detector, using 2-propanol as
an internal standard. The column and running conditions have been described
previously (Long et al., 1984a).

Nucleotide levels in C. acetobutylicum 64
3.2.4 Preparation of nucleotide extracts
Nucleotide extracts were prepared from C. acetobutylicum cells grown in CAMM.
The extraction methods of Olempska-Beer and Freese (1984) and Payne and
Ames (1982) were combined and modified for use with C. acetobutylicum. Cells
(100 ml) were rapidly collected on a 100 mm diameter nitrocellulose filter
(Schleicher and Schull BA 84 or AE 95) by vacuum filtration. The filter was
placed cell side down in a glass Petri dish containing 5 ml of ice-cold 3 M formic
acid saturated with 1-butanol. After a 30 min extraction period, the liquid was
removed and the filter and Petri dish were washed twice with ice-cold sterile
water. The above manipulations were carried out in an anaerobic glove box, and
all solutions were pre-reduced for at least 24 h. The three liquid fractions were
combined, removed from the anaerobic chamber and adjusted to pH 8.8 with
25% (w /v) ammonia solution. The salt concentration of the extract was
increased to 1 M by the addition of 3 M ammonium acetate, pH 8.8. Debris was
removed by centrifugation at 40 000 X g for 20 min. The supernatant was
applied to a column (1.5 cm long X 1 cm i.d.) packed with Affi-Gel 601 (Bio-Rad
Laboratories, Richmond, CA, USA) which had been equilibrated with 1 M
ammonium acetate, pH 8.8. The absorbance of the effluent was monitored at
254 nm using an Isco flow cell monitor (model UAS fitted with a type 6 optical
unit) and unwanted and interfering components were washed through the
column with a mobile phase of 1 M ammonium acetate, pH 8.8. When the A254 of
the effluent reached baseline, the mobile phase was changed to 100 mM acetic
acid to initiate elution of the nucleotides. The desired sample which contained
the nucleotides (about 10 ml) was collected and freeze-dried. The freeze-dried
sample was resuspended in 100 µl of water, centrifuged and assayed by HPLC.
The reliability of this extraction method was routinely tested by performing
duplicate extractions where a known concentration of a standard nucleotide
mixture was added to one sample just prior to the formic acid treatment (Freese
et al., 1984a).

Nucleotide levels in C. acetobutylicum 65
3.2.5 Chromatographic conditions
The Partisil-10 SAX column described in section 2.2.1 was operated at room
temperature at a flow rate of 1 ml min-1. A 50 µl sample volume was injected and
the nucleotides were separated using a multi-step gradient profile. The initial
buffer (A) contained 7 mM potassium dihydrogen phosphate which was
adjusted to pH 4 with HCl. The high ionic strength buffer (B) used to elute the
nucleotides contained 0.5 M potassium dihydrogen phosphate and 0.5 M sodium
sulfate, and was adjusted to pH 5 with potassium hydroxide. After injection, the
mobile phase contained 100% buffer A for 12 min. A linear gradient was
employed such that the mobile phase contained 50% buffer B after another 21
min (33 min run time). The slope of the gradient was then increased such that
the mobile phase contained 100% buffer B after an additional 10 min (43 min run
time). The mobile phase was maintained at 100% B for another 7 min (50 min
run time), after which the mobile phase was changed to 100% buffer A in 5 min.
The column was equilibrated at 100% A for 20 min prior to injection of the next
sample. After 5 consecutive runs, the column was regenerated by the passage of
150 ml of 0.5 M sodium sulfate, pH 2 with sulfuric acid, followed by 50 ml of
buffer B. This removed highly ionized, strongly bound impurities. Once a week
the column was washed with 100% HPLC grade methanol to remove adsorbed
organic impurities. The salts used to prepare the al:x>Ve buffers were all Aristar
grade (BDH chemical) and were dissolved in 18 MQ water (Milli-Q).
3.2.6 Analysis of nucleotide extracts
The computer-HPLC data collection and analysis system used to analyze the
nucleotide composition of the extracts has been reported previously (Santangelo,
1988) and is described in Chapter 2. All experiments were performed at least
three times, with similar results; representative data are presented.
3.2.7 Nucleotide synthesis inhibitors
Decoyinine and psicofuranine were generously donated by Dr. R.L. Keen,
Upjohn Company, Kalamazoo, Ml, USA. Caffeine and 3-methylxanthine were
obtained from the Fluka Chemical Company. Theobromine, theophylline,

Nucleotide levels in C. acetobutylicum 66
6-mercaptopurine, 2-amino-6-mercaptopurine and 6-azathymine were purchased
from the Sigma Chemical Company. Since CAMM supports a near maximum
spore titre for C. acetobutylicum P262, it was an unsuitable medium for inhibitor
studies where an increase in sporulation was to be determined. The tryptone,
yeast extract, glucose medium (TYG) of Hongo et al. (1968), which resulted in a
lower sporulation level, was therefore used for these studies. The inhibitors
were added during the mid exponential growth phase, when the OD600 of the
culture was between 0.40 to 0.45. Percentage sporulation was determined after
48h.
3.3 Results
3.3.1 Growth, physiology and morphology
The ABE fermentation profile typical of C. acetobutylicum P262 in CAMM is
shown in Fig. 3. l(a,b). Cells transferred to this medium show a characteristic
15 h lag phase after which cell numbers begin to increase (Long et al., 1983). The
exponential growth phase, from 15 to 35 h, was characterized by highly motile,
rod-shaped cells. During this stage, glucose consumption resulted in acid
production. The pH break point occurred when the acid concentration reached a
maximum of approximately 4 g 1-1 (between 30 and 35 h). The break point was
associated with the onset of the stationary growth phase and clostridial stage
formation. Just prior to the pH break point, the cell morphology began to change
from motile rods to phase-bright, granulose filled clostridial cells, and by 40 h 90
to 100% of the cells had converted to the clostridial stage. The physiological
changes associated with the pH break point included a decrease in acid
concentration, initiation of solvent production, and an increase in the rate of
glucose consumption. After 45 h, the acid concentration stabilized at
approximately 2.7 g 1-1. Glucose exhaustion occurred at approximately 50 h and
shortly thereafter solvent levels reached a peak of approximately 10 g 1-1. At this
time a maximum number of cells containing forespore septa (60%) was observed,
as well as a small percentage of mature spores (15%). The highest proportion of

Nucleotide levels in C. acetobutylicum 67
phase-bright spores (approximately 50%) was observed at the end of the
fermentation (67 h).
A similar fermentation profile for the spo-1 mutant is shown in Fig. 3.l(c,d). The
exponential phase was characterized by motile rods, glucose consumption and
acid production. The pH break point (pH 5.3) was reached between 35 and 40 h
and was associated with a peak in acid levels. Stationary phase occurred after
approximately 40 h and by 55 h 90 to 100% of the cells were phase-bright
clostridial forms. Solvents were first detected immediately after the pH break
point and reached a maximum of 9.6 g 1-1 at the end of the fermentation (67 h).
The major difference between this and the wild type fermentation was that no
forespore septa or mature spores were observed, indicating that the spo-1 mutant
was an early sporulation mutant (spoO). Minor differences involving for example
maximum cell number, time of peak in motility, and residual glucose levels were
observed between the fermentation profiles of the P262 wild type and the spo-1
strains.
The cls-1 mutant showed a normal motile, acid producing, glucose consuming
exponential phase, but the switch to solvent production did not occur and no
clostridial stage cells were observed (Fig 3.1e,f). After approximately 35 h the
rate of glucose consumption slowed and acid levels continued to increase. By
55 h the fermentation ceased and virtually no solvents were produced
(<0.25 g 1-t). Only 30% of the available glucose was utilized and approximately
7 g acids 1-1 were produced.
3.3.2 Nucleotide profiles
The nudeoside triphosphate profile for the wild type C. acetobutylicum P262
strain showed that throughout the fermentation ATP was the most abundant
nucleoside triphosphate followed by UTP, GTP and CTP (Fig 3.2a). The
nucleoside triphosphate concentrations during the exponential growth phase (15
to 35 h) were much lower (by as much as 40-fold in the case of ATP) than the
values obtained during most of the stationary growth phase (40 to 50 h). From

Nucleotide levels in C. acetobutylicum 68
I 1me 1h1
- {)ll
c..
:::: -lll
i,/1
lime 1h1 I 1mc 1h1
[IJ I " ,---,---,---,---,-,,-,,-,,-,.---,.---,~ I II \ IH l ,-.---.---,---,---,-,,-,,-,,-,,-,,---,
I\ Ill
15
Figure 3.1 Morphological and physiological profiles for C. acetobutylicum. (a,b) Profiles for the wild-type strain P262; k,d) profiles for the spo-1 mutant; (e,f) profiles for the cls-1 mutant. Symbols for graphs (a), (c) and (e) correspond to the following: •, glucose concentration (%, w1v); •, total acids (g 1-I); e, total solvents (g 1-I); 0, log10 cell number; 0, pH. The plots in (b), (ii) and (f) are expressed as percentas.es of the total cell count, and the symbols correspond to the following: •, motility; •, phase bright clostridial cells; e, phase dark rods; 0, forespore containing cells; 0, mature spores. In (f), only motility is shown as the cls-1 mutant remained as 100% phase dark rods throughout the fermentation.
17 to 23 h there was a gradual decrease in the concentration of all the nucleoside
triphosphates, and just prior to the pH break point (25 to 35 h) the concentration
of all the nucleoside triphosphates decreased to almost zero (27 h). The
nucleotide levels then increased rapidly as the morphology of the culture
changed from phase-dark rods to phase-bright clostridial cells. The highest pool
values for all the nucleoside triphosphates coincided with the peak in the

Nucleotide levels in C. acetobutylicum 69
number of clostridial stage cells and the onset of forespore septum development,
indicating that the nucleoside triphosphate pool values were higher in the
stationary phase clostridial stage cells than in the exponential phase rods. The
decrease in the number of clostridial cells after 47 h correlated with a decrease in
the nucleoside triphosphate concentrations, maximum solvent levels and the
initiation of spore maturation.
The nucleoside triphosphate profile for the spo-1 mutant (Fig. 3.2b) was similar to
that for the wild type P262 strain. ATP was the most abundant nucleoside
triphosphate in exponential phase cells, followed by GTP, UTP and CTP. The
spo-1 mutant did not produce forespore septa, but the cells did produce a
clostridial stage. The concentrations of all nucleoside triphosphates increased as
the percentage of clostridial cells increased, and the peak concentrations
coincided with the peak in the percentage of clostridial stage cells. In contrast to
the wild type strain, the decrease in the nucleoside triphosphate levels after 50 h
was not associated with a decrease in the percentage of clostridial stage cells.
However, the metabolism of the spo-1 mutant culture slowed down as solvent
levels reached their maximum and the glucose concentration decreased.
The cls-1 mutant was unable to produce solvents or to sporulate and did not
differentiate into clostridial stage cells. The nucleotide levels in exponential
phase cells of this mutant (Fig. 3.2c) were comparable to those observed in the
wild type strain and the spo-1 mutant. ATP was the most abundant nucleoside
triphosphate, followed by GTP, UTP and CTP. The nucleoside triphosphate
levels decreased as the cell number increased and acids were produced, reaching
almost zero by 35 h. At this time, the cells had stopped dividing and the rate of
acid production and glucose consumption had decreased. In contrast to the
nucleoside triphosphate profiles obtained with the wild type strain and the spo-1
mutant, the nucleoside triphosphate levels did not increase during the stationary
phase, and after 40 h UTP and CTP were not detected.

Nucleotide levels in C. acetobutylicum 70
200
I 50
I 00
50 10
6
4
.., --r.
1.1 0 ':..)
X
... 200 1.1 C.
~ 150 C:
.... C: 100 ~ C: 0 50 ':..)
1.1 10 ~ .... 0
-= 6 ':..) :::: z
4
2
0
6 (c)
4
2
65 Time (h)
Figure 3.2 Nucleoside triphosphate profiles for C. acetobutylicum: (a) wild type strain P262, (b) the spo-1 mutant, and (c) the cls-1 mutant. In all plots the symbols correspond to the following:•, ATP; e, GTP; .A., CTP; 'Y, UTP.

Nucleotide levels in C. acetobutylicum 71
Table 3.1. Percentage sporulation of wild type C. acetobutylicum P262 with and without the addition of compounds known to alter nucleotide levels.
Compound
Cordycepin Deco yin me Psicofuranine
2-Aminomercaptopurine 6-Mercaptopunne
Caffeine 3-Methylxanthine Theobromine Theophylline
6-Azathymine
Optimum Concentrationa
(µg ml-I)
300 100 400
500 400
500 500 200 500
100
% Sporulation
Without With Addition Addition
33 42 31 44 35 53
39 60 31 51
31 60 35 60 32 63 36 57
36 56
a The optimum concentration of these compounds is the concentration that gave the greatest increase in percentage sporulation.
3.3.3 Nucleotide synthesis inhibitors
Ten compounds which increased the percentage of sporulating cells are shown in
Table 3.1. Cordycepin, decoyinine and psicofuranine are adenosine analogues
altered in the ribose moiety (Zain-ul-Abedin et al., 1983). Psicofuranine and
decoyinine, which both inhibit GMP synthetase (Freese et al., 1979), were more
effective than cordycepin at increasing the percentage of sporulating cells. The
mercaptopurines (6-mercaptopurine and 2-aminomercaptopurine) were the next
most effective compounds. The methylxanthines caffeine and theobromine
provoked the largest increase in percentage sporulation, whereas the other two
methylxanthines tested, theophylline and 3-methylxanthine, increased
sporulation to a lesser extent. The pyrimidine analogue 6-azathymine also
increased the percentage of sporulating cells.
3.4 Discussion
Nutrient shift-down experiments, in which rapidly dividing cells from a rich
medium are transferred to a nutrient depleted medium, have been used to

Nucleotide levels in C. acetobutylicum 72
induce sporulation in Bacillus species (Sterlini and Mandelstam, 1969). However,
nutrient depletion does not induce sporulation in C. acetobutylicum P262, which
sporulates only under conditions where growth is limited in the presence of
excess glucose and ammonia (Long et al., 1984a). These studies were therefore
carried out in the minimal medium CAMM, of Long et al. (1983), which provides
a sufficiently synchronous developmental cycle to allow for correlative
morphological, physiological and biochemical studies (Woods and Jones, 1986).
Nucleotides were quantitatively extracted from C. acetobutylicum cells by 3M
formic acid saturated with 1-butanol. The nucleotide extraction method of
Olempska-Beer and Freese (1984) utilized 1 M formic acid saturated with
1-butanol. The concentration of formic acid had to be increased to 3 M to
overcome the high buffering capacity of CAMM which contained calcium
carbonate. This was consistent with the results of Bagnara and Finch (1972) who
reported that formic acid was unsatisfactory for the extraction of nucleotides if
the buffering capacity of the culture medium caused the pH of the extractant to
rise above approximately pH 3. The formic acid extract had to be purified prior
to HPLC analysis. Similar purification procedures were also reported as an
essential step for the analysis of nucleotides from plant tissues (Meyer and
Wagner, 1985) and from bacterial cells (Payne and Ames, 1982).
ATP was the most abundant nucleoside triphosphate produced by the wild type
strain and the spo-1 and cls-1 mutants. An interesting observation was the
extremely high concentrations of nucleotides in non-growing clostridial stage
cells of the wild type strain and the spo-1 mutant, since the fermentation of
glucose to solvents yields 2 mol ATP per mol glucose, as compared to
approximately 3.3 mol ATP per mol glucose when acids are produced (Jones and
Woods, 1986a). However, the clostridial cells do not appear to elongate or divide
and the nucleotides may accumulate as a result of the absence of growth. The
high pool values of these energy rich compounds may explain the association of
energy consuming processes such as granulose formation and capsule
production with the clostridial stage (Reysenbach et al., 1986).
Nucleotide levels in C. acetobutylicum 73
The decrease in ATP levels during the acidogenic phase could also be a result of
rapid ATP consumption for maintenance of a constant ~pH by proton extrusion.
Acid production results in a decrease in the pH of the medium, and the cell must
maintain a more or less constant ~pH at the expense of ATP (Gottwald and
Gottschalk, 1985; Huang et al., 1985). These results agree with the expected, in
that the lowest ATP levels are associated with the pH breakpoint (Grupe and
Gottschalk, 1990). The rate of proton extrusion, and hence the rate of ATP
consumption, would be highest at the pH breakpoint where the external pH is at
a low. The switch to solventogenesis and the reassimilation of acetic and butyric
acids results in a rise in the pH of the medium. The maintenance of a ~pH
would therefore require less ATP and the ATP levels would begin to rise.
Interestingly, in the case of the cls-1 mutant, which was unable to switch to
solventogenesis, ATP levels never rose.
The units that been used for reporting nucleoside triphosphate levels in B. subtilis
are pmol per OD600 unit (Ochi and Freese, 1983; 2.ain-ul-Abedin et al., 1983) or
pmol per AM unit (Freese et al., 1981), where one AM unit is the amount of cells
that produces an OD600 of 1 if suspended in 1 ml. Unfortunately, these authors
make no reference to cell number, nor do they mention the path length used in
the optical density measurements. Therefore, the results presented here, which
are based on cell number, are not directly comparable to those above which are
based on optical density. With the C. acetobutylicum P262 strain, 108 cells ml-1
gives an OD600 of approximately 1 if a 1 cm path length is used. Therefore if the
maximum nucleoside triphosphate concentrations reported by 2.ain-ul-Abedin et
al. (1983) are converted from pmol per OD600 unit tong per OD600 unit, the values
obtained are approximately 375, 115, 91 and 41 for ATP, GTP, UTP and CTP
respectively. Therefore, the nucleoside triphosphate levels for 1 X 10⁸ C.
acetobutylicum cells fall within the same range as reported for 1 OD600 unit of
B. subtilis cells.
The isolation of various classes and combinations of sporulation, clostridial cell,
solvent, granulose and capsule mutants demonstrates that although the
individual pathways function independently of each other, the induction of these

Nucleotide levels in C. acetobutylicum 74
events appears to be linked by some common regulatory mechanism (Woods
and Jones, 1986). The spo-1 and cls-1 mutants are examples of independent
pathway and common regulatory mutants respectively. The concentrations of
nucleoside triphosphates in the wild type strain and in the cls-1 and spo-1
mutants decreased during the late exponential growth phase and reached their
lowest levels just prior to the pH break point. This trough also coincided with a
decrease in motility and rate of cell division. In the wild type strain and the spo-1
mutant the conversion of cells to the non-dividing clostridial stage and the onset
of solvent production coincided with a rapid and very large increase in
nucleotide pools. In the cls-1 mutant, which failed to produce solvents or the
clostridial stage, no increase in the level of nucleoside triphosphates was
detected. The accumulation of high concentrations of nucleoside triphosphates
in the spo-1 mutant suggests that the increase in these compounds was associated
with the conversion of cells to the solvent producing clostridial stage and was
not dependent on spore formation.
A decrease in GTP has been shown to be associated with the initiation of
differentiation and sporulation in B. subtilis (Lopez et al., 1979; Freese, 1981; Ochi
and Freese, 1983), Saccharomyces cerevisiae (Freese et al., 1984b), and a
streptomycete (Ochi, 1986). A variety of inhibitors which are known to decrease
ribonucleotide levels in B. subtilis bring about an increase in sporulation (Freese
et al., 1979; Ochi and Freese, 1983; Zain-ul-Abedin et al., 1983). Although there is
no direct evidence implicating the low levels of GTP which occur during the late
exponential growth phase in C. acetobutylicum P262 it is possible that a decrease
in this or other nucleoside triphosphates plays a role in differentiation of C.
acetobutylicum. The involvement of these compounds is supported by the
increase in sporulation which was obtained in cultures treated with the various
inhibitors shown in Table 3.1. When these inhibitors were added to stationary
phase cultures just after the pH break point, little or no increase in sporulation
occurred. This observation supports the suggestion of a common regulatory link
between the shift to the clostridial stage and endospore formation. The
methylxanthines were the most effective compounds in stimulating sporulation,
which is consistent with the results of Sacks and Thompson (1977). One inhibitor

Nucleotide levels in C. acetobutylicum 75
which would not be expected to affect purine ribonucleotide levels is the
pyrimidine analogue 6-azathymine. This compound also caused an increase in
sporulation in C. acetobutylicum. Similar results were obtained by Craven and
Blankenship (1982) with C. perfringens. It can be speculated that a cascade of
events must occur in order for C. acetobutylicum to sporulate. The initial trigger
in the cascade would therefore take place at the switch from acidogenesis to
solventogenesis. Although it is not direct evidence, it is interesting to note that a
sporulating clostridial stage mutant has never been reported.

Chapter4
Metronidazole activation and E. coli
4.0 Summary ........................................... 76
4.1 Introduction ......................................... 77
4.2 Materials and Methods .................................. 82 4.2.1 Bacterial strains . . . . . . . . . . . . . . . . . . . . . . . . . . . . ....... 82 4.2.2 Media and culture conditions .......................... 82 4.2.3 Determination of MIC ............................... 82 4.2.4 Transposon mutagenesis . . . . . . . . . . . . . . . . ............. 82 4.2.5 Nitroreductase assay ................................ 83 4.2.6 Testing for RecA phenotype ........................... .84
4.3 Results . . . . . . . . . . . . . . . . . . . . . . . . . . . . . . . . . . . . . . . ...... 84 4.3.1 DNA repair mutations and metronidazole sensitivity ........... 84 4.3.2 Growth conditions and metronidazole sensitivity ............. 85 4.3.3 Transposon mutagenesis . . . . . . . . . . . . . ................ 86 4.3.4 Nitroreductase activities and recA stability .................. 87
4.4 Discussion . . . . . . . . . . . . . . . . . . . . . . . . . . . . . . . . . . . . . . . . . . 87

76
Chapter4
Metronidazole activation and E.coli
4.0 Summary
E.coli strains with lesions in their DNA repair systems were more susceptible to
metronidazole than wild type strains. The effect was more severe in recA
mutants than in uvr mutants. The sensitivity of E.coli to metronidazole was
tested under aerobic, anaerobic respiration and fermentation conditions.
Anaerobically grown cultures were more sensitive to metronidazole than
aerobically grown cultures, which were killed only when exposed to high levels
of metronidazole. The lower redox potential of E.coli cells grown under
fermentation conditions rendered them slightly more susceptible to
metronidazole than anaerobically respiring cells. No synergistic effect between
ampicillin and metronidazole was observed when testing the susceptibility of
E.coli strains harbouring plasmid vectors which contained the l}-lactamase gene.
To isolate a suitable E.coli cloning host for the selection of C. acetobutylicum
electron transport genes which activated metronidazole, transposon mutagenesis
of the recA E.coli strain CCl 18 with TnphoA, was used to construct a recA,
metronidazole resistant mutant (F19). F19 was shown to have diminished
nitroreductase activity, which was presumed to be responsible for the
metronidazole resistant phenotype. The recA mutation renders E.coli F19 highly
susceptible to the reduced toxic intermediates of metronidazole. Thus, selecting
for increased sensitivity to metronidazole makes F19 a suitable cloning host for
the isolation of C. acetobutylicum electron transport genes which activate
metronidazole, in E. coli.

Metronidazole.and E.coli 77
4.1 Introduction
Although the spectrum of activity of metronidazole transcends many taxonomic
boundaries, initial reports suggested that its toxicity was mainly limited to strict
anaerobes and microaerophiles (Edwards, 1980), and that it was inactive against
aerobes and facultative anaerobes except in concentrations that far exceeded
those therapeutically attainable (Prince et al., 1969; Benazet et al., 1970; Ralph
and Clarke, 1978; Onderdonk et al., 1979). Prince et al. (1969) tested
metronidazole on a group of facultative anaerobes, and concluded that it had
little or no clinical use for treatment of infections caused by these organisms.
These authors did report that E.coli was slightly more sensitive than the other
organisms tested, but the antibiotic concentration necessary for bacteriocidal
action was still well above the obtainable serum concentrations at the
recommended dosage. Edwards et al. (1979) reported a low incidence of clinical
failure with metronidazole when treating patients for Trichomonas vaginalis
infections. Swabs from these refractory patients yielded mixed cultures which
typically contained Streptococcus faecalis and E.coli. The theory proposed for the
clinical failures was that organisms other than T. vaginalis were able to absorb
and bind metronidazole and hence decrease the concentration of the drug at the
site of infection.
A comprehensive study by Onderdonk et al. (1979) was carried out where the
pelvic cavity of Wistar rats was injected with either E. coli or a mixture of E. coli
and &lcteroides fragilis. The rats that did not receive metronidazole all died due
to E.coli septicemia, regardless of whether they were injected with E.coli or
E. coli and B. fragilis. When the rats were treated with metronidazole, 2 out of 10
(20%) with mixed infections died, whereas 17 out of 20 (85%) with E.coli
infections died. These authors carried this study one step further and analyzed
the effect of metronidazole on continuous cultures of E.coli or E.coli and B.
fragilis. In the case of E.coli alone, metronidazole was not being reduced and was
therefore not biologically active. In the mixed culture, B. fragilis rapidly
disappeared when the calculated concentration of metronidazole reached
1 µg ml-1• Concomitant with this was a temporary reduction in the viable

Metronidazole and E. coli 78
number of E.coli. The E.coli concentration returned to pre-treatment levels
within 24 h. These authors concluded that B. fragilis reduced metronidazole to its
active intermediate, and this intermediate escaped from the B. fragilis cells, and
then entered and killed the E.coli cells. These results were supported in a later
study by Soriano et al. (1982) where the antimicrobial activity of metronidazole
was also measured against pure and mixed cultures of E.coli and B. fragilis.
Chrystal et al. (1980) demonstrated that the presence of E.coli enhanced the
bacteriocidal effect of metronidazole against B. fragilis. They used a control
culture where B. fragilis was inoculated into centrifuged and filtered medium
that had supported the growth of E.coli. These authors also proposed that the
reduced active intermediates of metronidazole were stable enough to diffuse
from one cell to another. Hence they concluded that E.coli reacted with
metronidazole to form a more active derivative which then diffused into the
B. fragilis cells resulting in death. Their belief was that B. fragilis was more
sensitive than E.coli to this particularly active derivative of metronidazole.
Therefore, the presence of E.coli increased the concentration of this active
derivative and this was responsible for the enhanced activity against B. fragilis.
Ingham et al. (1980) tested the effect of metronidazole on anaerobically grown
cultures of E.coli. These authors showed that in the presence of 10 µg ml-1 of
metronidazole, there was an initial increase in the viable counts of E.coli cultures
to 5 X 10⁷ CFU ml-1 during the first 4 h. Thereafter the viable count dropped and
eventually reached 4 X 10⁴ CFU ml-1 after 24 h. This effect was faster and greater
at a metronidazole concentration of 100 µg ml-1, and was independent of
inoculum size. In control cultures that were not treated with metronidazole,
stationary phase was reached and the viable cell count after 24 h was 1 X 10s
CFU ml-1. Eight other strains of E.coli, 3 strains of Klebsiella and 6 out of 7 strains
of Proteus gave almost identical results. Metronidazole had no effect on 6 strains
of Staphylococcus aureus or 5 strains of S faecalis. These authors refute the work of
Onderdonk et al. (1979), and state that the presence of B. fragilis causes a decrease
in the oxidation reduction potential of the environment, and hence
metronidazole is more active against E.coli. They conclude that the killing of

Metronidazole and E.coli 79
facultative anaerobes does not require prior reduction of metronidazole, but
merely an appropriately low redox environment. In a subsequent report
(Ingham et al., 1981) these authors challenged the work of Chrystal et al. (1980).
They prepared mixtures of B. fragilis or B. fragilis plus viable or heat killed E.coli.
They also inoculated B. fragilis into centrifuged and filtered medium that had
supported the growth of E.coli. In all cases they measured the redox potential
(Eh), pH and dissolved oxygen concentration (p02). They confirmed that the
rate of killing of B. fragilis was enhanced in the presence of viable or heat killed
E.coli when compared to the control culture where B. fragilis was inoculated into
medium that had previously supported the growth of E.coli. However, when
compared to a control culture where B. fragilis was inoculated into freshly
prepared medium, this enhanced rate of killing was not observed. Oxygen
concentration measurements and redox measurements showed that the viable
E.coli medium, the heat treated E.coli medium and the freshly prepared medium
all had low p02 and Eh values. The centrifuged and filtered medium however
had greater p02 and Eh values. They concluded that centrifugation and filtration
introduced oxygen into the medium, which resulted in a slower killing rate of
B. fragilis by metronidazole.
Moran et al. (1987) reported a 68% decrease in the viable cell count of E.coli
cultures when treated with 10 µg ml-I of metronidazole and a 99% decrease when
treated with 100 µg ml-I of metronidazole. They also showed that there was
enhanced metronidazole sensitivity of both E.coli and B. fragilis when grown in
mixed culture. It was suggested that this enhanced lethal effect against B. fragilis
was due to a more reduced environment, and the enhanced lethal effect on E.coli
was due to the presence of reduced intermediates excreted by B. fragilis. In a
letter, Ingham and Sisson (1988) point out that these workers failed to employ
stringent conditions of anaerobiosis, and that their conclusion that B. fragilis
excreted metabolites of metronidazole was unjustified. The implication being
that under strict anaerobic conditions, metronidazole was being reduced by
E.coli.

Metronidazole and E.coli 80
The bacteriocidal toxic derivatives of metronidazole have been shown to cause
DNA damage (Knight et al., 1978). Chrystal et al. (1980) proposed that reduced
metronidazole can interact with either DNA to exert the bacteriocidal effect, or
with water to form acetamide. Measuring metronidazole sensitivities of various
E.coli strains which carried one or more genetic lesions in their DNA repair
systems, Jackson et al. (1984) confirmed that DNA was the target molecule in this
organism. The wild type strains were the least susceptible to metronidazole,
whereas lesions in DNA repair genes conferred greater sensitivity to
metronidazole. In all E.coli strains tested, metronidazole disappeared from the
culture medium indicating that E.coli has the capacity to reduce metronidazole.
In a similar study, Yeung et al. (1984) also tested the bacteriocidal activity of
metronidazole against DNA repair mutant strains of E.coli. These DNA repair
mutants of E.coli were killed more efficiently by metronidazole than their
respective parental strains. However, if these DNA repair mutants also lacked
the ability to reduce nitrate and chlorate, they were no more susceptible to
metronidazole than their wild type parents. It was shown that metronidazole
disappeared from the culture medium more slowly in the these nitroreductase
deficient strains. Since acetamide concentration is proportional to the
concentration of the active derivatives of metronidazole, these authors expressed
metronidazole sensitivity in terms of acetamide concentration. This
demonstrated that all of the strains with lesions in DNA repair genes were more
susceptible to the reduced active derivatives of metronidazole than the wild type
strains, whether or not they had diminished nitroreductase activity. This
indicates that in E. coli, nitroreductase activity is obligatory for the activation of
metronidazole, but not for the DNA damaging activity of the reduced
derivatives. There are therefore two mechanisms of resistance to metronidazole,
a decrease in the rate of formation of the reduced active derivatives, or an
increased resistance at the target molecule, DNA.
In the absence of oxygen, E.coli cells breakdown pyruvate to produce formate
and acetyl CoA by the action of the pyruvate formate lyase enzyme. Formate can
be metabolized via the fermentative formate degradation pathway or via the
Metronidazole and E. coli 81
respiratory nitrate linked route (reviewed in Stewart, 1988). In the presence of a
terminal electron acceptor such as nitrate, reduction is coupled to NADH
oxidation to generate a proton motive force for membrane energization and
hence energy production. In the fermentative pathway, formate is converted to
carbon dioxide and hydrogen by the formate hydrogenlyase system (Peck and
Gest, 1957). Formate hydrogenlyase consists of formate dehydrogenase,
unknown electron carriers and hydrogenase (Stewart, 1988). The syntheses of
the formate dehydrogenase and hydrogenase components of the formate
hydrogenlyase pathway in E.coli are known to be repressed under aerobic
conditions and anaerobically by nitrate (Wimpenny and Cole, 1967).
Two types of formate dehydrogenase activities have been identified in E.coli,
and these may be distinguished by their activities with artificial electron
acceptors (Stewart, 1988). Formate dehydrogenase-N (FDHN) is present in
nitrate respiring cells and is active with the artificial electron acceptors
methylene blue, phenazine methosulfate, and dichlorophenolindolphenol. In
contrast, the formate dehydrogenase-H (FDHH), which is a component of the
fermentative formate hydrogenlyase pathway, is active with methyl viologen
and benzyl viologen as artificial electron acceptors. It can be inferred from the
oxidation reduction potential of these artificial electron acceptors, that the redox
environment is lower under fermentation conditions than under conditions of
anaerobic respiration.
Since the redox environment has been shown to play a crucial role in
metronidazole susceptibility (Ingham et al., 1981), it is imperative to determine,
in the case of facultative anaerobes, if metabolism is occurring via anaerobic
respiration or fermentation. The purpose of this study was to determine the
effect of metronidazole on various strains of E.coli, under conditions of
fermentation and anaerobic respiration with the view to creating a suitable
system for the cloning of C. acetobutylicum electron transport genes that may
activate metronidazole.

Metronidazole and E.coli 82
4.2 Materials and Methods
Commonly used materials and techniques are presented in the Appendices. The
details provided below are included for completeness.
4.2.1 Bacterial strains
The bacterial strains used in this study are shown in Table 4.1, and are described
in Appendix C. The nitroreductase deficient E.coli strain F19 was derived from
the recA E. coli strain CCl 18 (araD139~(ara, leu)7697 ~lacX74 phoA~20 galE galK thi
rpsE rpoB argEam recAl) (Manoil and Beckwith, 1985) by transposon
mutagenesis. Phage Ab221rex::TnphoA cl857 Pam3 was a gift from C. Manoil
(Gutierrez et al., 1987).
4.2.2 Media and culture conditions
E.coli was grown aerobically in Luria-Bertani (LB) medium. Anaerobic growth
of E.coli was carried out in an anaerobic glove box (Forma Scientific Inc.,
Marietta, Ohio). The medium used for growth of E.coli under conditions of
anaerobic respiration was LB medium containing 0.1 % glucose and 0.5% sodium
nitrate (LBR). The medium used for fermentative growth of E.coli was either LB
medium containing 1.0% glucose (LBF) or the complex medium (pH 8.0)
described by Clark and Cronan (1980) supplemented with 1 % glucose (ECAM).
When necessary, 1.5% agar was added to these media.
4.2.3 Determination of MIC
An anaerobically grown overnight liquid culture of E.coli was diluted lQ-4 with
anaerobic sterile water, and 100 µl was spread onto pre-reduced agar medium
containing various concentrations of metronidazole. The MIC was taken as the
amount of antibiotic (per ml) that totally inhibited growth after incubation for
24 hat 34°C.
4.2.4 Transposon mutagenesis
TnphoA is a derivative of Tn5 which contains the structural gene for E.coli
alkaline phosphatase (phoA) cloned into the transposon (Manoil and Beckwith,
1985). The alkaline phosphatase portion of TnphoA was not needed for the
desired E.coli chromosomal mutation, and hence TnphoA was merely used in
Metronidazole and E. coli 83
preference to Tn5 because it was readily available. Transposon insertions of
TnphoA into E.coli (CC118) were obtained using an adaptation of the protocol of
Gutierrez et al. (1987). A sample (1 ml) of an overnight culture of E.coli CC118 in
LB containing 10 mM magnesium sulfate was mixed with phage A.::TnphoA at a
multiplicity of infection of approximately 1, and was incubated at 30°C for 4 h to
allow for outgrowth of the phage. Samples (100 µI each) were plated onto LB
plates containing 30 µg ml-1 of kanamycin and incubated overnight at 30°C.
Colonies from each plate were pooled into 1 ml of sterile water. From each
cell/water pool, 100 µl was plated onto LBR medium containing 30 µg ml-1 of
kanamycin and 30 µg ml-1 metronidazole and incubated anaerobically at 34 ·c. Metronidazole resistant mutants were tested for recA reversion and
ni trored uctase activity.
4.2.5 Nitroreductase assay
To test the ability of E. coli to reduce nitro-heterocyclic compounds, the
conversion of p-nitrobenzoic acid (PNBA) top-aminobenzoic acid (PABA) was
monitored. PABA concentration was measured using an assay procedure
originally developed for sulfanilamide determination (Bratton and Marshall,
1939). One ml of an anaerobically grown overnight culture of E.coli was added
to 5 ml of pre-reduced LB supplemented with 120 µg ml-1 of PNBA (final
concentration of PNBA = 100 µg ml-1). A 100 µI sample was removed
immediately and assayed for PABA (time 0), and the remainder was incubated
anaerobically at 34 ·c. Samples were then assayed for PABA at hourly intervals
for six hours. To assay for PABA, the 100 µl sample was placed in a test tube
containing 2.3 ml of water, 600 µl of 15% tri-chloroacetic acid, and 300 µl of 0.1 %
sodium nitrite. After standing for at least 3 min, 300 µI of 0.5% ammonium
sulfamate was added to the tube. After standing for another 3 min, 300 µl of
0.1 % N-(1-naphthyl)ethylene diamine dihydrochloride was added to the tube.
The absorbance was measured at 540 nm against a blank of LB containing
100 µg ml-1 PNBA, which was similarly treated. The PABA concentration was
calculated using the least squares regression line equation determined by
assaying known concentrations of P ABA.
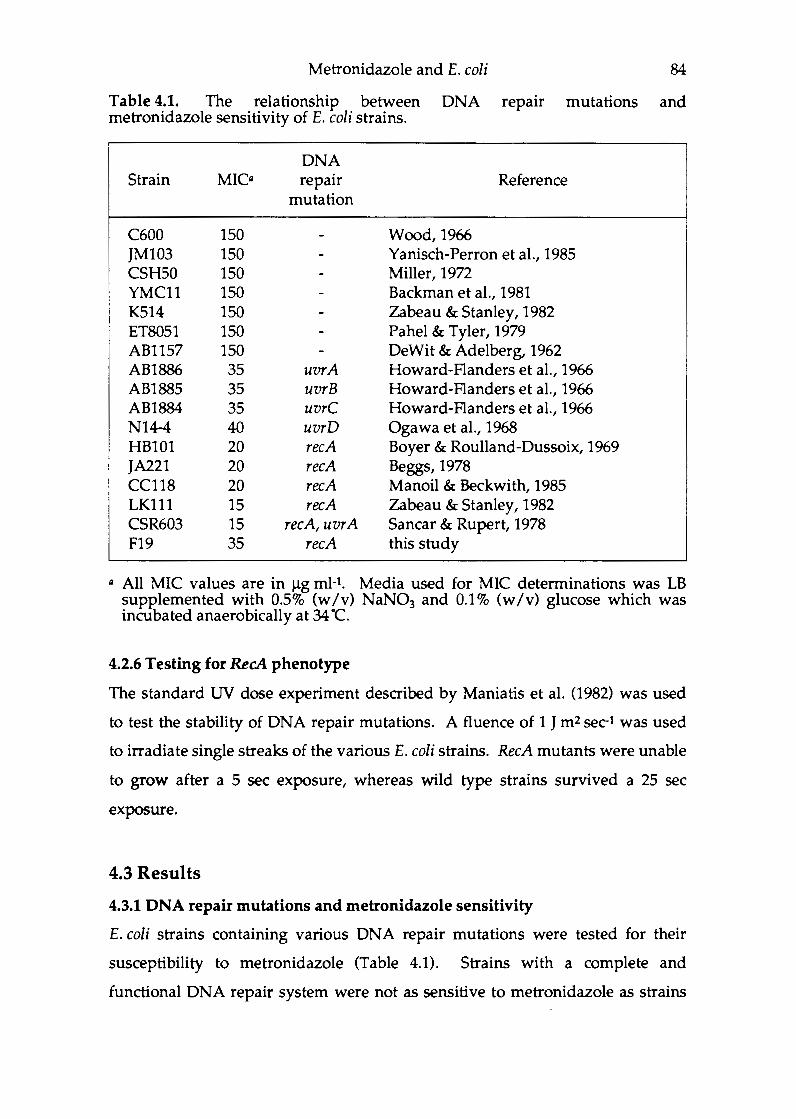
Metronidazole and E. coli 84
Table 4.1. The relationship between DNA repair mutations and metronidazole sensitivity of E.coli strains.
DNA Strain MIC.a repair Reference
mutation
C600 150 Wood, 1966 JM103 150 Yanisch-Perron et al., 1985 CSH50 150 Miller, 1972 YMCll 150 Backman et al., 1981 K514 150 Zabeau & Stanley, 1982 ET8051 150 Pahel & Tyler, 1979 AB1157 150 DeWit & Adelberg, 1962 AB1886 35 uvrA Howard-Flanders et al., 1966 AB1885 35 uvrB Howard-Flanders et al., 1966 AB1884 35 uvrC Howard-Flanders et al., 1966 N14-4 40 uvrD Ogawa et al., 1968 HB101 20 recA Boyer & Roulland-Dussoix, 1969 JA221 20 recA Beggs, 1978 CC118 20 recA Manoil & Beckwith, 1985 LKlll 15 recA Zabeau & Stanley, 1982 CSR603 15 recA, uvrA Sancar & Rupert, 1978 F19 35 recA this study
a All MIC values are in µg ml-1. Media used for MIC determinations was LB supplemented with 0.5% (w/v) NaN03 and 0.1% (w/v) glucose which was incubated anaerobically at 34 ·c.
4.2.6 Testing for RecA phenotype
The standard UV dose experiment described by Maniatis et al. (1982) was used
to test the stability of DNA repair mutations. A fluence of 1 J m2 sec-1 was used
to irradiate single streaks of the various E.coli strains. RecA mutants were unable
to grow after a 5 sec exposure, whereas wild type strains survived a 25 sec
exposure.
4.3 Results
4.3.1 DNA repair mutations and metronidazole sensitivity
E.coli strains containing various DNA repair mutations were tested for their
susceptibility to metronidazole (Table 4.1). Strains with a complete and
functional DNA repair system were not as sensitive to metronidazole as strains

Metronidazole and E. coli
Table 4.2 Metronidazole sensitivity of E.coli strains grown under aerobic (LB), anaerobic respiration (LBR) and fermentation (LBF and ECAM) conditions.
Mediuma E.coli Strain MIC (Incubation) (Plasmid) (µg ml-1)
CC118 20 CCl 18 [pBR322] 20
LBR F19 35 (anaerobic) F19 [pBR322] 35
C600 150 C600 [pBR322] 150
CC118 6 CCl 18 [pBR322] 6
LBF F19 15 (anaerobic) F19 [pBR322] 15
C600 110 C600 [pBR322] 110
CC118 6 CCl 18 [pBR322] 6
ECAM F19 15 (anaerobic) Fl 9 [pBR322] 15
C600 110 C600 [pBR322] 110
CC118 100 CCl 18 [pBR322] 100
LB F19 200 (aerobic) F19 [pBR322] 200
C600 1500 C600 [pBR322] 1500
11 Media used to support growth of E. coli cells which contained plasmids was supplemented with 100 µg ml-1 of ampicillin.
85
with mutations in their DNA repair systems. Strains with uvr mutations were
more sensitive to metronidazole than wild type strains, and strains with recA
mutations were even more sensitive than strains with uvr mutations.
4.3.2 Growth conditions and metronidazole sensitivity
E.coli strains grown under aerobic, anaerobic respiration and fermentation
conditions were tested for their susceptibility to metronidazole (Table 4.2). All

Metronidazole and E.coli 86
....-200
0 0 <.O
0 0 150
....-
E 100 / <( / CD <( 50 a_
0)
:i. 0 0 1 2 3 4 5 6
Incubation Time (h)
Figure 4.1 Nitroreductase activity of E.coli Fl9 (e) as compared to its parent, E.coli CC118 (0). Nitroreductase activity was determined by incubating cells with p-nitrobenzoic acid and measuring the resulting p-aminobenzoic acid (PABA) concentration with respect to time.
strains were more sensitive to metronidazole when grown under anaerobic
conditions. E.coli strains grown under fermentation conditions were more
sensitive to metronidazole as compared to strains grown under anaerobic
respiration. Ampicillin (100 µg ml-1) was added to media used to support the
growth of E.coli strains containing the plasmid pBR322. No synergistic effect
between metronidazole and ampicillin was demonstrated.
4.3.3 Transposon mutagenesis
E.coli CC118 was a suitable strain for transposon mutagenesis since it has a
stable recA mutation, is not a A-lysogen, is readily transformable and is a proven
host for TnphoA (Manoil and Beckwith, 1985). Following transposon
mutagenesis, 222 metronidazole resistant mutants were isolated.

Metronidazole and E. coli 87
4.3.4 Nitroreductase activities and recA stability
The 222 metronidazole resistant mutants isolated by transposon mutagenesis
were tested for stability of mutation, recA reversion, and nitroreductase activity.
Of the 222 mutants, 10 were not stable and were unable to grow in the presence
of metronidazole after subculturing. A further 29 were recA revertants, while 50
did not show reduced nitroreductase activity. The remaining 133 mutants had a
diminished ability to reduce nitroheterocyclic compounds. Mutant F19
consistently showed the lowest level of nitroreductase activity, and the
nitroreductase activity of this mutant is compared to that of its parent CC118 in
Fig. 4.1. Mutant F19 was therefore chosen to screen the C. acetobutylicum gene
bank for genes which cause an increase in sensitivity towards metronidazole (see
chapter 5).
4.4 Discussion
Chrystal et al. (1980) proposed a model relating metronidazole metabolism to
bacteriocidal action, and a similar model is presented in Fig. 4.2. Metronidazole
is reduced to its active form M*, which can react with DNA resulting in DNA
damage. If the rate of DNA damage (K;;) is greater than the rate of repair (K;;;),
cell death occurs. Therefore a cell with an efficient DNA repair mechanism is
able to tolerate higher levels of M* than a cell with a less efficient DNA repair
system. Since the rate of formation of M* (K;) is proportional to the rate of DNA
damage, two mechanisms of resistance to metronidazole exist. One mechanism
involves an efficient DNA repair system and the other involves the lack of the
ability to reduce metronidazole to its active intermediate M*.
In agreement with Jackson et al. (1984) and Yeung et al. (1984), the results in
Table 4.1 show that of all the E.coli strains tested, those with one or more lesions
in their DNA repair systems were more susceptible, to varying degrees, than
strains with complete and functional DNA repair system. An MIC of 40 µg ml-I
was observed for the uvrD mutant (N14-4), while the next susceptible strains
were the uvrA (AB1886), uvrB (AB1885) and uvrC (AB1884) strains, which had an
MIC of 35 µg ml-I. With the exception of strain LK111 which has an MIC of

Kiiii Kii
SURVIVAL
Metronidazole and E.coli
METRONIDAZOLE
lK; M*
1 K;;
DNA DAMAGE
1 K;;;
DNA REPAIR
Kii ~ Kiii
LETHAL EVENT
88
Figure 4.2 A model relating metabolism of metronidazole to cell death. Metronidazole is reduced to its active derivative M* by the cell. M* reacts with DNA causing damage, which can be repaired by the host cell's DNA repair systems. Ki 1s the rate of reduction of metronidazole, Kii is the rate of DNA damage, and Kiii is the rate of DNA repair. If the rate of DNA damage (Kii) is greater than the rate of DNA repair (KiiJ, cell death occurs.
15 µg ml-1, all of the recA only mutants had an MIC of 20 µg ml-1. Therefore, with
respect to single lesions in the DNA repair systems, the recA mutation proved to
have the largest effect. As shown by the MIC of strain CSR603 (recA, uvrA),
additional lesions in DNA repair systems caused an enhanced effect. Similar
results were reported by Jackson et al. (1984) with lexA, uvrA and recA, uvrA
double mutants. E.coli strain F19 was specifically developed to be resistant to
metronidazole, as is discussed in more detail below.
Under aerobic conditions, E.coli cells respire which leads to the transfer of
electrons to oxygen. Metronidazole is an artificial electron acceptor for low
redox potential electrons (Miiller, 1983). Therefore, metronidazole is in
competition with oxygen for available electrons in aerobically grown cells. It is
believed that the reduction of metronidazole occurs in single electron steps,

Metronidazole and E.coli 89
leading to the formation of a free radical anion (Perez-Reyes et al., 1979). In the
presence of oxygen metronidazole can be reduced, albeit slowly, to the single
electron transfer free radical anion, which is reoxidized by oxygen with the
production of superoxide. It can be speculated that the superoxide radical,
which is known to cause DNA damage, may be responsible for the bacteriocidal
effect high concentrations of metronidazole have on aerobically grown E.coli
cells (Table 4.2), and that metronidazole itself is not directly involveq. Under
anaerobic conditions, the cellular redox potential is related to the reduction of
metronidazole to its active derivative or derivatives (beyond single electron
transfer). As is shown in Table 4.2, anaerobically respiring E.coli cells are
slightly less susceptible than fermenting cells, presumably due to the slightly less
negative intracellular redox potential. The results in Table 4.2 also support the
data in Table 4.1, where E.coli strains CC118 and F19, which are recA mutants,
are more susceptible to metronidazole than the wild type C600 strain. This
observation occurred even in aerobically grown cells, indicating that DNA
damage is still the mechanism by which cell death occurs.
Ampicillin did not have a synergistic effect when used in conjunction with
metronidazole. This is an important observation in lieu of the development of an
E.coli cloning host for use with vectors containing a ~-lactamase resistance
marker. This desired cloning host should lack the ability to reduce
metronidazole to its active intermediates, while being highly susceptible to these
active compounds. As shown in Table 4.1, DNA repair deficient mutants of
E.coli are more susceptible to metronidazole than their wild type parents.
However, Yeung et al. (1984) demonstrated that nitrate reductase, DNA repair
double mutants were no more susceptible to metronidazole than their wild type
parents. Furthermore, these authors showed that these double mutants were
equally sensitive to the active intermediates of metronidazole, when compared to
other DNA repair mutants, but they reduced metronidazole at a slower rate. The
latter feature was presumed to be due to the nitrate reductase mutation. Nitrate
reductase mutants of E.coli are easily obtained by selecting for chlorate
resistance (Begg et al., 1977; Graham et al., 1980; Stewart and McGregor, 1982).
Since a primary goal of this study was to isolate an E. coli mutant with

Metronidazole and E.coli 90
diminished ability to reduce metronidazole, it was decided to select directly for
metronidazole resistance as opposed to chlorate resistance. Furthermore, as
metronidazole is not a nitrate compound per se, but rather a nitroheterocyclic
compound, further screening of these metronidazole resistant mutants was
carried out by measuring their ability to reduce PNBA to PABA. Transposon
mutagenesis of E. coli CC118 yielded 133 stable metronidazole resistant, recA
mutants. Mutant F19 consistently showed the lowest level of nitroreductase
activity (Fig. 4.1). This mutant has the desired traits of a diminished ability to
reduce metronidazole, presumably due to the low level of nitroreductase, while
remaining highly sensitive to the reduced active derivatives of metronidazole,
due to the recA mutation. F19 was therefore chosen as the cloning host to screen
for recombinant plasmids containing C. acetobutylicum DNA coding for electron
transport genes that activate metronidazole (see Chapter 5). Since this mutant
was developed to be used as a cloning host, and not for physiological studies of
the effects of metronidazole on E.coli, no efforts were made to further
characterize the mutation induced by TnphoA.

Chapter 5
Isolation and classification of C. acetobutylicum genes
which activate metronidazole
5.0 Summary ........................................... 91
5.1 Introduction ......................................... 92
5.2 Materials and Methods .................................. 93 5.2.1 Chemicals . . . . . . . . . . . . . . . . . . . . . . . . . . . . . . . . . . . . . . . 93 5.2.2 Bacterial strains and plasmids .......................... 93 5.2.3 Media and growth conditions .......................... 94 5.2.4 Determination of MIC ............................... 94 5.5.5 Preparation of DNA ................................ 94 5.2.6 Genebank construction . . . . . . . . . . . . . . . . . . . . . . . . . . . . . . 94 5.2.7 Cloning of C. acetobutylicum genes which activate metronidazole ... 94 5.2.8 Preparation of cell extracts . . . . . . . . . . . . . . . . . . . . . . . ..... 95 5.2.9 Enzyme assays .................................... 95 5.2.10 SOS polyacrylamide gel electrophoresis ................... 96 5.2.11 Restriction mapping ................................ 96 5.2.12 Preparation of radiolabelled probe ON A .................. 96 5.2.13 DNA hybridization ................................ 96
5.3 Results . . . . . . . . . . . . . . . . . . . . . . . . . . . . . . ............... 97 5.3.1 Screening of the C. acetobutylicum gene library . . . . . . . . . . . . . . . 97 5.3.2 Classification of clones based on MIC ..................... 97 5.3.3 Tests for enzyme activity . . . . . . . . . . . . . . . . . . . . . . . . . . . . . 97 5.3.4 PAGE studies ..................................... 99 5.3.5 DNA hybridization studies ........................... 100 5.3.6 Restriction endonuclease mapping and deletion studies ........ 103
5.4 Discussion ......................................... .105
Chapter 5
Isolation and classification of C. acetobutylicum genes which activate metronidazole
5.0 Summary
91
The E.coli Fl9 recA, nitroreductase deficient mutant (Chapter 4) was used for the
isolation of C. acetobutylicum genes on recombinant plasmids which activated
metronidazole. These genes rendered the E.coli Fl9 strain sensitive to
metronidazole. Twenty five E.coli Fl9 clones which contained different
recombinant plasmids were isolated and classified into five groups (I-V) based
on their sensitivity to metronidazole. With respect to metronidazole
susceptibility, class I isolates were the least sensitive group whereas class V
isolates were the most sensitive group. The clones were tested for
nitroreductase, pyruvate-Fd-oxidoreductase and hydrogenase activities.
Nitroreductase and pyruvate-Fd-oxidoreductase activity was not demonstrated
in any of the isolated clones. Only one clone pMET15B2, which is a class I
isolate, tested positive for hydrogenase activity. DNA hybridization and
restriction endonuclease mapping revealed that four of the C. acetobutylicum
insert DNA fragments on recombinant plasmids were linked in an 11.1 kb
chromosomal fragment. Three of these clones, pMET13A, pMET030 and
pMET190, were class V isolates, whereas the fourth clone was the hydrogenase
positive isolate pMET15B2. The 11.1 kb chromosomal fragment therefore
contained at least two regions responsible for activating metronidazole. The
region responsible for class V sensitivity to metronidazole was localized to a 2 kb
EcoRI-EcoRV fragment, which was present in each of the clones pMET13A,
pMET030 and pMET190. Based on the orientation of the insert DNA with
respect to vector DNA it was concluded that the gene responsible for class V
sensitivity to metronidazole located on this 2 kb region was transcribed from a
promoter present on the insert.

Cloning of metronidazole activating genes 92
5.1 Introduction
Based on the principal that electron flow can control carbon flow (Kim et al.,
1984; Jones and Woods, 1986a), genes encoding electron transport proteins and
enzymes may play an important role in genetic manipulations of C.
acetobutylicum aimed at improving the fermentation. Furthermore, an
understanding of the mechanisms involved in the activation of metronidazole is
important for the development of improved analogs for use in medicine. To gain
knowledge of both metronidazole activation and C. acetobutylicum electron
transport genes, a negative selection system was developed for cloning C.
acetobutylicum electron transport genes in E.coli that activate metronidazole (see
also chapter 4). The cloning strategy involved the use of the nitroreductase
deficient, recA E.coli F19 mutant. C. acetobutylicum genes on recombinant
plasmids which activate metronidazole would complement this mutant's
deficiency in reducing the drug. These genes can be identified by observing an
increased sensitivity to metronidazole.
There have been conflicting reports as to what proteins or enzymes are
responsible for the reduction of metronidazole to its active derivatives. Edwards
and Mathison (1970) reported that reduced ferredoxin could directly transfer
electrons to metronidazole, forming the reduced toxic derivatives. This theory is
supported by the hydrogenase linked assay system developed by Chen and
Blanchard (1979) for measuring ferredoxin and flavodoxin, using metronidazole
as the indicator compound. These authors report that hydrogenase transfers
electrons from hydrogen gas to ferredoxin or flavodoxin which then transfer
electrons to metronidazole forming the reduced toxic intermediates. It has also
been reported that metronidazole is reduced enzymatically by the action of
pyruvate-Fd-oxidoreductase (Narikawa, 1986). The most recent theory has been
put forward by Church et al (1988, 1990) who have shown that metronidazole as
well as other nitroimidazole drugs are reduced by hydrogenase 1 of C.
pasteurianum. Any of the clostridial genes encoding electron carriers or enzymes
involved in the phosphoroclastic breakdown of pyruvate and the concomitant

Cloning of metronidazole activating genes 93
production of hydrogen gas are therefore likely candidates to be isolated using
this cloning strategy.
The work described in this chapter involved the screening of a C. acetobutylicum
DNA fragment library in E.coli F19 for genes that activate metronidazole.
5.2 Materials and Methods
Commonly used materials and techniques are presented in the Appendices. The
details provided below are included for completeness.
5.2.1 Chemicals
Restriction endonucleases were obtained from several sources (Amersham
International, Anglian Biotec, Boehringer Mannheim Biochemicals GmbH, New
England Biolabs, and the Promega Corp.) [a-32p] labelled dA TP was obtained
from Amersham International. Metronidazole was obtained from the Sigma
Chemical Co. All other chemicals were analytical grade and were purchased
from various local agents and suppliers.
5.2.2 Bacterial strains and plasmids
C. acetobutylicum P262 (Jones et al., 1982) was used as the source of DNA. E.coli
strain F19 (Santangelo et al., 1991) was used as the recipient strain for
recombinant plasmids. Construction of the nitroreductase deficient, recA E.coli
strain F19 is described in Chapter 4. For hydrogenase assays, plasmids were
transformed into the E.coli SE53 hydA mutant which was derived from E. coli
strain Puig426 (Lee et al., 1985). The plasmid vector pEcoR251 (Appendix E)
which was a gift from M. Za.beau, Biotechnology Business Development, Ghent,
Belgium, was used to prepare a genomic library of C. acetobutylicum
chromosomal DNA (Za.ppe et al., 1986). pEcoR251 is a positive selection vector
containing the E.coli EcoR1 gene under the control of the A-rightward promoter,
the pBR322 ampicillin resistance gene and the pBR322 origin of replication. The
EcoRI gene product, when expressed at high levels by the A promoter is lethal
unless insertionally inactivated, or regulated by a resident A prophage. The
EcoRI gene has single restriction enzyme sites for Hindlll, Bglll and Sspl. Positive

Cloning of metronidazole activating genes 94
selection is obtained through insertional inactivation of the EcoRl endonuclease
gene, by cloning foreign DNA into one of these single restriction enzyme sites.
pEcoR251 was derived from the pCL series of plasmids described by Zabeau and
Stanley (1982).
5.2.3 Media and growth conditions
C. acetobutylicum P262 was grown under strict anaerobic conditions in the
Clostridium basal medium (CBM) of O'Brien and Morris (1971) as described by
Allcock et al. (1982). E.coli F19 was grown as described in section 4.2.2.
5.2.4 Determination of MIC
MIC values were determined as described in section 4.2.3.
5.5.5 Preparation of DNA
Plasmid DNA was prepared by the alkali-hydrolysis method of Ish-Horowicz
and Burke (1981). The small-scale (miniprep) and large-scale (maxiprep)
methods of plasmid isolation are described in Appendix B. C. acetobutylicum
cellular DNA was prepared by the method of Marmur (1961), which was
modified (Zappe et al., 1986) to overcome the high nuclease activity exhibited by
this organism (Drano et al., 1983). E.coli cellular DNA was prepared as
described by Maniatis et al. (1982).
5.2.6 Genebank construction
The genomic library (Zappe et al., 1986) contained sucrose fractionated Sau3A1
endonuclease fragments (4 to 7 kb from a partial digestion) of C. acetobutylicum
P262 chromosomal DNA which were ligated with pEcoR251 which had been
restricted with Bglll endonuclease.
5.2.7 Ooning of C. acetobutylicum genes which activate metronidazole
E.coli F19 cells containing recombinant pEcoR251 plasmids were selected on LB
agar containing ampicillin (100 µg ml-I). Colonies were duplicated onto LBR
agar containing ampicillin (100 µg ml-I) or ampicillin plus metronidazole
(30 µg ml-1). These plates were incubated anaerobically at 34 ·c for 24 h, and

Cloning of metronidazole activating genes 95
colonies that were resistant to ampicillin and sensitive to metronidazole were
chosen for further study.
5.2.8 Preparation of cell extracts
Cell extracts of E.coli were prepared from overnight cultures (400 ml) grown
anaerobically in the presence of ampicillin (100 µg ml-I). Cell extracts of C.
acetobutylicum were prepared from exponential phase cells grown anaerobically
in CBM. Cell extracts were prepared under anaerobic conditions by the
procedure of Clark and Cronan (1980) and stored at -70°C to preserve enzyme
activity. Protein concentrations in the extracts were determined by the biuret
method as described by Cornall et al. (1949).
5.2.9 Enzyme assays
Nitroreductase activity was assayed by determining the conversion of PNBA to
PABA according to the method of Bratton and Marshall (1939), as described in
section 4.2.5.
Pyruvate-Fd-oxidoreductase was assayed using the method of Wahl and
Orme-Johnson (1987). The reaction mix contained 10 mM sodium pyruvate,
250 µM 2-mercaptoethanol, 250 µM coenzyme A, 50 µM thiamine pyrophosphate
and 2 mM methyl viologen in 50 mM Tris-HCl (pH 7.5). The reaction was
initiated by the addition of the cell free extract (500 µg protein). The reaction was
monitored by following the absorbance at 600 nm. All manipulations and
measurements were carried out under strict anaerobic conditions in an anaerobic
cabinet.
Hydrogenase activity was determined by testing the ability of cell free extracts to
produce hydrogen gas from the reduced artificial electron acceptor, methyl
viologen (Church et al., 1988). Assays were performed using a Warburg
apparatus with a water bath temperature of 30°C. Warburg flasks were gassed
out for 20 min with helium. The centre well contained 200 µl of 20% potassium
hydroxide to absorb any carbon dioxide which evolved during the reaction. The
rim of the centre well was coated with a thin layer of vacuum grease to prevent

Cloning of metronidazole activating genes 96
creeping of the potassium hydroxide. The reaction flask contained 10 mM
methyl viologen and 15 mM sodium dithionite in 50 mM Tris-HCl (pH 7.5). The
reaction was started by tipping a volume of the cell free extract equivalent to
3 mg of protein, into the main compartment of the reaction vessel. The final
volume in the reaction flask was always 2 ml, and hydrogen production was
monitored over 10 min. The volume of hydrogen produced was calculated
according to the methods described by Umbreit et al. (1972).
5.2.10 SOS polyacrylamide gel electrophoresis
SDS polyacrylamide gel electrophoresis (PAGE) was carried out by following the
methods of Laemmli (1970), using 50 µg per lane of proteins from crude cell
extracts. The gels were electrophoresed at 35 mA constant current using a
Hoeffer SE 600 vertical gel apparatus. The 1.5 mm thick gels consisted of 10%
acrylamide with 2.7% crosslinking. After electrophoresis, proteins were stained
with Coomassie blue R-250.
5.2.11 Restriction mapping
Recombinant plasmids were characterized by restriction mapping using
standard procedures (Maniatis et al., 1982).
5.2.12 Preparation of radiolabelled probe DNA
Plasmids containing C. acetobutylicum DNA inserts, or isolated DNA fragments
were nick translated (Rigby et al., 1977) with [a..32P]dATP using the nick
translation kit of Amersham International (code N.5500). Nick translated probes
were prepared according to the manufacturer's instructions.
5.2.13 DNA hybridization
Plasmid DNA, C. acetobutylicum chromosomal DNA and E. coli chromosomal
DNA were digested to completion with the appropriate endonucleases, and the
resulting fragments were fractionated by electrophoresis in either 0.8% or 1.2%
(w/v) agarose gels in Tris-acetate buffer, as appropriate. The DNA was
transferred monodirectionally to a Hybond N + nylon membrane (Amersham
International) according to the manufacturer's instructions. Radiolabelled DNA,

Cloning of metronidazole activating genes 97
described above, was used to probe these membranes (Southern, 1975; Smith and
Summers, 1980).
5.3 Results
5.3.1 Screening of the C. acetobutylicum gene library
E.coli F19 was used as the host to screen the C. acetobutylicum gene library for
genes conferring metronidazole sensitivity. Although this mutant was very
sensitive towards the reduced toxic derivative(s) of metronidazole due to a recA
mutation, it was resistant to metronidazole since it was deficient in
nitroreductase activity associated with the reduction of metronidazole. The
screening of the C. acetobutylicum gene library in E.coli F19 selected for genes that
complement the metronidazole reducing ability which is lost in this mutant.
Twenty six stable clones were isolated that showed an increased sensitivity
towards metronidazole. Plasmid involvement in metronidazole susceptibility
was confirmed by retransformation experiments with plasmids isolated from the
26 clones. Plasmids from each clone retransformed into E.coli F19 produced
similar numbers of ampicillin resistant and metronidazole sensitive
transformants.
5.3.2 Oassification of clones based on MIC
The 26 metronidazole sensitive clones were classified into five groups (1-V) based
on their susceptibility to metronidazole, where class V was the most sensitive
group and class I was the least sensitive group (Table 5.1). All clones were more
sensitive to metronidazole than the E.coli F19 mutant.
5.3.3 Tests for enzyme activity
Since it has been reported that clostridial enzymes, pyruvate-Fd-oxidoreductase
(Narikawa, 1986) and hydrogenase (Church et al., 1988, 1990) may be responsible
for the reduction of metronidazole, cell extracts of all 26 clones were tested for
these enzymes. Since the enzyme activity responsible for the reduction of
metronidazole in E.coli involves a nitroreductase (Yeung et al., 1984), the 26
clones were also tested for nitroreductase activity. No significant nitroreductase

Cloning of metronidazole activating genes 98
Table 5.1 Metronidazole sensitivity of the twenty six E.coli clones containing recombinant plasmids with DNA inserts from C. acetobutylicum gene library. MIC's were determined under conditions of anaerobic respiration and fermentation.
Isola tea MIC (µg ml-1)
respiration fermentation Sensitivity
Classb
F19c 35 15 -CC11Bc 20 6 -pMET11B <5 <1 V pMET13A <5 <1 V pMET13Cl <5 <1 V pMET030 <5 <1 V pMET190 <5 <1 V pMET4B 10 3 IV pMET5E 10 3 IV pMET10B 10 3 IV pMET9D 12 4 III pMETlOD 12 4 III pMET14B 12 4 III pMET2D 15 5 II pMET4A 15 5 II pMET8E 15 5 II pMETlA 20 6 I pME17A 20 6 I pME17C 20 6 I pMET9A 20 6 I pMET13B 20 6 I pMET13C2 20 6 I pMET15B2 20 6 I pMET15D 20 6 I pMET020 20 6 I pMET040 20 6 I pMET130 20 6 I pMET140 20 6 I
11 All isolates represent C. acetobutylicum DNA cloned into plasmid pEcoR251 which was transformed into E.coli F19.
b Sensitivity class is a arbitrary numbering system based on the observed MIC. Class Vis the most sensitive class towards metronidazole whereas Class I is the least sensitive class.
c E.coli strains CC118 and F19 are included as controls for comparative purposes. Plasmid pBR322 was transformed into these control strains m order to determine the MIC on the same medium as the clones, which contained ampicillin.
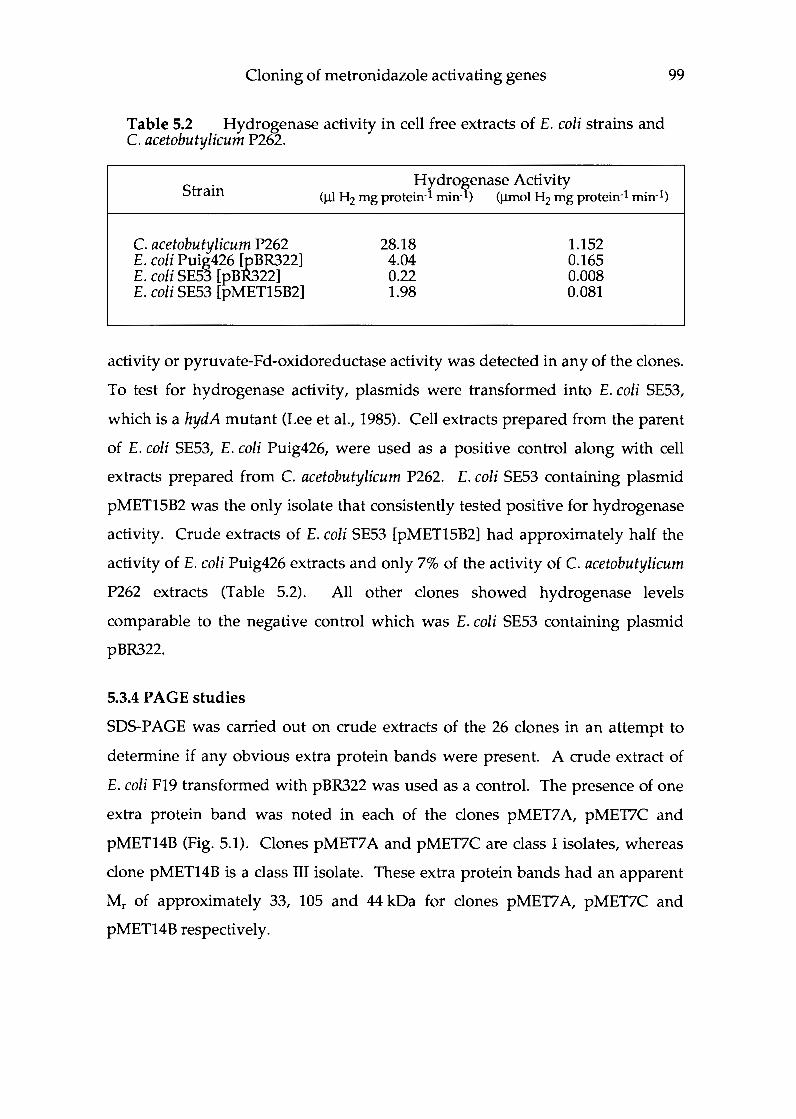
Cloning of metronidazole activating genes
Table 5.2 Hydrogenase activity in cell free extracts of E.coli strains and C. acetobutylicum P262.
Strain
C. acetobutylicum P262 E.coli Puig426 [pBR322] E. coli SE53 [pBR322] E.coli SE53 [pMET15B2]
Hydrogenase Activity (µl H2 mg protein-I min-I) (µmol H2 mg protein-I min-I)
28.18 4.04 0.22 1.98
1.152 0.165 0.008 0.081
99
activity or pyruvate-Fd-oxidoreductase activity was detected in any of the clones.
To test for hydrogenase activity, plasmids were transformed into E.coli SE53,
which is a hydA mutant (Lee et al., 1985). Cell extracts prepared from the parent
of E.coli SE53, E.coli Puig426, were used as a positive control along with cell
extracts prepared from C. acetobutylicum P262. E.coli SE53 containing plasmid
pMET15B2 was the only isolate that consistently tested positive for hydrogenase
activity. Crude extracts of E.coli SE53 [pMET15B2] had approximately half the
activity of E.coli Puig426 extracts and only 7% of the activity of C. acetobutylicum
P262 extracts (Table 5.2). All other clones showed hydrogenase levels
comparable to the negative control which was E. coli SE53 containing plasmid
pBR322.
5.3.4 PAGE studies
SDS-PAGE was carried out on crude extracts of the 26 clones in an attempt to
determine if any obvious extra protein bands were present. A crude extract of
E.coli F19 transformed with pBR322 was used as a control. The presence of one
extra protein band was noted in each of the clones pMET7 A, pMET7C and
pMET14B (Fig. 5.1). Clones pMET7 A and pMET7C are class I isolates, whereas
clone pMET14B is a class III isolate. These extra protein bands had an apparent
Mr of approximately 33, 105 and 44 kDa for clones pMET7 A, pMET7C and
pMET14B respectively.

Cloning of metronidazole activating genes 100
A B C D E F G
94 94
67
43 43
30
Fi~e 5.1 SOS-PAGE of extracts of E.coli F19[pMET14B] cells (lane B), E.coli F19[pME17 A] cells (lane D), E. coli F19[pME17C] cells (lane E) and E. coli F19[pBR322] cells (lane F). Lanes A, C and G contained Pharmacia low molecular weight standards (phosphorylase b, 94 kDa; bovine serum albumin, 67 kDa; ovalbumin, 43 kDa; and carbonic anhydrase, 30 kDa). The arrows indicate the positions of the extra protein bands in extracts of clones pME17 A, pME17C and pMET14B.
5.3.5 DNA hybridization studies
To determine the relatedness of the 26 clones, DNA hybridization studies were
performed. Each plasmid as well as pEcoR251 with no insert, was nick
translated to yield a total of 27 radiolabelled probes. Unlabelled plasmids were
digested to completion with HinF1 endonuclease which has a four base pair
recognition sequence, and were fractionated by electrophoresis in 1.2% (w /v)
agarose gels in Tris-acetate buffer. Since HinF1 is a four base pair cutter, it was
assumed that at least one fragment consisting of only C. acetobutylicum insert
DNA would be generated for each plasmid. Twenty seven agarose gels were
prepared, each containing HinF1 digestions of all 26 plasmids plus pEcoR251.
Each of these agarose gels was blotted onto a nylon membrane and probed with

Cloning of metronidazole activating genes 101
Table 5.3 Results of cross hybridization studies of the twenty six plasmids isolated from the C. acetobutylicum gene library. All plasmids were composed of the pEcoR251 vector containing C. acetobutylicum insert DNA.
Plasmid Insert Cross Hybridized with Probe Size
(kb) Plasmid Plasmid Plasmid
pMETlA 5.15 - - -pMET2D 4.90 pMET14B - -pMET4A 1.20 - - -pMET4B 4.30 pMET5E - -pMET5E 4.30 pMET4B - -pMET7A 6.35 - - -pMET7C 6.05 pMET140 - -pMET8E 5.35 pMET13B - -pMET9A 5.20 - - -pMET9D 4.75 - - -pMETlOB 2.25 pMET040 - -pMETlOD 6.75 - - -pMETllB 7.60 - - -pMET13A 6.65 pMET15B2 pMET030 pMET190 pMET13B 6.10 pMET8E - -pMET13Cl 4.80 - - -pMET13C2 5.65 - - -pMET14B 9.90 pMET2D - -pMET15B2 1.00 pMET13A pMET030 -pMET15D 9.60 pMET130 - -pMET020 6.25 - - -pMET030 7.05 pMET13A pMET15B2 pMET190 pMET040 3.35 pMETlOB - -pMET130 4.75 pMET15D - -pMET140 5.25 pMET7C - -pMET190 7.95 pMET13A pMET030 -
a different plasmid probe. Probing one of these gels with radiolabelled
pEcoR251 (no insert) yielded an autoradiograph showing all DNA fragments
containing vector DNA. The other plasmid probes yielded autoradiographs
showing the extent of cross hybridization between the clones (Table 5.3).
From restriction endonuclease digests and these DNA hybridization studies,
only isolates pMET4B and pMETSE contained identical inserts (Fig. 5.2).
Therefore, of the 26 clones, 25 individual cloning events were represented. Ten
of the clones hybridized only with themselves, 12 hybridized with one other
clone, and 4 hybridized with two or more clones. The 12 clones that hybridized

Cloning of metronidazole activating genes 102
ABCDEFGHIJ
Figure 5.2 A 0.8% (w /v) agarose gel showing the identity between clones pMET4B and pMETSE. Lanes C and H contain stze markers of bacteriophage A DNA which was digested to completion with Pstl. Lanes A, D, F and I contain pMET4B plasmid DNA which was digested with Hindi, Pstl, Sspl and HinDIII respectively. Correspondingly, Lanes B, E, G and J contain pMETSE plasmid DNA which was digested with Hincll, Pstl, Sspl and HinDill respectively. In all cases, the digestion pattern of both pMET4B and pMETSE were identical.
with one other clone may represent different size fragments of the same region of
C. acetobutylicum DNA. Therefore, the area of C. acetobutylicum DNA containing
the active region may be completely contained on each of the two clones or
alternatively, a truncated version may exist on one of the clones. The latter may
explain why there are differences in the sensitivity class of two clones that
hybridized with each other. The four clones, pMET13A, pMET15B2, pMET030
and pMET190, make up the most intriguing group, ie. those clones that
hybridized with 2 or more other clones. It is interesting to note that with the
exception of clone pMET15B2, all of the isolates in this group have a class V
sensitivity to metronidazole. This may indicate that clones pMET13A, pMET030
and pMET190 all contain the same active region from the C. acetobutylicum
chromosome. This is supported by the fact that pMET13A, pMET030 and

pMET190
pMET030
pMET13A
pMET1582
== --~~_g J: J:X
Cloning of metronidazole activating genes
= - =ci:=ci: ::i~o~o~o-;_
1;i > - .0 ·- 0 ·- U -ll. 11.u x :i:: w:i::w II)
> -0:: =-i:i
o s siiiio 0 w ll.ll.lD
> > --- = 0::-0:: -
~s_g so.co ~ Ull.X ll. i!:l~i!:l I
:v
0 1 2 3 4 5 6 7 8 9 10 11 I , 11 , , ,, 1 1 I 1 1 rt I 11 , , I , , , , 1, 11 ,I , 11 II , , , , I , , 11 I 11 11 I 111 1 I , t II I 11 11 I 1 11 d t1 , 1 I rt II I 11 1 1 I 11 11 I , 11 , I II r d 1 , 11 I 1 11 d ,
Kilobases
V
V
103
Figure 5.3 Restriction endonuclease map showing the relationship between clones pMET13A, pMET15B2, pMET030 and pMET190. The arbitrary metronidazole sensitivity class is shown on the right of each clone ma?· The striped region represents the area necessary to exhibit the class V metromdazole sensitivity phenotype in E.coli F19.
pMET190 all hybridized with each other, whereas clone pMET15B2 only
hybridized with clones pMET13A and pMET030.
5.3.6 Restriction endonuclease mapping and deletion studies
The relationship between clones pMET13A, pMET15B2, pMET030 and pMET190
was determined by restriction endonuclease mapping. The restriction map of the
insert DNA of these four clones is shown in Fig. 5.3. As can be seen from these
restriction maps, insert DNA of clone pMET15B2 is completely contained within
clones pMET13A and pMET030. Furthermore, insert DNA of clone pMET15B2
overlaps slightly with clone pMET190, however this was not identified in the
hybridization studies. This is most likely due to the experimental design of the
hybridizations, in that the probes used contained insert DNA as well as
pEcoR251 vector DNA. The small overlap from clone pMET190 was most likely
linked to pEcoR251 vector DNA and was therefore disregarded, as it hybridized
with the pEcoR251 (vector only) probe. Although pMET030 and pMET13A
contained the same region as pMET15B2, which showed hydrogenase activity,
these two plasmids did not express hydrogenase activity in E. coli SE53.

Cloning of metronidazole activating genes 104
ABCDEFGH I J ABCDEFGH I J
Figure 5.4 Southern blot analysis of five clones that show class V sensitivity towards metronidazole. The agarose gel is shown on the left and the corresponding autoradiograph on the right. The 1.6 kb Styl-EcoRV fragment from pMET13A was nick translated and used to probe against Styl-EcoRV digested DNA from: E.coli chromosome (lane A); C. acetobutylicum chromosome (lane B); pMET13A plasmid (lanes C, D, and E); pMETllB plasmid (lane G); pMET13C1 plasmid (lane H); pMET030 plasmid (lane I); and pMET190 plasmid (lane J) . Lane F contains Pstl digested A DNA as size standards.
By performing restriction endonuclease deletions of the insert DNA of clone
pMET13A, the region responsible for class V sensitivity to metronidazole was
localized to a 2 kb EcoRI-EcoRV fragment (Fig. 5.3). To verify that this DNA
originated from C. acetobutylicum P262, Southern blot analysis was performed
using the Styl-EcoRV fragment from clone pMET13A as a probe (Fig. 5.4).
Chromosomal DNA isolated from C. acetobutylicum and E. coli (negative control),
as well as plasmid DNA isolated from clones pMETl 1 B, pMET13A, pMET13C1,
pMET030 and pMET190 was digested with Styl and EcoRV and the resulting ,
fragments were separated by electrophoresis in 0.8% (w /v) agarose in Tris
acetate buffer. The Styl-EcoRV probe hybridized to Styl-EcoRV fragments of
identical size from clones pMET13A, pMET030 and pMET190, as well as a

Cloning of metronidazole activating genes 105
Styl-EcoRV fragment of identical size from C. acetobutylicum chromosomal DNA
No hybridization to the E.coli chromosomal DNA was demonstrated. This
indicates that the region of DNA responsible for class V sensitivity in clone
pMET13A is contained within clones pMET030 and pMET190, and also verifies
that this DNA originated from the C. acetobutylicum chromosome. Plasmids
pMET11B and pMET13Cl were included in this Southern blot analysis because
they also demonstrated class V sensitivity to metronidazole. Since the active
region from pMET13A did not hybridize with either pMETl 1 B or pMET13Cl,
the class V sensitivity to metronidazole associated with these clones is separate
and unique from that found on clones pMET13A, pMET030 and pMETl 90.
5.4 Discussion
The E.coli F19 recA, nitroreductase deficient mutant proved to be a most suitable
host for the isolation of recombinant plasmids. Screening experiments resulted
in the isolation of 25 different recombinant plasmids which contain C.
acetobutylicum DNA coding for genes involved in the activation of
metronidazole. The E.coli F19 mutant can be utilized for the isolation of genes
from other bacteria which are involved in the reduction of metronidazole.
Furthermore, a recA+ revertant of E.coli F19 has been isolated (Fig. 5.5).
Therefore, a battery of E.coli strains and C. acetobutylicum genes exists for testing
the activities of novel antimicrobial compounds related to metronidazole. It can
be inferred whether a compound needs to be reduced to become active and
whether the active compound is related to DNA repair by comparing the
sensitivity of the various strains, with and without the cloned genes, to these
novel compounds.
In choosing enzyme systems which may be controlled by the 25 plasmids, it was
obvious that nitroreductase activity should be analyzed. However, in strict
anaerobes such as C. acetobutylicum, where oxygen can not be utilized as the
terminal electron acceptor, other electron transport mechanisms also exist. These
electron transport systems typically operate at a much lower redox potential than
nitroreductase systems. Ferredoxin is a low molecular weight, iron-sulfur

Cloning of metronidazole activating genes 106
Figure 5.5 Results of a UV dose experiment demonstrating the recA- and recA+ isolates of E.coli strain F19. The recA+ isolate (top streak) survived a 25 sec exposure to UV light (1 J m2 sec-I), whereas the recA- isolate (bottom streak) was killed with a 10 sec exposure.
containing protein which can accept and donate electrons at a very low potential
approaching that of the hydrogen electrode (E0' = -410 mV) (Jones and Woods,
1986a). This molecule plays a crucial role as an electron carrier in electron
distribution in the cell. Oxidized ferredoxin accepts electrons during the
phosphoroclastic conversion of pyruvate to acetyl CoA. The enzyme responsible
for this conversion and electron transfer is the pyruvate-Fd-oxidoreductase.
Reduced ferredoxin can transfer electrons to the iron-containing hydrogenase
which uses protons. as the final electron acceptor. A simplified schematic of this
electron transport system is shown in Fig. 5.6. Like ferredoxin, flavodoxin is a
small acidic molecule that functions as a low potential electron transfer protein
(Krey et al., 1988). The redox potential of the semiquinone/hydroquinone couple
is approximately -450 mV (Mayhew and Ludwig, 1975). Flavodoxin was first
isolated from C. pasteurianum grown under iron deficient conditions (Knight et
al., 1966) and it was shown to be able to replace ferredoxin as an electron carrier
(Knight and Hardy, 1966; Knight and Hardy, 1%7).

Cloning of metronidazole activating genes 107
[M*] PYRUVATE HYDROGEN
(MET) .------- F d Ox
---------~Fd Red--------__. (M*)
ACETYL-CoA PROTONS [MET]
Figure 5.6 A simplified schematic of the C. acetobutylicum electron transport system. The relationship between oxidized ferredoxin (Fd0 x), reduced ferredoxin (Fdred), pyruvate-Fd-ox1doreductase (A) and hydrogenase (B) is shown. In the absence of metronidazole, electrons are transferred to Fd0 x by pyruvate-Fdoxidoreductase. Hydrogenase transfers electrons from Fdred to protons to form hydrogen gas. In the presence of metronidazole, electrons may fie transferred to metronidazole (MET) by pyruvate-Fd-oxidoreductase to form the reduced toxic derivative of metronidazole (M*), which causes DNA damage (Narikawa, 1986). Alternatively, [MET] may re_Elace protons and be reduced to [M*] by the action of the hydrogenase enzyme (Church et al., 1988, 1990).
The theory proposed by Narikawa (1986) that the enzyme pyruvate-Fd
oxidoreductase is responsible for the reduction of metronidazole to its active
intermediates, assumes that metronidazole replaces oxidized ferredoxin in the
phosphoroclastic breakdown of pyruvate to acetyl CoA (Fig. 5.6). It is therefore
surprising that none of the clones isolated in this study demonstrated
nitroreductase or pyruvate-Fd-oxidoreductase activity, but this does not rule out
the possibility that C. acetobutylicum nitroreductase or pyruvate-Fd
oxidoreductase can reduce metronidazole to its active form. The assay system
used to measure pyruvate-Fd-oxidoreductase activity uses the artificial electron
acceptor, methyl viologen, as the indicator of enzyme activity. In principal,
pyruvate-Fd-oxidoreductase transfers electrons from the breakdown of pyruvate
to oxidized methyl viologen, which is colourless. This in tum forms reduced

Cloning of metronidazole activating genes 108
methyl viologen which is blue in colour and can be measured
spectrophotometrically at 600 nm. Unfortunately, extracts prepared from
anaerobically respiring E.coli cells are able to reduce methyl viologen in the
absence of additional pyruvate. No increase in the rate of reduction of methyl
viologen was observed in extracts prepared from the isolated clones. One or
more of the clones may indeed contain the gene for the pyruvate-Fd
oxidoreductase, however these can only be identified by employing more
specific and sensitive techniques.
O'Brien and Morris (1972) studied the effects of metronidazole on hydrogen
production in C. acetobutylicum. These authors reported that when sub-inhibitory
concentrations of metronidazole were added to C. acetobutylicum cultures,
hydrogen evolution ceased until the presence of metronidazole could no longer
be detected. Despite the inhibitory effect of metronidazole on hydrogen
production, no alteration in carbon dioxide production occurred. This indicates
that electrons normally utilized for hydrogen production were siphoned away
for metronidazole reduction. The lack of hydrogen production could have been
caused by electrons being transferred to metronidazole instead of ferredoxin. In
this case, no electrons would be available for the hydrogenase enzyme
component of the C. acetobutylicum electron transport cycle. Alternatively, in
support of the theory of Church et al. (1988, 1990), the hydrogenase enzyme
could have been responsible for the reduction of metronidazole, where
metronidazole replaced protons as the final electron acceptor. Another
possibility is that reduced ferredoxin directly transfered electrons to
metronidazole without enzyme action. In all of these cases, electrons would not
be available for the production of hydrogen gas (Fig. 5.6).
The enzymes NADH- and NADPH-Fd-oxidoreductase (Jungermann et al., 1973;
Jungermann et al., 1976; Petitdemange et al., 1976) may operate at a low enough
redox potential to activate metronidazole. Attempts were made to assay these
enzymes in E.coli using NAD(P)H as the indicator. Unfortunately, extracts
prepared from anaerobically respiring E.coli cells were able to efficiently reduce

Cloning of metronidazole activating genes 109
these indicator compounds, making it extremely difficult to specifically assay for
these oxidoreductases.
E.coli [pMET15B2] was the only transformant that demonstrated hydrogenase
activity, which was approximately half of the activity of the wild type E. coli
strain Puig426 (Table 5.2). Voordouw et al. (1985) reported very low levels of
hydrogenase activity for the Desulfovibrio vulgaris hydrogenase cloned into E.coli.
E.coli therefore may not be a suitable host for expressing hydrogenase activity
and perhaps lacks the necessary electron carriers required by the C.
acetobutylicum hydrogenase. The fact that E. coli [pMET15B2] was a class I isolate
may be related to the low levels of hydrogenase activity. Since only one of the 25
different recombinant plasmids encoded an enzyme that was likely to be
involved in metronidazole reduction suggests that either these enzyme activities
are unstable and difficult to assay in E.coli or there are some interesting genes
encoding proteins not before considered to be involved in metronidazole
reduction.
Since the insert DNA of plasmid pMET15B2 is completely contained in the insert
DNA of plasmids pMET13A and pMET030, it is surprising that hydrogenase
activity was not detected in cell free extracts prepared from E.coli SE53
transformed with these plasmids. It can be speculated that the hydA mutation in
E. coli SES3 can only be complemented by pMET15B2 because it lacks the
additional DNA found in pMET13A and pMET030. Another possibility is that
other coding regions contained on pMET13A and pMET030 interfere with the
hydrogenase assay.
DNA hybridization and restriction endonuclease mapping revealed that
pMET13A, pMET15B2, pMET030 and pMET190 were linked. The total length of
chromosomal DNA from C. acetobutylicum represented by pMET13A, pMET15B2,
pMET030 and pMET1_90 is approximately 11.1 kb. This 11.1 kb DNA fragment
from C. acetobutylicum contained at least two genes involved with electron
transfer systems capable of activating metronidazole. The insert DNA in
pMET190 and pMET13A are in opposite orientations with respect to the vector

Cloning of metronidazole activating genes 110
DNA indicating that in E.coli, the gene responsible for metronidazole activation
is most likely transcribed from a promoter present on the insert.
Restriction endonuclease deletion studies, and Southern blot analysis (Fig 5.4)
revealed that the region responsible for class V sensitivity to metronidazole on
clones pMET13A, pMET030 and pMET190 was contained on a 2 kb EcoRI-EcoRV
fragment (Fig. 5.3). Since difficulties were encountered in measuring C.
acetobutylicum electron transport enzymes in E.coli, and considering that this
class V active region was independently cloned three times, it was decided to
proceed with nucleotide sequence analysis in an effort to determine what gene
product or products are coded for by this 2 kb fragment. Nucleotide sequencing
and analysis of this region are the topics of the next chapter.

Chapter 6
Nucleotide sequencing and sequence analysis of selected
metronidazole sensitive clones
6.0 Summary . . . . . . . . . . . . . . . . . . . . . . . . . . . . . . . . . . . . . . . . . . 111
6.1 Introduction ........................................ 113
6.2 Materials and Methods ................................. 113 6.2.1 Chemicals . . . . . . . . . . . . . . . . . . . . . . . . . . . . . . . . . . . ... 113 6.2.2 Bacterial strains and plasmids ......................... 114 6.2.3 Media and buffers . . . . . . . . . . . . . . . . . . . . . . . . . . . . . . . . . 114 6.2.4 Preparation of DNA ............................... .114 6.2.5 Sequencing strategy ................................ 114 6.2.6 Exonuclease III shortening . . . . . . . . . . . . . . . . . . . . . . ..... 115 6.2.7 Nucleotide sequencing .............................. 115 6.2.8 Sequence analysis ................................. 116
6.3 Results ............................................ 116 6.3.1 Isolation of sequencing templates ....................... 116 6.3.2 DNA sequence data ................................ 117 6.3.3 Codon usage . . . . . . . . . . . . . . . . . . . . . . . . . . . . . . . . . . . . 119 6.3.4 G + C content .................................... 124 6.3.5 Putative RBS, promoter and termination sequences ........... 125 6.3.6 Amino acid similarity studies ......................... 129 6.3.7 pMETllB sequence ................................ 132
6.4 Discussion ......................................... .132

111
Chapter 6
Nucleotide sequencing and sequence analysis of selected
metronidazole sensitive clones
6.0 Summary
The 2 kb EcoRI-EcoRV from pMET13A was shown to be the region responsible
for class V sensitivity to metronidazole (Chapter 5). The nucleotide sequence of
this fragment was determined and found to be 1 902 bp in length. Analyses of
the sequence data revealed the presence of two truncated open reading frames
(ORF1 and ORF3) and one complete open reading frame (ORF2) which was
responsible for class V sensitivity of E.coli F19 [pMET13A]. The deduced amino
acid sequence (160 amino acids) of ORF2 showed good similarity with amino
acid sequences of flavodoxin proteins from many organisms. Based on
alignments to the amino acid sequences of these flavodoxins, as well as the fact
that Chen and Blanchard (1979) reported that reduced flavodoxin can transfer
electrons to metronidazole, the sequence corresponding to ORF2 was identified
as coding for a flavodoxin gene from C. acetobutylicum. Analyses of the deduced
amino acid sequences of ORF1 and ORF3 did not result in the identification of
these gene products.
Analysis of the nucleotide sequence of other cloned C. acetobutylicum genes
resulted in the compilation of a codon usage table. Comparison of these codon
usage statistics with the codon usage in the nucleotide sequence of the
EcoRI-EcoRV fragment of pMET13A revealed that ORF1, ORF2 and ORF3
contained relatively few rare C. acetobutylicum codons. The presence of putative
consensus promoter and termination sequences relating to these open reading
frames is discussed.
Partial nucleotide sequence data of the C. acetobutylicum insert DNA on plasmid
pMET11B is presented. E.coli F19 [pMET11B] also showed class V sensitivity
towards metronidazole. One large open reading frame was located in this

Nucleotide sequencing and analysis 112
sequence and the deduced amino acid sequence showed good similarity with
spoIID proteins from B. subtilis and B. amyloliquefaciens
The role of flavodoxin in C. acetobutylicum and other organisms is presented.
Possible relationships between the cloned C. acetobutylicum flavodoxin gene and
metronidazole sensitivity are discussed.

Nucleotide sequencing and analysis 113
6.1 Introduction
Chapter 5 described the isolation of 25 E.coli F19 clones which carried different
recombinant plasmids containing C. acetobutylicum DNA coding for genes
involved in the activation of metronidazole. These 25 clones were classified into
5 groups (I-V) based on their sensitivity towards metronidazole. The class V
group, which was most sensitive to metronidazole, consisted of 5 clones of which
3 (pMET13A, pMET030 and pMET190) contained overlapping insert DNA. All
three of these clones contained the 2 kb EcoRI-EcoRV fragment identified as being
responsible for the class V activity. Since no enzyme activity could be detected in
any of the class V isolates, and since the active EcoRI-EcoRV fragment was
isolated as 3 independent cloning events, obtaining the DNA sequence of this
region was deemed necessary for identification of the gene or genes responsible
for metronidazole activation.
This chapter describes the DNA sequencing, characterization and amino acid
homology of the 2 kb EcoRI-EcoRV fragment responsible for class V activity in
the above 3 clones. Preliminary sequence data and analysis of another class V
isolate (pMET11 B) is also presented.
6.2 Materials and Methods
Commonly used materials and techniques are presented in the Appendices. The
details provided below are included for completeness.
6.2.1 Chemicals
Restriction endonucleases were obtained from several sources and were used as
specified by the manufacturers. The enzymes exonuclease Ill, 51 nuclease and
DNA polymerase I Kienow fragment (PolIK) were obtained from Boehringer
Mannheim Biochemicals. [a-355] dATP was obtained from Amersham
International. All other chemicals were analytical grade and were purchased
from various local suppliers
Nucleotide sequencing and analysis 114
6.2.2 Bacterial strains and plasmids
The E.coli strains used throughout this study are described in Appendix C.
E.coli strain LK111 (Zabeau and Stanley, 1982) was used as the host for the
exonuclease III shortened templates, whereas E.coli F19 was used as the host for
the determination of MIC values. Plasmid pMET13A was used as the primary
source of DNA. The M13 derived "BlueScript" phasmid vector (Stratagene, San
Diego, CA) was used for the preparation of templates for DNA sequencing as
described below.
6.2.3 Media and buffers
All media and buffers not described in the text are presented in Appendix A.
The E. coli strains were grown as described in section 4.2.2.
6.2.4 Preparation of DNA
Plasmid DNA was prepared by the alkali-hydrolysis method of Ish-Horowicz
and Burke (1981). The small-scale (miniprep) and large-scale (maxiprep)
methods of plasmid isolation are described in Appendix B. To ensure high
quality preparations, plasmid DNA used for nucleotide sequencing was always
purified on a cesium chloride gradient (Appendix B).
6.2.5 Sequencing strategy
Restriction endonuclease mapping and deletion studies of plasmid pMET13A
(chapter 5), showed that the region responsible for class V sensitivity to
metronidazole was contained on a 2 kb EcoRI-EcoRV restriction fragment. This
EcoRI-EcoRV fragment was subcloned into the BlueScript vector (orientation KS)
which had been linearized with EcoRI and HinCII endonucleases, to yield
plasmid pSEQ13A (Fig. 6.1). The BlueScript vectors have a large multiple
cloning region which contains 26 unique restriction sites. This large multiple
cloning region made it possible to chose a unique restriction site for DNA
shortening, using the exonuclease III technique (Henikoff, 1984, 1987). Since the
active region of pMET13A had been subcloned into the middle of this large
multiple cloning region, pSEQ13A was suitable for the generation of shortened
fragments from both directions of the insert.

Nucleotide sequencing and analysis 115
6.2.6 Exonudease III shortening
Progressive deletions of plasmid pSEQ13A from both the 5' and 3' ends of the
insert were generated by unidirectionally digesting BstXI-BamHI and KpnI-ClaI
restriction endonuclease fragments with exonuclease III (Henikoff, 1984, 1987).
After digestion, the linearized plasmid (approximately 12 µg) was precipitated
with isopropanol, resuspended in 100 µl Exo-buffer, and equilibrated at 37°C for
5 min. Eleven microfuge tubes containing 25 µl of ice cold 51 nuclease mixture
were prepared just prior to initiation of the shortening reaction and were kept on
ice. A time zero sample (9 µ1) was removed to a tube containing 51 nuclease
mixture before exonuclease III addition. The shortening reaction was carried out
at 37°C and was initiated by the addition of 300 units of exonuclease III.
Samples (9 µ1) were removed at 20 second intervals and immediately added to
the 10 remaining microfuge tubes containing the 51 nuclease mixture. After the
last sample was taken, the microfuge tubes were incubated at room temperature
for 30 min for the 51 nuclease to digest single stranded DNA. The 51 nuclease
reaction was stopped by the addition of 3.4 µl (per tube) of 51 stop solution,
followed by incubation at 70°C for 10 min. The extent of shortening was checked
by electrophoresis of approximately 200 ng of DNA (7 µl) from every second
tube in 0.8% (w /v) agarose gels in Tris-acetate buffer. To facilitate the blunting
of the exonuclease III generated ends, 0.5 units of PolIK was added to each tube
followed by incubation for 5 min at room temperature. A further 5 min
incubation was carried out in the presence of a mixture of dNTP's (0.125 mM
each, A, C, G and T). The shortened DNA was recircularized by the addition of
120 µI of ligation mixture to each tube, and these tubes were incubated at 15 ·c for 4 h. Competent E. coli LKl 11 cells were transformed with the ligation
mixtures and transformants were selected on LB agar plates containing
ampicillin (100 µg ml-1).
6.2.7 Nucleotide sequencing
The nucleotide sequence of both strands of the pMET13A active region was
determined using overlapping DNA fragments generated by exonuclease III
digestion as described above. Small scale (miniprep) preparations of

Nucleotide sequencing and analysis 116
recombinant plasmids resulting from exonuclease III digestion of linearized
pSEQ13A DNA were analyzed by restriction endonuclease mapping before large
scale CsCl purified plasmid DNA was prepared for nucleotide sequencing.
DNA sequencing was carried out by the dideoxynucleotide triphosphate chain
termination method developed by Sanger et al. (1977), according to the protocol
of Tabor and Richardson (1987), using the Sequenase DNA sequencing kit (U.S.
Biochemical Corporation, Clevland, OH). The DNA chains were radiolabelled
with [a..35S)dA TP (1 200 Ci mmol-1). The complete sequencing protocol,
including preparation of template DNA, primer annealing, sequencing reactions,
gel electrophoresis and autoradiography, is described in Appendix B.
6.2.8 Sequence analysis
The nucleotide and deduced amino acid sequences were analyzed on a
VAX 6000-330 computer using the Genetics Computer Group Inc. suite of
sequence analysis programs (Devereux et al., 1984). The databases GenBank
(release 65.0, September 1990; Bilofsky et al., 1986), EMBL (release 24.0, August
1990; Hamm and Cameron, 1986), SWISS-Protein (release 15.0, August 1990;
Hamm and Cameron, 1986), NBRF-Nucleic (release 36.0, April 1990; George et
al., 1986) and NBRF-Protein (release 25.0, June 1990; George et al., 1986) were
searched for related nucleotide and amino acid sequences. Since the EMBL,
GenBank and Swiss-protein databases are updated daily, further homology
studies were later carried out via electronic mail to the GenBank file server
([email protected]) (Yudin, 1990) and the EMBL file server
([email protected]) (Stoehr and Omond, 1989).
6.3 Results
6.3.1 Isolation of sequencing templates
The exonuclease III shortening method was utilized to obtain overlapping
shortened fragments for the sequencing of pSEQ13A insert DNA in both
directions. It was necessary to subclone one small fragment (H2) to complete the
sequence. Eleven overlapping clones were required to complete the sequence of
the coding strand, and similarly, 11 clones were necessary to complete the

Nucleotide sequencing and analysis
0)
C
-- ..... ::r:_ =--x~- _o:::uo_ ~ u u_-c E 0E_ o cc>>CC ui 0.1:J c IIIU-,-
Q..(/) VlCD Z X CDVlC..W::I: ::I:Vl
LL~ _l ._l --d _l
0Rf'1 22222222222222222222
L13A R24
L4
~8 L22
U7
R21 -~R22
o_---== ::J
CC O CC~ C ·- - .c 0.0.>;;:: Q. :z:ux..c::.::c....c <
0-U1 0)
CDCD
~ > c..
- ::J CC E a. Xct
......................... 0Rf'2 0Rf'3 .. '. · · • •
222222222222222 222222222222222 ··1
L10 __,,..,...,,..._ L13
-112--- LU l21
H2 ---rr-200 bp R13A
R26 R4
R6 R15 R9
R13 2
t.lap position In pSE013A {kb)
117
Figure 6.1 Sequencing strategy for plasmid pSEQ13A containing insert DNA from C. acetobuty1icum P262. The insert DNA is indicated by the bold line and the thin line represents BlueScript KS vector DNA. The arrows indicate the extent of sequence obtained from each clone. Clone names are written below each arrow. Clone H2 was constructed from a HinFI-Xhol fragment of clone L21. This fragment was subcloned into BlueScript KS vector that had been restricted with EcoRV and Xhol. This subclone was necessary to complete the sequence of the coding strand. The three identified open readmg frames ORF1, ORF2 and ORF3 are indicated by the hatched regions. The clone L12 (indicated by a dashed line) was not necessary to complete the sequence of the coding strand, but was used to locate the region responsible for metronidazole activation.
sequence of the non-coding strand. The extent of the sequence obtained from
each clone is depicted in Fig. 6.1.
6.3.2 DNA sequence data
The nucleotide sequence of the EcoRI-EcoRV active region of pMET13A was
determined to be 1 902 bp in length, and is shown in Fig 6.2. The nucleotide
sequence of this fragment showed that two partial open reading frames (ORF1
and ORF3 in Figs. 6.1 and 6.2) and one complete open reading frame (ORF2 in
Figs. 6.1 and 6.2) were present. The first partial open reading frame (encoding
159 amino acids) was truncated by the EcoRI site, and similarly the second partial

Nucleotide sequencing and analysis 118
720 740 760 780 EcoRI I I I I I I I I
GA ATT CCT TTT A.TT ATT CCA GTC MT ACA GAG CCA GM ATA ATT AAA GCT CAA TTA GM MT GTA GAT GGA CTT ATT TTA TCA GGT GGT l P F I l P V N T E P E l K A Q L E N V D G L l L S G G
800 820 840 860 880 I I I I I I I I
CAT GAT GTT AAC CCA TTA TTA TTT AAT GM GM CCA CAT MG CTT TTG GGA AAT ACA ATG AAT GM AGA GAC ACA TTT GAT TCT ATG TTA H D V N P L L F N E E P H K L L G N T M N E R D T F D S M L
900 920 940 960 I I I I I I ! I I
ATA AAA TAT GCA TTT GM ATG GM MG CCT ATC TTA GGT ATT TGT AGG GGA TGC CAA ATT TTA AAT GTT GTA TGT GGT GGA ACA TTA TAT ! K Y A F E M E K P l L G l C R G C Q l L N V V C G G T L Y
980 1000 1020 1040 1060 I I I I I I I I I
CAA GAT TGT TCC TTG GCA AAG GAT TCG TAT ATA AAA CAT TGT CAA GGG CAT ACA CCA GCA CAA CCT TCT CAT ACG ATA CAG ATT GAA AAA Q D C S L A K D S Y I K H C Q G H T P A Q P S H T l Q I E K
1080 1100 1120 1140 I I I I I I I I I
AAT TCT GAA TTA TAT ACT ATT TTA GGA GAA AAA GCT CTT GCA AAT TCA TTT CAT CAT ATG TCT ATA AAA GAT GTT GCG GAT GGA TTT AAG N S E L Y T ! L G E K A L A N S F H H M S I K D V A D G F K
1160 1180 1200 1220 1240 I I I I I I I I I
GTA GTA GCT ATA GCT AAT GAT GAA ATT ATT GAA GCA ATA GAG AAG GTA GAT GGT TCT TTT GCA CTT GGA ACA CAA E K V D G S F A L G T Q
TGG CAT CCA GAA ATG W H P E M V V A l A N D E l l E A I
1260 1280 1300 1320 I I I I I I I I I
ATG GCA AGC AGT GAT GAA AAT ATG CTG AAA ATA TTT AAA TTA TTT ATA TCT AAA TGT AAG AAT AGT AGA TTA TAG AATGAGTAAAAATAAATTT M A S S D E N M L K l F K L F I S K C K N S R L
1340 1360 1380 1400 1420 1440 I I I I I I I I I I I I
GAATTTTAAATTATATAGTTACTGAGTATTAATATTCATGATAAAAAAAATGATAGCAAAAACTAAAATGTTACTATAAATTATTTTGGTATTAACAAAAGCATTGTGCATGATGTGGA
1460 1480 1500 1520 1540 1560 I I I I I I I I I I I
ATTATTAATTCCAAGATGATACAATAAGTCTAAAATATACAATTTAATTATTTTAAACAATATAGTTTTTAATTIQQtQQ•TTTTATCA ATG AAA ATA TCA ATA CTA TAC M K I S I L Y
1580 1600 1620 1640 I I I I I I I I I
AGT AGC AAG ACA GGA AAA ACC GAA AGA GTT GCC AAG TTA ATT GAA GAA GGT GTG AAG AGG TCT GGA AAT ATT GAA GTA AAA ACT ATG AAT S S K T G K T E R V A K L I E E G V K R S G N I E V K T M N
1660 1680 1700 1720 1740 I I I I I I I I I
TTA GAT GCA GTT GAT AAA AAG TTC TTA L D A V D K K F L
CAA GAA TCA GAA GGA ATT ATT TTT GGA ACA CCA ACT TAT TAT GCC AAC ATA TCA TGG GAA ATG Q E S E G I I F G T P T Y Y A N I S W E M
1760 1780 1800 1820 I I I I I I I I I
AAA AAA TGG ATA GAT GAA TCA TCA GAA TTT AAT TTA GAA GGA AAA CTT GGA GCA GCA TTT TCA ACA GCT AAC TCT ATT GCT GGT GGT TCA K K W I D E S S E F N L E G K L G A A F S T A N S I A G G S
1840 1860 1880 1900 1920 I I I I I I I I I
GAT ATA GCA TTA CTT ACA ATT TTA AAT CAT CTT ATG GTA AAA GGA ATG TTA GTA TAT TCA GGT GGA GTT GCT TTT GGA AAA CCA AAG ACT D I A L L T I L N H L M V K G M L V Y S G G V A F G K P K T
1940 I I I
CAT TTA GGA TAT GTG CAT ATA AAT GAA ATA H L G Y V H I N E I
1960 1980 2000 I I I I I I
CAA GAA AAT GAA GAT GAA AAT GCG AGA ATA TTT GGT GAA AGA ATT GCA AAC AAA GTC AAA Q E N E D E N A R I F G E R I A N K V K
2020 2040 2060 2080 2100 2120 I I I I I I I I I I I
CAA ATA TTT TAA TGTAAAAATGTATATATAAATTGATTAATAATTTAAAAATATACAATATTATAATATTGAGAGCGAAGTTTATAATATGTTATAAATTAATAAAAATAGATGG Q I F
2140 2160 I I I I
AiaGiiilATGTTATT ATG AAT GAA GTA TTA CAA M N E V L Q
2180 I I I
AAT ATT TTA ACA AGA AGA AGT GTA AGA AAA TTT AAA N I L T R R S V R K F K
2200 2220 I I I
CAA GAA CAA ATA AAA GAT GAG GAA Q E Q l K D E E
2240 2260 2210 2300 I I I I I I I I I
CTA GAT TTA ATA TTA AAA GCT GGA GTA TAT GCA CCA AGT GGT ATG AAC AAG CAA AGT TGG CAG TTT ACA GTT GTT CAA AAT AAA GAA AAA L D L I L K A G V Y A P S G M N K Q S W Q F T V V Q N K E K
2320 2340 2360 2380 2400 I I I I I I I I I
ATA GAA TCT CTT GCT AAA GTA GTC AGG GAA GCA TTA GGT AGA GAT GCA GGA TAT AAT TTT TAT GCA CCT CCT ACT TTA ATT ATG TTA TCT I E S L A K V V R E A L G R D A G Y N F Y A P P T L I M L 5
2420 2440 2460 2480 I I I I I I I I I
AAT GAC AAA GAA AAT ACT AAT GGA TTG GCA GAT TGT TCT TGT GCA TTA GAA AAT ATA TTC TTA ATG GCT AAT TCA TTG GGT ATA GGT TCA N D K E N T N G L A D C S C A L E N I F L M A N S L G I G S
2500 I
TGT TGG ATT AAT C W I N
2520 2540 2560 2580 I I I I I I I I
CAA TTG AAA ACT ATT TGT GAT GAA AAG GAA GTA AGA GAA TTA TTA ACA AGC TTT GGA ATA CCA GAA AAC CAT ATT GTA Q L K T I C D E K E V R E L L T S F G I P E N H I V
2600 I I EcoRV
TGG GGA ATG GCA TCG ATT GGA Tate W G M A S I G

Nucleotide sequencing and analysis 119
open reading frame (164 amino acids) was truncated by the EcoRV site. Further
nucleotide sequence is necessary to complete these open reading frames. The
complete open reading frame (160 amino acids) that lies between the two
truncated open reading frames, is preceded by a 230 nucleotide intergenic region
and followed by an 88 nucleotide intergenic region. This nucleotide sequence
has been assigned the GenBank DNA sequence database accession number
M36770.
To determine the minimum sequence required for the activation of
metronidazole, the plasmids resulting from exonuclease III shortening of
pSEQ13A were transformed into E.coli F19 and tested for their ability to activate
metronidazole. Loss of the ability to activate metronidazole was obtained with
upstream shortenings after position 1 497 (shortened clones L12 through LS),
which was 46 bp upstream from the ATG start codon for ORF2 (Figs. 6.1 and 6.2).
In the opposite direction, shortened clones R9 through R24 were unable to
activate metronidazole. Shortened clone R9 was missing DNA from position
2 012 and resulted in the deletion of the last 4 amino acids of the protein product
coded for by ORF2. This clearly indicated that ORF2 was responsible for the
activation of metronidazole.
6.3.3 Codon usage
The GenBank database (release 65) contains six nucleotide sequences from C.
acetobutylicum, and their locus names are as follows: CLOADH (Youngleson et
al., 1989b), CLOBHBD (Youngleson et al., 1989a), CLOCBA (Hancock et al., 1991),
CLOEGLA (.2appe et al., 1988), CLOGLNSA (Janssen et al., 1988) and CLOXYNB
(.2appe et al., 1990). Furthermore, Gerischer and Diirre (1990) have submitted
the nucleotide sequence for an acetoacetate decarboxylase (CLOADC) for
inclusion in release 66 of the GenBank database. From the seven nucleotide
sequences mentioned above, eight genes have been positively identified: an
alcohol dehydrogenase (CLOADH), a J3-hydroxybutyryl CoA dehydrogenase
(CLOBHBD), a P-galactosidase (CLOCBA), a J3-galactosidase regulatory protein
(CLOCBA), an endoglucanase (CLOEGLA), a glutamine synthetase

Nucleotide sequencing and analysis 120
(CLOCLNSA), a xylanase (CLOXYNB) and an acetoacetate decarboxylase
(CLOADC). Using the coding regions for these eight genes, a codon frequency
table was constructed (Table 6.1). The codon usage of these 8 genes reveals a
bias towards the use of codons in which A and U predominate. In these 8 genes,
11 codons(GCC,CGG,CGC,CUG,CUC,CCG,CCC,UCG,UCC,ACG,GUC)
were used less than 5% of the time as compared to synonymous codons coding
for the same amino acid. In the 3 identified open reading frames ORF1, ORF2
and ORF3, 46, 40 and 41 of the possible 61 codons were utilized respectively.
Furthermore, in all three of these open reading frames, only 35 codons were used
more than once, and 9 codons (CGC, CGA, CGU, CGC, GGC, CAC, CUC, CCG,
CCC) were not used at all. It is also interesting to note that in the 8 genes
contained in the GenBank database, as well as in the 3 identified open reading
frames from pSEQ13A, the stop codon UGA was never used to terminate the
reading frame.
Table 6.1 Codon usa9:e of 8 known C. acetobutylicum genes as compared to the 3 identified open rea ing frames of pSEQ13A.
Identified C. iuetobutyliCMm genes b Totals pSEQ13A ORFs
aa COD 11 A B C D E F G H Sum %' 1 2 3
Ala CCC 4 0 3 0 0 1 1 3 12 6.0 1 1 0 GCA 12 9 20 2 6 24 8 8 89 44.3 7 5 7 CCU 18 21 10 0 21 15 3 6 94 46.7 4 3 3 CCC 1 0 1 0 2 0 1 1 6 3.0 0 2 0
Arg AGG• 0 1 2 2 0 0 0 2 7 6.6 1 1 1 AGA• 9 9 27 1 3 19 4 4 76 71.0 2 3 5 CCC- 0 0 0 0 0 0 0 0 0 0.0 0 0 0 CGA• 0 0 4 2 0 0 2 1 9 8.4 0 0 0 CCU 0 0 5 0 2 0 1 3 11 10.3 0 0 0 CCC 0 0 1 1 0 0 1 1 4 3.7 0 0 0
Asn AA~ 13 4 46 4 27 29 13 8 144 80.9 11 7 10 AAC 1 4 8 3 4 6 7 1 34 19.1 1 3 2
Asp GAU 18 15 51 3 20 26 5 17 155 85.2 10 5 5 GAC 2 1 7 3 5 4 4 1 27 14.8 1 0 1
Cys UGU 4 2 4 1 2 5 2 3 23 65.7 5 0 4 UCC 1 1 3 3 2 1 1 0 12 34.3 1 0 0
Gln CAG 0 0 10 0 6 0 6 2 24 27.6 1 0 1 CAA 9 6 19 1 11 11 4 2 63 72.4 6 3 6
Qu GAG 2 0 15 0 2 3 2 6 30 14.6 2 0 1 CAA 30 22 63 3 11 31 7 8 175 85.4 14 15 12
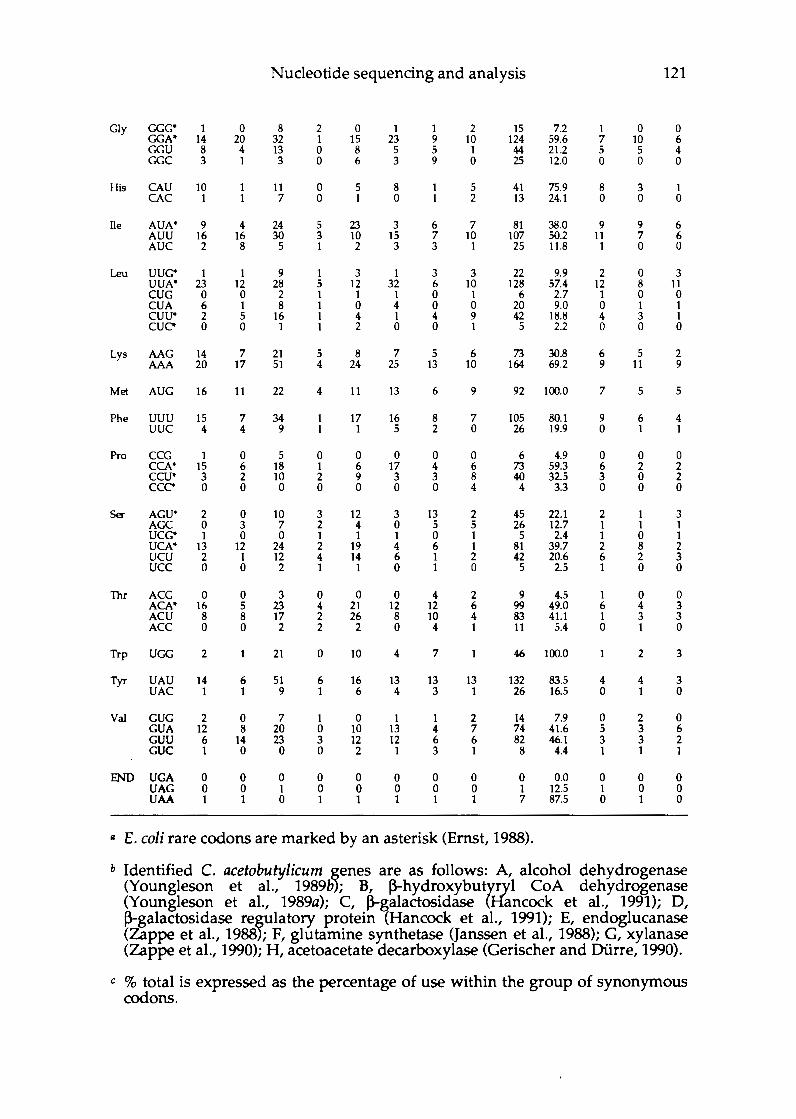
Nucleotide sequencing and analysis 121
Cly ccc• 1 0 8 2 0 1 1 2 15 7.2 1 0 0 GGA• 14 20 32 1 15 23 9 10 124 59.6 7 10 6 GGU 8 4 13 0 8 5 5 1 44 21.2 5 5 4 GGC 3 1 3 0 6 3 9 0 25 12.0 0 0 0
His CAU 10 1 11 0 5 8 5 41 75.9 8 3 1 CAC 1 1 7 0 1 0 2 13 24.1 0 0 0
lie AUN 9 4 24 5 23 3 6 7 81 38.0 9 9 6 AUU 16 16 30 3 10 15 7 10 107 50.2 11 7 6 AUC 2 8 5 1 2 3 3 1 25 11.8 1 0 0
Leu uuc• 1 1 9 1 3 1 3 3 22 9.9 2 0 3 UUA" 23 12 28 5 12 32 6 10 128 57.4 12 8 11 cue 0 0 2 1 1 1 0 1 6 2.7 1 0 0 CUA 6 1 8 1 0 4 0 0 20 9.0 0 1 1 cuu• 2 5 16 1 4 1 4 9 42 18.8 4 3 1 CUC" 0 0 1 1 2 0 0 1 5 2.2 0 0 0
Lys AAG 14 7 21 5 8 7 5 6 73 30.8 6 5 2 AAA 20 17 51 4 24 25 13 10 164 69.2 9 11 9
Met AUG 16 11 22 4 11 13 6 9 92 100.0 7 5 5
Phe uuu 15 7 34 1 17 16 8 7 105 80.1 9 6 4 uuc 4 4 9 1 1 5 2 0 26 19.9 0 1 1
Pro CCC 1 0 5 0 0 0 0 0 6 4.9 0 0 0 CCA• 15 6 18 1 6 17 4 6 73 59.3 6 2 2 ccu• 3 2 10 2 9 3 3 8 40 32.5 3 0 2 CCC" 0 0 0 0 0 0 0 4 4 3.3 0 0 0
Sa- AGU• 2 0 10 3 12 3 13 2 45 22.1 2 1 3 AGC 0 3 7 2 4 0 5 5 26 12.7 1 1 1 ucc• 1 0 0 1 1 1 0 1 5 2.4 1 0 1 UCA• 13 12 24 2 19 4 6 1 81 39.7 2 8 2 ucu 2 1 12 4 14 6 1 2 42 20.6 6 2 3 ucc 0 0 2 1 1 0 1 0 5 2.5 1 0 0
Tor ACG 0 0 3 0 0 0 4 2 9 4.5 1 0 0 ACA• 16 5 23 4 21 12 12 6 99 49.0 6 4 3 ACU 8 8 17 2 26 8 10 4 83 41.1 1 3 3 ACC 0 0 2 2 2 0 4 1 11 5.4 0 1 0
Trp UGG 2 1 21 0 10 4 7 1 46 100.0 1 2 3
Tyr UAU 14 6 51 6 16 13 13 13 132 83.5 4 4 3 UAC 1 1 9 1 6 4 3 1 26 16.5 0 1 0
Val GUG 2 0 7 1 0 1 1 2 14 7.9 0 2 0 CUA 12 8 20 0 10 13 4 7 74 41.6 5 3 6 GUU 6 14 23 3 12 12 6 6 82 46.1 3 3 2 GUC 1 0 0 0 2 1 3 1 8 4.4 1 1 1
END UGA 0 0 0 0 0 0 0 0 0 0.0 0 0 0 UAG 0 0 1 0 0 0 0 0 1 12.5 1 0 0 UAA 1 1 0 1 1 1 1 1 7 87.5 0 1 0
ii E.coli rare codons are marked by an asterisk (Ernst, 1988).
b Identified C. acetobutylicum ~enes are as follows: A, alcohol dehydrogenase (Youngleson et al., 1989b; B, (3-hydroxybut[iZl CoA dehydrogenase (Youngleson et al., 1989a); C, (3-galactosidase ancock et al., 1991); D, (3-galactosidase rerlatory protein {Hancock et al., 1991); E, endoglucanase (Zappe et al., 1988; F, glutamine synthetase (Janssen et al., 1988); G, xylanase (Zappe et al., 1990); H, acetoacetate decarboxylase (Gerischer and Durre, 1990).
c % total is expressed as the percentage of use within the group of synonymous codons.

Nucleotide sequencing and analysis 122
It has been suggested that codon preference represents a bias for abundant
tRNAs, thereby facilitating the biosynthesis of high levels of proteins utilizing
these codons (Bennetzen and Hall, 1982; Sharp et al., 1986; de Boer and Kastelein,
1986). In E.coli the following codons are regarded as minor codons and are
rarely utilized: GGA (Gly), UUA (Leu), AAU (Asn), CCA (Pro), AGA (Arg), UCA
(Ser) and ACA (Thr) (Konigsberg and Godson, 1983; Allf-Steinberger, 1984;
Ernst, 1988). In the 8 genes contained in the GenBank database, these codons
were used preferentially over all other synonymous codons coding for the same
amino acids. Despite the use of a high percentage of E.coli rare codons by these
cloned genes, enough protein was produced to allow for detection via enzyme
assays. Similarly ORF2 used a large percentage of E.coli rare codons, however
this did not effect the ability of the E.coli clones pMET13A, pMET030 and
pMET190, to produce enough protein product to allow for the metronidazole
sensitive phenotype.
Using the computer program CodonPreference (Devereux et al., 1984) in
conjunction with the constructed codon frequency table for C. acetobutylicum
(Table 6.1), the graphs and diagrams shown in Fig. 6.3 were assembled. Rare
codons were determined according to protocol described by Gribskov et al.
(1984) and the third position compositional bias was calculated as described by
Bibb et al. (1984). Fig. 6.3 shows that rare C. acetobutylicum codons are used less
frequently in the identified open reading frames ORFl, ORF2 and ORF3, than in
the intergenic regions. The compositional bias for each reading frame is the
fraction of the third position in each codon that is either A or T, using a sliding
window of 100 nucleotides. From these AT bias plots, it can be seen that the
three identified open reading frames ORFl, ORF2 and ORF3, all have above
average values for a bias towards codons that have an A or U in the third
position. The opposite is seen for the non-coding regions of this sequence.

Nucleotide sequencing and analysis 123
1,000 1,000 2.000 2.500
1.0
0.5
o.o I I I 11 Ill I II I 11
1.0 a, 0 iii ~ C
0.5 0 ~ ·en 0
Cl.. ,:, I...
o.o .c I-
I II I I I II IIIIHI I I I ,. II Ill I I I
1.0
0.5
o.o II 1111 II I I 1111
1,000 1,500 2.000 2.500
Figure 6.3 Third ~ition AT bias and open reading frame display for the three forward reading frames of pSEQ13A. The dashed horizontal line m each of the three plots represents the mean AT bias for this sequence. All possible open reading frames are shown as boxes beneath the plot for their respective reading frames. Start codons are shown as short lines that extend above the height of the box, and stop codons are marked by lines that extend below the bottom of the box. Only the start and stop codons at the beginning and end of an open reading frame are displayed. C. acetobutylicum rare codons in each reading frame are marked below the open reading frame display by short vertical lines. A rare codon threshold (p) of 0.10 was used for these plots [see Gribskov et al., (1984) for an explanation of the calculation of p]. The positions of the three open reading frames ORFl, ORF2 and ORF3 are marked as boxes below the X-axis.

Nucleotide sequencing and analysis 124
-40 315 30 26 20 16 10
1 000 1,600 2,000 i:::1 =======::ii 2.500
Figure 6.4 The percent G +Cina sliding window of 100 nucleotides over the length of the C. acetobutylicum insert DNA contained on plasmid pSEQ13A. The window was shifted along the sequence in 3 nucleotide stegs. The positions of the three identified open reading frames ORFl, ORF2 and RF3 are marked as boxes below the X-axis.
6.3.4 G + C content
The overall G + C content of the seven nucleotide sequences contained in the
GenBank database is 28.70 (CLOADH), 30.76 (CLOBHBD), 30.45 (CLOCBA),
30.33 (CLOEGLA), 30.31 (CLOGLNSA), 31.57 (CLOXYNB) and 33.84%
(CLOADC). These values are slightly higher than the overall G + C content for
C. acetobutylicum which is 28% (Cummins and Johnson, 1971). The overall G + C
content for the C. acetobutylicum insert DNA contained in plasmid pSEQ13A was
determined to be 28.07%. Calculating the percent G + C in a sliding window of
100 nucleotides, which is moved along the sequence in 3 nucleotide steps,
resulted in the plot shown in Fig. 6.4. The G + C content dropped dramatically in
the intergenic regions between the three identified open reading frames. The
G + C content of ORF1, ORF2 and ORF3 is 30.72, 30.43 and 30.06% respectively,
whereas the G + C content of the intergenic regions between these open reading
frames drops to 18.34 and 15.00% respectively. As mentioned in the previous
section, C. acetobutylicum preferred codons were biased towards an A or Tin the
third position (Fig. 6.3), which is contrary to the overall G + C content being
higher in the coding regions. The higher G + C content in the coding regions
must therefore reflect the necessity for G's and C's in the first two positions of the
codons in order to allow for translation to include all amino acids.
The coding regions of the seven sequences contained in the GenBank database
also have higher G + C values when compared to the overall values given above.
The G + C values for the coding regions of these seven sequences are as follows:

Nucleotide sequencing and analysis 125
32.56 (CLOADH), 33.92 (CLOBHBD), 32.70 (CLOCBA), 32.74 (CLOEGLA), 31.76
(CLOGLNSA), 37.53 (CLOXYNB) and 37.01 % (CLOADC). Since the C.
acetobutylicum nucleotide sequences contained in the GenBank database all
resulted from the isolation of known coding regions, they contain relatively
small amounts of non-coding sequence. This could account for the slightly
higher overall G + C values of these sequences as compared to the 28% reported
by Cummins and Johnson (1971).
6.3.5 Putative RBS, promoter and termination sequences
The process of translation, in which the mRNA nucleotide sequence is translated
into an amino sequence, is initiated by the interaction between the 165 ribosomal
RNA (rRNA) and a specific sequence on the mRNA know as the ribosome
binding site (RBS). In E.coli and B. subtilis, ribosome binding sites are generally
characterized by the start codon and a purine rich (SD) sequence 4 to 15
nucleotides upstream of the start codon (Shine and Dalgarno, 1974). The
consensus SD sequence 5'-AGGAGG-3' is complementary to the 3' end of 16S
rRNA (Gold et al., 1981, Gold, 1988). The start codon is usually AUG, but
prokaryotic ribosomes occasionally start at a GUG or UUG codon (Kozak, 1983).
It has been shown that B. subtilis and other Gram positive organisms have a
much higher frequency for non-AUG initiation codons than E.coli (Hager and
Rabinowitz, 1985).
The ribosome binding sites of both ORF2 and ORF3 were characterized by the
presence of a SD region and a AUG start codon. The AUG start codon of ORF2 is
located at position 1 543 and is preceded by a putative SD region (AGGAGG)
9 bp upstream of the AUG codon (Fig. 6.2). This putative SD site resembled that
reported for the S. aureus ~lactamase gene (Mclaughlan et al., 1981) and the C.
acetobutylicum endoglucanase gene (Zappe et al., 1988) (Fig. 6.5). The AUG start
codon of ORF3 is located at position 2144 and is preceded by a putative SD site
(AGGAAG) 8 bp upstream of the AUG codon (Fig. 6.2).
In Gram positive organisms such as B. subtilis, transcription of genes expressed
during growth are dependent on the CJ factor identified as cr43 (Graves and

Nucleotide sequencing and analysis 126
C. acetobutylicum ORF2
S. aureus bla
C. acetobutylicum eglA
5' A G G A G G A T T T T A T C A 3'
5' A G G A G G A G A T A A A A
5' A G G G G G T A T T A A C
3'
3'
Figure 6.5 Putative ribosome binding site of the pSEQ13A ORF2 as compared to the ribosome binding sites for the S. aureus ~-lactamase (bla) gene and the C. acetobutylicum endoglucanase (eglA) gene. The Shine-Dalgarno region is underlined. In all tnree cases, a start codon follows immediately after the last nucleotide shown.
Rabinowitz, 1986). Promoter regions for a43 dependent transcription show
structural similarities with the E. coli cr70 promoters (see Fig 6.6). It is apparent
that besides the traditional core regions of these Gram positive promoters,
upstream and downstream regions also display conserved sequences. It is these
upstream and downstream regions that have given rise to the term "extended
Gram positive promoters" (Graves and Rabinowitz, 1986). Conservation of
nucleotide sequences in the extended regions can compensate for a lack of
conservation in the core regions. For example, a TG pair starting 3 base pairs
upstream of the TATAAT Pribnow box has been shown to be sufficient to
compensate for the absence of a specific -35 region (Ponnambalam et al., 1986;
Keilty and Rosenberg, 1987).
As mentioned earlier (Chapter 5), the insert DNA in pMET190 and pMET13A
are in opposite orientations with respect to the vector DNA indicating that in
E.coli, the gene responsible for metronidazole activation (ORF2) is most likely
transcribed from a promoter present on the insert. The high A+ T content of the
intergenic regions between the three open reading frames on the pSEQ13A insert
DNA makes it very difficult to identify possible promoters from the sequence
data alone. Speculation leads to 10 possible promoters for the 5' upstream region
of ORF2 and 4 possible promoters for the 5' upstream region of ORF3 (Fig. 6.6).
The location of these promoters with respect to the ribosome binding site, as well
as the distance between the -10 and -35 regions, easily eliminates some of them as
candidates, however they are all included as a matter of completeness. Another

EC G+
Gene EGl EG2 GS1 GS2
Position 1485-1531 1457-1501 1450-1499 1446-1494 1438-1483 1414-1466 1414-1460 1390-1434 1372-1416 1351-1398
Position 2070-2116 2062-2106 2038-2085 2034-2082
Nucleotide sequencing and analysis 127
a t TTGACa t t t tg _TAtAA_! TA AAAAA TTGAcA a A a T TG TATAAT AAtAt -
-35 -10 TTTTATATATAT TTGTAT TAAATTA-------ACTTTAATGT TACAAT GTTCT AATAAAAAAAAA TTATTA ATGTAAA----AATATACTAAGTA TAGAAT AATAG TAAAAAAATCAC TTGATT TCTTAAA------AAAAAGGGAAG TATAAT TTAGT TGAGCAAAGGCG TCCGAT AGAAGTT-------TATACTTGTC TATTGT GCGCT
-35 ORF2 -10 AAAATATACAAT TTAATT ATTTTAA------ACAATATAGTT TTTAAT TAGGA ATTAATTCCAAG ATGATA CAATAAG--------TCTAAAATA TACAAT TTAAT TGGAATTATTAA TTCCAA GATGATA---CAATAAGTCTAAAA TATACA ATTTA GATGTGGAATTA TTAATT CCAAGAT----GATACAATAAGTC TAAAAT ATACA TTGTGCATGATG TGGAAT TATTAAT-------TCCAAGATGA TACAAT AAGTC ATTATTTTGGTA TTAACA AAAGCATTGTGCATGATGTGGAAT TATTAA TTCCA ATTATTTTGGTA TTAACA AAAGCAT------TGTGCATGATG TGGAAT TATTA GCAAAAACTAAA ATGTTA CTATAAA--------TTATTTTGG TATTAA CAAAA ATGATAAAAAAA ATGATA GCAAAAA--------CTAAAATGT TACTAT AAATT AGTTACTGAGTA TTAATA TTCATGA-----TAAAAAAAATGA TAGCAA AAACT
-35 ORF3 -10 AATATTATAATA TTGAGA GCGAAGT------TTATAATATGT TATAAA TTAAT AAATATACAATA TTATAA TATTGAG--------AGCGAAGTT TATAAT ATGTT TATATAAATTGA TTAATA ATTTAAA-----AATATACAATAT TATAAT ATTGA TGTATATATAAA TTGATT AATAATT----TAAAAATATACAA TATTAT AATAT
Figure 6.6 Possible Gram positive consensus promoter sequences for ORF2 and ORF3. The top panel snows two promoter consensus sequences: EC, the E.coli cr7o consensus sequence (McClure, 1985) and G+, the extended consensus sequence reported to be a feature of the cr43 RNA polymerase recognition site of B. subtilis and other Gram positive bacteria (Graves and Rabinowitz, 1986). In this panel, highly conservea bases (>70%) are indicated by underlined capital letters; >50% conservation are capital letters and >41 % conservation are lower case letters (after Graves and Rabinowitz, 1986). The second panel shows the sequence of four identified C. acetobutylicum promoters. The aboreviations are as follows: EGl and EG2 are two promoters identified for the endoglucanase gene (Zappe et al., 1988), and GS1 and GS2 are two promoters identified for the glutamine synthetase gene (Janssen et al., 1990). The third and fourth panels are the positions and sequences of possible cr43 typeJromoters for ORF2 and ORF3 respectively. The sequence positions correspon to Fig. 6.2. Nucleotides with identity to the consensus sequence are shown in bold typeface. All sequences are aligned by the -35 and Pribnow (-10) regions.
assumption in this analysis is that ORF2 and ORF3 have cr43 Gram positive
consensus type promoters. This assumption is based simply on the fact that the
5' upstream regions of these 2 open reading frames did not contain any promoter
consensus elements which have been reported as recognition sites for other
Gram positive holoenzymes such as cr37, cr32, cr29 or cr2s (Doi and Wang, 1986). For
comparison, previously identified promoters for two C. acetobutylicum genes are
included in Fig 6.6.

Nucleotide sequencing and analysis 128
Like initiation, the termination of transcription by RNA polymerase is a key
event in gene expression. Prokaryotic terminators, particularly those found in
E.coli, fall into 2 classes: factor dependent and factor independent terminators.
Factor dependent terminators require the presence of rho-protein (Roberts, 1969),
or of other factors (Kingston and Chamberlin, 1981) for termination to occur. The
nucleotide sequence of these factor dependent terminators show little similarity
amongst themselves, as well as with factor independent terminators (Holmes et
al., 1983). On the other hand, factor independent terminators have been shown
to be functionally active in in vitro assays in the absence of any protein factors
other than RNA polymerase (Brendel and Trifonov, 1984).
Factor independent terminators show a region of dyad symmetry downstream of
the 3' stop codon of an open reading frame. This dyad symmetry is typically rich
in GC base pairs and allows for the formation of a stable hairpin structure in the
RNA transcript. On average, the stem contains 77% GC base pairs and is stable
with a free energy of .1.G = -18.0 ± 7.3 kcal mol-t (Brendel and Trifonov, 1984). A
typical hairpin stem has a length of 8 ± 2 base pairs and a loop of 5 ± 1 base pairs.
Furthermore, just downstream of this region of dyad symmetry, there is a stretch
of consecutive thymine residues. Typically, this stretch is 10 base pairs long
containing at least 7 thymine residues. The region of dyad symmetry has been
implicated in slowing down the polymerase, whereas the thymine rich region
allows for the formation of a rU·dA hybrid that may facilitate release of the
transcript (Martin and Tinoco, 1980).
Using the above criteria, sequences that could resemble factor independent
terminators were searched for in the pSEQ13A insert DNA sequence
immediately downstream of both ORF1 and ORF2. No structures resembling
factor independent terminators were identified in these searches. As in any
living system, there are exceptions to the rules (for examples see Brendel and
Trifonov, 1984). Regardless of the biological implications of some of these
exceptions, it does not appear that a region of dyad symmetry and an adjacent
stretch of thymine residues unequivocally characterize the termination signal.
These features may be enough to provide the proper conditions necessary for

Nucleotide sequencing and analysis 129
termination, however they are apparently not required (Brendel and Trifonov,
1984).
The structures that characterize factor independent transcription terminators
have primarily been identified from studies of genes isolated from E.coli and
other enterobacteria (Brendel and Trifonov, 1984). With a few exceptions
(Mongkolsuk et al., 1985; Pulido and Jimenez, 1987), very little has been
documented about such structures in Gram positive organisms. Gram positive
organisms may therefore have alternative termination systems which may be
either dependent or independent of protein factors.
It would be necessary to isolate RNA from C. acetobutylicum in order to
determine what promoters and termination signals are functioning for these
open reading frames. Since the objectives of this study were to identify C.
acetobutylicum electron transport genes that are able to activate metronidazole,
such RNA studies were deemed to be beyond the scope of this project.
6.3.6 Amino acid similarity studies
The deduced amino acid sequences of the open reading frames ORFl, ORF2 and
ORF3 were used to search the GenBank, EMBL, SWISS-Protein, NBRF-Nucleic
and NBRF-Protein databases using the PASTA and TFASTA computer programs
described by Pearson and Lipman (1988).
The best similarity to the deduced amino acid sequence from the complete open
reading frame, ORF2, was obtained with the flavodoxin sequences from
Azotobacter vinelandii (Bennett et al., 1988), Clostridium MP (Tanaka et al., 1974),
Anabaena variabilis (Leonhardt and Straus, 1989) and Klebsiella pneumoniae
(Drummond, 1985). GAP (Devereux et al., 1984), the alignment program based
on the methods of Needleman and Wunsch (1970), was used to compare this
deduced amino acid sequence to the above flavodoxin sequences. The amino
acid sequence of the A. vinelandii flavodoxin had 29% identity and 55% similarity
to the deduced amino acid sequence of ORF2. Likewise, the amino acid
sequences of the Clostridium MP, Ana. variabilis and K. pneumoniae flavodoxins

Nucleotide sequencing and analysis 130
1 MAIIGILGTPYNTVERSPFWWNKVSYTRQSFIDVFQELGHTVIVLPVD-K 49 ••:::II:•
1 ----------------------------------------IPFIIPVNTE 10
50 TENIKNYLPLVDKIVLTGGVDVSPYLYGEEPHAQLGTTDPIRDRFELAAI 99 •I II• I• II ::1•11 ll•l•l:•1111 11•1 II I: I
11 PEIIKAQLENVDGLILSGGHDVNPLLFNEEPHKLLGNTMNERDTFDSMLI 60
100 KAALEANKPILGVCRGLQLLNVYFGGTLYQDLSLT-SSQIKHLQSPTPQE 148 I 1:1 :11111:111 1:111 1111111 II· •I Ill l:•11•:
61 KYAFEMEKPILGICRGCQILNVVCGGTLYQDCSLAKDSYIKHCQGHTPAQ 110
149 VPTHHISVEKEVL------------------------------------- 161 I • I I : I I :
111 -PSHTIQIEKNSELYTILGEKALANSFHHMSIKDVADGFKVVAIANDEII 159
Figure 6.7 Comparison of the amino acid sequence of the 3'-truncated open reading frame wnich is downstream of the L. lactis X-prolyl dipeptidyl aminopeptidase (pepXP) sene (Nardi et al., 1991) (top strand) with the pSEQ13A 5'-truncated open readmg frame (ORF1) (bottom strand). The symbol comparison table described by Gribskov and Burgess (1986) was used to calculate percentage similarity and percentage identity. The symbols between the sequences are as follows: I, represents identity;:, and • represent closer and further evolutionary distance between similar amino acids respectively.
had 29, 26 and 24% identity and 51, 55 and 56% similarity respectively. All
figures referring to percent identity and percent similarity reflect data obtained
from the entire length of the respective amino acid sequences. Based on the
alignments to these and other flavodoxins, the fact that ORF2 has been identified
as the gene responsible for class V sensitivity to metronidazole, as well as the
report by Chen and Blanchard (1979) that shows reduced flavodoxin can transfer
electrons to metronidazole, the sequence corresponding to ORF2 is identified as
coding for a flavodoxin from C. acetobutylicum P262 (Santangelo et al., 1991).
No conclusive information was obtained from database searches using the amino
acid sequence derived from 5'-truncated open reading frame, ORF1, as the query
sequence. However, this amino acid sequence can be easily aligned with an
unidentified open reading frame that is truncated at the 3' end (Fig. 6.7). This
3'-truncated unidentified open reading frame is downstream of the X-prolyl
dipeptidyl aminopeptidase gene from Lactococcus lactis NCD0763 (Nardi et al.,
1991). The alignment, which was generated using the GAP program described
above, shows a 64.5% similarity and a 51.2% identity between the two amino

Nucleotide sequencing and analysis 131
10 30 50 70 I I I I I I I
G GM ATA ATG AMATA GTT MT CGA ATT GGC MG MT ATG AGA TTA TTA ATA ATA ATG ACT TTA ATT ATT TTT GCT GTA CTA ATA ATT E I H K V N R I G K N H R L L I I H T L I I F A V L I I
90 110 130 150 l 70 I I I I I I I I I
TTA CCT CTA ATT ATT TTA AM GGT AGT GGA TTT AGT ATT AGC AM TTC MT TTA GAT MC AM MT TTA GTG 11M MT TCA CM ATA ACT L p L I I L K G s G F s I s K F N L D N K N L V K N s Q I T
190 210 230 250 I I I I I I
TTT CCG GTT MT GGT MG GTT AM TTA TAC CAT 11M MG GAT MC TCA GTT GM GAG TTA GAT TTG GM GAT TAT ATA ATG GGG GTT GTA F p V N G K V K L y H K K D N s V E E L D L E D y I H G V V
270 290 310 330 350 I I I I I I I I I
TCA AGT GM GTT CCA GCA MT TTT GAG GM GM GCT TTA MG GCT CM GCT GTA GCA GCT AGA ACA TTC TAT ATG MC MG AGA MT CM s s E V p A N F E E E A L K A Q A V A A R T F y H N K R N Q
370 390 410 430 I I I I I I I
CCT TGT MT TAT GCA AM GM AM GGT GCA GM ATT TGC GAT ACA ACT CAT TGT CM GTT TAT ATG AGT MG GM GM A.GA ATG AAA AGC p C N y A K E K G A E I C D T T H C Q V y H s K E E R M K s
450 470 490 510 530 I I I I I I
TGG AGC AGT AGT GM GCA AAA AGT GAT TGG GM AAA A.TT GAG AGG GCT GTT GM GM ACA AM GGA CM GTA TTA ACT TAT MT GGA CM w s s s E A K s D w E K I E R A V E E T K G Q V L T y N G Q
550 570 590 610 I I I I I I I I I
GTG CTC GM TAT CAG MT TTT TCG CTA TTA GTT CTG GM /\M ACA GAG GAT GCT MG GAC GTA TTT TCT GTT GAT GTA CCA TAT CTT /\M V L E y Q N F s L L V L E K T E D A K D V F s V D V p y L K
630 650 670 690 710 I I I I I I I I I
TCA GM GM AGT /\M GGT GM GAG ATA GCG CCT AM TAT AM ACA TCT GTA CAG ATT GCT ACA MT GAT TTT GTT MT AM ATT MT MC s E E s K G E E I A p K y K T s V Q I A T N D F V N K I N N
730 750 770 790 I I I I I I I I I
AM TAT TCA AM GCA MT ATA AGT AM AGT MT TTA GCG TCT TAT ATT AM ATA AM AGC TAT ACT GM GCT GGA AGT GTA AM GM ATT K y s K A N I s K s N L A s y I K I K s y T E A G s V K E I
810 830 850 870 890 I I I I I I I I I
CM ATA GGA MT GM GTT ATA MG GGA ACA GM TTT AGA GM TTA TTG GGA TTA MT TCA ACA MT TTC ACC TTG GAT TTT GGA ACC MT Q I G N E V I K G T E F R E L L G L N s T N F T L D F G T N
910 930 950 970 I I I I I I I I
GCA GTA ACT GTA MT TGT MG GGG TAT GGT CAT GAC GTA GGA ATG AGT CM TGG GGA GCT MT GTA ATG GCG /\M MT GGG GCT MG TAT A V T V N C K G y G H D V G H s Q w G A N V H A K N G A K y
990 1010 1030 1050 1070 I I I I I I I I I
AGT GM ATC CTA AM CAT TAT TAT GTT GGA GTT GM ATT ACT CM ATA AM TAT ATG CGT AM TTA TTT GM GTT TAT MT TAT GTG GCA s E I L K H y y V G V E I T Q I K y H R K L F E V y N y V A
1090 I I I
ATA ACG CTG MT AM TM ATATGGCTTTTTA I T L N K
FiSU!e 6.8 Nucleotide sequence of the 1109 base pair fraraent of C. acetobutylicum insert DNA of plasmid pMET11B. The deduce amino acid sequence is given in single letter code (see Appendix D).
acid sequences, with virtually no need to introduce gaps in either of the amino
acid sequences.
No conclusive information was obtained from database searches using the amino
acid sequence derived from 3'-truncated open reading frame, ORF3, as the query
sequence. The matches obtained from this database search were either over very
short lengths of the sequence, or it was necessary to introduce frequent and
lengthy gaps in order to obtain alignment.

Nucleotide sequencing and analysis 132
6.3.7 pMET11B sequence
The sequence of a 1 109 base pair fragment of the C. acetobutylicum insert DNA of
pMET11B was determined by a post-doctoral researcher in the Anaerobe Unit at
the University of Cape Town. Since pMET11B was isolated in this study, the
sequence of this fragment is reported here. A single open reading frame of 364
amino acids was coded for by 1 092 of the 1 109 base pairs, and was truncated at
the 5' end (Fig. 6.8).
Using the deduced acid sequence (Fig. 6.8) as a query sequence to carry out
database searches, it was determined that this open reading frame coded for a
spoIID gene from C. acetobutylicum. Alignment of this sequence with the B.
subtilis and B. amyloliquefaciens SpoIID protein sequences showed 55.8 and 52.5%
similarity and 36.5 and 34.0% identity respectively. It was however determined
that this 1 109 base pair fragment was not the region on pMET11B responsible for
class V sensitivity towards metronidazole.
6.4 Discussion
From the exonudease III shortened clones, it was determined that the complete
open reading frame, ORF2, was the gene responsible for class V sensitivity
toward metronidazole in clones pMET13A, pMET030 and pMET190. The
nucleotide sequence of ORF2 has the coding capacity for a 17 763 Mr protein.
Based on the deduced amino acid sequence of this open reading frame and the
ability of this gene product to activate metronidazole, it has been identified as a
C. acetobutylicum flavodoxin gene. The amino acid sequence of nine other
flavodoxins has been determined by direct amino acid sequencing, or deduced
from their nucleotide sequence. Wakabayashi et al. (1989) aligned seven of these
flavodoxin sequences, and this alignment was used as the basis for the
comparison shown in Fig. 6.9, which includes the C. acetobutylicum flavodoxin.
The C. acetobutylicum flavodoxin shows some degree of similarity to the other
flavodoxins. The invariant regions are located primarily at the FMN binding
domains (the redox-active prosthetic group), which are included in positions
11-23, 58-64 and 101-114 (Wakabayashi et al., 1989).

Clostrtdium acetobutyl.1cwn
Anabaena var.1ab1l1s
Chondrus crispus
Anacystis nidulans
Azotobdcter v1nelandii
Klebsiella pnewnoniae
Enterobacter agglomerans
Desulfov1br.10 vulqaris
Clostr1d1-u.m MP
l•teqasphera eldensi.i
60
IIFGTPTY
LIIGCPTW
Lt'LGAPTWNTG
IIGCPTW
70
Nucleotide sequencing and analysis 133
lO 20 30 40 50
M KISILYSSKTGKTERVAKLIEE GVK RSGNIEVKT MNLDAVDKKFLQESEG
M X K KI G~F Y c:TQ,T G K:T ES V A'E XI ROE F G NDVVTLHDVSQAEVTOLNDYQY
PIOVDDVTDPQALKDYDL IGKTLGAKADA KI c r FFST S'T c:NiT:TE:v A'D F
AK I GILlF Y GT QT G,V TIQ T ~A E S ~, I I -
AK I G~F~~G s!NiT c!K,T!R K'V AK s
IQQEFGGESIVDLNDIANADASDLNAYDYL
fKKRFDDET~SOALNVNRVSAEDFAQYQFL
M AN I GI F p·cTnlT G'K,T R KIA KM l HK Q LG EL AD A p V NIN RT TL DD FM.AYPV
M AT I G I F F GS DIT G O!T R KV AK L I HQ K L D G I AD A P L D V R RAT R E Q F LS Y p V L
M PKA1.1'V:YcSTTGNITEYTAETIARELA N A G Y E V D S R D A A S V E A G G L F' E G ~-
V YWS GT G N'T EK MAE LI AK G I I E S G K D V N T I N V S D V N l D E L I, N E D I
VE I VY W'S GT G NiT EA MAN E I EA AV K A AG ADV E S V R f E D TN VD D VASKDV
80 90 lOO 110 l20
YANISWEIMKK WIDESSEfNLEGKI,GAAfSTAN S I A G GSDI ALLT
N I G E'L Q S D WE G L Y S ELD DVD f NGK L VAY f GT GD Q I G y AON F Q DA I G I L
A D T E R ~ G T S W D E f L Y D K L P E V D M K D L. P V A I F G L G DAE G Y p D N F C o A I E E [ H o
NV G E·L Q s D w E GI y DD L D s V NF Q GK KV A y F GAG oQv G y s D NFQDAMG
G. 'f- P T L G E G E L P G L S S D C E N E S W E'
LLLGTPTLGDGQLPGLEAGCESESWS
EFL P K__!__E GLD F S GK TV ALF G LG D Q VG Y PEN Y L DAL GEL Y S
E:FISGLDDASLKGKTVALFGLGDQRGYPDNFVSGMRPLfD
LLGTPTL
VLLGCST
LILGCSA
ILLGCPAM
l30
ILNHLM
l40
G D G E L P G V E A G ~ Q Y D S W Q E F T N T L S E A D L T G K TV A L F G L G D Q L NY S K N f V S A.M R I L y D
W GD OS I E!L Q DD FI PL FD SLEET GA Q GRK VA CF G CG D
MGDEVLEESEF·E. PFIEEIST KISGKKVALF
GSE ELED5vvEPFFTD
150 l60 l 70 lBO
SSYEYFCGAVDAIEE
GSYGWGDGKWMR
LAPKLKGKKVGLFG
l90 200
VKGMLVYS G,GIV AFG KP KT H LG Y V H I N E IQ ENE DEN AR I F GER I AN~ VjK Q I F
EEK Is QR G GK TV G y w s T oiG,Y D F ND s KA LR NGK F VG LAL DE D N Q s D LT D~R~Ks w VA Q L JCS EFG L,.
C F A K Q GA KP v G F s NP o o Yo YEE s Ks v Ro GK FL G LPL o M v No QI PM EK R vEc w v e:~v vs E~G~
i I, EEK IS SL GS QT VG Y WP I E!GjY D F NE SK A V RN N Q F VG LA IDE D N Q PD LT K~R_!__K T WV SQ L KS EFG L
f' F K D R G A K I VG S W S T o!Gi Y E F E S S E A V V D G K F VG L A. L D L D N Q S G K T D E R VA A W L A Q I A p E F G L S L
AL SAR GA QM I G s·WP NEG YE FSA SSA LEG DR F VG L V L D Q D N Q FD QT EAR
LVIARGAC VVGNWPREGYKFSFSAALLENNEFVGLPLDQENQYDLT
D•G!D PR A ARDD IVG WAH DVRGAI
LASWLEEIKRTVL
E.ERIOSWLEKLKPAVL
KLKNLGAE IVQDGLR I
D F E E R • M NG Y:G]C V V V E T P • L IV Q NE PD EA E Q DC I E F G,K:K I AN I
s y G W·G, S G g W N DAW I Q R T K D T GA TV I G T A I V II I ll P O II A P I C K E L G1 B,A AIA K A
Figure 6.9 Comparison of the amino acid sequence of the C. acetobutylicum flavodoxin to nine other flavodoxin amino acid sequences. The flavodoxin sequences are from A. variabilis (Leonhardt and Straus, 1989), Chondrus crispus (Wakabayashi et al., 1989), Anacystis nidulans (Laudenbach et al., 1988), A. vinelandii (Bennett et al., 1988), K. pneumoniae (Drummond, 1985), Enterobacter agglomerans (W. Klingmiiller, personal communication), Desulfovibrio vulgaris (Dubourdieu and Fox, 1977; Krey et al., 1988), Clostridium MP (Tanaka et al., 1974) and Megasphera eldensii (Tanaka et al., 1973). The boxed regions indicate sequences with identical amino acid residues. Chemically related amino acids are not indicated.
While iron-containing ferredoxin is one of the most important components of
biological electron transport chains, it can be degraded as a source of iron under
iron limiting conditions (Schonheit et al., 1979; Ragsdale and Ljungdahl, 1984).
Certain organisms, such as members of the genus Clostridium, induce the
synthesis of the non-iron containing electron transfer protein flavodoxin under
conditions of iron stress (Pardo et al., 1990). Ragsdale and Ljungdahl (1984)
showed that when C. formicoaceticum was grown in a medium with a low iron
content, the concentration of flavodoxin reached at least 2% of the total soluble

Nucleotide sequencing and analysis 134
protein. Flavodoxins mediate electron transfer at a low redox potential between
prosthetic groups of microbial proteins in an analogous fashion to ferredoxin.
When the production of flavodoxin is induced (as in the clostridia) it generally
replaces ferredoxin in many oxidation reduction reactions, but at a slower rate
(Ragsdale and Ljungdahl, 1984). However, in other organisms such as A.
vinelandii, flavodoxin is constitutively produced and hence has a unique
biological function (Tollin and Edmondson, 1980).
In the clostridia and in other anaerobes, the principal role of flavodoxin is in the
phosphoroclastic breakdown of pyruvate to acetyl-CoA. In C. acetobutylicum
electrons derived from pyruvate reduce an iron-sulfur moiety in the enzyme
pyruvate ferredoxin oxidoreductase (Meinecke et al., 1989). Under iron limiting
conditions, these electrons are then used to reduce flavodoxin, which in turn is
reoxidized by hydrogenase with the accompanying formation of molecular
hydrogen via the actions of the hydrogenase enzyme. It has been shown that in
C. acidi-urici reduced electron carriers such as ferredoxin and flavodoxin, are also
used as the electron source in the uric acid fermentation (Valentine et al., 1962).
Flavodoxin can also be oxidized and reduced by the action of the clostridial
NADH- and NADPH-ferredoxin oxidoreductases (Ragsdale and Ljungdahl,
1984). In C. pasteurianum and C. kluyverii, where CO2 fixation (essentially the
reverse of pyruvate catabolism) is known to occur, reduction of ferredoxin and
flavodoxin occurs by reduced pyridine nucleotides via the action of these
enzymes (Jungerrnann et al., 1971a, 1971b; Thauer et al., 1971).
In obligate anaerobic nitrogen fixers, the endogenous donor of electrons to
nitrogenase is ferredoxin or flavodoxin (Mortenson, 1964; Benemann et al., 1969;
Yoch et al., 1969). A. vinelandii however, constitutively produces a flavodoxin to
serve this function (Scherings et al., 1977). Haaker and Veeger (1977) showed
that in A. vinelandii, reducing equivalents are produced at a site localized at the
cytoplasmic membrane which is specifically mediated by the action of a NADH
flavodoxin oxidoreductase. Hence, this oxidoreductase operates at a site of low
pH (ca. pH=S), where the semiquinone-hydroquinone potential is high enough
to allow NADH to function as a reductant. Membrane energization in turn
Nucleotide sequencing and analysis 135
brings the flavodoxin hydroquinone to a low enough potential such that it can
serve as the electron donor to the nitrogenase. Like A. vinelandii, K. pneumoniae
and E. aerogenes also have specific genes (nifF) for the production of a flavodoxin
which is used as the electron carrier for the nitrogenase component of nitrogen
fixation (Drummond, 1985; W. Klingmtiller personal communication).
Other known functions for flavodoxins include the mediation of electron transfer
between hydrogen and sulfite in D. vulgaris (Hatchikian et al., 1972). Flavodoxin
has also been shown to function in the light dependent reduction of NADP+ by
plant chloroplasts (Smillie, 1965).
All known flavodoxins have low molecular weights (14 500 to 23 000 g mol-t) and
are usually anionic (Tollin and Edmondson, 1980). In general, flavodoxins from
non-photosynthetic bacteria have a molecular weight of approximately 15 000
(short flavodoxins), while flavodoxins from cyanobacteria and algae have a
molecular weight of approximately 20 000 (long flavodoxins) (Wakabayashi et
al., 1989). A. vinelandii flavodoxin is an exception in that it is produced by a non
photosynthetic bacteria and falls into the class of long chain flavodoxins. This
flavodoxin is also unique in that it is the only flavodoxin known to contain a
phosphodiester linkage (Dreef-Tromp et al., 1989; Taylor et al., 1990).
Dubourdieu and Fox (1977) reported that amino acid similarity amongst the long
chain flavodoxins ranged from 36 to 39% whereas amino acid similarity amongst
the short chain flavodoxins ranged from 25 to 35%. The amino acid similarity of
the short chain C. acetobutylicum flavodoxin to other flavodoxins falls within the
latter range.
Flavodoxins consist of a single polypeptide chain lacking disulfide bonds
(cysteine content varies from 1 to 5 residues). Flavodoxins non-covalently bind
one mole of FMN, and binding studies indicate that all flavodoxins have
structurally analogous coenzyme binding sites (D'Anna and Tollin, 1972).
Amino acid alignments support this theory, as the ribityl phosphate binding
regions of different flavodoxins have a similar primary structure. With reference
to Fig 6.9, Ser-11, Thr-13 and Thr-16 hydrogen bond to the FMN phosphate,

Nucleotide sequencing and analysis 136
whereas Thr-64 and Asp-176 hydrogen bond to the 4'-hydroxy group of the
ribityl side chain (Wakabayashi et al., 1989).
E.coli is known to produce small amounts of ferredoxin and flavodoxin. While
the biological role of ferredoxin in E. coli has not been completely elucidated, the
role of flavodoxin has been established. Reduced flavodoxin has been show to
be involved in the conversion of pyruvate formate lyase from an inactive to an
active form (Knappe et al., 1974, 1984; Conradt et al., 1984). The mechanism of
the reduction of flavodoxin in E.coli was elucidated by Blaschkowski et al.
(1982), who showed that two enzymes exist capable of carrying out this
reduction. The first enzyme is the CoA acetylating pyruvate flavodoxin
oxidoreductase, which is analogous to the pyruvate ferredoxin oxidoreductase
more commonly associated with the phosphoroclastic breakdown of pyruvate in
anaerobes. The second enzyme is an NADPH dependent oxidoreductase which
these workers identified as the flavoprotein "component R" previously described
by Fujii and Huennekens (1974).
If the cloned C. acetobutylicum flavodoxin is responsible for activating
metronidazole in E.coli F19 [pMET13A] by direct electron transfer, reasonable
amounts of this flavodoxin must exist in a reduced form. The pyruvate
flavodoxin oxidoreductase and the NADPH dependent oxidoreductase are both
minor proteins in E.coli and hence may not be present in large enough amounts
to reduce significant quantities of the cloned flavodoxin. This suggests that
either the cloned flavodoxin is reduced by other mechanisms, or that it is not
entirely responsible for activating metronidazole. Since reduced flavodoxin is
capable of converting the pyruvate formate lyase to its active form, perhaps the
cloned flavodoxin merely enhances this effect. This could result in a higher
conversion rate of pyruvate to acetyl CoA and formate, which may in tum lead
to induction of the FDHH enzyme (see Chapter 4). This would reduce the overall
oxidation reduction potential of the cell which has been shown to cause an
increase in metronidazole sensitivity in E.coli (Onderdonk et al., 1979).

Nucleotide sequencing and analysis 137
It is interesting to note that the addition of extraneous formate (as sodium
formate) to culture medium increased the sensitivity of E.coli strains towards
metronidazole (data not shown). It was also observed that this effect was
reversed by increasing the nitrate concentration in the medium. Unfortunately,
these formate and nitrate experiments were carried out early on in this study in
an effort to determine the ideal medium for genebank screening, and hence
metronidazole sensitivity of E.coli F19 [pMET13A] was not tested with media
containing additional formate. However, in one experiment where a calculation
error resulted in a ten fold increase in the nitrate concentration of the growth
medium, no change in the MIC values for E.coli F19 [pMET13A] was observed.
This indicates that with this clone, there was essentially no formate effect to
overcome. Since one of the objectives of this study was to isolate electron
transport genes from C. acetobutylicum, the identification of this flavodoxin gene
fulfills this goal. However, not enough evidence was obtained to elucidate the
mechanisms involved in the activation of metronidazole.
While the structure-function relationships of ferredoxins have been studied
extensively, these studies are not as advanced for the flavodoxins. Flavodoxins
are among the smallest flavoproteins, and therefore represent the simplest
models for studying the chemistry and biochemistry of this group of proteins
(Mayhew and Ludwig, 1975). Since the production of flavodoxin in the clostridia
occurs under conditions of iron limitation, the cloned C. acetobutylicum
flavodoxin can provide a platform for studying the genetics of induction in this
industrially important microorganism. Furthermore, since iron limitation is a
form of stress, this is the first account of the cloning of this type of gene from C.
acetobutylicum. Since solvent toxicity also represents a form of stress to this
organism, it is exciting to note that the spoIID gene was isolated using the same
screening method. Sporulation is a response of this organism to solvent toxicity,
and although the spoIID gene was not directly involved in the activation of
metronidazole, it may be linked to other sporulation genes present on plasmid
pMET11B.

138
Chapter 7
General conclusions
The endospore forming Gram positive rod, C. acetobutylicum, has been used for
many years in the industrial fermentation of carbohydrates to produce the
neutral solvents acetone, butanol and ethanol. Economic pressures have placed
this fermentation into the history section of general microbiology textbooks,
perhaps only temporarily.
The aims of this thesis included studies on small phosphorylated molecules
involved in energy metabolism and cell differentiation. One of the main themes
in studies on C. acetobutylicum has been the regulation of cell differentiation,
particularly the switch from acidogenesis to solventogenesis and the induction of
sporulation. In B. subtilis, sporulation is induced when the concentration of GTP
reaches a critically low threshold level. A change in the level of GTP has also
been implicated in controlling cell differentiation of other organisms. It was
therefore desired to measure the nucleotide triphosphate levels in C.
acetobutylicum . in order to determine if GTP and perhaps other NTP's, play a
similar role in cell differentiation.
The separation of nucleoside triphosphates in cell extracts can be accomplished
using strong anion exchange HPLC. The lack of a readily available automatic
integration system for chromatographic data, along with the complexity of
chromatograms associated with the separation of nucleotides in biological
materials, led to the development of a manual computer-linked integration
system. This system was designed to be flexible so that it could be applied to
other analytical equipment that generates gaussian output curves. Advances in
microprocessor technology and diode-array spectrophotometric detectors has all
but made this system redundant, however it is still used for general
chromatographic work in our laboratory.

General conclusions 139
A comparison of nucleoside triphosphate profiles from batch fermentations of
the C. acetobutylicum P262 wild type, sporulation deficient (spo-1) and solvent
deficient (cls-1) strains was obtained. In the wild type strain and the spo-1
mutant, there was a sharp decrease in the nucleotide triphosphate levels just
prior to the pH breakpoint and the switch from acid production to solvent
production. After the switch to solvent production, the nucleotide triphosphate
levels rapidly increased to reach much higher levels than were seen during
acidogenesis. Exponential phase nucleotide levels in the cls-1 mutant were
comparable to those observed in the wild type and spo-1 mutant. Unlike the wild
type and spo-1 strains the cls-1 mutant, which does not switch to solventogenesis,
did not demonstrate an increase in nucleotide levels after the cessation of cell
division.
While the drop in nucleotide levels just prior to the pH break point in the two
differentiating C. acetobutylicum strains does not categorically demonstrate their
role in the switch to solventogenesis and hence the induction of sporulation, this
observation does coincide with previous results on cell differentiation in other
organisms. The effect of nucleotide synthesis inhibitors, which decrease
nucleotide triphosphate levels, add further support to the role of nucleotide
triphosphates (particularly GTP) in differentiation of C. acetobutylicum. It is
interesting to note that in the wild type strain, these nucleotide synthesis
inhibitors only increase the spore titre when they were added to the fermentation
medium prior to the switch to solventogenesis.
ATP is the primary currency by which a cell passes energy from one metabolic
operation to another. In the wild type and spo-1 mutant, ATP levels during
acidogenesis were much lower than during solventogenesis. These results are
somewhat surprising since the production of acids generates more ATP per mole
of glucose than does the production of solvents. These low acidogenic phase
ATP levels could perhaps be accounted for by considering that ATP must be
expended in order to maintain a constant pH gradient across the cell membrane.
Furthermore, the ATP calculations were based on cell number and the cessation
of rapid cell division could alter the perception of the total ATP levels.

General conclusions 140
In analyzing the results of the nucleotide profile studies, it must be kept in mind
that these levels represent a value for the "pool" quantity of these molecules. No
conclusions can therefore be drawn on the actual turnover rates of these
molecules. These difficult to interpret results merely indicate a general trend of
what may be happening to the levels of these phosphorylated molecules with
respect to the changing metabolism of C. acetobutylicum.
In addition to these nucleotide studies, an initial investigation into the genetics
and molecular biology of C. acetobutylicum electron transport genes was
performed. The antibacterial agent metronidazole played a pivotal role in the
development of a negative selection system for the isolation of these electron
transport genes. Metronidazole is a prod.rug that needs to be reductively
activated. The reduced intermediates of metronidazole cause DNA damage and
hence cell death. It has been shown that E.coli strains with lesions in their DNA
repair systems are more susceptible to metronidazole than their wild type
parents. However, if these DNA repair deficient strains also lacked the ability to
reduce chlorates and nitrates, they were no more susceptible to metronidazole
than the wild type strains. The lack of availability of nitrate and chlorate
reductase, DNA repair deficient mutants of E.coli led to the construction of
E.coli F19 via transposon mutagenesis with TnphoA. This strain has a
diminished ability to reduce p-nitrobenzoic acid, while retaining the recA
mutation of its parent strain CC118. These characteristics make E.coli F19 an
ideal candidate for the isolation of C. acetobutylicum electron transport genes able
to activate metronidazole. The recA mutation of F19 renders it highly susceptible
to the reduced toxic intermediates of metronidazole, while the nitroreductase
deficiency renders F19 more resistant to the prodrug. E.coli F19 forms the basis
of this negative selection system where C. acetobutylicum electron transport genes
were cloned on recombinant plasmids that are able to activate metronidazole
and overcome the nitroreductase deficiency of this strain.
Since E.coli F19 was developed to be used as a cloning host, and not for
physiological studies of the effects of metronidazole on E.coli, no efforts were
made to further characterize the mutation induced by TnphoA. However, it

General con cl us ions 141
would be interesting for future work to develop along these lines and hence to
determine the exact nature of this mutation which renders this E.coli strain less
susceptible to metronidazole.
Using E.coli F19 as a cloning host to screen a C. acetobutylicum gene library, 25
different C. acetobutylicum chromosomal DNA fragments on recombinant
plasmids which activated metronidazole were isolated. These clones were
classified into five groups (1-V) based on their sensitivity to metronidazole. With
respect to metronidazole susceptibility, class I isolates were the least sensitive
group, whereas class V isolates were the most sensitive group. After testing
these 25 clones for nitroreductase, hydrogenase and pyruvate-Fd-oxidoreductase
activities, it was determined that only one clone expressed weak hydrogenase
activity. No positive activity was found for either nitroreductase or pyruvate-Fd
oxidoreductase in any of the clones. The hydrogenase positive clone, pMET15B2,
was a class I isolate. Assuming that the metronidazole sensitive phenotype is
due to the hydrogenase activity demonstrated by this clone, the relatively low
levels of hydrogenase activity may account for the class I susceptibility grouping.
Although the hydrogenase enzyme plays a critical role in electron flow in C.
acetobutylicum, it was desired to further classify all 25 isolates and to determine
what C. acetobutylicum genes were responsible for class V susceptibility to
metronidazole. Therefore, no further effort was made to specifically characterize
the hydrogenase positive clone pMET15B2. Due to the possible extent of work
involved in the characterization of this clone, it was determined that this should
form the basis of a separate research project stemming from these initial studies.
Using DNA hybridization and restriction endonuclease mapping techniques, it
was revealed that four of the metronidazole activating C. acetobutylicum insert
DNA fragments on recombinant plasmids were linked in an 11.1 kb
chromosomal fragment. Three of these clones, pMET13A, pMET030 and
pMET190, were class V isolates, whereas the fourth clone was the hydrogenase
positive isolate pMET15B2. Therefore, the 11.1 kb chromosomal fragment
contained at least two regions responsible for activating metronidazole. The

General conclusions 142
region responsible for class V sensitivity to metronidazole was localized to a 2 kb
EcoRI-EcoRV fragment present in each of the clones pMET13A, pMET030 and
pMET190.
The nucleotide sequence of this 2 kb region was determined and a gene coding
for a flavodoxin-like protein was identified. Although direct electron transfer
from reduced electron carriers has been implicated in the activation of
metronidazole, recent evidence strongly suggests that metronidazole is reduced
via enzymatic routes. It would be interesting to identify how this C.
acetobutylicum flavodoxin protein is activating metronidazole in E.coli Fl 9. There
is a strong possibility that the overproduction of flavodoxin in E.coli alters the
anaerobic metabolic pathways such that the redox environment is lowered.
Hence the flavodoxin itself may not be responsible for reducing metronidazole,
but rather may be activating low redox potential enzymes in E.coli capable of
reducing metronidazole.
Much work can continue from this initial study, and indeed some research
projects are already underway in our laboratory. Apart from the
characterization of the hydrogenase positive clone pMET15B2, the two remaining
class V isolates, pMET11 B and pMET13C1, are being characterized using
molecular genetic techniques. PAGE studies of cell extracts of the 25 isolates
revealed that 3 clones, pME17 A, pME17C and pMET14B, had a visible extra
protein product. Furthermore, 2 of these clones, pME17C and pMET14B, cross
hybridized with clones pMET140 and pMET2D. Molecular genetic
characterization of all 5 of these clones is also underway.
It was never intended to study the mode of action of metronidazole, and
therefore this drug was primarily used as a tool for the isolation of C.
acetobutylicum electron transport genes. However, the medical importance of this
drug warrants further investigation into how these cloned C. acetobutylicum
genes may be involved in metronidazole activation. Another advantage of this
system is that it provides the capability to test novel analogs of metronidazole for
their mutagenic activity. A recA+ revertant of E.coli F19 has been isolated, and in

General conclusions 143
conjunction with the cloned metronidazole activating genes, we are able to easily
determine if an analog of metronidazole needs to be reductively activated and if
this active product causes DNA damage. Since the DNA is the site of action for
metronidazole, it is inherently mutagenic. Medically, it is desirable to obtain a
similar drug that needs to be reductively activated, yet has a different site of
activity. Indeed we have already used this system to test 5 novel compounds,
which are related to metronidazole, and initial evidence suggest that one of these
compounds may not act upon DNA.
Electron transport systems in C. acetobutylicum play a pivotal role in determining
the carbon flow during the fermentation of carbohydrates. Characterization of
these electron transport genes may eventually lead to knowledge that will allow
for enhancement of the productivity of the ABE fermentation. In view of recent
developments concerning the genetic manipulation of C. acetobutylicum, it is
likely that some electron transport genes will be specific targets for mutation
aimed at improving C. acetobutylicum strains.
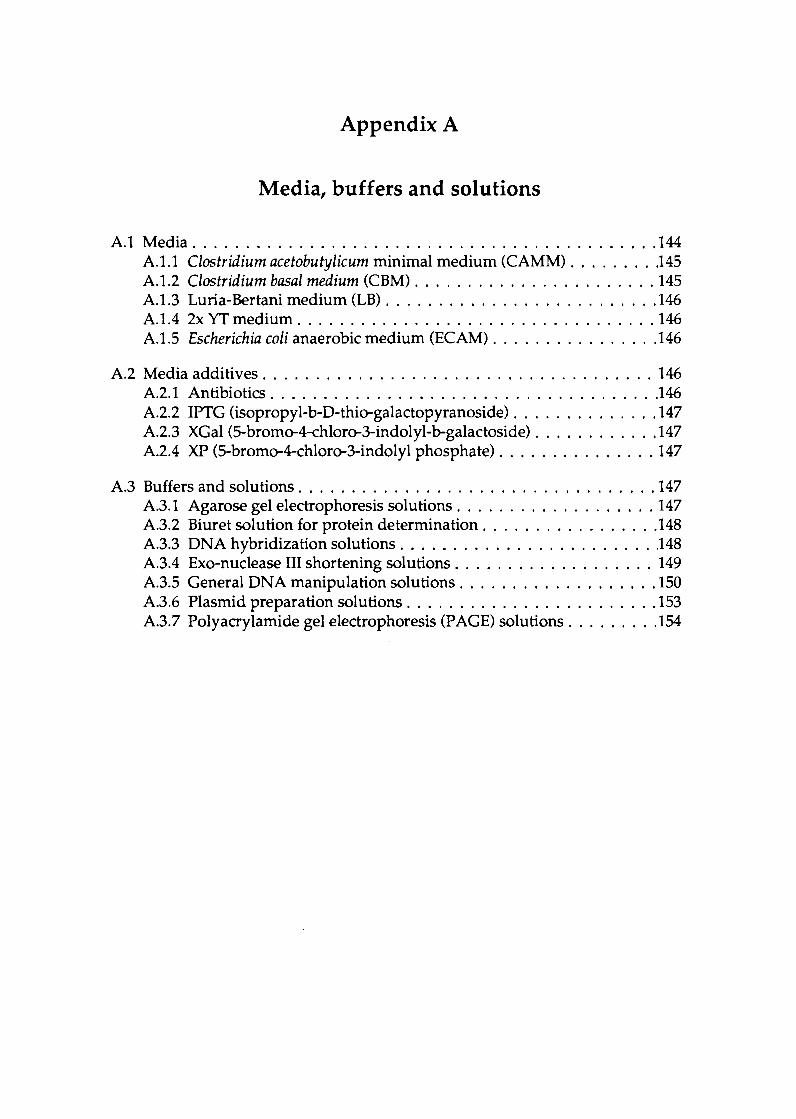
Appendix A
Media, buffers and solutions
A.1 Media ............................................ 144 A.1.1 Clostridium acetobutylicum minimal medium (CAMM) ........ .145 A.1.2 Clostridium basal medium (CBM) ....................... 145 A.1.3 Luria-Bertani medium (LB) .......................... 146 A.1.4 2x YT medium .................................. 146 A.1.5 Escherichia coli anaerobic medium (ECAM) ................ 146
A.2 Media additives ..................................... 146 A.2.1 Antibiotics .................................... .146 A.2.2 IPTG (isopropyl-b-D-thio-galactopyranoside) .............. 147 A.2.3 XGal (5-bromo-4-chloro-3-indolyl-b-galactoside) ............ 147 A.2.4 XP (5-bromo-4-chloro-3-indolyl phosphate) ............... 147
A.3 Buffers and solutions .................................. 147 A.3.1 Agarose gel electrophoresis solutions ................... 147 A.3.2 Biuret solution for protein determination ................. 148 A.3.3 DNA hybridization solutions ........................ .148 A.3.4 Exo-nuclease III shortening solutions ................... 149 A.3.5 General DNA manipulation solutions ................... 150 A.3.6 Plasmid preparation solutions ........................ 153 A.3.7 Polyacrylamide gel electrophoresis (PAGE) solutions ......... 154

144
Appendix A
Media, buffers and solutions
Media, buffers and solutions were sterilized by autoclaving at 121 ·c for 20 min
when required. Heat labile substances were sterilized by filtration through
0.22 µm membrane filters (Millipore).
A.1 Media
The methods of Moore (1966) and Hungate (1969) were used to prepare pre
reduced, oxygen-free media. Most of the oxygen was driven off by gentle boiling
of media for 15-20 min. Aliquots (10 ml) of the warm medium were dispensed
into Hungate tubes and perfused with H2 and CO2 prior to sterilization by
autoclaving. Large volume culture media were not perfused with H2 and CO2,
but rather autoclaved and transferred to an anaerobic atmosphere in the
anaerobic glove box at least 15 h prior to inoculation. Media containing agar was
autoclaved, poured into petri dishes and stored in anaerobic jars (flushed with
H2 and CO2 for 20 min), with silica gel in muslin bags. Cysteine hydrochloride
was added to most anaerobic media to scavenge any residual oxygen.

Media, buffers and solutions 145
A.1.1 Clostridium acetobutylicum minimal medium (CAMM) (Long et al., 1983)
Ingredient
Glucose Ammonium nitrate Calcium carbonate Salts stock solution11
MgS04•7H20 (20% w/v) MnS04•4H20 (1% w/v) FeS04•7H20 (1 % w /v) ZnS04•7H20 (5% w /v) NaMo04•2H20 (1% w/v) p-Aminobenzoic acid (0.1 % w /v) Thiamine HCl (0.1% w/v) Biotin (0.02% w /v) Cysteine HCl
Arnount/1
50.0 g 7.2 g
20.0 g 40.0 ml
1.0 ml 1.0 ml 1.0 ml 1.0 ml 1.0 ml 1.0ml 1.0 ml
250.0 µl 0.5 g
Sterile potassium phosphate buffer (1.0 M), pH 7.0, was added to the autoclaved broth at a final concentration of 0.05 M.
11 Salts stock solution contained/1:
0.2 g 0.2 g 1.0 g 1.0 g
10.0 g 2.0 g
A.1.2 Clostridium basal medium (CBM) (O'Brien and Morris, 1971)
Ingredient
Glucose Casein hydrolysate Yeast extract MgS04•7H20 (20% w /v) MnS04•4H20 (1% w/v) FeS04•7H20 (1 % w /v) p-Aminobenzoic acid (0.1% w/v) Thiamine HCl (0.1% w/v) Biotin (0.0002% w /v) NaHC03 Cysteine HCl Resazurin stock solution (0.02% w /v)
Amount/1
10.0 g 4.0 g 4.0 g 1.0 ml 1.0 ml 1.0ml 1.0ml 1.0ml
250.0 µl 1.0 g 0.5 g
10.0 ml
The required percentage agar (1.5% w /v) was added to CBM medium made as above. Cysteine HCL (10.0 ml) and NaHC03 (20 ml) were added as sterile stock solutions after the medium had been autoclaved and prior to pouring. The solid medium did not contain the anaerobic indicator, resazurin.

Media, buffers and solutions
A.1.3 Luria-Bertani medium (LB)
Ingredient
Tryptone Yeast extract NaCl Agar (solid medium only)
A.1.4 2x Yf medium
Ingredient
Tryptone Yeast extract NaCl Agar (solid medium only)
A.1.5 Escherichia coli anaerobic medium (ECAM)
Ingredient
Glucose Tryptone Yeast extract NaCl NaHC03 Tris-base Agar (solid medium only)
Amount/I
10.0g 5.0 g 5.0 g
15.0 g
Amount/I
16.0 g 10.0 g 5.0 g
15.0 g
Amount/I
10.0 g 10.0 g
1.0 g 5.0 g
840.0 mg 12.1 g 15.0 g
The pH of this media was adjusted to 8.0 with HCl prior to autoclaving.
A.2 Media additives
146
Media were cooled to 50°C before addition of antibiotics, XGal, XP or IPTG.
Plates containing these additives were stored for no longer than one week at 4 ·c.
A.2.1 Antibiotics
Antibiotic stock solutions were as follows: Ampicillin Chloramphenicol Kanamycin Tetracycline
100 mg/ml water 20 mg/ml ethanol (96%)
62.5 mg/ml water 12.5 mg/ml ethanol (50%)
All antibiotics were filter sterilized and stored at -20°C, except for tetracycline which was always made fresh
Media, buffers and solutions
A.2.2 IPTG (isopropyl-b-D-thio-galactopyranoside)
IPTG (100 mM) Distilled water
This solution was stored in aliquots at-70°C.
A.2.3 XGal (5-bromo-4-chloro-3-indolyl-b-galactoside)
XGal (2% w/v) Dime thy lformamide
This solution was stored at -70°C.
A.2.4 XP (5-bromo-4-chloro-3-indolyl phosphate)
XP Dime thy lsulfoxide
This solution was stored at-70°C.
A.3 Buffers and solutions
A.3.1 Agarose gel electrophoresis solutions
A.3.1.1 DNA loading solution (6x)
Bromophenol blue Sucrose Distilled water
This solution was stored at 4 ·c.
A.3.1.2 Tris acetate buffer (S0x)
Tris-base Acetic acid EDT A (0.5 M, pH 8.0) Distilled water
A.3.1.3 Tris borate buffer (Sx)
Tris-base Boric acid EDT A (0.5 M, pH 8.0) Distilled water
23.4 mg 1.0 mf
0.2 g 10.0 ml
80.0 mg 1.0 mf
250.0 mg 40.0g
to 100.0 ml
242.0 g 57.1 ml
100.0 ml to 1000.0 ml
54.0g 27.5 g 20.0 ml
to 1000.0 ml
147

Media, buffers and solutions
A.3.2 Biuret solution for protein determination
CuS04°5H20 NaKC48'06°4H20 (NaK-tartrate) Distilled water
1.5 g 6.0 g
to 500.0 ml
148
With constant stirrins, add 300 ml of 10% (w/v) NaOH. Make up to 1 liter with H20. Solution is an mtense blue color and must be stored in a cfark glass bottle to protect from light.
A.3.3 DNA hybridization solutions
A.3.3.1 Alkali fixation solution
NaOH (0.4 M) Distilled water
A.3.3.2 Denaturing solution
NaCl (1.5 M) NaOH (0.5 M) Distilled water
A.3.3.3 Denhardt's solution (SOx)
Bovine serum albumin (1 % w /v) Ficoll (1 % w /v) Polyvinylpyrrolidone-40 (1 % w /v) Distilled water
This solution was stored in aliquots (10 ml each) at-20°C.
A.3.3.4 Hydrolysing solution
HCl, concentrated (0.25 M) Distilled water
A.3.3.5 Neutralizing solution
EDT A (1.0 mM) NaCl (1.5 M) Tris-base (0.5 M) Distilled water
This solution was adjusted to pH 7.2 with HCL
16.0 g to 1000.0 ml
87.6g 20.0 g
to 1000.0 ml
1.0 g 1.0 g 1.0 g
to 100.0 ml
26.0 ml to 1000.0 ml
372.0 mg 87.6g 60.5 g
to 1000.0 ml
Media, buffers and solutions 149
A.3.3.6 Salmon sperm DNA
A 10 mg/ml solution was made in TE buffer. The DNA solution was sonicated at full power (20 microns) for 10 min in a MSE Soniprep sonicator. The solution was afiquoted and stored at -20°C. Immediately before use the DNA was denatured by boiling for 10 min followed by cooling on ice.
A.3.3.7 SSC (20x)
NaCl (3.0 M) Sodium citrate (0.3 M) Distilled water
175.3 g 88.2g
to 1000.0 ml
This solution was adjusted to pH 7.0 with NaOH and autoclaved.
A.3.4 Exo-nuclease III shortening solutions
A.3.4.1 Exo buffer
Tris-HCl buffer (1 M, pH 8.0) MgC12 (0.1 M solution) Distilled water
A.3.4.2 Klenow mixture
Tris-HCl buffer (1 M, pH 8.0) MgC12 (1 M solution) Distilled water
One µl of klenow was added per µg of DNA just prior to use.
A.3.4.3 Ligase mixture
Ligation buff er (1 Ox) T 4 ligase (1 U / µl) Distilled water (sterile)
A.3.4.4 St buffer (10x)
KOAc (3 M, pH 4.6 solution) NaCl (5 M solution) Glycerol ZnS0430.0 mg
A.3.4.5 s1 mixture
S1 buffer (1 Ox) S1 nuclease (40 U/µl) Distilled water (sterile)
660.0 µI 66.4 µl 9.3ml
3.0 µI 6.0 µl
20.0 µl
144.0 µI 24.0 µl
1282.0 µI
1.1 ml 5.0ml 5.0ml
41.0 µl 1.5 µI
259.0 µI

A.3.4.6 S1 stop
EDT A (0.05 M) Tris-base (0.3 M) Distilled water (sterile)
Media, buffers and solutions
372.2 mg 726.6 mg 20.0 mf
150
The pH of this solution was not adjusted as alkaline conditions are required to inactivate the S1 nuclease.
A.3.5 General DNA manipulation solutions
A.3.5.1 ATP (10x)
Adenosine S'-triphosphate Distilled water (sterife)
30.0 mg 5.0m[
This solution was adjusted pH to 7.0, and stored in 100 µl aliquots at -70°C.
A.3.5.2 DIT (1M)
Di thiothrei tol Sodium acetate (10 mM, pH 5.2 solution)
This solution was filtered and stored in aliquots at -20°C
A.3.5.3 EDT A (0.SM, pH 8.0)
EDTA Distilled water
3.1 g 20.0 ml
168.1 g to 1000.0 ml
The EDTA did not dissolve until the pH was raised to 8.0 with approximately 20 g of solid NaOH. This was autoclaved and stored at room temperature.
A.3.5.4 Ethidium bromide solution
(2,7-diamino-10-ethyl-9-phenyl-phenanthridinium bromide). A solution of 10 mg/ml was made in distilled water and stored in a dark bottle.
A.3.5.5 Isopropanol (salt saturated)
Isopropanol was saturated with aqueous 5 M NaCl, 10 mM Tris-HCl and 1 mM EDT A (pH 8.0).
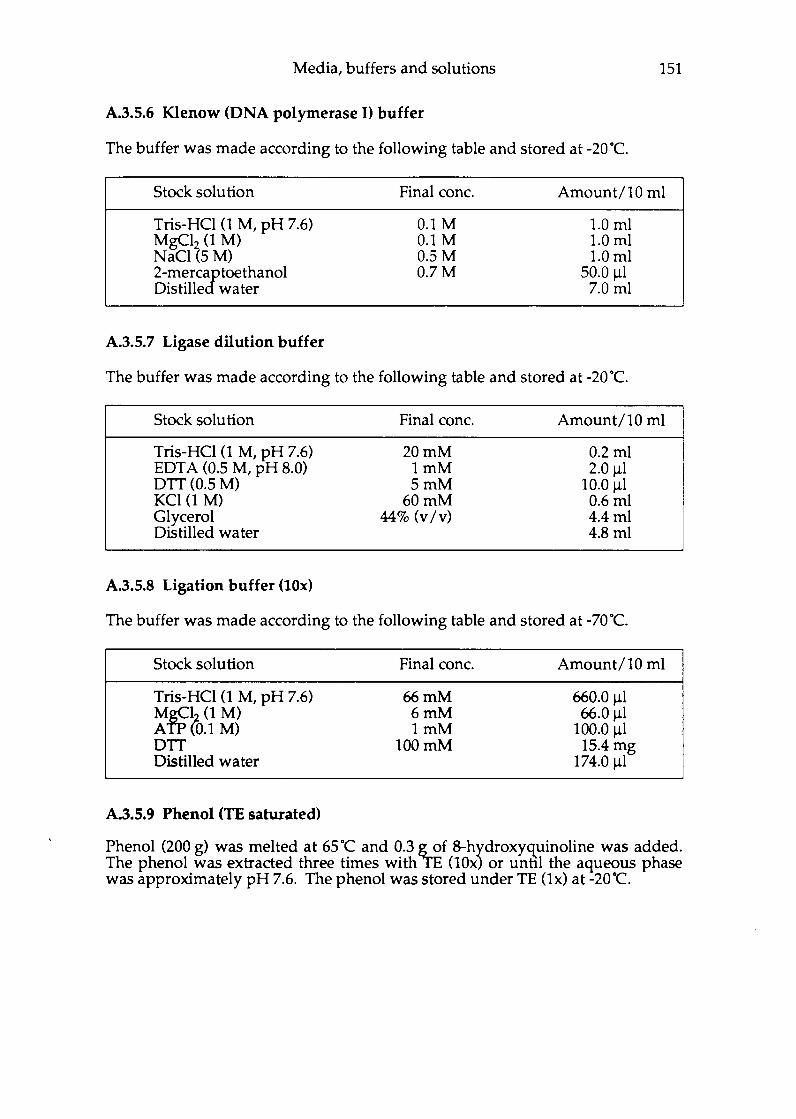
Media, buffers and solutions 151
A.3.5.6 Klenow (DNA polymerase I) buffer
The buffer was made according to the following table and stored at -20°C.
Stock solution
Tris-HCl (1 M, pH 7.6) MgC12 (1 M) NaCl (5 M) 2-mercaptoethanol Distilled water
A.3.5.7 Ligase dilution buffer
Final cone.
0.1 M 0.1 M O.SM 0.7M
Amount/10 ml
1.0 ml 1.0 ml 1.0 ml
50.0 µl 7.0 ml
The buffer was made according to the following table and stored at -20°C.
Stock solution
Tris-HCl (1 M, pH 7.6) EDT A (0.5 M, pH 8.0) DTT (0.5 M) KCl (1 M) Glycerol Distilled water
A.3.5.8 Ligation buffer (10x)
Final cone.
20mM lmM 5mM
60mM 44% (v/v)
Amount/10 ml
0.2ml 2.0 µl
10.0 µl 0.6ml 4.4 ml 4.8ml
The buffer was made according to the following table and stored at-70°C.
Stock solution
Tris-HCl (1 M, pH 7.6) MgC~ (1 M) ATPW.1 M) DTT Distilled water
A.3.5.9 Phenol (TE saturated)
Final cone.
66mM 6mM lmM
100mM
Amount/10 ml
660.0 µl 66.0 µl
100.0 µl 15.4 mg
174.0 µl
Phenol (200 g) was melted at 65 ·c and 0.3 g of 8-hydroxyquinoline was added. The phenol was extracted three times with TI (10x) or until the aqueous phase was approximately pH 7.6. The phenol was stored under TE (lx) at -20°C.

Media, buffers and solutions
A.3.5.10 Restriction enzyme buffers
Stock solution Tris-HCl buffer (1 M, pH 7.9) MgC12 (1 M) DIT (0.5 M) BSA (10 mg/ml) Glycerol NaCl (5 M)
Final cone. 0.1 M 0.1 M
10.0mM 1 mg/ml
44% (v/v) 0, 50, 100 or 150 mM
152
These restriction enzyme buffers were made according to the following table and stored at -20°C.
Salt concentration (mM) Stock solution 0 50 100 150
Tris-HCl (1 M, pH 7.9) 1 ml 1 ml 1 ml 1 ml M~l2 (1 M) 1 ml 1 ml 1 ml 1 ml D (0.5 M) 0.2 ml 0.2ml 0.2 ml 0.2ml BSA (10 mg/ml) 1 ml 1 ml 1 ml 1 ml Glycerol 4.4ml 4.4ml 4.4ml 4.4ml NaCl (5 M) 1 ml 2ml 87.7mff Distilled water 2.4ml 1.4 ml 0.4 ml 2.4m
A.3.5.11 Restriction enzyme dilution buffer
This buffer was made according to the following table and stored at -20°C.
Stock solution Final cone. Amount/10 ml
Tris-HCl (1 M, pH 7.5) 10 mM 0.1 ml KCl (1 M) 50 mM 0.1 ml Distilled water 5.3 ml Filter sterilize this solution and then add the following constituents: 2-mercaptoethanol 10 mM 7.0 µl Gelatin (10 mg/ml) 100 µg/ml 0.1 ml Glycerol 44% (v /v) 4.4 ml
A.3.5.12 Smal restriction endonuclease buffer
This buffer was made according to the following table and stored at-20°C.
Stock solution
Tris-HCl (1 M, pH 8.0) KCl (1 M) MgC12 (1 M) DTI (0.5 M) Glycerol Distilled water
Final cone.
0.1 M 0.2M 0.1 M
10mM 44% (v /v)
Amount/10 ml
1.0 ml 2.0ml 1.0 ml 0.2 ml 4.4ml 1.4 ml

Media, buffers and solutions
A.3.5.13 Tris-EDT A (TE) buffer (100x)
Component
Tris-base EDTA (0.5 M, pH 8.0 solution) Distilled water
Amount
121.1 g 200.0 ml
to 1000.0 ml
153
Adjust to desired pH (eg. 7.5, 7.6 or 8.0) with HCl and autoclave. Dilute with sterile water before use.
A.3.6 Plasmid preparation solutions
A.3.6.1 Solution I (10x)
Component
Glucose (anhydrous) Tris-base EDTA (disodium salt) Distilled water
Final cone.
SOOmM 250mM 100mM
Amount
9.01 g 3.03 g 3.72g
to 100.00 ml
Adjust to pH 8.0 with HCl and autoclave. Dilute with sterile water before use.
A.3.6.2 Solution II
This solution was prepared fresh on a weekly basis according to the following table:
Component
NaOH (10 N solution) SDS (10% w/v solution) Distilled water
A.3.6.3 Solution III
Component
K-acetate Acetic acid (glacial) Distilled water
Final cone.
0.2N 1.0 %
Amount
0.5 ml 2.5 ml
22.0 ml
Amount
147.0 g pH to4.8
to 500.0 ml
The potassium acetate was dissolved in as little water as possible, and the pH was adjusted to between 4.8 and 5.0 with acetic acid before bringing the volume up to 500 ml.

Media, buffers and solutions
A.3.7 Polyacrylamide gel electrophoresis (PAGE) solutions
A.3.7.1 Acrylamide solution
Acrylamide Bis-acrylamide Distilled water
29.2g 0.8 g
to 100.0 ml
154
This solution was filtered through Whatman's No.1 paper and stored in a dark bottle at 4 ·c.
A.3.7.2 Ammonium persulphate solution
A 10% (w/v) ammonium persulphate solution was freshly prepared as needed.
A.3.7.3 Coomassie blue staining solution
Coomassie blue R250 Destain solution (see below)
2.5 g to 500.0 ml
This solution was stirred overnight to ensure complete dissolving of the dye. The following day, it was filtered through Whatman's No.1 paper.
A.3.7.4 Destain solution
Acetic acid (glacial) Methanol Distilled water
A.3.7.5 Reservoir buffer
Tris-base Glycine SOS (10% w /v solution) Distilled water
The pH of this solution should be approximately 8.5.
A.3.7.6 Resolving gel buffer
Tris-base Distilled water
The pH of this solution was adjusted to 6.8 with HCl.
250.0 ml 750.0 ml
1.5 1
15.15 g 72.05 g 50.00 ml
to 5.001
18.17 g to 100.00 ml

Media, buffers and solutions
A.3.7.7 Sample treatment buffer
Stacking gel buffer (see below) SDS (10% w /v solution) Glycerol 2-mercaptoethanol Distilled water
This solution was stored in aliquots at-20°C.
A.3.7.8 SDS solution
A 10% (w /v) solution of SDS was prepared as required.
A.3.7.9 Stacking gel buffer
Tris-base Distilled water
The pH of this solution was adjusted to 6.8 with HCL
2.5 ml 4.0 ml 2.0 ml 1.0 ml 0.5 ml
6.06g to 100.00 ml
155
Appendix B
General techniques
B.1 Plasmid preparations .................................. 156 B.1.1 Small scale (miniprep) ............................. 156 B.1.2 Large scale (maxiprep) ............................ .156
B.2 Restriction endonuclease digestion . . . . . . . . . . . . . . . . . . . . . .... 157
B.3 Agarose gel electrophoresis .............................. 158
B.4 DNA ligation reactions ................................. 158
B.5 Subcloning protocol . . . . . . . . . . . . . . . . . . . . . . . . . . . ........ 159
B.6 The preparation and transformation of competent E. coli cells ....... 159
B.7 Nucleotide sequencing ................................. 160 B.7.1 Primer annealing reaction .......................... .160 B.7.2 Sequencing reactions .............................. 160 B.7.3 Gel electrophoresis and autoradiography ................ .161
B.8 Radioactive labelling of DNA probes ....................... .161
B.9 DNA hybridization ................................... 161
B.10 SDS polyacrylamide gel electrophoresis (SDS-PAGE) ............ 162
B.11 Determination of protein concentrations ..................... 163
B.12 Fermentation end product determination .................... 163

AppendixB
General techniques
B.1 Plasmid preparations
B.1.1 Small scale (miniprep)
156
Plasmid was isolated from a 5 ml overnight culture (LB + Ap, 100 µg/ml) as
described by Ish-Horowicz and Burke (1981). Cells from a 1.5 ml sample of the
culture were harvested by centrifugation in an Eppendorf microfuge tube for 1
min. The pellet was resuspended in 200 µl Solution I (50 mM glucose; 25 mM
Tris-HCl, pH 8.0), incubated for 5 min at room temperature, and then 400 µl of
Solution II (0.2 M NaOH, 1 % (w /v) SDS) was added. The sample was vortexed
briefly and placed on ice for 5 min, before the addition of 300 µlice-cold Solution
III (5 M KOAc, pH 4.8). The sample was vortexed briefly, and, after 5 min on ice,
cellular debris and denatured chromosomal DNA were pelleted by
centrifugation for 5 min. The supernatant (750 µ1) was removed to a fresh tube
and sedimented by centrifugation with an equal volume of isopropanol for
5 min. The pellet was resuspended in TE (600 µ1), NaC104 was added (60 µl, 5
M), and the DNA was sedimented with an equal volume of isopropanol, washed
with 70% ethanol, air dried and resuspended in 50 µl TE buffer.
B.1.2 Large scale (maxiprep)
A 200 ml culture was grown overnight at 37°C in the presence of the appropriate
antibiotic. The cells were harvested by centrifugation at 6 000 g for 5 min and
then resuspended in 4 ml Solution I. After 5 min at room temperature 8 ml
Solution II was added, and the mixture was kept on ice for 5 min, before the
addition of 6 ml ice cold Solution Ill. After a further 5 min on ice the cellular
debris was removed by centrifugation at 12 000 g for 10 min. An equal volume of
isopropanol was added to the supernatant and the DNA was precipitated by
centrifugation at 27 000 g for 15 min. The pellet was washed with 70% ethanol
and resuspended in 4.2 ml TE buffer, and purified by isopicnic CsCl-EtBr
ultracentrifugation (Maniatis et al. 1982). The plasmid preparation was prepared

General techniques 157
for ultracentrifugation by the addition of CsCl (1 mg/ml) and EtBr (0.5 ml of a 10
mg/ml stock). The solution was centrifuged at 27 000 g for 15 min to precipitate
any remaining protein debris. The refractive index of the supernatant was
adjusted to 1.396, the sample sealed in Beckman Quickseal ultracentrifuge tubes
and centrifuged for 12 hat 55 000 rpm at 15°C in a Beckman Vti 65.2 rotor. The
plasmid DNA band was visualized by long wave UV light (350 nm), and
removed in the smallest volume possible. The EtBr was removed by extraction
(3 times) with equal volumes of NaCl-saturated isopropanol. The DNA was
precipitated from the CsCl solution by the addition of two volumes of water
followed by an equal volume of isopropanol, and centrifugation in an Eppendorf
microfuge for 15 min. The pellet was resuspended in 200 µl TE buffer and the
concentration was determined spectrophotometrically by measuring the
absorbance of 10 µl (diluted in TE) between 220 and 310 nm. The concentration
was determined by using the relationship A2w = 1 for 50 µg/ml double-stranded
DNA.
B.2 Restriction endonuclease digestion
Restriction digests were carried out using one of the four restriction buffers
(Appendix A) according to the salt requirements of the particular enzyme. The
enzyme Smal required a unique buffer (Appendix A). Digestion volumes were
routinely 20 µl containing 300-500 ng DNA and one unit of restriction enzyme.
Digestions were done at 37°C (most enzymes) for 1 h. Concentrated enzyme
stocks were diluted to 1 or 2 units using universal restriction enzyme dilution
buffer (Appendix A). For electrophoretic analysis, the digestions were
terminated by the addition of 5 µl DNA loading solution (Appendix A) to the 20
µl digestions. If the sample was to be used for ligation the digestion was
terminated by a phenol-chloroform extraction. The DNA solution was extracted
with the addition of phenol (1/10 volume, TE-saturated) and an equal volume of
chloroform:isoamyl alcohol (24:1). The mixture was vortexed briefly, and the
two phases were separated by centrifugation. The aqueous phase was extracted
twice with water-saturated ether. The DNA was precipitated by the addition of

General techniques 158
SM NaC104 (1/10 volume), an equal volume of isopropanol, and 15 min
centrifugation. If the DNA concentration was less than 2 µg/100µ1 E.coli tRNA
was added (2 µg) before precipitation. After centrifugation the pellet was
washed with 70% ethanol and resuspended in TE buffer.
B.3 Agarose gel electrophoresis
Agarose gel electrophoresis was carried out using a horizontal submerged gel
system. Tris-acetate buffer (Appendix A) was routinely used, however Tris
borate buffer (Appendix A) was occasionally used. Sigma type II agarose was
used at varying concentrations. The amount of DNA loaded/lane also varied
with the sizes and number of fragments but under normal circumstances about
300 ng of plasmid DNA was used. The gels were electrophoresed at 2 V /cm for
16 h. Gels were stained in electrophoresis buffer containing EtBr (0.5 µg/ml) for
15-30 min. DNA bands were visualised using a 254 nm transilluminator. A
310 nm transilluminator was used if the DNA was to be recovered from the gel.
Gels were photographed using a Polaroid CU-5 Land camera fitted with a red
filter and a fixed focal length attachment. Polaroid type 667 film (ASA 3 000) was
used with an exposure time of 1-2 sec at f4.7. If a negative was required then a
Polaroid type 665 film (ASA 64) with an exposure of 120-140 sec at f 4.7 was
used.
B.4 DNA ligation reactions
DNA ligation reactions were of two basic types: recircularization of plasmids for
the isolation of deletion clones (use low DNA concentrations, 1 pmole DNA/ml)
and recombination reactions, for example in subcloning (use 5 pmole DNA/ml).
DNA concentration was calculated using the formula 1 pmole = (0.662 x kb)µg.
Ligation reactions containing DNA, ligation buffer (Appendix A) and water to
the required volume, were performed in sterile microfuge tubes. Sticky-end
ligations were performed at room temperature for 3 h or at 15 ·c overnight using

General techniques 159
0.1-0.25 U of ligase, whereas blunt-end ligations were performed at room
temperature for 3-20 h using 20-100 x more ligase.
B.5 Subcloning protocol
The rapid subcloning protocol of Struhl (1985) was used. The DNA fragments
were separated by electrophoresis through low melting point (LMP) agarose
(1 %) (Seaplaque) in Tris-acetate buffer (50 mM, pH 8.2, no EDTA, no EtBr). The
gel was stained with EtBr after electrophoresis and the DNA bands were viewed
under UV light (310 nm), as briefly as possible. The desired bands were excised
using sterile scalpel blades, in as small a volume as possible. The gel slices were
melted at 70 ·c for 5 min in a microfuge tube and the required amounts (2 µI
vector DNA, 8 µI insert DNA) were added hot to the prepared ligation mixture
containing ligation buffer, ligase and water (10 µ1). The ligation was incubated at
room temperature for 3 h. Before transformation of E.coli competent cells, the
gelled ligation reactions were melted at 70°C for 5 min, and then diluted with 4
volumes of TE buffer (Appendix A).
B.6 The preparation and transformation of competent E. coli cells
Competent cells of E.coli were prepared essentially as described by Dagert and
Ehrlich (1979). An overnight culture of E. coli was diluted 1:1 000 into 50 ml
pre-warmed (37°C) YT medium and grown with shaking to early exponential
phase (OD(i()() = 0.3-0.6) (2-4 h). The culture was cooled on ice for 5 min, and the
cells were collected by centrifugation at 5 000 x g. The cell pellet was washed
once with 50 ml of ice cold 0.1 M MgC12, and resuspended in 25 ml of ice cold
0.1 M CaC12• After 1 h on ice the cells were collected by centrifugation and
resuspended in 5 ml of 0.1 M CaC12• The competent cells were kept on ice for at
least 1 h before use or aged overnight at 4 ·c to improve their competency. For
long term storage, competent cells were treated with glycerol to a final
concentration of 15% (v /v) and the cells frozen at -70°C. Competent cells
prepared in this way were suitable for use for more than 1 year.

General techniques 160
Plasmid DNA {1-5 ng) or a fraction of a ligation reaction (20-100 ng DNA) was
added to 100 µl of competent cells on ice. After 10 min the cells were induced to
take up the DNA by heat shocking the transformation mix at 42 ·c for 5 min.
One ml of LB medium was added and the transformation mix left at 42°C for a
further 30 min to allow expression of the plasmid borne antibiotic marker.
Controls included: competent cells with no DNA added; unrestricted plasmid to
monitor transformation frequency and linearised and ligated plasmid to monitor
ligation efficiency. The transformation frequency was in the order of 3 000 to
8 000 colonies per nanogram of unrestricted plasmid DNA.
B.7 Nucleotide sequencing
B.7.1 Primer annealing reaction
The supercoiled DNA (6-10 µg, in TE buffer) was diluted to a final volume of 20
µl in distilled water. Alkaline denaturation in 0.2 N NaOH (5 min at room
temperature) was followed by the addition of 5 µl of 3 M sodium acetate (pH
5.2), 25 µl of distilled water and 150 µl of ethanol. This mixture was chilled to -
70°C, centrifuged at 4 ·c for 20 min in a microfuge and washed with 200 µl of
ethanol (70%). The DNA pellet was dried and resuspended in a final volume of
10 µl of sequencing buffer (40 mM Tris-HCl, pH 7.5; 20 mM MgCli,; 50 mM NaCl)
and 12 ng of primer. This mixture was annealed for 15 min at 40°C immediately
prior to sequencing. The primers used were the forward sequencing primer as
supplied in the Sequenase DNA sequencing kit (US Biochemical Corp.,
Cleveland, Ohio) and the Ml3 reverse sequencing primer (Amersham).
B. 7.2 Sequencing reactions
DNA sequencing was done by the dideoxy chain termination method of Sanger
et al. (1977) according to the protocol of Tabor and Richardson (1987), using T7
DNA polymerase and a "Sequenase" sequencing kit supplied by the US
Biochemical Corporation, Cleveland, Ohio. The DNA chain was radiolabelled
with [a..3SS]dA TP (1200 Ci/mmol; Amersham).

General techniques 161
B.7.3 Gel electrophoresis and autoradiography
The sequencing reactions were analyzed on standard 6% denaturing acrylamide
urea sequencing gels. The composition and running conditions of the gels were
as described in the Amersham M13 Sequencing HandbCX>k. After electrophoresis
the gels (0.2mm thick) were dried onto Whatman No. 3 filter paper using a Dual
Temperature Slab Gel Dryer (Model 1125B; Hoefer Scientific Instruments, San
Francisco). Gels containing 355-labelled DNA were placed under XAR-5
autoradiographic film and exposed for 1-2 days. The autoradiographs were
developed using Kodak GBX X-ray developer and fixer.
B.8 Radioactive labelling of DNA probes
DNA probes were labelled with [a..32P]dCTP to high specific activity by nick
translation (Rigby et al. 1977). The reagents were obtained in kit form
(Amersham) and used according to the suppliers specifications. Contaminating
nucleotides were removed from the radioactively labelled probe preparation
using a Sephadex G50 spin column as described by Maniatis et al. (1982).
Radioactively labelled probes were stored in lead containers at -20°C. Probes
were denatured by boiling (5 min) in a fume hCX>d just before use.
B.9 DNA hybridization
DNA fragments resolved by agarose gel electrophoresis were transferred to a
Hybond-N+ hybridization membrane (Amersham) according to the
manufacturer's instructions. After staining the agarose gel with ethidium
bromide, and obtaining a polariod picture, the gel was soaked in 0.25 M HCl for
30 min to partially hydrolyse the DNA by acid depurination. After rinsing
briefly in distilled water the gel was soaked in denaturing solution (Appendix A)
for 30 min. The gel was again rinsed in distilled water followed by a 30 min soak
in neutralizing solution (Appendix A). The gel was placed on a glass surface and
a pre-wet (with neutralizing solution) piece of Hybond-N+ membrane was
placed on top of the gel. After removal of all air bubbles between the gel and the
membrane, three sheets of Whatman 3 MM filter paper, wetted in neutralizing

General techniques 162
solution, were laid onto the membrane, followed by a 4 cm thick layer of
absorbent paper. A light weight was placed on top of this, and transfer left to
continue for 60 to 90 min. After transfer, the membrane was placed on a pad of
absorbent filter paper which had been soaked in 0.4 M NaOH to fix the DNA to
the membrane. The membrane was rinsed briefly in 5x SSC (Appendix A).
Hybridization and washing conditions were essentially according to Maniatis et
al. (1982). The membrane was gently shaken in pre-hybridization solution
(Appendix A) for 4 h at 65°C, while the probe was being prepared. The
radioactively-labelled probe to be used was denatured by boiling for 10 min and
was added to the pre-hybridization fluid. Hybridization was carried out at 65°C
overnight. The membrane was washed in 1 x SSC at 65 ·c, for 30 min, and after
checking the radioactivity by means of a Geiger-counter, the washing was
terminated and the membrane sealed in a plastic bag. The membrane was
exposed to autoradiographic film (XAR-5) overnight at-70°C.
B.10 SOS polyacrylamide gel electrophoresis (SOS-PAGE)
Discontinuous SDS-PAGE was done according to the method of Laemmli (1970),
using a Hoefer SE600 vertical slab electrophoresis unit (Hoefer Scientific
Instruments, San Fransisco, CA, USA). The 1.5 mm thick gel spacers were used.
The resolving gel was prepared and degassed before pouring. Isopropanol was
layered on the gel to promote a sharp interface. After the gel had polymerized
(30 min), the isopropanol was removed by rinsing with the stacking gel buffer,
and the stacking gel was cast.
Samples were prepared in sample treatment buffer (Appendix A) and placed in a
boiling waterbath for 2 min before being loaded onto the gel. Electrophoresis
was continued at 35 mA (constant current)/gel until the dye front migrated to
the end of the gel (four to five hours).
After electrophoresis the gels were stained for 3 h in coomassie blue staining
solution with gentle agitation, destained and dried.
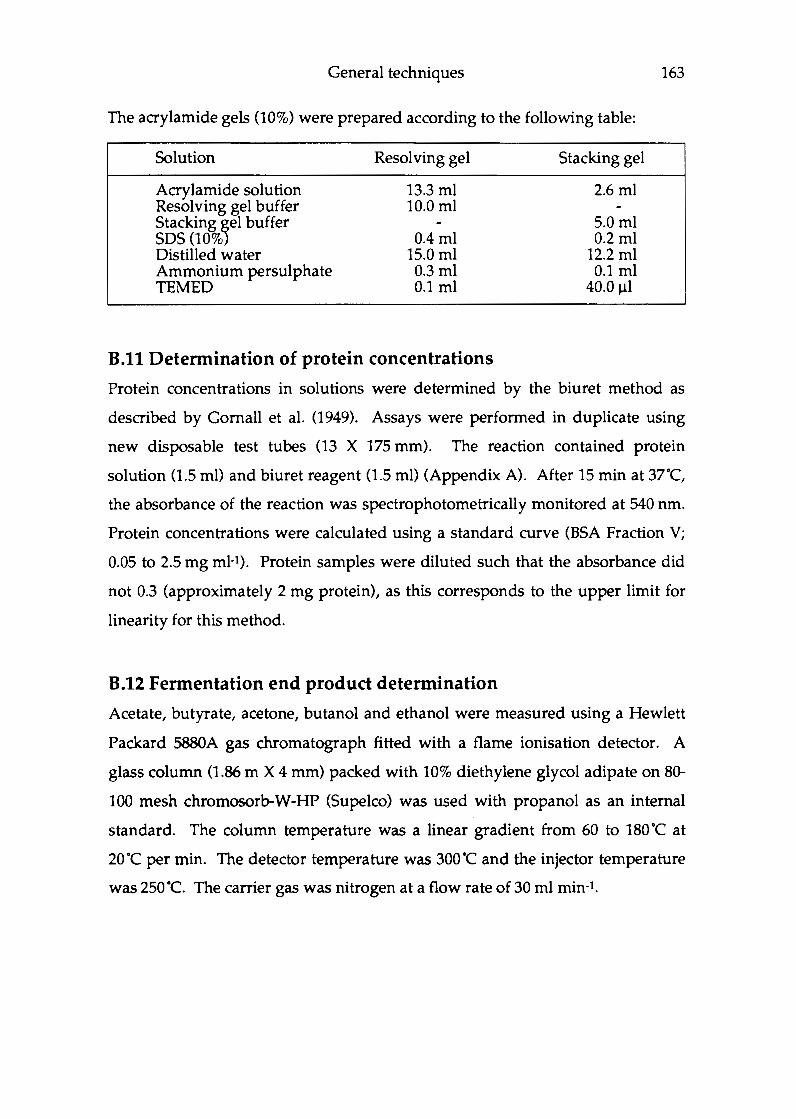
General techniques 163
The acrylamide gels (10%) were prepared according to the following table:
Solution Resolving gel Stacking gel
Acrylamide solution 13.3 ml 2.6 ml Resolving gel buffer 10.0 ml Stacking ~el buffer 5.0 ml SDS (10% 0.4 ml 0.2ml Distilled water 15.0 ml 12.2 ml Ammonium persulphate 0.3ml 0.1 ml TEMED 0.1 ml 40.0 µ1
B.11 Determination of protein concentrations
Protein concentrations in solutions were determined by the biuret method as
described by Cornall et al. (1949). Assays were performed in duplicate using
new disposable test tubes (13 X 175 mm). The reaction contained protein
solution (1.5 ml) and biuret reagent (1.5 ml) (Appendix A). After 15 min at 37°C,
the absorbance of the reaction was spectrophotometrically monitored at 540 nm.
Protein concentrations were calculated using a standard curve (BSA Fraction V;
0.05 to 2.5 mg ml-1). Protein samples were diluted such that the absorbance did
not 0.3 (approximately 2 mg protein), as this corresponds to the upper limit for
linearity for this method.
B.12 Fermentation end product determination
Acetate, butyrate, acetone, butanol and ethanol were measured using a Hewlett
Packard 5880A gas chromatograph fitted with a flame ionisation detector. A
glass column (1.86 m X 4 mm) packed with 10% diethylene glycol adipate on 80-
100 mesh chromosorb-W-HP (Supelco) was used with propanol as an internal
standard. The column temperature was a linear gradient from 60 to 180°C at
2o·c per min. The detector temperature was 300°C and the injector temperature
was 250°C. The carrier gas was nitrogen at a flow rate of 30 ml min-1.
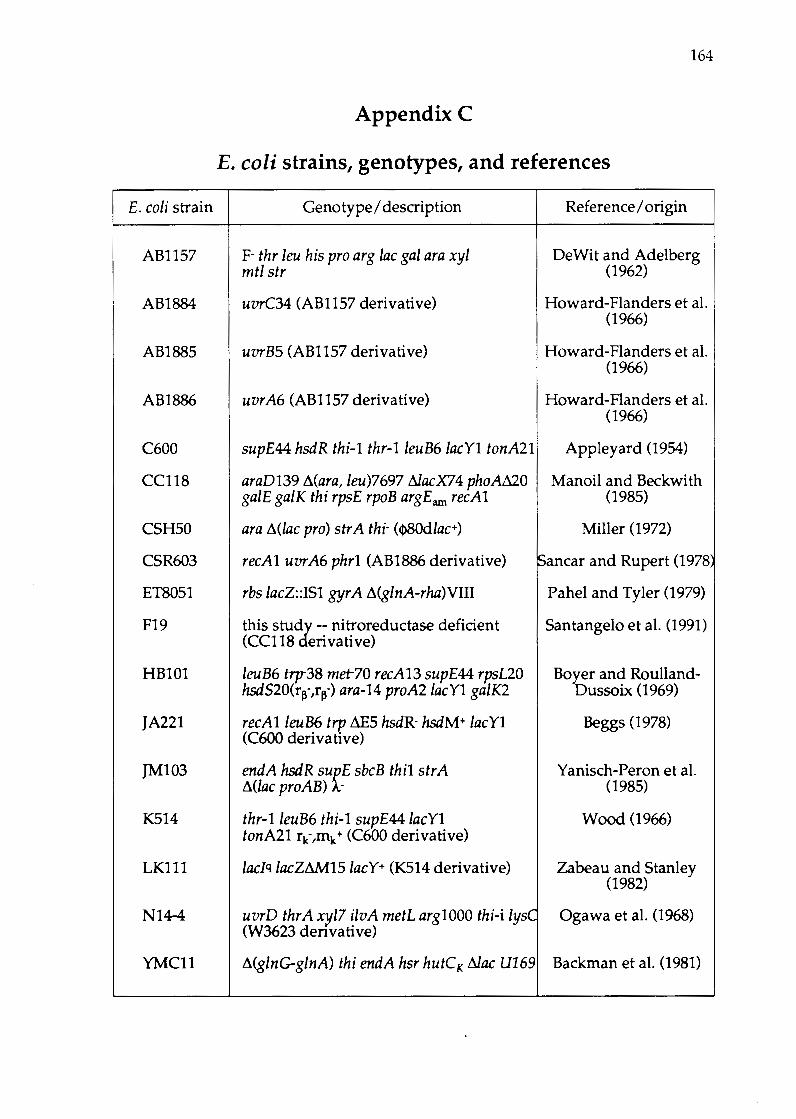
164
Appendix C
E.coli strains, genotypes, and references
E. coli strain Genotype/ description Reference/ origin
AB1157 F- thr leu his pro arg lac gal ara xyl DeWit and Adelberg mtl str (1962)
AB1884 uvrC34 (ABl 157 derivative) Howard-Flanders et al. (1966)
AB1885 uvrB5 (ABl 157 derivative) Howard-Flanders et al. (1966)
AB1886 uvrA6 (ABl 157 derivative) Howard-Flanders et al. (1966)
C600 supE44 hsdR thi-1 thr-l leuB6 lacYl tonA21 Appleyard (1954)
CC118 araD139 Mara, leu)7697 AfacX74 phoA~O Man oil and Beckwith galE galK thi rpsE rpoB argEam recAl (1985)
CSH50 ara Mlac pro) str A thi- (<)>80dlac+) Miller (1972)
CSR603 recAl uvrA6 phrl (AB1886 derivative) Sancar and Rupert (1978
ET8051 rbs IacZ::IS1 gyrA ~(glnA-rha)VIII Pahel and Tyler (1979)
F19 this studi-- nitroreductase deficient Santangelo et al. (1991) (CC118 erivative)
HB101 leuB6 tryr38 met-70 recA13 supE44 rpsL20 Boyer and Roulland-hsdS20(rf ,rf) ara-14 proA2 lacY1 galK2 Dussoix (1969)
JA221 recA1 leuB6 trp ~5 hsdR- hsdM+ lacY1 Beggs (1978) (C600 derivative)
JM103 endA hsdR surE sbcB thi1 strA Yanisch-Peron et al. ~(lac proAB) - (1985)
K514 thr-1 leuB6 thi-1 supE44 lacY1 Wood (1966) tonA21 rk-,mk + (C600 derivative)
LK111 lacJq lacZ~15 lacY+ (K514 derivative) Zabeau and Stanley (1982)
N14-4 uvrD thrA xyI7 ilvA metL arglOOO thi-i IysC Ogawa et al. (1968) (W3623 denvative)
YMC11 ~(glnG-glnA) thi endA hsr hutCK Afac U169 Backman et al. (1981)

165
AppendixD
One- and three-letter codes used for amino acids
Amino acid Codes Code Amino acid
Alanine Ala A A Alanine
Arginine Arg R C Cysteine
Asparagine Asn N D Aspartic acid
Aspartic acid Asp D E Glutamic acid
Cysteine Cys C F Phenylalanine
Glutamine Gln Q G Glycine
Glutamic acid Glu E H Histidine
Glycine Gly G I Isoleucine
Histidine His H K Lysine
Isoleucine Ile I L Leucine
Leucine Leu L M Methionine
Lysine Lys K N Asparagine
Methionine Met M p Proline
Phenylalanine Phe F Q Glutamine
Proline Pro p R Arginine
Serine Ser s s Serine
Threonine Tor T T Threonine
Tryptophan Trp w V Valine '
Tyrosine Tyr y w Tryptophan
Valine Val V y Tyrosine

AppendixE
Plasmid vectors and phage restriction maps
Pstl Fapl
V.pl ~
Boll Geul
pEcoR251
Hoel
Pstl Baml
Aaull
166
pEcoR251 (3349 bp) is a derivative of the pCL series vectors (Zabeau and Stanley, 1982), and was a gift from M. Zabeau, Biotechnology Business Development, Ghent, Belgium. This is a positive selection vector used routinely by insertional activation of the EcoRI endonuclease gene at either the BglII or Hindlll site.

Asel BgU <3600
Oral
Plasmid and phage restriction maps
Aatll HlndlN < Clal < 4363 < EcoRI EcoRV< Raal
Nhel
pBR322
167
< Sall
1000
Bgll
pBR322 (4361 bp; Sutcliffe, 1978) is a common E. coli cloning vector. This plasmid was constructed in vitro using the Tcr gene from pSC101, the origin of DNA replication (ori) from the ColE1 derivative pMB1, and the Apr gene from transposon Tn3.

Pvul
2000
Plasmid and phage restriction maps 168
pUC19
Hg!Ell
XmaI
HglEll < Ndel Marl
:,:pl Pvul
PYull EcoRI
Banll / Sacl Smol < Aval / Kpnl / Xmol BomHI Xbol HlncN < kcl < SoU
/.Q-~ Pstl ~- Hlndlll < Sphl 500
Pvull
SacI SmaI XbaI PstI HindIII agtgaattCGAGCTCGGTACCCGGGGATCCTCTAGAGTCGACCTGCAGGCATGCAAGCTTGGcgtaatca
EcoRI KpnI BamHI Sall SphI HincII
Acer ---BspMI
pUC19 (2686 bp; Yanisch-Perron et al., 1985) is a small, high copy number E.coli cloning vector. The pUC series of plasmids were constructed using portions of pBR322 and M13mp19. The nucleotide sequence of the multiple cloning site polylinker (in the lacZ gene) is shown below the circular plasmid map. pUC18 differs from pUC19 in the orientation of the multiple cloning site polylinker.
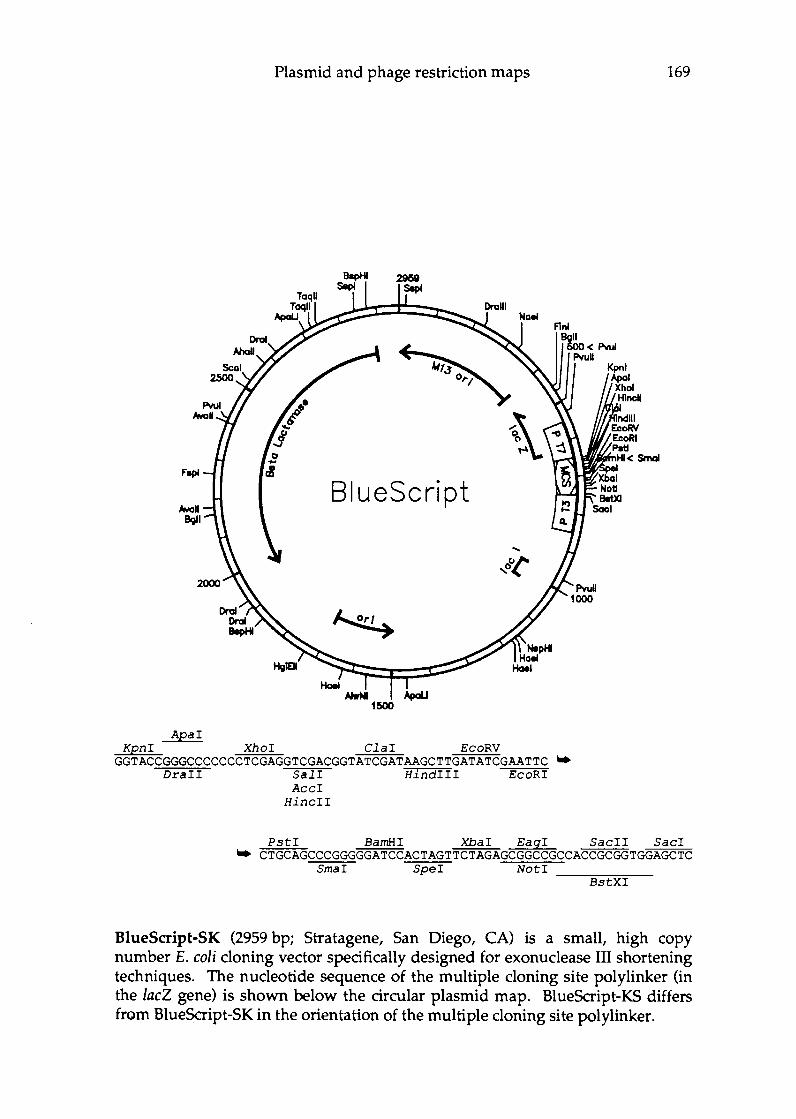
Fapl
AYOII 9911
Apar
Plasmid and phage restriction maps
BlueScript
ApaU
Kpnr Xhor Clar EcoRV GGTACCGGGCCCCCCCTCGAGGTCGACGGTATCGATAAGCTTGATATCGAATTC _.
Drarr Salr Hindrrr EcoRr Acer
HincII
169
Pstr BamHr Xbar Eagr Sacrr Sacr _. CTGCAGCCCGGGGGATCCACTAGTTCTAGAGCGGCCGCCACCGCGGTGGAGCTC
Smar Sper Notr ~~~~~-Bstxr
BlueScript-SK (2959 bp; Stratagene, San Diego, CA) is a small, high copy number E.coli cloning vector specifically designed for exonuclease III shortening techniques. The nucleotide sequence of the multiple cloning site polylinker (in the lacZ gene) is shown below the circular plasmid map. BlueScript-KS differs from BlueScript-SK in the orientation of the multiple cloning site polylinker.

Plasmid and phage restriction maps
= 0::;: O'l...c en coxn_
I ' I ISSOL with phoA
TnphoA
- I u==-== o- E ==u C ::J -+-' ::J E ::J = 0 ::J C ·- > en > > o ...c o > ·-IQ_ n_ n_ U)Q_U)XCO Q_I
I I Jt~IZIIIZZZ2 I I
Tn5
1 kb
::;: 0 (J) ...c n_x
I I
170
A partial restriction map of the transposon TnphoA (Manoil and Beckwith, 1985) showing the position of Tn5 relative to the leftward (ISSOJ and rightward (ISSOR) insertion sequences. IS50L and ISSOR are represented as thick solid bars, Tn5 is represented as a thick slashed bar, and phoA is represented as a thin solid line.

171
Appendix F
Source code for chromatographic software
STARTUP.SRC
l O RD4 PRcx;R.AM NAME • STARTUP, SllC 200 DEF!NT .\,C,8,L-P,V: DEFD8L O,JC:,R,S: OEFSTR E,f,I,Q,T,X,Y: DEFSNG B 210 CALL GMOOE 220 P11GE-O: LINTS-1 230 CALL GPAGE(PAGE) 240 CALL LtVI.L(LINTS) 250 CALL CLRSCJl 260 CALL DISP (PAGE) 270 PAGE•l: LINTS•l 280 CALL GP AGE (PAGE) 290 CALL LEVI.L(LIN"!S) 300 CALL CLRSCR J 10 LX•lJS: LY•l55 320 CALL HOVE (LX, LY) 330 LX-585: LY•lSS 340 CALL OLINE (LX, LY) 350 LX•S85: LY•llS 360 CALL DLINE(LX,LY) 370 LX•l35: LY•llS 380 CALL DLINE(LX,LY) 390 LX•lJS: LY•lSS 400 CALL DLINE(LX,LY) 410 LX•255: LY•lSS 420 CALL HOVE (LX, LY) 430 LX•255: LY•llS 440 CALL DLINE(LX,LY) 450 LX•.US: LY•lSS 4 60 CALL MOVE (LX, LY) 410 LX•465: LY•llS 00 CALL DLINE(LX,LY) 490 LX•lJS: LY•lSO 500 CALL HOVE (LX, LY) 510 LX•l20: LY•lSO 520 CALL DLINE(LX,LY) S30 LX•l35: LY•l20 540 CALL MOVE (LX, LY) 550 LX•l20: LY-120 560 CALL DLnn: (LX, LY) 570 LX•515: LY-150 580 CALL HOVE ILX, LY) 590 LX-600: LY•l50 600 CALL DLINt(LX,LY) 610 LX-585: LY•l20 620 CALL !<1VE (LX, LY) 630 LX-600: LY•l20 640 CALL DLINt(LX,LY) 650 LX•90: LY•l55 660 CALL HOV!. (LX, LY) 670 LX-120: LY•l55 680 CALL DLIHt(LX,LY) 690 LX•l20: LY•ll5 700 CALL DLINE(LX,LYJ 710 LX•90: LY•ll5 720 CALL OLINE (LX, LY) 730 LX•90: LY•l55 HO CALL DLINl.(LX,LY) 750 LX•600: LY•155 ?60 CALL l«JV!.(LX, LY) 170 LX•630: LY•l55 710 CALL DLIIIE(LX,LY) 790 LX•630: LY•l15 800 CALL DLIME(LX,LY) 110 LX•600: LY•ll5 820 CALL DLINE(LX,LY) 130 LX•600: LY•l55 840 CALL DLINE(LX,LY) 150 LX•90: LY•l45 860 CALL MOYE (LX, LY) 1'70 LX•'° t LY•l4.S 880 CALL DLIWl(LX,LY) I 90 LX•'° I LY•l 20 ,oo CALL DLIMl(LX,LY) 910 LX•IO I LY•UO ,20 CALL OLI111 (LX, LY) no LX•IO 1 LY•lSO ,40 CALL 01,IWl(LX,LY) ,so LX•60: LY•lSO HO CALL DLIJll(LX,LT) ,10 LX•iO: LY•l Z.S no CALL DLIIII (LX, LY) ''° LX•tCh LY•U5 1000 CALL DLilf!. (LX, LT) 1010 u:-no I LT-145 1020 CALL MOVZ(LX,LY) 1030 LX•660: LT•l45 1040 CALL OLINE (LX, LY) 1050 LX•660: LY•l20 1060 CALL OLINE (LX, LY) 1070 LX•6•0: LY-120 1010 CALL DLilf!. (LX, LY) 10,0 LX•640: LY•lSO 1100 CALL DLIN"t (LX, LY) 1110 LX•6'° I LY•lSO 1120 CALL OLINJ! (LX, LY) 1130 LX•HO I LY•l25 lUO CALL DLINE(l.X,LY) 1150 U:•6301 LY•l25 1160 CAl.L Dl.IlfE (l.X, LY) 1163 PAGE•l 1166 CALL DISP(PAGE) 1110 U:•90: LY•lH: LN-30: LJl•l5 1110 CALL 111.)(FIL(LX,LY,LW,LB) 11'0 U:•1201 LY•l21: LW•l5: LB•lO 1200 CALL ILJU'IL(U:, LY, LW, LB) 1210 LX•l351 l.Y•lU: LW•l21: l.8•15 1220 CALL ILXFIL(LX,LY, LN',LB) 1230 LX-46.S: LY•lU: LN'•l20: LB•l5 12•0 CALL ILXFIL(LX,LY, LW,LB) 1250 I.X•515: l.Y•l21: LN•l5: LB•lO
1260 CALL BLKFIL (LX, LY, LW, LH) 1270 LX-600: LY•l14: !..W-31: LB•l5 1280 CALL BLKFIL(LX,LY,LW,LB) 1290 LX•90: LY•l70: LN•JO: LH•l5 1300 CALL BLICFIL(LX,LY,LN,LH) 1310 LX•l20: LY•l60: LW•lS: LB•lO 1320 CALL BLXF!L(LX, LY, LN,LB) 1330 LX•l35: LY•l70: LW•121: LB•lS 1340 CALL BLXFIL(LX,LY,LW,LB) 1350 LX•4.65: LY•170: LW•l20: LB•l5 1360 CALL BLXFIL(LX, LY, LW, LB) 1370 u-sas: LY•l60: LW-15: LB-10 1380 CALL BLXFIL(LX,LY,LN,LB) 13'0 LX•600: LY•l70: LW•Jl: LB•lS 1400 CALI. BLJffIL(LX, LY, LN, LB) 1470 LX•270: LY•SO: [ST•· BPLC 100 CALL TEXTB(LX,LY,!.ST) 1490 LX•270: LY•U: !.ST•" SYSTF.MS SOF"l'NAAE 1500 CALL TEXTB(LX,LY,!.ST) 1550 LX•310: LY•210: tST•·veuion 1.2• 1560 CALL TtXTB(LX,LY,EST) 1570 LX•302: LY•250: EST•·Preu any key" 1580 CALL TEXTB(LX,LY,EST) 15,o IF INKEY$•"· THEN 1S,O 1600 CHAIN "A:BPtc•
10 REM PROGP.»I NAME• RPLC.SRC 12 Rr.M
" 20 RD< RD<
HPLC.SRC
JO RD< •• BPLC Sy•t-• •oft111&re written for a Beck!llan 340H BPLC by •o ll!M 50 REM 60 l&l 70 llDI
•• Jo•eph D. Santangelo in the department of Microbiology at the •• Un1ver•1ty of Cape Town; Rondebosch 7700; South Africa,· u•ing •• an IBM-PC.
80 l!M •• Analoq data fro• a Beck••n 160 detector is converted to ,o REM • • digital data by an t.agle Electronics PC-2 6 AID converter. 100 RDI •• TM bu• ad.d.r••• of the PC-26 e&rd lllUSt be selected as 110 RDI • • 700 (Mix) . 120 REM 130 REM •• These software programs run on IBM and compatible PC's, i;~ :: :: providing a Hercules aonochro .. graphics card 1• installed.
170 REM 180 RDI •••• •• •• •• •• •• •••• •• •• •••• •••• •• •• •••• •• •• •• •• ** ** ** ** ** • • •• • • •• * 0 * 190 RDI 200 D!.FINT A,C,B,L-P,V: DtFDIL 0,X,ll,S: OtFSTll t,F,I,0,T,X,Y: OEFSNG B 210 LlllTS•l: PAGt-0 2U CALL GP11GE(PAQE) 216 CALL U:VEL(LINTS) 211 CALL CLRSCR 21' CALL DISP (P11GE) 220 REM lllflflflfffflllllllllltt Ml.MU GtNtJIATIClf tfffllllltttttttttttllfttf 230 LX•2•0: LY•Z. 231 CALL l«Jvt (LX, LY) 232 Lx-•n: LY•2• 233 CALL DLINE(LX,LY) 23• LX••71: LY•U 235 CALL DLINE(U:, LY) 236 LX•240: LY••• 23'7 CALL DLIJIEILX,LY) 231 LX•240: LY•22 239 CALL DLlNE(LX,LY) 240 LX•411: LY•22 2U CALL OLilfEILX,LY) H2 LX•411: LY•46 243 CALI. DLUIE(U:,LY) 2U LX•240: LY•O 20 CALL OLIME(LX,LY) 20 LX•2•0: LY••U 20 CALI. OLilft(LX,LY) 2SO LX-2601 LY•ll: ts-r-·artc DATA SYSTF.HS Hr.HU" 260 CALL TI:XTll(LX,LY,EST) 2'70 LX•l231 LY•l7 271 CALL t«JV! (l.X, LY) 212 LX•S'6: LY•l7 273 CALL DLINE(LX,LY) 27', LX•596: LY•289 275 CALL DLINE(LX, LT) 216 LX•l23: LY•219 2'7'7 CALI. OLilfE(U:,LY) 271 LX•l23: LY•l5 2'79 CALL DLINE(LX.,LY) 210 L:1•596: LY•l5 211 CALL DLIME(LX,LY) 212 l.X•S96: LY•Ul 213 CALI. Dl.IM!(LX.,LY) 214 LX•l23: LY•291 21S CALL DLI11t(LX.,LY) 216 LX-1231 LY-219 217 CALL OLINE (LX, LY) 211 LX•lSI: LY•l12: !.ST•'"l) Record Daily Baseline• 219 CALL TI:XTl(LX,LY, EST) 2,0 LX•lSl1 LY•l39: EST•'"2) lecord C&l1})ration Chroaatogr-· 291 CALL TI:XTl(LX, LY, UT) 292 LX•l511 LY•l66: !.ST•'"l) Data Collection and Manual Integration" 293 CALL TtXTl(IJC,LY, tsT) 2'4 LX-1SI: LY•l'3: EST•'"•J Data Collection with Automatic Int•gration" 29S CALL TI:XTIIU:,LY,UT) 29' LX•lSI: LY•220: !.ST•'"5) D1•play a Stored ChroaAtograi• 2 91 CALL TI:XTI I LX, LY, tsT) 291 LX•l51: l.Y•2fl: EST•·6) Manually Integrate a Stored Chrc:aatogram" 2 9' CALL TEXTI I LX, LY, !.ST) 300 LX•l58: LY•2H: EST•"'?) Exit to HS-DOS ~•rating Sy•t-" 302 CALL TI:XTl(LX,LY,EST) 310 LX•2U: LY•l29: ES'?•"E.nter Selection Nullber ( 1 - 7 ) • 315 CALL TI:XTl(LX,LY, !.ST) .

Chromatographic software 172
320 LX•l: LY•l43: EST•SU.INGS(19,32) 330 CALL TI.XT8(LX, LY, EST) 365 DEF Sr.G-0: ,on 1050,PEEX(l052): DEF SEG: POKE 106,0 'clear kbrd buffer 310 as-nuans Ir o•-·" THEN 370 ELSE C80ICE-VAL(Q$) 380 LX•216: LY•J21: EST•STllHIGS {33, 32) 385 CALL TEX'?BILX,LY,EST) 390 IF CBOICI.<l Oll CB0ICE>7 THEN GOSUB 600 ELSE 410 400 GCTI'O 310 410 ON CHOICE GOTO 460, 410, 480, 490, 500, 510, 520 430 RDt .UO REM fffffffttflllfftftfftff GET SELECTED PRcx;RAM Utttfffffffftftfttffff <150 RF.M 460 CHAIN "A:BASELINE" 470 CHAIN "A.:CALIBRAT" 480 CRAIN "A:MANINT" 490 CBA.IN "A.:.\UTO!NT" 500 CHAIN "A:DISPLAY" 510 CHAIN "A:MANINTST" 520 REM 530 Rr.M fffffftfffffttfflffflf r.xn n .. OH BPLC SYSTEMS flfffffffffffltfftffff 540 Rr.M 550 LX-256: LY•J.43: EST•"Confir11 Selection (y/n}" 555 CALL TEXTB(LX,LY,EST) Ho as-nncr.Ys: IF as-·· TREN s6o 570 IF 0.S<>"Y" AND OS<>'"y'" TB.EN 310 575 CALL 'I'MOOE 577 CLOSE: CLS: ENO 580 RDt 590 REH fttfftftllffffllffffttttt ERR.OR SUBROUTINE ttttflttttttttttttttttUf 600 LX•292: LY•343: EST•" INVllID ENTRY'": LINTS•O 602 CALL LEVEL (LINTS) 604 CALL TEXTB (LX, LY, EST) 606 LINTS•l 608 CALL LEVEL(LINTS) 610 BEEP: roR LOOP • 1 TO 6000: NEXT 630 RETURN
MAN INT. SRC
l O JU:M pao:;RAM NAME • MAN INT SRC
•• UM 96 REM 100 RD!: tttttffttttttttttHffff Initialize th• 8255 fttttttUUUttffttttttt 110 REH 120 OUT ,a703,,B92 194 RD!: 196 REH 200 REH fffttttfft Initilize the Screen and OiJnenaion Variables fffffttttttf 210 REH 220 DEFINT A,C,8,L-P,V: DEFDBL O,PC,Jl,S: DEFSTR E,F,I,Q,T,X,Y: OEFS'NG B 230 DIM AST0(5010), 8STO (S010), PPCSTAJlT (1, 25), PPCEND (l, 2S), DP!tARF.A (2S), DPPCJt.T (25),
DPDHT (25), EPXNAM$ ( 25), STORT (20), STDXMEAN (20), STDYMF..U (20), STOSLOPE (20}, ESTDNAMS ( 20)
240 PAGE•O: LIHTS•l 250 CALL GPAGl.(PAGE) 260 CALL LEV!.L(LINTS) 270 CALL CLlSCR 280 CALL DISP (PAGE) 29.C REH 296 R!'J1 300 RD1 fftffffUtt Conv.rt Date Fonaat fro• Merican to Europea.11 fffttttfff 310 J.Dt 320 £OATES• DATES: HID$(EDATtS,l,2) "'MIDS(DATU,.4,2): HID$(£0ATU,4,2}"' HID$(DATES,1,2) 39.C REH J 96 REH 400 RDI tHHUHttttfffffffffftt Startinq Prcapta tfttttttHttttttftttttttt 410 REH 4 12 CALL CLRSCI. 413 LX•350: LY•30: EST•'"Data Collection and Ha.nu.l Integration'" 414 CALL TtXTll(LX,LY,EST) .415 Otr Sr.G-0: POICE 10SO,PEEK{1052): DEF SEC: POll:E 106,0 'cl-r kklrd buffer 416 FILES•'"'" 418 LX•20: LY•l80: EST-" NAME OF FILE FO,. DATA STOllAGE (extension not
permitted) " .420 CALL ffX'?ll(LX,LY, EST) -421 Ot•I111CEYS: IF Qt••• TB.EM .421 .422 CBAJ.•ASC (Qt) 423 tr (CBA.ll<>ll AMO CBAll<>I) AJfD (CBAll<l2 OR CBAJt.>126) TB.tN SOUND .CO, 10:
QO?O .421 424 IF CBAll•ll TREN 43S 42S Ir CRAJ.-1 AJfD LEM(rILU)<l TBDI SCXJND 40, 10: GOTO 421 426 Ir CRAJ.-1 AJIC Ll.N(rILES)>O TB!Jf rILU•LEFTS(rILES, (LEN(FILE$)-1)):
Ga?O 421 421 FILU•FILU~t 421 LX•5l51 LY•ll01 EST-FILES+• • 429 CALL ff.XTB(LX,LT, UT) 430 GO?O .421 435 IF MIDt(FIL&.t,2,l) o •:• ?BEW FILEt • •B:"+FILE.$ 440 FOR LOOP• l TO LDl(FIL&.t) 1 IF MIDt(FILEl,LOOP, l) <> •.• TREJrl JrlEXT UX:.
ELI& 442 Ul GO?O 4.50 442 LIWTl-0 443 CALL LEVEL (Liftl) U4 LX•2411 LT-l21t EST•" EX'?EIISIClf NOT PUHI'?'l'F.D • 445 CALL TI.XTl(LX,LT,UT) 446 LIWTa•l I l&&P 441 rca l,(X)Pl • l TO 5: FOR LOOP2 • 1 TO 5000: NEXT LOOP2: HEXT LOOPl 441 CALL LEVEL (Lill'!'I) 44 9 COTO 412 450 IF LEM (Fil.Et) < 11 TRDI 4 M> 4Sl LlllTS-0 4S2 CALL L.EV!.L(LIH'?S) 45l LX•2.56: LY•321: EST•• FILE NAHi. IS TOO LONC " 4S.C CAI.L TtX'?B(LX,LT,&ST) 45S Ltllff•l: BEU 456 rca LOOPl • 1 TO 5: FOR LOOP2 • 1 TO SOOO: nrr LOOP2: NEXT LOOPl 457 CALL L&V!.L(LIH'?S) 4SI GO?O 412 460 PAGE-l I LIN'?S•l 462 CALL QPAGE (PAGE) 46.C CALL UV!.L(LI11TS) 466 CAI.I. CLUO. 461 LX•20: LY•llO: l.ST-'"All YOO OSillG Alf UTEDIAL TRI~tl. TO START SAMPLING
(Y/N) ?" 470 CALL TEXTBILX,LY,EST) 472 CALL DISP (PAGE) 410 EXTJ.t • IJrlJCEYS: IF txnS • "" TllN 410 490 IF r.rns • ,. 01. EX'TU • •n• Ol r.xns • •y• Oil EX'?RS • •y• TBEH 510 500 SOU11C 40, 10: PAGE•l S04 CALL CLUCJt. S06 QO?O 461 S10 PAG!.•O: LIJrl'?S•l 520 CALL c.PAGE(PM.£) 530 CALL LtVl.L(LtHTS) HO CALL CLUCJt. S9.C JI.D'I S96 JI.D'I
600 REH ttttttttttttttttttftfft Dn.w Running Screen ftttttttttttttfffHfftff 610 R.EH 620 LX•30: LY-0: GOSUB 20010 630 LX•30: LY•2 60: GOSU!l 20030 632 LX•630: LY•260: GOSUB 20030 634 FOR MAJ.JI: • 256 TO O STEP -10 636 LX-30: LY-MAJU(: GOSUB 20010 638 LX•2S: LY-MA..RJI'.: GOSUB 20030 640 NEXT MAJUC 642 FOR MAR.JC • 30 TO 630 STEP 20 644 LX-H>Jt.JC: LY•260: GOSUB 20010 646 LX-+O.RJC: LY•265: GOSUB 20030 64 8 NEXT MAJUt: 650 FOR MAJ.JC • JO TO 630 STEP 100 652 LX-MAJl.JC: LY•265: GOSUB 20010 654 LX-H>Jt.JC: LY•270: GOSUB 20030 6S6 NEXT MAJUt: 651 FOP. HAAK • 30 TO 630 STEP 200 660 LX-H>Jt.K: LY-270: GOSUB 20010 662 LX-H>Jt.X: LY•275: GOSUB 20030 6U NEXT MARJ(
666 LX•21: LY•291: EST•'"lS'": GOSUB 200SO 668 LX•l21: LY•291: EST•'"20'": GOSUB 20050 670 LX•221: LY•291: EST•'"25": GOSUB 20050 672 LX•321: LY•291: EST•"30'": GOSUB 20050 674 LX•421: LY•291: EST•""35'": GOSUB 20050 676 LX•521: LY•291: EST•'"40": GOSUB 20050 678 LX•621: LY•291: EST•'"45•: GOSUB 20050 680 LX•281: LY•305: EST•'"TIHE (mina)": GOSUB 20050 6'0 LX•619: LY•l'7: EST•EDATES: GOSUB 20050 700 LX•30: LY-343: EST•"FILE • '"HILES: GOSUB 20050 710 LX-450: LY•321: EST•'"SA111ple Number•'": GOSUB 20050 720 LX•4SO: LY•343: EST•'"Run Time•'": GOSUB 20050 730 CALL DISP (PAGE} 7 96 REH 800 JI.EH tffffffffUHt s-pl• Channel O -- External Trigger tttttffffffflfff 810 RD4 820 IF EXTll.$ • •y- Oil. EXTR$ • •y• THEN CHANNEL - 0 ELSE GOTO 900 130 VALUE-0 840 LX•30: LY•328: EST-'"Waiting for External Triqq9r ..... ": GOSUB 20050 850 NRILE VALUE < 2500 860 OUT ,B702, 2 863 OUT ,B702, CRANNEt-,810+3 lil66 VALUE•(INP(,B10l)AHD '8F)"256+INP(,B700) 870 NEND 894 REH 896 RD4 900 RD4 tttttttttfft O.ter.un• Injection Time of Chromatogr- tttftftftftt 910 RD4 920 Il1JtCT$ "' TIME$: MINS • INT (VAL (HID$ ( INJECT$, 4, 2))} 930 IF HINS>24 THEN 1040 ELSE IF HINS>l5 THEM 1010 ELSE IF HINS<l5 THEN 970 940 UM --------- HIMS • 15 ---------9SO MIDS(IJrlJECTS,4,2) • •oo· 9i0 QO?O 1100 970 UM -------- HINS < 1S ----------910 IF VAL (MIDI (INJECT$, 1, 2)) > 10 THEN HID$ ( INJECT$, 1, 2) • HID$ (STU (IHT ( (VAL (HID$ (INJECT$, 1, 2)) )-1)), 2, 2) ELSE MID$ (INJECT$, l, 2) • "0" +MIDS (STRS (INT ( (VAL (HIOS (INJE.CTS, 1, 2))) -1)), 2, 1} 990 HIOS ( INJECTS, 4, 2) • HID$ (STU ( IHT ( (VAL IHIDS (INJECTS, 4, 2))) +45) l, 2, 2 J 1000 GOTO 1100 1010 J.I.M --------- 24 > HIMS > 15 ie: ainql• digit ----------1020 MIDS (INJECT$, 4, 2) • .. 0 '"+HID$ (SU.$ ( INT ( (VAL (HID$ ( INJECTS, 4, 2))) -15)), 2, l) 1030 QO'?O 1100 1040 ll£M --------- MINS > 24 ----------1050 HIDS (INJr.CTS, 4, 2) • HIDS (STU ( INT( (VAL (HID$ ( INJECTS, 4, 2))) -15)), 2, 2) 1094 ll.M 1096 REM 1100 Jl.l.M ttftttftt s .. pl• Channel 1 -- Abaorba.noe Data free BPLC ttffttffff 1110 REM 1120 CRANH!.L-1: NOSM1PLS•O: LASTX•31: LASTY•256: ll.UNTIHE•O: BST0(0)-.006 1130 LX•lO: LY•321: EST•STlING.$(35,32): «;OSUB 20050 1140 LX•lO: LY•321: EST•'"Suipling ..... •: GO.SUB 20050 1150 STAJI.TIME • TIMEA 11S5 LX•30: LY•256 1156 CALL MO'VE(LX,Ll) 1160 NBILE RU1f'TIME <• 45 1110 OUT ,a102, 2 1173 OU'l' ,a702,CRAJfJrlE.L•,B10+3 1176 VAI.UE•(IJrlP(U70l)AMC '8F)•256+INP(,B700) 1110 JrlOSM1Pl.S • NOSNtPLS + 1 11'0 ABVAL • 260 - ( (CIMT(VALU!./16)) +4) 1200 Jt:UJl.ll'? IM!. • TIMEl 1210 JI.UNTIME • ( ( oruu.TIME-STllTIHE) /60) +15) 1215 Ir JI.CJITIM!. < BS'l'O(NOSN'IPLS-1) +.006 TBEJrl 1200 1220 PL'?Il1.E • ((CIN'?((RUN'?IHE-15) 1 20))+30) 1230 LX•PLTIME: LY-UVAL 1240 CALL DLillE(LX,LY) 1250 BSTO(MOIAMPLS) • JI.UW'l'IHE: ASTO(NOSAKPLS) • ABVAL 1260 LX•540: LY•l4l: TEHP$•STJ.$(1tUM"l'IME) l f.ST-LEr?.S (TEMP$, 10): GOSUB 20050 1270 LX•515: LY•328: EST•STJ.S(NOSAHPLS): GOSUB 20050 1210 LX•'21: LY•34: l.ST-'?IHr.S: GOSUI 200SO 1290 WEND 1214 UM 12'6 J.1.M 1300 J.1.M ffttttttttff Store Data in a Sequential File (•FILES) tttttfttffttf 1310 UM 1320 LX•lO: Lr•321: EST-Sff.INGS(l5,32): GOSUB 20050 1330 LX•lO: LY•321: £ST•·storinq Data ••••• ·: OOSUII 20050 1335 FILEDATAt • FILES-t".DAT" 1340 c::9'DI FILEDATM fO,. OUTPUT AS tl 1350 111..ITE fl, !.DATU, IJrlJECTS, NOSAMPLS, JCUJtRTIME, STAR.TIME 1360 ro• LOOP • 1 TO NOSAMPLS STEP 20 1310 110 • UTO (LOOP) 1371 AO • AITO (LOOP) 1312 Ill • HTO(LCXJP+l) 1373 Al • ASTO(LOOP+l) 1314 12 • UTO (LOOP+2) 1315 A2 • AITO (LOOP+2) 137, Bl • UTO (LOOP+3) 1317 Al • ASTO(LOOP+3) 1371 84 • UTO(LOOP+4) 1379 A4 • ASTO(l.OOP+4) 1310 115 • ISTO (LOOP+5) 1311 Al • ASTO (LOOP+S) 1312 16 • HTO(LOOP+6) 1313 A6 • MTO(LOOP+') 1314 11 • ISTO(LOOP+1) 1315 A.7 • AS'l'O(LOOP+7) 1316 II • HTO(LOOP+II 1311 Al • ASTO (LOOP+I) 1311 119 • HTO(LOOP+9) lllt A9 • ASTO(LOOP+9) 1390 B10 • ISTO(LOOP+lO) 1391 AlO • AITO(LOOP+lO) 13'2 Ill • ISTO(LOOP+ll) 13'3 All • A5TO(LOOP+ll) 13'4 1112 • BSTO(LOOP+l2) llt5 A.12 • U'?O(LOOP+12) llt6 Ill • IST0(I..OC9'+ll) 13t1 All • ASTO(LOOP+ll) 1391 114 • 1S'l'O(LOOP+l4)

Chromatographic software 173
1399 Al4 - ASTO(LCX:>P+l-4) 1400 815 • !ISTO(LOOP+lS) 1401 A.15 • ASTO{LOOP+lS) 1402 BU • BSTO{LOOP+lfi) 1403 Alfi • ASTO(LOOP+l6) 1-404 817 • BSTO(LOOP+l7) UIOS Al7 • .UTO(LOOP-+17) 1406 Bll • B!TO(LOOP+ll) 1407 All • .UTO(LOOP+l8) 1408 819 • 8STO(LOOP+l 9} 1409 A.19 • A!ITO(LOOP-+19) 1410 NRITZ fl, 80,AO, Bl ,Al, 82 ,A.2, Bl,AJ, B4,A4, 85,A.5, 86, A6, Bl ,A7, BB, AB, B9,
A9, !HO, Al 0, Bl l, Al 1,812, Al 2, Bl 3, Al 3, 81<1, Al 4,815, A.15, Bl 6, Al 6, Bl 1, Al 7, Bll,Alt,819,AU
1420 NEXT LOOP 1430 CLOSE 1600 LX-30: LY•J28: r.ST•SU.INGS (20, 32): GOSUB 20050 1605 :.X•4: LY•343: EST•STIUNGS(79,32l: GOSUB 20050 1610 LlC•18: LY•328: EST•"R.aw data 1• stored, do you wiah to continue ...
Manual Inteqrat1on (y/nl 1•: GOSUB 20050 1615 BEEP 1620 0$•1NXEY$: IF Q$-•• THEN 1620 1630 IF as • ·y" OR as • "y" THEN 1700 1640 IF OS • "N" OR QS • "n" THEN 5020 1650 SOUND 40,10: GG!O 1620 1694 UH 1696 llM 1700 UH fttftttftftfflttftfffff Manual Integration fttftfttttftftfltttttttt l 710 UH 1720 LX•l8: 1Y•328: EST•STR.ING$ (74, 32): GOSUB 20050 1730 LX•lO: LY-0 1 HO CALL MOVE(LX,LY) 1750 LX•lO: LY•259 1760 CALL OLINE (LX, LY) 1770 LINTS-2 1780 CALL LEVEL (LINTS) 1890 posx-10: NUMSTRTS-0: NUMENDS-0 1894 PLTI'Df • CINT( ((BSTO(l0)-15) •20) +30) 1896 PLTtND • CINT( ((BSTO(NOSAHPLS-10)-15) •20)+30) 1900 SAMPOINT - CDBL 1 (NOSAHPLS-20) / (PLTEND-PL'M'EN)) 1910 GOSUB 10130 1930 llEM ----------------------- Input Control Co111111and ---------------------1940 IHOVE.S - INJl:EY.$: IF IHOVE$ - "" THEN 1940 1942 IT LEH(IMOVE$)>1 AND IHOVE$-CHRS(O)+"H" THEN HOVE-28: GOTO 1980 1943 IF LEM(IMOVES)>l AND IH0VE$-CBR$(O)+"JC• THEM HOVE•29: GOTO 1980 1945 MOVE-A.SC (IMOVE.S) 1950 IF HOVE< 52 THEN 1940 1960 IF HOVE < 55 TfiEN 1980 1970 IF HOYT.>6S ANO POSX>29 AJilO POSX<631 THEM 2070 ELSE SOUND 40,10:
GOTO 1940 1910 Rl.H --------------------------- Hov• cur1or --------------------------1990 IF MOVE • 28 THEN POSX2•P0SX+l: GOTO 2000 1992 IF MOVE • 54 THEN P0SX2•POSX+l0: GOTO 2000 1994 IT MOVE • 29 THEN P0SX2•P0SX- l: 00'1'0 2000 1996 IF MOVE - 52 TBEN P0SX2•POSX-l0: GC11'0 2000 1991 SOUMO 40, 10: GOO'O 1940 2000 IF POSX2<10 THEN BllP: POSX2-10 2002 IF POSX2>640 TBEN BEEP: P0SX2•640 2004 LX•POIX: LY•O 2006 CALL MOV't(LX,LY) 2001 LX-POSX: 1'!•259 2010 CALL OLINE (LX, LY) 2012 LX-POSX2: LY-259 2014 CALL MOVE(LX,LY) 2016 LX•POSX2: LY-0 2011 CALL OLINE (LX, LY) 2020 POSX-POSX2 2030 00'1'0 1940 2040 llM ---------- Int•gration control Co1Mand1 ·---------20SO Rl.M 2060 kDI --------------------------- P .. k Start ---------------------------2010 IF HOV'.£• 13 OR HOVt • 115 TBEM SOUND S23.2S,.5 ELSE 2230 2010 J..Oal' • CINT( (POSl:-35) •SAMPOINT) 2090 IF LOOP < l THEN LOOP • 1 2100 IF LOOP > NOSAHPLS TR.EN LOOP • NOSAMPLS 2110 LOWPOUf'?-0: FLAGS-'"FilS'?" 2120 CCMPX • CIN'T((BSTO(LOOP)-15) •20)+30 2130 N8ILE CCMPX <• POSX 21'0 IF COMPX < POSX '?BEN 2110 2150 IF FLAGt-'"FIRS'?" THEN NlMSTrrS-NUMSnTS+l: PJl:START(O,NUMS'n.TS)•J..Oal':
rLAG.S•"NO" 2160 PIUITAllT(l,N~STlTS)•LOOP 2110 Ir ASTO(LOOP) > LCIIPOINT TBD LClfPOilfT • ASTO(LOOP) 2110 LOOP • LOOP + 1 2190 CaffX • CIWT( (BSTO(LOOP)-15) •20) +30 2200 WEIIO 2210 LX-POSX: LT•LOIIPOIN'T+l 2211 CALL MCJVE (LX, LY) 2212 LX•POSX: LY•LOIIPOINT+ll 2213 CALL OLIO (LX, LT) 2214 LX-PClaX+41 L'!•LOIIPOIW'?+ll 221S CALL DLIR(LX,LT) 221' QO'!O 1'40 2220 ICM ---------------- Peak End ----------------------------2230 IF NOVI,• H 01. flCl'YI • 101 TH!.11 SOUIID S23.2S, .S ELSE 2390 2240 LOOP • cnrrc CPOIX-25) •SAMPOUI'?) 22SO IF l.OOf > aoaANPLI TB!.N LOOP • NOI.MIPLS 2260 IF LOOf C l TUii' L<X>P • l 2270 LOIIPOIIIT-G I F'LAG,_"FIIS'T" 2210 ca9X • Cill'!'((U'l'O(LCX>P)-15) •20)+30 2290 IIIIILZ cxwx >- ,oax 2300 IF aJMPX > POaX TB!.W 2340 2310 Ir FI.AQ,-·,nrr- TllDI Nt»IIJIDI-W~DS+l: PJ(DfO(O,NUMEHDS)•LOOP:
rLM.t-·ao· 2320 PXEIID(l,Xt»UIIOS)•LOOP 2330 IF Al'l'O(LCX>P) > LOIIPOilllT THO LOIIPOINT • ASTO(LOOP) 2340 LOOP • LOOP - l 23SO Cc>IPX • CllfT( (BSTO(LOOP)-15) •20) +30 2360 MENO 2310 LX-POSX: LT•L0ta0Il1T+l 2311 CALL MO'l/t(LX,LY) 2312 LX•POIX: LT•LOIIP0Ilf'?+ll 2313 CALL OLINE (LX, LY) 2314 LX•POSX-4: LY-LOWPOIN'T+ll 2315 CALL DLIXE (LX, LY) 2316 00?0 lt40 2310 R!.M -------------------- c1 .. r Entry -------------------------2Jt0 IF MOVI. <> 61 MD MOYE <> H THEN 2740 2400 CAJICll-0 i LOIIPOill'T-0 2410 IF N~STrrs < l THEN 2510 2420 roa LOOP • l TO NUMSUTS 2430 CQtPX • CINT((BSTO(PKSTAAT(O,LOOP))-15)•20)+30 2440 IF COMPX • POIX TUN CAIICI.L - LOOP 24SO NEXT LOOP 2460 Ir CANaL < 1 ?II.Elf 2510 2410 FOi LOOP • PJtSTAJ:"?(0,CANaL) TO PKSTAJ.T(l,CAHCEL) 2410 IF AS'l'O(LOOP) > LOll1'0IlfT Till.JI LOIIPOINT • ASTO(LOOP) 2 4 90 NEXT LOOP 2SOO SOUND soc, .S: SOUND 32167,1: sanro 600,.S 2Sl0 LX•POSX: LT•LOIIPOill'?+l 2Sll CALL HOV'.E(LX,LY)
2512 LX•POSX: LY-LOWPOINT+ll 2513 CALL OLINE (LX, LY) 2514 LX•POSX+4: LY•LOWPOIMT+l l 251S CALL OLIN!. (LX, LY) 2520 f'OR LOOP • CANCEL TO NUHSTRTS-1 2530 PKSTAJ.T(O,LOOP) - PKSTAJ.T(O,LOOP+l) 2540 PKSTART(l,LOOP) • PKSTART(l,LOOP+l) 2550 NEXT LOOP 2560 NUHSTllTS • NUMSTRTS - 1: GOTO 1940 2570 IF NUMSTRTS <l A.HO NUMENDS<l TB.EN SOCJNO 40, 10: GOTO 1940 2580 FOR LOOP • l TO NOMI.NOS 2590 C04PX • CINT((BSTO(PJl:ENO(O,LOOP)J-15)•20)+30 2600 IF CCMPX • POSX THEN CAHCEL • LOOP 2610 N!.X"l' LOOP 2620 IF CANCEL< l THEN SOUND 40, 10: GOTO 1940 2630 F'OR LOOP• PKENO(l,CANCEL) TO PKEND(O,CANCEL} 2 64 0 IF ASTO (LOOP) > LONPO INT THtN LONPO INT • A..51'0 (LOOP) 2 650 N!.X"l' LOOP 2660 SOUND 500, .S: SOUND 32167, 1: SOUND 600, .S 2610 LX-POSX: LY•LOWPOINT+l 2611 CA.LL HOVE(LX,LY) 2672 LX-POSX: LY•LOWPOINT+ll 2673 CA.LL OLINE (LX, L't) 2674 LX•POSX-4: LY-LOWPOIN'?+ll 2 67 S CALL OLINE (LX, LY) 2 680 FOR J..Oal' • CANCEL TO NUHENDS-1 2690 PKl.ND(O,LOOP) • PKt.ND(O,LOOP+l) 2700 P!CENO(l,LOOP) - P!(END(l,LOOP+l) 2110 NEXT LOOP 2720 NUHENDS • NUHENDS - l: GC11'0 1940 2730 ll£M ------------------------- Redo Fron:i Start -------------------------2740 IF HOVE <> 82 AND !Clvt <> 114 THEN 2840 2150 BEEP: LINTS-1 2751 CALL LEV!.L (LINTS) 21S2 LX•4: LY-328: EST-STRINGS(19,32): GOSUB 20050 2153 LX-4: LY•JU: EST•STRINGS (19, 32): GOSUB 20050 2154 LX•lO: LY-321: !.ST•"bdo Froa Start •• , •• '": GOSUB 20050 21SS LX•227: LY•3U: EST•"CClilFIRM SELECT I Oil (y/n) '": GOSUB 20050 2760 OS • INJC:EYS: IF QS • •• THEN 2160 2770 IF Q$ • •y• OR QS - •y- THEN 2190 2180 GOSUB 10130: GOTO 1940 2 790 CALL CLJ.SCR 2791 LX•30: LY•O: GOSUB 20010 2792 LX•30: LY•260: GOSUB 20030 2193 LX•630: LY•260: GOSUB 20030 2794 FOR HAlU{ • 256 TO O STEP -10 219S LX-30: LY.........UJc:: GOSUB 20010 2796 LX-25: LY-MA.al(: GOSUB 20030 2197 NEXT MAllJc: 2798 FOll MAU • 30 TO 630 STEP 20 2'799 LX.........a.K: LY•260: QOSUB 20010 2800 LX-+I.U.k: LY-265: OOSUB 20030 2101 NEXT MAit.i( 2102 ro, MAM • JO TO 630 STEP 100 2103 LX.........a.K: LY•265: QOSUB 20010 2104 LX-+I.U.k: LY•210: QOSUB 20030 210S NEXT MAit.Jc: 2106 FOR MAM • 30 TO 630 STEP 200 2107 LX.........a.K: LY•270: 00SU8 20010 2101 LX-MAM: LY•275: QOSUB 20030 2109 NEXT MA.all: 2810 LX•21: LY•291: EST-"15'": QOSUB 200SO 2111 LX•l21: LY•291: EST-'"20": QOSUB 200SO 2112 LX•221: LY•291: EST-'"2S": OOSUB 20050 2813 LX•321: LY-291: EST-'"30": QOSUB 200SO 2114 LX-421: LY•291: EST-"35": QOSUB 20050 211S LX•521: LY-291: EST-"40": QOSUB 200SO 2116 LX•621: LY•291: EST-"45•: GOSUB 200SO 2111 LX-211: LY•30S: EST-"TIHt (aina) "': GOSUB 200SO 2111 LX•((CINT((BSTO(l)-15)'20))+30): L'!•ASTO(l) 2119 CALL PLOT(LX,LY) 2120 CALL MOY'!.(LX,LYl 2121 ro, LOOP • 2 TO MOSAMPLS 2822 LX-( (CINT ( (BSTO(LOOP)-15) •20)) +30): LY•ASTO(LOOP) 2123 CALL DLINE(LX,LY) 2124 NEXT LOOP 212S 00'?0 1700 2130 ll£M --------------------- Quit Int*ir&tion ------------------------2140 IF MOVE <> 11 MIO M0Vt <> 113 THEN 2900 21SO BEEP: LINTS•l 2151 CALL LEV!.L(LIJrfTS) 2152 LX•4: LY•321: EST-STUNGS(19,32): 005011 20050 2153 LX-4: LY•3U: l.ST-STUJ«.S (19, 32) : OOSUB 20050 2154 LX•30: LY-321: EST•"Quit ••••• •: GOSUII 20050 2155 LX-221: LY-3431 EST-"CCIIIFIIIM SELECTICIII (y/n)": came 20050 2160 Qt • INKEYS: IF 0, • •• THEN 2160 2170 IF Qt<>"y'" AND Q$<>"Y" THEN 2110 2172 CALL CLJ.ICR 217 4 CALL '?MOOE 2116 l.Ulf '"A:BPLC" 2110 QOSUB lOll01 c;cro 1940
2190 llM -----------· Proce•• Data -------------· 2900 IF MCJVt <> 10 AND MOYE <> 112 THEN SOOND 40, 10: GOTO 1940 2910 B!.t.P: LIM'?S•l 2911 CALL LEVEL (LINTS) 2912 LX-4: LY•3211 EST-STlINGt (79, 32): QOSUB 200SO 2913 LX-4: LY•l4l: EST-STlINGS (79, 32) : oosua 200SO 2914 LX•l01 LY-321: tS"?•"Proca••· •••• ": GOSUI 20050 2tlS LX•221: LY•JO: EST-"CCIIIFIJIM SE.LECTICIII (y/n)": GOSUII 200SO 2920 0, • INJtlTf: IF Qt • •• TBEN 2920 2930 IF QI • "y• ca Qt • •y'" TBDI 2950 2940 QOSUI 10130: QO?O U40 2950 LX-4: LT•321: UT-STUNc.$(79,32): QOSUI 20050 2955 LX-4: L'!•l01 EST-STRINGS(19,32): QOSUB 200SO 2960 IF NUMSTITS - NUM!IIDS ?BEN 3030 2910 B!.U: IF Nll4STA1'S>NUME1fDS THD 2910 2915 LX•ll7: LY•J21: UT-"lftl"IBEl OF P!.Alt STARTS< NUMBER OF Pt.Al{ ENOS'":
QOSUB 200SO 2,11 00'?0 29'0 2910 LX•ll1: LY•l21: UT--W~ER Of' pr.Al( STARTS > NUMBE• OF PEA.Jt ENDS'":
QOSUI 20050 2990 LX•l9$1 L'!•l4l: u-r-·Pni•• any key to continue ••••• •: OOSUI 20050 3000 Ir INKtTt••• TU• 3000 3010 OOSUI 10130: Qare 1'40 3020 1.1'.M -------------------- Bu:tiol• Sort ---------------------------3030 UK 3040 c.BECJI: • l 3050 DILE car.cs: JOiO CBECJI: • 0 3010 roa. LOOP - 1 TO N1MSTJtTS-l 3010 IF BSTO(PKS'l'.UT(O,LOOP)) <- ISTO(PltSTAlT(O,LOOP+l)) THEN 3120 JOtO SIIAP PltSTAlT(O,LOOPI ,PICS'?'AlT(O,LOOP+l) 3100 SIIAP PUTll'l'(l,LOOP),PKITAlT(l,LOOP+l) 3110 CUCJI: - l 3120 NU'T LCX'I'
3130 11ZWO 3140 CBI.CS: • 1 3150 DILE CHI.CK 3UO cno: • o 3110 Fta LOOP • 1 TO NtMDIDS-1 1110 IF ISTO(PJ(!JID10,LCX>P)) <• BSTO(Pltt.NC(O,LOOP+l)) THEN 3220

Chromatographic software 174
3190 SWAP P!CElfD(O,LOOP) ,PXF.NO(O,LCX)P•ll 3200 SWM PK?NO(l,LOOP) ,PKEND(l,LOOHl) 3210 CBECJI: - 1 3220 MtX'l' I.,OC:. 3230 WElfD 3240 REM --------------------- Confira Order ----------------------------3250 roJt. LOOP • l TO NUMSTJ.TS 3260 IF PKSTART(O,LOOP) <• PJCE.ND(O,LOOP) THEN 3280 3270 CHECK • CB.ECK + 1 3 280 NIX'? LOOP 3290 If CHECK < 1 THEN 3360 3300 LX•4: LY•321: £ST-STUNG$ (H, 32): GOSUB 20050 3310 81:EP: LX-11: LY•321: tST•"PEAX STARTS AND PEAX ENDS ARE NOT IN THE
COPJlECT ca.Ctr: OOSUB 20050 3320 LX•l95: LY•343: EST•"Pr•u any key to continue .•... ": GOSUB 20050 3330 IF INXEYS•"" THEN 3330 3340 GOSUB 10130: GOTO 1940 3 35 O Rr.M -------------------------- I nteqrat ion ----------------------------3360 LX•4: LY•328: EST•STRING$ (H, 32): GOSUB 20050 3364 LX•l45: LY-328: EST•"Calculating ar•a for peak TIUll'lbsr": GOSUB 20050 3366 LX-4D: LY-328: EST•"of"+STllS(NUHSTllTS): GOSUB 20050 3380 LINTS-2 3381 CALL !.tVI.L(LINTS) 3382 LX-POSX: LY-0 3383 CALL MOVE(LX,LY) 33U LX•POSX: LY•259 3385 CALL OLINE (LX, LY) 3386 LINTS•l 3387 CALL LEVEL(LINTS) 3390 FOil LOOPl "' 1 TO NUMSTRTS 3400 LX•435: LY•328: EST•ST11.$(LOOP1) 3405 CALL Tt.X'TB (LX, LY, EST) 3410 RD1 ----------------- B•••lin• (LSllL) c ... lculation• ------------------3420 DSUMX-0: DSUHY•O: DXY-0: OXSQ-0: 8IG8P0INT•675: FLAGS•"NO" 3430 DXHF.AJl•O: DYMEAH•O: DLXY•O: DLXS0-0: LOWPOINT-0 3440 FOR LOOP2 • PIC!TAJlT(O,LOOPl) TO PKSTAllT(l,LOOPl) 3450 OSUMX • OSUMX + BST0(LOOP2) 3460 DSUHY • OSUHY + ASTO(LOOP2) 3470 DXY • DXY + BSTO (LOOP2) •ASTO (LOOP2) 3480 DXS0 • OXSO + 8STO(LOOP2) "2 3490 If ASTO(LOOP2) > LC*POINT THEN LC*POINT "' ASTO(LOOP2) 3500 NEXT LOOP2 3510 PTSTllT • ((CIHT((8STO(PXSTAltT(0,LOOP1))-l5)•20))+30) 3520 LINTS•2 3522 CALL LEVEL(LIN'rS} 3523 LX•PTSTJlT: LY•LONPOINT+ 1 3524 CALL MOVE (LX, LY) 3525 LX•PT!TllT: LY•LON'POINT+ll 3526 CALL DLINE(LX,LY) 3527 LX•PTSTRT+4: LY•LONPOINT+ll 3528 CALL DLINE(LX,LY) 3530 LON'"POINT • 0 3540 Foa LOOP] • PXENO(l,LOOPl) TO Pl(I:NO(O,LOOPl) 3550 OSUMX • OSUMX + BSTO (LOOP3) 3560 D!UMY - OSUMY + ASTO(LOOP3) 3570 OXY • DXY + BSTO(LOOP3) *A!TO(LOOP3) 3510 DXSQ • OXSQ + BSTO (LOOP)) "2 3590 IF .UTO(LOOPJ) > LOWPOINT TBE'N LONPOINT • ASTO(LOOP3) 3600 NEXT LCX)PJ 3610 PTENO • ( (CINT( (BSTO(PKEND(O, LOOPl) )-15) *20)) +JO) 3620 LX•PTENO: LY•LONPOIN'?+l 3622 CALL MOVE (LX, LY) 3623 LX•PTEND: LY•LOICPOIN'r+l l 3624 CALL DLINE(LX,LY) 3625 LX•PTEND-4: LY•LONPOIN'?+l l 3626 CALL OLINE(LX,LY) 3 62 7 L INTS•l 3621 CALL LEV!.L(LIN'?S) 3 630 N•PKSTAJ.T ( 1, LOOPl )-PkSTAJtT (0, LOOP 1) +PJCEND (0, LOOPl )-n:tHD ( 1, LOOP 1) +2 3640 OXHF.AJI • DSUMX/N: DYMrAN • DSUMY/N 3650 DLXY•DXY-(DSUMX•DSUKY/N): DLXSQ-()XSQ-( (DSUMX"2) /M): SLOPE-OLXY/DLXSQ 3660 RDII ------------ calculate ArN , Retention Tim• --------------3670 FC.. LOOP4 • PltS'?AJ.T(O,LOOPl) TO Pl(I:ND(O,LOOPl)-1 3690 DBASL - DYM!.Nf+StoPE• (BSTO(LOOP4)-DXHEAN) 3700 DBASl • OYMI'.AH+SLOPE*(BSTO(LOOPHl)-DXMEAN) 3710 DUPlSID • US(ASTO(LOOP4)-ASTO(LOOP4+1)} 3720 OLIO.SID • US (DBASL-DIASR) 3730 IF A.S'TO(I..CX:.4)<ASTO(LCXIP4+1) TUN DTD4PY1•ASTO(LOOP4+l) ELSE
DTD4PYl•ASTO (LOOP4) 3740 3750
3760 3770 3710 3790 3100 3110 3120 3830 3140 JISO 3160 3170 3190 3900 3910
3920 3121 3922 3923 3924 392~ 3926 3927 3921 3929 3930 3931 3932 3933 3934 3935 3936 3937 3931 39]9 3940 3941 3942 3943 3944 3945 3946 3947 3941 3949 3950 3951 3952
IF DBASL>DBA.Sl '?8!.H DTD1PY2•DIA!l ELSE OTEMPY2-0BASL DPKAJ.EA(LCXIP 1) -OPJt.Ur.A(LOOPl) + ( (BSTO ILOOP4 +l )-BSTO (LOOP4)) • (I. 5•ou, .. SID) + ( .5 *DLIIUID) +0T1'.MPY2-DT1'.MPY1)) IF ASTO(LOOPO>•BIC.JIPOIHT ?REX 3710 DSD.TJ\T-&STO(LOOP4) t 8IGBPOIN'l'-ASTO(LOOP4): FL.IIG$•·ENO" IF AS'?O(UX:.4)•RIGBP0IN'? 01 FLM.S<>"!lfD" TREN 3100 DEHOlt'l'•ISTO(LOOP4-l): n.AGS•-itO"
NEXT UX:.4 DPKIT (LOOPl) • Olliff.ff?+ ( (OENDltT-DS'?RTRT) /2) ll'.M ----------- Print a.tention '?1-• on scr-n --------------IS • STJ.4 (OPD.'r (LOOP!)) P'?X • CflT((DPO'?IL<X>Pl)-lS)•20)+21 IF IIQI..POIII'! < 27 ?HZ• P'?Y • 27 ELSE PTY • HIGHPOINT Fca LOOPS • 2 TO ,
IF N1Dt(H,LOOP5,l} • •.• TBD PTY•PTY-3: GOTO 3920 CU&IC'fta • Vll(MIDt(U,LOOPS, U)+l P"f'T•rrt-, CII Ca&ACTD. QOTO l'2l,3932,39ll,3947,3960,J966,3977,3918, JIM,4001 LX_.TX+l1 l.1'•PTY1 QOSOI 20010 LX-fTX+51 LT.PTT: QOIUI 20030 QO'l"O 4030 LX.PTX+l I LT-PTY1 QOIOI 20010 LX-PTXUI LT.PTT: QOIUI 20030 LX..PTX+,1 LT-PTY+l I QOIOI 20030 LX•PTX+,1 LT-PTY+:Z I QOIUB 20030 LX•PTX+5t LY•PTY+)t QOSUB 20030 LX•PTX+l I LT•PTY+31 QOIUB 20030 LX•PTXt LY-PTT+2: CX>IUB 20030 LX:•PTX: LY•PTT+l I QOSUI 20030 QOTO 4030 LX•PTX+6: LY•PTY+J: QOIUI 20010 LX•PTX+6: LY•PTY1 QOIDI 20030 LX•PTX+51 LY•PTY+l: OOSUB 20030 LX•PTX1 LY-PTY+l I CX>SUI 20030 LX•PTX+2 l LY•PT'!+J: OOSUB 20030 CilOTO 4030 LX•PTX+i I LY•PT'!: CX>SOB 20010 LX•PTX+i: LT•PTY+l I QOIUB 20030 LX•PTX+51 LY•PT'!+J I QOIUI 20030 LX•PTX+2: LY•PTT: QOSUI 20030 LX•PTX+l: LY•PTY: QOSUI 20030 LX•PTX: LY•PTY+l: QOSOB 20030 LX•PTX: LY•PTY+2: OOSUI 20030 LX•PTX+l: LY•PTY+31 QOSUI 20030 CilOTO 4030 LX•PTX+l: LY•PTY+31 OOSUI 20010 LX•PTX: LT•PT'!+2: QOSUI 20030 LX•PTX: LY•PT'!+l: QOSOI 20030 LX•PTX+l: LY.PTT: OOSUI 20030 LX.PTX+2: LY•PTY: QOSUB 20030 LX•P'?X+J: LY•PTT+l: QOSUI 20030
3953 LX•PTX+3: LY•PTY+2: GOSUB 20030 3954 LX•PTX+4: LY•PTY: OOSUB 20010 3955 LX•PTX+5: LY•PTY: GOSUB 20030 3956 LX•PTX+6: LY-PTY+l: GOSUB 20030 3951 LX•PTX+6: LY•PTY+2: GOSUB 20030 3958 LX•PTX+5: LY•PTY+3: GOSUB 20030 3959 GOTO 4030 3960 LX•PTX+l: LY•PTY+3: GOSUB 20010 3961 LX•PTX+4: LY•PTY+3: GOSUB 20030 3962 LX•PTX+4: LY•PTY: GOSUB 20030 3963 LX•PTX+6: LY•PTY+l: GOSUB 20010 3964 LX•PTX: LY•PTY+l: GOSUB 20030 3965 GOTO 4030 3966 LX•PTX: LY•PTY: GOSUB 20010 3967 LX•PTX: LY•PTY+3: GOSUB 20030 3968 LX•PTX+2: LY•PTY+3: GOSUB 20030 3969 LlC•PTX+2: LY•PTY+l: GOSUB 20030 3970 LlC•PTX+3: LY•PTY: GOSOB 20030 3971 LX•PTX+5: LY•PTY: GOSUB 20030 3972 LX•PTX+6: LY•PTY+l: G0SU8 20030 3113 LX•PTX+6: LY•PTY+2: GOSUB 20030 3974 LX•PTX+5: LY•PTY+3: GOSUB 20030 3975 LX•PTX+4: LY•PTY+3: GOSUB 20030 3 916 001'0 4030 397"1 LX•PTX+l: LY•PTY: GOSUB 20010 3978 LX•PTX: LY•PTY+l: GOSUB 20030 3979 LlC•PTX+2: LY•PTY+3: GOSUB 20030 3 980 LX•PTX+5: LY•PTY+3: GOSUB 20030 3911 LX•PTX+6: LY•PTY+2: GOSUB 20030 3912 LX•PTX+6: LY•PTY+l: GOSUB 20030 3 983 LX•PTX+5: LY•PTT: GOSUB 20030 3984 LX•PTX+4: LY•PTY: GOSUB 20030 3915 LX•PTX+3: LY•PTY+l: GOSUB 20030 3916 LX•PTX+3: LY•PTY+2: GOSUB 20030 3917 GOTO 4030 3911 LX•PTX: LY•PTY+3: GOSUI 20010 3 919 LX•PTX: LY•PTY: GOSUB 20030 3990 LX•PTX+2: LY•PTY: GOSUB 20030 3991 LX•PTX+5: LY•PTY+3: GOSUB 20030 3992 LX•PTX+6: LY•PTY+3: GOSUB 20030 3993 GOTO 4030 3994 LlC•PTX+2: LY•PTY+3: OOSUB 20010 3995 LX•PTX+l: LY•PTY+3: GOSUB 20030 3996 LX•PTX: LY•PTY+2: GOSUB 20030 3997 LX•PTX: LY•PTY+l: GOSUB 20030 3991 LX•PTX+l: LY•PTY; GOSUB 20030 3999 LX•PTX+2: LY•PTT: GOSUB 20030 4000 LX•PTX+3: LY•PTY+l: OOSUB 20030 4001 LX•PTJC+3: LY•PTY+2: GOSUB 20030 4002 LX•PTX+4: LY•PTT+3: OOSUB 20030 4003 LX•PTX+5: LY•PTY+3: GOSUB 20030 4004 LX•PTX+6: LY•PTT+2: GOSUI 20030 4005 LX•PTX+6: LY•PTT+l: GOSUB 20030 4006 LX•PTX+5: LY•PTT: OOSUI 20030 4007 LX•PTX+4: LY•PTT I GOSUI 20030 4001 00'1'0 4030 4009 LX•PTX-+i: LY•PTY+2: GOSUB 20010 4010 LX•PTX+4: LY•PTY: OOSUI 20030 4011 LX•PTX+l: LY•PTT: OOSUB 20030 4012 LX•PTX: LY•PTY+l: GOSUB 20030 4013 LX•PTX: LY•PTY+2: QOSUB 20030 4014 LX•PTX+l: LY•PTY+3: GOSUB 20030 4015 LX•PTX+2: LY•PTY+J: GOSUB 20030 4016 LX•PTX+3: LY•PTY+2: GOSUI 20030 4017 LX•PTX+J: LY•PTY+l: GOSUI 20030 4030 Nl.XT LOOPS 4040 NEXT LOOPl 4100 ll!.M ------------------- Print Ba.rdcopy of Chranatogra/11 ---------------4110 LX-t: LY•l21: EST-STUNCS(79,32): GOSUI 20050 4112 LX-t: LY•l43: £ST-STRING$(79,32): OOSUB 20050 4114 LX:•619: LY•l7: EST-STI.INGS:(10,32): GOSUI 20050 4116 LX•621: LT•J4: EST-ST1.ING$ (I, 32) : GO.SUI 20050 4111 BEU: LX•96: LY•321: EST•"Pr••• <(ah1ft] PrtSc-1> when thil meuage
diuapNU": QOSUB 20050 4120 LX•l95: LY•343: EST•"Pr•H any key to cont1nu• ..... ~: GOSUB 20050 4130 IF IMKEYS • •• TBEN 4130 4140 LX-t: LY•Hl: EST-STI.INGS (79, 32) : QOSUB 20050 4150 FOR LOOP • 1 TO 5000: NEXT LOOP 41'0 BEEP: LX-t: LY•321: EST-STJUNGS(79,]2): GOSUB 20050 4170 IF INltlTt • ... TBEII 4170
4110 ll!.M ---- Quant1tat1on --------------4190 llM 4200 J.l.H ------ lNd Standard Curv. Pa.r-etera frOfll A:STANDAJtDS .DAT ------4210 LX-30: L't•J21: EST•"Loadinq Standard Curve Data, Pl•••• N&it ••.
COSOB 20050 4210 OPEN •A:STIIDRDS.DAT" .U f2 LEN • 35 4240 FillD fZ, 2 AS EXUMl'l'OSS, 10 .U WAITS, 23 AS EOUMMYS 4250 QE'? 12, l 4260 NUMS'l'OS • CVI (ENll'ISTDSS): ES'?OATU - E0AIT$ 4210 FIELD t:z,I AS ti.TS, I AS XMr.M$, I AS !MF.ANS, 8 AS £SLOPES, 3 A5 ENAHES 4290 FOR L()C:» • l TO NUMS'?OS 4300 GE? U. LCX»+l 4310 STOit'? (LOOP) • CVD IERTS) 4320 S?OXM!.M(LOOP) • CVD0CMF.AN$) 4330 S'?O!Ml.All(LOOP) • CVD(YMUJIS) 4340 STOSLC.E(LOOP) • CVD(ESLOPES) 4350 ESTDN11H$(LOOP) - ENAMU 4360 NEX'l' LOOP 4370 CLO!ll 4310 u:M ---------------- Ccapan J.•t•nt1on Till•• --------------------4310 LX-t: LY'•l21: &ST-STRING$ (71, 32) : QOSUB 20050 4400 LX•30: LY•321: ES'?•"PlN- wait ••••• •: QOSUB 20050 4410 roa L()C:»l - 1 '?O 11~nns 4420 If DPD?(LOOPl) < 34 ?BP UNQE • , 625 ELSE RANGE • .5 4430 car.a: • 0: LOOP2 • 1 4440 NBILI. CBECJC < 1 4450 IF S'l'01tT(LOOP2)<(DPXltT(L00Pl)-RAHG!.) Cl
STDaT(LOOP2)>(DPDT(LOOPl) +RANGE) TBEH 4490 4460 CBECIC • 1 4470 UIOIAM8 (LOOPl) • ESTDN»IS (100P2) 4410 DPUMT (LOOPl )•STDTMP.AN (LOOP2) + (S'l'OSLOPE (LOOP2) • (OPD.P.EA(LOOP 1) -
S'?DXMUII (LOOP2 I) I 4490 LOOP2 • L()C:»2 + 1 4500 IF LOOP2 > Nta4STDS AIID CBI.CJ{ < l TBEN car.cit • 2 USE 4530 4510 EPKNAHa(LOOPl) - "???• 4520 DPDMT(LOOPl) • 0 4530 Wl'.IID 4540 lflXT LOOPl 4550 llM ------------ Sten QuantitatN Data ---------------------4510 FILEOJMT$ • FILU + • ,QN'r 4590 OPEN FILEQUAIITt AS fl UN•27 4600 FIELD fl, 2 AS ENUMSD.Tsa, 10 AS £STDT$, l AS FLAG$, 12 .U E0Up,f,4Y$ 4610 LSET ENmaTI.TSa • MKU {Nll'ISTR'?S) 4620 LSE'T ES'?D'U • UTOATU 4625 LSE'T FLM.I • "YES" 46.JO un !.D0"4Ya • • 4640 PUT tl, 1 4650 Flr.I.O fl, 3 AS EMN1Et, I 1J UD'?S, I AS EPXAlEAS, I AS EPMMT$ 4 660 roa LOC:. • l TO NUMSff'?S 4 no LH'? ZNIIMU • EPJOIAMI (LOOP) 4610 LH.T EPDTI • KKDt(DPDT(LOOPII

Chromatographic software 175
4690 LStT EPJCAllAS • MXD$(DPICAJ.EA(LOOP)) 4700 LSI.T !.PDM'U • Mlit:OS (DPJC»f'l'(LOCIP)) 4710 Ptn fl, LOOP+l 4 72 C NEXT LOOP 4730 CLOSE 4740 UM --------------------- Printout Qu&ntitated. Data -------------------4750 LX•<I: LY•321: IST-ST1lINGS ('79, 32): GOSUB 20050 4755 LX-4: LY•Hl: EST-STJ.INGS('19,32): OOSUB 20050 4760 LX•240 ! LY•J21: [ST•"Check Printer Sta.tu•": GOSUB 20050 4710 LX•l95: LY•)Ul EST-"Pn•• any key to oontinue .•.. ,": GOSUB 20050 4780 If IHXEY$ • "" THEN 4180 4790 OPEN "LPTl:" AS f3 4800 NI0T8 f],10 -4810 PRINT fl, CB.k$(27);CHJ.Sf13):C8Jl$(2): PRINT fl, CB.JU(l3);CB:ll$(10) 4820 PRINT fl, TAB(l);"FILEI ";FILI$:TAB(34);"INJECTION TIME!
INJr.CTS;TAB(64);EDATtS: PUNT 13, CBR$(13);CRR$(10) 4830 PUNT fl, TAB(]) ;STRING$ P6, 205) 4840 PRINT 13, TAB(5);"Peak No.";TABl20);"Peak Name";TAB(34);
"Retention Time'"; TAB(55);'"Area'";TAB(70);'"Alllount• 4850 PRINT f3, TAB(3);STRINGS(76,l96) 4860 FOMAT1$ ft 4870 FOMAT2S • •\ - - - - - \ - - - - - - - - - - - - -
4880 FOMAT3$ • '"tf,ftt fff.ttttff fftt.ffff'" 4890 FOR U>OP - 1 TO NuMsTR.Ts- - - - - - - - - - -4900 PRINT f3, USING FORMATlS;LOOP; 4910 PRINT t3, USING FOR.MAT2S;EPKNAMS(LOOP); 4 920 PRINT t3, USING FORMAT3$; DPPCR.T (LOOP l; DPKAJ\EA(LOOP); DPXAH'l' (LOOP) 4930 NEX'? LOOP 4940 PRINT 13, TAB(3);STJ.UIG$(76,205) 4950 PRINT tJ, TAB(7) ;'"Qua.nt1tated data extrapolated fra11 standards recorded
on: "; £STOAT!.$ 4960 IF VAL(MIDS(ESTDATES,4,2)) • VM.(MIDS(tDATU,4,2)) THEN H90 4970 IF (VAL(MIDS(ESTDATES,1,2)))-31 >• (VAI.(MID$(EDAT£$,1,2)))-31 THEN 4990 4980 PRINT f3, CBll$(27);CHll$(69);TAJ(16J;'"WAllNING, STANDARD CURVE IS OLDER
TRAN ONE MOITB l ! • ;CBJlS (27) ;CBJlS (70) 4990 PRINT tJ, CBR$(27);CBJ.$(73);C8Jl$(1) 5000 PRINT fl, CBRS (12) 5010 CLOSE 5020 LX•4: LY•328: tsT•STRINGS (79, 32): GOSUB 20050 5025 LX•-4: LY•343: EST-STRINGS (79, 32): GOSUB 20050 5030 LX-249: LY•328: EST•'"A.nother lh.in (y/n) 1": GOSUB 20050 5033 BEU 5035 DEF SEG-0: POKE 1050,PEEK(1052): Dr.F SEC: POKE 106,0 'cl .. r kbrd buffer 5040 QS•IHKEYS: IF 0$•"" THEN 5040 5050 IF QS<>"N" AND QS<>"n" THEN 5060 5055 CALL CLRSCJ. 5057 CRAIN "A:RPLC· 5060 IF QS<>'"Y'" ANO QS<>•y• TIil.Ji SOtJlrilD 40, 10: GOTO 5040 5070 CLF.All 5080 GOTO 220 9999 END 10130 REM ffttfffffffftttff Inteqrat1on Curaor COINla.nd Menu ftfttttttffttttt 10140 llD4 10142 LINTS•l 10144 CALL LEVEL(LINTS) 10150 LX•4: LY•321: EST•STRINGS (79, 32) 10160 CALL TEX'?l(LX,LY,UT) 101 70 LX•4: LY•343: EST•STJ.I'NGS (79, 32) 10180 CALL ff.XTl(LX, LY, tsT) 10190 LX•27: LY•321: r.s-r-•cu1-.soa CCM4ANDS: Use L, a arrow
key• - <shift> • lOX-10200 CALL ff.XTl(LX,LY,ES'?) 10210 LX•27: LY•343: EST-"lMTEGIATiai CCM0.NDS: Start End C&.tloel
Redo Process Quit'" 10220 CALL TEXTl(LX, LY, EST) 10222 LIN'?S•2 10224 CALL LEVEL(LINTI) 10230 l!.TUJ.N 20000 RD! fftttttffttfttttffftfft GIAPB-X SubroutinH fftttffffttfftttfffttt 20010 CALL MOVE (LX, LY) 20020 lETUJ.N 20030 CALL DLINE(LX,LY) 20040 RETURN 20050 CALL ff.XTB(LX, LY, ts'?) 20060 J.ETUJ.li
MANINTST.SRC
10 llM n.cxa.AM MAME • MANIN'?S'?.SlC .. llEM •• llEM 200 RDf tttttttffff Init1l11• thal scr-n and Diaenaion Variable• ttttffffttt 210 1124 220 Dr.Fili'? A.,C,8,L-P,V: Or.FOIL D,K,l,S: DUSTI !.,F,I,Q,T,X,Y: D!.FSWG B 230 DIM UT0(5010), U1'0(5010), PUTAn (1, 2S), PJCEMD (1, 25), OPXAJt.r.A. (25), DPKRT (25),
OPlUIM'T (25), UD»lt (2S), STDR'? (20), STOXMEAN (20), STDYMEA.N (20), STDSLOPE (20), ESTDll»lt (20)
240 PAGE-11 Lnrrl•l 250 CALL Q.l~&(HG&) 260 CALL 1.&VKL(LIW'l'I) 2 70 CALL L&V&L (Llftl) 294 UM 29' lDI 400 lDI tfffttfHffffftffffHtfft 1tartin9 Prcapts ffttttttfttttttfttttttttt 410 I.DI 4 12 CALL c.uca 413 LX•l25: LY•J01 U'?-"Manual lnt~ration of a Stored Chroaatoqr-· 414 CALL nrr•(LX,LY,U'?) 415 DEF 1~1 POIIZ 1050,PEU(l0.52) 1 DEF HC1 PCICE 106,0 'cl .. r kbrd buffer 416 FILU••• 420 LX•20 1 LY•llO: !.S'?-"ll»IE C1I' FIL!. J"Ol IM'l'EGJt.ATIOlf (exten•ion not
penitted) " 421 CALL T!.XTJ(LX,LY,UT} 422 CALL OISP (PAGE) 423 QS•INKEYt: IF Qt••• TB!.N 423 !..LSE CB.U•ASC(OS) 424 IF (CBAA<>ll AND CllAl.<>I) AJID (CB.AJ.<32 Oil CB.All>l26) TB.EN SOUND 40, 10:
GOl'O 423 425 IF CB.AJ.•13 '?B.!JI 4l5 426 IF CB.AA ... AJIO L!Jl(FILU)<l TBDI SOOWD 40,10: 00'1'0 423 427 IF CJI.All-1 AND LEN(FILU)>O TBDI' FILU•LEM$(FILE$, (LEN(FILES)-1)):
GOl'O 429 421 FILU•FILU+Ot 42' LX•511: LY•llO: !.ST•FILU+• " 4l0 CALL Tr.X"rl(LX, LY, EST) 431 GOl'O 423 435 IF MIDS(FII.U,2,1) <>•:•TREW FIL£$• '"!:'"+FILE$ -440 FOil LOOP• 1 '?O 11:Jf(FILU): IF MIDS(FILES,LOOP,l) <>•.•THEM NEXT LOOP
!LSE 442 Ul GOl'O 450 442 LINTS-0 443 CALL L&VEL(LIN'U) U4 LX•241: LY•l21: EST•'" !.XTENSIClf NOT PD.MI'M'!.D '" 445 CALL TZX'?l(LX,LY, U'?) 446 LINTl•l I BEU 441 rca LOOPl • l '?O 5: Fca LOOP2 • 1 TO 5000: N!.XT LOOP2: NEXT LOOPl UI CALL U:VZL(Lill'H) 40 QOfO 412 450 IF Ulf(FIUt) < 11 '?BEIi 4iCI
451 LINTS""° 452 CALL LEVEL (LINTS) 453 LX-256: LY•328: EST•" FILE NAME IS TOO LONG • 454 CALL TEXTB(LX, LY, EST) 4 55 L INTS•l: BEEP 456 FOR. LOOPl - 1 TO 5: roR LOOP2 - 1 TO 5000: NEX'l' LOOP2: NEX'? LOOPl 457 CALL LEVEL (LINTS) 458 GOTO 412 460 LX•20: LY•250: EST•"Reading Data, P leaae Nait.,.,, • 462 CALL TtXTB(LX,LY,EST) 465 rILEDATAS • FILES+• .DAT'" 470 OPEN FIL£0A.TA$ FOR INPUT AS fl 4 71 INPU'T fl, EDATES, INJECTS, NOSAMPLS, KURRTIME, STAllTIME 4 72 FOR LOOP • l TO NOSAMPLS STEP 20 473 INPUT tl, BO, AO, Bl, Al, 82, A2, BJ, A), 84, A4, 85, A5, 86, A6, 87, A7, 88, A.8, 89,
A9, B10,Al0, Bl 1,A.11, 812, Al 2, B13,A13, Bl4,Al4, B15,Al5, B16,Al6, Bl 7 ,Al 7, 818, All, 81 CJ, Al 9
474 BSTO(LOOP) • BO 475 A5TO(LOOP) • AO 476 BSTO(LOOhl) • Bl 471 ASTO(LOOP+l) • Al 4 78 BSTO (LOOP+2) • 82 479 A!TO(LOOP+2) • A2 480 BSTO(LOOP+J) • 83 481 ASTO(LOOP+J) • A3 482 BSTO(LOOP+4) • 84 483 ASTO(LOOP+4l • A4 484 BSTO (LOOP+S) • BS 485 ASTO (LOOP+5) • AS 486 BSTO(LOOP+6) • 86 4117 ASTO(LOOP+6) • A6 488 BSTO(LOOP+7) • 87 489 ASTO(LOOP+7) • A7 490 8STO(LOOP+8) • 88 491 ASTO (LOOP+I) - Al 492 BST0(LOOP+9) • 89 493 ASTO(LOOP+9) • A9 494 BSTO(LOOP+lO) • 810 495 ASTO(LOOP+lOJ • AlO 496 8STO(LOOP+ll) • 811 497 ASTO(LOOP+ll} • All 491 8STO(LOOP+l2) • Bl2 499 ASTO(LOOP+12) • Al2 500 BSTO(LOOP+13) • 813 501 ASTO(LOOP+13) • A.13 502 BST0(L00P+l4) • 814 503 A.!TO (LOOP+ 14) • AH 504 BST0(L00P+15) • 815 505 A.,'?O(LOOP+15) • Al5 506 8STOILOOP+l6) • 816 507 ASTO(LOOP+l6) • Al6 501 BSTO (LOOP+ 17) • Bl 7 509 ASTO(LOOP+l7) • Ali 510 BSTO (LOOP+ 18) • 811 511 A.,TO(LOOP+l8) • AU 512 BSTO (LOOP+ 19) • Bl 9 513 MTO(LOOP+19) • AU 514 Nf.X'1' LOOP 515 CLOSE 520 PAG!.•O: LINTS•l 530 CALL G1'AGE(PAGE) 540 CALL LEVEL(LINTS) 550 CALL CLUCI. 594 llD4 59' llD4 600 It.DI ttttffttfttftttttttttff Draw Running Screen tttttttUfftttlfttlftttt 610 R.DI 620 LX•lO: LY-0: OOSUB 20010 630 LX•JO: LY•260: OOSUB 20030 632 LX•630: LY•260: QOSUI 20030 634 FOil MARK • 256 TO O STEP -10 636 LX•301 LY-MAU: 00SUI 20010 631 LX•25: LY-MA.J.K: OOSUB 20030 64 0 N r.xT MAJ.JC 642 FOil MA.II( • 30 TO 630 STEP 20 644 LX-+tA.JlK: LY•260: GOSUB 20010 646 LX-MAJ.11'.: LY•2'5: QOSUI 20030 641 Ntx'? MAJ.II: 650 FOR MA.Ill'. • 30 TO 630 STU 100 652 LX-MAJ.J{: LY•26S: GOSUI 20010 6S4 LX-MAI.X: LY•270: GOSUB 20030 6 S 6 NEXT MAJ.II: 651 FOil MA.IX • 30 TO 630 STEP 200 660 LX-MAJ.I: LY•270: GOSUB 20010 662 LX-MAJ.I: LY•275: GOSUB 20030 664 NU'? MAI.It 6H LX•21: LY•291: r.s-r-•15·: GOSUB 200SO 661 LX•121: LY•291: £ST•'"20•: GOSUB 20050 no LX-221: LY-2'1: !.5'?•"25·: QOSUI 20050 672 LX•l21: LY•291: !..!'?•'"30•: GOSUI 20050 674 LX•421: LY-291: EST•"lS'": GOSUI 20050 676 LX•521: LY•291: tST•·40'": GOSUI 20050 611 LX•621: LY•Ul: EST••,t5•: GOSUI 20050 HO LX•211: LY•30S: !.ST•'"TIHE (a ins)•: GOSUB 20050 700 LX•lO: LY•JO: £!'?-"FILE• •+FILE$: C.OSUB 20050 710 CALL OISP (PAGE) 796 lDI 100 UM tttffftttttttftfffffftff Draw Chrc:aatogru tfffttttftftlftttttttflff 110 LX•((Cill'l((U'?O(l}-15)•20))+30): LY•ASTO(l) 120 CALL PLOl' (LX, LY) 130 CALL J«)YE (LX, LY) 140 Fca LOOP • 2 1'0 NOSWIPLS 150 U:•( ICIW'? ( (ISTO ILOOPJ-15) •20)) +30) : LY-ASTOi.LOOP) 160 CALL CLINE (LX, LY) 170 NU'? I..OC» 1700 llM tttttttttffttffttttfffff Manual Inteqrat1on ffttttfftttfttttttfffft 1710 llM 1720 LX•ll: LY•321: !.ST-Sff.INC::,(74,32): COSUB 20050 1730 LX•l01 LY•O 1740 CAl.L MOVl.(LX, LY) 1750 LX•l01 LY•259 1160 CALL CI.IR (LX, LY) 1770 LI11TS•2 1710 CALL LEV!.l. (LIMTS) 1190 POSX•lO: NtMSTlTS•O: NUMENDS-0 1194 PL'?'?l'll • Clll'?( ( (BS'l'O(l0)-15) •20) +JO) 119' PL'?'!.IID • Cill'?(((ISTO(llOSWIPLS-10)-15)•20)+30) 1900 SAMPOIN"? • CDIL ( (NOSIIHPLS-20) / (PLTDIO-PLT?DI)) 1910 QOSUI 10130 19)0 llM --------------------- Input Control Co•and ---------------------1940 IJ10VJ:.t • IlfnYSt IF IMOV!.t - •• T!lEJI 1940 1"42 IF LEN(l,C:,VZS)>l AND IMOVEt-CBIS(O)+-"M'" T!lEJrl MOVE•21: GOTO 1980 1"43 IF LEll(IIC)'VE$)>1 AJIO IMOV!.l<!lU(O}+'"J{• TBDI MOVE•29: GOTO 1910 1 "45 tCIV!.-ASC (IMOVES} 1950 IF MOVE < S2 '?REN 1'40 1960 IF MOVE < 55 THEN 1910 1'70 IF MOVt.>65 AJIO POIX>U AND P08X<U 1 THEN 2070 !.I.SE SOONO 40, 10:
QOTO 1940 1910 llM --------------------- Move Cursor --------------------------1990 IF MOVE • 21 '?llN P0SX2•P0SX+1: 00'?0 2000 19'2 IF MOVE • 54 '?REN P0SX2•POSX+l0: GOl'O 2000

Chromatographic software 176
1994 IF MOVE - 29 TBEN POSX2•P0SX-1: GOTO 2000 1996 IF ~ • 52 TBZN P0SX2•POSX-l0: GOTO 2000 1998 SOUND 40,10: GC11'0 1940 2000 IF POSX2<10 THEN Br.I.P: POSX2•10 2002 IF POSX2>640 TBEN BEEP: POSX2•640 2004 UC•POSX: LY•O 2006 CA.LL MOVt (LX, LY) 2008 LX•POSX: LY•259 2010 CALL DLIME(LX,LY) 2012 LX•POSX2: L'/•25' 2014 CALL MOVE(LX,LY) 2016 LX•PO!X2: LY-0 2018 CA.LL OLINE (LX, LY) 2020 P0SX•POSX2 2030 GOTO 19,40 2040 REM---------· lnteqration Control Colftfflands ----------2050 JU:M 2060 REM ---------------------------- Peak Sta.rt ---------------------------2070 Ir MOVE• 83 OR MOVE • 115 THEN SOU"HD 523.25, .5 tLSE 2230 2080 LOOP • CINT( (POSX-35) •SAMPOINT) 2090 IF LOOP < l TBE.N LOOP • 1 2100 IF LOOP > NOSAMPLS THEN LOOP • NOS.t.MPLS 2110 LOWPOINT-0: FLAG$•"FI1t.ST" 2120 COMPX • cnrr ( (BSTO(LOOP)-15) *20) •30 2130 WHILE COMPX <• POSX 21-40 IF CCMPX < POSX THEN 2180 2150 IF FLAGS•"FIR.ST" THEN NUHSTRTS•NUMSTRTS+l: P!<START (0, NUMSTRTS) •LOOP:
FLAGS•"NO" 2160 PXSTART(l,NUHSTRTS)•LOOP 2170 IF ASTO(LOOP) > LC*POINT THEN LOWPOINT • ASTO(LOOP) 2180 LOOP • LOOP + 1 2190 CCJ4PX • CINT( (BSTO(LOOP)-15) •20) +30 2200 WEND 2210 LX•POSX1 LY•LOWPOINT+l 2211 CALL MOVJ: (LX, LY) 2212 LX•POSX: LY•LOWPOINT+ll 2213 CAlJ.. OLINE (LX, LY) 2214 LX•PO!X+4: LY•LONPOINT+l l 2215 CALL OLINE {LX, LY) 2216 001'0 l 940 2220 REM ----------------------------- Peak End ----------------------------2230 IF MOY"l. • 69 Oil MOVE • 101 TBI.N SOUND 523.25, .5 ELSE 2390 2240 LOOP • CINT( (PO!X-25) •SAHPOINT) 2250 IF LOOP > NOSAMPLS THEN LOOP • NOSAHPLS 2260 IF LOOP < 1 THEN LOOP • 1 2270 LOWPOINT-0: rLAGS•'"FIRST" 2280 COMPX • CINT ( (BSTO(LOOP)-15) •20) +30 2290 WHILE CCMPX >• POSX 2300 IF CC>IPX > POSX THEM 2340 2310 IT FLAGS•"FilST" THEN NUMENOS-NUMEMDS+l: PXENO (0, NUMENOS) •LOOP:
FLAG$•"HO" 2320 PKEND(l,MUMDIDS)•L(X)P 2330 IT ASTO(LOOP) > LONPOINT TBEN LOWPOINT • ASTO(LOOP) 2340 LOOP • LOOP - l 2350 CCMPX • CINT((BSTO(LOOP)-15)•20)+30 2360 WEND 2370 LX•POSX: LY•LOIIPOIW'?'+l 2371 CALL MOVE(LX,LY) 2372 LX•POSX: LY•LOIIPOINT+ll 2373 CALL OLINE (LX, LY} 2374 LX•POSX-4: LY•LOICPOINT+ll 2375 CA.LL CLIME (LX, LY) 2376 GOTO U<tO 2380 J.EM --------------------------- Clear Entry ---------------------------2390 IT MOVE <> 67 AND HOVE <> gg TBl:N 2740 2<t00 CAHCr.L-0 I LOIIPOINT-0 2<tl0 IF NUMST1t'l'S < l THEM 2570 2420 roll LOOP • l TO NUMSTllTS 2430 CCMPX • CIMT( (BSTO(PJt:STAJlT(O,LCJa>))-15) •20) +30 2440 IF CCMPX • POSX '?BEN CAHCl.L • LOOP 2450 MEX"? LOOP 2460 IF CANCEL < l TBDI 2570 2470 FOil LOOP • PltSTllT (0, CNICEL) TO PJt:STAllT ( 1, CANCEL) 2410 IF ASTO(LOOP) > LOWPOINT '?BEN LOlfPOIMT • .UTO(LOOP) 200 NEX'? LOOP 2500 SOUND 500, .5: SOOND 12767, 1: SOOIID 600, .5 2510 LX•POSX: LY•LOIIPOINT+l 2511 CA.LL MOY'E(LX,LY) 2512 LX•POSX: LY•LOIIPOIN'?+l l 2513 CALL OLINE (LX, LY) 251'1 LX•POIX+4t LY•LOIIPOill'!'+ll 2515 CA.Ll, OLINE ILX, LY) 2520 F'Ol LCXlP • CANC:ZL TO NUMS'?a'l'S-1 2530 PltSTll"l'(O,LOOP) • PltSTAH(O,LCX'.)P+l) 2540 PUTAlT(l,LOOP) • PKS'?ll'?(l,LOOP+l) 2550 NEXT LOOP 2560 NUMSTJ.TS • Nl.l'ISTa'l'S - 1: QC7l'O U40 2570 IF llUMSTa'l'S <l AIID ll!M!JIDS<l TllR SOUND 40, 10: GC71'0 U40 2510 roll LCXlP - 1 TO NUMEWDS 2590 CCM!'X • CIW'?( (BSTO(PXEIID(O, LCXIP) )-15) •20) +JO 2600 IF caox • ,oax TD.R CAJICEL • LOOP 2610 IRXT LOOP 2620 IF CAIICZL < 1 '?UJI SCIOlfD 40, 10: QOTO 19<t0 2630 roll~• PKEIID(l,CMCEL) TO PXEND(O,OJICEL) 2640 IF Al'!'O(LOOP) > I.OlfPOIR'?' TBDI LOIIPOillT • A:!ITO(LOOP) 2650 RX'T LOOf' 2660 SOOND 500,.51 aom1D 321'1,l: SCIOlfD 600,.5 2670 LX-POll1 LT•LOatOIWT+l 2671 CALL ...,..(JJ<,LT) 2612 LX•POll1 LT•i.c:.,OIWT+ll 2,n CALL DLlft (LX, LT) 2674 LX•POIX-41 LY•LOIIPOllr'T+ll 2675 CALL OLIO (LI, LY) 2610 F'Oll LCXlP • CMCEL '?O Wt.14l'JID1-l 2610 PllllD(O,LOOP) • PRND(O,LOOP+l) 2700 PKEJfO(l,LOOP) • PJCEIID(l,L(X)P+l) 2710 REX'? LOOP 2720 NUME>IDI • llUMENDI - l I c;oro 1940 2730 llEM ------------------ Redo Froa Start ---------------------2740 IF MOVE <> 12 AND MOVE <> 114 THEN 2140 2750 IUJ': LIIITS•l 2751 CALL LEVll (LI>ITS) 2752 LX_.: LY•321: UT-S'TllING$ p,, 32) : OOSUB 20050 275] LI_.: LY•34l: UT-S'TllINc:1(19,32): OOSUI 20050 275,t LX•lO: LY•321: EST•"lledo rroa Start ••.•• ": GOSOI 20050 2755 LX•227: LY•JO I u-r-·ct11FIJIIM S'tLECTICII (y/n) ": GOSUII 20050 2760 Q$ • INXZY$: IF Q$ • •• Tll!:N 2160 2770 IF QI • "y" OR Qt • •y• '?BEIi 2190 2710 OOSUII 10130: QO'?O 1940 27'10 CALL CLllSCll 2791 Ll•lO: LY•O: C.OSOI 20010 2192 LX•l01 LY•260: GOSUB 20030 2191 LX•6l0: LY•2601 OOS011 20030 2794 roll MAU • 256 TO O STU -10 2795 LX•JO: LY-MAI.Jt: COSUI 20010 2796 LX•251 LY1'lllJ{: GOSUI 20010 2797 NEXT MARK 2791 l'Oll MAM • JO TO 630 STEP 20 2791 LX-MAll'.1 LY•260: QOSUI 20010 2100 LX-MAll1 LY•26S: QOSUI 20030 2101 NEXT M»Jt
2802 TOR MA.JU( • 30 TO 630 STEP 100 2803 LX"""""'-1UI': LY•265: GOSUB 20010 2804 LX~: LY•270: GOSUB 20030 2805 NEXT MAJlX 2806 l'OR MAU - 30 TO 630 STEP 200 2801 LX-+IAJU(: LY•270: GOSUB 20010 2808 LX~: LY•275: OOSUB 200]0 280 9 NEXT MARX 2810 LX•21: LY•291: EST•"l5": GOSUB 20050 2811 LX•l21: LY•291: £5'?•"20": OOSUB 20050 2812 LX•221: LY•291: £ST•"25": GOSUB 20050 281] LX•321; LY•291: EST-"30": GOSUB 20050 28U LX-121: LY•291: EST-"35": GOSUB 20050 2815 LX•521: LY•291: EST•"40": GOSUB 20050 281' LX•621: LY•291: EST•"45": GOSUB 20050 2817 LX•281: LY•305; EST•"TIME {111lna) ": GOSUB 20050 2818 LX•((CINT(lBSTO(l)-15)•20))+30): LY•A!!ITO(l) 2819 CALL PLOT(LX,LY) 2820 CALL MOVE(LX,LY) 2821 FOJ. LOOP • 2 TO NOSAHPLS 2822 LX• ( (CINT ( (BSTO (LOOP) -15) *20) l +30) : LY•A.STO (LOOP) 2823 CALL DLINE(LX, LY) 2824 NEXT LOOP 2825 GOTO 1700 2830 Jll.M ------------------------- Q\.llt Integration ------------------------2840 IF MOVE <> 81 MD MOVE <> 113 THEN 2900 2850 BEEP: LINTS•l 2851 CALL LEVtL(LIMTS) 2852 LX•4: LY•328: EST•STRINGS (79, 32): GOSUB 20050 2853 L.X-<t: LY•lO: EST-STRINGS(79,32): GOSUB 20050 285,t LX-30: LY•J28: EST•"QUlt •••.. ·: GOSUB 20050 2155 LX•227: LY•343: EST-"CClffIRM SELECTICJtl (y/n) ": GOSUB 20050 2860 0$ • IWXEY.S: IF Q$ • "" '?BEN 2860 2170 IF QS<>"y" AHO QS<>"Y" TB.EN 2880 2176 CHAIM •A:BPLc• 2110 QOSUB 10130: GOTO U40 2190 Jll.M ------------ Proc••• Data--------------2900 IF MOVE<> 80 AND !«)VE<> 112 THEN SOONO 40, 10: GOTO 1940 2'110 BEU: LINTS•l 2911 CALL L.EVEL(LINTS) 2912 LX-1: LY•321: EST•STllING$(79,32): GOSUB 20050 2913 L.X•<t: LY•343: EST•S"l'llINC$(79,l2): OOSUB 20050 2914 LX•30: LY•328: EST•"Proceu ..... ": GOSUB 20050 2915 LX•227: LY•34J: UT-"CC>IFUM SELECTiai (y/n) ~; GOSUB 20050 2920 OS • INXEYS: IF OS • .... THEN 2920 2930 IF QS • •y• a,. QS • "Y" TBEH 2950 2940 GOSUI 10110: GO?O U40 2950 LX-1: LY•l21: EST-STJlIMGS (79, 32): GOSUB 20050 2955 LX-4: LY•l4l: EST-S'TUMCS (79, 32): OOSUB 20050 2960 IF Ntl"ISTllTS • NUMENDS THEN 3030 2970 BEU: IF NUHSTJ.TS>NUMENDS THEN 2980 2975 LX•l37: LY•328: EST-'"llUMBEJ. OF PEA.JI: STARTS < NUMBER or PE.U: ENDS":
GOSUll 20050 2917 QOTO 2990 2910 LX•137: LY-321: EST•"MUMBEll or PEAi( STARTS> NUMBER or PEAX £NOS":
OOSUB 20050 2990 LX•l 95: LY•JU: u-r-•Preu any key to cent inu• ..... ": GOSUB 20050 3000 IF INICEYS••• TBZ.N 3000 3010 QOSUB 10130: GOTO 1940 3020 JlEM ------------------------- Bubb!• Sort ---------------------------3030 llEM 3040 CBECIC • l 3050 NBILE CBECJt: 3060 CBECX • 0 3070 FC* LOOP • l TO Ntl"ISTJtTS-1 3010 IF ISTO(PJt:START(O,U:X:.)) <• BSTO(PJt:STllT(O,LOOP+l)) THEN 3120 3090 SNAP PltSTllT(O,LOOP),PltSTllT(O,LOOP+l) 3100 SNAP PltSTAJlT(l,LOOP) ,PltSTAllT(l,LOOP+lJ 3110 CBtcJt: • 1 3120 NEX'?' LCXlP ]130 Nl!ND 3140 CBECJt: • 1 l lSO NB ILE CBECX 11'0 CllCX • 0 3170 FCII. LOOP • 1 TO Nt.14ENDS-l 3110 IF Bl'?O(PXEND(O,UXJP)) <• BSTO(PICEMD(O,LOOP+l)) THEN 3220 JUO SIIAP PICENO(O,LOOP),PKEND(O,LOOP+l) 3200 SNAP PKENO(l,LOOP),PKEND(l,LOOP+l) 3210 CBECIC • l 3 220 IIEX'T LCXlP 3230 Nl!ND 1240 llr.M ------------------ Confir. Order ----------------------------3250 l"Ol ~ • 1 TO NUHSTJ.TS 3260 IF PICSTAllT (0, UXJP) <• PKENO (0, LOOP) TBl:N 3280 1210 cna - cna + 1 1210 NEXT LOOP l2t0 IF CBECJ: < l THEN 3360 3300 LX_.: LY•321: UT-S'?llING$ (79, 32) : GOSUB 20050 3310 SEU: LX-17: LY•321: ES'?•"P£.M STU.TS AND PEAJC ENDS ARE NOT IN THE
COD.EC'! c:aD!l": GOSUB 20050 3320 LX•lt5: LY•lU: UT-"Pnu any key to continue ..... ": GOSUB 20050 3330 IF IlllCEY$•"" TBZ.8 1330 3340 QOSUB 10130: QO?O 1940 3350 llr.M ------------------- Integration ----------------------------3160 LX-4 1 LY•l21: UT-S'?'UJICS (79, 32): QOSUB 20050 33,<t LX•l45: LY•l21: UT-"Calculat1J\9' area for peak number": GOSUB 20050 31,6 UC_.7l: LY•l21: tsT-"o!"+STllS(NUMSTJ.TS): GOSUB 20050 3310 LI1f'?S•2 Jlll CALL LEVll(LI>ITS) 3312 LX-POSX: LY•O 331] CAL.I, MOVE I LX, LY) 3314 LX-POSX: LY•2St 331S CALL OLINE ILX, LY) 3316 LIIITl•l lll7 CA.LL LEV!.L(LillTS) JltO FOil LCXll'l • 1 TO NUMSTHS 3400 L1•4l5: LY•l21: EST•ST1l$(I.0C:.l) 3405 CALL ttrra (LX, LY, UT) 3410 llDI ------------ 1 .. eline (LSllL) Calculation, -----------------3420 DSOHX-0: DSl.1'11'•0: DXY-0: OXSQ-o: BIQBPOINT-675: FLAG$••NO" JOO DXMr.All-0: DYM!.AM•O: DLXY•O: DLXS0-0: LOWPO!ll'?-0 3440 FCII. LOOP2 • PltSTllT(O,LOOPl) TO PltSTllT(l,LOOPl} 300 DltlllX • 0Sl.l'IX + BSTO(LOOP2) 3460 OltMY • DSUMY + ASTO(LOOP2) 3 410 DXY • DXY + BSTO (LOOP2) • ASTO ILOOP2) 300 DXS0 • OXIQ + BIT0(1(X)P2) '"2 300 IF ASTOCLOC»2) > LCWPOIRT THEN LCMPOINT • .UTO(LOOP2) 350 0 N EX'? LCXlP 2 3510 PTSTll'? • ((CIWT((BITO(PltSTA.RT(O,LOOPl))-15)•20))+30) 3520 LillTl•2 3522 CALL 11.VEL (LINTS) ]52] LX•PTS'TJ:'!': LY•LOlfPOIMT+l lS24 CALL J«7VI. (LX, LY) l52S LX•PTS'?r!s LY•LC*POIM'?+ll 3521 CALL DLIWE(LX, LT) 3527 LX•PTSTJt'l'+,t: LY•LOIIPOIJIT+ 11 3521 CALL DLINE(L.X,LY) 3Sl0 LOWPOIJfT • 0 3540 roa LOOP) • PKEND(l,LOOPl) '?O PKEND(O,LOOPl) 3550 DStllll • 0St.14X + BSTO(LOOPl) 3560 DltMY • Dlt.14Y + ASTOILOOPJ)
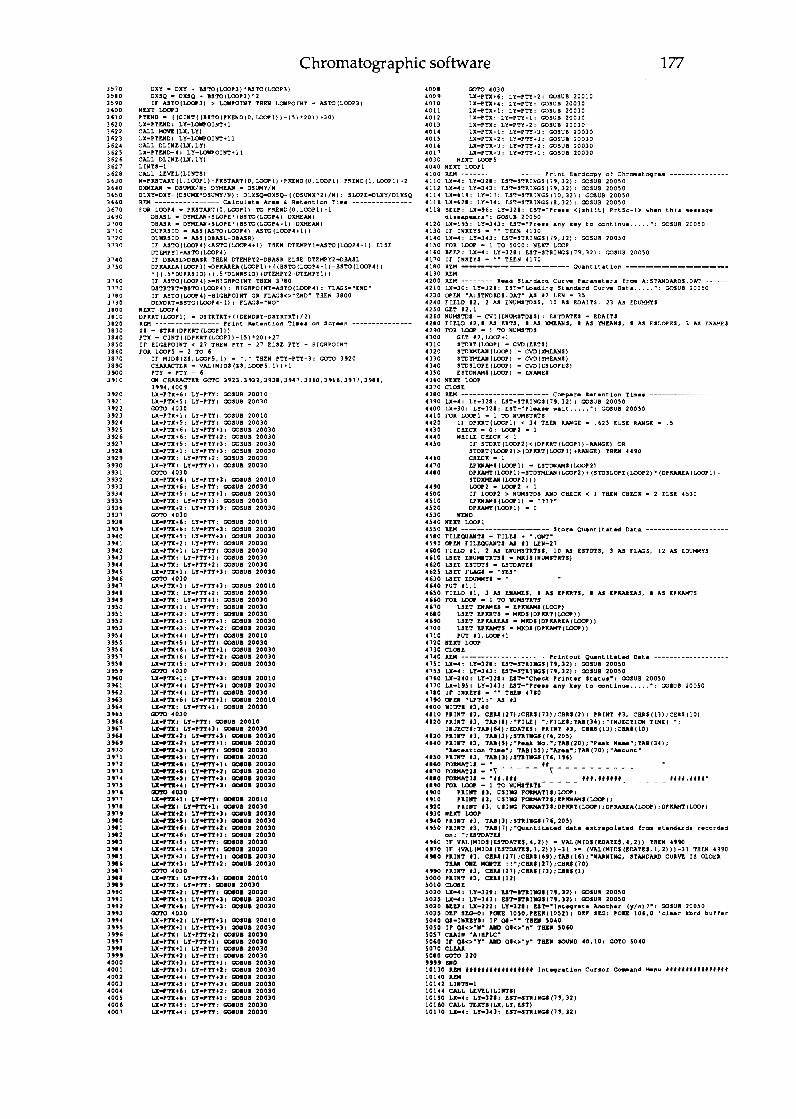
3570 3580 3590 3600 3610 3620 )622 3623 3624 3625 3626 3627 3628 3630 36,40 3650 3660 3670 3690 )700 3710 3720 3730
)7<40 3750
3760 3T10 3780 3790 3800 3810 3820 3830 3840 3850 3860 3870 3890 3900 3910
3920 3921 3922 3923 3924 3925 3926 3927 3928 3929 3930 3931 3932 3933 3934 3935 Jg]fj
3937 3938 3939 3940 39-41 3942 39.0 3944 39.S 3946 3941 3948 39,0 3950 HSl 3952 3953 3954 3955 3956 3951 3951 3959 3960 3961 3962 3963 3964 3965 3966 3967 3961 3969 3910 3911 3912 3913 3914 J97S 3916 3911 3911 3919 3910 3911 3912 3913 3914 3915 3916 3917 3911 3919 39'0 39'1 3992 3993 3994 3995 39'6 39'1 3991 3999 4000 4001 4002 4003 4004 4005 4006 4007
Chromatographic software 177
DXY - OXY + BST0(L00PJ)•A!5TO(LOOP3) DXSQ - OXSQ + BSTO(LOOPJ) "2 IF A!TO(LCXlPJ) > LCWPOIJIT TBEN LONPOINT .. ASTO(LOOPJ)
NEXT LC>C:.3 PT!:HD • ((CllfT((B!TO(PKENO(O,LOCJPl))-15)*20))+)0) LX-PTEMD: LY-LOIIPOIH'l'+l CALL HOV! (LX, LY) LX•PTEND= LY•LOIIPOINT+ll CALL DLIHE(LX,LY) LX•PTEM0-41 LY•LOIIPOIH'hl 1 CALL DLIHE(LX,LY) LINTS•l CALL LEVlL(LINTS) N•Plt:!!ITAJt.T {l, LOOPl )-PKSTM.T {O, LOOP 1) +-PXEND (0, LOOPl) -PKEND ( 1, LOOP 1) +2 OXHEAH • DSUMX/N: OYME>Jrl • DSUMY/N OLXY•DXY- (DSUMX•OSUMY/N): DLXS~X:50- ( (0SUHX"2) /N): SL0P£-OLXY/DLXSQ RF.M ---------------- calculate Ar•• , Retention Time --------------FOR !..OOP4 • Plt:STAJ.T(O,LOOPll TO PKEND(O,LOOPl)-1
DBA5L • DYM£AN+SL0PE• (BST0(LOOP4)-DXHEAN) DBA5R • DYM£AN+SL0PE• (BSTO(LOOP-4+1)-DXMEAN) OUPRSID • ABS(ASTO(LOOP4)-A5TO(LOOP4+1)) DLNRSID • ABS (08A5L-0BASR) Ir ASTO(LOOP4)<ASTO(LOOP4+1) THEN DTF.MPYl•ASTO(LOOP4+1) ELSE DTFl1PY1•A5TO (LOOP4) Ir DBASL>DBA!!IR THEN DTFMPY2•DBASR ELSE OTEHPY2-0BASL DPKAR.EA(LOOP l) -OPXARF.A. (LOOPl) + ( (BSTO (LOOP4 +l )-BSTO (LOOP4) l • ( (, 5•0UPRSID) + (. 5 *DLNRS ID) +D'TD4PY2-DTEMPY1) J IF ASTO(LOOP4)>•HIGBPOINT TBEM 3780 DSTRTRT-BSTO(LOOP4): HIGH1'0INT•ASTO(LOOP4): FLAG$•"END" IF A!!ITO(LOOP4) •BIGB.POINT OR FLAGS<>"EMD" THEN 3800 DEHDRT•BSTO ( LOOP4- l) : FLAG$•"NO"
NEXT LOOP4 DPKRT (LOOPl) • DSTllTRT+ ( (OENDlT-OSTRTRT) /2) REM ---------------- Print Retention Ti••• on scr-n --------------ZS• STU(DPKJlT(LOOPl)) PTX • CINT((OPKJlT(LOOPl)-15)*20)+21 If HIGHPOINT < 21 THEN PTY • 21 ELSE PTY • HIGHPOINT fOJl LOOPS • 2 TO 6
Ir MID$(Z$,LOOP5,l) •"."THEM PTY•PTY-3: GOTO 3920 CH.AR.ACTER • VAL(MID$(ZS,LOOP5,l))+l PTY • PTY - 6 a.I CBARACT!.Jl GOl'O 3923,3932,3938,3941,3960,3966,3911,3988, 3994, 4009 LX•PTX+6: LY•PTY: GOSUB 20010 LX•PTX+S: LY•PTY: GOSUB 20030 GOTO 4030 LX•PTX+l: LY•PTI: GOSUB 20010 LX•PTX+5: LY•PTY: OOSUB 20030 LX•PTX.+6: LY•PTY+l: GOSUB 20030 LX•PTX+6: LY•PTY+2: Q0SU8 20030 LX•PTX+5: LY-PTY+3: OOSUB 20030 LX•PTX+l: LY-PTY+3: OOSUB 20030 LX•PTX: LY•PTY+2: OOSUB 20030 LX•PTJ:: LY•PTY+l: QOSUB 20030 GOTO 4030 LX-PTX+6: LY•PTY+3: OOSUI 20010 LX-PTX+6: LY•PTY: QOSOB 20030 LX•PTX+5: LY•PTY+l: QOSUI 20030 LX•P'?X: LY•PTY+l: 00SU8 20030 LX•PTJ:+2: LY•PTY+3: OOSU8 20030 GOTO 4030 LX•PTX.+6: LY•PTY: 00SU8 20010 LX•PTX.+6: LY•PTY+J: QOSUB 20030 LX•PTX+S: LY•PTY+3: OOSUB 20030 LX•PTX+2: LY•PTY: OOSUB 20030 LX•PTX+l: LY•PTY: OOSUB 20030 LX•P'?'X: LY-PTY+l: OOSUB 20030 LX•PTX: LY•PTY+2: OOSUB 20030 LX•PTX+l: LY•PTY+3: QOSUB 20030 GOTO 4030 LX•PTX+l: LY-PTY+3: OOSUII 20010 LX-PTX: LY•PTY+2: QOSUB 20030 LX•PTX: LY•PTY+l: QOSUB 20030 LX•PTX+l: LY•PTY: QOSUB 20030 LX•PTX+2: L!•P'?Y: QOIUB 20030 LX•PTJ:+3: LY•PTY+l: QOSOI 20030 LX•PTX+3: LY•PTY+2: QOIOB 20030 LX•PTX+4: LY•PTY: QOIOI 20010 LX•P'?X+5: LY•PTY: QOIOI 20030 LX•PTX+6: LY•PTT+l: QOSUI 20030 LX•P'?X+6: LY•PTY+2 1 QOIUI 20030 LX•PTX.+5: LY•PTY+l: QOSUI 20030 GOTO 4030 LX•PTX+l: LY•PTY+l: QOSUI 20010 U:•PTX+4: LY•PTY+3: QOSUI 20030 LX•PTX+41 LY-PTY: QOSOB 20030 LX•PTX:+6i LY•PTY+l: C.0101 20010 LX•PTX: LY..PTY+l I QOIUI 20030 00?0 4030 LX•PTX: LY•PTY: OOSOI 20010 LX-PTXt L1'•PT't+3t QOSOI 20010 LX.PTX+21 L1'.PT1'+31 QOIOI 20030 LX.PTX+21 LY-PTT+l I QOIOI 20010 LX.PTX+l I L1'-PT1' 1 QOIOJ 20010 LX-tff+5 a L1'-PT1'1 Q0801 20030 LX-tff+l1 LY.PTY+l I QOIUI 20030 LX.Pn+, 1 L1'-fff+21 QOIUI 20030 LX-fTX+51 LY-PTT+l I QOIUI 20030 LZ-rrz+41 LY-tTT•l I QOIUI 20030 QOIIO 4010 LZ-f'ft+l I L1'.PTY1 aoaul 20010 LX-rff1 LY-fTT+l I aoaua 200]0 LZ-PTX+21 LY.PTT+l I QOSOI 20030 LJ:.PTX+51 L1'.PT1'+l I QOIOI 20010 LX•PTX+,: LY.PT1'+21 QOSUI 20030 LX•PTX+61 LY.PTT+l: t.lOaUI 20030 LX•PTX+S1 LY•PTT: QOSDI 20030 LX•PTX+4: LY•PT1'1 QOIOI 20030 LJ:•PTX+31 LY•P'?Y+l I QOIOI 20030 LX•PTX:+l: LY•PTY+2: QOSOI 20030 GOTO 4030 LJ:-PTX1 LY•PTT+31 QOIOI 20010 LX•PTX: LY•PT'l: QOIUI 20030 LX•PTX:+2: LY-PT'l: QOIOI 20010 LX-PTX+5: L1'•PT1'+31 QOIUI 20030 LX•PTX+6 1 LY•PTY+3: QOSUI 20030 QOTO 4030 LJ:-P'l'X+2: LY•PTY+l I QOSUI 20010 LX.PTX+l: LY-PTY+l: QOSOI 20030 LX•PTX1 L1'•PT1'+21 QOIOB 200)0 LX•PTX:1 LY•PTY+l I QOSOB 20030 LX•PTX+l: LY•PT't: QOSOB 20030 LX•PTX+2: LY•PTT: QOIUB 20030 LX•PTX+l I LY•PTY+l: OOSUB 200)0 LX•PTX+l I LY•PTY+2: QOSUI 20030 LX•PTX.•4 I LY•PTY+] I QOIOI 200)0 LX•PTX+5 1 LY•PTY+l I COIUI 20030 LX-PTX:+6 t LY•PTT+2: QOIUI 20010 LX•PTX+li I LY•PTY+l: QOSUI 20030 LX•PTX+5: LY•PTT: QOIUI 20030 Lll•PTX+4: LY-PTT: QOIUI 20030
40011 GOTO 4030 4009 LX•PTX+6: LY•PTY+2: GOSUB 20010 4010 LX•PTX+4: LY•PTY: GOSUB 20030 4011 LX•PTX+l: LY•PTY: OOSUB 20030 4012 LX:•PTX: LY•PTY+l: 00SU8 20030 4013 LX•PTX: LY•PTY+2: OOSUB 20030 4014 LX•PTX+l: LY•PTY+3: GOSUB 20030 4015 LX•PTX+2: LY•PTY+3: GOSUB 20030 4016 LX•PTX+3: LY•PTY+2: GOSUB 20030 4011 LX-PTX•3: LY•PTY+l: GOSUB 20030 4030 NEXT LOOP5 4040 N!.XT LOOPl 4100 RE.M -------------------- Print B.udcopy of Cnt'Olllatogram ---------------4110 LX•4: LY•3211: EST•STRINGS(79,32): GOSUB 20050 4112 LX•4: LY•HJ: EST•STRINGS(79,32): GOSUB 20050 4114 LX•619: LY•l7: EST•STRING$(10,32): GOSUB 20050 4116 LX•628: LY•H: EST-STRING$i8,32): OOSUB 20050 4118 BEEP: LX•96: LY•328: EST•"Presa <[shift] PrtSc-1> when this me.9saqa
diuap .. n": Gos:UB 20050 4120 LX•l95: LY•343: EST-"Preas any key to continue ..... '": GOSUB 20050 4130 If INKEY$ • "" 1'8.EN 4130 4140 LX-41: LY•343: EST•STRINGS(H,32): GOSUB 20050 4150 roR LOOP • 1 1'0 5000: NEXT LOOP 4160 BEU: LX•4: LY•328: EST•STJUNGS(H,32): OOSUB 20050 4110 IF INKEYS • "" Ta.EH 4110
4180 RE.M -------------- Quant1tat1on -------------· 4190 RE.M 4200 REM -------- Read Stand.a.rd Curve Parameters frOIII A:STAHDARDS .DAT -----4210 LX•30: LY•328: EST•"Loading Sta.nd&rd Curve Data ...• ,": GOSUB 20050 4230 OPEM "A:STHDROS.DAT" AS f2 LDI • 35 4240 flELD 12, 2 AS ENUMSTOS$, 10 AS r.DAIT$, 23 AS EDUMHY$ 4250 GET t2, 1 4260 NUMSTDS • CVI (OIUHSTOS.S): !STOA.Tr.$ • EDAITS 4210 FIELD 12,1 AS !.JlTS, I A!! XMEANS, I AS YHEAHS, II A5 E!LOPtS, 3 AS ENAMES 4290 roa LOCIP • 1 TO NUMSTDS 4300 GET 12, LOOP+l 4310 !TORT (LOOP) • CVD {!.JlT$) 4320 STOXHEAH(LOOP) • CVD{XHEAH$) 4330 STDYMf.AH(LOOP) • CVD(YH£AH$) 4340 STDSLOP!(LOOP) • CVD(ESLOPES) 4350 ESTDNAH$ (LOOP) • £NAME$ 4360 NEXT LOOP 4310 CLOSE 4380 llM ---------------------- Canpar• Retention T.illl•• --------------------4390 LX-4: LY•328: EST•STR1NG$(H,32): OOSUB 20050 4400 LX•30: LY•328: EST•'"Pl .. H wait ••••• ": GOSUB 20050 4410 l'OJl LOOP 1 • 1 TO MUMSTRTS 4420 If DPKJlT(LOOPl) < 34 TBEN RANGE • . 625 ELSE RANGE - .5 4430 CHEO: • 0: LOOP2 • 1 4440 NBILE Ca.ECK < 1 4450 IF STDJlT(LOOP2)<(DPKJlT(LOOP1)-RANGE) OJl
STClT(LOOP2)>(0PJCRT(LOOPl) •RANGE) TBEH 4490 44 60 CHECK • 1 4410 4410
!.PKNNU(LOOPl) • ESTDNN4S(LOOP2) DPKAMT (LOOPl) •!!ITDYMEAN (LOOP2) + (STDSLOPE (LOOP2) • (OPMREA(LOOP l) -STDXMEAN (LOOP2) ) )
400 LOOP2 • LOOP2 + 1 4500 Ir LOOP2 > Nl.14S'?DS AHO ce.r.cic: < 1 THEN CHECK • 2 EL!l. 4530 4510 UKNAMS(LOOPl) • '"777" 4520 DPIWfl'(LOOPl) - 0 4530 VEND 4540 nrr LOOPl 4550 Jll.M -------------------- !tor• Quantitated. Data ---------------------45110 FILl.QUANTI • FILU + ".QNT" 4590 OPEN FILEQUAHTS A!!1 11 LEM•21 4600 FIELD 11, 2 A!!1 ENUMSTJ.TSS, 10 A!! ESTD'?S, 3 AS FLAG$, 12 AS EDU!+!Y$ 4610 LS£'? ENUMl'!RTU • MIU$ (MtMS'?JtTS) 4620 LSI:'? ESTD'U • E!!ITDATES 4625 LSET FI.AG.I • "YU" 4'30 LSET EI>U)9(YS • • 4,40 PUT 11, 1 4650 FIELD 11, 3 A!! EN.AMES, I AS EPDTS, I A5 EPJlAllF.A.S, I AS EPKAM'TS 4 660 roa LOOP • 1 TO NUMSTlTS 4610 LSET EN»JU • EPK'MAMS (LOOP) 4610 I.SET l.PICRTS • MtmS(DPJCRT(LOOP)) 4 690 LSI'? £PKAllA,J • Mimi (DPM.JlEA(LOOP)) 4100 LSET UKAMTS • NICOi (OPDMT (LCXJP) l 4110 PUT fl, LOOP+l 4120 nrr LOOP 4130 CLOSE 4140 Jll.M ------------------- Printout Quantitated Data -------------------4150 LX-4: LY•321: EST-STJlINGS(19,32): OOSUB 20050 4155 LX-4: LY•30: U:T-STAINGS(19,32): GOSUB 20050 4160 LX-240: LY•321: E.ST-·Cheek Printer Status•: OOSUB 20050 4110 LX•l 95: LY•30: E!IT-•PreH any lr:ey to continue ••••• ": GOSUB 20050 4110 Ir INKEYS • "" TB!.N 4110 4790 !»Ell "LP'?l 1" AS fl 4100 WIDTH 13,10 4110 Pl HIT 13, CBU (27) ;CBJlS (13) ;CBJl$ (2): PllINT 13, Cfill$ (13) ;CHR$ (10) 4120 PJ.IJIT f), '?Al(l);"FILEI •;rILES;TAl(34);'"INJECTia.l TIME!
INJEC'U;TAl(64);EDA'?U: PJ.UIT 13, C8U{ll);C8J.$(10) 4130 PllllT 13, '?AB(3);ST1.Il1G.S(16,205) 4140 PUllT 13, TAB(5) ;"Peak Mo. ";TAB(20); .. , .. 1r: N ... ";TAB(34);
"J.etention Ti.Me"; TAB(55);"Area•;TAJl(10);"Mount" 4150 PRill'? 13, '?Al(l) ;ST'JlillCI (16,196) 4160 l'OIHATU • If 4170 l'OIMAT21 • "\ - - - - - \ - - - - - - - - - - - - -
4110 l'OIHATlS • "If.flt 111,111111 1111,1111" 4190 roa LOOP - 1 TO wuMST•Ts- - - - - - - - - - -4900 PUN"? 13, USING rOI.MATU;LOOP; 010 PaIWT fl, USING rORMA.'US;UICM»IS(LOOP); 4920 PUN"? fl, USING r0I.MAT3S; OPD.T (LOOP); DPD.llA(LOOP); OPKAMT (LOOP) 4 93 0 NEXT LCX>P 4940 PUNT fl, TAB(]) ;S'BIWCS p,, 205) 4950 PlIN'? 13, TAJ(1) ;"Quantitated data extrapolated froa standards recordAd
on; '";UTDATU 49'0 Ir VAL(HICS(E!ITDA'?U,4,2}) • VAJ..(MIDS(£DATES,4,2)) THl.H 4990 4910 IF (VAL (MIDS (ESTCA'HS, 1, 2))) -31 >• {VAL (MID$ (ECATES, 1, 2))) -31 TBEN 4 990 4910 PUll'? fl, CHU (27) ;CBJ.$ (69) ;TAl(U); ·MM.Nillf., STMOAlD cuavr. IS OLDER
TB.AN ONE Mal'?B ! ! ";CDS f21) ;CBU (10) 4990 PJ.Ilf'? 13, CBU(21);CUS(7l);CBU(l) 5000 Pltll'? 13, CHU (12) 5010 CLOSE 5020 LJ:-4: LY•l21: E!l'?-S'?UNGS(19,321: COSUB 20050 5025 LX-41 LY•30: U:T-STaINGS(19,32): OOSUB 20050 5030 HU I LX-222: LY•321: zs-r-·Int-irate Another (y/n) ?" 1 OOSUB 20050 5035 DEF S~01 POii:! 1050,P!.l:Jt:(1052): C!.F Sr.G: POI(! 10,,0 'clN.r lr:brd buffer 5040 Ol•INJt:IYS1 Ir os-·· '?IIEII 5040 5050 Ir Qt<>·•· A11D QS<>'"n" '?BI.N 5060 5051 CHAIN "A:RPLC" 5060 IF QS<>"Y- .UC QS<>•y• TllW SOUND 40,101 GOTO 5040 5010 CLL\J. 5010 Q01'0 220 9'99 END 10130 lDt lltllllllllltllll Inteqration Cursor C.0-and Menu fllflflfllfllfll 10140 J.DI 10142 LINTS•l 10144 CALL LEYEL(LINTS) 10150 LX•4: LY•l21t z:sr-snIN.:;.f(19,32) 10160 CALL '?l!XTB(LX,LY, UT) 10170 LX•41 LY•34l1 !.ST-SnIN.:;.f(19,32)

Chromatographic software 178
10180 CALL ff.XTB(LX,LY,EST) 101 to LX•27: LY•l21: UT-"CUJtSOI. CClfol'IANOS: Uae L lo J. .arrow
key• -- <shift> - lOX" 10200 CA.LL ffXTB(LX,LY, UT) 10210 LX•21: LY•JO: tsT-"IHTtGR.ATIClf CCMHANDS: Start End CAJ'loel
Jted.o Proc.•• Quit• 10220 CALL TEX'TB(LX,LY,EST) 10222 LINTS•2 10224 CALL L.EV£L(LIN'?S) 10230 RETURN 20000 RF11 fttflfftttttttfffttttff GRAPB-X SubroutinH fffttttttttttftttfffft 20010 CALL !CW (LX, LY) 20020 RETURN 20030 CALL DLINE(LX,LY) 20040 RETURN 20050 CALL T!:XTB(LX,LY,EST) 20060 iH'.TURN
DISPLAY.SRC
10 k.EH PRCX.ilAM NI.ME• OISPLAY.SRC 94 REH 96 REH 200 IU:14 fffffflfftt Init111H the Scr .. n and D1111enaion Variables ttfftttlttl 210 RD4 220 DEFINT A,C,B,L-P,V: OEfDBL O,K,ll,S: DEFSTR t,F,I,0,T,X,Y: DEFSNC B 230 0 IM ASTO (5010), BSTO (5010), PICSTART ( 1, 25), PKr.ND (1, 2 5), DPKARr.A (25),
DPKltT (25), DPUMT (25), EPKNAMS (25), STOJ.T {20), STOXME"111 (20), STOYMEAN ( 20), STOSLOPE ( 20), IST0NAM$ (20)
240 PAGE•l: LINTS•l 250 CALL C.P11GE (PAGE) 260 CALL LEVEL (LINTS) 294 JtrJ,4. 296 REM 400 J.r.M tftffllllfttfftfflltffttf Starting PrOfflpts ffftttttttfffftfftffftfff 410 J.D4. 412 CALL CLRSCR 413 LX•.440: LY•JO: EST--Diaplay a Stored Chro111atogram" 414 CALL TEXTB(LX,LY,EST) 415 DEF SEC-0: POKE 1050,PEU:(1052): DEF SEG: POJtE 106,0 'clear kbrd buffer 416 FILES••• 420 LX•20: LY•l80: EST-"10.ME Of' FILE TO DISPLAY (exten•ion not pel"lllitted) • 421 CALL TEXTB(LX, LY, EST) 422 CALL DISP (PAGE) 423 Q$•INKEY$: Ir Q$•"" TBEN 423 ELSE CBAR•ASC(Q$) 424 IF (CBAll<>l3 ANO CB.AR<>I) AND (CRAll<32 OR CBAll>126) THEN SOUND 40, 10:
GOTO 423 425 IF CB.AR.•13 TBEN 435 426 IF CB.AR•I AMO LEN(FILE$)<1 THEN SOOND 40, 10: COTO 423 421 IF CB.AR-I "1110 LDl(FILES)>O THEN FILE$•LEFT$(FILU, (LEN(FILE$)-l)):
GOTO 429 428 FILES•FII.U+<JS 429 LX•415: LY•llO: EST•FILE$+" " 430 CALL TEXTB(LX,LY,E!T) 431 GOTO 423 435 IF MID$(FILE$,2,l) <>":•THEM FILU • "B:"+FILES 440 FOil LOOP• 1 TO LEN(FILE$): IF MID.S(FILE$,LOOP, 1) <>"."THEM NEXT LOOP
ELSE 442 441 GOTO 450 442 LINTS-0 443 CALL LEVEL (LINTS) 444 LX•2U: LY•328: EST•• EXTDISiai NOT Pr.R.MITl"ED " 445 CAI.L TEXTB (LX, LY, EST) 446 LINTS•l: BEU 441 FOil LOOPl • 1 TO 5: FOil LOOP2 • 1 TO 5000: NEXT LOOP2: NEXT LOOPl 448 CALL LEVEL(LINTSI 449 GOTO 412 450 IF LEM(FILl.$) < 11 THEN 4'° 451 LINTS-0 452 CALL LEVEL(LINTS) 453 LX•256: LY•321: EST•" TILE NNtt IS TOO LONG " 455 CALL TEXTB(LX,LY,UT) 456 Lil'IITS•l: BEU 451 FOil LOOPl • l TO 5: FOi. LOOP2 • 1 TO 5000: NEXT LOOP2: NEXT LOOPl 458 CALL LEVEL(LINTS) 459 GO'l'O 412 4 60 LX•20: LY•250: U'?-"J.N.dinq Data, Pleue Mait ••••• " 462 CALL TEX'l'B(LX,LY,ES'?) 465 FILl.DATAS • FILES+" .OAT" 410 OPEN FILEOATA,$ roa IMPUT A! tl 4 71 IMPtr? fl, £DATU, INJEC'?S, NOS»IPLS, JrullTIME, STAJt'?IHE 412 FO'- LOOP • 1 TO NOSAMPLS S'?U 20 413 INPUT tl, 80, l+IJ, Bl, Al, 82, A2, 83, Al, 84, A4, 85, A5, 86, A6, 81, A1, Bl, Al, 89,
A,, 810, AlO, 811,All, 812 ,Al 2, Ill ,All, 814,Al4, 815, Al 5, Bl6,Al6, Bl1, Al?, Bll,Al8,819,Al9
414 BSTO(LOOP) • 10 415 MTO(LCOP} • AO 416 BSTO(LOOP+l) • Bl 411 M'l'O(LCX)f+l) • Al 418 al'l'O(LODP+2) • 82 419 AIT0(1,00f+2) • A2 no UTO(LOOP+]) • 83 481 UTO{L(X)f+3) • Al 412 BSTO (LOOP+4) • 84 483 AITO(L<X»+4) • A4 484 B1TO(LOOP+5) • 15 '85 AITO(LOOP+.5) • A! 486 UTO(LOOf+') • a, 481 AITO(LOOP+,) • A' UI UTO{LCOP+7) • 81 48' AITO(LOOP+1) • A1 4 90 BS'l'O (LOOP+I) • 118 491 ASTO(LOOP+I) • Al 492 BST0(LOOP+9) • 19 4 93 ASTO (LOOP+ 9) • A9 494 BS'?0(LOOP+10) • BlO 495 A!TO(LOOP+lO) • AlO 49' BSTO(LOOP+ll) • 111 491 ASTO(l.OOP+ll) • All 491 BITO(LOOP+l2) • 112 4'9 A!TO(LOOP+l2) • Al2 500 BSTO(LOOP+ll) • 113 501 Al'?O(LOOP+ll) • Al) 502 UTO(LOOP+l4) • 814 503 Al'?O(LOOP+14) • Al4 504 1S'?O{LOOP+l5) • 815 505 A!TO(LOOP+l5) • Al5 506 BSTO(LOOP+UI • 816 501 ASTOILOOP+U) • AU 508 UTO(LOOP+l1) • 811 509 A!TO(LOOP+l1) • Al 1 510 BSTO(LOOP+ll) • 818 511 A!TO(LOOP+ll) • All 512 ISTO (LOOP+ U) • 819 513 ASTO(LOOP+l9) • AU 514 NUT LOOP 515 CLOS& 520 rILE,QOAIITt-rn.u+• .an·
525 OPEN FIU.QUANTS AS fl LEN • 27 530 Fil.LO fl, 2 U l.MU~TllTU, 10 .U lSTOTS, 3 AS EfLAC$, 12 AS EDUMMY$ 535 GET tl, l 540 NUMSTJ.TS • CVI (DIUMSTJtTSS) 550 l.STOATE.S • ESTOTS 555 FLAG$ • £FLAGS 556 IF FLAG$ <> "YES" TRI.N CLOSE: KILL FILEQU"111T$: FLAG$•"NO•: GOTO 575 560 FIELD fl, 3 AS ENN4E$, 8 A! EPKRTS, 8 AS tPKAll.A.$, 8 .U EPPCAMT$ 565 FOR LOOP • l TO NUMSTRTS 566 GET 11,LOOP+l 561 EPKNAMS(l.OOP) • r.NN4ES 568 DPKRT(LOOP) • CVD(EPKRTS) 5 69 DP KAJlE.A (LOOP) • CVD ( EP KM.EA$ ) 510 DPKMfl'(LOOP) • CVDlEPKN4T$) 511 NEXT LOOP
572 CLOSE 515 PAGE•O: LINTS•l 580 CALL GPAGE(PAGE) 585 CALL LEVEL (LIH'l'S) 590 CALL CLUO 594 R.F.M 596 RDt 600 R.DIJ tttHffUIIHtttfffffllf Draw R.unnlnq Scr-n tffUtUUlfltflltttftl 610 UM 620 LX•JO: LY-0: OOSUB 20010 630 LX•JO; LY•260: OOSUB 20030 632 LX•630: LY•260: GOSUB 20030 634 FOil HAJlJ( • 256 TO O STEP -10 636 LX•30: LY--+IAIU{: OOSUB 20010 638 LX•25: LY-MAU: OOSUB 20030 640 NEXT MAM 642 FO'- MAJlJ( • 30 TO 630 STEP 20 644 LX"""-DJC: LY•260: GOSUB 20010 646 LX~J(: LY•265: GOSUB 20030 648 NEXT MAU 650 FO'- MAJlJ( • lO TO 630 STU 100 652 LX"""-DJC: LY•265: GOSUB 20010 654 LX"""-Alllt: LY•210: GOSUB 20030 656 NEXT MAU 658 FOR MARJ( • JO TO 630 STEP 200 660 LX"""-AJlJ(: LY•270: GOSUB 20010 fi62 LX"""-Allll'.: LY•275: C.OSUB 20030 664 NEXT MAM 666 LX•21: LY•291: EST-'"15": OOSUB 20050 668 LX•l21: LY•291: EST•"20": GOSUB 20050 670 LX•221: LY-291: r.sT-·25•: C.OSUB 20050 612 LX•321: LY•291: EST•'"30": GOSUB 20050 614 LX•421: LY•291: EST•"35": GOSUB 20050 616 LX•521: LY•291: tST•"40": C.OSUB 20050 611 LX•621: LY•291: l.ST•"45": C.OSUB 20050 680 LX•211: LY•305: EST•"TIME {min•)'": GOSUB 20050 700 LX•30: LY•343: EST•"FILf. • •+FILE$: QOSUB 20050 710 CALL CUP (PAGf.) 796 llD1 800 lEM tttttfttfffftllUttfttftt Draw ChroaatoqrM tllttlltttttttttllttllll 110 LX•((CHIT((ISTO(l)-15)•20))+)0): LY•ASTO(l) 820 CALL PLC7l' (LX, LY) 130 CALL !«)VE (LX, LYI 840 FOi LOOP • 2 TO NOSAMPLS 850 LX•( (CINT ( (BSTO(LOOP) -15) •20)) +30) : LY•ASTO (LOOP) 860 CALL OLINE (LX, LY) 810 NEXT LOOP 1100 l£H Httffffttfttttttttff Draw Q\lant1tat1on Data ttfftfttttttttfHIIHI 1110 If FLAQ..$ • '"'!ES" THEM 1100 1114 LX-4: LY•l21: EST-STU NC$ (79, 32) 1115 CALL Ttx'?B(LX,LY,EST) 1116 LX-C: LY•Hl: EST-ST1lINC$ (19, 32) 1711 CALL '?t.xTB (LX, LY, EST) 1111 LIN'?S•O 1719 CALL Ltvn (LINTS) 1720 LX•lU : LY•321: EST•" Ch.roaatogr- B.a• Not Been Integrated " 1130 CALL TEXTB (LX, LY, EST) 1134 LIN'?S•l 1136 CA.LL LEVIl(LIMTS) 1140 LX•l95: LY•JU: ES'?-"Preu any key to c:ontinue., .. ,• 1150 CALL TEXTB (LX, LY, f.ST) 1155 If INUYS••• TllN 1755 1160 GOTO 4100 1100 lf.M ------- Print Qua11t1tated Data on S•~nd
4
Graphic• Paqe ----------1110 PAGZ•l: LIN'?S•l 1120 CALL C.PAG!. (PAGEi 1130 CALL Ltvn (L HITS I 1840 CALL Ct.I.SCI 1150 LX•ll: LY•20: ES'?-"FIL!.: "+FILE$ 1155 CALL TEXTB (LX, LY, EST) 1160 LX•2H: LY•20: EST•"IMJECTION TIME: "+INJECT$ 1165 CALL TEXTB (LX, LY, ES'?) 1870 LX•611: LY•20: f.ST•EDATES 1175 CALL TUTl(LX,LY,EST) 1880 LX•ll: LY•l4: EST-STUNC$(16,205) 1185 CALI. TEXTB(LX,LY,EST) 100 LX•J 61 LY•O: U'?-"PN.k llo." 105 CALL TUTB(LX,L'!,!.ST) 1900 LX•l 71: LY-41: En••Peak N••" 1905 CALL TUTl(LX,LY,EST) 1910 LX•2'7: LY-48: EST•" .. tention Ti ... 1915 CALL TU'?B(LX,LY,EST) 1920 LX-4H1 LY-411 tST•"Ar.._• 1925 CALL TU'?B (LX, LY, EST) 1930 LX-6211 LY-48: ES'?•"Alllount" 1935 CALL Tl.XTI (LX, LY, EST) 19,f;O LX•ll1 1.1'•'2: U'?-1TllNC.S(76,196) 1945 CALL Tll't'B(LX,L1',1ST) 1950 FOi LOOP! • 1 1'0 Nt.14STl'l'S 1960 LY•62+(LOOP1•14): ES'?•STllS(LOOPl) 1970 IF LEW (UT) >2 '?UW LX-4S &I.SE LX•54 lMO CALL '?tXTB(LX,LY,ES'?) lHO LX•l981 LY•62+(LOOPP14) 1 l.ST•EPKNAMS (LOOPl) 2000 CALL T!XTB(LX, LY, UT) 2010 TIMPS-STJ.SIDPD.T(LOOPl)) 2020 LX•324: LY•62+U.oc:»1•14): tST•LtFTS (T!MU, '1) 2030 CALL TEXTB(LX,LY, ES'?) 2040 TIMPI-STJ.l(OPKAll.A(LOOPl)): CBECJC-0: LOOP2•1 2050 WBILE cno: < l 2060 TS'?.S-ttIDS (TEMP$, LOOP2, 1) 2010 IF '?STS<>•." '?UN 2110 2080 LX-486-(9•LOCJP21 2090 U'?-LEF'U(TEMPS, LOOP2+6) 2100 CB.f.CJl:•l 2110 LOOP2•LOOP2+1 2120 lffJID 2130 LY•62+(LOOP1•14) 2140 CALL '?EXTB(LX,LY,UT) 2145 Ir DPltNff (LOOPl) •O TBDI LX•612: EST•• 0 .OOOO•: GOTO 2240 21SO TDU'S-STJ.S(DPltNff(LOOPl)): CBECJt•O: LOOP2•1 2UO WBILE CUO: < l 2110 Tl'?S-ttIDl(T!.MPI, LOOP2, 1) 2110 IF TSTS<>"." TUN 2220 2UO LX-639-C,•LOOP:ZI 2200 UT-L&l"U rrr.MPS, LOOP2+4) 2210 CBECJl:•l

Chromatographic software 179
2220 LCX)p2•LOOP2+1 2230 WDID 22'0 LY•62+(LOOP1'1') 2250 CALL Tl.XTB(LX,LY,EST) 2260 NIX'? LOOPl 2210 LX•ll: LY•62+( (NUMSTlTS-tl) •14): EST•STJlHIG$ (76,205) 2280 CALL TtxTB(LX,LY,!.ST) 2290 LX•54: LY•62+( (NUMSTJt.TS+2) *14): £ST•"Quant1tate<i data •xtrapolated from
standards recorded. on: "+ESTOATES 2300 CALL TtxTB (LX, LY, EST) 2310 IF VAL(HIDS(ESTOATES,4,2)) • VAL(MIDS(EOATt.$,4,2)) THEN 2390 2320 !F (VAI.(HIDS(ISTOATE$,l,2)))-31 >• (VAI.(MIDS(EDATES,1,2)))-31 TB.F.N 2390 2330 LIH1'S•O 2340 CALL LEVE.I. (LINTS) 2350 LX•140: LY•62+((NUMSnTS+JJ•14): EST•" WARNING, STANDARD CURVE IS 0LD£R
THAN ONE MCWTB " 2360 CALL TEXTJS(LX,LY,EST) 2390 PAGE-0: LIN'I'S•l 2400 CALL LEvtL (LINTS) 2410 CALL GPAGE (PAGE) 3730 REH ------------------ Print Retention Ti.JIies on Screen ----------------3740 FOR LOOP l • l TO NUMSTRTS 3750 LX - CINT( (DPKRT(LOOPl)-15) *20) +30 3760 CRECK-0: LOOP2-0 3770 WHILE CRECK<l 3780 LY•LOOP2 3790 CALL GETPT (LX, LY, Ce.£0:) 3800 LOOP2•LOOP2+1 3810 N£ND 3815 PTX • CINT((DPKRT{LOOPl)-15) 1 20)+27 3820 HIGH.POINT • LOOP2-l 3830 IS• STllS(DP!t:RT(LOOPl)) 3850 IF BIGJIPOINT < 27 Te.EN PTY • 27 ELSE PTY • BIGBPOINT 3860 FOR LOOP5 • 2 TO 6 38"10 IF HIDS(U,LOOP5,l) ••,•THEN PTY•PTY-3: GOTO 3920 3890 CB..UACTER • VAL(HIDS(U,LOOP5,l))+l 3900 PTY • PTY - 6 3910 Cli' CB.U.ACTER GOTO 3923,3932,3931,3947,3960,3966,3917,
3981, 3994, 4009 3920 LX•PTX+6: LY•PTY: GOSUB 20010 3 921 LX•PTX+5: LY•PTY: G0SU8 20030 3922 GOTO 4030 3923 LX•PTX+l: LY•PTY: GOSUB 20010 3924 LX•PTX+5: LY•PTY: G0SU8 20030 3925 LX•PTX+6: LY-PTY+l: G0SU8 20030 3926 LX•PTX+6: LY•PTY+2: 00508 20030 3927 LX•PTX+S: L'!•P'l'Y+3: GOSUB 20030 3928 LX•PTX+l: LY•PTY+3: GOSUB 20030 3929 LX•PTX: LY•PTY+2: GOSUB 20030 3930 LX•PTX: LY•PTY+l: GOSUB 20030 3931 GOTO 4030 3932 LX•PTX+6: LY•PTY+l: GOSUB 20010 3933 LX•PTX+6: LY•PTY: GOSUB 20030 3934 LX•PTJ:+5: LY•PTY+l: GOSUB 20030 3935 LX•PTX: LY•PTY+l: GOSUB 20030 3936 LX•PTX+2: LY•PTY+3: GOSUB 20030 3937 GOTO 4030 31J38 LX•PTX+6: LY•PTY: GOSUB 20010 3939 LX•PTX+6: LY•PTY+3: GOSUB 20030 J 940 LX•PTX+5: LY•PTY+3: GOSUB 20030 3941 LX•PTX+2: LY•PTY: GOSUB 20030 3942 LX•PTX+l: LY•PTY: GOSUB 20030 3943 LX•PTX: LY•PTY+l: GOSUB 20030 3944 LX•PTX: LY•PTY+2: GOSUB 20030 3945 LX•PTX+l: LY•PTY+J: GOSUB 20030 3 94 6 GOTO 4030 3947 LX•PTX+l: LY•PTY+3: GOSUB 20010 3948 LX•PTX: LY•PTT+2: OOSUB 20030 3949 LX•PTX: LY•PTY+l: GOSUB 20030 3950 LX•PTX+l: LY•PTY: GOSOB 20030 3951 LX•PTX+21 LY•PTY: GOSUB 20030 3952 LX•PTXt3: LY•PTYtl: GOSUB 20030 3 953 U•PTX+l: L't•PTYt2: GOSUB 20030 3954 U•PTX+4: L't•PTY: GOSUB 20010 3955 LX•PTXt5: LY•PTY: GOSUB 20030 39Sfi U•PTX+6: LY•PTY+l: GOSUB 20030 3 957 LX•PTX+6: LY•PTY+2: QOSUB 20030 3 951 LX•PTX+5: LY•PTY+3: GOSUB 20030 3 95 9 GOTO 4030 3960 LX•PTX+l: LY•PTT+3: GOSUB 20010 3 9fil LX•PTX+4: LY•PTY+3: GOSUB 20030 3962 LX•PTX+4: LY•PTY: QOSUB 20030 3963 LX•PTX+61 LY•PTY+l I QOSUB 20010 3964 LX•PTX: LY•PTY+l: QOSUB 20030 3 965 GOTO 4030 3966 LX•PTX: LY•PTY: GOSUII 20010 3967 LX•PTX: LY•PTY+3: QOSUB 20030 3 961 LX•Ptt+2: LY•PTYt3: QOSOI 20030 3969 LX•PTl:+2: LY•PTY+l I QC.SUI 20030 3970 LX-PTl:+31 LY-PTY; QOSOI 20030 3 911 Llt-PTl:+S I LY-PTT: QOSOI 20030 3972 LX-l'Tl:+11 LY-PTY+l I QOSUI 20030 1971 LX-l''n+l1 LY-PTY+21 QOSUI 20030 3914 LX-tff+51 LY-PTT+] 1 QOIUI 20030 3915 LX-fff+4 r LY-PTY+31 QOSUI 20030 3916 QO!O 4030 3917 LX-PTX+l; LY-PTYz QOSOI 20010 3971 LX-tff1 LY-Pfftl: QOSUI 20030 3979 LX-P'n+21 LY..Pff+3t QOIUI 20030 3910 LX-Pff+J I LY ... TY+3: QOSUI 20030 3911 LX-Pfftlz LY-PTY+21 CilOIOI 20030 3912 LX-P'!Xtl1 LY-PTY+l I QOIUI 20030 3913 LX•PTX+5: LY-PTY1 QOSOI 20030 3914 LX-PTX+4: LY•PTY: QOIUI 20030 3915 U-PTX+31 LY•PTY+l1 QOSUB 20030 3916 LX•PTX+l: LY•PTY+2: QOSUB 20030 3917 GOTO 4030 3911 LlC•PTX: LY•PTY+3: QOIUI 20010 3919 LX•PTX: LY•PTY: QOSUI 20030 3990 LX•PTX+2: LY•PTY: QOSOI 20030 3991 LX•PTX+5: LY.PTT+] 1 QOSOI 20030 ]'92 LX-PTX+, 1 LY•PTY+3: oosua 20030 3993 QOTO 4030 3994 LlC•PTX+2: LY•PTY+3: QOSUB 20010 399S LX-PTX+l: LY•PTY+31 00101 20030 3996 LX•P'?X1 LY•PTY+21 OOIUI 20030 3991 LX-PTX1 LY•PT'Ytl: QOIUI 20030 3991 LX•PTXtl: LY•PTY1 GOIOI 20030 3999 LX•PTX+2: LY•PTYz 00101 20030 4000 LX•PTX+l: LY•PTY+l: QOSUI 20030 400 l U•PTX+3 1 LY•PTY+2 1 QOIUB 20030 4002 LX•PTX+4: LY•PTY+3: OOSUI 20030 4003 LX•PTX+S: LY•PTYt3: QOSUI 20030 4004 LX•PTX+6: LY•PTY+2: QOSOI 20030 400S LX•PTX+6 1 LY•PTY+l: OOSUI 20030 4006 LX•PTX+S I LY•PTY: QOIUI 20030 4001 LX•PTX+4: LY•PTY1 QOIUB 20030 4001 GOTO 4030 4009 LX-PTX+6: LY•PTY+2: OOSUB 20010 4010 LlC•PTX+4: LY..PTY: GOIOI 20030 4011 LX•PTX+l: LY•PTY: GOSOI 20030
4012 LX-PTX: LY•PTY+l: GOSUB 20030 4013 LX•PTX: LY•PTY+2: GOSUB 20030 4014 U:•PTX+l: LY•PTY+3: GOSUB 20030 4015 LX•PTX+2: LY•PTY+3: GOSUB 20030 4016 LX•PTX+): LY•PTY+2: GOSUB 20030 4017 LX•PTX+l: LY•PTY+l: GOSUB 20030 4030 NEXT LOOPS 4040 N£XT LOOPl 4100 REH -------------------- Print .B.ardcopy of Ch.romatoqraJ11 ---------------4102 LX-4: LY•328: EST-STRING$ (79, 32): GOSUB 20050 4103 LX-4: LY•343: £ST•STRINGS(79,32): GOSUB 20050 4104 LX•92: LY•J28: EST•"Mould You Like a Hardcopy of the ChrOlllatoqra.lfl
(y/n) ?·: G0SU8 20050 4105 Q$•Il0CEY$: IF QS••• TH!:H 4105 4106 IF Q$••1r Oil Q$•"n• THEN 4180 4101 IF QS<>·r AHO QS<>•y• THEN SOUND 40,10: GOTO 4105 4110 LX-4: LY•)28: EST•STR.INGS(79,32): GOSUB 20050 4112 LX•4: LY•l43: EST•S'?RINGS(H,32): GOSUB 20050 4118 BEEP: LX•96: LY•328: tST•·Pr••• <[•hift) PrtSc-1> wh•n thi1 m•su.ge
diuap .. ra•: GOSUB 20050 4120 LX•l95: LY•343: EST•·Pr••• any lc•y to continue. .": GOSUB 20050 4130 IF IN!t:£YS • "" Te.EN 4130 4140 LX•4: LY•343: EST-STUNG$ (79, 32): GOSUB 20050 4150 FOJ. LOOP - l TO 5000: N£X'? LOOP 4160 BEEP: LX-4: LY•l28: EST•STRINGS(H,32): GO!UB 20050 4170 IF IN!t:EY9 • ... Te.EN 41 70 4180 REM ----------------- Print B.ardcopy of Quantitat•d Data ------4190 IF FLAG$<>·YF.!• TBEN 5020 4200 LX•4: LY•l21: EST•STRING$ (79, 32): GO.SUB 20050 4210 LX-4: LY•343: £ST•,'TR1NGS (79, 32): GOSUB 20050 4220 U•H: LY•328: EST•·Nould You Lik• a Ba.rdcopy of the Quantit.a.tad Data.
(y/n) ?": OOSUB 20050 4230 0$•INKEY$: IF 0$•"" TH£H 4230 4240 IF QS•"ll" Cl. Q$•"n· TBtN 4600 42SO IF QS<>"Y-- AND QS<>"y" THEN SOUND 40, 10: Gal'O 4230 4260 LX-4: LY•321: EST•STRING$ (79, 32): GOSUB 20050 42"10 U:•4: LY•l43: EST•STJ.INGS (79, 32): GOSUB 20050 4210 LX•240: LY•328: EST•"Cheek Printer !tatu•": GOSUB 20050 4290 LX•l95: LY•343: EST•·Pr•n any lc•y to continue .... ,": GOSUB 20050 4300 IF IN1".EY$ • •• THEN 4300 4310 OPDI •tPTl: • AS fl 4320 NID1'8 fl,10 4330 PRINT tl, C8R$(2"1);CBJ.$(73J;CBR$(2): PRINT tl, CHR${13);CHRS(l0) 4340 PRINT t], TAB(l);-FILEl •;FILES;TAB(34);'"INJECTION TIME!
INJEC"l'$;TAB(64);EDATU: PRINT #3, CBJ.S(l3);CRJl.$(10) 4350 PJ.INT fl, TAB()) ;STllINc;.$ (16,205) 4360 PRIN'!' tl, TAB(5);•Pea.k No.";TA.B(20);"P•alc N&Me•;TAB(J4);
·11etent ion Ti .. " ;TAB (55): ·.1.rea• ;TAB (70); ·Mount• 4370 PJ.INT t3, TAB(l) ;STRINC..S (76,196) 4310 FORMA.TlS ft 4390 l'OIIMAT2S • "\ - - - - - \ - - - - - - - - - - - - -
4400 FORMA.Tl.S • "tt.ttt ttt.tttttt tttt.fftf" 4410 roa LOC» - 1 TO NuMST1tTs- - - - - - - - - - -4420 PRINT fl, USING FORMATlS; LOOP; 4430 PRINT fl, USING FORMAT2$;EPXNN1$(LOOP); 4440 PJ.INT fl, USIMG FoaKAT)S;DPDT(LCX)P) ;DPKAllA(LOOP) ;DPMM? {LOOP) 4450 NErr LOOP 4460 PRINT fl, TAB(]) ;Sn.ING$ (76,205) 4410 PUNT t3, TAB (7); "Quantitat•d data •xtrapolated from. 1tandard1
recorded on: "; ESTDATEt 4410 IF VAL(MIDS(ts'!"OATU,4,2)) • VAL(MIDS(F.DATU,4,2)) TREN 4510 4490 IF (VAL(MI0t(ESTDATE$,l,2)))-3l >• (VAL(HID$(EDATE$,l,2)))-31 THEN "4510 4500 PJ.INT fl, CBJ.S(27);Cll$(69);TAB(l6);•1fAJt.NINC, STANDAIU) CURVE IS OLDER
TUN OME MClilTB I !";CDS(21);CBU(?O) 4510 PUNT tl, CBU(27);CJlJ.S(73);C8U(l) 4520 PlIHT fl, CBU(l2) 4530 CLOSl. 4600 J.l.M -------------- Vi•w Qu.ntitated Data on th• CRT ----------------4610 IF rJ.AG..t<>"Yts" THEN 5020 4620 LX-4: LY-321: EST-STJ.INGS (79, 32): oosua 20050 4630 LX-41 LY•34l: l.ST-STllINGS(79,32): OOSUB 20050 4640 LX•56: LY•321: EST•·Nould You Like to View the Quantltated Oat• on the
O'T (y/n) ?": GOSUB 20050 4650 QS-INKl.YS: Ir os-·· TBEJI 4650 4660 IF Q$•"11" ca. QS••n• TBDI 5020 4'70 If QS<>•Y" AlfO QS<>•y" Te.EM SOUND 40, 10: Gal'O 4650 4610 PAGJ:•l: Llll'?S•l 4690 CAl.L QPAGr. (PM.!.) 4100 CALL LEV!..L (LINTS) 4110 CA.L.L DISP (PAG!.) 4720 LX-41 LY•343: l.ST-S'l'UNGS (H, 32) 4130 CA.L.L TE.XTB(LX,Lr,EST) 4140 LlC•163: LY•Hl: r.s-r-•Preu any key to return to chro11atogrM1 .••.. " 4750 CA.L.L T!.X'?l(LX,LY,tS'l') 4760 Dl.F sr.c:;..01 PC:S:l. 1050,Pll1".(1052): DEF SEC: POKE 106,0 'cl .. r lcbrd buffer 4770 tr IN!ttYS•"• TR!.lf 4710 4710 PAGE-0: Llll'?S•l 4790 CALL QPAGE (PJiGt) 4100 CALL LEV!..L (LllfTI) 4110 CALL DISP (PAGE) 5020 LX-4 t LY•3211 UT-ITJ.I11QI (7t, 32) : GOSUB 20050 5030 LX-4: LY•34l: UT-S'l'lINGS (79, 32) : QOSUB 20050 5040 BEU: Lll'.•240: LY•321: U'?--View Another (y/n)?": GOSUB 20050 5050 DEF SEG-0: PCS!. l0S0,PUK(l0S2): DU SEC: POKE 106,0 'el .. r lcbrd buff•r 5060 Ql•INKEYS: Ir QS••• TBDI 5060 S010 IF Qt<>•w• ANO Q$<>•n• T.UN 5110 5100 CRAIN "A:BPLC• 5110 IF QS<>·Y- AlfD Qt<>•y• TREN SOUND 40, 10: c:;oro 5060 5120 CLl.AI. 5130 QOTO 220 uu arc 20000 UM ttfftffHHHffttffHH C1'APB-X Subroutines HttttfttHUttttttttt 20010 CALL MOYE (LX, LY) 20020 lETUJJI 20030 CALL DLiltlLX,LY) 20040 l.E'?UJJI 200SO CALL T!.XTB(LX,LY,£ST) 20060 J.E'?Oll
CALIBRAT. SRC
10 llM ncx;UiM 11N1! • CALIBJ.AT.sac •• llM .. llM 100 lDI tttffffttffHHHttfffff Initialise the 1255 HHHHHHtttttttttlt 110 J.D( 120 OUT 611703, iB92 194 '-DC 196 J.Dt 200 J.Dt tttfttfttft Initilise the scr-n and 01 .. naion Variabl•• tttfffffftf 210 J.D( 230 DEJ"I'NT A, C, 8, L-P, V: OEJ"DBL D, 1"., J., S: DEFSTll l., F, I, Q, T, X, Y: D!.f!NG B 235 FILU•·A:11'11DlDr 240 DIM AST0(5010), UTO (5010), PltSTll'l' ( 1, 25), PllND (l, 2S), SSTDX (25),
SS'?DY (2S), SS"?DXY(2S), SITDXSQ(25), SS'!"OJ..T (2S), N (25), !.STDN»t$ (25), DPJ{U.l'..A 125), DPDT (25), DPIWIT 125), E.PIOfN1S (25)
2SO P11GE•01 LIN'l'S•l 260 CALL QPM.!.(PAGZ)

Chromatographic software 180
270 CALL LEV'EL (LIH"!'S) 280 CALL Cl.llSCJl 290 CALL OISP (PAGE) 294 JU'.M 296 llr.M JOO REH fffffffllfft Convert Date Fora.at frOf!I Arnerica.n to r.uropean ftftftftf 310 REM 320 EDATtS • OATES: MIDS(E.DATU,1,2) • MIDS(DATF.S,-4,2):
HIDS(r.DATU,4,2) • MIOS(DATU:,1,2) 394 RrJoll 3 96 RDt 400 REH ftfltftfftfHIIIIHHIIII Starting Pranpta flllllfflltffttfflffffllt 410 ROIi 411 IF !.REPtA'U • ·ns" TBEM 452 412 LX•40: LY-28: EST•"Thi• progr .. 1• ct.signed for the input of stand.a.rd
data. It 1• recolllfllended": GOSUB 20050 413 :.X•4: LY•56: EST•"that at 1 .. at five runa are made, ao that an accurate
standard curve can De": GOSUB 20050 -414 LX•-4: LY•84: EST•"d•rived. After each run you will select peak atart:11
and ends, £roll which ar-•·: GOSUB 20050 -415 LX•4: LY•ll2: EST•'"will D• calculated. Once thia is complete, the
retention ti.Illes will b,e '": OOSUB 20050 416 LX•4: LY•l40: EST•'"displayed on line 24 and you will b,e pro111pted for the
peak naJl'le and the uount. •: GOSUB 20050 417 LX•4: LY•l68: EST•'"After .. ch input you will ••• the valu•• displayed.
and a1ked if they are": GOSUB 20050 418 LX•4: LY•l96: EST•'"correct. If you have made an error, it can b4i
ad:)u1ted at this time.'": GOSUB 200SO 420 LX•225: LY-328: EST•'"Do you wi1h to continue (y/n)'?": GOSUB 20050 421 DEF SEG-0: POKE 1050,PEE.X(l052): DEF SEG: POl<E 106,0 'clear kbrd buffer 422 o.s-noa:.YS: IF QS•"'" TBI.N 422 423 IF QS•'"Y" OR QS•"y" TBI.N 452 424 lf Q,$•"N" Oil QS•"n" TBEN CHAIN •A:BPLC" ELSE SOUND 40, 10: GOl'O 421 4 52 LX•4: LY•328: EST•STR.ING$ p 9, 32) 453 CA.LL TEXTB(LX,LY, EST) 455 LX-167: LY-321: EST•'"Jwad.ing 1y1t- parwneter1, pl•••• wait •• ,,," 456 CA.LL TEXTB(LX,LY,EST) 460 PAGE•l: LINTS-1 470 CA.LL GP-'GE(PAGE) 480 CA.LL LEVEL(LIN'l'S) 4 90 CALL CLI\SCJl 557 OPEN "A:STNDJlDS .TMP" AS t1 LEN•45 558 rIELD fl, 2 AS EHUMRUNS$, 2 AS EHUMST0S$, 10 AS TODAY$, 3 AS FLAG$,
28 AS EDU~Y$ 559 GET fl. 1 560 IF FLAGS<>"YES" TH.EN NUMRUNS•l: NUMSTOS-0: GOTO 564 562 NUMRUNS • CVI (ENUMRUNS$): NUMRUNS • NUHRUNS+l: NUHSTOS • CVI (ENUHSTDSS) 564 CLOSE 570 LX•95: LY•l 14: EST•" UE YOU USING AN EXTERNAL TRIGGER TO START
SAMPLING {y/n) 1 " 572 CALL TEXTB(LX,LY,EST) 5i.3 CALL DI!P (P-'GE) 575 DEF SEG-0: POKl. 1050,P££J{{l052): DEF SEG: POKE 106,0 'clear kbrd buffer 580 EXTRS • INJt:EYS: IF EXTRS • "'" THEN 510 590 IF EXTll.$ <> "N" AHO EXTRS <> "n" AND EXTR$ <> "Y- AND EXTRS <> "y" THEM
SOOND 40, 10: GOTO 575 594 REH 5 96 REH 600 REH fffftttlllllltfllllllllt Draw Running Scr-n fftfftfftfffllffffllfff 610 REH 612 PAGE•O: LINTS•l 614 CALL GPAG[ (PAGE) 616 CALL LEVEL(LIHTS) 611 CALL CLR.SCR 620 LX•30: LY-0: OOSUB 20010 630 LX•lO: LY-260: GOSUB 20030 632 LX•630: LY•260: GOSUB 20030 634 FOl MARIi: • 256 TO O STEP -10 636 LX.•30: LY-+IAU: OOSUB 20010 638 LX•25: LY-MAll: QOSUB 20030 64 0 N EX'? MAJJt 642 FOl MARJ: • 30 TO 630 STU 20 644 LX--MAAlt:: LY-260: c;osun 20010 646 LX~JI'.: LY•265: c;osua 20030 648 NF.X'T MAU 650 roa MAJ.)( • JO TO 630 STEP 100 652 LX-MARJt:: LY•265: GOSUB 20010 654 LX~Jt:: LY•270: GOSUB 20030 656 NEXT MAU 658 rOl MAJ.It: • 30 TO 630 S'?!.P 200 660 LX-MARJI'.: LY•270: GOSUB 20010 662 LX-MAJ.11:: LY•27S: <.OSUB 20030 664 NEXT HAU 666 1x-21: LY•2 91: l!!IT-'"15'": oosua 2ooso 668 LX•l21: LY•29l: EST••20•1 GOSUB 20050 670 LX•221: LY•291: r.n--2s·: QOSUB 20050 672 LX•32l: LY•291: EST•"30": COIUB 20050 674 LX•421: LY•29l: EST•'"35": QOIUB 20050 676 LX•521: LY•2tl: ES1'•'"40": t'X.1108 20050 671 LX•621: LY•2'l1 EST••45•1 t'X.lltJB 20050 680 LX•2ll1 1?•3051 I.ST•'"TIM! (aina)": QOSUB 20050 690 LX•6il 91 L'f•l 11 U'?-&DA.Tl.$: QOSUB 20050 700 LX•lOt LY•34la u-r-•rtLE • •+rIU$1 GOIIUB 20050 710 LX•4501 L'f•l211 zn-·Saapl• N1.aher -·: QOSUB 20050 720 LX-4501 L!•3431 r.rr-•aun Tiae -·: c.olUB 20050 730 CALL DIIP CPM:I.) 196 I.EM 100 IDI fllffffffffffff S•pl• Ch.annal O - Exter~l Tri999r ftftfffftttfltf 110 REM 120 IF UTI.$ • •y• ca EXTU • "y" THE• CUIINEL • 0 l.LSE GOTO 1100 130 GOSOB 10000 140 LX•JO: LY•3211 UT--..1t1nq for Exterrwtl Tr ig~r ••••• ": GOSUB 20050 850 NBILI. VALUE < 2500 860 oosua 10000 870 lfEND 194 It.EM 196 JtD1 1100 REM Httffllll S•pl• Channel l - Abscrbanee Data froa HPLC tHHHftt 1110 llM 1120 CBAM'NEL-1: MOS»IPLS•O: L.ASTX•311 L.ASTY•256: RUM'I'IHE•O: BST0(0}-,006 1130 LX•lO: LY•321:· l.ST-STJ.lllc.$(35,32): QOSU8 20050 1140 LX•30: LY•321: ES1'•"Saaplinq ••••• ": QOSUB 20050 1150 S"l'.UTIM! • TIMD 1155 LX•301 LY•256 1156 CALL MOVE(LX,LY) 1160 IIBILE JtUHTIME <• 45 1170 t;OltJB 10000 1110 NOS»IPLI • NOIAMPLS + l 1190 ABVAL • 260 - ((CIWT(VALUE/1'))+4) 1200 11:UlltTIME • TIMER 1210 RUNTIME • ( ( (KUllTIMZ-STllTIMt) /60) +15) 1215 Ir lUHTIME < BSTO(NOSAMPLS-1) +.oo, THEN 1200 1220 PL'l'IME • ( (CIHT( {J.UWTIME-15) 1 20)) +30) 1230 LX-PLTIME: LY•UVAl., 1240 CALL DLI'NE(LX,LY) 1250 BS'?O(WOSAMPLS) • RUNTIME: AS1'0(WOSAMPLS) • ABVAL 1260 LX•540: LY•3431 TEMP$-ST1S(RUNTIME): l.ST-LI.f"rS(Tl.KP$, 10) 1265 CALL Ttr?B(LX,LY,UT) 1270 LX•515: LY•321: tST-STlt(NOSAMPLS) 1275 CALL TEXTB(LX,LY, UT) 1210 LX•6i21: LY•34t UT-'?IM!.S
1285 CALL TEXTB(LX,LY,EST) 1290 WI.NO 1294 REM 1296 REM 1 700 REM ftllfftttftt ftfftfttffff Ma.nual Integration Ifft ffffftfttffHlff U f 1710 REM 1720 LX•18: LY•328: EST•STJI.INGS(74,32): GOSUB 20050 172 5 LX•628: LY•34: EST•STRINGS (8, 32) : GOSUB 20050 1730 LX•lO: LY•O 1740 CALL MOVE(LX,LY) 1750 LX•lO: LY-259 1760 CALL OLIN!. (LX, LY) 1770 LINTS•2 1780 CALL LEVEL(LINTS) 1890 POSX•lO: NUHSTRTS•O: NUMENOS-0 1894 PLTI'EN • CINT(((BSTO(l0)-15)*20)+30) 1896 PLTEND • CIHT(((BSTO(NOSN4PLS-10)-15)•20)+30) 1900 SAMPOIN'? • COBL ( (NOSAHPLS-20) / (PLTEND-PLTI'EH)) 1910 GOSUB 10130 1930 REM ----------------------- Input Control Co111111a.nd ---------------------1940 IHOVES • INJ:EY$: IF IMOVES • "" THEM 1940 1942 IF LEH(IMOVES)>l AHO IMOVES-CBRS(O)+'"M" THEN MOVE•28: GOTO 1980 1943 IF LEN(IMOVES)>l AHO I!'1:JVE$-C8R$(0)+"l(" THEN HOVE•29: COTO 1980 1945 !'IJVE•ASC {IKJVES) 1950 IF MCIVE < 52 TB.EN 1940 1960 rr MOVE < 55 THEN 1980 1970 If HOYY.>65 AHO POSX>29 AHO POSX<631 THEN 2070 ELSE SOONO 40, 10:
GOTO 1940 1980 REM ---------------------------- Hove Cur1cr -------------------------1990 IF MOVE • 28 THEN P0SX2•POSX+l: COTO 2000 1992 IF MOVE • 54 TB.EN P0SX2•P0SX+l0: GO'l'O 2000 1994 If HOV'! • 29 THEN POSX2•P0SX-1: GOTO 2000 1996 IF MOVE • 52 THEN P0SX2•POSX-l0: GO'l'O 2000 1991 SOUND 40, 10: GOTO 1940 2000 IF POSX2<10 THEM BEEP: POSX2•10 2002 IF POSX2>640 TREN BEU: POSX2•640 2004 LX•POSX: LY•O 2006 CALL MOVE(LX,LY) 2001 LX•POSX: LY•259 2010 CALL OLIN!. (LX, LY) 2012 LX•POSX2: LY•259 2014 CALL MOVt. (LX, LY) 2016 LX•POSX2: LY-0 2011 CAL.I. OLIN!. (LX, LY) 2020 POSX•POSX2 2030 GOTO 1940
2040 REM ---------- Integration Control Coa111a.nd1 ----------2050 R£H 2060 REM ---------------------------- P .. k Sta.rt ---------------------------2070 IF MOVE• 13 OR MOVE• 115 '1'Bllrf SOUHO 523.25, .5 ELSE 2230 2080 LOOP• CINT((POSX-35)*SAMP0INT) 2090 Ir LOOP < 1 'l'BEN LOOP - 1 2100 rr LOOP > NOSAMPLS '?HEN LOOP • NOSAMPLS 2110 LOWPOIHT-0: FLAG.S•"fIJtST• 2120 C04PX • CIN'l'((BSTO(LOOP)-15) 1 20)+30 2130 IIBIL! CCMPX <• POSX 2140 IF CCMPX < POSX THEN 2180 2150 IF 1"1.>tGS•"FIJ.ST" TBEJI NUHSTRTS•NUHSTITS ... l:
PKS'l'ART (0, HIMSTR'l'S) •LOOP: FLAG.s•"NO" 2160 P!tSTART(l,NUHSTRTS)•LOOP 2170 IF AS'l'O(LOOP) > LOMPOIN'l' THEN L0lf1'0IMT • ASTO(LOOP) 2110 LOOP .. LOOP + l 2190 CCl4PX • CINT((8ST0(LOOP)-l5)•20)+JO 2200 ftND 2210 LX•POSX: LY•LOIIPOIMT+l 2211 CALL MOVE (LX, LY) 2212 LX•POSX: LY•LOWPOIHT ... 11 2213 CALL OLINE (LX, LY) 2214 LX•POSX+4: LY•LOWPOINT+ll 2215 CALL OLINE (LX, LY) 2216 GOTO U4 0 2220 Jt.EM ----------------------------- Peak End ----------------------------2230 IF MOVE• 6i9 OR KJV1! • 101 THEN SOOND 523.25, .5 r.Lst 2390 2240 LCXJP • CINT ( (POSX-25) •SAMPOINT) 2250 IF LOOP > NOSAKPLS THEM LCXJP • NOSNtPLS 2260 IF LOOP < l THEN LOOP • l 2210 LOIIPOINT--0: FL.liG.S•"FilST'" 2210 CCMPX • curr ( (BSTO(LOOP)-15) 1 20) +30 2290 WBILE CCMPX >• POSX 2300 Ir CCMPX > POSX TBlN 2340 2310 IF FL.JiGt••FilST" '?BEN NUMENDS-NUMEHDS+l: Plt:EHD (0, NUMENOS) •LOOP:
FLAG$•"MO• 2320 PU.ND(l,NUMDIOS)•LCXJP 2330 Ir AS'l'O(LOOP) > LOMPOINT THEN LClfPOINT • ASTO(LOOP) 2340 LOOP • LCXJP - l 2350 CCMPX • CINT ( (BS'?O(LCXJP)-15) 1 20) +30 2360 WEHD 2370 LX•POSX: LY•LOIIPOINT+l 2311 CA.LL MOV!.(LX,LY) 2372 LX•POSX: LY•LOIIPOINT+ll 2373 CA.LL OLINE (LX, LY) 2374 LX•POSX-4: LY•LOIIPOINT+l l 2315 CALL OLINE (LX, LY) 2376 QOTO 1940 2310 lEM ------------------------ c1 ... r Entry ---------------------------2390 IF MOYE <> 6i7 ANO HOV!. <> 99 TBlN 2740 2400 CAHCll--0: LOIIPOIHT-0 2410 Ir NI.MSTl'?S < 1 TBDI 2570 2420 f'OR LOOP • 1 TO NUMS'RTS 2430 CCMPX • CIN'l'( (BSTO(PU'?.UT(O, LCXJP) )-15) 1 20) +30 2440 IF CCMPX - POSX TBJ:.W CANCll • LOOP 2 450 NtXT LOOP 2460 Ir CANC'EL < l THEN 2570 2470 roa LOOI' - PJtSTAAT(O,CANC'EL) TO Plt:STAJ.'1'(1,CANCEL) 2410 IF ASTO(LOOP) > LOlf!'OIN'? TBEH Ltltf!'OINT • ASTO(LOOP) 24t0 NEXT LOOP 2500 SOUIID 500, .S: SOUND 32767, 1: SOUND 600, .S 2510 LX•POSX: LY•LOIIPOINT+l 2Sll CAl.l. MOY!:(LX,LY) 2512 LX•POISX: LY•LOIIPOINT+l 1 2513 CA.LL DLINE (LX, LY) 2Sl4 LX•POSX+41 LY•LOIIPOINT+l l 2515 CA.LL DLIR (LX, LY) 2520 roa LOOI' • CAIIC!L TO NUMSTR'?S-1 25]0 PKSTAl'?(O,LOOP) • PJtSTAl'?(O,LOOP+l) 2540 PltS'?AH(l,LOOP) • PKSTAA'?(l,LOOP+l) 2550 NEXT LOOP 2S60 NUNSTITS • NUMl'?HS - 1: c.a?O 1940 2570 IF NUMl'?lTS <l AND Nt.14ENDS<l 'l'BJ:.H SOON'O 40, 10: GO'l'O 1940 2SIO FOi LOOI' • 1 TO NUM!.HOS 2590 CCMPX • CINT( (BS'?O(PKEHO(O, ~) )-15) 1 20) +30 2600 Ir CCMPX • POSX THEN CAIICll • LOOP 2610 WEr? LOOP 2620 IF CMIC!.L < l TUJI SOUHD 40, 10: COTO 1940 2630 roa LOOP • PU.ND(l,CANC!.L) TO Plt:EHD(O,CAHCtL) 2640 IF AS'l'O(LOOP) > LClfPOINT '?BEN Ltltf!'OINT • ASTO(LOOP) 2 6SO lfEXT LOOP 2HO SOUND 500, ,Sr SOUND ]2767, l: SOUND 600, .5 2670 LX•POSX: LY•LOIIPOIN"J'+l 2671 CALL MO'n(LX,LY) 2672 LX•POSX: LY•LOIIPOIN'?+l l
Chromatographic software 181
2673 CALL OLINE (LX, LY) 2614 LX-PO:SX-4: LY•LONPOINT+ll 2 675 CALL DLINt (LX, LY) 2680 FOR LOOP • cANaL TO HUMENDS-1 2690 PICr.ND(O,LOOP) • PKr.ND(O,LOOP+l) 2700 PICEND(l,LOOP) - PXENO(l,LOOP+l} 2 710 NEXT LOOP 2720 NOMI.NOS • WUMENDS - 1: GOl'O 1940 2no Ilr.M ------------------------- Redo rro111 Start -------------------------2740 If MOVE<> 12 AND l«)V!. <> 114 TB£N 2140 2750 BEEP: LIH1'S•l 2751 CALL LEVT.L(LINTS) 2752 LX•4: LY•J21: EST•!TilINGS (79, 32): GOSUB 20050 2753 LX•4: LY•J43: EST-STRINGS (19, 32): GOSUB 20050 275.4 LX•lO: LY•328: EST•'"Jledc fro• Start ••... '": G05UB 20050 2755 LX•227: LY•343: EST•"COffIRH SELl.CTIOf (y/n) ": GOSUB 20050 2760 Q$ • INXEYS: If OS • "'" TBEN 2760 2770 IF Q$ • "y" OR QS • "Y" THEN 2790 2780 GOSUB 10130: GO?O 1940 2 790 CALL cu.sea 2791 LX•JO: LY•O: GOSUB 20010 2792 LX•JO: LY•260: GOSUB 20030 2793 LX•630: LY•260: GOSUB 20030 2794 roR MAJUC • 256 TO O STEP -10 2795 LX•30: LY-+tAJtX: GOSUB 20010 2796 LX•25: LY""f1ARX: GOSUB 20030 2797 N£XT MARX 2 798 FOR MAlU( • 30 TO 630 STEP 20 2799 LX-tO.IUC: LY-260: GOSUB 20010 2 800 LX-HAJU(: LY'•2 65: GOSUB 20030 2801 NEXT MARI( 2802 FOJ. M1J\X - 30 TO 630 STEP 100 2803 LX-tO.IUC: U•265: GOSUB 20010 2104 LX-MAJUC: U•270: OOSUII 20030 2 80 5 NEXT MARK 2806 FOR MAU - 30 TO 630 SUP 200 2807 LX-tO.IUC: LY•270: GOSUB 20010 2808 LX-MAIU(: LY•275: GOSUB 20030 2 80 9 NEXT MARX 2810 LX•21: 1'.!•291: EST•"l5'": GOSUB 20050 2811 LX•l21: U•291: EST-"20'": GOSUB 20050 2812 LX•221: LY•291: EST-"25": OOSUB 20050 2813 LX•321: LY'•291: EST-"30": OOSUB 20050 2814 LX-421: u-291: r.sT-"35": GOSUB 20050 2815 LX•521: LY•291: tsT-"40": GOSUB 20050 2816 LX•621: LY•2!H: EST-"45": GOSUB 20050 2817 LX•211: LY•305: £ST•"TIHE (ainal ": GOSUB 20050 2818 LX•((CINT((BSTO(l)-15)*20))+30): LY'•ASTO(l) 2819 CALL PLOT(LX,LY') 2820 CALL MOVE(LX,LY) 2821 FOJ. LOOP • 2 TO NOSAMPLS 2822 LX• ( (CINT ( (BSTO {LOOP) -15) *20)) +JO): LY•ASTO (LOOP) 2823 CALL DLINE{LX,LY) 2824 NEXT LOOP 2825 GOTO 1700 2830 ll£M ------------------------ Quit Int~ration ------------------------2840 Ir MOVE <> 11 AND I«>V!. <> 113 THEN 2900 2850 BEU: LINTS•l 2851 CALL LEVll(LINTS) 2852 LX•4: LY•321: EST-STRING.S (79, 32): GOSUB 20050 2153 LX-4: LY•JO: UT-STUNG$(79,32): GOSUB 20050 2854 LX•JO: LY•321: t!T•"Quit ••••• ": GOSUB 20050 2855 LX-227: LY•343: EST•"CONrIJtM SELECTION (y/n)": GOSUB 20050 2860 Q$ • INKtYS: tr 0$ • •• THEN 2160 2170 tr QS<>"y" ANO Q$<>'"Y- TBF.M 2110 2112 CALL CLJlSCR 2176 C.RAIN '"A:8PLC"' 2880 GOSUB 10130: GO?'O 1940 2190 llM -------------· Proce•• Data--------------2900 IF MOVE<> 10 AND l«)V£ <> 112 THEN SOOND 40, 10: GOTO 1940 2910 BttP: LINTS•l 2911 CALL LEVE.L (LINTS) 2912 LX-4: LY•J21: EST-STRIMG.9(79,32): QOSUB 20050 2913 LX•4: LY'•H3: ES'?-STlINGl(79,32): QOSUB 20050 2914 LX•30: LY•321: EST•'"Proceu ....... : GOSUB 20050 2,1s LX-227: LY•343: EST•'"CONFIN'I SE.LECTI<*I (y/n)'": GOSUB 20050 2920 QI • INKlYS: IF QI • •• THEN 2920 2,30 Ir QI • •y• ca QI • •y .. THEN 2950 2940 QOSUB 10130: QOTO 1940 2,50 LX-4: LY•321: &S'?-ST1lIMGS(79,32): OOSUB 20050 2955 LX-4: LY'•30: tST-STUNC$(7',32): QOSUI 20050 29'0 IF NUMSTITS • NUH!MOS TBDI 3030 2970 BEU: Ir NUMS"?RTS>NUH!NDS TBEN 2910 2,75 LX•ll7: LY•l21: U'?--WUMBEl Of' PEA){ STARTS < NUMBEJt Of' PEA){ !.HOS'":
C.OSUB 20050 2'77 GOTO 2 990 2910 LX-137: LY•J21: EST-"MUMBEI. OI" PF.IJC STAATS> NUHBEl or PF.IJC ENDS'":
C.OSUB 20050 2990 LX•l95: LY'•l4Ji UT- .. PNH any key to ccntinue ••••• ·: GOSUB 20050 3000 IF IJIJaYI••• TBEll 3000 3010 oosoa 101301 c;aro lHO 3020 llM --------------- lu»le Sort ---------------------------3030 llM 3040 CU.CK • l 3050 1111 ILi CUC:1'. 3060 CllCll • 0 3070 roa LOOP • l TO 11:MITl"?S-l 3010 IF IITO(Pl:rtAI.T(O, toe::.)) <• UTO(PKSTllT (0, LOOP+l)) TB&Jrl 3120 3090 S1IAP PKl'?Aa"T(O,LOOP),PklTAHIO,LOOP+l) 3100 S1IAP PD'?Aa"T(l,LOOP),PUTAr?(l,LOOP+l) )110 CIIJrl'.•l 3120 llEX'T toe::. 3130 111,111)
3140 CBEC'X • l 3150 WIIILE CBEC'I 3160 CllCJ( • 0 3170 rca LOOP• 1 TO ltMllfDS-1 3110 IF BITO(PIEND(O,LOCPI) <- BSTO(Pl(EJID(O,LOOP+l)) TBtlf 3220 JUO SWAP PJCE•D(O,LOOP) ,P.UND(O,LOOP+l) 3200 SNAP P1'END(l,LOOP) ,PUND(l.LOOP+l) 3210 CBECI • l 3220 NUT LOOP 3230 Ill.ND 3240 I.EM ----------------- Confint Order ----------------------------3250 !'Ol LOOP • l '?O NUMSD.TI 3260 IF PIITAJ.T (0, LOCP I <• P.UND (0, LOOP) TB.£N 3210 1210 car.a - c.111,a + 1 3210 NEXT LOOP 3290 IF CUCK < 1 TBEW 3360 3300 LX-4: LY•l21: UT-STU NCI {79, 32) I QOSOB 20050 3310 BEUi LX-171 LY•l21: EST•'"PEAI STAATS AND PEAi ENOS M.E NOT IN THE
COllr.cT c:aor.r: QOSOB 20050 3320 U:•19Sz LY-3431 U'?-'"PreH any key to ccntinu.., ••• •: GOSUB 20050 3330 IF INX!TI••• Tllll 3330 3340 QOSOB 101301 GOTO 1'40 3350 I.EM ---------------- Inteq-ration ---------------------------3360 LX-4: LY•l21: U"f-STlINCI {79, 32) : QOSUI 20050 3364 LX•l45 1 LT-3211 UT-·Calc:,,;alat1"9 ana for pealr: n\aber": QOSUB 20050 3366 LX-4731 LY•l21: U'?-"of•+snt(IIUMSTITS): C.OSUB 20050 3310 LINTS•2 3311 CAU LEVEL(LillTS)
3382 LX•POSX: LY•O 3313 CALL !4()1,{E(LX,LY) 3384 LX•POSX: LY•2S9 JJ85 CALL DLINt {LX, LY) 3386 LINTS•l 3387 CALL LEVEL (LINTS) 3390 f'OJl LOOP l • l TO NUHSTRTS 3400 LX•-435: LY•l28: EST•STRS(LOOPl) 3405 CALL TEXTB(LX, LY', EST) 3410 RDII ----------------- Baaelin• (LSRL) Calcula.t1ons -----------------3420 DSUMX-0: DSUMY•O: DXY-0: DXSQ-0: 81GBP0INT•67 5: fLAG.$•'"NO'" 3430 DXMEAN-0: OYMEAN•O: DLXY•O: OLX!Q-0: :.OWPOINT-0 3440 FOR LOOP2 - P!<STAJtT(O,LOOPl) TO PK!ITAJlT(l,LOOPll 34SO OSUMX - OSUMX + BST0{LOOP2) 3460 OSUHY' • DS\JHY + ASTO (LOOP2) 3470 DXY • OXY + BSTO(LOOP2)•ASTO(LOOP2) 3480 DXSQ • OXSQ + BST0{LOOP2)"2 3490 IF ASTO(LOOP2) > LC*'POINT TB&N LC*POINT • ASTO(LOOP2l 3500 NEXT LOOP2 3510 PTSTI.T • ((CINT((BSTO(PKSTAJlT(O,LOOPllJ-15)•20))+30) 3520 LINTS•2 3522 CALL I.EVEL(L!NTS) 3523 LX•PTSTllT: LY'•U::efPOINT+l 3524 CALL HOVE (LX, LY) 3525 LX•PTSTllT: LY•LCIIPOINT+ll 3526 CALL DLINE(LX,LY) 3527 LX•PTSTRT+4: LY•LCWPOUIIT+ll 3521 CALL DLINE(LX,LY) 3530 LC*POINT • 0 3540 roa. LOOP]• PKENO(l,LOOPl) TO PKEND(O,LOOPl) 3550 DSUMX • DSUMX + BSTO(LOOP3) 3560 D!UMT • OSUMT + ASTO{LOOP3) 3570 OXY • DXY + BST0(LOOP3)*AST0(L00Pl) 3510 OXSQ • OXSQ + 8STO(LOOP3) "2 3590 tr ASTO(LOOP3) > LOWPOINT THEN LCNPOINT • ASTO(LOOP3) 3600 NEXT LOOPJ 3610 PTEND • ( (CINT( (8STO(PXEND(0, LOOPl) )-15) *20}) +30) 3620 LX•PTEHD: LY•LOWPOINT+l 3622 CALL HOVE(LX,LY') 3 623 LX•PTEHD: LY•LOWPOIN'I'+l l 3624 CALL OLINE (LX, LY) 3625 LX•PT&M0-4: LY•LOWPOINT+ll 3626 CALL DLINE(LX,LY) 3627 LINTS•l 3628 CALL LEVEL(LINTS) 3630 N•PX!TAJtT (1, LOOPl) -Pl".START (0, LOOP l) +PKEND (0, LOOP 1 )-PXEND ( l, LOOP l) +2 3640 DXHEAN • OSUMX/N: OY'HEAN • DSUHY/N 3650 DLXY•DXY-(OSUMX*DSUMY/N): OLXSQ-OXSO--( (DSUHX'"2) /N): SLOPE-OLXY/DLXSQ 3660 RD4 --------------- calculate Ar•• , Retention Time ----------------3670 roa LOOP4 • Pl".STAJtT(O,LOOPl) TO PJCEND(O,LOOPl)-1 3690 DBAIL • DYMEAN+SLOPE• (BST0(LOOP4)-DXM&AN) 3700 DBA!l • DYMEAN+SLOPE*(BSTO(LOOP4+1)-0XMEAN) 3710 DUPRSID - ABS(MTO(LOOP4)-ASTO(LOOP4+1)) 3720 DLNJ..SID • ABS (DBASL-DBASR) 3730 IF ASTO(LOOP4)<ASTO(LOOP4+1) THEN DTEMPYl•ASTO(LOOP4+1)
E.LSE DTr.MPYl•ASTO(LOOP4) 3740 3750
3760 3770 3710 37'0 3100 3110 3120 3130 3140 3150 3160 3110 3190 3900 3910
3920 3921 3922 3923 3,24 3925 3926 3927 1,21 3,2, 3930 3931 3932 3933 3934 3935 393' 3937 3931 3939 3940 3941 3942 3943 3944 3945 3946 )9.'7
3941 390 3950 3951 3t52 3953 Jt5• 3955 3956 3957 3t51 3959 lHO JHl 3H2 3963 39'4 39'5 396i 3967 lHI 3969 3970 3971 3972 3973 3974 3'75
IF D&AJL>DBASJ. TB.EN DTEMPY2•0BA!ll ELSE OTEMPY'2-0BASL DPKUEA(LOOP 1) -OPIC.Ut.A (LOOPl) + ( (BSTO (LOOP4 +l )-BSTO (LOOP4)) t ( {. 5•DUPlSID) + (, 5 *DLWllS ID) +DTD4PY2-0TD4PY1}) IF ASTO(LOOP4) >•BIGBPOINT TB&M 3780 OSTRTIT-UTO(LOOP4): BIGBP0INT•ASTO(L00P4): FLAGS•'"END'" Ir UTO(LOOP-4) •BIGBPOINT OJ. rLAG.S<>•EJilD" THEN 3800 DENDJlT•ISTO(LOOP4-1): F'LIIGS••No•
NUT LOOP4 DPllT (LOOPl) • DSTITIT+ ( (DENDJlT-DSTRTllT) /2) JlD'I ---------------- Print btention Ti••• on sc.r-n ---------------11 • S'?J.$(0Pl".HILOOP1)) PTX • CilfT((DPlt'lT(LOOPl)-15)•20)+27 Ir RICJI.POINT < 27 TRElf PTY • 27 ELSE PTY' • HIGHPOINT roa LOOPS • 2 TO 6
Ir MIDI ( U, LOOPS, l) • •. • THEN PTY•PTY-3: GOTO 3 920 CILUACTEI. • VJ.L(MIDS(l$,LOOP5,l))+l PTT • PTT - 6 al CBAJ.ACTt.l GOTO 3923,3932,3931,3947,3960,3966,3977, 3911,3994,400, LX•PTX+6: LT•PTY: QOSUI 20010 LX•PTX+5: LY•PTY: QOSUB 20030 COTO 4 030 LX•PTX+l: U•PTY: GOSUI 20010 LX•PTX+5: LT•PTY: QOSUI 20030 LX•PTX+6: LT•PTY+l: QOIUI 20030 LX•PTX+6: LY•PTY+2: QOSUB 20030 LX•PTX+5: LY•PTY+l: QOSUB 20030 LX•PTX+l: LT•PTY+3: QOSUB 20030 LX•PTX: LY•PTY+2: OOSUB 20030 LX•PTX: LY•PTY+l: QOIUB 20030 QOTO 4030 LX•PTX+61 LY•PTY+3: OOSUB 20010 LX•PTX+6: LT•PTY: OOIUI 20030 LX•PTX+5: LY•PTY+l: OOSUB 20030 LX•PTX1 LY•PTY+l: OOSUB 20030 LX-PTX+2: LY•PTY+3 1 QOIUB 20030 QOTO 4030 LX•PTX+,: LY•PTY: QOSUB 20010 LX•PTX+6: LY-PTY+3: OOSUB 20030 LX•PTX+5: LT-PTY+J: QOSUB 20030 LX•PTX+2: LY•PTY: QOSUB 20030 LX-PTX+l: LY-PTT: QOSUB 20030 U:•PTX: LT-PTY+l: GOSUB 20030 LX•PTX: LY•PTY+2: QOSUB 20030 U:•PTX+l: LY'•PTY+3: QOSUB 20030 QOTO 4030 LX•PTX+l: LY•PTY+3: QOSUB 20010 LX•PTX: LY'•PTY+2: QOSUI 20030 LX•PTX1 LY•PTY+l: QOSUB 20030 U:-PTX+l: LY-PTY: OOIUB 20030 LX-PTX+2 I LT•PTY: QOIUI 20030 LX-PTX+3: LT•PTY+l: QOSUI 20030 LX-PTX+J i LT-PTY+2: QOIOI 20030 LX•PTX+4: LY•P'!'Y: QOIUI 20010 LX•PTX+5: LY•PTY: QOSUB 20030 LX•PTX+6i LY•PTY+l: QOIOB 20030 LX-PTX+i: LY•PTY+2; QOSUI 20030 LX•PTX+5: LY•PTY+l: ~UI 20030 001'0 4030 LX•PTX+l I LT•PTY+J I QOIUI 20010 U:•PTJ:+4: LY•PTY+3: QOSUB 20030 U:-PTX+4: LY•PTY: QOIUB 20030 LX•PTX+6: LY•PTY+l1 QOSUI 20010 LX•PTX: LT.PTY+l: QOSUB 20030 001'0 4030 LX•PTX: LY•PTY: QOSUI 20010 LX•PTX: LY•PTY+3: QOIUI 20030 LX•PTX+2 1 LY•PTY+l: QOIUI 20030 LX•PTX+2: LY•PTY+l: QOSUB 20030 LX-PTX+l I LY•PTY1 QOIUB 20030 LX-PTX+5: LY•PTY: QOSOB 20030 LX•PTX+,1 LT•PT'Y+l: QOSUB 20030 LX-PTX+i: LY•PTY+2: QOSUB 20030 LX•PTX+S: LY•PTY+3: QOSUI 20030 LX•PTX+4: LT•PTY+3: -QOSUB 20030
Chromatographic software 182 3976 GOTO 4030 3977 LX-PTX+l: LY-PTY: GOSUB 20010 3978 LX•PTX: LY•PTY+l: GOSUB 20030 3919 LX•PTX+2: LY•PTY+3: GOSUB 20030 3980 LX•PTX+S: LY•PTY+): QOSUB 20030 3 981 LX•PTX+6: LY•PTY+2: GOSUB 20030 3982 LX•PTX+6: LY•PTY+l: QOSUB 20030 3983 LX•PTX+5: LY•PTY: GOSUB 20030 3984 LX•PTX+4: LY•PTY: GOSUB 20030 3985 LX•PTX+l: LY•PTY+l: OOSUB 20030 3986 LX•PTX+l: LY•PTY+2: OOSUB 20030 3981 GOTO 4030 3988 LX•PTX: LY•PTY+3: GOSUB 20010 3989 LX•PTX: LY•PTY: GOSUB 20030 3 990 LX•PTX+2: LY•PTY: GOSUB 20030 3991 LX•PTX+S: LY•PTY+J: OOSUB 20030 3992 LX•PTX+6: LY•PTY+): GOSUB 20030 3993 GOTO 4030 3994 LX•PTX+2: LY•PTY+J: GOSUB 20010 3995 LX•PTX+l: LY•PTI+): GOSUB 20030 3996 LX•PTX: L't•PTY+2: GOSUB 20030 Jg97 LX•PTX: LY•PTY+l: OOSUB 20030 3998 LX•PTX+l: LY•PTY: GOSUB 20030 3999 LX•PTX+2: LY•PTY: GOSUB 20030 4000 LX-PTX+): LY•PTY+l: GOSUB 20030 400 l LX•PTX+J: LY•PTY+2: GOSUB 20030 4002 LX•PTX+4: LY•PT!+): GOSUB 20030 4003 LX•PTX+5: LY-PT!+): GOSUB 20030 4004 LX•PTX+6: LY•PT!+2: GOSUB 20030 4005 LX•PTX+6: LY•PTY+l: QOSUB 20030 4006 LX•PTX+5: LY-PTY: GOSUB 20030 4007 LX•PTX+4: LY•PT!: GOSUI 20030 4008 GOTO 4030 4009 LX•PTX+6: LY•PT!+2: GOSUI 20010 4010 LX•PTX+4: LY•PTY: GOSUI 20030 4011 LX•PTX+l: LY•PT!: GOSUI 20030 4012 LX•PTX: LY•PT!+l: GOS08 20030 4013 LX•PTX: LY•PTY+2: GOSUB 20030 4014 LX•PTX+l: LY•PTY+3: GOSUB 20030 4015 LX•PTX+2: LY•PTY+3: GOSUB 20030 4016 LX•PTX+3: LY•PT!+2: GOSUB 20030 4017 LX•PTX+3: LY•PTY+l: QOSUB 20030 4030 NEXT LOOPS 4 04 0 NEXT LOOP 1 4050 LX•4: LY•328: E!!!T•STRINGS (79, 32) 4052 CALL TEXTB (LX, LY, EST) 405,4 LX•4: LY•34l: EST•STRIMG$ (79, 32) 4056 CALL TtX'?B (LX, LY,EST) 4058 LX•92: LY•l28: EST•"llould you like a hardcopy of the ch.ron.atograa
(y/n) 1" 4060 BEEP 4062 CALL TEXTB(LX,LY,EST) 4064 QHP.DCPYS•IHKEY$: IF QSRDCPYS•"" TBDi 4064 4066 IF QlillDCPYS-"lC" OR OBJ.OCPYS•"n" TBEN 4180 4068 IF Oft.RDCPYS<>"Y" AHO QBAOCPYS<>"y" THEN SOUND 40, 10: GOl'O 4064 4070 LX•,4: LY-321: EST-!TRINGS (79, 32) 4072 CALL TUTl(LX,LY,UT) 4100 llM ------------------ Print Ba.rdcopy of Ch.ron.atograa ---------------4110 LX•4: LY•32t: EST-STRING$(79,32): 00SUB 20050 4112 LX•4: LY•JO: EST-STRING$ (79, 32): 00SUB 20050 4114 LX•619: LY•l7: tsT-STRING.$(10,32): GOSUI 20050 4116 LX•62t: LY•34: £ST•STJ.ING$ (t, 32) : 00SUB 20050 4118 BEEP: LX•96: LY•l21: EST•"Pr••• <(•hift] PrtSc-1> when thi• meHage
diuapean": GOSUI 20050 4120 LX•l 95: LY•34l: tsT-"Pr.H any key to continue •.. , . ": GOSUB 20050 4130 IF INXEU • "" THEN 4130 4140 LX•,I: LY•30: EST-STRINGS (79, 32) : 00SUB 20050 4150 roR LCXJP • 1 TO 5000: NEXT LOOP 4160 BEU: LX-4: LY•32t: EST-STRIMGS(19,32}: GOSUB 20050 4170 IF IHXEYS • "" THEN 4170 4180 llM ----------------- Enter Standard Value• --------------------"190 Rf.M 4192 LX•,4: LY•32t: f.ST•STRINGS (79,32) 4194 CALL TEXTB (LX, LY, EST) 4196 LX-4: LY•343: EST-STRIHG$(79,32) 4191 CALL TEXTB(LX, LY,EST) 4200 roa LCXJP • l TO NUMSTJ.TS 4210 LX•30: LY•32t: !.ST-"PK NO.:"+STJ.$(LOOP) 4215 CALL TEXTB(LX,LY, UT) 4220 TDtP1$•S'?U (DPKKT (LOOP)) 4222 TDIP2S•U:M$(ffMPU, 1) 4224 LX•U11 LY•l21: EST•"PJ: RT1·+TE.MP21 "226 CALL TEXTl(LX,LY,UT) 4221 LX•2,IO: LY•343: EST•"t.nter Peak N••:":UICNAHS(LOOP)•"" 4230 CALL TEXTB(LX,LY,EST) 4231 OS•Ilfll'tt: IF Qt•"" TllW 4231 4232 CBAJ.•ASC(Qit) 42ll IF (CBAa<>ll MD CB.Aa<>I) AIID (CBAJ.<65 ca CBAR>,O) AND
(CRAa<t1 ca CBAJ.>122) TUW SOUliD 40, 10: GOl'O 4231 423,1 ,1235 4236
4231 4231 4239 42,10 42"1 4242 4243 4244 4245 .. 2 .. , 4241 4248 4249 4250
4251 4252 ,1253
4254 4255 425, 4251 42SI 4259 4260 4261 4262 4263 4264 4210 4290 4300 4310 4320 4321 "322 4323
rr cau.-ll TBDI ,1241 IF CJIAa.-e AIID l,D(EPDAMl(LCX>P))<l TBD SOOlfD 40,10: GOTO 4231 IT CIIAl.-e AJR> LD (&PJOIAMI (LCX>P) )>0 TBDI EPKNAM$ (LOOP)• LZMfCU-(LOOPI, (LEW(UKUNS(LOOP))-11), 00'!'0 4231 .,.,,_ (LOOP) -CP- (LOOP) +QS LX•3'41 LY•l,131 ES"r•I.PIOIAld(LCX>P)+• " CALL ffftl (LX, LY, UT) coro Ull LX•lll1 LY•3211 ES"r•"PK W»IZI "+EPIOL\Mt (LOOP) CALL ffX'!'l(LX,l..Y, UT} LX•,11 l..Y•34l1 1.IT-ST'1.IWC:,(1t,l2) CALL '!'I.X'n(LX,LY,UT) LX•Z091 LY-3411 &IT•"t.nter Peale Aaount: • CALL ffX'!'l{LX,LY, UT) TDIPt••• 0S•INKEY$: IF os-·· Tll!N 4241 C&U•ASC(Qt) IF (CBAJ<>ll AND CB.AJ.<>I MO CJIAP.<>46) AND (CBAJ<4t OR CB.ll>57) T8!N SOUIID 40, 10: GOl'O 420 IF CRAJ.•13 T&D 4251 IF CllAl.-t AND LDl(TDfPf)<l TUii SOOlfD 40, 10: 00'1'0 "248 IF Cv.1.-t AND LD(TDfU)>O TBEN TEHPS•LUTS(TDtPS, (LEM(Tt.MPS)-1)): GO?O 4255 TDlPl-'l'Dffl+<)I LX•lt l I LY•3U t ES'?-'l'DDI+" CALL TEXTl(LX,LY,UT) coro uu Lx-u,1 LY•32t: EIT•"PJ: »ff: •+u:n, (TEMPI, t) CALL T!XTl(LX,LY, UT) DPIUIH'? I LC><:.' I •VAL (TE.MP II LX•41 LY•3U: EIT-STJ.IWGI (19, 32) CALL Tt.X'!'l(LX,LY,EST) BEEP: LX•ll,: LY•3,4): ES'?•"Ar• th••• value• correct (y/nl ?" CALL TEXTll(LX,LY,EST) DU Sr.,..-Q1 POU 1050,Pl.0(1052) 1 DEF S!.G: POKE 106,0 'clear keyboard Ql•INK!.Y$; IF QI••• TllX 42 ,0 IF Qt•"Y- oa Qit•"y" THEW 030 IF Qit<>"W" AND Qlo•n• TBJ:ll SOOXD 40, 10: 00'1'0 4210 LX•4: LY•32t1 EST-SffIWC.,(19,32) CALL TEXTB(LX,LY, UT) LX•4: LY•lU1 EST-STJ.IWGl(19,32) CALL TEXTl(LX,LY, UT)
4325 GOTO 4210 ,l]JO LX•4: LY•328: EST•STRINC.$(79,32) 4331 CALL TEXTB(LX, LY, EST) 032 LX-4: LY•l43: £ST•STRING$(H,32) 4333 CALL TEXTB(LX,LY,EST) 4340 Nf.XT LOOP 4350 IF NUMRUNS > l TREN 4390 4355 LX-30: LY-328: l.ST•"Stor1n9 data, plea•• wait .... ,'" 060 CALL TEXTB (LX, LY, EST) 4361 OPEX.. "A:!TMDRDS.1'4:P" AS fl LEM•,4S 4362 FIE.LO fl, 2 AS EMUHRUHSS, 2 AS ENUHSTD!S, 10 AS TODAYS, J AS fLA.GS,
28 AS EOUHHY$ 4363 LSET ENUHRUHS$ • HXI$ (NUMRUNS) 4364 LSET ENUHST0S$ "'Hlt:IS(NUHSTRTS) 4lfi5 LSET TOOAYS • [DATES 4366 LSET FLAGS • '"!ES'" 061 LSET EDUl44Y$ • " 4368 PUT fl, 1 4369 f1£LD 11, I ,\S XS, 8 AS YS, 8 AS XYS, 8 AS XS0$, 8 AS ERTS, 2 AS ENS,
3 A!I ENA.MS 4310 fOR LOOP • l TO NUHSTRTS 4311 LSET XS '"'HXD$(DPJO.R.l.A(LOOP)) 072 LSET YS • MKD$ (DPKAfifl' (LOOP)) 4373 LSET XYS • MJt:0$(DP!Cllr.A(LOOP) *OPKN1T(LOOPll 074 LSET XSO$ • MMJS(DPKA.J.EA(LOOP)"2) 015 L!ET DTS • HKD$(DPIO.T(LOOP)) 4376 LSET £NS • MJt:IS (NUMRUNS) 4377 LSET DiAMS • EPXHAMS(LOOP) 4378 PU'l' fl, LOOP+l ,1379 NEXT LOOP 080 CLOSE 4385 GOTO 4130 ,1390 llEM ------------------- Identify Standard• , SUffl Data -----------------4395 UM 4396 LX•30: LY•328: EST•"C&lculatin9 LSRL pa..r.a,neter• •.... " 4391 CALL TtxTB(LX,LY,EST) 4400 OPDi '"A:ST'HORDS.1'4:P" AS fl L£N•,l5 4405 FIELD fl, I AS XS, I AS YS, 8 AS XYS, 8 AS XS0$, 8 AS EllTS, 2 AS ENS,
3 AS ENA.MS 4410 roR LOOP • l TO NUHSTDS 4420 GET tl, LOOP+l 4430 SSTDX (LOOP) • CVD (XS) 4440 !STOY (LOOP) • CVO (YS) 4450 SSTDXY(LOOP) • CVC(XY$) 4460 SSTDXSO(LOOP) • CVD(XS0$) 4470 SSTDRT(LOOP) • CVD(ERT$) 400 N (LOOP) • CVI (ENS) 4 4 90 ESTDNAHS ( LOOP l • ENAHS 4500 NEXT LOOP 4510 roR LOOPl • 1 TO NUMSTRTS 4512 CRECJt'.-0: LOOP2•1 4Sl4 NBILE CRECJ: < 1 4516 IF EPIOfAMl(LOOPl)<>ESTDNAM$(LOOP2) TBJ:N 4536 4511 SST0X(LOOP2) -sncx (LOOP2) +DPIOJlEA(LOOP 1) 4519 LS!T XS• MK0$(SSTOX(LOOP2}) 4520 SST0Y(LOOP2) •SSTDY (LOOP2} +DPKAMT (LOOPl I 4521 LS!T YI • MKDt (SSTDY (LOOP2)) 4522 SSTDXY (LOOP2) •SST0XY (LOOP2 I+ (DPKAREA(LOOPl) *DPJWff (LOOPl)) 4523 LSET XYS • HXDS(SST0XY(LOOP2)) 4524 SST0XS0(LOOP2) •SSTCXSQ (LOOP2) + (DPKAll!.A (I.OOPl) "2) 4525 LSET XSQ$ • MKDS(SSTCXS0(LOOP2)) 4526 SSTDKT (LOOP2) •SST0H (LOOP2) +DP!O.T (LOOP l) 4521 LS!T ERTS • HKDS (SSTDJ.T(LOOP2) I 4521 N (LCXJP2) -M (LOOP2) +l 4529 I.SET EN$• MK1S(N(LOOP2)I 4530 LSET ENAKI • ESTDN11M$ (LOOP2) 4531 PUT tl,LOOP2+1 4534 car.ex - 1 4536 LOOP2 • LOOP2 + 1 4531 IF LOOP2>NUMST0I ANO Cll!CJt:<l TH.EN csr.cx-2 ELSE 45S8 45,40 NUMSTOS • NUMSTDS+l 4542 SSTDX(NUMSTOS)-OPR.AJlEA (LOOP!) 45U UE'? XS• MKDS(SSTOX(NUMSTDS)) ,15,1,1 SSTDY(MUMSTDS) -OPKAMT (LCXJP 1) ,15,15 Lll!T YS • MKDS (SSTDY (NUMSTCS)) ,154, SSTDXY (MUMSTDS) •DPJ:IJ.EA(LCXJP l) *DPUHT (LOOP 1) 45"1 LSE'? XYS • H1'D$(SSTOXY(NUMSTDS)) 4S41 SST0XSQ(NUMSTDS)-0PltAllEA(LOOP1) "2 4549 I.SET xso• • MKDt (SSTDXSQ(NUMSTDS) I 4550 SSTORT(NLMS'?DS)•DPD.T(LOOPl) 4551 Ur? ERTt • MJ:Dl (SSTDRT(NUMIT'DS)) 45S2 N (lfUMIT'DS) •l ,1553 LSET tNt • MJ:U (N (NUMSTOS)) 45S,1 !.STONMI (Nll'IS'?DS)•UJOI.NU (LOOPll 4555 urr EJIAMS • ES'?DN.AMI (NUMSTOS) 455, PUT 11,Nll'IS'?DS+l 45SI WEND 4560 NEXT LOOPl 45'2 FIELD fl, 2 AS &NUMJ.UlfU, 2 AS EMUMSTDSS, 10 AS TODAYS, 3 A:5 FLAG$,
21 AS WLMff$ ,15,, LSET tWUNa.UNU • JUI$ (lfUMJt.UNS) ,l5H Lat'? ENUMST'CU • MJl:U (NUMST'CS) ,IS10 LSE'? TCl)AYI • WA'?U 4S12 LSE'? FLAGt • "YES" 4S14 LSET EOUMIYS • " 451' PUT fl, l 4511 CLOSE 4730 IF QUDCPYt•"ll" ca QBJ.OCPYS•"n" THEN 5020 4140 a.EM --------------- Printout QuantitatN Data ------------------"150 LX-4: LY•321: !.ST-S'?RINQl(79,32) 4152 CALL TE.XTB (LX, LY, ES'?) "15" LX-4: LY•lO: EST-STlillr:$(79,32) "156 CALL TD'?B(I.X,LY,EST) 4151 BEU: LX•240: LY•l21: EST-"Chaclr: Printer Statu•" 4160 CALL '?z.x'?I (LX, LY, EST) 41,2 U:•lt5: LY•J,431 !.ST-"Pr••• any Jcey to continue ••... " 41U CALI. TUTB(LX,LY,ES'l') 4110 IF INJ:EYI • "" TUN 4110 "190 OPEN "LPTl: • AS fl 4100. NID'?B t], 10 4110 PUN'! fl, CllU(21);CD$(1J);C8U(2)i PRIMT 13, Clill$(13);CHR$(10) 020 PUNT fl, TAB(t);"FILEI ";FII.Et:TAB(3,l);"J.Ull NUMBER! ";NUMJlUNS;
TAB(60;WATU: PUNT fl, CBU(lll ;CBltS(lO) 4tl0 PRilfT fl, TAB()) :snn1c.t p,, 205) 040 PlllfT fl, '?AB(5);"Peall: No.";TAB(20);"Peak N&IM";TAB(34);"Retent1on
Tt.ae" ;TAB (55); "Area" ;TAB (10); "Jiaount" USO UIXT fl, TAB(J) ;SffINc.t (16, 19') ,1160 FOIHATll • " ff 4110 FOMAT2$ • •\ - - - - - \ - - - - - - - - - - - - -
4110 FOIIMATlt • "ft.tit tff.ttffff tttt.tttt" 400 roa ux::. • 1 TO NuMBTKTs- - - - - - - - - - -,1,00 PRINT 13, USING FOI.MATU;LCXlP; 4910 PUllT fl, USING FORMAT2S;UXHAMS(LOOP); 4t20 ,anrr fl, USIIIG FOIUQ.TlS; DPDT (LCXJP); DPD.ll.A(LOOP); DPKAMT (LOOP} 4930 NEXT LOOP 4"40 PlIWT fl, TAB(l) ;SffilfG.I (16,205) 4'90 PlIXT fl, caU(21);CD.t(13);CBU(l) SOOO PRI'NT fl, CBU (12) 5010 Cl.08E 5020 LX-4: LY•l2t: EST-S'?UNc:$(79,32) 5022 CALI. TEXTI (LX, I.Y, EST)

Chromatographic software 183
5024 LX-.f: LY-343: l.ST-STlt.INGS (1', 32) 5026 CALL T&XTB(LX,Ll',EST) 5028 LX•l 61: LY•l21: tsT-"lapeat" 5030 CALL TUTB (LX, LY, EST) 5032 LX-261: LY•321: l.ST-"Proc:eH" 5034 CALL TE.XTB (LX, LY, EST) 5036 LX•liS: LY•321: EST-"Stop" 5031 CALL TUTB(LX,LT,!.ST) 5040 LX•465: LY•l21: !.ST•"Quit" 5042 CALL Tt.XTB(LX,LY,EST) 5044 LX•2Jl: LY•l4J: EST-"Enter your choice., ... " 50-46 CAI.I. TUTl(LX,LY,EST) 5050 DEF SEG-0: POKE 1050,PUJl:(1052}: Dr.F SEG: POKE 106,0 'cle•r kbrd buffer 5060 IMOV!.S•INJCE'U: Ir IMOV'ZS•"" TBEX 5060 ELSE MOVE•A5C(IMOVE$) 5070 IF i!«J'V!.>79 MD MJVE<l4) Ol (MOVE>lll AND K>VE<ll6) THEN 5085 5080 SOUND 40, 10: GOTO 5050 5015 RI.M ---------------------------- Repeat Run ---------------------------5090 IF MOV!.<>82 »ID MOV!.<>114 THEN 5130 5095 CLOSE 5100 Ctr.Alt. 5110 EREPr.ATS-·ns· 5120 PAGE-0: GOTO 230 5130 llI.M ------------------------------ Stop ------------------------------5140 IF MO't'Z<>IJ AND l«)Vl.<>115 TBEN 5110 5150 CLOSE 5160 CLF.AJ. 5 162 CALL CLllSCJl 5170 CHAIN "A:BPLC" 5180 REM ------------------------------- Quit ------------------------------5190 IF !10VE<>ll AND MOVE<>113 THEN 5250 5200 CLOSE 5202 LX•4: LY•321: EST-STJ.IMGS(''11,32) 5203 CALL TEXTB(LX,LY,EST) 5204 LX-C: LY•lO: EST-STRIMGI (19, 32) 5205 CALL Tl'.XTB (LX, LY, EST) 5206 LIMTS•O 5207 CALL LEVEL(LIMTS) 5201 BE:EP: LX•ll2: LY•34l: EST-" Ent•r Y to confinn loaa of data " 5209 CALL TEXTB (LX, LY, EST) 5210 LIHTS•l 5211 CALL LEVEL (LINTS) 5212 Q.S•INKE'!.S: IF OS•"" THEN 5210 5213 IF QS<>"Y" AND QS<>"y" TBZ.N 5020 5214 CALL Cl.J.SCl 5220 KILL "A:STllDllOS.TMP-5230 CLUJ. 5240 CRAIN "A:B.PLC" 5250 JlEH ----------------------------- Proce•• ----------------------------5260 IF MOVE<>IO AND MOVI.<>112 T8D SOOND 40, 10: GOTO 5050 5261 LX-4: L'!•321: EST-STRIMGS(19,32) 5262 CALL T&XTB (LX, LY, EST) 5263 LX-.e: L'!•343: EST-STlIMGS (19, 32) 5264 CALL TEXTll(LX,LY,EST) 5265 LX•30: LY•321: ES'?•"Pr~aainq data, pleaae wait ••... • 5266 CALL TEXTB(LX,LY,tST) 5270 CLOSE: ULL "A:STNDlOS .OAT" 5210 OPDf '"A:STHDll01.1MP" AS fl LEN•45 5290 Fil.LO fl, 2 AS EMUMJlUNU, 2 AS ENUMSTOSS, 10 AS TODAY$, 3 AS fl.AG$,
21 AS r.Dt.MffS 5300 GET fl, l 5310 MtJMlUNI-CVI (DIUMJlDMU): HtJMITDS-CVI (EMUMS'?DS$) 5330 FIELD fl, I AS XS, I AS YS, I AS XYS, I AS XSQS, I AS Elt.TS, 2 A5 EN$,
3 AS ENAH,f 53'10 OPEN "A:STNOaDS.DAT'" AS 12 LEN•35 5350 Fil.LO 12, 2 AS ENtJMSTDSS, 10 AS EST0ATE$, 23 AS £DUMMY$ 5360 I.SET ENUMSTDU • HKU (NtJMSTDS) 5370 LSE'I' ESTDATEt • TODAYS 5310 LSE'? EDIJMIIYS • " 5390 PUT t2, 1 5400 FIELD t2, I AS ESTOITS, I AS XMr.ANt, I AS YMl.ANS, I A5 £SLOPE.$,
3 AS ESTON»lt 5410 FOi WC::. • 1 TO HtJMSTOS 5420 c;rr tl.LCX:.+l 5430 SIMX • CVD(XS) 5440 SUMY • C'VO(YS) 5450 SIMXY • CVD (XYI) 54'0 SUMXSQ • CVD(XSQt) 5410 Sll'IH • CVD (EHS) 5410 N • CVI (EN8) 5490 STDRT • Sl.14:kT/ll SS00 STDl04r.Alf • SUMX/ll 5510 STDYMUJI • SUMY/11 5520 SUMLXl.Y • S1MXY-(StJMX•St1i1Y/N) 5530 SUMLXSQ • SUMUQ-( (SUIIX"2) /NI 5540 STDILOPE • SUMLXLY/SUMLJCSQ 5550 LSET UTDRT8 • Mlm$ (STCr!) S560 LIE'? XMI.Allt • MJIDS 1S'?DXM£AII) 5570 LIE'? 1"MJ'.A11$ • MKD8 (S'?DYMEM) 5510 I.HT ULOH,I • MKDI (STDILC»E) S590 I.HT UTDIIAMt • EJIAM$ S600 POT f2,I.Om'+l 5610 RX'! LOJf 5620 CLOa& 5630 LX-11 LY-3211 UT-l'rUIICl(19,32) 5632 CALL TD'!9CJ..X,LY,ZIT) 5634 LX-11 LY•JU1 UT-ITUIICl(19,32) 5636 CAL.I. TUTl(ll,LY,EIT) SUI LX•ll6r LY-3211 &1T-•1t•nclarCU File Baa a.en Updated." 56-40 CAL.I. TUTl(ll,LY,&l'r) 5642 IIUr LJ:•lA1 LY•l4lr UT-·PreH any key to return to ••nu., ••• " 5 6-4 4 CALL TIX'n (LX, LY, IIT) 5660 IF IWllYt-•• '?ID .5HO 5670 KILL •.1.11T11DSDl.'!MP• 5610 CLP..U 5690 CB.All •A1U1,C• 9999 DID 10000 UJt tttttff S•plin9 SubrDYtine tor S•lected Channel (-CHANNEL) fHHt 10010 lDIJ 10020 OU'!' ,a102,2 10030 OOT ,uo2,cBANNn•,a10+3 10040 VAI.O'E•(INP(U/Ol)MD ,ar) •256+INP (lB.700) 100.50 lETtJU 10060 lDIJ 10070 lDIJ 10130 llDI ftfttHHHHtftt Int ... ration Curaor ca-and Menu ffffffffffffffff 10140 llDIJ 10142 LI11Tl•l 10144 CALL LEV1L(Ll1ITS) 10150 LX•4: LY•32t: EST-S'RINGt("79,32) 10160 CALL TEXTB(LX,LY,UT) 10170 LX•4: LY•343: !.S'?-STJ.IWC.,(79,32) 10110 CALL TEXTJl(LJ:,LY,UT) 10190 LX•27: LY•3211 UT-"CO'I.SOA CCM4ANDI: Uae L l ll arrow
keya - <ahift.> • lOX" 10200 CALL ffl'Tl(LX,LY, UT) 10210 LX•27: LY•34l: UT-"Ilffr.GlATiaf CC>IHAJIDS: Start End Cancel
ledo Proce•• Quit• 10220 CALL T!.X'?I (LX, LY, U'?) 10222 LINTl•2 10224 CALL LEVEL(Llll'U) 10230 ll'?UU
20000 REH tffffftftffffffffffftff GllAPB-X Subroutinea tltlfftfftffttttfffftt 20010 CALL Jr«:)V't(LX,LY) 20020 llETUllN 20030 CALL DLINE(LX,LY) 200-40 RETURN 20050 CALL TEXTB (LX, LY, EST) 20060 RETUJlN

184
Literature Cited
Abou-Zeid, A.A., M. Fouad and M. Yassein. 1978. Microbiological production of acetone-butanol by Clostridium acetobutylicum. Zentralbl. Bakteriol. Parasitenkd. Infektionskr. Ayg. Abt. 2133:125-134.
Allcock, E.R,, S.J. Reid, D.T. Jones and D.R. Woods. 1982. Clostridium acetobutylicum protoplast formation and regeneration. Appl. Environ. Microbiol. 43:719-721.
Allf-Steinberger, C. 1984. Evidence for a coding pattern on the non-coding strand of the E.coli genome. Nucleic Acids Res. 12:2235-2241.
Andersch, W., H. Bahl and G. Gottschalk. 1982 Acetone-butanol production by Clostridium acetobutylicum in an ammonium-linked chemostat at low pH values. Biotechnol. Lett. 4:29-32.
Andersch, W., H. Bahl and G. Gottschalk. 1983. Level of enzymes involved in acetate, butyrate, acetone and butanol formation by Clostridium acetobutylicum. Eur. J. Appl. Microbiol. Biotechnol. 18:327-332.
Andreesen, J.R., H. Bahl and G. Gottschalk. 1989. Introduction to the physiology and biochemistry of the genus Clostridium, p. 27-62. In N.P. Minton and D.J. Clarke (eds.), Clostridia. Biotechnology Handbooks 3. Plenum Publishing Corp., New York, NY.
Backman, K.C., Y.-M. Chen and B. Magasanik. 1981. Physical and genetic characterization of the glnA-glnG region of the Escherichia coli chromosome. Proc. Natl. Acad. Sci. USA 78:3743-3747.
Bagnara, A.S. and L.R. Finch. 1972. Quantitative extraction and estimation of intracellular nucleoside triphosphates of Escherichia coli. Anal. Biochem. 45:24-34.
Bahl, H., W. Andersch, K. Braun and G. Gottschalk. 1982a. Effect of pH and butyrate concentration on the production of acetone and butanol by Clostridium acetobutylicum grown in continuous culture. Eur. J. Appl. Microbiol. Biotechnol. 14:17-20.
Bahl, H. W. Andersch and G. Gottschalk. 1982b. Continuous production of acetone and butanol by Clostridium acetobutylicum in a two-stage phosphate limited chemostat. Eur. J. Appl. Microbiol. Biotechnol. 15:201-205.
Bahl, H. and G. Gottschalk. 1985. Parameters affecting solvent production by Clostridium acetobutylicum in continuous culture. Biotechnol. Bioeng. 514:217-223.
Ballongue, J., J. Amine, E. Masion, H. Petitdemange and R. Gay. 1985. Induction of acetoacetate decarboxylase in Clostridium acetobutylicum. FEMS Microbiol. Lett. 29:273-277.
Baronofsky, J.J., W.J.A. Schreurs and E.R. Kashket. 1984. Uncoupling by acetic acid limits growth and acetogenesis by Clostridium thermoaceticum. Appl. Environ. Microbiol. 48:1134-1139.
Beaulieu, B.B. Jr.,M.A. Mclafferty, R.L. Koch and P. Goldman. 1981. Metronidazole metabolism in cultures of Entamoeba histolytica and Trichomonas vaginalis. Antimicrob. Agents Chemother. 20:410-414.

Literature Cited 185
Begg, Y.A., J.N. Whyte and B.A. Haddock. 1977. The identification of mutants of Escherichia coli deficient in formate dehydrogenase and nitrate reductase activities using dye indicator plates. FEMS Microbiol. Lett. 2:47-50.
Beggs, J.D. 1978. Transformation of yeast by a replicating hybrid plasmid. Nature 275:104-108.
Benazet, F., L. Lacroix, C. Godard, L. Guillaume and J.P. Leroy. 1970. Laboratory studies of the chemotherapeutic activity and toxicity of some nitroheterocycles. Scan. J. Infect. Dis. 2:139-143.
Benemann., J.R., D.C. Yoch, R.C. Valentine and D.I. Aron 1969. The electron transport system in nitrogen fixation by Azotobader. L Azotoflavin as an electron carrier. Proc. Natl. Acad. Sci. USA 64:1079-1086.
Bennett, L., M. Jacobson and D.R. Dean. 1988. Isolation, sequencing and mutagenesis of the nifF gene encoding flavodoxin from Azotobacter vinelandii. J. Biol. Chem. 264:1364-1369.
Bennetzen, J.L. and B.D. Hall. 1982. Codon selection in yeast. J. Biol. Chem. 257:3026-3031.
Berman, B.W., F.H. King Jr., D.S. Rubenstein. and S.S. Long. 1978. Bacteroides fragilis meningitis in a neonate successfully treated with metronidazole. J. Pediatr. 93:793-795.
Bemhauer, K. and K. Kurschner. 1935. Butyl- und aceton- Garugen I Millerlung: uber Zwischenprodukte der butanol- aceton-Goring. Biochem. Z. 280:379-387.
Bertram, J. and P. Diirre. 1989. Conjugal transfer and expression of Streptococcal transposons in Clostridium acetobutylicum. Arch. Microbiol. 151:551-557.
Bertram, J., A. Kuhn and P. Diirre. 1990. Tn916 Induced mutants of Clostridium acetobutylicum defective in regulation of solvent formation. Arch. Microbiol. 153:373-377.
Beynon, R.J. 1985. Communicating with microcomputers, p. 17-42. In C.R Ireland and S.P. Long (eds), Microcomputers in biology. IRL Press Ltd., Oxford.
Bibb, M.J., P.R. Findlay and M.W. Johnson. 1984. The relationship between base composition and codon usage in bacterial genes and its use for the simple and reliable identification of protein-coding sequences. Gene 30:157-166.
Bilofsky, H.S., C. Burks, J.W. Fickett, W.B. Goad, F.I. Lewitter, W.P. Rindone, C.D. Swindell and C.-S. Tung. 1986. The GenBank genetic sequence data bank. Nucleic. Acids Res. 14:1-4.
Birge, E.A. 1981. Mutations and mutagenesis, p. 40-66. In Bacterial and bacteriophage genetics. An introduction. Springer-Verlag, New York, NY.
Blaschkowski, H.P., G. Neuer, M. Ludwig-FesU and J. Knappe. 1982. Routes of flavodoxin and ferredoxin reduction in Escherichia coli. Eur. J. Biochem. 123:563-569.
Bowles, L.K. and W.L. Ellefson. 1985. Effects of butanol on Clostridium acetobutylicum. Appl. Environ. Microbiol. 50:1165-1170.

Literature Cited 186
Bowring, S.N. and J.G. Morris. 1985. Mutagenesis of Clostridium acetobutylicum. J. Appl. Bacterial. 58:577-584.
Boyer, H.W. and D. Roulland-Dussoix. 1969. A complementation analysis of the restriction and modification of DNA in Escherichia coli.
Bratton, A.C. and E.K. Marshall. 1939. A new coupling component for sulfanilamide determination. J. Biol. Chem. 128:537-550.
Brendel, V. and E.N. Trifonov. 1984. A computer algorithm for testing potential prokaryotic terminators. Nucleic Acids Res. 12:4411-4427.
Britz, J.L. and R.G. Wilkinson. 1979. Isolation and properties o metronidazole-resistant mutants of Baderoides fragilis. Antimicrob. Agents Chemother. 16:19-27.
Brown, P.R., A.M. Krstulovic and R.A. Hartwick. 1980. Current state of the art of HPLC analyses of free nucleotides, nucleosides, and bases in biological fluids. Adv. Chroma to gr. 18:101-138.
Buchner, Y. and D.I. Edwards. 1975. The effect of metronidazole and nitrofurans on the morphology of Trichmonas vaginalis. J. Antimicrob. Chemother. 1:229-234.
Caesar, F. and M. Klier. 1974. Novel determination of peak areas for application on large computers. Chromatographia 7:526-529.
Carosi, G., G. Filice, F. Suter and C.A. Dei. 1977. Trichomonas vaginalis: Effect of tinidazole on ultrastructure in vitro. Exp. Parasitol. 43:315-325.
Cary, J.W., D.J. Petersen, E.T. Papoutsakis and G.N. Bennett. 1988. Cloning and expression of Clostridium acetobutylicum phosphotransbutyrylase and butyrate kinase genes in Escherichia coli. J. Bacterial. 170:4613-4618.
Cary, J.W., D.J. Petersen, E.T. Papoutsakis and G.N. Bennett. 1990. Cloning and expression of Clostridium acetobutylicum ATCC 824 acetoacetyl-coenzymeA :acetate/butyrate:coenzymeA transferase in Escherichia coli. Appl. Environ. Microbial. 56:1576-1583.
Catteral, R.D. 1976. Fifteen years experience with metronidazole, p. 107-111. In S.M. Finegold, J.A. McFadzean and F.J.C. Roe (eds.), Metronidazole. Proceedings of the international metronidazole conference, Montreal, Quebec, Canada. Excerpta Medica, Amsterdam.
Chambers, S.P., S.E. Prior, D.A. Barstow and N.P. Minton. 1988. The pMTL nu- cloning vectors. I. Improved pUC polylinker regions to facilitate the use of sonicated DNA for nucleotide sequencing. Gene 68:139-149.
Chen, J.S. and D.K Blanchard. 1979. A simple hydrogenase linked assay for ferredoxin and flavodoxin. Anal. Biochem. 93:216-222.
Chow, A.W., V. Patten and D. Bednorz. 1978. Susceptibility of campylobacter fetus to twenty two antimicrobial agents. Antimicrob. Agents Chemother. 13:416-418.
Chrystal, E.J.T., R.L. Koch, M.A. Mclafferety and P. Goldman. 1980. Relationship between metronidazole metabolism and bactericidal activity. Antimicrob. Agents Chemother. 18:566-573.
Literature Cited 187
Church, D.L., H.R. Rabin and E.J. Laishley. 1988. Role of hydrogenase 1 of Clostridium pasteurianum in the reduction of metronidazole. Biochem. Pharrnacol. 27:1525-1534.
Church, D.L., H.R. Rabin and E.J. Laishley. 1990. Reduction of 2-, 4- and 5-nitroirnidazole drugs by hydrogenase 1 in Clostridium pasteurianum. J. Antirnicrob. Chemother. 25:15-23.
Clark, D. and J.E. Cronan, Jr. 1980. Escherichia coli mutants with altered control of alcohol dehydrogenase and nitrate reductase. J. Bacterial. 141:177-183.
Clark, S.W., G.N. Bennett and R.B. Rudolph. 1989. Isolation and characterization of mutants of Clostridium acetobutylicum A ICC 824 deficient in acetoacetylcoenzyrne A:acetate/butyrate:coenzyrne A transferase (EC 2.8.3.9) and in other solvent pathway enzymes. Appl. Environ. Microbial. 55:970-976.
Clewell, D.B. and C. Gawron-Burke. 1986. Conjugative transposons and the dissemination of antibiotic resistance in streptococci. Annu. Rev. Microbial. 40:635-659.
Conradt, H., M. Hohmann-Berger, H.-P. Hohmann, H.P. Blaschkowski and J. Knappe. 1984. Pyruvate formate-lyase (inactive form) and pyruvate forrnate-lyase activating enzyme of Escherichia coli: Isolation and structural properties. Arch. Biochem. Biophys. 228:133-142.
Contag, P.R., M.G. Williams and P. Rogers. 1990. Cloning of a lactate dehydrogenase gene from Clostridium acetobutylicum B643 and expression in Escherichia coli. Appl. Environ. Microbial. 56:3760-3765.
Cosar, C. and L. Julou. 1959. The activity of 1-(2-hydroxyethyl)-2-methyl-5-nitroirnidazole (RP. 8823) against experimental Trichomonas vaginalis infections. Ann. Inst. Pasteur 96:238-241.
Crabbendam, P.M., O.M. Neijssel and D.W. Tempest 1985. Metabolic and energetic aspects of the growth of Clostridium butyricum on glucose in chemostat culture. Arch. Microbiol. 142:375-382.
Craven, S.E. and L.C. Blankenship. 1982. Effect of purine derivatives, papaverine hydrochloride, and irnidazole on enterotoxin formation by Clostridium perfringens type A. Can. J. Microbiol. 28:851-859.
Cummins, C.S. and J.L. Johnson. 1971. Taxonomy of the clostridia: Wall composition and DNA homologies in Clostridium butyricum and other butyric acid-producing dostridia. J. Gen. Microbiol. 67:33-46.
Dagert, M. and S.D. Ehrlich. 1979. Prolonged incubation in calcium chloride improved the competence of Escherichia coli cells. Gene 6:23-28.
D'Anna, J.A. and G. Tollin. 1972. Studies of flavin-bound interaction in flavoproteins using protein fluorescence and circular dichroism. Biochemistry 11:1073-1080.
Datta, R. and J.G. Zeikus. 1985. Modulation of acetone-butanol-ethanol fermentation by carbon monoxide and organic acids. Appl. Environ. Microbial. 49:522-529.
Davies, A.H. 1967. Metronidazole in human infections with syphilis. Br. J. Vener. Dis. 43:197-200.

Literature Cited 188
Davies, A.H., J.A. McFadzean and S. Squires. 1964. Treatment of Vincent's stornatitis with rnetronidazole. Br. Med. J. 1:1149-1150.
Davies, R. and M. Stephenson. 1941. Studies on the acetone-butyl alcohol fermentation. 1. Nutritional and other factors involved in the preparation of active suspensions of Cl. acetobutylicum (Weizmann). Biochern. J. 35:1320-1331.
de Boer, H.A. and R.A. Kastelein. 1986. Biased codon usage: an explanation of its role in optimization of translation. p. 225-285. In W. Reznikoff and L. Gold (eds.), Maximizing gene expression. Butterworths, Stoneham, MA.
de Bruijn, F.J. and J.R. Lupski. 1984. The use of transposon TnS rnutagenesis in the rapid generation of correlated physical and genetic maps of DNA seqrnents cloned into rnulticopy-plasrnids: A review. Gene 27:131-149.
Despois, R., S. Pinnert-Sindico, L. Ninet and J. Preud'homme. 1956. Three antibiotics of different groups produced by the same strain of Streptomyces. Giom. Microbial. 2:76-90.
Devereux, J., P. Haeberli and 0. Smithies. 1984. A comprehensive set of sequence analysis programs for the VAX. Nucleic Acids Res. 12:387-395.
DeWit, S.K. and E.A. Adelberg. 1962. The occurrence of a genetic transposition in a strain of Escherichia coli. Genetics 47:577-585.
Doelle, H.W. 1975. Bacterial metabolism, 2nd ed. Academic Press Inc., New York, NY.
Doi, R.H. and L.-F. Wang. 1986. Multiple procaryotic ribonucleic acid polymerase sigma factors. Microbial. Rev. 50:227-243.
Doremus, M.G., J.C. Linden and A.R. Moreira. 1985. Agitation and pressure effects on acetone-butanol fermentation. Biotechol. Bioeng. 27:852-860.
Drasar, B.S., W.H. Huges, R.E.O. Williams and M. Shiner. 1966. Bacterial flora of the normal intestine. Proc. R. Soc. Med. 59:1243.
Dreef-Tromp, C.M., C. Erkelens, G.A. van der Maret and J.H. van Boom. 1989. Synthesis of seryl threonyl phosphate. A model compound designed to study the spectroscopic and chemical features of a phosphodiester linkage similar to the one proposed to exist in Azotobacter flavodoxin. J. Arn. Chern. Soc. 111:6470-6471.
Drummond, M.H. 1985. The base sequence of the nifF gene of Klebsiella pneumoniae and homology of the predicted amino acid sequence of its protein product to other flavodoxins. Biochern. J. 232:891-896.
Dubourdieu, M. and J.L. Fox. 1977. Amino acid sequence of Desulfovibrio vulgaris flavodoxin. J. Biol. Chern. 252:1453-1463.
Dubreuil, L., J. Devos, C. Neut and C. Romond. 1984. Susceptibility of anaerobic bacteria from several French hospitals to three major antibiotics. Antimicrob. Agents Chernother. 25:764-766.
Duong, T.-V., E.A. Johnson and A.L. Demain. 1983. Thermophilic anaerobic and cellulolytic bacteria. p. 156-195. In A. Weisman (ed.), Topics in enzyme and fermentation biotechnology 7. John Wiley and Sons Inc., New York, NY.

Literature Cited 189
Durel, P., V. Roiron, A. Siboulet and L.J. Borel. 1959. Trial of an anti-trichomonal drug derived from imidazole. C.R. Soc. Fr. Gynecol. 29:36-45.
Durre, P., A. Kuhn and G. Gottschalk. 1986. Treatment with allyl alcohol selects specifically for mutants of Clostridium acetobutylicum defective in butanol synthesis. FEMS Microbiol. Lett. 36:77-81.
Dyr, J., J. Protiva and R. Praus. 1958. Formation of neutral solvents in continuous fermentation by means of Clostridium acetobutylicum, P. 210-226. In I. Malek (ed.), Proceedings of the 1st Symposium on Continous Cultivation of Microorganisms. Publishing House of the Czechoslovakia Academy of Sciences, Prague.
Edwards, D.I. 1977. The action of metronidazole on DNA. J. Antimicrob. Chemother. 3:43-48.
Edwards, D.I. 1980. Antimicrobial Drug Action, p. 235-243. MacMillan Press Ltd., London.
Edwards, DJ., M. Dye and H. Carne. 1973. The selective toxicity of antimicrobial nitroheterocyclic drugs. J. Gen. Microbiol. 76:135-145.
Edwards, DJ. and G.E. Mathison. 1970. The mode of action of metronidazole against Trichomonas vaginalis. J. Gen. Microbiol. 63:297-302
Edwards, DJ., D.A. Rowley, R.J. Knox, I.M. Skolimowski and R.C. Knight. 1980. Nature of DNA damage induced by electrolytically reduced nitroimidazole drugs, p. 561-575 In J.D. Nelson and C. Grassi (eds.), Current chemotherapy and infectious disease. Vol. I. The American Society for Microbiology, Washington, oc.
Edwards, DJ., E.J. Thompson, J. Tomusange and D. Shanson. 1979. Inactivation of metronidazole by aerobic organisms. J. Antimicrob. Chemother. 5:315-316.
Efstathiou, I. and N. Truffaut. 1986. Cloning of Clostridium acetobutylicum genes and their expression in Escherichia coli and Bacillus subtilis. Mol. Gen. Genet. 204:317-321.
Eliasberger, P.S. 1930. Hydrogen and the butyric acid fermentation. Biochem. Z. 220:259-277.
Ernst, J.F. 1988. Codon usage and gene expression. Trends Biotechnol. 6:196-199.
Errington, J. 1984. Efficient Bacillus subtilis cloning system using bacteriophage vector •105. J. Gen. Microbiol. 130:2615-2628.
Fiedler, S. and R. Wirth. 1988. Transformation of bacteria with plasmid DNA by electroporation. Anal. Biochem. 170:38-44.
Fond, 0., E. Petitdemange, H. Petitdemange and R. Gay. 1984. Effect of glucose flow on the acetone butanol fermentation in fed batch culture. Biotechnol. Lett. 6:13-18.
Forsgren, A. and L. Forssman. 1979. Metronidazole resistant Trichomonas vaginalis. Br. J. Vener. Dis. 55:351-353.
Freeman, W.A., J.A. McFadzean and J.P.F. Whelan. 1968. Activity of metronidazole against experimental tetanus and gas gangrene. J. Appl. Bacteriol. 31:443-447.

Literature Cited 190
Freese, E. 1981. Initiation of bacterial sporulation. In Spores VIII, p. 1-12. P. Gerhardt (ed.), American Society for Microbiology, Washington, IX.
Freese, E., J. Heinze, T. Mitani and E.B. Freese. 1978. Limitation of nucleotides induces sporulation, p. 277-285. In G. Chambliss and J.C. Vary (eds.), Spores VII. American Society for Microbiology, Washington, IX.
Freese, E., J.M. Lopez and E.B. Freese. 1979. Initiation of bacterial and yeast sporulation by partial deprivation of guanine nucleotides, p. 127-143. In D. Richter and G. Koch (eds.), Regulation of macromolecular synthesis by low molecular weight mediators. Academic Press Inc., New York, NY.
Freese, E., J.M. Lopez and K. Ochi. 1981. Role of guanine nucleotides and of the stringent response to amino acid deprivation in the initiation of bacterial sporulation, p. 11-16. In D. Schlessinger (ed.), Microbiology-1981. American Society for Microbiology, Washington, DC.
Freese, E., Z. Olempska-Beer and M. Eisenberg. 1984a. Nucleotide composition of cell extracts analysed by full spectrum recording in high pressure liquid chromatography. J. Chromatogr. 248:125-142.
Freese, E.B., Z. Olempska-Beer, A. Hartig and E. Freese. 1984b. Initiation of meiosis and sporulation of Saccharomyces cerevisiae by sulfur or guanine deprivation. Dev. Biol. 102:438-451.
Fujii, K. and F .M. Huennekens. 197 4. Activation of methionine synthetase by a reduced tri-phosphopyridine nucleotide dependent flavoprotein system. J. Biol. Chem. 249:67 45-6753.
Gabriel, C.L. 1928. Butanol fermentation process. Ind. Eng. Chem. 20:1063-1067.
Gabriel, C.L. and F.M. Crawford. 1930. Development of the butyl-acetonic fermentation industry. Ind. Eng. Chem. 22:1163-1165.
Gapes, J.R., V.F. Larsen and I.S. Maddox. 1982. Microbial production of n-butanol: some problems associated with the fermentation, p. 90-101. In Energy from biomass. Proceedings of the 14th Biotechnology Conference, Palmerston North, New Zealand.
Garnier, T., S. Saurin and S.T. Cole. 1987. Molecular characterization of the resolvase gene, res, carried by a multicopy plasmid from Clostridium perfringens: Common evolutionary origin for prokaryotic site-specific recombinases. Mol. Microbiol. 1:371-376.
Gawron-Burke, C. and D.B. Clewell. 1984. Regeneration of insertionally inactivated streptococcal DNA fragments after excision of transposon Tn916 in Escherichia coli: Strategy for targeting and cloning of genes from Gram positive bacteria. J. Bacteriol. 159:214-221.
George, D.G. and W.C. Barker. 1986. The protein identification resource (PIR). Nucleic Acids Res. 14:11-16.
George, H.A. and J.S. Chen. 1983. Acidic conditions are not obligatory for onset of butanol formation by Clostridium beijerinckii (synonym, C. butylicum). Appl Environ. Microbiol. 46:321-327.
Literature Cited 191
Gerischer, U. and P. Durre. 1990. Cloning, Sequencing, and molecular analysis of the acetoacetate decarboxylase gene region from Clostridium acetobutylicum. J. Bacteriol. 172:6907-6918.
Gibbs, D.F. 1983. The rise and fall (. ... and rise?) of acetone/butanol fermentations. Trends Biotechnol. 1:12-15.
Gold, L. 1988. Post-transcriptional regulatory mechanisms in Escherichia coli. Annu. Rev. Biochem. 57:199-233.
Gold, L., D. Pribnow, T. Schneider, S. Shinedling, B.S. Singer and G. Stormo. 1981. Translational initiation in procaryotes. Annu. Rev. Microbiol. 35:365-403.
Goldring, J., A. Scott, W. McNaught and G. Gillespie. 1975. Prophylactic oral antimicrobial agents in elective colonic surgery. Lancet 2:997-999.
Goldstein, B.P., E. Nielsen, M. Berti, G. Bolzoni and L.G. Silvestri. 1977. The mechanism of action of nitro-heterocyclic antimicrobial drugs. Primary target of 1-methyl-2-nitro-5-vinylimidazole is DNA. J. Gen Microbiol. 100:271-281.
Cornall, A.G., C.J. Bardawill and M.M. David. 1949. Determination of serum proteins by means of the biuret reaction. J. Biol. Chem. 177:751-766.
Gottschal, J.C. and J.G. Morris. 1981a. Nonproduction of acetone and butanol by Clostridium acetobutylicum during glucose- and ammonium-limitation in continuous culture. Biotechnol. Lett. 3:525-530.
Gottschal, J.C. and J.G. Morris. 1981b. The induction of acetone and butanol production in cultures of Clostridium acetobutylicum by elevated concentrations of acetate and butyrate. FEMS. Microbiol. Lett. 12:385-389.
Gottschalk, G. 1979. Bacterial metabolism. Springer Verlag, New York, NY.
Gottschalk, G. and H. Bahl. 1981. Feasible improvements of the butanol production by Clostridium acetobutylicum, p. 463-470. In A. Hollaender, R Rabson, P. Rogers, A. San Pietro, R. Valentine and R. Wolfe (eds.), Trends in the biology of fermentation for fuels and chemicals. Plenum Publishing Corp., New York, NY.
Gottwald, M. and G. Gottschalk. 1985. The internal pH of Clostridium acetobutylicum and its effect on the shift from acid to solvent formation. Arch. Microbiol. 143:42-46.
Graham, A., H.E. Jenkins, N.H. Smith, M.-A. Mandrand-Berthelot, B.A. Haddock and D.H. Boxer. 1980. The synthesis of formate dehydrogenase and nitrate reductase proteins in various fdh and chi mutants of Escherichia coli. FEMS Microbiol. Lett. 7:145-151
Graves, M.C. and J.C. Rabinowitz. 1986. In vivo and in vitro transcription of the Clostridium pasteurianum ferredoxin gene. J. Biol. Chem. 261:11409-11415.
Gribskov, M. and R.R. Burgess. 1986. Sigma factors from E.coli, B. subtilis, phage SPOl, and phage T4 are homologous proteins. Nucleic Acids Res. 14:6745-6763.
Gribskov, M., J. Devereux and R.R. Burgess. 1984. The codon preference plot: Graphic analysis of protein coding sequences and prediction of gene expression. Nucleic Acids Res. 12:539-549.

Literature Cited 192
Grupe, H. and G. Gottschalk. 1990. Clostridium acetobutylicum and the production of solvents, p. 715-729. In H. Heslot, J. Davies, J. Florent, L. Bobichon, G. Durand and L. Penasse (eds.), Proceedings of the 6th international symposium on genetics of industrial microorganisms, Vol. 2. Societe Frarn;aise de Microbiologie, Strasbourg.
Gruss, A and S.D. Erlich. 1989. The family of highly interrelated single-stranded deoxyribonucleic acid plasmids. Microbiol. Rev. 53:231-241.
Gutierrez, C., J. Barondess, C. Manoil and J. Beckwith. 1987. The use of transposon TnphoA to detect genes for cell envelope proteins subject to a common regulatory stimulus. Analysis of somotically regulated genes in Escherichia coli. J. Mol. Biol. 195:289-297.
Haaker, H. and C. Veeger. 1977. Involvement of the cytoplasmic membrane in nitrogen fixation by Azotobacter vinelandii. Eur. J. Biochem. 77:1-10.
Hager, P.W. and J.C. Rabinowitz. 1985. Translational specificity in Bacillus subtilis, p. 1-32. In D. Dubnau (ed.), The molecular biology of the Bacilli. Academic Press Inc., New York, NY.
Haggstrom, L. 1985. Acetone-butanol fermentation and its variants. Biotechnol. Adv. 3:13-28.
Hamm, G.H. and G.N. Cameron. 1986. The EMBL data library. Nucleic Acids Res. 14:5-10.
Hancock, KR., E. Rockman, C.A. Young, L. Pearce, I.S. Maddox and D.B. Scott. 1991. Expression and nucleotide sequence of the C. acetobutylicum ~-galactosidase gene cloned in Escherichia coli. J. Bacteriol. 173:3084-3095.
Hardman, J.K. and C.T. Stadtman. 1963. Metabolism of co-amino acids. V. Energetics of the y-aminobutyrate fermentation by Clostridium aminobutyricum. J. Bacteriol. 85:1326-1333.
Hartmanis, M.G.N. and S. Gatenbeck. 1984. Intermediary metabolism in Clostridium acetobutylicum: levels of enzymes involved in the formation of acetate and butyrate. Appl. Environ. Microbiol. 47:1277-1283.
Hartmanis, M.G.N., T. Klason and S. Gatenbeck. 1984. Uptake and activation of acetate and butyrate in Clostridium acetobutylicum. Appl. Environ. Microbiol. 20:66-71.
Hartwick, R.A. and P.R. Brown. 1975. The performance of microparticle chemicallybonded anion-exchange resins in the analysis of nucleotides. J. Chromatogr. 112:650-662.
Hastings, J.H.J. 1971. Development of the fermentation industries in Great Britain, p. 1-45 In D. Perlman (ed.), Advances in applied microbiology, Vol. 14. Academic Press Inc., New York, NY.
Hastings, J.H.J. 1978. Acetone-butyl alcohol fermentation, p. 31-45 In A.H. Rose (ed.), Economic microbiology, Vol. 2. Primary products of metabolism. Academic Press Inc., New York., NY.
Literature Cited 193
Hatchikian, E.C., J. LeGall, M. Bruschi and M. Dubourdieu. 1972. Regulation of the reduction of sulfite and thiosulfate by ferredoxin, flavodoxin and cytochrome cc'3 in extracts of the sulfate reducer Desulfovibrio gigas. Biochim. Biophys. Acta 258:701-708.
Henikoff, S. 1984. Unidirectional digestion with exonuclease III creates targeted breakpoints for DNA sequencing. Gene 28:351-359.
Henikoff, S. 1987. Unidirectional digestion with exonuclease III in DNA sequence analysis, p. 156-165. In R. Wu (ed.), Methods in Enzymology, Vol. 155. Academic Press Inc., New York, NY.
Herrero, A.A. 1983. End-product inhibition in anaerobic fermentations. Trends Biotechnol. 1:49-53.
Heyworth, R., D. Simpson, G.J.C. McNeillage, D.H.H. Robertson and H. Young. 1980. Isolation of Trichomonas vaginalis resistant to metronidazole. Lancet 2:476-478.
Hickey, C.S. and M.G. Johnson. 1981. Effect of pH shifts, bile salts and glucose on sporulation of Clostridium perfringens NCTC8798. Appl. Environ. Microbiol. 41:124-129.
Holmes, W.M., T. Platt and M. Rosenberg. 1983. Termination of transcription in E.coli. Cell 32: 1029-1032.
Hongo, M., A. Murata, K. Kono and F. Kato. 1968. Lysogeny and bacteriocinogeny in strains of Clostridium species. Agric. Biol. Chem. 32:27-33.
Hood, F.J.C. 1978. The place of metronidazole in the treatment of acute oro-facial infection. J. Antimicrob. Chemother. 4:(Suppl. C)71-73.
Howard-Flanders, P., R.P. Boyce and L. Theriol 1966. Three loci in Escherichia coli K-12 that control the excision of pyrimidine dimers and certain other mutagen products from DNA. Genetics 53:1119-1136.
Huang, L., L.N. Gibbins and C.W. Forsberg. 1985. Transmembrane pH gradient and membrane potential in Clostridium acetobutylicum during growth under acetogenic and solventogenic conditions. Appl. Environ. Microbiol. 50:1043-1047.
Hungate, R.E. 1969. A roll tube method for cultivation of strict anaerobes. p. 117-132 In J.R. Norris and D.W. Ribbons, (eds.), Methods in Microbiology, Vol. 3B. Academic Press Inc., New York, NY.
Husemann, M.H.W. and E.T. Papoutsakis. 1986. Effect of acetoacetate, butyrate, and uncoupling ionophores on growth and product formation of Clostridium acetobutylicum. Biotechnol. Lett. 8:37-42.
Husemann, M.H.W. and E.T. Papoutsakis. 1990. Effects of propionate and acetate additions on Solvent production in batch cultures of Clostridium acetobutylicum. Appl. Environ. Microbiol. 56:1497-1500.
Ingham, H.R., S. Eaton, C.W. Venables and P.C. Adams. 1978. Bacteroides fragilis resistant to metronidazole after long term therapy. Lancet 1:214.
Ingham, H.R., C.J. Hall, P.R. Sisson, D. Tharagonnet and J.B. Selkon. 1980. The activity of metronidazole against facultatively anaerobic bacteria. J. Antimicrob. Chemother. 6:343-347.

Literature Cited 194
Ingham, H.R., J.B. Selkon and C.M. Roxby. 1977. Bacteriological study of otogenic cerebral abscesses: chemotherapeutic role of metronidazole. Br. Med. J. 4:991-993.
Ingham, H.R., J.B. Selkon, S.C. So and R. Weiser. 1975. Brain abscess. Br. Med. J. 4:39-40.
Ingham, H.R. and P.R. Sisson. 1988. Activity of metronidazole against Enterobacteriaceae in mixed culture. J. Antimicrob. Chemother. 21:497.
Ingham, H.R., P.R. Sisson, R.L. Eisenstadt, M.S. Sprott, P.O. Byrne and J.B. Selkon. 1981. Enhancement of activity of metronidazole by Escherichia coli under suboptimal anaerobic conditions. J. Antimicrob. Chemother. 8:475-479.
lngs, R.M.J. and F.L. Constable. 1975. An investigation into the effect of metronidazole on the morphology of Trichomonas vaginalis. J. Antimicrob. Chemother. 1:121-126.
Ings, R.M.J., J.A. McFadzean and W.E. Ormeron. 1974. The mode of action of metronidazole in Trichomonas vaginalis and other microorganisms. Biochem. Pharmacol. 23:1421-1429.
Ireland, C.R. and S.P. Long. 1985. Preface. p. iii-iv. In C.R. Ireland and S.P. Long (eds), Microcomputers in biology. IRL Press Ltd., Oxford.
Ish-Horowicz, D. and J.F. Burke. 1981. Rapid and efficient cosmid cloning. Nucleic Acids Res. 9:2989-2998.
Jackson, D., A. Salem and G.H. Coombs. 1984. The in vitro activity of metronidazole against strains of Escherichia coli with impaired DNA repair systems. J. Antimicrob. Chemother. 13:227-236.
Janniere, L., C. Bruand and S.D. Ehrlich. 1989. Structurally stable Bacillus subtilis DNA cloning vectors. Gene 87:53-61.
Janssen, P.J., W.A. Jones, D.T. Jones and D.R. Woods. 1988. Molecular analysis and regulation of the glnA gene of the Gram positive anaerobe Clostridium acetobutylicum. J. Bacteriol. 170:400-408.
Janssen, P.J., D.T. Jones and D.R. Woods. 1990. Studies on Clostridium acetobutylicum glnA promoters and antisense RNA. Mol. Microbiol. 4:1575-1583.
Jones, H.I. 1979. Cutaneous leishmaniasis in western Australia. Med. J. Aust. 2:495-496.
Jones, D.T., W.A. Jones and d.R. Woods. 1985. Production of recombinants after protoplast fusion in Clostridium acetobutylicum P262. J. Gen. Microbiol. 131:1213-1216.
Jones, D.T., A. van der Westhuizen, S. Long, E.R. Allcock, S.J. Reid and D.R. Woods. 1982. Solvent production and morphological changes in Clostridium acetobutylicum. Appl. Environ. Microbiol. 43:1434-1439.
Jones, D.T. and D.R. Woods. 1986a. Acetone-butanol fermentation revisited. Microbiol. Rev. 50:484-524.
Jones, D.T. and D.R. Woods. 1986b. Gene transfer, recombination and gene cloning in Clostridium acetobutylicum. Microbiol. Sci. 3:19-22.

Literature Cited 195
Jones, D.T. and D.R. Woods. 1988. Genetic manipulation of Clostridium acetobutylicum and other species of Clostridium, p. 255-276. In J.A. Thomson. (ed.), Recombinant DNA and bacterial fermentation. CRC Press, Inc., Boca Raton.
Jungermann, K., M. Kem, V. Riebeling and R.K. Thauer. 1976. Function and regulation of ferredoxin reduction with NADH in Clostridia, p. 85-96. In H.G. Schlegel, G. Gottschalk and N. Pfennig (eds.), Microbial production and utilization of gases. Goltze, Gottingen, Germany.
Jungermann, K., G. Leimenstoll, E. Rupprecht and R.K. Thauer. 1971a. Demonstration of NADH-ferredoxin reductase in two saccharolytic Clostridia. Arch. Microbiol. 80:370-372.
Jungermann, K., E. Rupprecht, R. Ohrloff, R.K. Thauer and K. Decker. 1971b. Regulation of the reduced nicotinarnide adenine dinucleotide-ferredoxin reductase system in Clostridium kluyveri. J. Biol. Chern. 246:960-963.
Jungermann, K., R.K. Thauer, G. Leimenstoll and K. Decker. 1973. Function of reduced pyridine nucleotide-ferredoxin oxidoreductases in saccharolytic Clostridia. Biochirn. Biophys. Acta 305:268-280.
Keilty, S. and M. Rosenberg. 1987. Constitutive function of a positively regulated promoter reveals new sequences essential for activity. J. Biol. Chern. 262:6389-6395.
Keithly, J.S. and S.G. Langreth. 1983. Inefficacy of rnetronidazole in experimental infections of Leishmania donovani, L. mexicana and Trypanosoma brucei brucei. Arner. J. Trop. Med. Hyg. 32:485-496.
Kell, D.B., M.W. Peck, G. Rodger and J.G. Morris. 1981. On the permeability to weak acids and bases of the cytoplasmic membrane of Clostridium pasteurianum. Biochern. Biophys. Res. Commun. 99:81-88.
Khym, J.X 1975. An analytical system for rapid separation of tissue nucleotides at low pressures on conventional anion exchangers. Clin. Chern. 21:1245-1252.
Khym, J.X., J.W. Bynum and E. Volkin. 1977. The co-use of retention time and bandwidth measurements in evaluations of nucleotide pools by ion-exchange chromatography. Anal. Biochern. 77:446-463.
Khym, J.X., M.H. Jones, W.H. Lee, J.D. Regan and E. Volkin. 1978. On the question of compartmentalization of the nucleotide pool. J. Biol. Chern. 253:8741-8746.
Killeffer, D.H. 1927. Butanol and acetone from com. A description of the fermentation process. Ind. Eng. Chern. 19:46-50.
Kim, B.H., P. Bellows, R. Datta and J.G. Zeikus. 1984. Control of carbon and electron flow in Clostridium acetobutylicum fermentations: utilization of carbon monoxide to inhibit hydrogen production and to enhance butanol yields. Appl. Environ. Microbiol. 48:764-770.
Kim, B.H. and J.G. Zeikus. 1985. Importance of hydrogen metabolism in regulation of solventogenesis by Clostridium acetobutylicum. Dev. Ind. Microbiol. 26:1-14.
Kingston, R.E. and M.J. Chamberlin. 1981 Pausing and attenuation of in vitro transcription in the rrnB operon of E.coli. Cell 27:523-531.

Literature Cited 196
Knappe, J., H.P. Blaschkowski, P. Grabner and T. Schmitt. 1974. Pyruvate formatelyase of Escherichia coli: The acetyl-enzyrne intermediate .. Eur. J. Biochern. 50:253-263.
Knappe, J., F.A. Neugebauer, H.P. Blaschkowski and M. Ganzler. 1984. Posttranslational activation introduces a free radical into pyruvate formate-lyase. Proc. Natl. Acad. Sci. USA. 81:1332-1335.
Knight, E. Jr., A.J. D'Estachio and R.W.F. Hardy. 1966. flavodoxin; flavoprotein with ferredoxin acitivty from Clostridium pasteurianum. Biochern Biophys. Acta 113:626-628.
Knight, E. Jr. and R.W.F. Hardy. 1966. Isolation and characteristics of flavodoxin from nitrogen-fixing Clostridiurn Clostridium pasteurianum. J. Biol. Chern. 241:2752-2756.
Knight, E. Jr. and R.W.F. Hardy. 1967. Flavodoxin: chemical and biological properties. J. Biol. Chern. 242:1370-137 4.
Knight, R.C., I.M. Skolimowski and 0.1. Edwards. 1978. The interaction of reduced rnetronidazole with DNA. Biochern Pharrnacol. 27:2089-2093.
Koch, R.L., E.J.T. Chrystal, B.B. Beaulieu Jr. and P. Goldman. 1979. Acetarnide: A metabolite of rnetronidazole formed by the intestinal flora. Biochern. Pharmacol. 28:3611-3615.
Koch, R.L. and P. Goldman. 1979. The anaerobic metabolism of rnetronidazole forms N(2-hydroxyethyl)-oxamic add. J. Pharmacol. Exp. Tuer. 208:406-410.
Konigsberg, W. and G.N. Godson. 1983. Evidence for use of rare codons in the dnaG gene and other regulatory genes of Escherichia coli. Proc. Natl. Acad. Sci. USA 80:687-691.
Kozak, M. 1983. Comparison of initiation of protein synthesis in procaryotes, eucaryotes and organelles. Microbiol. Rev. 47:1-45.
Krey, G.D., E.F. Vanin and R.P. Swenson. 1988. Ooning, nucleotide sequence, and expression of the flavodoxin gene from Desulfovibrio vulgaris (Hildenborough). J. Biol. Chem. 263:15436-15443.
Kucers, A and N. Mck. Bennett. 1987. Metronidazole, p. 1290-1329. In The use of antibiotics: A comprehensive review with clinical emphasis. 4th edition. William Heinemann Medical Books, London.
Kulda, J., M. Vojtechovska, J. Tachezy, P. Demes and E. Kunova. 1982. Metronidazole resistance of Trichomonas vaginalis as a cause of treatment failure in trichomoniasis. Br. J. Vener. Dis. 58:394-399.
Laemmli, U.K. 1970. Cleavage of structural proteins during the assembly of the head of bacteriophage T 4. Nature. 227:6~685.
LaRusso, N.F., F. Tomasz, M. Muller and R. Lipman. 1977. In vitro interaction of metronidazole with nucleic adds. Mol. Pharmacol. 13:872-882.
Laudenbach, D.E., M.E. Reith and N.A Straus. 1988. Isolation, sequence analysis, and transcriptional studies of the flavodoxin gene from Anacystis nidulans R2. J. Bacteriol. 170:258-265.

Literature Cited 197
Lee, J.H., P. Patel, P. Sankar and K.T. Shanmugam. 1985. Isolation and characterization of mutant strains of Escherichia coli altered in H2 metabolism. J. Bacteriol. 162:344-352.
Leigh, D.A., K. Simmons and E. Norman. 1974. Bacterial flora of the appendix fossa in appendicitis and postoperative wound infection. J. Clin. Pathol. 27:997-1000.
Leonhardt, K.G. and N.A. Straus. 1989. Sequence of the flavodoxin gene from Anabaena variabilis 7120. Nucleic Acids Res. 17:4384.
Lockerby, D.L., H.R. Rabin, L.E. Bryan and E.J. Laishley. 1984. Ferredoxin-linked reduction of metronidazole in Clostridium pasteurianum. Antimicrob. Agents Chemother. 26:665-669.
Lockerby, D.L., H.R. Rabin and E.J. Laishley. 1985. Role of the phosphoroclastic reaction of Clostridium pasteurianum in the reduction of metronidazole. Antimicrob. Agents Chemother. 27:863-867.
Long, P.I. 1973. Cutaneous leishmaniasis treated with metronidazole. J. Amer. Med. Assn. 223:1378-1379.
Long, S., D.T. Jones and D.R. Woods. 1983. Sporulation of Clostridium acetobutylicum P262 in a defined medium. Appl. Environ. Microbiol. 45:1389-1393.
Long, S., D.T. Jones and D.R. Woods. 1984a. Initiation of solvent production, clostridial stage and endospore formation in Clostridium acetobutylicum P262. Appl. Microbiol. Biotechnol. 20:256-261.
Long, S., D.T. Jones and D.R. Woods. 1984b. The relationship between sporulation and solvent production in Clostridium acetobutylicum P262. Biotechnol. Lett. 6:529-534.
Lopez, J.M., A. Dromerick and E. Freese. 1981. Response of guanosine 5'-triphosphate concentration to nutritional changes and its significance for Bacillus subtilis sporulation. J. Bacteriol. 146:605-613.
Lopez, J.M., C.L. Marks and E. Freese. 1979. The decrease of guanine nucleotides initiates sporulation of Bacillus subtilis. Biochim. Biophys. Acta 587:238-252.
Losick, R., P. Youngman and P.J. Pigot 1986. Genetics of endospore formation in Bacillus subtilis. Annu. Rev. Genet. 20:625-669.
Lossick, J.G. 1981. Metronidazole. New Engl. J. Med. 304:735.
Lucansky, J.B., P.M. Muriana and T.R. Klaenhammer. 1988. Application of electroporation for transfer of plasmid DNA to Lactobacillus, l.adococcus, Leuconostoc, Listeria, Pediococcus, Bacillus, Staphylococcus, Enterococcus and Propionibacterium. Mol. Microbiol. 2:637-646.
Lukin~ G.P., I.S. Logotkin and I.Ya. Veslov. 1972. An investigation of the possibility of the fermentation of sugar beet molasses by the organism Clostridium acetobutylicum, strain S. Translated from Prikladnaya Biochimiya i Microbiologiya. 8:332-336.
Maniatis, T., E.F. Fritsch and J. Sambrook. 1982. Molecular cloning: a laboratory manual. Cold Spring Harbor Laboratory. Cold Spring Harbor, NY.

Literature Cited 198
Manoil, C. and J. Beckwith. 1985. TnphoA: a transposon probe for protein export signals. Proc. Natl. Acad. Sci. USA 82:8129-8133.
Marmur, J. 1961. A procedure for the isolation of deoxyribonucleic acid from microorganisms. J. Mol. Biol. 3:208-218.
Martin, J.R., H. Petitdemange, J. Ballongue and R. Gay. 1983. Effects of acetic and butyric acids on solvent production by Clostridium acetobutylicum. Biotechnol. Lett. 5:89-94.
Martin, J.R., H. Petitdemange, R. Marczak and R. Gay. 1982. A study of NAD(P) oxidoreductases of Clostridium acetobutylicum involved in the metabolism of glucose, p. 123-138. In 0. Chaude and G. Durand (eds.), Industrielle et biotechnologie. Production d'intermediares industriels par culture anaerobie. Societe Fran\aise de Microbiologie, Paris.
Martin, F.H. and I. Tinoco Jr. 1980. DNA-RNA hybrid duplexes containing oligo(dA:rU) sequences are exceptionally unstable and may facilitate termination of transcription. Nucleic Acids Res. 8:2295-2299.
Mayhew, S.G. and M.L. Ludwig. 1975. p 57. In P.D. Boyer, (ed.) The Enzymes, 3rd ed., Vol. 12. Academic Press Inc., New York, NY.
McClure, W.R. 1985. Mechanism and control of transcription initiation in procaryotes. Annu. Rev. Biochem. 54:171-204.
McCoy, E., L.E. McDaniel and J.C. Sylvester. 1944. Bacteriophage in a butyl fermentation plant. J. Bacteriol. 47:433.
Mccutchan, W.N. and R.J. Hickey. 1954. The butanol-acetone fermentations. Ind. Ferment. 1:347-388.
McFadzean, J.A. 1986. Flagyl. The story of a pharmaceutical discovery. The Parthenon Publishing Group Ltd., London.
Mclafferty, M.A., R.L. Koch and P. Goldman. 1982. Interaction of metronidazole with resistant and susceptible Bacteroides fragilis. Antimicrob. Agents Chemother. 21:131-134.
McLaughlin, J.R., C.L. Murray and J.C. Rabinowitz. 1981. Unique features in the ribosome binding site sequence of the Gram positive Staphylococcus aureus ~lactamase gene. J. Biol. Chem. 256:11283-11291.
McNeil, B. and B. Kristiansen. 1985. Effect of temperature upon growth rate and solvent production in batch cultures of Clostridium acetobutylicum. Biotechnol. Lett. 7:499-502.
Meinecke, B., J. Bertram and G. Gottschalk. 1989. Purification and characterization of the pyruvate-ferredoxin oxidoreductase form Clostridium acetobutylicum. Arch. Microbiol. 152:244-250.
Meyer, C.L., J.K. McLaughlin and E.T. Papoutsakis. 1985. The effect of CO on growth and product formation in batch cultures of Clostridium acetobutylicum. Biotechnol. Lett. 7:37-42.
Meyer, R. and K.G. Wagner. 1985. Determination of nucleotide pools in plant tissue by high performance liquid chromatography. Anal. Biochem. 148:269-276.

Literature Cited 199
Miller, J.H. 1972. Experiments in molecular genetics, p. 13-23. Cold Spring Harbor Laboratory, Cold Spring Harbor, NY.
Minton, N.P., J.K. Brehm, J. Oultram, T.-J. Swinfield, S. Schimming, S.E. Whelan, D.E. Thompson, M. Young and W.L. Staudenbauer. 1990a. Development of genetic systems for Clostridium acetobutylicum, p. 759-770. In H. Heslot, J. Davies, J. Florent, L. Bobichon, G. Durand and L. Penasse (eds.), Proceedings of the 6th international symposium on genetics of industrial microorganisms, Vol. 2. Societe Frarn;aise de Microbiologie, Strasbourg.
Minton, N.P., J.K. Brehm, J.D. Oultram, D.E. Thompson, T.-J. Swinfield, A. Pennock, S. Schimming, S.M. Whelan, U. Vetter, M. Young and W.L. Staudenbauer. 1990b. Vector systems for the genetic analysis of Clostridium acetobutylicum, p. 187-201. In S.P. Borriello (ed.), Clinical and molecular aspects of anaerobes. Wrightson Biomedical Publishing Ltd., Petersfield.
Minton, N.P. and D.E. Thompson. 1990. Genetics of Anaerobes, p. 38-61. In B.I. Duerden and 0.1. Drassar (eds.), Anaerobes in Human Disease. Edward Arnold, London.
Mitani, T., J.E. Heinze and E. Freese. 1977. Induction of sporulation in Bacillus subtilis by decoyinine or hadacin. Biochem. Biophys. Res. Commun. 77:1118-1125.
Mongkolsuk, S., E.J. Duvall and P.S. Lovett. 1985. Transcription termination signal for the cat-86 indicator gene in a Bacillus subtilis promoter cloning plasmid. Gene. 37:83-90.
Monot, F. and J.M. Engaser. 1983. Continuous production of acetone butanol on an optimized synthetic medium. Eur. J. Appl. Microbiol. Biotechnol. 18:246-248.
Monot, F., J.M. Engasser and H. Petitdemange. 1984. Influence of pH and undissociated butyric acid on the production of acetone and butanol in batch cultures of Clostridium acetobutylicum. Appl. Microbiol. Biotechnol. 19:422-426.
Moore, W.E.C. 1966. Techniques for routine culture of fastidious anaerobes. Int. J. Syst. Bacteriol. 16:173-190.
Moran, F.J., C. Perez, C. Hurtado, M.T. Blanco and J. Prieto. 1987. The in vitro activity of metronidazole against Enterobacteriaceae alone and in mixed cultures with Bacteroides fragilis. J. Antimicrob. Chemother. 20:657-661.
Mortenson, L.E. 1964. Ferredoxin requirement for nitrogen fixation by extracts of Clostridium pasteurianum. Biochim. Biophys. Acta 81:473-478.
Mortenson, L.E. and J.S. Chen. 1975. Hydrogenases, p. 69-74. In H.G. Schlegel, G. Gottschalk and N. Pfennig (eds.), Microbial production and utilization of gases. Goltze, Gottingen, Germany.
Millier, M. 1982. Resistance to 5-nitroimidazoles in pathogenic microorganisms, p. 133-148. In A. Breccia, B. Cavalleri and G.E. Adams (eds.), Nitroimidazoles; chemistry, pharmacology and clinical applications. Plenum Publishing Corp., New York, NY.
Millier, M. 1983. Mode of action of metronidazole on anaerobic bacteria and protozoa. Surgery 93: 165-171.

Literature Cited 200
Muller, M. and D.G. Lindmark. 1976. Uptake of metronidazole and its effect on viability in trichomonads and Entamoeba invadens under anaerobic and aerobic conditions. Antimicrob. Agents Chemother. 9:696-700.
Murrell, W.G. 1967. The biochemistry of the bacterial endospore. Adv. Microbiol. Physiol. 1:133-251.
Nakhmanovich, B.M. and N.A. Shcheblykina. 1959. Fermentation of p[entoses of corn cob hydrolyzates by Clostridium acetobutylicum. Mikrobiologiya 28:99-104.
Nardi, M., M.-C. Chopin, A. Chopin, M.-M. Cals and J.-C. Gripon. 1991. Cloning and DNA sequence analysis of an X-prolyl dipeptidyl aminopeptidase gene from Uldococcus lactis subsp. ladis NCDO 763. Appl. Environ. Microbiol. 57:45-50.
Narikawa, S. 1986. Distribution of metronidazole susceptibility factors in obligate anaerobes. J. Antimicrob. Chemother. 18:565-574.
Narikawa, S. and M. Nakamura. 1987. Differentiation of obligate anaerobes by assay of pyruvate:ferredoxin oxidoreductase activity. Eur. J. Clin. Microbiol. 6:74-75.
Needleman, S.B. and C.D. Wunsch. 1970. A general method applicable to the search for similarities in the amino acid sequence of two proteins. J. Mol. Biol. 48:443-453.
Nieves, B.M., F. Gil and F.S. Castillo. 1981. Growth inhibition activity and bacteriophage and bacteriocin-like particles associated with different species of Clostridium. Can. J. Microbiol. 27:216-225.
Noble, J.I. and F.P. Tally. 1984. Metronidazole, p. 255-263. In A.M. Ristuccia and B.A. Cunha (eds.), Antimicrobial Therapy. Raven Press, New York, NY.
O'Brien, R.W. and J.G. Morris. 1971. Oxygen and the growth and metabolism of Clostridium acetobutylicum. J. Gen. Microbiol. 68:307-318.
O'Brien, R.W. and J.G. Morris. 1972. Effect of metronidazole on hydrogen production by Clostridium acetobutylicum. Arch. Mikrobiol. 84:225-233.
Ochi, K. 1986. A decrease in GTP content is associated with aerial mycelium formation in Streptomyces MA406-A-1. J. Gen. Microbial. 132:299-305.
Ochi, K. and E. Freese. 1983. Effect of antibiotics on sporulation caused by the stringent response in Bacillus subtilis. J. Gen. Microbiol. 129:3709-3720.
Ochi, K., J.C. Kandala and E. Freese. 1981. Initiation of Bacillus subtilis sporulation by the stringent response to partial amino add deprivation. J. Biol. Chem. 256:6866-6875.
Ogata, S. and M. Hongo. 1979. Bacteriophages of the genus Clostridium. Adv. Appl. Microbiol. 25:241-273.
Ogawa, H., K. Shimada and J.-1. Tomizawa. 1968. Studies on radiation-sensitive mutants of Escherichia coli: I. Mutants defective in the repair synthesis. Mol. Gen. Genet. 101:227-244.
Olempska-Beer, Z. and E.B. Freese. 1984. Optimal extraction conditions for high performance liquid chromatographic determination of nucleotides in yeast. Anal. Biochem. 140:236-245.
Literature Cited 201
Onderdonk, A.B., T.J. Louie, F.P. Tally and J.G. Bartlett. 1979. Activity of metronidazole against Escherichia coli in experimental intra-al:xiominal sepsis. J. Antimicrob. Chemother. 5:201-210.
Oultram, J.D., A. Davies and M. Young. 1987. Conjugal transfer of a small plasmid from Bacillus subtilis to Clostridium acetobutylicum by cointegrate formation with plasmid pAM~1. FEMS Microbial. Lett. 42:114-119.
Oultram, J.D., M. Loughlin, T.-J. Swinfield, J.K. Brehm, D.E. Thompson and N.P. Minton. 1988. Introduction of plasmids into whole cells of Clostridium acetobutylicum by electroporation. FEMS Microbiol. Lett. 56:83-88.
Oultram, J.D. and M. Young. 1985. Conjugal transfer of plasmid pAM~1 from Streptococcus ladis and Bacillus subtilis to Clostridium acetobutylicum. FEMS Microbiol. Lett. 27:129-134.
Page, M.I. 1974. Beware- the anaerobe bandwagon. New Engl. J. Med. 290:338-340.
Pahel, G. and B. Tyler. 1979. A new glnA-linked regulatory gene for glutamine synthetase in Escherichia coli. Proc. Natl. Acad. Sci. USA 76:4544-4558.
Pardo, M.B., C. Gomez-Moreno and M.L. Peleato. 1990. Effect of iron deficiency on ferredoxin levels in Anabaena variabilis PCC 6309. Arch. Microbiol. 153:528-530.
Parker, M.T. 1969. Postoperative clostridial infections in Britain. Br. Med. J. 3:671-676.
Payne, S.M. and B.N. Ames. 1982. A procedure for rapid extraction and high pressure liquid chromatographic separations of nucleotides and other small molecules from bacterial cells. Anal. Biochem. 123:151-161.
Pearson, W.R. and D.J. Lipman. 1988. Improved tools for biological sequence comparison. Proc. Natl. Acad. Sci. USA 85:2444-2448.
Peck H.D., Jr. and H. Gest 1957. Formic dehydrogenase and the hydrogenlyase enzyme complex in coli-aerogenes bacteria. J. Bacteriol. 73:706-721.
Perez-Reyes, E., B. Kalyanaraman and R.P. Mason. 1979. The reductive metabolism of metronidazole and omidazole by anaerobic liver microsomes. Mol. Pharmacol. 17:239-244.
Peschke, U., V. Beuck, H. Bujard, R. Gentz and S. Le Grice. 1985. Efficient utilization of Escherichia coli transcriptional signals in Bacillus subtilis. J. Mol. Biol. 186:547-555.
Petersen, D.J. and G.N. Bennett 1990. Purification of acetoacetate decarboxylase from Clostridium- acetobutylicum ATCC 824 and cloning of the acetoacetate decarboxylase gene in Escherichia coli. Appl Environ. Microbial. 56:3491-3498.
Petitdemange, H., C. Cherrier, G. Raval and R. Gay. 1976. Regulation of the NADH and NADPH-ferredoxin oxidoreductases in Clostridia of the butyric group. Biochim. Biophys. Acta 421:334-347.
Pheifer, T.A., P.S. Forsyth, M.A. Durfee, H.M. Pollock and K.K. Holmes. 1978. Nonspecific vaginitis: Role of Haemophilus vagina/is and treatment with metronidazole. New Engl. J. Med. 26:1429-1434.

Literature Cited 202
Ponnambalam, S., C. Webster, A. Bringham and S. Bushby. 1986. Transcription initiation in the Escherichia coli galactose operon promoters in the absence of the normal-35 region sequences. J. Biol. Chern. 261:16043-16048.
Powell, S.J., I. Macleod, A.J. Wilmot and R. Elsdon-Dew. 1966. Metronidazole in amoebic dysentery and amoebic liver abscess. Lancet 2:1329-1331.
Prescott, S.G. and C.G. Dunn. 1959. Industrial microbiology. 3rd ed. McGraw-Hill Book Co., New York, NY.
Prince, H.N., E. Grunberg, E. Titsworth and W.F. Delorenzo. 1969. Effects of 1-(2-nitro-1-imidazolyl)-3-rnethoxy-2-propanol and 2-rnethyl-5-nitroimidazole-1-ethanol against anaerobic and aerobic bacteria and protozoa. Appl. Micro biol. 18:728-730.
Pulido, d. and A. Jimenez. 1987. Optimization of gene expression in Streptomyces lividans by a transcription terminator. Nucleic Acids Res. 15:4227-4240.
Ragsdale, S.W. and L.G. Ljungdahl. 1984. Characterization of ferredoxin, flavodoxin and rubredoxin from Clostridium formicoaceticum grown in media with high and low iron contents. J. Bacterial. 157:1-6.
Ralph, E.D. and D.A. Clarke. 1978. Inactivation of rnetronidazole by anaerobic and aerobic bacteria. Antimicrob. Agents Chernother. 14:377-383.
Reilly, J., W.J. Hickinbottom, F.R. Henley and A.C. Thaysen. 1920. The products of the "acetone:n-butyl alcohol" fermentation of carbohydrate material with special reference to some of the intermediate substances produced. Biochern. J. 14:229-251.
Reysenbach, A.L., N. Ravenscroft, S. Long, D.T. Jones and D.R. Woods. 1986. Characterization, biosynthesis, and regulation of granulose in Clostridium acetobutylicum. Appl. Environ. Microbial. 52:275-281.
Reysset, G., J. Hubert, L. Podvin, and M. Sebald. 1987. Protoplast formation and regeneration of Clostridium acetobutylicum strain N1-4080. J. Gen. Microbial. 133:2595-2600.
Reysset, G., J. Hubert, L. Podvin, and M. Sebald. 1988. Transfection and transformation of Clostridium acetobutylicum strain N1-4081 protoplasts. Biotechnol. Tech. 2:199-204.
Reysse~ G. and M. Sebald. 1985. Conjugal transfer of plasmid-mediated antibiotic resistance from streptococci to Clostridium acetobutylicum. Ann. Microbial. Inst. Pasteur 136:275-282.
Riebeling, V., R.K. Thauer and K. Jungermann. 1975. The internal-alkaline pH gradient, sensitive to uncoupler and A TPase inhibitor, in growing Clostridium pasteurianum. Eur. J. Biochem. 55:445-453.
Rigby, P.W.J., M. Dieckmann, C. Rhodes and P. Berg. 1977. Labeling deoxyribonucleic acid to high specific activity in vitro by nick translation with DNA polymerase I. J. Mol. Biol. 113:237-251.
Roberts, J.W. 1969. Termination factor for RNA synthesis. Nature 224:1168-1174.
Rogers, P. 1986. Genetics and Biochemistry of Clostridium relevant to development of fermentation processes. Adv. Appl. Microbial. 31:1-60.

Literature Cited 203
Rood, J.P. and J. Murgatroyd. 1979. Metronidazole in the prevention of dry socket. Br. J. Oral Surg. 17:62-70.
Rose, A.H. 1961. Industrial microbiology, p. 160-166. Butterworths, London.
Rosenkranz, H.S. and W.T. Speck. 1975. Mutagenicity of metronidazole: activation by mammalian liver microsomes. Biochem. Biophys. Res. Commun. 66:520-525.
Ross, D. 1961. The acetone-butanol fermentation. Prog. Ind. Microbiol. 3:73-85.
Rowland, S.J. and K.G.H. Dyke. 1988. A DNA invertase from Staphylococcus aureus is a member of the HIN family of site-specific recombinases. FEMS Microbiol. Lett. 50:253-258.
Rowley, D.A, R.C. Knight, I.M. Skolimowski and D.I. Edwards. 1979. The effect of nitroheterocyclic drugs on DNA: and in vitro model of cytotoxicity. Biochem. Pharmacol. 28:3009-3013.
Rowley, D.A, R.C. Knight, I.M. Skolimowski and D.I. Edwards. 1980. The relationship between misonidazole cytotoxicity and base composition of DNA. Biochem Parasitol. 29:2095-2098.
Sacks, L.E. and P.A. Thompson. 1977. Increased spore yields of Clostridium perfringens in the presence of methylxanthines. Appl. Environ. Microbiol. 34:189-193.
Sancar, A. and C.S. Rupert. 1978. Determination of plasmid molecular weights from ultraviolet sensitivities. Nature 272:471-472.
Sanger, F., S. Nicklen and A.R. Coulson. 1977. DNA sequencing with chain-terminating inhibitors. Proc. Natl. Acad. Sci. USA 74:5463-5467.
Santangelo, J.D. 1988. A general purpose computer analysis system for chromatographic data. CABIOS. 4:275-279.
Santangelo, J.D., D.T. Jones and D.R. Woods. 1989. Comparison of nucleoside triphosphate levels in the wild-type strain with those in sporulation-deficient and solvent-deficient mutants of Clostridium acetobutylicum P262. J. Gen. Microbiol. 135:711-719.
Santangelo, J.D., D.T. Jones and D.R. Woods. 1991. Metronidazole activation and the isolation of Clostridium acetobutylicum electron transport genes. J. Bacteriol. 173:1088-1095.
Savitzky, A and M.J.E. Golay. 1964. Smoothing and differentiation of data by simplified least squares procedures. Anal. Chern. 36:1627-1639.
Schardinger, F. 1905. Bacillus marcerans, ein Aceton bildender Rottebacillus. Zentralbl. Bakteriol. Parasitenkd. Infektionskr. Hyg. Abt. 2 14:772-781.
Scherings, G., H. Haaker and C. Veeger. 1977. Regulation of nitrogen fixation by Fe-S protein II in Azotobader vinelandii. Eur. J. Biochem. 77:621-630.
Schonheit, P., A. Brandis and R.K. Thauer. 1979. Ferredoxin degradation in growing Clostridium pasteurianum during periods of iron deprivation. Arch. Microbiol. 120:73-76.

Literature Cited 204
Sharp, P.M., T.M.F. Tuohy and K.R. Mosurski. 1986. Codon usage in yeast: cluster analysis clearly differentiates highly and lowly expressed genes. Nucleic Acids Res. 14:5125-5143.
Shine, J. and L. Dalgarno. 1974. The 3' terminal sequence of Escherichia coli 165 ribosomal RNA: complementary to nonsense triplets and ribosomal binding sites. Proc. Natl. Acad. Sci. USA 71:1342-1346.
Shinn, D.L.S. 1962. Metronidazole in acute ulcerative gingivitis. Lancet 1:1191.
Simon, E. 1947. The formation of lactic acid by Clostridium acetobutylicum (Weizrnan). Arch. biochern. 13:237-243.
Smillie, R.M. 1965. Isolation of two proteins with chloroplast ferredoxin activity from blue-green alga. Biochern. Biophys Res. Commun. 20:621-629.
Smith, G.E. and M.D. Summers. 1980. The bidirectional transfer of DNA and RNA to nitrocellulose or diazobenzyloxyrnethyl-paper. Anal. Biochern. 109:123-129.
Snedecor, G.W. and W.G. Cochran. 1980. Statistical Methods. 7th ed. The Iowa State University Press, Ames IA.
Sonenshein, A.L. 1985. Recent progress in metabolic regulation of sporulation, p. 185-193. In J.A. Hoch and P. Setlow (eds.), Molecular biology of microbial differentiation. American Society for Microbiology, Washington, DC.
Sonenshein, A.L. 1989. Metabolic regulation of sporulation and other stationary phase phenomena, p. 109-130. In P. Setlow, R. Slipecky and I. Smith (eds.), Regulation of prokaryotic development. American Society for Microbiology, Washington, DC.
Soriano, F., M.C. Ponte and M.C. Gaspar. 1982. Reciprocal antimicrobial synergism between Escherichia coli and Bacteroides fragilis in the presence of rnetronidazole. J. Clin. Pathol. 35:1150-1152.
Southern, E.M. 1975. Detection of specific sequences among DNA fragments separated by gel electrophoresis. J. Mol. Biol. 98:503-517.
Speakman, H.B. 1920. Gas production during the acetone and butyl alcohol fermentation of starch. J. Biol. Chern. 43:401-411.
Spivey, M.J. 1978. The acetone/butanol/ethanol fermentation. Process Biochern.13:2-5.
Stadtman, E.R. 1952. The purification and properties of phosphotransacetylase. J. Biol~ Chem. 196:527-534.
Sterlini, J.M. and J. Mandelstam. 1%9. Commitment to sporulation in Bacillus subtilis and its relationship to development of actinornycin resistance. Biochern. J. 113:29-37.
Stewart, V. 1988. Nitrate respiration in relation to facultative metabolism in Enterobacteria. Microbiol. Rev. 52:190-232.
Stewart, V. and C.H. MacGregor. 1982. Nitrate reductase in Escherichia coli K-12: Involvement of chlC, chlE, and chlG loci. J. Bacteriol. 151:788-799.
Literature Cited 205
Stoehr, P.J. and R.A. Omond. 1989. The EMBL network file server. Nucleic Acids Res. 17:6763-6764.
Struhl, K. 1985. A rapid method for creating recombinant DNA molecules. Bio Techniques 3:452-453.
Sutcliffe, J.G. 1978. Complete nucleotide sequence of the Escherichia coli plasmid pBR322. Cold Spring Harbor Symp. Quant. Biol. 43:77-90.
Swinfield, T.-J., J.D. Oultram, D.E. Thompson, J.K. Brehm and N.P. Minton 1990. Physical characterisation of the replication region of the Streptococcus faecalis plasmid pAM~l. Gene 87:79-90.
Tabor, S. and C.C. Richardson. 1987. DNA sequence analysis with a modified bacteriophage T7 DNA polymerase. Proc. Natl. Acad. Sci. USA 84:4767-4771.
Tally, F.P., B.R. Goldin and N.E. Sullivan. 1981. Nitroimidazoles: In vitro activity and efficacy in anaerobic infections. Scand. J. Infect. Dis. (Suppl.) 26:46-53.
Tally, F.P., B.R. Goldin, N. Sullivan, J. Johnston and S.L. Gorbach. 1978. Antimicrobial activity of metronidazole in anaerobic bacteria. Antimicrob. Agents Chemother. 13:460-465.
Tally, F.P., D.R. Snydman, M.J. Shimell and B.R. Goldin. 1979. Mechanisms of antimicrobial resistance of Baderoides fragilis, p. 19-27. In I. Phillips and J. Collier (eds.), Proceedings of the 2nd international symposium on metronidazole. Academic Press Inc., New York, NY.
Tally, F.P., V.L. Sutter and S.M. Finegold. 1975. Treatment of anaerobic infections with metronidazole. Antimicrob. Agents Chemother. 7:672-675.
Tanaka, M., M. Haniu, K. T. Yasunobu and S. Mayhew. 1974. The amino acid sequence of the Clostridium MP flavodoxin. J. Biol. Chem. 249:4393-4396.
Tanaka, M., M. Haniu, K.T. Yasunobu, S. Mayhew and V. Massey. 1973. The primary structure of Peptostreptococcus elsdenii flavodoxin. J. Biol. Chem. 248:4354-4366.
Taylor, M.F., M.H. Boylan and D.E. Edmondson. 1990. Azotobader vinelandii flavodoxin: Purification and properties of the recombinant, dephospho form expressed in Escherichia coli. Biochem. 29:6911-6918.
Thauer, R.K., K. Jungermann and K. Decker. 1977. Energy conservation in chemotrophic anaerobic bacteria. Bacteriol. Rev. 41:100-180.
Thauer, R.K., B. Kaufer, M. Zahringer and K. Jungermann. 1974. The reaction of the iron-sulfur protein with carbon monoxide. Eur. J. Biochem. 42:447-452.
Thauer, R.K., E. Rupprecht, C. Ohrloff, K. Jungermann and K. Decker. 1971. Regulation of the reduced nicotinamide adenine dinucleotide phosphateferredoxin reductase system in Clostridium kluyveri. J. Biol. Chem. 246:954-959.
Thurner, J. and J.G. Meingassner. 1978. Isolation of Trichomonas vagina/is resistant to metronidazole. Lancet 2:738.
Tollin, G. and D.E. Edmondson. 1980. Purification and properties of flavodoxins, p. 392-406. In A. SanPietro (ed.), Methods in Enzymology, Vol. 69. Academic Press Inc., New York, NY.

Literature Cited 206
Truffaut, N., J. Hubert and G. Reysset. 1989. Construction of shuttle vectors useful for transforming Clostridium acetobutylicum. FEMS Microbial. Lett. 58:15-20.
Umbreit, W.W., R.H. Burris and J.F. Stauffer. 1972. Manometric and Biochemical techniques, 5th ed., Burgess Publishing Company, Minneapolis, MN.
Urano, N., I. Karube, S. Suzuki, T. Yamada, H. Hirochika and K. Sakaguchi. 1983. Isolation and partial characterization of large plasmids in hydrogen-evolving bacterium Clostridium butyricum. Eur. J. Appl. Microbial. Biotechnol. 17:349-354.
Usdin, K.P., H. Zappe, D.T. Jones and D.R. Woods. 1986. Cloning, expression and purification of glutamine synthetase from Clostridium acetobutylicum. Appl Environ. Microbial. 52:413-419.
Valentine, R.C., R.C. Jackson and R.S. Wolfe. 1962. Role of ferredoxin in hydrogen metabolism of Micrococcus lactilyticus. Biochem. Biophys. Res. Commun. 7:453-456.
van der Westhuizen, A., D.T. Jones and D.R. Woods. 1982. Autolytic activity and butanol tolerance of Clostridium acetobutylicum. Appl. Environ. Microbial. 44: 1277-1282.
Volesky, B., A. Mulchandani and J. Williams. 1981. Biochemical production of industrial solvents (acetone-butanol-ethanol) from renewable resources. Ann. N.Y. Acad. Sci. 369:205-218.
Volesky, B. and T. Szczesny. 1983. Bacterial conversion of pentose sugars to acetone and butanol. Adv. Biochem. Eng. Biotechnol. 27:101-117.
Voordouw, G., J.E. Walker and S. Brenner. 1985. Cloning of the gene encoding the hydrogenase from Desulfovibrio vulgaris (Hildenborough) and determination of the NHz-terminal sequence. Eur. J. Biochem. 148:509-514.
Wahl, R.C. and W.H. Orme-Johnson. 1987. Clostridial pyruvate o:xidoreductase and the pyruvate-o:xidizing enzyme specific to nitrogen fixation in Klebsiella pneumoniae are similar enzymes. J. Biol. Chem. 262:10489-10496.
Waitkins, S.A. and D.J. Thomas. 1981. Isolation of Trichomonas vaginalis resistant to metronidazole. Lancet 2:590.
Wakabayashi, S., T. Kimura, K. Fukuyama, H. Matsubara and L.J. Rogers. 1989. The amino acid sequence of a flavodoxin from the eukaryotic red alga Chondrus crispus. Biochem. J. 263:981-984.
Walton, M.T. and J.L. Martin. 1979. Production of butanol-acetone by fermentation, p. 187-209. In H.J. Peppler and D. Perlman (eds.), Microbial technology, 2nd ed., Vol. 1. Academic Press Inc., New York, NY.
Wardman, P. and E.D. Clarke. 1976. One-electron reduction potentials of substituted nitroimidazoles measured by pulse radiolysis. J. Chem. Soc. Faraday Trans. I. 72:1377-1390.
Waterson, R.M., F.J. Castellino, G.M.Hass and R.L. Hill. 1972. Purification and characterization of crotonase from Clostridium acetobutylicum. J. Biol. Chem. 147:5266-5271.
Weizmann, C. 1963. Trial and error. Hamish Hamilton, London.

Literature Cited 207
Welch, R.W., F.B. Rudolph and E.T. Papoutsakis. 1989. Purification and characterization of the NADH-dependent butanol dehydrogenase from Clostridium acetobutylicum (ATCC 824). Arch. Biochem. Biophys. 273:309-318.
Wiesenbom, D.P., F.B. Rudolph and E.T. Papoutsakis. 1988. Thiolase from Clostridium acetobutylicum A TCC 824 and its role in the synthesis of acids and solvents. Appl. Environ. Microbiol. 54:2717-2722.
Wiesenbom, D.P., F.B. Rudolph and E.T. Papoutsakis. 1989a. Coenzyme-A transferase from Clostridium acetobutylicum ATCC 824 and its role in the uptake of acids. Appl. Environ. Microbiol. 55:323-329.
Wiesenbom, D.P., F.B. Rudolph and E.T. Papoutsakis. 1989b. Phosphotransbutyrylase from Clostridium acetobutylicum ATCC 824 and its role in acidogenesis. Appl. Environ. Microbiol. 55:317-322.
Williams, D.R., D.I. Young and M. Young. 1990. Conjugative plasmid transfer from Escherichia coli to Clostridium acetobutylicum. J. Gen Microbiol. 136:819-826.
Willis, A.T, C.L. Bullen, I.R. Ferguson, P.H. Jones, K.D. Phillips, P.V. Tearle, K. Williams, S.E.J. Young, G.C. Brentnall, G.H. Bancroft-Livingstone, S.A. Seligman, J. Abrahams, A. Collyer, C. Lush and D. Wilkinson. 1974. Metronidazole in the prevention and treatment of Bacteroides infections in gynaecological patients. Lancet 2:1540-1543.
Willis, A.T., I.R. Ferguson, P.H. Jones, K.D. Phillips, P.V. Tearle, R.B. Berry, R.V. Fiddian, D.F. Graham, D.H.C. Harland, D.B. Innes, W.M. Mee, R.L. RothwellJackson, I. Sutch, C. Kilbey and D. Edwards. 1976. Metronidazole in prevention and treatment of Bacteroides infections after appendicectomy. Br. Med. J. 1:318-321.
Willis, A.T., I.R. Ferguson, P.H. Jones, K.D. Phillips, P.V. Tearle, C.D. Brentall, G.H. Bancroft-Livingston, S.A. Seligman, C. Lush, D. Wilkinson, I. Sutch and C. Kilbey. 1975. An evaluation of metronidazole in the prophylaxis and treatment of anaerobic infections in surgical patients. J. Antimicrob. Chemother. 1:393-401.
Willis, A.T., I.R. Ferguson, P.H. Jones, K.D. Phillips, P.V. Tearle, C.D. Brentall, G.H. Bancroft-Livingston, S.A. Seligman, I. Sutch and D. Edwards. 1978. An evaluation of metronidazole in the prophylaxis and treatment of anaerobic infections in obstetrical patients. J. Antimicrob. Chemother. (Suppl. C) 4:55-62.
Willis, A.T., I.R. Ferguson, P.H. Jones, K.D. Phillips, P.V. Tearle, R.V. Fiddian, D.F. Graham, D.H.C. Harland, D.F.R. Hughes, D. Knight, W.M. Mee, N. Pashby, R.L. Rothwell-Jackson, A.K. Sachdeva, I. Sutch, C. Kilbey and D. Edwards. 1977. Metronidazole in prevention and treatment of Bacteroides infections in elective colonic surgery. Br. Med. J. 1:607-610.
Wimpenny, J.W.T. and J.A. Cole. 1967. The regulation of metabolism in facultative bacteria. III. The effect of nitrate. Biochim. Biophys Acta 148:233-242.
Wirth, R., A. Friesenegger and S. Fiedler. 1989. Transformation of various species of gram-negative bacteria belonging to 11 different genera by electroporation. Mol. Gen. Genet. 216:175-177.
Wood, W.B. 1966. Host specificity of DNA produced by Escherichia coli: Bacterial mutations affecting the restriction and modification of DNA. J. Mol. Biol. 16:118-133.

Literature Cited 208
Wood, H.G., R.W. Brown and C.H. Werkman. 1945. Mechanism of the butyl alcohol fermentation with heavy carbon acetic and butyric acids and acetone. Arch. Biochem. 6:243-261.
Woods, D.R. and D.T. Jones. 1986. Physiological responses of Bacteroides and Clostridium strains to environmental stress factors. Adv. Microb. Physiol. 27:1-64.
Woolley, R.D., A. Pennock, R.J. Ashton, A. Davies and M. Young. 1989. Transfer of Tn1545 and Tn916 to Clostridium acetobutylicum. Plasmid 22:169-174.
Wynkoop, R. 1943. n-Butanol and acetone. Ind. Eng. Chem. 35:1240-1242.
Yanisch-Perron, D., J. Vierra and J. Messing. 1985. Improved M13 phage cloning vectors and host strains: nucleotide sequences of M13mp8 and pUC19 vectors. Gene 33:103-119.
Yarvenko, V.L. 1964. Principles of the continuous alcohol and butanol-acetone fermentation processes, p. 205-217. In I. Malek (ed.), continuous cultivation of microorganisms. 2nd Symposium. Czechoslovakian Academy of Sciences, Prague.
Yerushalmi, L. and B. Volesky. 1985. Importance of agitation in acetone-butanol fermentation. Biotechnol. Bioeng. 27:1297-1305.
Yerushalmi, L., B. Volesky and T. Szczesny. 1985. Effect of increased hydrogen partial pressure on the acetone-butanol fermentation by Clostridium acetobutylicum. Appl. Microbiol. Biotechnol. 22:103-107.
Yeung, T-C., B.B. Beaulieu Jr., M.A. Mclafferty and P. Goldman. 1984. Interaction of metronidazole with DNA repair mutants of Escherichia coli. Antimicrob. Agents Chemother. 21:131-134.
Yoch, D.C., J.R. Benemann, R.C. Valentine and D.I. Aron. 1969. The electron transport system in nitrogen fixation by Azotobader. II. Isolation and function of a new type of ferredoxin. Proc. Natl. Acad. Sci. USA 64:1404-1410.
Yoshino, S., T. Yoshino, S. Hara, S. Ogata and S. Hayashida. 1990. Construction of shuttle vector plasmid between Clostridium acetobutylicum and Escherichia coli. Agric. Biol. Chem. 54:437-441.
Young, M., N.P. Minton and W.L. Staudenbauer. 1989a. Recent advances in the genetics of the Clostridia. FEMS Microbiol. Rev. 63:301-325.
Young, M., W. L. Staudenbauer and N.P. Minton. 1989b. Genetics of Clostridium, p. 63-103. In N.P. Minton and D.J. Clarke (eds.), Clostridia. Biotechnology Handbooks 3. Plenum Publishing Corp., New York, NY.
Youngleson, J.S., W.A. Jones, D.T. Jones and D.R. Woods. 1989a. Homology between hydroxybutyryl and hydroxy acyl coenzyrne A dehydrogenase enzymes from Clostridium acetobutylicum fermentation and vertebrate fatty acid ~oxidation pathways. J. Bacteriol. 171:6800-6807.
Youngleson, J.S., W.A. Jones, D.T. Jones and D.R. Woods. 1989b. Molecular analysis and nucleotide sequence of the adh1 gene encoding a NADPH-dependent butanol dehydrogenase in the Gram positive anaerobe Clostridium acetobutylicum. Gene. 78:355-364.

Literature Cited 209
Youngleson, J.S., J.D. Santangelo, D.T. Jones and D.R. Woods. 1988. Cloning and expression of a Clostridium acetobutylicum alcohol dehydrogenase gene in Escherichia coli. Appl. Environ. Microbial. 54:676-682.
Yu, P.-L. and L.E. Pearce. 1986. Conjugal transfer of strepotcoccal antibiotic resistance plasmids into Clostridium acetobutylicum. Biotechnol. Lett. 8:469-474.
Yudin, K 1990. Database services available form E-mail servers. News From Genbank 3:1-2.
Zabeau, M. and K.K. Stanley. 1982. Enhanced expression of cro-~galactosidase fusion proteins studied under the control of the Pr promoter of bacteriophage A. EMBO J. 1:1217-1224.
Zain-ul-Abedin, J.M. Lopez and E. Freese. 1983. Induction of bacterial differentiation by adenine and adenosine analogs and inhibitors of nucleic acid synthesis. Nucleosides and Nucleotides 2:257-274.
Zappe, H., D.T. Jones, W.A. Jones and D.R. Woods. 1988. Structure of an endo-~1,4-glucanase gene from Clostridium acetobutylicum P262 showing homology with endoglucanase genes from Bacillus spp. Appl. Environ. Microbiol. B54:1289-1292.
Zappe, H., D.T. Jones and D.R. Woods. 1986. Cloning and expression of Clostridium acetobutylicum endoglucanase, cellobiase and amino acid biosynthesis genes in Escherichia coli. J. Gen. Microbiol. 132:1367-1372.
Zappe, H., D.T. Jones and D.R. Woods. 1987. Cloning and expression of a xylanase gene from Clostridium acetobutylicum P262 in Escherichia coli. Appl. Microbial. Biotechnol. 27:57-63.
Zappe, H., W.A. Jones and D.R. Woods. 1990. Nucleotide sequence of a Clostridium acetobutylicum P262 xylanase gene (xynB). Nucleic Acids Res. 18:2179.
Zeikus, J.G. 1980. Chemical and fuel production by anaerobic bacteria. Annu. Rev. Microbiol. 34:423-464.
Zeikus, J.G. 1983. Metabolism of one-carbon compounds by chemotrophic anaerobes. Adv. Microb. Physiol. 24:215-266.