Studies of the Radiation Chemistry and Grafting of a ...process, both the radiation chemistry of PFA...
217
Studies of the Radiation Chemistry and Grafting of a Fluoropolymer A thesis submitted for the fulfillment of the degree of Doctor of Philosophy In the Department of Chemistry The University of Queensland, Australia by Tim R. Dargaville, B.Sc. (Hons.) December 2002
Transcript of Studies of the Radiation Chemistry and Grafting of a ...process, both the radiation chemistry of PFA...

Studies of the Radiation Chemistry and
Grafting of a Fluoropolymer
A thesis submitted for the fulfillment of the degree of
Doctor of Philosophy
In the Department of Chemistry
The University of Queensland, Australia
by
Tim R. Dargaville, B.Sc. (Hons.)
December 2002

ii
Declaration
The work contained in this thesis was undertaken in the Department of Chemistry at the
University of Queensland, the Institute of Polymer Research Dresden (Germany) and
Mimotopes Pty Ltd, Melbourne. To the best of my knowledge and belief, all work
contained in this thesis is original and my own, except as acknowledged by appropriate
references. I declare that I have not submitted this material, either in whole or in part, for a
degree at this or any other university.
Tim R. Dargaville

iii
To Mum

iv Acknowledgements
I would like to thank my principle supervisor Associate Professor Dave Hill for his
encouragement, good ideas (the bad ones were mine), support and the knack he had for
filling me with enthusiasm whenever I left his office after a meeting. I would also like to
thank Associate Professor Andrew Whittaker for his guidance and willingness to offer help
whenever things hit a rough patch.
This project would not have been possible without the efforts and vision of
Professor Graeme George, Drs Firas Rasoul , Joe Maeji and Senake Perera. Thanks also to
Dr Peter Pomery for suggestions at the beginning of the project.
I would also like to thank Drs Ulrich Scheler, Beata Fuchs, Uwe Lappan and Klaus
Lunkwitz from the Institute of Polymer Research Dresden for allowing me to work at the
IPF, and to the relatives of Francine Kroesen for making travel to Germany possible
through the Francine Kroesen Travel Fellowship.
The help from Bob and Ian from the glassblowing workshop for patience and
sensational glassblowing skills is greatly acknowledged, as is assistance from Dr Graham
Ruhle for use of the Instron, Gavin Gant at ANSTO for irradiation of samples at high
temperature, Dr Barry Wood for help with the XPS, and Merrin, Jennifer and Birgit in the
office for the gracious handling of my many administrative requests.
Use of the Raman microprobe was provided by Dr Llew Rintoul and Professor Peter
Fredricks at QUT, while assistance with the loading tests was from Yen Pham and Fran
Ercole at Mimotopes.
My time at UQ would not have been the same without the friendships and help from
members of the Polymer Materials and Radiation Group, past and present, who have
allowed me to experience a fantastic and memorable 3.5 years at UQ, especially Tri, Chris,
Julie, Kris, Liying, Nihal, Shahroo, David and Francisco.

v Additional personal financial support and work experience was made possible by
Associate Professors John Cotton, Lawrie Gahan and Mary Garson by way of tutoring and
casual employment.
Special thanks to Moling Chen for the laughs and helping me quit my job to start a
PhD.
The financial support for the project from the Australian Research Council,
Mimotopes Pty Ltd and the RACI Polymer Division is gratefully acknowledged.
Finally I would like to pay special thanks to Bronwin for her love and support and
help with preparation of this manuscript and to my family—Mum (dec.), Dad, Roger, Toby
and Simon.

vi
Abstract
The radiation chemistry and the grafting of a fluoropolymer, poly(tetrafluoroethylene-co-
perfluoropropyl vinyl ether) (PFA), was investigated with the aim of developing a highly-
stable grafted support for use in solid phase organic chemistry (SPOC). A radiation- induced
grafting method was used whereby the PFA was exposed to ionizing radiation to form free
radicals capable of initiating graft copolymerization of styrene. To fully investigate this
process, both the radiation chemistry of PFA and the grafting of styrene to PFA were
examined.
Radiation alone was found to have a detrimental effect on PFA when irradiated at
303 K. This was evident from the loss in the mechanical properties due to chain scission
reactions. This meant that when radiation was used for the grafting reactions, the total
radiation dose needed to be kept as low as possible. The radicals produced when PFA was
exposed to radiation were examined using electron spin resonance spectroscopy. Both
main-chain (–CF2–C.F–CF2-) and end-chain (–CF2–C
.F2) radicals were identified. The
stability of the majority of the main-chain radicals when the polymer was heated above the
glass transition temperature suggested that they were present mainly in the crystalline
regions of the polymer, while the end-chain radicals were predominately located in the
amorphous regions. The radical yield at 77 K was lower than the radical yield at 303 K
suggesting that cage recombination at low temperatures inhibited free radicals from
stabilizing.
High-speed MAS 19F NMR was used to identify the non-volatile products after
irradiation of PFA over a wide temperature range. The major products observed over the
irradiation temperature 303 to 633 K included new saturated chain ends, short fluoromethyl
side chains in both the amorphous and crystalline regions, and long branch points. The
proportion of the radiolytic products shifted from mainly chain scission products at low
irradiation temperatures to extensive branching at higher irradiation temperatures.
Calculations of G values revealed that net crosslinking only occurred when PFA was
irradiated in the melt. Minor products after irradiation at elevated temperatures included
internal and terminal double bonds and CF3 groups adjacent to double bonds. The volatile
products after irradiation at 303 K included tetrafluoromethane (CF4) and oxygen-
vii containing species from loss of the perfluoropropyl ether side chains of PFA as identified
by mass spectrometry and FTIR spectroscopy.
The chemical changes induced by radiation exposure were accompanied by changes
in the thermal properties of the polymer. Changes in the crystallinity and thermal stability
of PFA after irradiation were examined using DSC and TGA techniques. The equilibrium
melting temperature of untreated PFA was 599 K as determined using a method of
extrapolation of the melting temperatures of imperfectly formed crystals. After low
temperature irradiation, radiation- induced crystallization was prevalent due to scission of
strained tie molecules, loss of perfluoropropyl ether side chains, and lowering of the
molecular weight which promoted chain alignment and hence higher crystallinity. After
irradiation at high temperatures, the presence of short and long branches hindered
crystallization, lowering the overall crystallinity. The thermal stability of the PFA
decreased with increasing radiation dose and temperature due to the introduction of defect
groups.
Styrene was graft copolymerized to PFA using γ-radiation as the initiation source
with the aim of preparing a graft copolymer suitable as a support for SPOC. Various
grafting conditions were studied, such as the total dose, dose rate, solvent effects and
addition of nitroxides to create “living” graft chains. The effect of dose rate was examined
when grafting styrene vapour to PFA using the simultaneous grafting method. The initial
rate of grafting was found to be independent of the dose rate which implied that the reaction
was diffusion controlled. When the styrene was dissolved in various solvents for the
grafting reaction, the graft yield was strongly dependent of the type and concentration of
the solvent used. The greatest graft yield was observed when the solvent swelled the grafted
layers and the substrate. Microprobe Raman spectroscopy was used to map the penetration
of the graft into the substrate. The grafted layer was found to contain both poly(styrene)
(PS) and PFA and became thicker with increasing radiation dose and graft yield which
showed that grafting began at the surface and progressively penetrated the substrate as the
grafted layer was swollen. The molecular weight of the grafted PS was estimated by
measuring the molecular weight of the non-covalently bonded homopolymer formed in the
grafted layers using SEC. The molecular weight of the occluded homopolymer was an
order of magnitude greater than the free homopolymer formed in the surrounding solution
suggesting that the high viscosity in the grafted regions led to long PS grafts. When a

viii nitroxide mediated free radical polymerization was used, grafting occurred within the
substrate and not on the surface due to diffusion of styrene into the substrate at the high
temperatures needed for the reaction to proceed.
Loading tests were used to measure the capacity of the PS graft to be functionialized
with aminomethyl groups then further derivatized. These loading tests showed that samples
grafted in a solution of styrene and methanol had superior loading capacity over samples
graft using other solvents due to the shallow penetration and hence better accessibility of
the graft when methanol was used as a solvent.

ix
Publications
Dargaville, T. R., Hill, D. J. T., Whittaker, A. K., “An ESR Study of Irradiated
Poly(tetrafluoroethylene-co-perfluoropropyl vinyl ether) (PFA)”, Radiat. Phys. Chem. 62,
25-31 (2001).
Dargaville, T. R., George, G. A., Hill, D. J. T., Scheler, U., Whittaker, A. K., “High-Speed
MAS 19F NMR Analysis of an Irradiated Fluoropolymer”, Macromolecules 35, 5544-5549
(2002).
Dargaville, T.; Hill, D., Perera, S., “Grafted Fluoropolymers as Supports for Solid Phase
Organic Chemistry: Preparation and Characterization.”, Aust. J. Chem. 55, 439-441 (2002),
invited paper.
Dargaville, T. R., Hill, D. J. T., “Grafting to Fluoropolymers – A Review”, Prog. Polym.
Sci., in preparation
Conference Proceedings
Effect Of Ionising Radiation on Poly(tetrafluoroethylene-co-perfluoropropyl vinylether)
(PFA), Tim R. Dargaville, David J. T. Hill, Graeme A. George,
Queensland Polymer Symposium 1999 (Poster)
Effect Of Ionising Radiation on Poly(tetrafluoroethylene-co-perfluoropropyl vinylether)
(PFA), Tim R. Dargaville, David J. T. Hill, Graeme A. George, 23rd Australian Polymer
Symposium (1999) Geelong, Victoria, Australia (Poster)
Radiation Induced Vapour Phase Grafting of Styrene onto a Fluoropolymer, Tim R.
Dargaville, David J. T. Hill, Graeme A. George, F. Cardona, Radiation 2000, ANSTO,
Sydney, Australia (Poster)

x Radiation Induced Vapour Phase Grafting of Styrene onto a Fluoropolymer, Tim R.
Dargaville, David J. T. Hill, Graeme A. George, F. Cardona, Pacifichem 2000, Honolulu,
USA (Oral)
High Speed MAS NMR Analysis of an Irradiated Fluoropolymer, T.R. Dargaville, D.J.T.
Hill, G.A. George, U. Scheler, A.K. Whittaker, 24th Australian Polymer Symposium (2001)
Beechworth, Victoria, Australia (Oral)
High Speed 19F MAS NMR Analysis of an Irradiated Fluoropolymer, T.R. Dargaville,
D.J.T. Hill, G.A. George, U. Scheler, A.K. Whittaker, World Chemistry Congress 2001,
Brisbane, Australia (Poster)
Surface Modification of a Fluoropolymer, T.R. Dargaville, D.J.T. Hill, G.A. George, A.K.
Whittaker, 25th Australian Polymer Symposium (2002) Armidale, New South Wales,
Australia (Poster) – Awarded Treloar Prize for best poster presentation
Awards
The Francine Kroesen Travel Fellowship 2000
The Treloar Prize for best poster presentation at the 25th Australasian Polymer Symposium
xi
Table of Contents
Declaration.......................................................................................................................... ii
Acknowledgements............................................................................................................ iv
Abstract .............................................................................................................................. vi
Publications ........................................................................................................................ ix
Conference Proceedings .................................................................................................... ix
Awards ................................................................................................................................ x
Table of Contents............................................................................................................... xi
List of Figures .................................................................................................................. xvi
List of Tables .................................................................................................................. xxii
List of Schemes.............................................................................................................. xxiv
List of Abbreviations ..................................................................................................... xxvi
Chapter 1: Introduction and Review of the Literature
page
1.1 Overview................................................................................................................. 1
1.2 Polymers as Supports for Solid Phase Organic Chemistry..................................... 2
1.2.1 Modern Solid Supports ................................................................................... 4
1.3 The Problem............................................................................................................ 6
1.4 The Fluoropolymer PFA......................................................................................... 8
1.5 Literature Review of Grafting to Fluoropolymers ................................................ 10
1.5.1 Radiation-Induced Graft Copolymerization ................................................. 10
1.5.2 Grafting to Fluoropolymers .......................................................................... 12
1.5.2.1 Influence of Solvent and Monomer Concentration .............................. 14
1.5.3 The Use of Additives for Grafting................................................................ 17
1.5.3.1 Additives Used to Control Homopolymerization................................. 17
1.5.3.2 Acids Used to Enhance Grafting .......................................................... 19
1.5.3.3 Crosslinking Agents as Additives......................................................... 22
1.5.4 Effect of Fluoropolymer Substrate ............................................................... 24
1.5.5 Characterization Techniques ........................................................................ 26
1.5.5.1 Nuclear Magnetic Resonance Spectroscopy......................................... 26

xii
1.5.5.2 Graft Molecular Weight by Size-Exclusion Chromatography ............. 28
1.5.5.3 X-ray Photoelectron Spectroscopy ....................................................... 29
1.5.5.4 Microprobe Raman and FTIR-ATR Spectroscopy............................... 31
1.5.5.5 Scanning Electron Microscopy and X-ray Analysis............................. 32
1.6 Conclusions and Thesis Objectives ...................................................................... 34
1.7 References............................................................................................................. 36
Chapter 2: Radical Formation in PFA
2.1 Introduction........................................................................................................... 43
2.1.1 Theory and Technical Aspects...................................................................... 45
2.2 Experimental......................................................................................................... 47
2.3 Results and Discussion......................................................................................... 49
2.3.1 303 K Radiolysis........................................................................................... 49
2.3.2 Annealing of PFA Irradiated at 303 K.......................................................... 55
2.3.3 Life-times of Radicals at Ambient Temperature .......................................... 58
2.3.4 77 K Irradiation and Annealing Study.......................................................... 60
2.3.5 Radical Yields............................................................................................... 63
2.4 Conclusions ........................................................................................................... 64
2.5 References............................................................................................................. 65
Chapter 3: Structural Changes in γ-Irradiated PFA: High-Speed MAS 19F NMR
3.1 Introduction........................................................................................................... 67
3.2 Theory and Technical Aspects.............................................................................. 69
3.3 Experimental......................................................................................................... 70
3.3.1 NMR Spectroscopy....................................................................................... 70
3.3.2 Analysis of Volatile Products ....................................................................... 71
3.3.2.1 Irradiation ............................................................................................. 71
3.3.2.2 FTIR Spectroscopy............................................................................... 72
xiii
3.3.2.3 Mass Spectrometry ............................................................................... 72
3.4 Results and Discussion......................................................................................... 72
3.4.1 Effect of Spinning Speed .............................................................................. 72
3.4.2 Untreated PFA .............................................................................................. 74
3.4.3 Irradiated PFA .............................................................................................. 75
3.4.3.1 Radiolytic Products From TFE Groups ................................................ 75
3.4.3.2 Radiolytic Products From PPVE Groups ............................................. 83
3.4.4 G Values ....................................................................................................... 84
3.4.5 Analysis of the Volatile Products from Irradiation of PFA.......................... 88
3.5 Conclusions ........................................................................................................... 93
3.6 References............................................................................................................. 94
Chapter 4: Crosslinking of PFA by High Temperature Electron Beam
Irradiation
4.1 Introduction........................................................................................................... 96
4.2 Experimental......................................................................................................... 98
4.2.1 Electron Beam Irradiation............................................................................. 98
4.2.2 NMR Spectroscopy..................................................................................... 100
4.2.3 FTIR Spectroscopy..................................................................................... 100
4.3 Results and Discussion....................................................................................... 100
4.3.1 NMR Spectroscopy..................................................................................... 100
4.3.2 FTIR Spectroscopy..................................................................................... 104
4.3.3 G Values of Crosslinking............................................................................ 106
4.4 Conclusions ......................................................................................................... 109
4.5 References........................................................................................................... 110
Chapter 5: The Thermal Properties of Irradiated PFA
5.1 Introduction......................................................................................................... 112
5.2 Experimental....................................................................................................... 113

xiv
5.2.1 Radiolysis ................................................................................................... 113
5.2.2 Thermal Analysis ........................................................................................ 113
5.2.3 Preparation of Films for Tensile Measurements......................................... 114
5.2.4 Radiolysis of Dogbones for Tensile Measurements ................................... 114
5.2.5 Tensile Measurements ................................................................................ 115
5.3 Results and Discussion....................................................................................... 115
5.3.1 Glass Transition Temperature of Untreated PFA....................................... 115
5.3.2 Melting Behavior of Untreated PFA........................................................... 116
5.3.3 Thermal Properties of Irradiated PFA ........................................................ 119
5.3.4 Thermal Gravimetric Analysis (TGA)........................................................ 122
5.3.5 Tensile Measurements of Low-Dose PFA.................................................. 125
5.4 Conclusions ......................................................................................................... 127
5.5 References........................................................................................................... 128
Chapter 6: Grafting I – Vapour and Solvent Effects
6.1 Introduction......................................................................................................... 130
6.2 Theory and Technical Aspects............................................................................ 132
6.2.1 Microprobe Raman Spectroscopy............................................................... 132
6.3 Experimental....................................................................................................... 133
6.3.1 Materials ..................................................................................................... 133
6.3.2 Vapour-Phase Grafting ............................................................................... 134
6.3.3 Solution Grafting ........................................................................................ 135
6.3.4 Microprobe Raman Spectroscopy............................................................... 136
6.3.5 Size-Exclusion Chromatography (SEC) ..................................................... 136
6.3.6 Loading Tests.............................................................................................. 137
6.3.6.1 Aminomethylation.............................................................................. 137
6.3.6.2 Fmoc-Rink Coupling .......................................................................... 137
6.4 Results and Discussion....................................................................................... 138
6.4.1 Vapour-Phase Grafting ............................................................................... 138
6.4.2 Raman Microprobe Mapping of Vapour-Phase Grafted Films .................. 141
6.4.3 Effect of Solvents on the Graft Yield ......................................................... 146
6.4.4 Raman Microprobe Mapping of Lanterns – Effect of Grafting Solvent .... 152

xv
6.4.5 Molecular Weight Distribution of the Homopolymer ................................ 157
6.4.6 Loading of Grafted Substrates .................................................................... 162
6.5 Conclusions ......................................................................................................... 165
6.6 References........................................................................................................... 166
Chapter 7: Grafting II – Grafting by “Living” Polymerization
7.1 Introduction......................................................................................................... 169
7.2 Experimental....................................................................................................... 174
7.2.1 Reagents...................................................................................................... 174
7.2.2 Grafting....................................................................................................... 174
7.2.3 Differential Scanning Calometry................................................................ 174
7.2.4 Microprobe Raman Spectroscopy............................................................... 175
7.2.5 Loading Tests.............................................................................................. 175
7.3 Results and Discussion....................................................................................... 176
7.3.1 Nitroxide Effect on Graft Yield .................................................................. 176
7.3.2 Distribution of the Graft ............................................................................. 178
7.3.3 Radical Stability and Crystallinity.............................................................. 181
7.3.4 Loading Tests.............................................................................................. 182
7.4 Conclusions ......................................................................................................... 183
7.5 References........................................................................................................... 184
Chapter 8: Overall Conclusions and Further Work
8.1 Radiolysis of PFA............................................................................................... 186
8.2 Grafting to PFA .................................................................................................. 188

xvi
List of Figures
Chapter 1 Page
Figure 1.1 Synthesis of a peptide on Merrifield Resin using a series of coupling and
deprotecting steps. After each step the excess reagents and non-covalently impurities are washed away with solvent. BOC = tert-butyloxycarbonyl. ........... 3
Figure 1.2 Structures of Tentagel (left) and PEGA (right). ................................................... 5 Figure 1.3 Grafted solid supports commercialized by Mimotopes Pty Ltd. Left: injection
moulded lanterns; Middle: a lantern on a stem; Right: lanterns on stems in a 8 × 12 array format for multiple handling (pictures courtesy of www.mimotopes.com).......................................................................................... 6
Figure 1.4 The effect of boiling toluene on fluorinated and PP/PE/ERP blend lanterns.
Left: a fluorinated lantern and a PP/PE/EPR lantern before treatment; Right: the lanterns after being subjected to boiling toluene for five minutes then cooled. (source: author’s experiment). .............................................................................. 7
Figure 1.5 The structure of PFA. ........................................................................................... 8 Figure 1.6 The use of ionizing radiation to graft monomer “B” to polymer “A” to form a
graft copolymer................................................................................................... 10 Figure 1.7 The structure of Nafion®. .................................................................................. 14 Figure 1.8 Observation of a Trommsdorff effect when grafting styrene to poly(propylene)
fabric. Data taken from Nho et al.50 ................................................................... 15 Figure 1.9 Acid effect for radiation- induced grafting of styrene in methanol to
poly(propylene). Dose rate 0.4 kGy hr-1, the total dose was 2 kGy. (-ο-) no acid; (-•-) 0.05 M H2SO4. Data taken from reference [47]. ........................................ 20
Figure 1.10 The structure of several crosslinking agents used in grafting reactions. .......... 23
Chapter 2 Figure 2.1 Main-chain (I) and end-chain (II) radicals. ........................................................ 45 Figure 2.2 Possible energy levels for a single unpaired electron as a function of magnetic
field.16 ................................................................................................................. 46 Figure 2.3 Powerplots of PFA irradiated at 303 K and measured at 298 K (left) and PFA
irradiated and measured at 77K (right). The total dose was 500 kGy. The dashed

xvii
line is an aid to illustrate where the microwave power deviates from linearity (power saturation) ............................................................................................... 48
Figure 2.4 ESR spectra of PFA irradiated at 303 K in vacuum. Doses: 5, 30, 70, 100 kGy.
Features of the spectra are indicated by: # - the triplet; * - the central line of the double quintet; φ - outer wing of the broad component. The glass signal is indicated by “gs”. ................................................................................................ 50
Figure 2.5 Top: ESR spectrum of PFA irradiated to 10 kGy at 303 K in vacuum, Bottom:
simulation of the double quintet and triplet. ....................................................... 52 Figure 2.6 Radical concentration of PFA as a function of dose. 298 K (irradiated at 303 K
and acquired at 298 K); 77 K (irradiated and acquired at 77 K). ....................... 53 Figure 2.7 Decay curve for the total number of free radicals in PFA irradiated (100 kGy) at
303 K then annealed. .......................................................................................... 56 Figure 2.8 ESR spectra of PFA irradiated (100 kGy) at 303 K then annealed. The glass
signal is indicated by “gs”. ................................................................................. 57 Figure 2.9 Stability of the radicals created in PFA when irradiated at 303 K and stored
at 294 K in vacuum. ............................................................................................ 58 Figure 2.10 ESR spectra of PFA irradiated to 60 kGy. Top: immediately after irradiation;
Middle: 10 days after irradiation; Bottom: 664 days after irradiation. The dotted box highlights the decay of the central triplet. The glass signal is indicated by “gs”. ............................................................................................. 59
Figure 2.11 ESR spectra of PFA irradiated and acquired at (A) 77 K; (B) annealed and
acquired at 170 K; (C) annealed and acquired at 292 K; (D) cooled back to 77 K and acquired at 77 K. The glass signal is indicated by “gs”. .................. 61
Chapter 3 Figure 3.1 Effect of spinning speed. From top to bottom: static; 3 kHz; 9 kHz; 13.5 kHz;
19.5 kHz. ............................................................................................................. 73 Figure 3.2 High-speed 19F MAS NMR spectrum of PFA. Top: full spectrum; spinning
sidebands denoted with an asterisk, Bottom: expansion of –50 to –210 ppm region with 10 times vertical expansion. ............................................................ 74
Figure 3.3 19F MAS NMR of PFA: (A) untreated PFA, (B) irradiated to 1 MGy at 303 K,
(C) irradiated to 1 MGy at 473 K, (D) irradiated to 1 MGy at 573 K. Spinning sidebands from the peak assigned to CF3 groups at –83.6 ppm are denoted by an asterisk. ............................................................................................................... 77
Figure 3.4 Hahn echo experiment of PFA irradiated to 1 MGy at 573 K. (A) Single-pulse
experiment; (B) Hahn echo experiment. The spectra were normalized to the peak at –83.6 ppm. .............................................................................................. 80
xviii Figure 3.5 FTIR spectra of PFA: (a) untreated, (b) irradiated to 0.5 MGy at 303 K, (c)
irradiated to 0.5 MGy at 473 K, (d) irradiated to 0.5 MGy at 573 K. Assignments were made according to Lappan et al.,22 Lunkwitz et al.,21 and Carlson.25 ............................................................................................................ 81
Figure 3.6 19F MAS NMR of PFA: expansion of the region from –50 to –75 ppm: (A) PFA
irradiated to 1 MGy at 303 K in air, (B) PFA irradiated to 1 MGy at 303 K in vacuum, (C) irradiated to 1 MGy at 473 K in vacuum, (D) irradiated to 1 MGy at 573 K in vacuum. ............................................................................................ 82
Figure 3.7 New functional groups as a function of radiation dose: (A) PPVE units; (B) new
CF3 chain ends; (C) CF3 side chains; (D) long branch points. The dotted lines are an aid to the eye only. ................................................................................... 85
Figure 3.8 G values for PPVE, CF3 side chains, long branch points and new chain ends for
irradiation temperatures of 303, 473 and 573 K. ................................................ 86 Figure 3.9 FTIR spectra of the volatile products from irradiated PFA and PTFE over the
range 2600 to 550 cm-1. The spectra of the volatile products from irradiation of PTFE and PFA after 15 minutes are expanded by ×2. Inset: expansion of the region from 1400 to 950 cm-1. ............................................................................ 89
Figure 3.10 Mass spectrum of the gases evolved from PFA irradiated at 303 K to
60 kGy. ............................................................................................................ 91
Chapter 4 Figure 4.1 Top: Diagram of the chamber used for electron beam irradiation; Middle and
Bottom: photographs of the scanner and vacuum chamber (courtesy of Dr Uwe Lappan, IPF). ...................................................................................................... 99
Figure 4.2 Weight loss (measured gravimetrically) of PFA samples irradiated at 633 K
with electron beams. ......................................................................................... 100 Figure 4.3 HS MAS 19F NMR of PFA irradiated at 633 K in vacuum. (A) 0.5 MGy,
3.5 kHz; (B) 0.5 MGy, 17 kHz; (C) 1 MGy, 13.5 kHz; (D) 1 MGy, 19 kHz; (E) 2 MGy, 13.5 kHz; (F) 2 MGy, 19.5 kHz. The movement of the spinning sidebands due to the CF2 peak at –122 ppm is indicated by the dashed lines. The asterisk on the peak at –150 ppm denotes the spinning sideband from the peak at –83 ppm. ........................................................................................................... 102
Figure 4.4 FTIR spectra of (A) untreated PFA; (B) PFA irradiated to 0.5 MGy at 633K;
(C) PFA irradiated to 2 MGy at 633K. ............................................................. 105
Chapter 5 Figure 5.1 DMA of untreated PFA. Tan δ as a function of temperature. .......................... 115

xix Figure 5.2 Melting endotherms (positive direction) of as received PFA and after
crystallization at temperatures Tc. The heating rate was 20 K min-1. ............... 117 Figure 5.3 Melting temperature (Tm) plotted as a function of crystallization temperature
(Tc). The dashed line satisfies the equation Tc = Tm. ........................................ 118 Figure 5.4 DSC traces of non- irradiated PFA and PFA irradiated to 1 MGy over a range of
temperatures. Samples were crystallized from the melt by cooling at 40 K min-1 followed by subsequent heating at 40 K min-1 to measure the melting endotherms (positive direction). ....................................................................... 120
Figure 5.5 Melting temperature as a function of dose for samples irradiated at 303, 423,
473, 573 and 633 K........................................................................................... 121 Figure 5.6 Crystallinity as a function of dose for samples irradiated at 303, 423, 473,
573 and 633 K................................................................................................... 121 Figure 5.7 TGA traces of untreated PFA and PFA irradiated to a dose of 1 MGy at 303,
423, 473, 573 and 633 K................................................................................... 123 Figure 5.8 TGA traces. (A) irradiated at 303 K; (B) irradiated at 473 K; (C) irradiated at
573 K (derivative curves are included to highlight the predominately two-step decomposition); (D) irradiated at 633 K........................................................... 124
Figure 5.9 Typical stress-strain plots for untreated PFA and PFA irradiated to 5, 10 and
30 kGy, all in vacuum at 303 K. Measurements were made at 296 K. ............ 125 Figure 5.10 Tensile strength, Young’s modulus, elongation and energy to break of
irradiated PFA as a function of irradiation dose. The dotted line is an aid to the eye only. ................................................................................................... 126
Chapter 6 Figure 6.1 A photograph of a Mimotopes lantern made from PFA before grafting. Injection
moulding has left injection points on the third and seventh rings indicated by the arrows. .............................................................................................................. 134
Figure 6.2 Glassware used for vapour-phase grafting. The PFA film was in the radiation
source, while the styrene feed monomer was outside the source. .................... 135 Figure 6.3 Graft yield as a function of time for the grafting of styrene vapour to PFA films
using the simultaneous grafting method. .......................................................... 140 Figure 6.4 Raman spectrum of untreated PFA in the region 3000 - 200 cm-1................... 141 Figure 6.5 Raman spectra of (a) untreated PFA, and (b) pure PS in the region
1250 – 700 cm-1. ............................................................................................... 142

xx Figure 6.6 Microscope photograph of a cross-section of a PFA film grafted using styrene
vapour. .............................................................................................................. 143 Figure 6.7 Stack plot of vapour-phase grafted PFA. The total dose was 19.6 kGy at a
dose rate of 1.9 kGy hr-1. .................................................................................. 143 Figure 6.8 Depth penetration profiles of the mole fraction of PS for films grafted with
styrene vapour at different dose rates. .............................................................. 145 Figure 6.9 The correlation between the area under the Raman profile and the graft yield
for vapour-phase grafted PFA. ......................................................................... 146 Figure 6.10 Effect of monomer concentration for various solvents. Total dose: 15 kGy,
dose rate: 0.69 kGy hr-1. ................................................................................ 147 Figure 6.11 Graft yield for higher dose (30 kGy): methanol, toluene and
dichloromethane. ........................................................................................... 150 Figure 6.12 Cross-section cut from a lantern for Raman-mapping. A one-dimensional
Raman map was produced by collecting spectra along a path perpendicular to the surface. ................................................................................................. 152
Figure 6.13 Stack plots of Raman spectra obtained by microprobe mapping of cross-
sections. Top: PFA grafted in a solution of styrene and methanol (70 % v/v styrene); Bottom: PFA grafted in a solution of styrene and dichloromethane ( 70 % v/v styrene). Each was irradiated to a dose of 15 kGy. ...................... 153
Figure 6.14 Profiles of the mole fraction of PS into graft copolymers prepared by grafting
in styrene dissolved in: (A) methanol; (B) toluene (note: bulk styrene is included in this profile); (C) dichloromethane. The total dose for all samples was 15 kGy at a dose rate of 0.69 kGy hr-1. .................................................. 154
Figure 6.15 SEC traces of homopolymer isolated from the grafting reactions: (a) occluded
and (b) free homopolymer from bulk styrene; (c) occluded and (d) free homopolymer from methanol solutions; (e) occluded and (f) free homopolymer from dichloromethane solutions; (g) occluded and (h) free homopolymer from toluene solutions. The concentration except for the bulk styrene experiments was 50 % v/v styrene in each case and the total dose was 15 kGy. ................................................................................................... 159
Chapter 7 Figure 7.1 (A) Cartoon picture of “Dreadlocked” “Rasta” resin; (B) TMI / styrene
“Rasta” resin (taken from reference [13]). ....................................................... 171 Figure 7.2 Structures of TEMPO (left); and TEISO (right). ............................................. 176 Figure 7.3 Graft yield for different nitroxide concentration when grafting styrene to PFA
at 373 K – (¦ ) TEMPO; (? ) TEISO. The grafting time was 40 hours............ 177
xxi Figure 7.4 Raman map of a cross-section of PFA grafted with styrene with 4.6 × 10⁻³ M
TEMPO............................................................................................................. 179 Figure 7.5 Raman map of a cross-section of PFA grafted with neat styrene. ................... 179 Figure 7.6 Raman spectrum of TEMPO in the range 700 – 1100 cm-1. ............................ 180 Figure 7.7 Map of PS graft into PFA substrate. (-¦ -) room temperature grafting, no
nitroxide; (-? -) no TEMPO, 373 K; (-? -) 4.6 × 10⁻³ M TEMPO, 373 K; (-•-) 1.9 × 10⁻² M TEMPO, 373 K. 0 % indicates the surface of the graft copolymer, while 50 % indicates the mid-point into the cross-section. ........... 181

xxii
List of Tables
Chapter 1
Page
Table 1.1 Some of the commercially available fluoropolymers. ......................................... 13
Chapter 3 Table 3.1 Peak assignments for untreated PFA. .................................................................. 75 Table 3.2 Peak assignments for PTFE irradiated in the melt by Katoh et al.11 and Fuchs and
Scheler10 and assignments for new peaks in irradiated PFA. ............................. 78 Table 3.3 Assignment of the MS. ........................................................................................ 92
Chapter 4 Table 4.1 Assignments of new peaks observed in the 19F NMR spectra of PFA after
irradiation at 633 K. .......................................................................................... 104 Table 4.2 Assignments of bands in the FTIR spectra of PFA irradiated in vacuum at
633 K. ............................................................................................................... 105 Table 4.3 Comparison of the G values for formation of functional groups in irradiated
PFA (633 K) and PTFE (638 K). ...................................................................... 107
Chapter 6 Table 6.1 Graft yield in methanol and dichloromethane solutions irradiated to 15 and
30 kGy and pre- irradiated. ................................................................................ 151 Table 6.2 Percentage conversion of styrene to PS for each solvent over a concentration
range. The total dose was 15 kGy at a dose rate of 0.69 kGy hr-1.................... 158 Table 6.3 Number-average molecular weight (Mn) of the free and occluded homopolymer
for each of the solvents used. The concentration was 50 % v/v styrene. ......... 161 Table 6.4 Results of Fmoc loading tests. ........................................................................... 164

xxiii
Chapter 7 Table 7.1 Heat of fusion determined by DSC (first run) for PFA grafted using various
conditions.......................................................................................................... 182

xxiv
List of Schemes
Chapter 1 Page
Scheme 1.1 Reaction of oxygen with a carbon-centred radical on a polymer. .................... 18 Scheme 1.2 Reaction of a peroxy radical with a small polymer fragment P'. ..................... 19 Scheme 1.3 Decomposition of a diperoxide by Mohr’s salt. ............................................... 19 Scheme 1.4 Decomposition of a peroxy radical by Mohr’s salt. ......................................... 19 Scheme 1.5 Conversion of a hydroxy radical to a hydroxy ion using Mohr’s salt. ............. 19 Scheme 1.6 Conversion of a charged proton to a radical. .................................................... 20 Scheme 1.7 Decomposition of a hydroperoxy group Mohr’s salt........................................ 22
Chapter 2 Scheme 2.1 Possible radicals formed from scission at the PPVE units and the
ß-rearrangement to form acyl fluoride (V). ..................................................... 54
Chapter 3 Scheme 3.1 Possible pathways of the PPVE units during radiation treatment of PFA. ....... 84 Scheme 3.2 Possible volatile products formed from decomposition of the ether side
chain................................................................................................................. 90
Chapter 4 Scheme 4.1 Possible non-volatile products from cleavage of the C–O bonds of the alkoxy
group of PFA. ................................................................................................ 108
Chapter 6 Scheme 6.1 Mechanism of the Fmoc-Rink loading test..................................................... 163

xxv
Chapter 7 Scheme 7.1 Proposed mechanism for nitroxide-mediated polymerization. ....................... 170 Scheme 7.2 Reaction scheme of graft polymerization of styrene to PP. Taken from
Miwa et al.19 .................................................................................................. 173
Chapter 8 Scheme 8.1 The major decomposition pathways of the PPVE units in PFA when exposed
to γ-radiation. ................................................................................................. 188

xxvi
List of Abbreviations
ATR Attenuated Total Reflectance
CP Cross Polarization
DMA Dynamic Mechanical Analysis
DSC Differential Scanning Calorimetry
EPR Ethylene-propylene rubber
ESR Electron Spin Resonance
ETFE Ethylene-tetrafluoroethylene copolymer
FEP Fluorinated ethylene-propylene copolymer
FTIR Fourier Transform Infrared
G(R) Radical Yield
LFRP “Living” Free Radical Polymerization
MAS Magic Angle Spinning
MS Mass Spectrometry
MWD Molecular Weight Distribution
NMR Nuclear Magnetic Resonance
PCTFE Poly(chlorotrifluoroethylene)
PFA Perfluoroalkoxy
PMMA Poly(methyl methacrylate)
PPVE Perfluoropropyl vinyl ether
PS Poly(styrene)
PTFE Poly(tetrafluoroethylene)
PVDF Poly(vinylidene fluoride)
PVDF-co-HFP Poly(vinylidene fluoride-co-hexafluoropropylene)
PVF Poly(vinyl fluoride)
SEC Size Exclusion Chromatography
SEM Scanning Electron Microscopy
SPOC Solid Phase Organic Chemistry
TEMPO 2,2,6,6-tetramethyl-1-piperidinyloxy
TEISO 1,1,3,3-tetraethylisoindolin-2-yloxyl
TFE Tetrafluoroethylene
Tc Crystallization Temperature
Tm Melting Temperature

xxvii Tg Glass Transition Temperature
TGA Thermal Gravimetric Analysis
XPS X-ray Photoelectron Spectroscopy
Chapter 1
1 Introduction and Review of the Literature
1.1 Overview
Surface modification of polymers by graft copolymerization has afforded a great number of
new materials with unique properties. The surface properties of the grafted polymer are
often in stark contrast to the properties of the original polymer. Most industrial polymers
are hydrophobic in nature, however through introduction of new functional groups to the
surface, properties such as hydrophilicity, adhesion, biocompatibility, conductivity,
anti- fogging and anti- fouling may be attained.
Fluoropolymers are a class of polymers with excellent chemical and thermal
stability, low dielectric constants, and low surface energy. It is quite remarkable, almost
iconoclastic, that fluoropolymers can be altered so that the surface behavior displays none
of the non-stick, inert properties made famous by this class of polymers.
The chemical stability of fluoropolymers means that extremely harsh conditions are
required to modify the surface on the molecular scale. This can be achieved either
chemically, by etching, or by using high-energy radiation. Chemical treatment is most
commonly performed using sodium-liquid ammonia1 or sodium naphthalemide.2 These
treatments can improve the bondabilty of the surface, however the environmental concerns
as well as the difficulties in controlling the depth profiles of the treatments make these
methods unsuitable as a modern industrial process. Cleaner methods are available as
fluoropolymers are relatively susceptible to high-energy radiation such as plasma,3 X-rays,4
γ-rays,5 vacuum ultraviolet,6 excimer or Ar+ lasers,7 electron8 and ion beams.9,10 Alkyl
radicals are usually produced and these can react with air to form oxygen-containing
species. Alternatively, the radicals produced may be used to initiate polymerization of a
monomer to form a graft copolymer. By using the graft copolymerization method to modify
the surface, the properties can be tailored by judicious choice of monomer.

Chapter 1 Introduction and Review of the Literature 2
This thesis examines the processes in which the surface of fluoropolymers are
modified so they may be used as solid supports for organic synthesis.
1.2 Polymers as Supports for Solid Phase Organic Chemistry
The synthesis of compounds while tethered to an insoluble polymer support was first
demonstrated in 1963 by Bruce Merrifield, the recipient of the 1984 Nobel prize in
Chemistry.11 In his pioneering work, Merrifield synthesized a series of peptides in which
one terminus of each peptide was covalently bonded to 1 % crosslinked chloromethylated
poly(styrene) resin. This method is now the most commonly used tool to synthesize
peptides and has become known as solid phase peptide synthesis (SPPS). As can be seen
from Figure 1.1, the Merrifield method for peptide synthesis is a series of repeated coupling
and deprotecting steps, each separated by washing steps. The advantage of using a
functionalized poly(styrene) (PS) resin support is that being insoluble in the solvent used, it
acts as a “handle” to which the peptides are attached. This facilitates the synthesis by virtue
of the fact that purification after each step becomes trivial: the resin-bound peptide can be
filtered and washed free of any excess reagents and non-covalently bonded impurities. The
advantages are obvious when compared to traditional solution phase synthesis, where
workup may involve evaporation of the solvent, dissolution of the target compound and
impurities, some chromatography and further removal of solvent. In addition to the
handling advantages of using SPPS, reactions may be driven to completion by addition of
excess reagents which are simply washed away after the reaction.

Chapter 1 Introduction and Review of the Literature 3
Cl O
O
R1
NHBOCO
O
R1
NH2
CF3COOH
O
O
NH
O
R2
NHBOC
R1
CF3COOH
O
O
NH
O
R2
NH2
R1
O
R1
NH
O
R2
HN
O
R3
NHBOC
O
BOCNH
COOH
R2
BOCNH
COOH
R3
BOCNH
COOH
R1
coupling deprotection
coupling deprotection
coupling
P
P P P
PP
P= 1% crosslinked chloromethylated polystyrene
Figure 1.1 Synthesis of a peptide on Merrifield Resin using a series of coupling and deprotecting steps. After
each step the excess reagents and non-covalently impurities are washed away with solvent.
BOC = tert-butyloxycarbonyl.
In the 1970s the same methodology used for SPPS was extended to solid phase
synthesis of non-peptidic compounds (called solid phase organic chemistry (SPOC)).12
However, it was not until some 15 years later that SPOC became popular through the
advent of combinatorial chemistry. This relatively new area of chemistry allows large
libraries or arrays of compounds to be produced by the random or directed combinations of
simple building blocks. For example, in the case of peptide synthesis, the amino acids are
the building blocks. Geysen, in 1984, was the first to report the use of a

Chapter 1 Introduction and Review of the Literature 4
solid phase / combinatorial chemistry methodology to synthesize a library of several
hundred peptides to map an epitope.13 Unfortunately, peptides are inherently poor drugs as
they cannot be taken orally and have short half- lives. It was not until the 1990s when
“pharmaceutical type” chemistries were adapted to solid phase chemistry that the
realization was made that large arrays of potential drugs could be made using combinatorial
chemistry. The growth in this area of chemistry has been driven mainly by advances in
high-throughput screening (HTS), in which the capacity to test compounds for biological
activity and the types of assays available has increased significantly. This put pressure on
the synthetic chemist to produce larger numbers of compounds to keep up with the capacity
of the assays. Many large pharmaceutical companies are now using combinatorial solid
phase methodologies to synthesize large numbers of compounds in order to improve their
chances of discovering new drug leads. Recently these same methods used for drug
discovery have been used in a novel way to synthesize libraries of initiators used in the
preparation of dendritic nanoscale materials.14
To date, many books and journals have been dedicated to exploring the types of
chemistry that can be performed on the solid phase. Unfortunately the influence of the solid
support is regularly overlooked and more often than not, the polymer phase is depicted as
an opaque circle by the synthetic chemist (for example Figure 1.1). Whether it was
Merrifield’s foresight or the lack of significant development in resins is unclear, but
Merrifield resin (first used in 1963) is still the most popular resin.15 When compared with
the chemistry performed on solid phases, the solid support as a separate entity has received
little attention in the literature and in the laboratory.
1.2.1 Modern Solid Supports
The term “solid support” may conjure up an image of a rigid, impermeable, static system,
whereas in reality a good solid support is none of these things. Reactions commonly occur
on mobile, well-solvated, and reagent-accessible polymer strands throughout the interiors
of the supports. An ideal support has good swelling ability in a range of solvents; the
compounds synthesized have high purity and reactions should proceed at rates similar to
solution phase reactions.
Chapter 1 Introduction and Review of the Literature 5
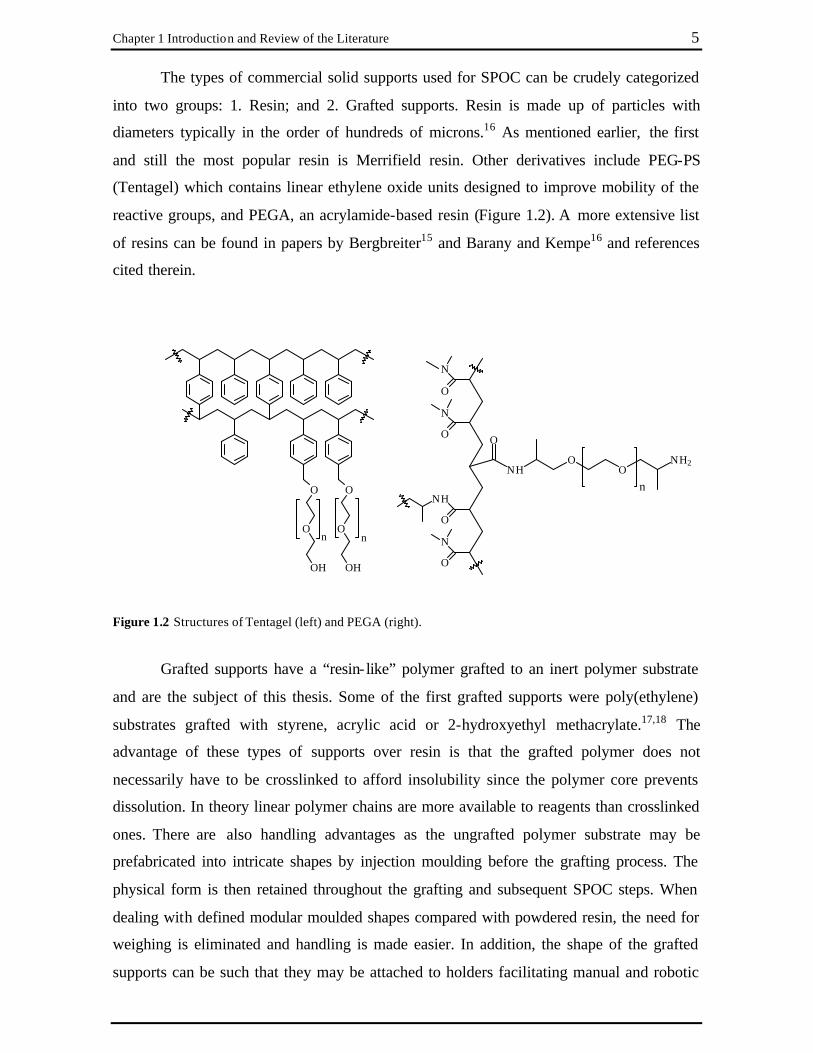
The types of commercial solid supports used for SPOC can be crudely categorized
into two groups: 1. Resin; and 2. Grafted supports. Resin is made up of particles with
diameters typically in the order of hundreds of microns.16 As mentioned earlier, the first
and still the most popular resin is Merrifield resin. Other derivatives include PEG-PS
(Tentagel) which contains linear ethylene oxide units designed to improve mobility of the
reactive groups, and PEGA, an acrylamide-based resin (Figure 1.2). A more extensive list
of resins can be found in papers by Bergbreiter15 and Barany and Kempe16 and references
cited therein.
nn
O O
O O
OH OH
n
O
O
O
N
N
N
O
NH
O
NHO
ONH2
Figure 1.2 Structures of Tentagel (left) and PEGA (right).
Grafted supports have a “resin- like” polymer grafted to an inert polymer substrate
and are the subject of this thesis. Some of the first grafted supports were poly(ethylene)
substrates grafted with styrene, acrylic acid or 2-hydroxyethyl methacrylate.17,18 The
advantage of these types of supports over resin is that the grafted polymer does not
necessarily have to be crosslinked to afford insolubility since the polymer core prevents
dissolution. In theory linear polymer chains are more available to reagents than crosslinked
ones. There are also handling advantages as the ungrafted polymer substrate may be
prefabricated into intricate shapes by injection moulding before the grafting process. The
physical form is then retained throughout the grafting and subsequent SPOC steps. When
dealing with defined modular moulded shapes compared with powdered resin, the need for
weighing is eliminated and handling is made easier. In addition, the shape of the grafted
supports can be such that they may be attached to holders facilitating manual and robotic

Chapter 1 Introduction and Review of the Literature 6
processes, or have radio-frequency tags inserted to aid identification and sorting.
Mimotopes Pty Ltd (Melbourne, Australia) has led the field in grafted supports for SPOC
and SPPS. They have coined the term “pins” to describe their product. An example of a pin
is the “lanternTM”, shown in Figure 1.3.
Figure 1.3 Grafted solid supports commercialized by Mimotopes Pty Ltd. Left: injection moulded lanterns;
Middle: a lantern on a stem; Right: lanterns on stems in a 8 × 12 array format for multiple handling (pictures
courtesy of www.mimotopes.com).
1.3 The Problem
At present the commercially available pins from Mimotopes Pty Ltd are manufactured by
grafting various vinylic monomers to a base polymer blend made from poly(propylene),
poly(ethylene) and ethylene-propylene rubber using a radiation-grafting method. As the
types of chemistry being explored using SPOC widens, so too do the conditions to which
the supports are subjected. Poly(propylene)-based or resin supports have relatively low
temperature limits and will degrade or dissolve if exposed to certain solvents at high
temperatures (for example, toluene heated to reflux temperature) or if exposed to
microwaves. By using a more stable base polymer for the pins in terms of temperature and
chemical resistance it is hoped that these problems can be overcome.
Another problem occasionally reported with the poly(propylene)-based pins is that
while performing multiple step SPOC reactions, impurities from reactions several steps
earlier can appear.19 It is possible that the impurities are being trapped in the
poly(propylene) matrix and are released in subsequent synthesis steps. A less penetrable
base polymer may solve this problem.

Chapter 1 Introduction and Review of the Literature 7
Fluoropolymers are the obvious choice of polymer when high temperature and
chemical stability are needed and they swell only slightly in most solvents. These properties
stem from the extraordinary C–F bond strength of 481.3 kJ mol-1 and orientation of the
fluorine atoms about the carbon backbone which shield it against chemical attack.20
Figure 1.4 illustrates how a fluorinated lantern is resistant to boiling toluene, while a
poly(propylene) blend lantern dissolves and becomes unrecognizable after the same
treatment. Poly(tetrafluoroethylene) (PTFE) is the most common fluoropolymer and has the
highest temperature limit of all the fluoropolymers but it is not melt-processable∗ , so cannot
be injection moulded into lantern shapes. Fortunately, melt-processable fluoropolymers are
available which have similar properties to PTFE, and this thesis examines grafting to one of
these polymers.
Figure 1.4 The effect of boiling toluene on fluorinated and PP/PE/ERP blend lanterns. Left: a fluorinated
lantern and a PP/PE/EPR lantern before treatment; Right: the lanterns after being subjected to boiling toluene
for five minutes then cooled. (source: author’s experiment).
The use of grafted fluoropolymers for application in solid phase synthesis is not
entirely new. Tregear reported the use of a grafted fluoropolymer,
poly(trifluorochloroethylene), as a support for SPPS in 1972, however he found that there
was no advantage over Merrifield resin for synthesis of a dodecapeptide, although he did
admit that the grafted support used had not been fully optimized.22 Recently, a different
approach was reported in preparing a stable solid support, again taking advantage of the
strength of the C–F bond but instead of grafting to a fluoropolymer, the fluorine was
contained in the backbone of Merrifield resin synthesized from fluorinated-styrene.23
Shortly after this project was conceived, Zhao and coworkers published work and
filed a patent application describing the use of grafted fluoropolymer tubes for use in a high ∗ Terwoort et al. claimed to have developed melt-processable PTFE made from blending high and low molecular weight PTFE,21 but this is not a commercial product.

Chapter 1 Introduction and Review of the Literature 8
temperature SPOC application.24,25 Their work is based on creating a rough surface (to
increase the surface area) on the fluoropolymer before grafting and is mainly concerned
with the application of the product and not the polymer chemistry behind the grafting
process.
While grafting to polyolefins using radiation grafting methods is well established,
grafting to fluoropolymers is less well understood. In the following sections, the
fluoropolymer used for this thesis is introduced and a literature review is presented on the
current state-of-the-art of grafting and analysis techniques.
1.4 The Fluoropolymer PFA
This project was carried out in collaboration with Mimotopes Pty Ltd with the aim of
developing a thermally-stable fluoropolymer-based solid support for SPOC.
The fluoropolymer which has been chosen for this project is
poly(tetrafluoroethylene-co-perfluoropropyl vinyl ether) (PFA)∗ (the structure is shown in
Figure 1.5). Invented by DuPont and commercialized 1971/2, PFA is a melt-processable
fluoropolymer copolymerized from tetrafluoroethylene (TFE) and perfluoropropyl vinyl
ether (PPVE) and has similar thermal and chemical properties to PTFE. The bulky
perfluoropropoxy side chains in PFA act to disrupt crystallinity of the polymer chains and
decrease the melt viscosity. The amount of comonomer incorporated into these resins is
typically only 1 – 2 mol. %. The low reactivity of PPVE means that statistically it is very
unlikely for the copolymer to contain adjacent PPVE units.20
CF2 CF2 CF2 CF
O
C3F7
n m
Figure 1.5 The structure of PFA.
∗ The origin of the name “PFA” is not immediately obvious from the full chemical name and is actually an acronym of Perfluoroalkoxy resin. Strictly speaking, the name “perfluoroalkoxy resin” can mean any perfluoropolymer with alkoxy side chains; however, to avoid confusion, in this thesis the term “PFA” will refer exclusively to the copolymer of tetrafluoroethylene and perfluoropropyl vinyl ether.

Chapter 1 Introduction and Review of the Literature 9
Much of the literature on the behavior of polymers when exposed to radiation was
published in the 1950s and 1960s when nuclear technology was first being developed.
Polymers such as PTFE received much attention, however as PFA was invented after the
peak in the interest in radiation behavior of polymers, it has received little attention in the
literature. In recent years radiation modification of fluoropolymers has gained in popularity
as methods for crosslinking and new techniques to analyze the polymers have become
available. Despite this, PFA is generally considered to be a specialized fluoropolymer, and
as such, has not been widely studied.
Chapter 1 Introduction and Review of the Literature 10
1.5 Literature Review of Grafting to Fluoropolymers
While there have been many reviews on the topic of grafting to polyolefins (for example
references [26-29] and the rather curiously titled review “Radiation-Induced Graft
Polymerization in the U.S.S.R.”30), the only recent review of grafting to fluoropolymers is
by Gupta and Scherer31 from 1994 and is mainly concerned with grafting to FEP (a
copolymer of tetrafluoroethylene and hexafluoropropylene) for use as proton exchange
membranes. In this literature review, a more up-to-date review is given covering the topic
of grafted fluoropolymers, including techniques for optimizing graft yields as well as some
of the modern techniques used to analyze graft copolymers. In the following section on
radiation- induced grafting there are instances where some non-fluoropolymer examples are
given in cases where literature on fluoropolymers is unavailable.
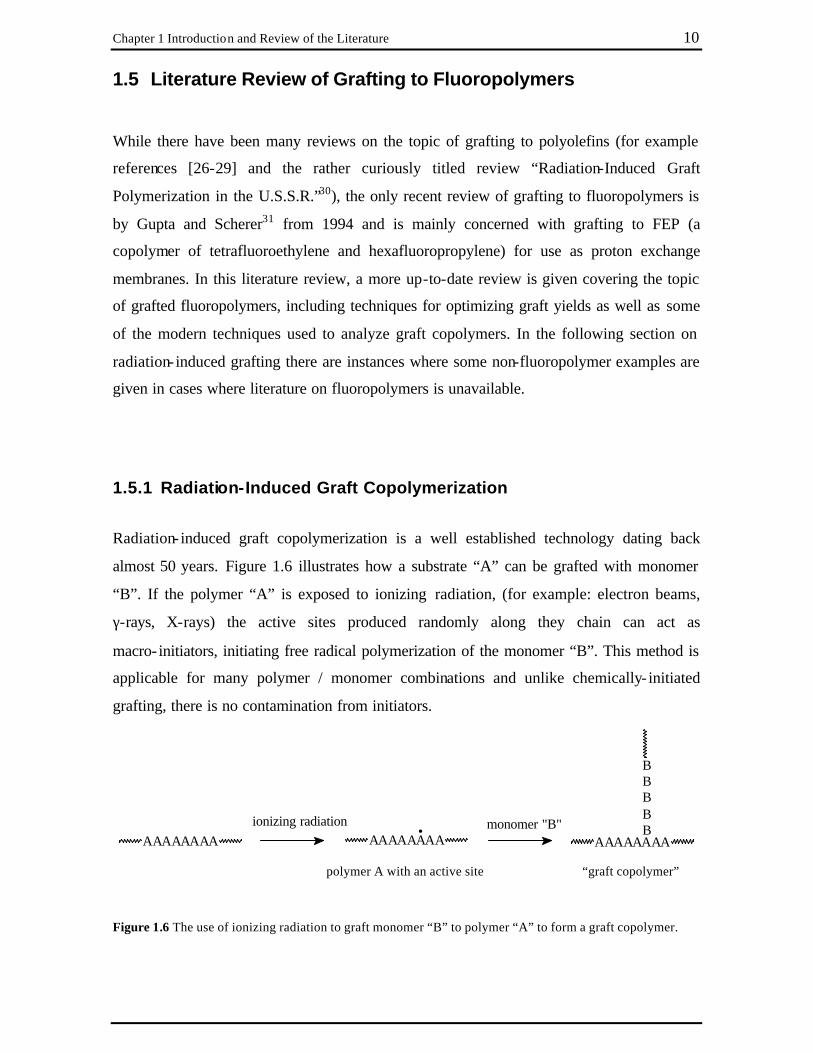
1.5.1 Radiation-Induced Graft Copolymerization
Radiation- induced graft copolymerization is a well established technology dating back
almost 50 years. Figure 1.6 illustrates how a substrate “A” can be grafted with monomer
“B”. If the polymer “A” is exposed to ionizing radiation, (for example: electron beams,
γ-rays, X-rays) the active sites produced randomly along they chain can act as
macro- initiators, initiating free radical polymerization of the monomer “B”. This method is
applicable for many polymer / monomer combinations and unlike chemically- initiated
grafting, there is no contamination from initiators.
AAAAAAAAionizing radiation
AAAAAAAA. monomer "B"
AAAAAAAA
BBBBB
polymer A with an active site “graft copolymer”
Figure 1.6 The use of ionizing radiation to graft monomer “B” to polymer “A” to form a graft copolymer.

Chapter 1 Introduction and Review of the Literature 11
The extent of polymerization of monomer B on substrate A is expressed in terms of
the graft yield which is also referred to as the degree of grafting. This value is simply the
mass of the graft polymer as a percentage of the mass of the original polymer substrate. For
example, a graft yield of 50 % means that the weight of the graft copolymer is 50 % greater
than that of the original substrate.
There are essentially three methods for radiation grafting:32
1. Simultaneous method – also sometimes called the mutual method. The polymer
substrate is immersed in the monomer, which may be a liquid, vapour or diluted
with solvent and may contain additives, then exposed to ionizing radiation. As
well as the formation of the graft polymer, homopolymer will invariably also be
formed as both the substrate and the monomer are exposed to radiation. Control
of homopolymer formation is discussed in Section 1.5.3.1.
2. Pre-irradiation method (post-irradiation grafting) – so called because the
polymer substrate is first exposed to ionizing radiation in vacuum or under an
inert atmosphere to generate radicals before being exposed to a monomer.
Homopolymer formation is less of a problem with this method since the
monomer is not actually exposed to the radiation.
3. Peroxy / hydroperoxy method – similar to the pre- irradiation method, only with
this method the polymer is exposed to ionizing radiation in the presence of air.
This produces either peroxy radicals or hydroperoxy groups on the polymer
substrate which, when heated in the presence of monomer, will decompose and
grafting may be initiated. While homopolymer formation is not as serious as
with the simultaneous method, there is still some homopolymer formation
initiated by the small fragments from the decomposition of the peroxy groups.
In addition, oxidative degradation of the polymer may occur during irradiation.
Each of these methods has its advantages and disadvantages. The pre-irradiation and
peroxy methods are convenient in that the polymer substrate can be irradiated and stored
for some time before the monomer is introduced. This is useful when access to a radiation
source is limited. The simultaneous method requires the use of the radiation source during

Chapter 1 Introduction and Review of the Literature 12
the entire grafting process, however graft yields are generally higher compared with the
pre-irradiation methods due to radical loss through decomposition reactions in the latter
method.33
1.5.2 Grafting to Fluoropolymers
The unique resistance of fluoropolymers to almost all chemicals has made them suitable for
many specialized applications.34 Despite their chemical stability, fluoropolymers are one of
the most sensitive polymers to radiation.35 This perceived weakness can be exploited to
favorably modify the properties of fluoropolymers by either radiation exposure alone, or by
radiation- initiated copolymerization.
The seminal works on radiation grafting to PTFE can be found in the 1959 and 1962
publications by Chapiro.36-38 Given that PTFE is inert to most chemicals and is insoluble in
all common solvents, it is quite remarkable that when grafting styrene or methyl
methacrylate to PTFE using low radiation dose rates, the films swell and grafting occurs
not just on the surface but also homogeneously throughout the film.36 This result is
explained by assuming that grafting occurs initially at the surface of the film then proceeds
gradually inwards as the grafting zone is swelled by the monomer. This mechanism is
known as the grafting front mechanism.
In the last 40 years many fluoropolymers have been developed and made
commercially available. The structures of some of these polymers are shown in Table 1.1,
each of which has been used as a graft substrate. The grafting front mechanism first
proposed by Chapiro has been proven to occur when grafting to PTFE and other
fluoropolymers using various analytical techniques, described later in Section 1.5.5 of this
chapter. As well as the numerous fluoropolymers used as graft substrates, many different
monomers and additives have been used.

Chapter 1 Introduction and Review of the Literature 13
Table 1.1 Some of the commercially available fluoropolymers.
Name Abbreviation Structure
Poly(tetrafluoroethylene) Poly(tetrafluoroethylene- co-hexafluoropropylene) Poly(ethylene- alt-tetrafluoroethylene) Poly(chlorotrifluoroethylene) Poly(vinylidene fluoride) Poly(tetrafluoroethylene- co-perfluoropropyl vinyl ether) Poly(vinylidene fluoride- co-hexafluoropropylene) Poly(vinyl fluoride)
PTFE
FEP
ETFE
PCTFE
PVDF
PFA
PVDF-co-HFP
PVF
CF2 CF2n
CF2 CF2 CF2 CF
CF3n m
CF2 CF2 CH2 CH2n m
CF2 CF
Cln
CH2 CF2n
CF2 CF2 CF2 CF
O
C3F7
n m
CF2 CH2 CF2 CF
CF3n m
CH2 CHFn
The motivating force behind much of the existing research into grafting to
fluoropolymers is the prospect of being able to produce an alternative to the very costly fuel
cell membrane Nafion® (Figure 1.7).31,39-41 By grafting styrene to a fluoropolymer
followed by sulfonation, membranes with similar ion-exchange and conductivity to

Chapter 1 Introduction and Review of the Literature 14
Nafion® have been synthesized. Grafted fluoropolymers have also been used as charged
ultrafiltration membranes,42 waste treatment membranes,43 and in biomedical
applications.44,45
CF2 CF2 CF CF2
O
CF2
CFCF3 CF2 CF2 SO3- Na+
n m
Figure 1.7 The structure of Nafion®.
In the following sections a review of the current literature is given, examining the
influence of various solvents, additives and types of fluoropolymers.
1.5.2.1 Influence of Solvent and Monomer Concentration
The addition of solvent to a monomer / substrate combination can enhance grafting and
determine the specific nature of the graft copolymer.46 The penetration of the graft into the
substrate is an important factor when preparing grafted surfaces for SPOC and is often
dependent on the solvent used and the monomer concentration.
It is common to observe a Trommsdorff phenomenon when grafting styrene to
polyolefins47 and cellulose.48 This phenomenon was first noticed when polymerizing bulk
methyl methacrylate using benzoyl peroxide in which the rate becomes explosively rapid at
approximately 20 – 25 % conversion.49 This is explained by the restricted diffusion of the
growing molecular chains, which hinders termination by combination with other growing
chains, but does not appreciably disturb diffusion of the monomer. When the
polymerization is carried out in a solvent, the explosive rate increase is not observed,
however, when a non-solvent for poly(methyl methacrylate) is used the rate increase is
even more rapid than the bulk polymerization and there is a higher degree of
polymerization.

Chapter 1 Introduction and Review of the Literature 15
The Trommsdorff effect has also been observed in grafting reactions as illustrated in
Figure 1.8. This figure shows the graft yield versus styrene concentration in methanol for
grafting to pre- irradiated poly(propylene) fabric. The plot can be split into two regions. In
region 1 the rates of propagation and initiation increase with increasing monomer
concentration. Since methanol is a non-solvent for PS, the growing chains became
sufficiently immobilized so that termination by combination was inhibited. In Figure 1.8
this effect reaches a maximum at approximately 22 % styrene concentration. At styrene
concentrations above the maximum (region 2) the styrene swelled the matrix, increasing
mobility and termination was greatly enhanced, lowering the graft yield.50-52
Figure 1.8 Observation of a Trommsdorff effect when grafting styrene to poly(propylene) fabric. Data taken
from Nho et al.50
Maxima in the graft yield with variation in the monomer concentration have been
observed when grafting styrene to PTFE,53 FEP,54 and PFA,55 although in these cases
dichloromethane was used as a solvent and the greatest graft yield and rates occurred at
approximately 60 % styrene concentration. Since dichloromethane is a good solvent for PS,
the observed maxima cannot be due to a real Trommsdorff effect. Instead, the behavior has
been attributed to an increase in the styrene diffusion and hence concentration in the
grafting region, which reached a maximum at approximately 60 % styrene concentration.
Above this concentration there was significant homopolymer formation, resulting in
hindered monomer diffusion to the grafting region and so lower graft yield.55 This
explanation is a little spurious as it is unlikely that the diffusion of styrene would be
hindered enough to prevent propagation unless a glassy state was reached, and if the

Chapter 1 Introduction and Review of the Literature 16
viscosity was high enough to prevent styrene diffusion, then termination would also be
expected to be hindered due to limited mobility of the growing chains. Similar results were
observed when grafting styrene in methanol to ETFE using the pre-irradiation method.56 In
this case the maximum was attributed to an increase in viscosity in the grafted layers at
high monomer concentration leading to lower diffusion of monomer to the interiors of the
films, and hence less grafting.
The same behavior is generally not observed when grafting hydrophilic monomers
to fluoropolymers in aqueous or methanolic / aqueous media. Grafting of methacrylic
acid,57-59 acrylic acid (AAc)57,60-64 and vinyl acetate65 to fluoropolymers led to a logarithmic
relationship between monomer concentration (typically less than 70 %) and the rate of
grafting which increased with increasing monomer concentration. Hegazy et al.61 explained
that since poly(acrylic acid) is insoluble in its monomer, the mobility of growing chains
decreases with increasing monomer concentration. An exception is the grafting of
N-vinyl-2-pyrrolidone to PFA using water as the solvent, where a maximum was observed
at 50 % v/v monomer concentration.66
When a good solvent for PS was used, such as benzene, to graft styrene to FEP at
333 K, there was an almost linear relationship between the final graft yield and monomer
concentration.31 With increasing monomer concentration, diffusion also increased as did the
final graft yield.
The penetration rate of the graft front is dependent on the monomer concentration.
In preparation of membranes of FEP-g-poly(acrylic acid)67 and PTFE-g-poly(acrylic acid)68
the penetration rate of the graft was low at high acrylic acid concentration in water, while
the converse was true at low acrylic acid concentration. This means that grafting throughout
the film could be achieved at lower graft yield if the monomer concentration is low.67 This
is especially important for membranes used as ion exchange devices, as complete
penetration of the substrate by the graft is required for transport of the ions.
Chapter 1 Introduction and Review of the Literature 17
1.5.3 The Use of Additives for Grafting
Generally the graft yield increases with radiation dose for both the simultaneous and
pre-irradiation methods – the more radicals produced on the polymer substrate, the more
initiation reactions occur, leading to greater amounts of graft. The use of additives can also
increase the graft yield so that a particular level of grafting can be reached using a lower
total radiation dose. This is of particular interest in cases where the polymer substrate is
detrimentally affected by radiation. Lower radiation doses may also decrease the likelihood
of crosslinking of the newly-grafted layer, which may be undesirable in some applications.
In 1979 Garnett published a comprehensive review on the role of additives when
grafting to poly(ethylene), poly(propylene) and cellulose.26 Since then some of the theories
covering the mechanism in which the additives work have been revised. In the following
two sections the literature covering the use of additives to control homopolymerization and
to enhance grafting is explored with an emphasis on grafting to fluoropolymers.
1.5.3.1 Additives Used to Control Homopolymerization
As mentioned in Section 1.5.1, the formation of homopolymer can often be detrimental to
the grafting reactions, and in many cases the homopolymer can be formed more rapidly
than the graft. Homopolymer formation can be predicted from the radical yields (G(R)) of
the monomer and polymer substrate. By definition, G(R) is the number of radicals formed
for 16 aJ (or 100 eV) of absorbed energy. The larger the G(R) of the monomer compared
with that for the polymer substrate, the greater the problem of homopolymer formation.69 In
an ideal case, G(R) for the polymer substrate would be much larger than that of the
monomer. Disregarding other factors, this would mean that graft polymerization would be
favoured over homopolymerization.
Excessive homopolymer formation may result in a decrease in the graft yield due to
increased viscosity, which limits the accessibility of monomer to the polymer substrate.
Excessive homopolymer formation can also add to the cost of the grafting process, as the
ungrafted polymer is essentially a waste product, and removal of the homopolymer
occluded to the grafted layer may require scrupulous washing routines.

Chapter 1 Introduction and Review of the Literature 18
Metal salts are commonly used to suppress homopolymerization during grafting
reactions, and are almost universal in their application. Ammonium ferrous sulphate
(Mohr’s salt), ferric chloride and copper chloride have been demonstrated to suppress
homopolymer formation in the preparation of grafted fluoropolymers such as PFA-g-
poly(acrylic acid),57 PFA-g-poly(methacrylic acid),57,58 and FEP-g-poly(acrylic acid).70
Typically, the concentration of the metal salt needed to suppress
homopolymerization is less than 1 wt %. The suppression of homopolymerization by metal
salts is thought to occur by a redox reaction, where the metal cations terminate growing
chains.71 While the formation of both homopolymer and graft are suppressed by metal salts,
the homopolymer is suppressed to a greater extent, allowing for reasonable graft yields with
little homopolymer formation. For grafted Nylon it is thought that the swollen substrate
forms a viscous barrier hindering diffusion of the cations to the growing graft chains.71
Since fluoropolymers do not swell appreciably in grafting solutions presumably the swollen
grafted layer acts as the barrier to the cations.
When fluoropolymers are irradiated in air, the carbon-centred radicals reversibly
react with oxygen to form peroxy radicals (Scheme 1.1). The peroxy radicals may then
react with small polymer fragments, P' (Scheme 1.2).72 This differs from hydrogenated
systems where chain peroxidation occurs – the POO• radical can abstract a tertiary
hydrogen from the polymer chain to form POOH and so form another P• radical which can
further react with oxygen.73,74 Bozzi and Chapiro used Mohr’s salt to suppress
homopolymerization when grafting acrylic acid to FEP pre- irradiated in air.70 These
workers postulated that P'O• radicals initiated homopolymerization. The effect of the
Mohr’s salt is to convert the diperoxides, POOP', to P'O- and PO• (Scheme 1.3) and PO2• to
PO• and O- (Scheme 1.4). They also proposed that when grafting to polymers which contain
hydrogen, the homopolymer initiating species is •OH which is converted to OH- by Fe2+
(Scheme 1.5).
γ-radiation
P ? P•
P• + O2 POO•
Scheme 1.1 Reaction of oxygen with a carbon-centred radical on a polymer.

Chapter 1 Introduction and Review of the Literature 19
POO• + P' ? POOP'
Scheme 1.2 Reaction of a peroxy radical with a small polymer fragment P'.
POOP' + Fe2+ ? PO• + P'O- + Fe3+
Scheme 1.3 Decomposition of a diperoxide by Mohr’s salt.
PO2• + Fe2+ ? PO• + O- + Fe3+
Scheme 1.4 Decomposition of a peroxy radical by Mohr’s salt.
•OH + Fe2+ ? OH- + Fe3+
Scheme 1.5 Conversion of a hydroxy radical to a hydroxy ion using Mohr’s salt.
The concentration of the metal salt additive used will affect the graft yield and an
optimum concentration must therefore be chosen. If the metal salt concentration is too low
homopolymerization will not be completely inhibited, if it is too high the grafting reaction
will be suppressed.59
1.5.3.2 Acids Used to Enhance Grafting
The use of mineral acids as additives has been studied extensively for the grafting of
vinylic monomers to poly(ethylene),47,75-78 poly(propylene),47,79 and cellulose.76-80 An
illustration of the enhancing effect of acid in grafting solutions is shown in Figure 1.9.47
The effect of the inclusion of acid is most pronounced at the Trommsdorff peak, while the
effect is lower at concentrations of monomer above and below this point. At some
concentrations the acid has no enhancing effect. In cases where there is no Trommsdorff
effect in the acid-free solution the addition of acid can actually induce one.47,80

Chapter 1 Introduction and Review of the Literature 20
Figure 1.9 Acid effect for radiation-induced grafting of styrene in methanol to poly(propylene). Dose rate:
0.4 kGy hr-1, the total dose was 2 kGy. (-ο-) no acid; (-•-) 0.05 M H2SO4. Data taken from reference [47].
The use of acids as additives when grafting to fluoropolymers has received
relatively little attention in the literature compared to the acid effect when grafting to
polyolefins. Dworjanyn et al. reported a slight but definite increase in graft yield on
addition of an unspecified acid when grafting a mixture of styrene and 2-hydroxyethyl
methacrylate (HEMA) in methanol to PTFE using the simultaneous method.76 In contrast,
Nasef found almost no effect on the graft yield upon addition of a series of mineral and
organic acids to styrene dissolved in methanol, benzene or dichloromethane when grafting
to PTFE, FEP and PFA, also using the simultaneous method.81
The mechanism of acid enhancement when grafting to polyolefins and cellulose was
initially understood to be a purely radiolytic phenomenon where the irradiation of the
solvent increased the hydrogen atom yield (G(H)) (Scheme 1.6).26,47,77,80 The hydrogen
radicals can abstract hydrogen atoms from the polymer substrate creating additional sites
for initiation of grafting.26,47
H+ + e ? H•
Scheme 1.6 Conversion of a charged proton to a radical.
Chapter 1 Introduction and Review of the Literature 21
As was later revealed, there were some discrepancies with this theory alone.75,77,78 It
was found that acid could have an enhancing effect in situations where there could not
possibly be an increase in the yield of hydrogen radicals. The basis for the doubt over this
theory was:
1) when ultraviolet light was used as the initiating source acid also had an
enhancing effect77
2) other neutral inorganic salts had the same effect as acid77,78
3) enhancement was also seen when the pre- irradiation grafting method was
used77,78
4) enhancement was only seen at certain monomer concentrations78
In addition, Chappas and Silverman found that when grafting styrene to
poly(ethylene), the acid had little effect on the grafting rate below 100 % graft yield.75 If
the effect was due to hydrogen radicals abstracting hydrogen from the polymer substrate
and so forming new initiating centres, then it would be expected that the acid would have
an effect at all degrees of grafting.
These acid-enhancing phenomena were eventua lly attributed to a partitioning or
“salting-out” effect of the additives. In a grafting system this partitioning increases the rate
of diffusion of the monomer, as well as the equilibrium concentration of the monomer
within the polymer substrate. The increased monomer supply results in enhanced grafting
rates.
The enhancement works best when grafting non-polar monomers to non-polar
substrates with methanol as the solvent.77 The greater polarity of methanol containing the
dissolved electrolyte favours the partitioning of the non-polar styrene into the substrate.
Conversely, a polar monomer would not be “salted-out”, and the same increase in diffusion
of the monomer to the grafting sites would not occur.
Considering the success of the partitioning theory by Garnett and coworkers, it is
curious that such a small amount of work has been reported on the effect of acid when
grafting onto fluoropolymers.

Chapter 1 Introduction and Review of the Literature 22
The use of more than one additive can also be useful in grafting reactions. The
addition of an acid and a metal salt can have a dramatic affect on the grafting to
fluoropolymers and polyolefins when the pre- irradiation peroxy method is used. Gupta and
Chapiro were able to double the graft yield across a large monomer concentration range
when grafting acrylic acid to pre- irradiated FEP by the addition of acid to a solution
containing Mohr’s salt.63 This synergistic effect in the case of grafting to polyolefins is
assumed to be due to an accelerated decomposition of the hydroperoxy group in the
presence of Fe2+ and H2SO4 (Scheme 1.7), followed by conversion of OH- to H2O by the
acid.82
POOH + Fe 2+ ? PO• + Fe3+ + OH-
Scheme 1.7 Decomposition of a hydroperoxy group Mohr’s salt.
1.5.3.3 Crosslinking Agents as Additives
Grafting using the simultaneous grafting method may result in a certain degree of
crosslinking of the grafted polymer due to the incidental exposure of the graft to radiation,
causing abstraction and crosslinking. In extreme cases, at high doses using the simultaneous
method, degradation of the graft can occur resulting in a decrease in the amount of grafted
polymer.83,84 The G value for crosslinking of PS is relatively low (0.1),85 so when grafting
styrene to a substrate, addition of a crosslinking agent is a useful way to artificially increase
this value.
Polyfunctional crosslinking agents (for example see Figure 1.10) have been shown
to either enhance or lower the graft yield depending on the concentration in which they are
used. When a high concentration (10 % v/v) of divinylbenzene (DVB) or triallyl cyanurate
(TAC) was added to styrene when grafting to FEP using the pre- irradiation peroxy method
the graft yield increased with grafting time until it reached a plateau. This final graft yield
decreased in the order: no additive > TAC > DVB.86 Similar results have been reported
using the pre- irradiation method where the crosslinking of PS grafted to FEP using DVB
(20 % v/v) in benzene led to lower final graft yield compared to the system without any
crosslinking agent.87 Grafting of styrene in methanol to ETFE using the pre- irradiation

Chapter 1 Introduction and Review of the Literature 23
peroxy method showed an increase in the final graft yield at low concentrations of DVB,
while at higher concentrations the final graft yield dropped.56 Grafting of styrene to
poly(ethylene) with the addition of a small amount of either DVB or trimethylolpropane
triacylate (TMPTA) was found to enhance grafting, while when grafting to
poly(propylene), addition of DVB had the effect of shifting the Trommsdorff peak to a
higher monomer concentration.88,89
N N
N OO
O
Divinyl benzene Triallyl cyanurate
O
O
3
Trimethylolpropane triacylate
Figure 1.10 The structure of several crosslinking agents used in grafting reactions.
The enhancing effect of crosslinking agents at low concentration can be attributed to
enhanced branching reactions. When one end of the DVB is immobilized through reaction
with a growing PS chain the other vinyl group of the DVB molecules is capable of
initiating a new chain through scavenging reactions.89 At higher concentration of the
crosslinking agent there is a significant increase in network formation, which leads to
suppression in the swelling of the graft and an increase in viscosity in the surrounding
solution, which lowers the diffusion and availability of monomer, leading to lower graft
yields. In addition, if the diffusion of monomer to the radicals within the substrate is
hindered, there may be decay of the substrate radicals without contribution to the graft
reaction.56,87

Chapter 1 Introduction and Review of the Literature 24
1.5.4 Effect of Fluoropolymer Substrate
The number of commercial fluoropolymers available has expanded greatly since the first
fluoropolymers, PCTFE and PTFE were introduced to the market. A wide variety of
fluoropolymers are now available with a range of melt viscosities and crystallinities, and
there is greater control over the end groups.90 In this section the literature examining the
influence of different fluoropolymer substrates on grafting reactions is presented.
Walsby et al. used electron beam irradiation to graft styrene to a range of
fluoropolymers and compared the graft yields.40 The fluoropolymers examined included
partially-fluorinated polymers PVF, PVDF, ETFE and PVDF-co-HPF (one with 6 % and
one with 15 % HPF content), and fully-fluorinated polymers PTFE and FEP. The graft
yields ranged from 5 % for PTFE to 76 % for PVF. These workers sited a number of
probable influences on the graft yield such as: different radical concentrations produced by
irradiation, different structures of the radical centres, variations in crystallinity and glass
transition temperature (Tg) of the polymers, and styrene uptake. While they did not measure
the first two variables mentioned, they did measure the crystallinity and Tg of each polymer
as well as the styrene uptake. In most cases they found reasonable agreement between the
styrene uptake of the untreated polymer and the graft yield. This is not surprising as any
increase in swelling of the grafting front would facilitate monomer penetration into the bulk
of the film. The two PVDF-co-HPF polymers were obvious exceptions to this rule. The
copolymer with 15 % HPF content had higher styrene uptake than the copolymer with 6 %
HPF, however, the graft yield of the former was lower. They attributed this observation to
variation in crystallinity between the two copolymers. The effect of the HPF is to disrupt
the crystalline packing, hence higher HPF content leads to higher amorphous content.91
Since the grafting reactions were performed above the Tg of these polymers, the chains in
the amorphous regions had a high degree of mobility which favoured the termination of
growing PS graft. The low graft yields found for FEP and PTFE were attributed to the low
measured crystallinity of 15 % and 14 %, respectively. However it seems quite remarkable
that the PTFE used had such low crystallinity considering it is a linear polymer and is
generally considered to be highly crystalline.20 It is of interest to note that the two fully
fluorinated polymers studied, PTFE and FEP, showed the two lowest graft yields compared
with the partially hydrogenated polymers.

Chapter 1 Introduction and Review of the Literature 25
Grafting of styrene to FEP, PVDF and ETFE with crystallinity of 17 %, 41 % and
30-37 %, respectively, has been reported using the peroxy method.92 The crystallinity of the
PVDF samples were similar to that in other reports, however the crystallinity of the ETFE
samples was significantly higher than in other reports.40 In agreement with other reported
work the graft yields for PVDF and ETFE were higher than for FEP.40 It was suggested that
because of the higher crystallinity of the PVDF and ETFE, they should have lower graft
yields compared with FEP, but the opposite was found. The result was attributed to greater
monomer transport and higher radical yields for the two partially fluorinated polymers
compared with FEP. This result is in contrast to that of Sakurai et al.93 who showed that
PTFE with crystallinity of 62 % and 67 % gave higher graft yields than PTFE with
crystallinity of 96 %. In each case the radical yield determined by ESR was the same,
regardless of crystallinity. They used a grafting temperature of 273 K, which is below the
Tg of PTFE. The monomer used, MMA, was able to diffuse into the amorphous regions,
whereas it could not diffuse into the crystallites. In totally-amorphous fluoropolymers, such
as the copolymer of tetrafluoroethylene and perfluoromethylvinyl ether, grafting was
unsuccessful,94 presumably due to the lack of stable radicals at the grafting temperature
used.
The effect of grafting temperature on the graft yields was reported by Gupta and
Chapiro.63 They found that at grafting temperatures below 313 K, grafting occurred more
rapidly in FEP than in poly(ethylene), whereas above 313 K the rates were similar.
Chapter 1 Introduction and Review of the Literature 26
1.5.5 Characterization Techniques
Once a grafting reaction is complete it is important to know the answers to several
fundamental questions: has the grafting reaction worked; where on the substrate has the
graft formed; and what is the nature of the graft? For soluble graft copolymers an
assortment of techniques may be used to analyze the products, however, when grafting to
insoluble fluoropolymers, the analysis is somewhat restricted to solid-state methods. The
success of a grafting reaction is commonly measured by either the mass increase following
thorough washing to remove any non-covalently bonded homopolymer, or by FTIR to
identify the new absorption bands of the grafted polymer. To obtain answers to the other
questions of “where has the grafting reaction occurred? and, what is the nature of the
graft?” is less straightforward. Following is a review of recently-reported techniques for
analyzing grafted fluoropolymers and the information that they provide.
1.5.5.1 Nuclear Magnetic Resonance Spectroscopy
While it is generally accepted that a covalent bond is formed between a graft polymer and
the macromolecular substrate (e.g. a polyolefin), this graft point cannot be observed
directly by nuclear magnetic resonance (NMR) spectroscopy due to the low concentration
of these points.95 Literature on the characterization of grafted fluoropolymers by NMR
spectroscopy is scarce due to the relatively low sensitivity of this technique and the limited
information gained. Still, there are several recent additions to the literature which use this
technique to analyze fluorinated graft copolymers.
Solid-state broadline 1H NMR has been used by Sakurai et al. to locate the position
and rotational motion of radiation- induced grafted PTFE-g-poly(methyl methacrylate)
(PTFE-g-PMMA).96 The solid-state 1H NMR spectrum of fully-protonated PMMA grafted
to PTFE was broad and featureless. By using partially-deuterated methyl methacrylate (d5,
with only the OCH3 undeuterated) as the monomer they were able to greatly narrow the
linewidth of the 1H NMR spectra, so the peaks could be resolved into Gaussian and
Lorentzian components. These components were assigned by comparison with a graft
prepared using a mixture of 100 : 1 d8 and d5 methyl methacrylate, enabling them to
essentially ‘dilute’ the OCH3 groups of the graft. The spectrum of this sample contained

Chapter 1 Introduction and Review of the Literature 27
only a Lorentzian component and was assigned to OCH3 groups in an isolated environment,
and as a corollary, the Gaussian component was assigned to aggregated local structures
where the OCH3 groups can magnetically interact. With increasing graft yield in the range
1 – 7 % wt the Lorentzian / Gaussian ratio decreased.
Measurement of the second moments, <∆H2>, of the Lorentzian and Gaussian
components gave some information regarding the rotational motion of the CH3 groups of
the PMMA. It was found that the diffusion of the CH3 group attached to the ester of grafted
PMMA was lower than that of the CH3 groups in bulk PMMA, indicating there was a
stronger interaction between the PTFE and PMMA chains than between the PMMA chains.
Hietala et al. used solid-state 13C cross-polarization magic angle spinning
(CP MAS) NMR to measure the miscibility and local heterogeneity of PVDF-g-PS
membranes.97 PVDF is a semicrystalline fluoropolymer made up of alternating CF2 and
CH2 groups. Graft yields of 18 – 73 % were achieved using the post-irradiation method in a
styrene / toluene solution.
The size of the phase-separated structures was measured using proton spin- lattice
relaxation (T1H) and proton spin- lattice relaxation in the rotating frame (T1ρH)
measurements for the PS and PVDF components. Spin relaxation experiments showed that
the T1H relaxation time was the same for the two components regardless of the grafting ratio
or measurement temperature, suggesting the homogeneity was on a tens of nanometers
scale. Conversely, the T1ρH relaxation measurements showed that while there was no
difference for the samples with different graft yields, the T1ρH was longer for PVDF than
for PS when measured at high temperature. This result suggested the phase-separated
domains were larger than a few nanometers. Incorporating these two observations they
concluded that the phase-separated domains were between a few nanometers and some tens
of nanometers in size. A two-dimensional wide- line separation (WISE) experiment showed
that the mobility of the amorphous phase of the PVDF was greater than the corresponding
phase in PS, which can be attributed to the much higher Tg of PS compared with PVDF
(173 K and 313 K, respectively).

Chapter 1 Introduction and Review of the Literature 28
1.5.5.2 Graft Molecular Weight by Size-Exclusion Chromatography
The molecular weight and molecular weight distribution of the graft polymer is of great
interest, as it can be pivotal in determining the properties and performance of the graft
copolymer. The most accurate way to measure the molecular weight of the graft is by
cleaving it from the polymer substrate, then use size-exclusion chromatography (SEC) to
measure the molecular weight distribution. This method is only possible in cases when the
graft point can be selectively cleaved. Garnett et al.77 grafted PS to cellulose using
γ-radiation then cleaved the PS graft by acid hydrolysis and measured the number average
molecular weight (Mn) by SEC. They observed reasonable agreement in the Mn between the
cleaved graft and the homopolymer formed, suggesting that the rates of propagation of the
graft polymer and polymer in the bulk were similar.
Miwa et al.98 grafted nitroxide-mediated PS to poly(propylene) using the peroxy
method and in doing so introduced an ether bond at the graft point. A small portion of the
graft was cleaved by soaking the graft copolymer in trifluoroacetic acid for several days.
Comparison of the Mn and polydispersity of the homopolymer formed during grafting with
the cleaved PS showed the values were almost the same. No attempt was made to explain
why only a small percent of the PS graft could be cleaved.
In many applications the graft copolymer must be resistant to strong acids, therefore
any cleavable graft points are undesirable. Molecular weight determination of the graft has
been reported by dissolving the grafted polymer and substrate followed by analysis by SEC.
While this technique is clearly not possible when the base polymer is an insoluble
fluoropolymer, it has been done for partially fluorinated, soluble polymers.
Ducouret et al. graft copolymerized styrene to thin (25 µm)
poly(vinylidene fluoride) (PVDF) films using the pre-irradiation peroxy method with swift
heavy ions, then analyzed the soluble component of the copolymer using SEC.99 PVDF is
one of the few soluble fluoropolymers and will dissolve in solvents such as DMF owing to
its dipolar nature from the tendency of the Fs and Hs to align themselves on opposite sides
of the carbon backbone.20 SEC of the grafted copolymer showed that the molecular weight
of the PVDF was significantly lower than the grafted PS at high graft yields. The effect of
the pre- irradiation dose was also examined. With increasing dose the Mn decreased, which

Chapter 1 Introduction and Review of the Literature 29
suggested that with more radicals produced in the substrate, the shorter the graft chains. At
high dose there was also an increase in the insoluble component, presumably due to
crosslinking.
Aymes-Chodur et al. also used the pre- irradiation peroxy method with γ- irradiation
as the ionizing source to graft styrene to PVDF-co-HFP, then analyzed the resulting graft
polymer by SEC.100 Again the molecular weight of the PS graft was significantly higher
than the polymer substrate. The graft yield increased with grafting time, accompanied by an
increase in graft chain length which was rapid at first then reached a plateau. Conversely,
Safranji et al. used the simultaneous radiation grafting method to graft
methyl-a,ß,ß-trifluoroacrylate to poly(tetrafluoroethylene-propylene) and found that at low
doses there was a slow increase in graft yield.84 Crosslinking of the grafts exposed to higher
doses prevented ana lysis due to solubility problems.
1.5.5.3 X-ray Photoelectron Spectroscopy
Surface characterization of polymers is commonly achieved using X-ray photoelectron
spectroscopy (XPS). This technique allows quantitative determination of surface chemical
composition and chemical bonding on the surface inferred by the shift in the
electron-binding energies of the surface elements. It also provides information about the
surface chemical structure with a spatial resolution of a few millimeters and a depth
resolution of approximately 5 nm, depending on the take-off angle.101
When XPS was used to study the surface of radiation-grafted PTFE-g-PS102 and
PFA-g-PS103 films, an increase in the C1s peak and a decrease in the F1s peak was
observed as the amount of styrene increased with increasing grafting. When PTFE-g-PS
films were analysed, a C–CF component of the C1s peak was identified which was
attributed to graft occurring with the loss of fluorine, and although there was no shift in the
F1s binding energy, there was a decrease in the peak intensity with increasing graft.102 XPS
of the PFA-g-PS films before grafting identified perfluoroalkoxy side chains of the
perfluoropropylvinyl ether (PPVE) groups partially masked by some oxygen
contamination.103 A larger than predicted F/C ratio for the structure suggested that there
Chapter 1 Introduction and Review of the Literature 30
was more fluorine at the surface. The peaks due to CF3 and CF groups representing the side
chain were lost when the film was grafted with PS.
XPS has also been used to examine the distribution of graft on a PTFE film. Inagaki
et al. treated PTFE with plasma then exposed it to air to introduce peroxy radicals to the
surface.104 The peroxy groups were then decomposed by heating and the resulting radicals
reacted with sodium vinyl sulfonate to form a graft layer. The existence of CF2 in the XPS
spectrum of the grafted PTFE led them to propose that either the graft layer was thinner
than the sampling depth or the graft gave incomplete coverage. The average thickness of
the graft was calculated based on the graft yield and found to be thicker than the sampling
depth, thus they concluded that the graft polymer was aggregated in patches on the surface.
This aggregation may have occurred after the grafting solvent was removed.
It is also possible to vary the XPS sampling depth by changing the take-off angle.
Sakurai et al. grafted methyl methacrylate to PTFE samples varying in crystallinity using
the post- irradiation method.93 Using angular-resolved XPS with take-off angles from
5° to 70° a depth somewhere between 45 to 80 Å below the surface was probed.
Calculation of the exact probe depth was difficult owing to the different densities of PTFE
and PMMA. At low take-off angles they found that the PMMA signal was larger than the
CF2 peak of the PTFE, and vice versa at large take-off angles, for highly crystalline (96 %)
PTFE. For PTFE with lower crystallinity (62 %) the grafting occurred more uniformly
which was attributed to grafting in the amorphous regions.
XPS analysis of plasma-initiated grafting of acrylamide to PTFE showed that there
was migration of the polar graft below the surface because of surface restructuring,
resulting in a thin fluorinated surface layer 2-3 nm thick.105 Similar results have been
reported for the grafting of acrylamide, acrylic acid, N,N-dimethylaminoethyl methacrylate
or a salt of 4-styrenesulfonic acid onto hydrocarbon films.106,107

Chapter 1 Introduction and Review of the Literature 31
1.5.5.4 Microprobe Raman and FTIR-ATR Spectroscopy
The distribution of the graft on or into the substrate is important in many applications. Ion
exchange membranes used in fuel cells need to be conducting and require homogeneous
bulk grafting of the substrate,41,64,108 while for SPOC, accessible surface grafting is vital for
the performance of the copolymer.
Raman spectroscopy, despite being first discovered in 1928 by C.V. Raman and
almost simultaneously by G. Landsbery and L. Mandelstam, only gained popularity years
later with the introduction of intense laser sources in the 1960s and then the development of
bench-top Raman spectrometers. The Raman microprobe uses an optical microscope
coupled to a Raman spectrometer enabling the laser to be focused on a small spot, followed
by collection of the scattered light from the illuminated region. Typically the sample spot is
in the order of 2 µm.
The homogeneity of PS-grafted PVDF has been measured using microprobe
Raman, both on the surface and by cutting a cross-section and recording depth-profile
spectra.109 At low grafting the PS distribution was heterogeneous on the surface and
decreased in concentration into the polymer substrate, however at high grafting the surface
became homogenous, at least within the resolution of the microprobe Raman. Sulfonation
of the PS graft and cross-section map using microprobe Raman showed that the sulfonation
reaction was not 100 % efficient at low graft yields, due to the poor swelling of the
hydrophobic PVDF polymer. At high graft yields the graft copolymer became easier to
swell in the sulfonation reaction solvent and more complete derivatization occurred. This
result revealed that it is not correct to assume that the derivatization of a graft is
independent of the graft yield.
Extensive microprobe Raman mapping of a plasma-initiated grafted surface of
styrene to a blend of poly(propylene), poly(ethylene) and ethylene-propylene rubber (EPR)
has been recently reported.110 A 50 × 50 µm section of the polymer was mapped using
resolution of 1 µm before plasma treatment, after plasma treatment and after grafting. From
the respective Raman absorption peaks, the concentration and crystallinity of the EPR and
the concentration of the PS were mapped. A clear correlation was found between low
crystallinity and EPR concentration and also between EPR concentration and high PS graft.

Chapter 1 Introduction and Review of the Literature 32
It was concluded that the plasma must introduce a high concentration of reactive species on
the EPR particles which are capable of initiating grafting.
FTIR-attenuated total reflectance (ATR) spectroscopy can also be used to perform
depth profiles of grafted samples. By varying the angle of incidence, the penetration depth
of the evanescent wave changes. Using two types of internal reflection crystals and three
angles of incidence, Rouilly et al. measured the PS distribution in FEP grafted films. Again
homogeneous grafting was found at high graft yields.41
Guilmeau et al. used FTIR-ATR to determine the surface graft yields and
transmission FTIR to determine the bulk graft yields for ETFE-g-PS films based on
characteristic absorption bands of each component.111 The penetration depth of the
evanescent wave in the ATR experiment was about 3 µm compared with a total film
thickness of 30 µm. Comparison of the surface graft yields determined by FTIR-ATR with
the volume graft yields by FTIR in transmission mode showed that initially the values were
similar, however after longer grafting time the graft yield below the surface exceeded that
at the surface. They concluded that the grafting was not diffusion controlled in 30 µm films,
although similar measurements for 100 µm films showed that the rate of grafting did
depend on the diffusion of monomer.
1.5.5.5 Scanning Electron Microscopy and X-ray Analysis
Like Microprobe Raman and FTIR-ATR Spectroscopy (section 1.5.5.4), scanning electron
microscopy (SEM) and X-ray analysis can give information on the distribution of the graft.
SEM can be used to view the graft copolymer on a nanometer scale, while elemental
analysis can be performed by coupling the SEM to an X-ray spectrometer. The principle of
X-ray analysis involves segmenting the X-ray energies dissipated when an electron beam
impinges upon a sample into characteristic energies for the elements. In this section a
review is given of how scanning electron microscopy and X-ray analysis have been used to
analyze fluorinated graft copolymers.

Chapter 1 Introduction and Review of the Literature 33
X-ray microscopy has been used to examine the cross-sections of PTFE,68 FEP,67
and PFA108 films grafted with acrylic acid. The X-ray micrograph showed the grafted and
non-grafted areas of the cross-section, and hence the penetration depth of the graft can be
obtained. At a low graft yield, the poly(acrylic acid ) was limited to the surface, but at a
higher graft yield it penetrated the entire film. This confirmed the grafting-front mechanism
mentioned in Section 1.5.2 where grafting begins at the surface and proceeds into the centre
of the films with progressive diffusion. X-ray microscopy has also been used to gain
information about the effect of the monomer concentration on the graft penetration. At low
monomer concentration homogeneous grafting throughout the entire film was achieved at a
lower total graft yield, while the converse was true at high monomer concentration.67
Measurement of the fluorine distribution in cross-sections of grafted fluoropolymer
films using SEM coupled to an X-ray analyzer can also be used to measure the graft
distribution. Walsby et al. used this technique to examine the effects of toluene and
n-propanol when used as solvents in the grafting of styrene to PVDF.112 Again the grafting-
front mechanism was evident from the surface grafting. When toluene was used as the
diluent for styrene the penetration depth was greater and the graft was more homogeneous
than when n-propanol was used where graft was essentially at the edges of the film. SEM
analysis of the surfaces of the same grafted films gave some insight into the surface
topology. Using toluene, the grafting did not change the surface topology and some of the
original surface features of the ungrafted material were visible. When n-propanol was used,
the surface was very rough and contained large PS domains with cavities up to 10 µm in
size. The same observations were made for bulk styrene grafting as for the n-propanol case,
however there were no cavities. Elemental analysis of the surface showed that there was
some fluorine present, suggesting that the surface graft was not pure PS, but included some
of the fluoropolymer substrate as well.
SEM has also been used to identify differences between grafting to PVDF and the
less crystalline copolymer, PVDF-co-HFP.113 Crystalline domains represented by 1 µm
spherulites were identified on the surface of the PVDF virgin polymer. At low
concentration of PS graft, small islands of PS could be seen on the surface correlating with
the presence of the spherulites. It appeared that the grafting was being initiated by the
crystalline zones. Virgin PVDF-co-HFP had no crystalline structures on the surface,
although small islands of PS did appear at low grafting levels, and these coalesced at high

Chapter 1 Introduction and Review of the Literature 34
graft levels. As expected, a higher pre- irradiation dose led to more islands of PS on the
surface, consistent with there being more grafting sites. The grafting seemed to be more on
the surface for PVDF compared with the PVDF-co-HFP, suggesting that the diffusion of
styrene in the polymer bulk is faster in the latter matrix, presumably due to the lower
crystallinity.
1.6 Conclusions and Thesis Objectives
Despite the stability of fluoropolymers they may be readily modified by radiation- induced
graft copolymerization. The number of fluoropolymer substrates and monomer
combinations reported in the literature is vast and the conditions employed equally so.
Parameters deemed important in predicting the grafting behavior include chemical
composition, radical yield, swellability, dose and dose rate, crystallinity, Tg, additives,
impurities, substrate thickness, processing, radiation atmosphere and type of radiation.
However, in the existing literature the substrate polymers are rarely characterized other
than by stating the proprietors responsible fo r donation or sale of the samples.
Once grafted, the characterization of the resulting graft copolymers is confined to a
limited number of techniques. With the exception of one or two fluoropolymers, they are
totally insoluble, so that solid-state techniques must be used.
The bulk of research on grafting to fluoropolymers has been focused on producing
membranes. In this thesis, the first effort towards understanding the radiation chemistry of
PFA and grafting to this fluoropolymer for the application as a solid support for SPOC is
presented. The objectives of this thesis are:
- to understand the radiation chemistry of the base fluoropolymer.
- to understand how grafting conditions affect the extent and rate of grafting so
that grafted polymer preparation can be carried out in a rapid and reproducible
manner.
- to develop a solid support with thermal and chemical stability to a large range of
solvents and conditions.

Chapter 1 Introduction and Review of the Literature 35
- to develop a solid support with better loading and kinetics than that of existing
solid supports.
This thesis has been divided into eight chapters, each written with introduction,
experimental, results and discussion, and conclusions sections. Some chapters also include
a technical and theoretical aspects section where appropriate. Chapter Two will examine
the structure and stability of the radicals produced in PFA when subjected to radiation. In
Chapters Three and Four the identity of new structures in PFA irradiated over a range of
temperatures is reported. Chapter Five describes the thermal properties of irradiated PFA.
In Chapters Six and Seven the grafting of PS to PFA using various solvents and a ‘living’
polymerization technique are examined. In Chapter Eight conclusions are made and scope
for further work is presented.

Chapter 1 Introduction and Review of the Literature 36
1.7 References 1. Boittiaux, V., Boucetta, F., Combellas, C., Kanoufi, F., Thiebault, A., Delamar, M.,
Bertrand, P., Polymer 40, 2011-2026 (1999). 2. Marchesi, J. T., Keith, H. D., Garton, A., J. Adhes. 38, 185-205 (1992). 3. Griesser, H. J., Da, Y., Hughes, A. E., Gengenbach, T. R., Mau, A. W. H.,
Langmuir 7, 2484-2491 (1991). 4. Rye, R., J. Polym. Sci. Part B: Polym. Phys. 31, 357-364 (1993). 5. Oshima, A., Seguchi, T., Tabata, Y., Radiat. Phys. Chem. 55, 61-71 (1999). 6. Rasoul, F. A., Hill, D. J. T., Forsythe, J. S., O'Donnell, J. H., George, G. A.,
Pomery, P. J., Young, P. R., Connell, J. W., J. Appl. Polym. Sci. 58, 1857-1864 (1995).
7. Ivanov, B., Popov, C., Lekova, M., Yankova, D., Peev, G., Appl. Surf. Sci. 108,
297-301 (1997). 8. Lappan, U., Haussler, L., Pompe, G., Lunkwitz, K., J. Appl. Polym. Sci. 66, 2287-
2291 (1997). 9. Zhang, Y., Huan, A. C. H., Tan, K. L., Kang, E. T., Nuc. Inst. Meth. Phys. Res. B
168, 29-39 (2000). 10. Svorcik, V., Micek, I., Rybka, V., Palmetshofer, L., Hnatowicz, V., J. Appl. Polym.
Sci. 69, 1257-1261 (1998). 11. Merrifield, R. B., J. Am. Chem. Soc. 85, 2149-2154 (1963). 12. Moos, W. H. Introduction: Combinatorial Chemistry Approaches the Next
Millennium. In: A Practical Guide to Combinatorial Chemistry; Czarnik, A. W.; DeWitt, S. H. Eds.; Americal chemical society: Washington, 1997.
13. Geysen, H. M., Meloen, R. H., Barteling, S. J., Proc. Natl. Acad. Sci. USA 81, 3998-
4002 (1984). 14. Hawker, C. J., Bosman, A. W., Frechet, M. J., Harth, E., Heumann, A., Ranger, M.,
Van Horn, B., Klaerner, G., Benoit, D., Polym. Prep. 42, 639-640 (2001). 15. Bergbreiter, D. E., Med. Res. Rev. 19, 439-450 (1999). 16. Barany, G., Kempe, M. The Context of Solid-Phase Synthesis. In: A Practical
Guide to Combinatorial Chemistry; Czarnik, A. W.; DeWitt, S. H. Eds.; American Chemical Society: Washington, DC, 1997.

Chapter 1 Introduction and Review of the Literature 37
17. Valerio, R. M., Bray, A. M., Campbell, R. A., Dipasquale, A., Margellis, C., Rodda, S., Geysen, H. M., Maeji, N. J., Int. J. Pept. Protein Res. 42, 1-9 (1993).
18. Maeji, N. J., Valerio, R. M., Bray, A. M., Campbell, R. A., Geysen, H. M., React.
Polym. 22, 203-212 (1994). 19. Rasoul, F. (Mimotopes Pty Ltd), Personal Communication 20. Carlson, D. P., Schmiegel, W. Fluoropolymers, Organic. In: Ullmann's
Encyclopedia of Industrial Chemistry; VCH Verlag: Weinheim, 1998; Vol. A11. 21. Tervoort, T., Visjager, J., Graf, B., Smith, P., Macromolecules 33, 6460-6465
(2000). 22. Tregear, G. W. “Graft Copolymers as Insoluble Supports in Peptide Synthesis”;
Chem. Biol. Pept., Proc. Am. Pept. Symp., 3rd, 1972, Ann Arbor, Mich. 23. Liu, S., Akhtar, M., Gani, D., Tetrahedron Lett. 41, 4493-4497 (2000). 24. Zhao, C., Shi, S., Mir, D., Hurst, D., Li, R., Xiao, X., Lillig, J., Czarnik, A. W.,
Comb. Chem. 1, 91-95 (2000). 25. Zhao, C., Lillig, J. E., Neeper, R., Hudson, G. W., Czarnik, A. W., Parandoosh, Z.,
David, G. S., Xiao, X.-Y., PCT Application WO 98/31732, (1998). 26. Garnett, J. L., Radiat. Phys. Chem. 14, 79-99 (1979). 27. Stannett, V. T., Radiat. Phys. Chem. 35, 82-87 (1990). 28. Schellekens, M. A. J., Klumperman, B., J. Macromol. Sci. Rev. Macromol. Chem.
Phys. C40, 167-192 (2000). 29. Kang, E. T., Zhang, Y., Adv. Mater. 12, 1481-1494 (2000). 30. Kabanov, V. Y., Radiat. Phys. Chem. 33, 51-60 (1989). 31. Gupta, B., Scherer, G. G., Chimia 48, 127-137 (1994). 32. Chapiro, A. Radiation Chemistry of Polymeric Systems. In: High Polymers; Mark,
H.; Marwell, C. S.; Melville, H. W. Eds.; Interscience: New York, 1962; Vol. XV.; p. 598.
33. Kamel, I., Machi, S., Silverman, J., J. Polym. Sci., Part A-1 10, 1019-1029 (1972). 34. Modern Fluoropolymers; John Wiley and Sons: Chichester, 1997. 35. Clough, R. L., Gillen, K. T. Radiation Resistance of Polymers and Composites. In:
Irradiation Effects on Polymers; Clegg, D. W.; Collyer, A. A. Eds.; Elservier Applied Science: London, 1991; pp. 79-156.

Chapter 1 Introduction and Review of the Literature 38
36. Chapiro, A., J. Polym. Sci. 34, 481-501 (1959). 37. Chapiro, A., Matsumoto, A., J. Polym. Sci. 57, 743-761 (1962). 38. Chapiro, A. Radiation Chemistry of Polymeric Systems. In: High Polymers; Mark,
H.; Marwell, C. S.; Melville, H. W. Eds.; Interscience: New York, 1962; Vol. XV.; p. 676.
39. Walsby, N., Paronen, M., Juhanoja, J., Sundholm, F., J. Appl. Polym. Sci. 81, 1572-
1580 (2001). 40. Walsby, N., Sundholm, F., Kallio, T., Sundholm, G., J. Polym. Sci., A, Polym.
Chem. 39, 3008-3017 (2001). 41. Rouilly, M. V., Kotz, E. R., Haas, O., Scherer, G. G., Chapiro, A., J. Membrane Sci.
81, 89-95 (1993). 42. Yamada, K., Gondo, T., Hirata, M., J. Appl. Polym. Sci. 81, 1595-1604 (2001). 43. Hegazy, E. A., Abd, E., Ali, A. M. I., Nowiev, H. G., Aly, H. F., Nuc. Inst. Meth.
Phys. Res. B 151, 393-398 (1999). 44. Zou, X. P., Kang, E. T., Neoh, K. G., Surf. Coat. Tech. 149, 119-128 (2002). 45. Wang, P., Tan, K. L., Kang, E. T., Neoh, K. G., J. Adhes. Sci. Tech. 16, 111-127
(2002). 46. Chapiro, A. Radiation Chemistry of Polymeric Systems. In: High Polymers; Mark,
H.; Marwell, C. S.; Melville, H. W. Eds.; Interscience: New York, 1962; Vol. XV.; p. 679.
47. Garnett, J. L., Yen, N. T., Polym. Lett. 12, 225-229 (1974). 48. Dilli, S., Garnett, J. L., Martin, E. C., Phuoc, D. H., J. Polym. Sci., C 37, 57-118
(1972). 49. Trommsdorff, E., Kohle, H., Lagally, P., Makromol. Chem. 1, 169-198 (1948). 50. Nho, Y. C., Chen, J., Jin, J. H., Radiat. Phys. Chem. 54, 317-322 (1999). 51. Li, Y., Desimone, J. M., Poon, C.-D., Samulski, E. T., J. Appl. Polym. Sci. 64, 883-
889 (1997). 52. Beenen, W., Wal, D. J., Janssen, L. P. B. M., Macromol. Symp. 102, 255-263
(1996). 53. Nasef, M. M., Saidi, H., Dessouki, A. M., El-Nesr, E. M., Polym. Int. 49, 399-406
(2000). 54. Nasef, M. M., Saidi, H., Nor, H. M., J. Appl. Polym. Sci. 76, 220-227 (2000).

Chapter 1 Introduction and Review of the Literature 39
55. Nasef, M. M., Saidi, H., Nor, H. M., Dahlan, K. Z. M., Hashim, K., J. Appl. Polym.
Sci. 73, 2095-2102 (1999). 56. Elmidaoui, A., Cherif, A. T., Brunea, J., Duclert, F., Cohen, T., Gavach, C., J.
Membrane Sci. 67, 263-271 (1992). 57. Taher, N. H., Dessouki, A. M., Khalil, F. H., El-Arnaouty, M. B., Polym. Int. 41,
383-389 (1996). 58. Hegazy, E. A., Taher, N. H., Ebaid, A. R., J. Appl. Polym. Sci. 41, 2637-2647
(1990). 59. Hegazy, E. A., Taher, N. H., Kamal, H., J. Appl. Polym. Sci. 38, 1229-1242 (1989). 60. Hegazy, E. A., El-Assy, N. B., Rabie, A. M., Ishigaki, I., Okamoto, J., J. Polym. Sci.
22, 597-604 (1984). 61. Hegazy, E. A., Ishigaki, I., Okamoto, J., J. Appl. Polym. Sci. 26, 3117-3124 (1981). 62. Hegazy, E. A., Ishigaki, I., Dessouki, A. M., Rabie, A.-G. M., Okamoto, J., J. Appl.
Polym. Sci. 27, 535-543 (1982). 63. Gupta, B. D., Chapiro, A., Eur. Polym. J. 25, 1145-1148 (1989). 64. Hegazy, E. A., Dessouki, A. M., El-Assy, N. B., El-Sawy, N. M., El-Ghaffar, M. A.
A., J. Polym. Sci., A, Polym. Chem. 30, 1969-1976 (1992). 65. El-Sawy, N. M., Hegazy, E. A., Rabie, A. M., Hamed, A., Miligy, G. A., Polym. Int.
33, 285-291 (1994). 66. Hegazy, E. A., Osman, M. B. S., Mokhtar, S. M., Mostafa, A. E. B., Polymer 33,
4230-4235 (1992). 67. Hegazy, E. A., Ishigaki, I., Rabie, A.-G. M., Dessouki, A. M., Okamoto, J., J. Appl.
Polym. Sci. 28, 1465-1479 (1983). 68. Hegazy, E. A., Ishigaki, I., Rabie, A.-G. M., Dessouki, A. M., Okamoto, J., J. Appl.
Polym. Sci. 26, 3871-3883 (1981). 69. Chapiro, A. Radiation Chemistry of Polymeric Systems. In: High Polymers; Mark,
H.; Marwell, C. S.; Melville, H. W. Eds.; Interscience: New York, 1962; Vol. XV.; p. 605.
70. Bozzi, A., Chapiro, A., Radiat. Phys. Chem. 32, 193-196 (1988). 71. Huglin, M. B., Johnson, B. L., J. Polym. Sci., A-1 7, 1379-1384 (1969). 72. Bozzi, A., Chapiro, A., Eur. Polym. J. 23, 255-257 (1987).

Chapter 1 Introduction and Review of the Literature 40
73. Wilson, J. E. Radiation Chemisty of Monomers, Polymers and Plastics; Marcel Dekker, Inc.: New York.
74. Gupta, B. D., Chapiro, A., Eur. Polym. J. 25, 1137-1143 (1989). 75. Chappas, W. J., Silverman, J., Radiat. Phys. Chem. 14, 847-852 (1979). 76. Dworjanyn, P. A., Garnett, J. L., Khan, M. A., Maojun, X., Meng-Ping, Q., Nho, Y.
C., Radiat. Phys. Chem. 42, 31-40 (1993). 77. Garnett, J. L., Jankiewicz, S. V., Sangster, D. F., Radiat. Phys. Chem. 36, 571-579
(1990). 78. Garnett, J. L., Jankiewicz, S. V., Levot, R., Sangster, D. F., Radiat. Phys. Chem. 25,
509-516 (1985). 79. Chaplin, R. P., Dworjanyn, P. A., Gamage, N. J. W., Garnett, J. L., Jankiewicz, S.
V., Khan, M. A., Sangster, D. F., Radiat. Phys. Chem. 47, 435-437 (1996). 80. Dilli, S., Garnett, J. L., Phuoc, D. H., J. Polym. Sci., Polym. Letts. Edn. 11, 711-715
(1973). 81. Nasef, M. M., Polym. Int. 50, 338-346 (2001). 82. Kwon, O. H., Nho, Y. C., Lee, Y. M., J. Mat. Sci., Mat. Med. 11, 593-600 (2000). 83. Shiraishi, N., Williams, J. L., Stannett, V., Radiat. Phys. Chem. 19, 73-78 (1982). 84. Safranj, A., Omichi, H., Okamoto, J., Radiat. Phys. Chem. 27, 447-453 (1986). 85. Charlesby, A. The Effects of Ionising Radiation on Polymers. In: Irradiation Effects
on Polymers; Clegg, D. W.; Collyer, A. A. Eds.; Elsevier Science Publishers Ltd: Essex, 1991; p. 44.
86. Gupta, B., Buchi, F., Scherer, G. G., J. Polym. Sci., A, Polym. Chem. 32, 1931-1938
(1994). 87. Xu, Z., Wang, G., Wang, H., Cian, G., Ni, M., Radiat. Phys. Chem. 22, 939-945
(1983). 88. Ang, C. H., Garnett, J. L., Levot, R., Long, M. A., J. Appl. Polym. Sci. 27, 4893-
4895 (1982). 89. Dworjanyn, P. A., Garnett, J. L., Radiat. Phys. Chem. 33, 429-436 (1989). 90. Hintzer, K., Lohr, G. Melt Processable Tetrafluoroethylene - Perfluoropropylvinyl
Ether Copolymers (PFA). In: Modern Fluoropolymers; Scheirs, J. Ed.; John Wiley & Sons, 1997; pp. 223-237.

Chapter 1 Introduction and Review of the Literature 41
91. Pucciariello, R., Villani, V., Mancusi, C., J. Appl. Polym. Sci. 74, 1607-1613 (1999).
92. Brack, H., Buhrer, H. G., Bonorand, L., Scherer, G. G., J. Mater. Chem. 10, 1795-
1803 (2000). 93. Sakurai, H., Shiotani, M., Yahiro, H., Radiat. Phys. Chem. 56, 309-313 (1999). 94. Uschold, R. E., J. Appl. Polym. Sci. 29, 1335-1344 (1984). 95. Dokolas, P., Looney, M. G., Musgrave, S., Poon, S., Solomon, D. H., Polymer 41,
3137-3145 (2000). 96. Sakurai, H., Shiotani, M., Yahiro, H., J. Appl. Polym. Sci. 74, 1386-1394 (1999). 97. Hietala, S., Maunu, S. L., Sundholm, F., Macromolecules 32, 788-791 (1999). 98. Miwa, Y., Yamamoto, K., Sakaguchi, M., Shimada, S., Macromolecules 34, 2089-
2094 (2001). 99. Ducouret, C., Betz, N., Le Moel, A., J. Chim. Phys. 93, 70-77 (1996). 100. Aymes-Chodur, C., Yagoubi, N., Betz, N., Le Moel, A., Ferrier, D.,
Chromatographia 51, 269-276 (2000). 101. Munro, H. S., Singh, S. In: Polymer Characterization; Hunt, B. J.; James, M. I.
Eds.; Chapman & Hall: London, 1993. 102. Nasef, M. M., Saidi, H., Nor, H. M., Yarmo, M. A., J. Appl. Polym. Sci. 76, 336-
349 (2000). 103. Nasef, M. M., Saidi, H., Yarmo, M. A., J. Appl. Polym. Sci. 77, 2455-2463 (2000). 104. Inagaki, N., Tasaka, S., Goto, T., J. Appl. Polym. Sci. 66, 77-84 (1997). 105. Tan, K. L., Woon, L. L., Wong, H. K., Kang, E. T., Neoh, K. G., Macromolecules
26, 2832-2836 (1993). 106. Loh, F. C., Tan, K. L., Kang, E. T., Uyama, Y., Ikada, Y., Polymer 36, 21-27
(1995). 107. Loh, F. C., Tan, K. L., Kang, E. T., Neoh, K. G., Pun, M. Y., J. Vac. Sci. Technol. A
12, 2705-2710 (1994). 108. Hegazy, E. A., Dessouki, A. M., Rabie, A. M., Ishigaki, I., J. Polym. Sci. Polym.
Chem. Ed. 22, 3673-3685 (1984).
Chapter 1 Introduction and Review of the Literature 42
109. Hietala, S., Paronen, M., Holmberg, S., Nasman, J., Juhanoja, J., Karjalainen, M., Serimaa, R., Toivola, M., Lehtinen, T., Parovuori, K., Sundholm, G., Ericson, H., Mattsson, B., Torell, L., Sundholm, F., J. Polym. Sci., A, Polym. Chem. 37, 1741-1753 (1999).
110. Keen, I., Rintoul, L., Fredericks, P. M., Appl. Spec. 55, 984-991 (2001). 111. Giulmeau, I., Esnouf, S., Betz, N., Le Moel, A., Nuc. Inst. Meth. Phys. Res. B 131,
270-275 (1997). 112. Walsby, N., Paronen, M., Juhanoja, J., Sundholm, F., J. Polym. Sci., A, Polym.
Chem. 38, 1512-1519 (2000). 113. Aymes-Chodur, C., Betz, N., M.-C., P.-D., Baquey, C., Le Moel, A., Nuc. Inst.
Meth. Phys. Res. B 151, 377-385 (1999).

Chapter 2
2 Radical Formation in PFA
2.1 Introduction
The nature of the initiating species in any free radical polymerization plays a pivotal role in
determining the success or failure of the reaction. A radiation- induced grafting reaction to a
pre-existing polymer is a specific type of free radical polymerization where a monomer is
polymerized to a polymer backbone. In this situation, the initiating species is in the form of
a free radical macro- initiator. The stability and accessibility of this initiator must be such
that the monomer is able to react with it. The stability will depend on the chemical structure
as well as the temperature at which the graft copolymerization reaction is performed. When
radiation is used to create the initiating species on the polymer substrate, the radical yield
will also influence the amount of graft.1
Radiation- induced grafting reactions of a monomer to a polymer substrate involves
firstly creating radicals on or in the polymer substrate followed by either immediate
reaction with the monomer (as is the case for the simultaneous grafting method), or by
reaction with the monomer some time in the future (the pre- irradiation grafting method).
For both the simultaneous and pre- irradiation grafting methods, the chemical environment,
stability and accessibility of the radicals produced on the substrate are important factors in
predicting the outcome of the grafting reaction.
The structure of PFA is relatively simple and there are only three types of bonds
which may be cleaved by radiation, namely C–C, C–F, and a small amount of C–O bonds
from the comonomer units. The possible radicals are thus limited to C, F and O-centred
radicals. The morphological environment in which these radicals may be formed in PFA is
more complex as PFA is semicrystalline. This, in conjunction with the insolubility of PFA,
means that the graft copolymer will undoubtedly be heterogeneous.

Chapter 2 Radical Formation in PFA 44
In addition to initiating grafting reactions, the radicals formed in PFA may also act
as precursors to chemical changes within PFA such as branches or double bond formation.
By using ESR spectroscopy to identify the radicals produced in PFA when exposed to
γ-radiation it may be possible to predict the mechanism of the grafting reaction and offer an
understanding of the pathways to possible new chemical structures formed in PFA.
The radiolysis of PFA has been studied by several workers. Like PTFE, it is
considered to be a radiation-degradable polymer. γ-Irradiation to low doses in vacuum or in
air at ambient temperature results in a loss of mechanical properties and an increase in the
crystallinity, suggesting that chain scission is the main radiolytic process.2-4 Hegazy et al.5
observed an initial slight increase in the tensile strength and elongation of PFA irradiated to
low dose, followed by a decrease in these properties with increasing radiation dose. When
irradiated to high doses with accelerated electrons in air, a drop in the melting point and the
introduction of chain scission products as well as some unsaturation was observed.6
Sun et al. claimed that under special conditions it is possible to radiation-crosslink PFA,
based on an observed increase in the zero-strength-temperature after treatment.7 Although
the conditions were not specified, it might be assumed that irradiation was performed at a
temperature where the chain mobility was high enough for radicals to recombine as
branched and eventually crosslinked structures.
The structure of PFA is very similar to PTFE in that it contains mostly –CF2–CF2–
chains. The difference between the structure of PFA and PTFE is that PFA contains a small
amount of perfluoroalkoxy pendant groups. PTFE is by far the most studied fluoropolymer,
so it is of interest to review what is known about the radicals formed in PTFE. The first
report of the radicals formed in irradiated PTFE was in 1955 by Schneider,8 although his
findings were widely rejected and it was not until several years later, in work by Tamura9
and by Siegel and Hedgpeth,10 that any consensus was agreed upon as to the components
making up the ESR spectrum of PTFE irradiated and measured in vacuum at room
temperature. Siegel and Hedgpeth10 observed a spectrum comprising of a double quintet
due to the main-chain radical (I) (Figure 2.1) (splitting ~ 3.3 mT ß-F and ~ 9.2 mT a-F) and
a triplet due to the end-chain radical (II) (splitting 1.6 mT ß-F, wing peaks ~ 8.5 mT for the
a-F). The yield of the end-chain radical was reportedly ten times greater than that of the
main-chain radical.

Chapter 2 Radical Formation in PFA 45
(II)
.CF2 CF2
(I)
.CF2 CF CF2
Figure 2.1 Main-chain (I) and end-chain (II) radicals.
In fluorinated copolymers such as FEP (a copolymer of TFE and
hexafluoropropylene (HFP)), the comonomer is known to have an effect on the radiation
behavior due to the changes in chain mobility, radical reactivity and steric hindrance.11 The
perfluoropropyl vinyl ether (PPVE) comonomer in PFA might be expected to have a
similar effect.
There is just one report in the literature examining the radical formation in
irradiated PFA. Momose et al. used ESR spectroscopy to examine the peroxy radicals
formed in PFA when subjected to an argon plasma and then exposed to air.12 After the
admission of oxygen to the sample, the spectrum contained a signal assigned to peroxy
radicals in the crosslinked structures at the surface which was superimposed with a peroxy
signal from oxygen reaction with radicals in the bulk.
In this chapter the radicals produced when PFA was exposed to γ-radiation in
vacuum are examined. Their identity, stability and number will be examined with the aim
of determining the initiating species for grafting reactions and the precursors to chemical
changes within PFA.
2.1.1 Theory and Technical Aspects
In this section a brief review of ESR theory is given. Many books have been published on
ESR theory and the reader is directed to Ranby and Rabek,13 Weil and Bolton,14 Ingram15
or Ayscough16 if a more detailed discussion of this technique is sought.
Electron Spin Resonance (ESR) (also often referred to as Electron Paramagnetic
Resonance (EPR)) spectroscopy is used to study chemical species with an odd number of
unpaired electrons. Radiation- induced cleavage of a chemical bond (an electron pair) will
often result in formation of a type of unpaired electron called a free radical. Unpaired

Chapter 2 Radical Formation in PFA 46
electrons are found in other forms including stable organic compounds, transition metal
ions and biradical species, however, in this chapter only free radicals will be considered.
An unpaired electron has an intrinsic angular momentum (spin vector) and a
magnetic moment which is proportional, but opposite in sign, to the spin vector. In the most
simple case, if a magnetic field (H) is applied to a paramagnetic sample with spin of ½, the
magnetic moment will have two possible orientations relative to the magnetic field. The
energy difference between the two orientations is such that transitions between the two
energy levels may be induced with an external electromagnetic field with frequency in the
microwave region (E) (Figure 2.2). E has an energy h?, where ? is the frequency of the
electromagnetic field and h is Planck’s constant. This energy difference is equal to gßH,
where H is the magnetic field, ß is the Bohr magnetron and g is a constant called the
“Lande g- factor”. When the population in the lower energy level is less than the population
in the higher energy level, there is an absorption of microwave frequency which is detected,
giving rise to an ESR absorbance. The electrons in the upper energy level repopulate the
lower level via relaxation processes. In practice, the microwave frequency (and hence, E) is
kept constant while the magnetic field (H) is scanned so that the equation h?=gßH is
satisfied. Typically, a microwave frequency of the order of 9 GHz will require a magnetic
field of approximately 0.3 T.
E Ms = + ½
?E = gßH = h?
H
Ms = - ½
Figure 2.2 Possible energy levels for a single unpaired electron as a function of magnetic field.16
The line position of an ESR signal is expressed as a g-value (not to be confused
with G values in Section 2.3.5). The g-value is a function of the microwave frequency and

Chapter 2 Radical Formation in PFA 47
the external magnetic field at resonance, that is, when the microwave energy is equal to the
difference in the energy levels. Different types of radicals have different g-values, and they
may be used to aid in the identification of the radicals.
Magnetic interactions between the radicals and surrounding nuclei can lead to
hyperfine couplings in the ESR signal due to small additional splitting of the energy levels.
The number of hyperfine couplings in conjunction with their magnitude and intensity can
be used to determine the structure of the group containing the free radical. The rule
governing the splitting of the electron magnetic levels is 2I + 1, where I is the spin of the
nucleus. 19F is the only non-zero spin nucleus (ignoring the isotopically rare 13C nucleus) in
perfluoropolymers. 19F has 100 % natural abundance and has I equal to ½ so that each 19F
atom will add to the hyperfine coupling by: (2 × ½) + 1 = 2.
2.2 Experimental
PFA (code TE 7132) with PPVE comonomer content of 1.7 ± 0.2 mol. % as determined by
NMR analysis was supplied by DuPont in pellet form. The crystallinity of the polymer by
DSC was 34 ± 3 % based on the heat of fusion of 100 % crystalline PTFE of 82 J g-1.17
Pellets were freezer milled into powder and packed into ESR tubes, evacuated at
1 × 10⁻² Pa for 48 hours and then sealed. All samples were checked for the absence of
radicals by ESR spectroscopy prior to any irradiation. Irradiation was performed using a
220 Nordian 60Co Gammacell facility either at 303 K or at 77 K using a liquid nitrogen
dewar. Dose rates were 6.2 and 5.4 kGy hr-1 for 303 K and for 77 K irradiations,
respectively.
The ESR spectrometer used was a Bruker ER200D operating in the X-band
microwave frequency range and fitted with variable temperature and 77 K dewar inserts.
All spectra were acquired using a modulation amplitude of 0.2 mT, a centre field of
330 mT, and a sweep width of 50 mT. By rotating the ESR tube in the ESR cavity it was
confirmed that the ESR signals were isotropic and that the sample orientation did not affect
the shape or intensity of the ESR spectrum.

Chapter 2 Radical Formation in PFA 48
Annealing of the sample irradiated at 303 K was performed by heating the sample at
the desired temperature for five minutes, then cooling back to 298 K to record the ESR
spectrum. Annealing of the sample irradiated at 77 K was performed by warming the
sample to a predetermined temperature (in 10 K increments) for five minutes before
recording the spectrum at this temperature.
The software used for acquiring and processing data and performing simulations
was SIMOPR written by Wayne Garrett (The University of Queensland). Radical
concentrations (spins g-1) were calculated from the area of the absorption spectra
determined from the double integration of the first derivative spectra, and by calibration of
the instrument with a Varian Strong Pitch Standard (4 × 10¹⁵ spins g-1). Microwave powers
of 0.063 mW at 77 K and 0.63 mW at 298 K were used to avoid power saturation.
Powerplots are shown in Figure 2.3. At 77 K and 298 K power saturation, as represented by
deviation from linearity, occurred at approximately 0.13 mW and 6.3 mW, respectively.
Figure 2.3 Powerplots of PFA irradiated at 303 K and measured at 298 K (left) and PFA irradiated and
measured at 77K (right). The total dose was 500 kGy. The dashed line is an aid to illustrate where the
microwave power deviates from linearity (power saturation).
The G values reported herein are based upon the number of events per 16 × 10-18 J
(16 aJ or 100 eV) of absorbed energy.

Chapter 2 Radical Formation in PFA 49
2.3 Results and Discussion
2.3.1 303 K Radiolysis
The ESR spectra of PFA irradiated at 303 K in the dose range 5 to 100 kGy and recorded at
298 K are shown in Figure 2.4. The spectra can be described as a double quintet (splitting
3.4 and 8.9 mT; centred at g = 2.0021) superimposed with a triplet (splitting 1.7 mT;
centred at g = 2.0029) and a broad signal just beyond the double quintet separated by
27.2 mT. Similar spectra have been observed for irradiated PTFE.9,18 The sharp signal in
the centre of the spectra denoted by “gs” was due to colour centres in the quartz ESR tube.
The double quintet was assigned to the main-chain radical (I in Figure 2.1). The four
ß-fluorines gave rise to a quintet with splitting of 3.4 mT, which were split by 8.9 mT by
the a- fluorine. The central triplet was assigned to the end-chain radical (II in Figure 2.1),
with a splitting of 1.7 mT from the ß- fluorine.

Chapter 2 Radical Formation in PFA 50
Figure 2.4 ESR spectra of PFA irradiated at 303 K in vacuum. Doses: 5, 30, 70, 100 kGy. Features of the
spectra are indicated by: # - the triplet; * - the central line of the double quintet; φ - outer wing of the broad
component. The glass signal is indicated by “gs”.
Chapter 2 Radical Formation in PFA 51
The splitting effect of the a- fluorine in the end-chain radical (II) has been studied by
Toriyama and Iwasaki using orientated PTFE.19 By irradiating stretched PTFE then
exposing it to air, the peroxy radicals at the main-chain and end-chain positions were
formed. Photolysis and re-evacuation of the sample at 77 K led to exclusive production of
the end-chain radical (II). Toriyama and Iwasaki showed that at room temperature the
signal due to this radical was comprised of a central triplet and outer wing peaks ascribed to
splitting by the ß- and a- fluorines, respectively.19 The a- fluorine was found to have a
splitting between 11.0 mT (parallel to the magnetic field) and 7.4 mT (perpendicular to the
field). The separation between the tails of these wing peaks was measured and found that
they approximately match the broad overlapping signals seen in the spectra in Figure 2.4.
Thus, the broad component in Figure 2.4 was tentatively assigned to the a-fluorine coupling
of the end-chain radical.
A simulation of the main-chain radical (I) and ß- fluorine coupling of the end-chain
radical (II) of the spectra for PFA is shown in Figure 2.5. The simulated spectrum shows
reasonable agreement with the splitting pattern of the experimental spectrum, although any
anisotropic interactions could not be accounted for by the simulation software which
assumes an isotropic tensor.

Chapter 2 Radical Formation in PFA 52
Figure 2.5 Top: ESR spectrum of PFA irradiated to 10 kGy at 303 K in vacuum, Bottom: simulation of the
double quintet and triplet.
As the dose was increased, the ratio of the end-chain radical to main-chain radical
decreased based on visual inspection of Figure 2.4. With increasing radical density the
likelihood of radical recombination also increases, especially for any end-chain radicals in
the amorphous regions. This dose effect was accompanied by a deviation from linearity in
the radical yield plot at 298 K (Figure 2.6).

Chapter 2 Radical Formation in PFA 53
Figure 2.6 Radical concentration of PFA as a function of dose. 298 K (irradiated at 303 K and acquired at
298 K); 77 K (irradiated and acquired at 77 K).
There were significant differences in the proportion of the central triplet attributed
to the end-chain radical in PFA, FEP and PTFE for samples irradiated to similar doses.
Siegel and Hedgepeth and Oshima et al. reported that the triplet for irradiated PTFE was
only a minor component,10,18 while Hill et al. and Kim and Liang reported that for FEP it
was the major feature.20,21 For PFA the triplet constituted approximately half of the total
signal, although it did vary depending on the dose. These observations may relate to the
morphology of these fluoropolymers. Oshima et al.18 used PTFE with crystallinity of 50 %,
which was significantly higher than that of the PFA used here (34 ± 3 %) and presumably
higher than that of the FEP used by Hill et al.20 and Kim and Liang.21 Although neither Hill
et al. or Kim and Liang reported the crystallinity of the FEP they used, it is known that the
HFP comonomer in FEP significantly disrupts chain packing, leading to a higher
amorphous content when compared with PTFE.22 At room temperature it might be expected
that C–C bond scission in the crystalline regions would more likely result in recombination
compared with C–C scission in the amorphous regions where the radicals may be able to
move apart and stabilize due to the greater mobility in the amorphous regions. The
end-chain radicals in PTFE are known to decay when warmed above the Tg 9 which has
been exploited by Siegel and Hedgpeth to isolate the main-chain radical.10 The same

Chapter 2 Radical Formation in PFA 54
observation was made for PFA irradiated at 303 K and then annealed (see Section 2.3.2),
which also suggested that the end-chain radical is present in the amorphous regions when
the polymer is irradiated at 303 K. Hence the greater amorphous content in PFA and FEP
led to more end-chain radicals in the copolymers compared with PTFE. End-chain
formation may also be aided in the copolymers by cleavage of the PPVE and HFP units in
PFA and FEP, respectively.
The PPVE units in PFA might be expected to be radiolytically labile, however no
component in the spectra of irradiated PFA could be assigned to any of the possible radicals
formed from cleavage at this group (Scheme 2.1). Any main-chain and end-chain radicals
formed from the PPVE units will be indistinguishable from those formed from the TFE
units. The oxy radical (IV in Scheme 2.1), if present, would give rise to an asymmetric
spectrum since it would have a higher g-value than either of the alkyl radicals.13 While
Iwasaki et al.23 and Matsugashita and Shirohara24 have claimed to have identified
R–CF2–O• oxy radicals formed from degradation of peroxy radicals (R–O–O•), subsequent
studies have thrown doubt onto this assignment. Rasoul et al.25 and Schlick et al.26 found
that the peroxy radical was stable at room temperature and that the oxy radical would give
rise to a singlet, not a triplet. Olivier et al.27 also disputed the assignment of the oxy radical
from experiments using isotopically- labeled oxygen when they did not observe the six
hyperfine lines expected for R–CF2–17O•, instead assigning the signal as a superimposition
of the end-chain radical and main-chain peroxy radical. On the other hand, the g-value of
the carbon centred radical (III) may not be as easily distinguishable.
CF2 CF CF2
OC3F7
CF2 CF CF2
OC3F7
OC3F7
CFOC3F7
CF2
CF2 CFO
..
.
.
+
+
+
(I)
(II)
(III)
(IV)
(V)
γ
γ
γ
Scheme 2.1 Possible radicals formed from scission at the PPVE units and the ß-rearrangement to form acyl
fluoride (V).

Chapter 2 Radical Formation in PFA 55
There are several possible reasons why none of the radicals attributed to scission at
the PPVE units were observed in the ESR spectra. The first reason may simply be that the
concentration of PPVE units in the polymer is so small that the signals due to the radicals
produced were swamped by the signals due to cleavage at the TFE groups. Another reason
may be that the products are not detectable by ESR spectroscopy. The products from
cleavage of the CF–O bond will be radical (I) which is already present from the cleavage of
C–F bonds, and the small fragment •OC3F7 which would quickly combine with another
radical or possibly rearrange to form a non-radical species. The other possible pathways in
Scheme 2.1 lead to radicals capable of rearrangement at 303 K, again resulting in a non-
radical species, in this case the acyl fluoride group (V).
2.3.2 Annealing of PFA Irradiated at 303 K
The thermal stabilities of each of the radicals observed were examined by annealing the
irradiated PFA over a range of temperatures. The radical concentration as a percentage of
the original concentration is presented in Figure 2.7 which shows the radical concentration
decreasing to almost zero with increasing annealing temperature up to 513 K. A selection
of the spectra from the annealing experiments are shown in Figure 2.8. It is clear from
Figure 2.8 that the species assigned to the central triplet and the outer wing peaks decayed
preferentially to the double quintet. At 503 K the triplet and broad component disappeared
completely, leaving the double quintet with diminished intensity. The Tg of non- irradiated
PFA is 363 K as measured by dynamic mechanical analysis (Chapter 5, Section 5.3.1),
although the onset of the transition begins at approximately room temperature. The
preferential loss of the end-chain radicals in the temperature range 300 to 503 K again
suggested they were present either in the amorphous regions or at the surface of the
crystallites.

Chapter 2 Radical Formation in PFA 56
Annealing Temperature (K)
300 350 400 450 500
Tota
l rad
ical
s(p
erce
ntag
e of
the
orig
inal
at 3
00 K
)
0
20
40
60
80
100
Figure 2.7 Decay curve for the total number of free radicals in PFA irradiated (100 kGy) at 303 K then annealed.

Chapter 2 Radical Formation in PFA 57
Figure 2.8 ESR spectra of PFA irradiated (100 kGy) at 303 K then annealed. The glass signal is indicated by
“gs”.

Chapter 2 Radical Formation in PFA 58
2.3.3 Life-times of Radicals at Ambient Temperature
The stability of radicals in PFA at ambient temperature is important for the success of
grafting reactions. This is especially true when using the pre- irradiation grafting method
where the substrate polymer is irradiated prior to introduction of any monomer for grafting.
Figure 2.9 Stability of the radicals created in PFA when irradiated at 303 K and stored at 294 K in vacuum.
The decay of radicals in a sample of PFA irradiated to 60 kGy at 303 K in vacuum
and stored at 294 K in the dark was measured using the peak area under the first derivative
of the ESR spectra and is shown in Figure 2.9. There was relatively rapid decomposition of
radicals during the first 50 days, after which the radical concentration reached
approximately 60 % of the original and remained constant, even after 664 days. The initial
rapid decomposition was due to loss of end-chain radicals, presumably by recombination.
This is evident from the ESR spectra recorded over the period 0 to 664 days (Figure 2.10)
which show that the central triplet due to end-chain radicals is greatly diminished after
10 days and completely absent after 664 days. As with the annealing studies, evidence
suggested the end-chain radicals were present in the amorphous regions or at the surfaces of
the crystallites while the main-chain radicals were predominantly in the crystallites. The
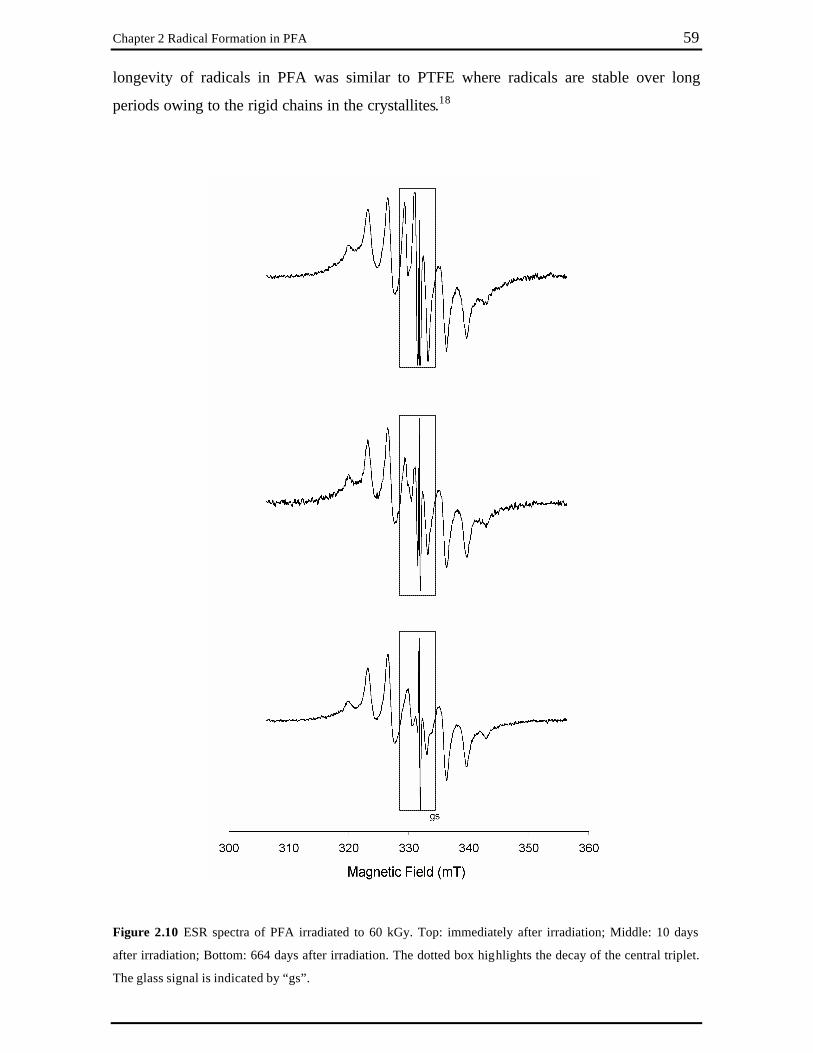
Chapter 2 Radical Formation in PFA 59
longevity of radicals in PFA was similar to PTFE where radicals are stable over long
periods owing to the rigid chains in the crystallites.18
Figure 2.10 ESR spectra of PFA irradiated to 60 kGy. Top: immediately after irradiation; Middle: 10 days
after irradiation; Bottom: 664 days after irradiation. The dotted box highlights the decay of the central triplet.
The glass signal is indicated by “gs”.

Chapter 2 Radical Formation in PFA 60
2.3.4 77 K Irradiation and Annealing Study
The spectrum of PFA irradiated to 395 kGy and measured at 77 K is shown in
Figure 2.11 A. The anisotropic hyperfine couplings were not averaged at low temperature
resulting in a broad spectrum. The spectrum may be considered to consist of a broad outer
component, with width ~ 40 mT, as well as a sharp central line with peak to peak width
(?Hpp) ~ 1.5 mT and shoulders of width ~ 15 mT. The spectrum is centred at g = 2.0061.
When the sample irradiated at 77 K was warmed to 170 K (Figure 2.11 B) the sharp
central line seen in the 77 K spectrum was missing, in its place was a signal beginning to
resemble the triplet of the end-chain radical (II) seen at 298 K. The double quintet did not
become resolved until 292 K (Figure 2.11 C) where the spectra resembled that of the
sample irradiated at 303 K and measured at 298 K. The total radical signal at 292 K was
reduced to 25 % of the original 77 K spectrum. Subsequent cooling of the sample back to
77 K (Figure 2.11 D) resulted in a broad spectrum similar to the spectrum of the
unannealed sample, but with the relative proportions of the inner and outer regions changed
compared with the spectrum in Figure 2.11 A.
Allayarov et al.28 and Tamura9 have examined the main-chain radical spectrum at
77 K. Allayarov et al. studied PTFE irradiated at 77 K to very high doses (0.8 and 19 MGy)
and then annealed to 300 K to isolate the main-chain radical.28 When cooled back to 77 K
and the spectrum acquired, they found a doublet of triplets of triplets due to non-equivalent
ß-fluorines (aFß1 = aFß3 = 7.2 mT; aFß2 = aFß4 = 1.8 mT; aFa = 23.8 mT). Tamura, on the other
hand, described the spectrum at 77 K as the same double quintet seen at room temperature,
only the triplet splitting had widened to 6.1 mT from 3.2 mT at room temperature with fine
structure in each line.9

Chapter 2 Radical Formation in PFA 61
Figure 2.11 ESR spectra of PFA irradiated and acquired at (A) 77 K; (B) annealed and acquired at 170 K; (C)
annealed and acquired at 292 K; (D) cooled back to 77 K and acquired at 77 K. The glass signal is indicated
by “gs”.

Chapter 2 Radical Formation in PFA 62
Toriyama and Iwasaki19 examined the end-chain radical at 77 K in orientated PTFE.
They observed a sharp central peak with ? Hpp ~ 1.6 mT parallel to the magnetic field, and a
multiplet with width ~ 12 mT perpendicular to the field, as well as minor wing peaks
separated by ~ 32 mT. The spectrum in Figure 2.11 A measured at 77 K may be considered
to be comprised of a mixture of the signal seen when PTFE was orientated parallel and
perpendicular to the field.
The inner sharp component and the shoulders in the spectra in Figure 2.11 of
irradiated PFA have been assigned to the end-chain radical (II), which is partially
overlapping with the outer broad component which has been assigned to the main-chain
radical (I). These assignments were based on the observations made by warming PFA to
292 K after irradiation at 77 K and subsequent cooling back to 77 K, and from the results of
Allayrov et al.,28 Tamura,9 and Toriyama and Iwasaki19 for radicals in PTFE.
Although no radicals due to scission of bonds at the PPVE units were observed at
298 K, they may be stabilized at 77 K. However, due to the loss of resolution at low
temperature, it was difficult to ascertain whether these radicals were present.
During the annealing from 77 K to 292 K the polymer undergoes both relaxation of
the side cha in (tan d maximum at 94 K) as well as a ?-relaxation (tan d maximum at 200 K)
due to the short chain motion as reported by Starkweather et al.29 In the annealing
experiments there was a rapid decrease in the radical concentration above approximately
200 K, presumably due to radical recombination as a result of the short-chain motion.

Chapter 2 Radical Formation in PFA 63
2.3.5 Radical Yields
Radical yields, G(R.), for PFA were calculated from the initial slopes of the plots of radical
concentration against dose as shown in Figure 2.6 in Section 2.3.1. G(R.) values of 0.93 and
0.16 were calculated for 298 K and 77 K, respectively. The deviation from linearity of the
radical yield at higher doses in Figure 2.6 was due to radical recombination as the radical
density increased. These values are similar to the corresponding values for
FEP of 2.0 ± 0.1(room temperature) and 0.22 ± 0.1(77 K),20 but in contrast to the values reported for
PTFE where the G(R.) at room temperature (0.14) was lower than at 77 K (0.4).18 This
suggested that like FEP, the comonomer in PFA has a dramatic effect on the radical
formation especially at ambient temperature.
As is the case with FEP, PFA exhibits three motional transitions below room
temperature as measured by dielectric spectroscopy, compared with just one transition for
PTFE.29 The higher chain mobility and lower crystallinity in PFA when compared with
PTFE limits the cage recombination at room temperature, resulting in higher radical
formation. This was also reflected in the ratio of the end-chain radical (II) to other radicals
formed in these fluoropolymers where FEP > PFA > PTFE for comparable doses.

Chapter 2 Radical Formation in PFA 64
2.4 Conclusions
The radicals identified in irradiated PFA were the same as those found in PTFE, although
the end-chain radical was more evident in PFA. While the comonomer in PFA did not
cause a large variation in the radical yie ld when compared with PTFE at 77 K, after
irradiation at 303 K the radical yield of PFA was significantly higher. This has been
attributed to the greater amount of amorphous content in PFA which helped to limit the
cage effect while scission at the PPVE units may also directly contribute to the increased
radical yield when compared with PTFE.

Chapter 2 Radical Formation in PFA 65
2.5 References
1. Battaerd, H. A. J., Tregear, G. W. Graft Copolymers; Interscience Publishers: New York, 1967.
2. Zhong, X., Yu, W., Zhang, Y., Sun, J., Polym. Degrad. Stab. 40, 115-116 (1993). 3. Rosenberg, Y., Siegmann, A., Narkis, M., Shkolnik, S., J. Appl. Polym. Sci. 45,
783-795 (1992). 4. Nasef, M. M., Saidi, H., Nor, H. M., Dahlan, K. Z. M., Hashim, K., J. Appl. Polym.
Sci. 73, 2095-2102 (1999). 5. Hegazy, E. A., Dessouki, A. M., Rabie, A. M., Ishigaki, I., J. Polym. Sci. Polymer
Chem Ed. 22, 3673-3685 (1984). 6. Burger, W., Lunkwitz, K., Pompe, G., Petr, A., Jehnichen, D., J. Appl. Polym. Sci.
48, 1973-1985 (1993). 7. Sun, J., Zhang, Y., Zhong, X., Zhang, W., Radiat. Phys. Chem. 42, 139-142 (1993). 8. Schneider, E. E., J. Chem. Phys. 23, 978 (1955). 9. Tamura, N., J. Chem. Phys. 37, 479-484 (1962). 10. Siegel, S., Hedgpeth, H., J. Chem. Phys. 46, 3904-3912 (1967). 11. Lovejoy, E. R., Bro, M. I., Bowers, G. H., J. Appl. Polym. Sci. 9, 401-440 (1965). 12. Momose, Y., Tamura, Y., Ogino, M., Okazaki, S., Hirayama, M., J. Vac. Sci.
Technol. A 10, 229-238 (1992). 13. Ranby, B., Rabek, J. F. ESR Spectroscopy in Polymer Research; Springer-Verlag:
Berlin, 1977. 14. Weil, J. A., Bolton, J. R., Wertz, J. E. Electron Paramagnetic Resonance:
Elementary Theory and Practical Applications; Wiley-Interscience: New York, 1994.
15. Ingram, D. J. E. Free Radicals as Studied by Electron Spin Resonance;
Butterworths scientific publications: London, 1958. 16. Ayscough, P. B. Electron Spin Resonance in Chemistry; Methuen: London, 1967. 17. Lau, S. F., Suzuki, H., Wunderlich, B., J. Polym. Sci., Polym. Phys. Ed. 22, 379-405
(1984). 18. Oshima, A., Seguchi, T., Tabata, Y., Radiat. Phys. Chem. 50, 601-606 (1997).

Chapter 2 Radical Formation in PFA 66
19. Toriyama, K., Iwasaki, M., J. Phys. Chem. 79, 2919-2924 (1969). 20. Hill, D. J. T., Mohajerani, S., Pomery, P. J., Whittaker, A. K., Radiat. Phys. Chem.
59, 295-302 (2000). 21. Kim, S. S., Liang, R. H. Effects of Ultraviolet and Vacuum Ultraviolet Irradiation
on Fluorinated Ethylene-propylene Copolymers. In: Radiation Effects on Polymers; Clough, R. L.; Shalaby, S. W. Eds.; American Chemical Society: Washington, 1991; pp. 135-145.
22. Carlson, D. P., Schmiegel, W. Fluoropolymers, Organic. In: Ullmann's
Encyclopedia of Industrial Chemistry; VCH Verlag: Weinheim, 1998; Vol. A11. 23. Iwasaki, M., Toriyama, K., Sawaki, T., Inoue, M., J. Chem. Phys. 47, 554-559
(1967). 24. Matsugashita, T., Shinohara, K., J. Chem. Phys. 35, 1652-1656 (1961). 25. Rasoul, F. A., Hill, D. J. T., George, G. A., O'Donnell, J. H., Polym. Adv. Tech. 9,
24-30 (1998). 26. Schlick, S., Chamulitrat, W., Kevan, L., J. Phys. Chem. 89, 4278-4282 (1985). 27. Olivier, D., Marachi, C., Che, M., J. Chem. Phys. 75, 3348-3353 (1980). 28. Allayarov, S. R., Mikhailov, A. I., Barkalov, I. M., High Energy Chem. 34, 141-144
(2000). 29. Starkweather, H. W., Avakian, P., Matheson, R. R., Fontanella, J. J.,
Wintersgill, M. C., Macromolecules 24, 3853-3856 (1991).

Chapter 3
3 Structural Changes in γ-Irradiated PFA: High-Speed MAS 19F NMR
3.1 Introduction
When a polymer substrate is grafted to using the radiation- induced grafting method excess
radicals will invariably be formed in the substrate. If a deeply-penetrating form of radiation
is used, such as γ-radiation, radicals may be produced in regions below the surface which
may be inaccessible to the monomer. Instead of these radicals participating in grafting
reactions, they may act as precursors to formation of new structures. The identification of
new structures in radiation-treated polymers can be determined using non-destructive
techniques such as nuclear magnetic resonance (NMR) spectroscopy and fourier transform
infrared (FTIR) spectroscopy.
High-resolution NMR spectroscopy has become a prerequisite for microstructural
investigations of polymers. Unfortunately, no t all polymers are easily analyzed by NMR
spectroscopy. Apart from those which are either soluble or have low viscosity at low
temperature, solid-state NMR must be used. In polycrystalline polymers where the
molecules have restricted mobility, tensorial NMR interactions such as chemical shift
anisotropy (CSA) and dipolar couplings are manifested in broadening of the resonance
lines. Advances in solid-state NMR spectroscopy, such as magic angle spinning (MAS)
where the sample is spun at high speed along an axis inclined at the magic angle (54.74°)
from the direction of the external magnetic field Bo, have overcome problems such as
chemical shift anisotropy and weak dipole–dipole interactions which permits obtaining a
“liquid- like” spectrum for polycrystalline solids. However, fluoropolymers pose the
additional problem of strong dipole–dipole interactions from the abundant 19F nuclei
leading to severe line-broadening when the experiment is run under standard MAS
conditions.

Chapter 3 Structural Changes in γ-Irradiated PFA 68
Of the two NMR-active nuclei present in perfluoropolymers, namely 13C and 19F, 19F is the most attractive to study given its 100 % natural isotropic abundance, large
magnetogyric ratio and large chemical shift range of about 400 ppm. Observation of the 13C
nucleus in fluoropolymers poses difficulties due the small chemical shift range and low
natural abundance. Poly(tetrafluoroethylene-co-perfluoromethyl vinyl ether) (TFE/PMVE)
has been studied by 13C NMR spectroscopy using MAS and cross-polarization (transfer of
magnetization from one nuclei to another to improve signal to noise) although the
linewidths were broad due to 13C–19F dipolar couplings.1 Recently, high-resolution 13C
NMR spectra of PTFE were reported using rotation-synchronized 19F 180° pulses which
refocuses the 19F–13C J-couplings but not the dipolar interactions.2
The first high-resolution NMR spectrum of a semicrystalline fluoropolymer was
reported in 1979 and was not a solid-state spectrum but rather a molten-state spectrum.
English and Gaza demonstrated this technique by acquiring well resolved spectra, with
linewidths of ~ 300 Hz, for PTFE, FEP and ETFE while in the melt.3 This method failed to
gain popularity due to the specialised equipment necessary to heat samples in the NMR
probe to such extreme temperatures and the possibility of thermal degradation of the
samples. In addition, since fluoropolymers have the greatest application while in the solid-
state, it is desirable to be able to analyse the polymer as a solid and not in the molten form.
In 1986, Maciel and coworkers used a combination of MAS and fast spinning
speeds (up to 23 kHz) to average the CSA and dipole–dipole interactions to obtain
high-resolution spectra of poly(chlorotrifluoroethylene) (PCTFE).4 This technique has since
gained popularity for the study of other fluoropolymers. Recently, solid-state high-speed
MAS 19F NMR has been used to characterize PTFE irradiated at room temperature,5 PTFE
irradiated in the melt,5,6 and FEP irradiated below and above the Tg.7
The effect of temperature and molecular motion in PTFE on the radiation products
have received much attention in recent years after the discovery that PTFE could be
crosslinked if irradiated in the melt in an inert atmosphere.8-10 When PTFE is irradiated
below the melting temperature, it does not crosslink, either in the amorphous or crystalline
regions, presumably due to the lack of mobility of the macro-radicals. During irradiation at
low temperature the polymer degrades and the molecular weight decreases to 1/10 of the

Chapter 3 Structural Changes in γ-Irradiated PFA 69
original after just 2 kGy at room temperature or 8 kGy at 77 K. In the molten state
crosslinks are able to form in the polymer by combination reactions between the freely
moving macro-radicals.11
In this chapter high-speed MAS NMR has been used for the first time to investigate
the new structures formed in the non-volatile component of PFA after exposure to
γ-radiation over the temperature range 303 to 573 K in vacuum, as well as in air at 303 K.
The volatile component has been studied using FTIR spectroscopy and mass spectrometry
(MS).
3.2 Theory and Technical Aspects
19F NMR spectroscopy of solid, semicrystalline fluoropolymers suffers from severe line
broadening effects from two sources under normal conditions, namely dipole–dipole
interactions, and chemical shift anisotropy (CSA). Both of these effects can be averaged
using a combination of magic angle spinning (MAS) and high-speed spinning.
Of the two sources of line broadening, the most influential are the dipole–dipole
interactions. Fluoropolymers have a high concentration of spins due to the 100 % natural
abundance of spin ½ 19F nuclei. Perfluorinated polymers do not contain protons and the
only other spin ½ nuc leus is the isotopically rare 13C nucleus so that almost all of the
dipolar interactions are homonuclear between 19F nuclei. In solid samples, unlike liquids or
solutions, the dipole–dipole interactions do not average to zero due to the restricted motion.
Since the resonance frequency of a particular nucleus depends on the magnetic field at its
site, and since the local field due to neighbouring spins varies appreciably from place to
place throughout the sample owing to a variation in the orientation of the neighbouring
spins, there will be a significant spread in the resonance frequencies. This results in a line
broader by several orders of magnitude than a typical line from a liquid sample.
CSA is similar to dipole–dipole line broadening in that it is a result of variation in
orientation in polycrystalline samples. Since the chemical shift may depend on the
orientation of the molecule with respect to the external magnetic field, the variation in

Chapter 3 Structural Changes in γ-Irradiated PFA 70
molecular orientation from crystal to crystal results in a continuous spread in the shifted
lines.
The dipole–dipole interactions and CSA can be averaged under MAS orientation
when the spinning speeds exceed the strength of the interactions measured in units of
frequency. The static linewidth of CF2 of fluoropolymers is in the order of 20 kHz12,13 so
that a spinning speed in excess of this value is required to achieve full line narrowing.
Recent hardware developments by probe manufactures has allowed these speeds to be
routinely achieved.
3.3 Experimental
3.3.1 NMR Spectroscopy
PFA (DuPont, code TE 7132 pellets) samples were exposed to γ-radiation at either the
Australian Nuclear Science and Technology Organisation (ANSTO) in a pond facility or at
the University of Queensland using a 220 Nordian Gammacell. Irradiation at 303 K was
performed using a dose rate of 5.9 kGy hr-1, while irradiation at higher temperature was
performed using a dose rate of 1.5 kGy hr-1. Samples to be irradiated in vacuum were
evacuated at 1 × 10⁻² Pa in glass tubes for 24 hours before being sealed. All samples with
the exception of the samples irradiated in the presence of air were heated at 473 K after
irradiation for 2 hours to remove the majority of the radicals before being opened to the
atmosphere. Samples irradiated in the presence of air were not thermally treated after
irradiation. All samples were cryogenically milled into powders for NMR analysis.
Single-pulse NMR experiments were performed using a Bruker 300 MHz NMR
spectrometer with a H/F-X BL 2.5 probe with the high-frequency channel tuned to 19F,
operating at a 19F resonance frequency of 282 MHz. Samples were spun at a frequency of
32 kHz at the magic angle using a 2.5 mm outer diameter rotor. The recycle time used
(10 seconds) was long enough to obtain quantitative integrated peak intensities. Spectra
were acquired using a p/2 pulse duration of 3 µs. The 19F chemical shifts were reported
relative to the CF2 signal of PTFE at –122 ppm which was externally referenced to CFCl3.

Chapter 3 Structural Changes in γ-Irradiated PFA 71
The broad signal due to static fluorine in probe materials was removed using a spline
baseline correction algorithm.
Hahn echo experiments were performed using a MSL 300 spectrometer operating at
282 MHz with a Doty Scientific triple-resonance MAS probe. Samples were spun at a
frequency of 20.5 kHz at the magic angle using a 4 mm outer diameter rotor. The spin-echo
experiment is described by the pulse sequence:
p/2 – τD – p – τ D – echo
Spectra were acquired using a p/2 pulse duration of 6 µs and a total echo time of 10 ms.
The method of referencing and removal of the static fluorine signal was the same as for the
single-pulse experiments.
FTIR spectra of the non-volatile component were recorded on a Bio-Rad FTS-155
spectrometer. Samples were prepared by pressing PFA pellets under 4 tonnes of pressure at
room temperature. Intensities in the spectra were normalized to the CF2 backbone overtone
at 2365 cm-1.
3.3.2 Analysis of Volatile Products
3.3.2.1 Irradiation Gaseous products evolved from PFA (DuPont, milled TE 7132 pellets) and PTFE (Aldrich,
beads) after irradiation to 350 kGy in vacuum at 303 K were analyzed using FTIR
spectroscopy and MS. For both FTIR and MS analysis, the samples (100 mg for each
experiment) were evacuated at 1 × 10⁻² Pa for 24 hours before being sealed and irradiated.
For FTIR spectroscopy analysis, the samples were in small thin-walled ampoules, while for
MS analysis, the samples were in Pyrex tubes each fitted with a break seal connected to a
B10 adaptor.

Chapter 3 Structural Changes in γ-Irradiated PFA 72
3.3.2.2 FTIR Spectroscopy
FTIR spectra were recorded using a Perkin Elmer 1600 series FTIR with a sample cell of
dimensions: 150 mm length × 10 mm ID, fitted with KBr discs at each end. Teflon tubing
was used to connect the sample cell to a cylinder of argon gas. A small ampoule containing
irradiated PFA or PTFE was placed in the tubing as close to the sample cell as possible.
The sample cell was flushed with argon gas for 20 minutes before the sample cell and the
tubing containing the ampoule was isolated by sealing the tubing using clamps. After
acquiring a background spectrum, the ampoule was crushed, allowing the gases produced
during irradiation to diffuse into the sample cell. Spectra were acquired at regular intervals
after the ampoule was crushed. 32 scans were recorded for each spectrum at a resolution of
4 cm-1.
3.3.2.3 Mass Spectrometry
Mass spectra were recorded using a Balzers ThermoCube MSC200 MS-Cube. Irradiated
samples were connected to the MS through a B10 adaptor and a break seal opened using a
metal slug inside a glass casing. A secondary electron multiplier detector was used at a
voltage of 1000 V. A background spectrum was recorded before opening the break seal and
subtracted from the spectra after introduction of the gases to the MS.
3.4 Results and Discussion
3.4.1 Effect of Spinning Speed
High-speed MAS NMR spectroscopy is a relatively new technique. The effect of spinning
speed on the NMR spectrum is demonstrated in Figure 3.1 for a sample of irradiated PFA.
The narrowing of the lines and spacing of the spinning sidebands of the CF2 peak at
–122 ppm, separated by the spinning speed, can be observed as the dipole–dipole
interactions and CSA are averaged. Full assignments of the peaks will be made in
Section 3.4.3.1.

Chapter 3 Structural Changes in γ-Irradiated PFA 73
(ppm)
-350-300-250-200-150-100-50050
Figure 3.1 Effect of spinning speed. From top to bottom: static; 3 kHz; 9 kHz; 13.5 kHz; 19.5 kHz.

Chapter 3 Structural Changes in γ-Irradiated PFA 74
3.4.2 Untreated PFA
The 19F NMR spectrum of untreated PFA shown in Figure 3.2 is dominated by the CF2
peak at –122 ppm. An expansion of the region between –50 and –210 ppm reveals a
number of small peaks due to the comonomer units. Assignments are shown in Table 3.1 which were made according to tables of chemical shifts14a,b and on the expected peak area
ratios. The perfluoroalkoxy comonomer was identified as perfluoropropyl vinyl ether
(PPVE). The fraction of this comonomer was determined from the relative peak area of the
PPVE groups to TFE groups. The mole percent of the comonomer in untreated PFA was
1.7 ± 0.2 %.
(ppm) -300 -250 -200 -150 -100 -50 0 50
* *
(ppm)
-200-180-160-140-120-100-80-60
2
5
3
4
1
Figure 3.2 High-speed 19F MAS NMR spectrum of PFA. Top: full spectrum; spinning sidebands denoted
with an asterisk, Bottom: expansion of –50 to –210 ppm region with 10 times vertical expansion.
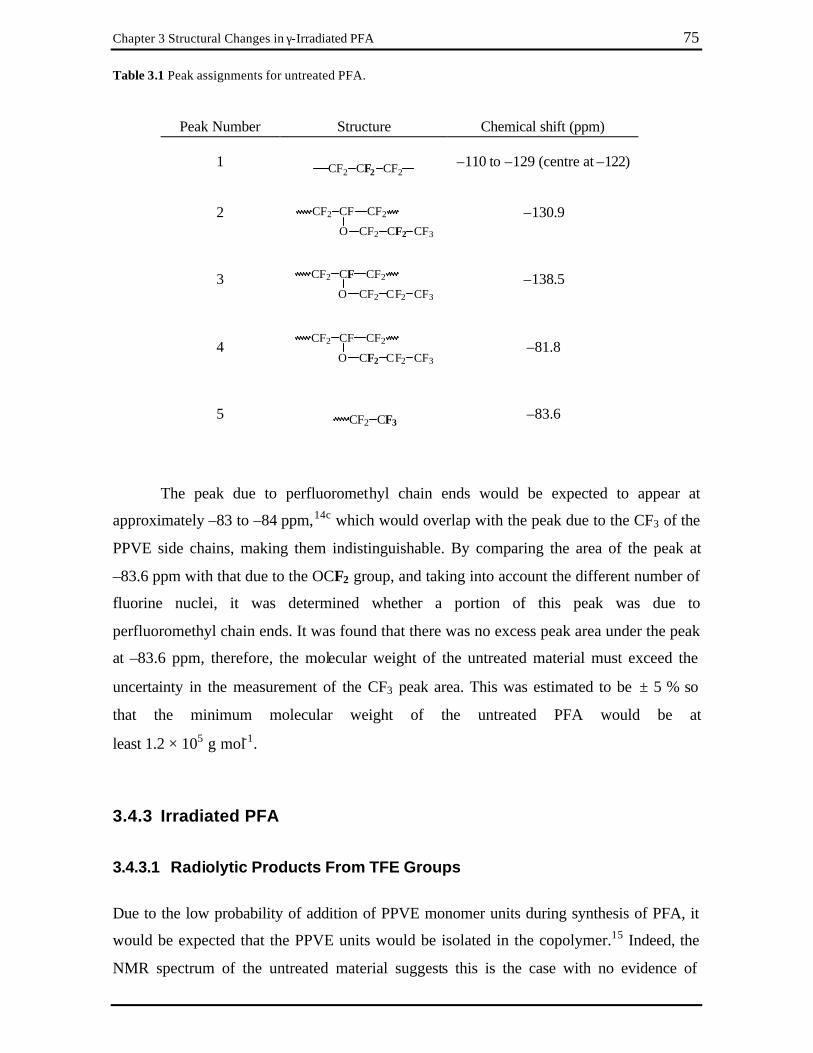
Chapter 3 Structural Changes in γ-Irradiated PFA 75
Table 3.1 Peak assignments for untreated PFA.
Peak Number Structure Chemical shift (ppm)
1
2
3
4
5
CF2 CF2 CF2
CF2 CF CF2
O CF2 CF2 CF3
CF2 CF CF2
O CF2 CF2 CF3
CF2 CF CF2
O CF2 CF2 CF3
CF2 CF3
–110 to –129 (centre at –122)
–130.9
–138.5
–81.8
–83.6
The peak due to perfluoromethyl chain ends would be expected to appear at
approximately –83 to –84 ppm,14c which would overlap with the peak due to the CF3 of the
PPVE side chains, making them indistinguishable. By comparing the area of the peak at
–83.6 ppm with that due to the OCF2 group, and taking into account the different number of
fluorine nuclei, it was determined whether a portion of this peak was due to
perfluoromethyl chain ends. It was found that there was no excess peak area under the peak
at –83.6 ppm, therefore, the molecular weight of the untreated material must exceed the
uncertainty in the measurement of the CF3 peak area. This was estimated to be ± 5 % so
that the minimum molecular weight of the untreated PFA would be at
least 1.2 × 10⁵ g mol-1.
3.4.3 Irradiated PFA
3.4.3.1 Radiolytic Products From TFE Groups
Due to the low probability of addition of PPVE monomer units during synthesis of PFA, it
would be expected that the PPVE units would be isolated in the copolymer.15 Indeed, the
NMR spectrum of the untreated material suggests this is the case with no evidence of

Chapter 3 Structural Changes in γ-Irradiated PFA 76
sequence effects. Given that the PFA used was composed of 98.3 ± 0.2 mol. %
tetrafluoroethylene (TFE) units, the majority of the radiolytic products would be expected
to be the same as for PTFE, although the different morphology, glass transition, and
crystalline melting temperatures of PFA may be expected to affect the temperature at which
various products are formed. Fuchs and Scheler5 and Katoh et al.6 have both reported the
high-speed 19F MAS NMR of irradiated PTFE. Katoh et al. used spinning speeds of 12 and
15 kHz, and while at these speeds the spinning sidebands overlapped with the peaks of
interest, by using two spinning speeds the spinning sidebands were shifted so that between
the two spectra recorded at different speeds most of the isotropic peaks could be observed.
Fuchs and Scheler used higher spinning speeds of 35 kHz to remove the spinning sidebands
altogether from the region of interest.
When PTFE was irradiated at room temperature, Fuchs and Scheler observed just
two new peaks at approximately –82 and –126 ppm, which were attributed to new –CF2CF3
chain ends. For PTFE irradiated in the melt, Fuchs and Scheler5 and Katoh et al.6 observed
a number of new structures which were consistent with branching, inc luding CF3 side
groups and Y-branching points. Chain end structures included CF3 groups on saturated
chain ends, COF end groups, and CF3 groups adjacent to double bonds. Fuchs and Scheler
concluded that PTFE undergoes net crosslinking when irradiated in the melt based on the
excess of branch points over chain ends. Katoh et al. measured the crosslinking density and
G values of crosslinking based only on the intensity of the tertiary CF peak, which does not
distinguish between crosslinks and long-chain branches.
Figure 3.3 A-D shows the 19F NMR spectra of the non-volatile products of PFA
irradiated with γ-radiation to 1 MGy at 303, 473 and 573 K, all in vacuum. The peak
assignments are shown in Table 3.2 as well as a comparison with the assignments made by
Katoh et al. and Fuchs and Scheler for PTFE irradiated in the melt. The major products
formed from radiolysis are the same as in PTFE irradiated in the melt, although in different
proportions depending on the radiation temperature. Spectra of samples irradiated to other
doses (not shown) indicate the same structures, only in different proportions for each
respective temperature. The lowest dose used was 0.5 MGy, below which the sensitivity
and dynamic range of the NMR experiment were not sufficient to observe any new peaks.

Chapter 3 Structural Changes in γ-Irradiated PFA 77
(ppm) -200 -150 -100 -50
Figure 3.3 19F MAS NMR of PFA: (A) untreated PFA, (B) irradiated to 1 MGy at 303 K, (C) irradiated to
1 MGy at 473 K, (D) irradiated to 1 MGy at 573 K. Spinning sidebands from the peak assigned to CF3 groups
at –83.6 ppm are denoted by an asterisk.
A
B
C
*
D
*
*
*
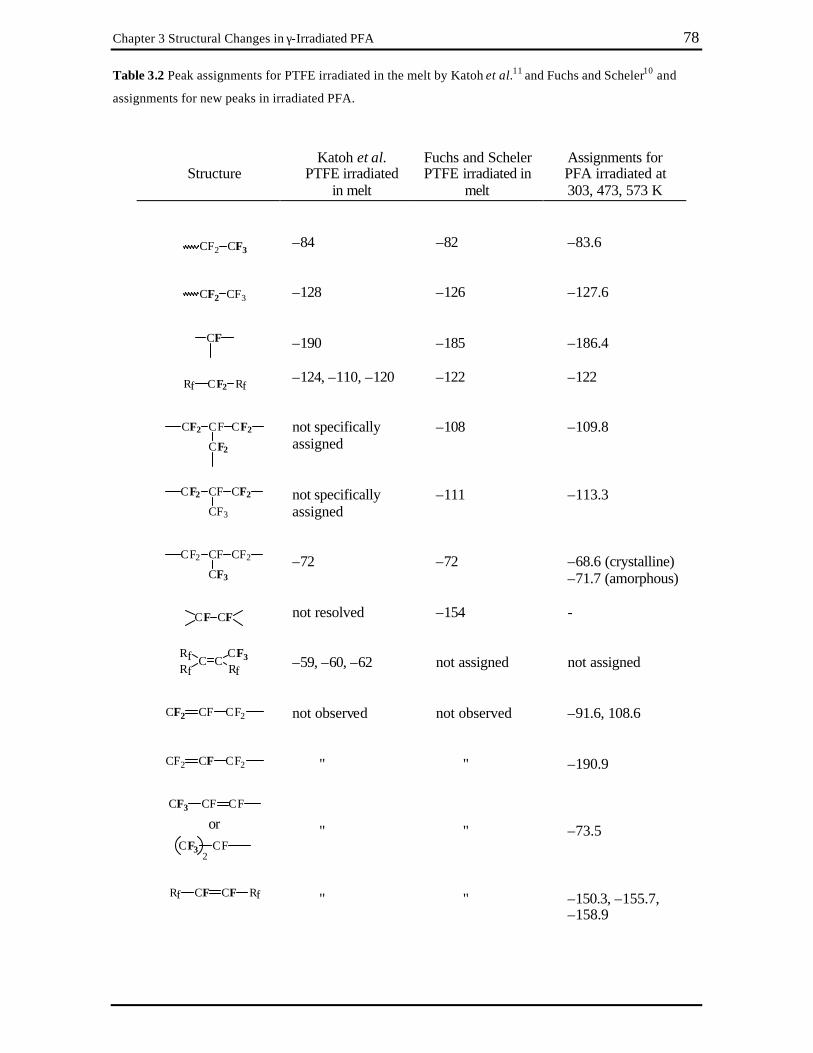
Chapter 3 Structural Changes in γ-Irradiated PFA 78
Table 3.2 Peak assignments for PTFE irradiated in the melt by Katoh et al.11 and Fuchs and Scheler10 and
assignments for new peaks in irradiated PFA.
Structure
Katoh et al. PTFE irradiated
in melt
Fuchs and Scheler PTFE irradiated in
melt
Assignments for PFA irradiated at 303, 473, 573 K
CF2 CF3
CF2 CF3
CF
Rf CF2 Rf
CF2 CF CF2
CF2
CF2 CF CF2
CF3
CF2 CF CF2
CF3
CF CF
C C
RfRf CF3
Rf
CF2 CF CF2
CF2 CF CF2
CF3 CF CF or
CF3 CF2
Rf CF CF Rf
–84 –128 –190 –124, –110, –120 not specifically assigned not specifically assigned –72 not resolved –59, –60, –62 not observed " " "
–82 –126 –185 –122 –108 –111 –72 –154 not assigned not observed " " "
–83.6 –127.6 –186.4 –122 –109.8 –113.3 –68.6 (crystalline) –71.7 (amorphous) - not assigned –91.6, 108.6 –190.9 –73.5 –150.3, –155.7, –158.9

Chapter 3 Structural Changes in γ-Irradiated PFA 79
Two new peaks at –71.7 and –68.6 ppm were observed in the spectra in
Figure 3.3 B-D. These were assigned to CF3 side chains in different morphological
environments based on their different T2 relaxation times implied from the Hahn echo
experiment shown in Figure 3.4. In the Hahn echo experiment the peaks decreased in
intensity compared with the single pulse experiment due to the spin-spin or T2 relaxation
times of the nuclei. More mobile groups, for example chain ends, have longer T2 times and
their respective peaks will decrease in intensity less than peaks attributed to less mobile
(shorter T2 relaxation times) species in the Hahn echo experiment. The peaks over the range
–108 to –128 ppm associated with the in-chain methylene CF2 groups were significantly
attenuated relative to the more mobile fluoromethyl peaks. The peak at –68.6 ppm had a
shorter T2 relaxation time than the peak at –71.9 ppm, suggesting that the CF3 side chain
due to the former is less mobile and perhaps incorporated into the crystalline lattices,
whereas the latter are due to CF3 side chains in the more mobile amorphous regions. It has
been shown by several authors that CF3 groups can be incorporated into the crystalline
lattice as point defects in FEP.16-18 The same two peaks have been observed in untreated
FEP and the different T1? times measured supporting this assignment.19
It is known that the crystallinity of PTFE irradiated in the melt decreases with
increasing dose,10 and as a result of this the appearance changes from opaque to
transparent.20 Although unassigned by Fuchs and Scheler, the spectra of PTFE irradiated in
the melt includes a peak at –68 ppm, which decreases in intensity compared to the peak at
–72 ppm with increasing dose and crosslinking, supporting the assignment of the peak at
–68.6 ppm as being due to CF3 side chains within the crystal lattices. The same peak was
not resolved in the spectra of Katoh et al. due to incomplete averaging of dipole-dipole
couplings at the lower spinning speeds used. Adjacent to the two CF3 side chain peaks in
the spectra in Figure 3.3 B-D is a peak at –73.5 ppm with very long T2, suggesting it is due
to a structure on the end of a chain – possibly due to either CF3– groups adjacent to a
double bond14c or –CF(CF3)2 groups.14d

Chapter 3 Structural Changes in γ-Irradiated PFA 80
Chemical Shift (ppm)
-160-150-140-130-120-110-100-90-80-70-60
A
B
Figure 3.4 Hahn echo experiment of PFA irradiated to 1 MGy at 573 K. (A) Single -pulse experiment;
(B) Hahn echo experiment. The spectra were normalized to the peak at –83.6 ppm.
The formation of unsaturated groups in PFA samples irradiated at 473 and 573 K
has been confirmed using FTIR spectroscopy (Figure 3.5). The band at 1785 cm-1 was
attributed to terminal double bonds while bands at 1730 and 1717 cm-1 were attributed to
internal double bonds.21,22 Previously, Fisher and Correlli23 postulated that similar bands
between 1735 and 1715 cm-1 observed in the IR spectra of irradiated PTFE were due to
branching points. However, in this case the assignment by Lappan et al.22 and
Lunkwitz et al.21 of these bands as being due to internal double bonds was favoured and is
supported by NMR evidence. In addition, it was also observed that the samples irradiated at
573 K changed from translucent to black, suggesting some conjugation of double bonds.
Similar observations were made by Tutiya24 for PFA irradiated under analogous conditions
to that used here. To prove that the colour change was due to radiation and heat, a control
sample was heated at 573 K for a time corresponding to the radiation time and it was found
that it did not discolour or reveal any new peaks by NMR spectroscopy.
CF2 CF CF2
CF3
crystalline
amorphous
CF3 CF CF CF2
CF3 CF
or

Chapter 3 Structural Changes in γ-Irradiated PFA 81
Wavelength (cm-1)
160016501700175018001850190019502000
a
b
cd
1730, 1717 -CF=CF-
1785 CF=CF2 1775 COOH(a)
1884 COF1814 COOH(f)
Figure 3.5 FTIR spectra of PFA: (a) untreated, (b) irradiated to 0.5 MGy at 303 K, (c) irradiated to 0.5 MGy
at 473 K, (d) irradiated to 0.5 MGy at 573 K. Assignments were made according to Lappan et al.,22 Lunkwitz
et al.,21 and Carlson.25
In the 19F MAS NMR spectra of PTFE irradiated in the melt, Fuchs and Scheler
assigned the peak at –154 ppm to >CF–CF<, while this peak was not resolved in the
spectra of Katoh et al. This type of structure seems doubtful due to the unlikelihood of
combination of alkyl radicals,11,26 therefore this peak, as well as peaks at –150.3 and –158.9
ppm in Figure 3.5 B-D, have been assigned to either –CF=CF–CF3 or –CF=CF– groups on
the basis of tabulated chemical shifts in the literature.14c Observation of the terminal
unsaturated group peaks was less ambiguous; the peaks at –91.6 and –108.6 ppm were
assigned to the fluoromethylene group, and the peak at –190.9 ppm was assigned to the
fluoromethine group of the unsaturated group –CF=CF2.14a
A number of relatively small peaks in the region –54 to –64 ppm appeared in the
NMR spectra of PFA samples irradiated across the temperature range studied. An
expansion of this region is shown in Figure 3.6. The most prominent peak in the spectrum
of PFA irradiated in air (Figure 3.6 A) in this region is the peak at –57.8 ppm. This was
assigned to an oxygenated species, –OCF3 on a chain end,27 which was also seen as a small
peak when PFA was irradiated at 303 K under vacuum (Figure 3.6 B). As the irradiation
temperature was increased, the proportions of these peaks changed and new peaks at –59.1,

Chapter 3 Structural Changes in γ-Irradiated PFA 82
–61.4 and –63.4 ppm became significant. Peaks in this region have also been observed in
the spectra of Katoh et al. and Fuchs and Scheler for PTFE irradiated in the melt and in
FEP irradiated at 300 and 363 K.7 Attempts to assign these peaks have not been made
except by Katoh et al. who postulated that the peaks at –59, –60 and –62 ppm are due to a
CF3 group adjacent to a double bond at a branch point.6 However, in earlier work with
fluoro-oligomers Katoh et al. assigned peaks with similar chemical shifts to >C=CF2 and
–C(CF3)3.28 In this work these peaks cannot be unequivocally assigned at this stage without
further data.
CF3 O CF2
-72 -68 -64 -60 -56 -52 Chemical Shift (ppm)
Figure 3.6 19F MAS NMR of PFA: expansion of the region from –50 to –75 ppm: (A) PFA irradiated to
1 MGy at 303 K in air, (B) PFA irradiated to 1 MGy at 303 K in vacuum, (C) irradiated to 1 MGy at 473 K in
vacuum, (D) irradiated to 1 MGy at 573 K in vacuum.
A
B
C
D

Chapter 3 Structural Changes in γ-Irradiated PFA 83
The peak at –186.4 ppm was assigned to CF branch points. These will be associated
with both the fluoromethyl short branches and longer branches. In Chapter 2 both the
main-chain (–CF2–C•F–CF2–) and end-chain radicals (–CF2–C•F2) were identified in PFA
irradiated in vacuum. Formation of long branches may occur when these two radicals
combine. To form short CF3 side chains, it is postulated that •CF3 radicals or
difluorocarbene radicals (:CF2) directly combine with the main-chain radical. The
difluorocarbene radical has been postulated as the product of “unzippering” during thermal
degradation of PTFE29 and FEP.30
3.4.3.2 Radiolytic Products From PPVE Groups
The products formed from the perfluoropropyl vinyl ether (PPVE) groups in PFA are not as
evident as the products from extended sequences of TFE units due to the low amount of
PPVE present in the untreated material. The relative peak area of peaks at –138.5, –81.8,
and –130.9 ppm decreased with increasing dose at all the temperatures studied, implying
that alkoxy side chains were being consumed. Scheme 3.1 shows all the possible products
from bond scission at the PPVE units. Peaks due to acyl fluoride groups (pathways 1 and 3)
were observed at +23 ppm (not shown) in samples irradiated at 303 K and decreased in
intensity with increasing irradiation temperature. Further reaction of the acyl fluoride with
atmospheric moisture would form a carboxylic acid group. Due to overlapping signals, no
peak due to the –CF2COOH group was resolved in the NMR spectra (expected
–118 ppm31), although –COOH (1775 cm-1 (hydrogen-bonded form) and 1814 cm-1 (free
form)) as well as –COF (1884 cm-1) were observed in the FTIR spectra (Figure 3.5).

Chapter 3 Structural Changes in γ-Irradiated PFA 84
CF2 CF CF2
O CF2 CF2 CF3
1
2
3 4 5
1 2 3 4 5
CF2 CF
O C3F7
.+ CF2
.
CF2 CF
O
CF2 CF2 OC3F7
CF2 CF CF2.
CF2 CFCF2
.
CF3
CF2 CF CF2
O.
CF2 CF
O
CF2.
H2O
CF2 COOH
CF2 CF CF2
O CF2.
CF2 CF CF2
O CF3
CF2 CF CF2
O CF2 CF2
CF2 CF CF2
O CF2 CF3
.
Scheme 3.1 Possible pathways of the PPVE units during radiation treatment of PFA.
Pathways 4 and 5 in Scheme 3.1 would yield methyl ether and ethyl ether side chains,
respectively. The expected chemical shift for the methyl ether (–OCF3) is –52.4 ppm,1
while the expect chemical shifts for the ethyl ether are –87.6 and –86.0 ppm14b,e for the
OCF2CF3 and OCF2CF3 groups, respectively. It was difficult to identify peaks at these
chemical shifts above the noise in the single-pulse experiments. In the Hahn echo
experiment (Figure 3.4) enhancement of peaks at –87.6 and –86.0 ppm was observed
allowing identification of the ethyl ether in small amounts. The enhancement of the ethyl
ether peaks in the Hahn echo experiment is indicative of their location in the amorphous
regions, as would be expected. Curiously, no –OCF3 side chain of the methyl ether was
seen at –52.4 ppm, suggesting that either pathway 4 is not important or that the methyl
ether is not the end product.
3.4.4 G Values
The radiation chemical yields for the formation of the new chemical structures were
expressed as G values, which are the number of new structures formed on the deposition of
16 × 10-18 J (16 aJ or 100 eV) of energy. The G values were calculated from plots of the
number of new functional groups against dose for PPVE units, short CF3 side chains, long
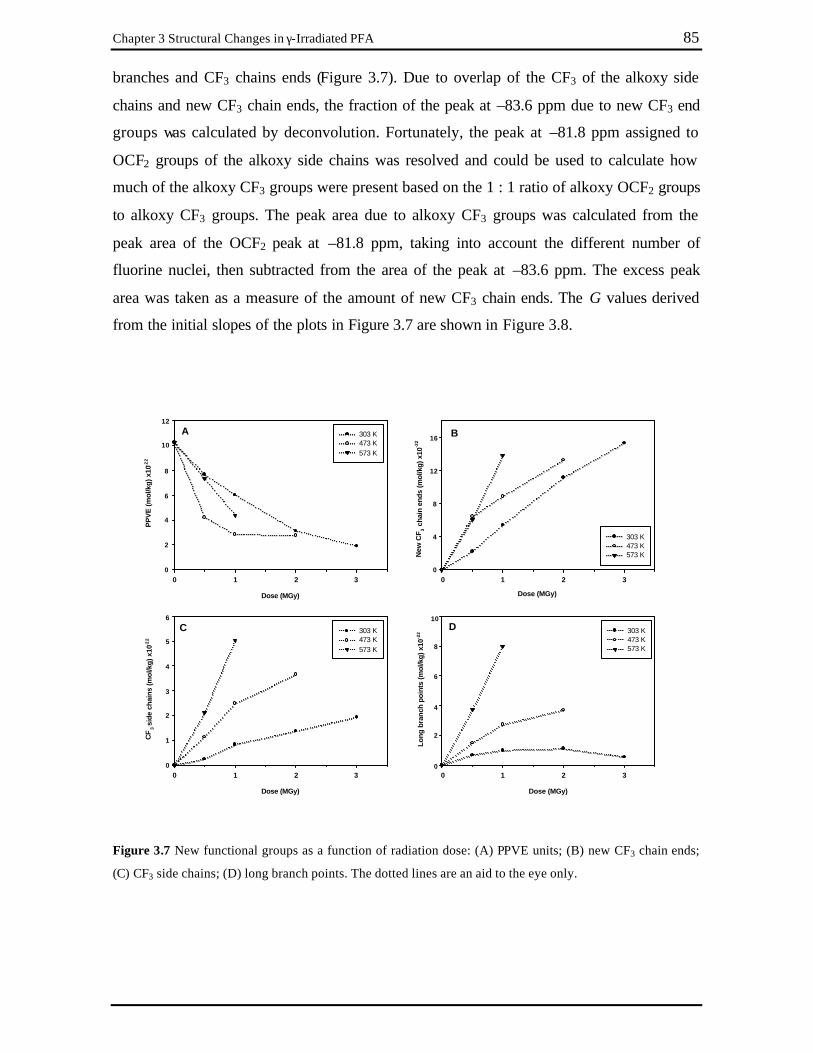
Chapter 3 Structural Changes in γ-Irradiated PFA 85
branches and CF3 chains ends (Figure 3.7). Due to overlap of the CF3 of the alkoxy side
chains and new CF3 chain ends, the fraction of the peak at –83.6 ppm due to new CF3 end
groups was calculated by deconvolution. Fortunately, the peak at –81.8 ppm assigned to
OCF2 groups of the alkoxy side chains was resolved and could be used to calculate how
much of the alkoxy CF3 groups were present based on the 1 : 1 ratio of alkoxy OCF2 groups
to alkoxy CF3 groups. The peak area due to alkoxy CF3 groups was calculated from the
peak area of the OCF2 peak at –81.8 ppm, taking into account the different number of
fluorine nuclei, then subtracted from the area of the peak at –83.6 ppm. The excess peak
area was taken as a measure of the amount of new CF3 chain ends. The G values derived
from the initial slopes of the plots in Figure 3.7 are shown in Figure 3.8.
Dose (MGy)
0 1 2 3
PP
VE
(mol
/kg)
x10
-22
303 K473 K573 K
Dose (MGy)
0 1 2 3
Long
bra
nch
poin
ts (m
ol/k
g) x
10-2
2
Dose (MGy)
0 1 2 3
New
CF 3
cha
in e
nds
(mol
/kg)
x10
-22
303 K473 K573 K
Dose (MGy)
0 1 2 3
CF
3 sid
e ch
ains
(mol
/kg)
x10
-22
303 K473 K573 K
303 K473 K573 K
0 0
0 0
2
2
2
4
64
4
1
3
5
6
4
8
10
6
8
10
12
8
12
16A B
C D
Figure 3.7 New functional groups as a function of radiation dose: (A) PPVE units; (B) new CF3 chain ends;
(C) CF3 side chains; (D) long branch points. The dotted lines are an aid to the eye only.

Chapter 3 Structural Changes in γ-Irradiated PFA 86
G-v
alue
-2.0
-1.5
-1.0
-0.5
0.0
0.5
1.0
1.5
2.0
2.5
303 K473 K573 K
PPVE
CF3 side chains
long branch points new CF3
chain ends
Figure 3.8 G values for PPVE, CF3 side chains, long branch points and new chain ends for irradiation
temperatures of 303, 473 and 573 K.
From Figure 3.8 it is clear that the number of branch points increased with
irradiation temperature. The relationship between molecular mobility and formation of
branches in PTFE has been reported by Tabata et al.11 who postulate that branched
structures can only occur when the end-chain and main-chain radicals have sufficient
mobility to move freely and combine. In PTFE this only occurs when it is in the molten
form. The only new structures identified in PTFE irradiated at room temperature were
–CF2CF3 chain ends,5 whereas in PFA irradiated at 303 K a small number of structures
associated with branching as well as chain ends were observed. The Tg of PFA is 363 K as
measured by dynamic mechanical analysis (DMA), although it is a broad transition with the
onset at approximately 300 K. The small amount of branched structures identified in the
sample irradiated at 303 K was presumably due to an increase in mobility of the amorphous
regions at this temperature. At 473 K the PFA is well above the Tg so that the radicals in the
amorphous regions could move freely and form branched structures in an analogous
manner to the formation of branches in PTFE in the molten state. At 573 K the PFA was at
the onset of the crystalline melting transition, permitting additional chain mobility within
the crystallites, which led to more branching.
While the NMR spectra showed the existence of branching, it was not clear whether
a crosslinked network had been formed or simply a highly branched system. The G values

Chapter 3 Structural Changes in γ-Irradiated PFA 87
for new CF3 chain ends were greater than the G values for long branch points at each of the
temperatures studied. Given the excess of CF3 chain ends over long branch points, in theory
each long branch point could be terminated with a CF3 chain end at each temperature,
resulting in a highly branched, but not crosslinked, system. Between the irradiation
temperatures of 473 – 573 K the G values for the long branch points increased while the
G values for new chain ends remained approximately constant. It might be expected that if
the irradiation temperature was increased to above the crystalline melting point of 578 K,
then the number of long branch points might have exceeded the number of new chain ends.
Fuchs and Scheler showed that PTFE irradiated in the melt exhibited an excess of branch
points over chain ends, suggesting that not all branches were terminated with CF3, but some
must react with other chains, forming crosslinks.5
The system was complicated by the existence of crystalline and amorphous regions
and the probable differences in radiation sensitivity between the two phases. It may be that
crosslinking predominated in the amorphous regions whereas chain scission dominated in
the crystalline regions. However, the probability for cage recombination would be expected
to be higher in the crystalline regions than the amorphous regions, due to the facile nature
of radical-radical reactions and the lower mobility of the fragments of scission reactions in
the crystalline phases. While it was possible to distinguish between some of the peaks in
different morphological environments (for example, the peaks due to CF3 side chains), the
chemical shifts of the remaining peaks gave little or no information as to the morphological
environments of their assigned structures. One conclusion that can be made is that after
irradiation more short branches are formed in the amorphous regions based on more intense
CF3(amorphous) side chain peaks at –71.7 ppm compared with the CF3(crystalline) side chain peak
at –68.6 ppm.
Figure 3.8 showed a large negative G value for PPVE units at all temperatures
studied. G values for loss of side groups in low density polyethylene with similar branch
frequency as for PFA measured using gas chromatography of the volatile products32 are
2 – 3 orders of magnitude lower than that observed for the PPVE units here. It may be
concluded that much of the radiation damage in PFA occurs at the comonomer units,
possibly due to the larger free volume and lower cage effect at these units compared with
the TFE units.

Chapter 3 Structural Changes in γ-Irradiated PFA 88
3.4.5 Analysis of the Volatile Products from Irradiation of PFA
To further investigate the radiation damage to PFA, the volatile products evolved after
irradiation of PFA in vacuum at 303 K were measured using FTIR spectroscopy and MS.
The identity of the volatile products was of interest for determining the mechanism of
decomposition of PFA when exposed to radiation.
The FTIR spectra of the volatile products when PFA and PTFE were irradiated to
350 kGy in vacuum are shown in Figure 3.9. The spectra of the gases evolved from the two
polymers after irradiation are significantly different, with the spectra of the PFA gases
approximately five times more intense than the spectrum of PTFE, indicating that more
volatile compounds are being evolved from the PFA compared with PTFE for the same
mass and dose for each polymer. The spectra of the gases evolved from irradiated PFA one
minute after admission of the gases from the ampoule into the sample cell, and PTFE gases
fifteen minutes after admission were very weak and have been expanded vertically by a
factor of two in Figure 3.9. The major band in the spectrum of PTFE gases at 1282 cm-1
was due to CF4 which has also been observed in the FTIR spectrum of the volatile
component of irradiated TFE/PFMVE33 and polyperfluroinated ether liquids34 formed by
cleavage of •CF3 followed by reaction with a fluorine radical. Since PTFE does not contain
any side groups, the origin of the •CF3 is most likely to be from the chain ends.
The spectra of PFA gases, like that of PTFE gases, contain a band due to CF4, but
also include a number of other bands in the 1350 to 1000 cm-1 region and a band at
1889 cm-1. The spectra observed for PFA and PTFE gases were repeated several times and
showed excellent reproducibility. Given the reproducibility and the difference between the
PTFE and PFA spectra, it was concluded that the additional peaks observed in the PFA
spectra were a product of decomposition of the PPVE units in PFA and not from any other
source, such as leakage of air into the system or from oxygen trapped in the polymer.

Chapter 3 Structural Changes in γ-Irradiated PFA 89
Figure 3.9 FTIR spectra of the volatile products from irradiated PFA and PTFE over the range 2600 to
550 cm-1. The spectra of the volatile products from irradiation of PTFE and PFA after 15 minutes are
expanded by ×2. Inset: expansion of the region from 1400 to 950 cm-1.
Possible pathways of the volatile products following cleavage of the alkoxy side
chain in PFA are shown in Scheme 3.2. Pacansky found that one of the major products
from radiolysis of poly(TFE-co-PFMVE) was COF2 (carbonyl fluoride) formed from loss
of •F by •OCF3 fragments of the side chain.33 The spectra of PTFE and PFA one and 10
minutes after introduction of the gases show some of the bands observed by Pacansky
assigned to carbonyl fluoride at 1956, 1929 and 774 cm-1, although in Figure 3.9 the bands
are barely above the baseline. The other characteristic carbonyl fluoride bands reported by
Pacansky at 1256 and 976 cm-1 were indistinguishable from the other intense bands
between 1300 and 1100 cm-1. Scheme 3.2 shows how carbonyl fluoride might be formed
from decomposition of C2F5CF2O•. Fifteen minutes after the gases were introduced from
irradiated PFA the identified bands due to carbonyl fluoride were no longer present.
Extinction coefficients were not available so a quantitative measurement could not be
made.
The other decomposition pathway from C2F5CF2O• in Scheme 3.2 affords the
product C2F5COF which has carbonyl stretching at 1889 cm-1.35 The boiling point of
C2F5COF is approximately 243 K, well below the temperature at which the FTIR
measurements were made.36 The bands at 1254, 1209 and 1154 cm-1 are typical of

Chapter 3 Structural Changes in γ-Irradiated PFA 90
perfluoroalkane structures,34 possibly part of C2F5COF, •C3F7 or •C2F5 (Scheme 3.2),
although without authentic samples for comparison, it is difficult to make definitive
assignments of these bands. The band at 1006 cm-1 is typical of an ether, possibly
C3F7OCF3 formed from reaction of the radical C2F5CF2O• with a •CF3 radical or with a
difluorocarbene radical (:CF2) which was proposed as an intermediate during the thermal
decomposition of PTFE,30 followed by further reaction with a fluorine radical.
CF2 CFOC3F7
CF2 CF2 CF CF2 + C2F5 CF2
O
.
..
.C2F5 CF2
O
C2F5 C FO
F+
CF2 CFOC3F7
CF2
.+CF2 CF CF2
OC3F7.
A:
B:
.CO
FF C2F5+
Scheme 3.2 Possible volatile products formed from decomposition of the ether side chain.
The minor band present in all the spectra at 2357 cm-1 was supposedly mainly due
to CO2 from the air gap between the sample cell and the laser beam of the spectrometer,
however, CO2 was also identified in the MS which was performed in vacuum. It is possible
that CO2 is formed in the sample from radiolytic decomposition of R–CFO or carbonyl
fluoride.33
The mass spectrum on the volatile component is shown in Figure 3.10 with possible
assignments shown in Table 3.3. Carbonyl fluoride has a cracking pattern which includes
ions with masses of 66 (minor) and 47 (major).37 Both these peaks are present in the mass
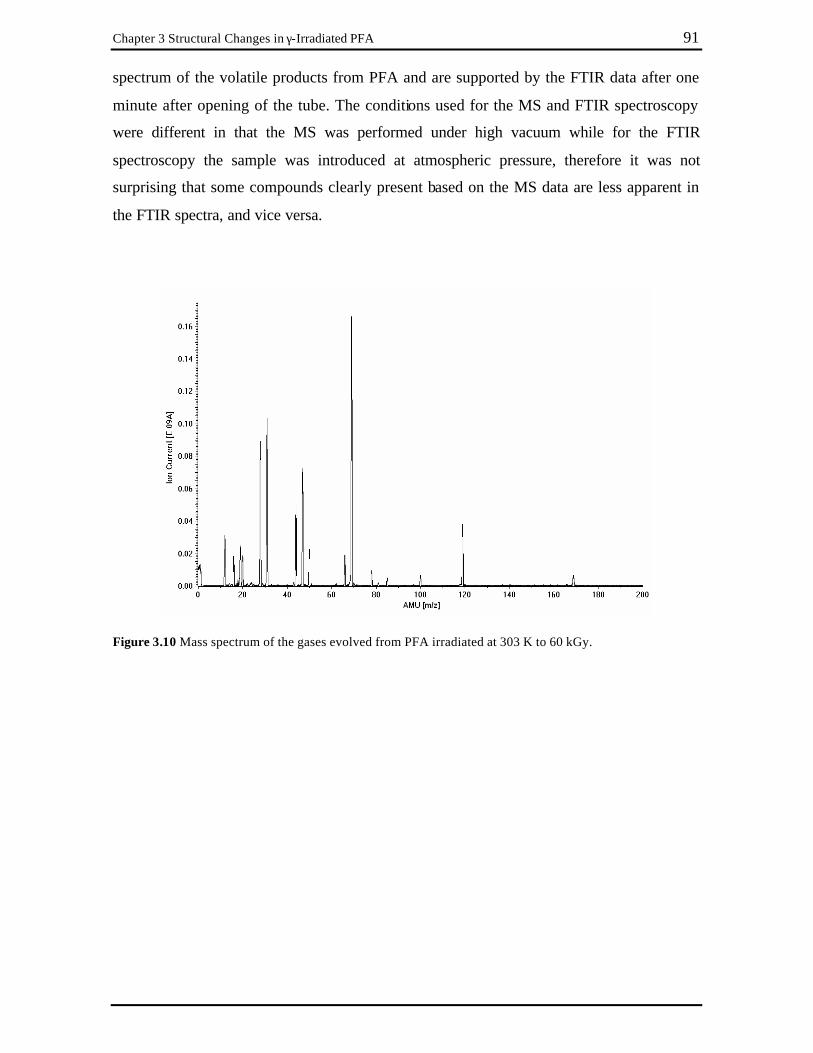
Chapter 3 Structural Changes in γ-Irradiated PFA 91
spectrum of the volatile products from PFA and are supported by the FTIR data after one
minute after opening of the tube. The conditions used for the MS and FTIR spectroscopy
were different in that the MS was performed under high vacuum while for the FTIR
spectroscopy the sample was introduced at atmospheric pressure, therefore it was not
surprising that some compounds clearly present based on the MS data are less apparent in
the FTIR spectra, and vice versa.
Figure 3.10 Mass spectrum of the gases evolved from PFA irradiated at 303 K to 60 kGy.
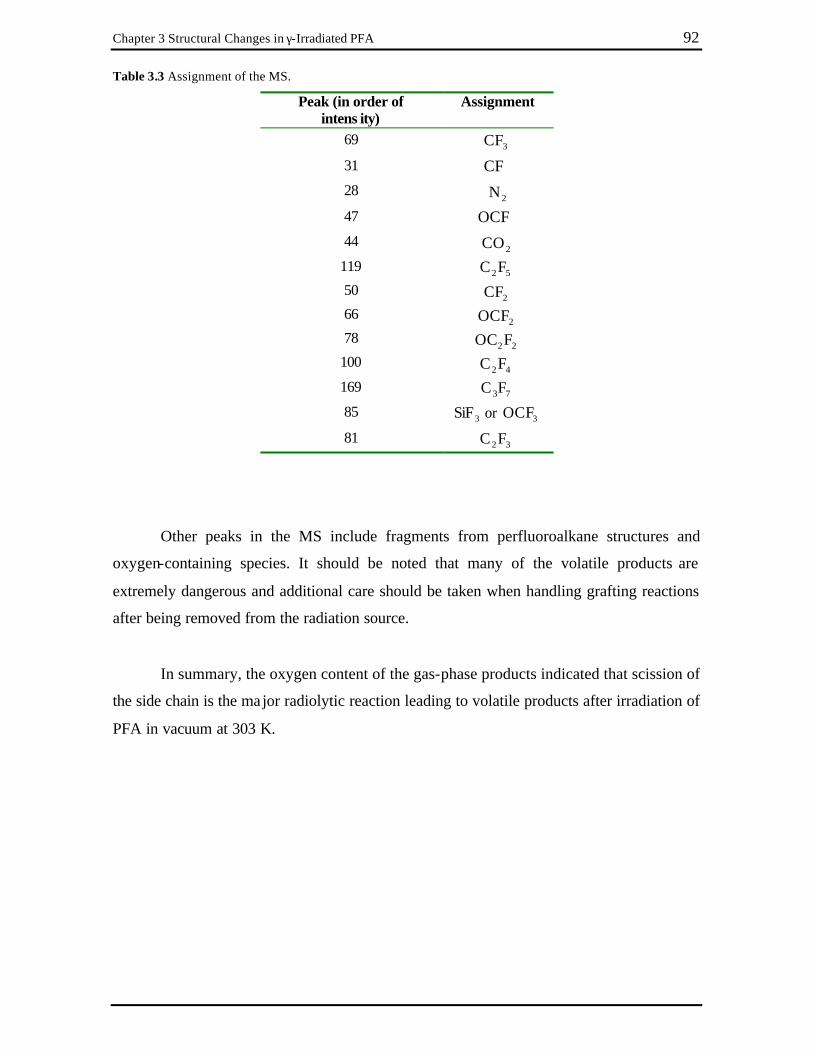
Chapter 3 Structural Changes in γ-Irradiated PFA 92
Table 3.3 Assignment of the MS.
Peak (in order of intens ity)
Assignment
69 +3CF
31 +CF
28 +2N
47 +OCF
44 +2CO
119 +52FC
50 +2CF
66 +2OCF
78 +22FOC
100 +42FC
169 +73FC
85 +3SiF or +
3OCF
81 +32FC
Other peaks in the MS include fragments from perfluoroalkane structures and
oxygen-containing species. It should be noted that many of the volatile products are
extremely dangerous and additional care should be taken when handling grafting reactions
after being removed from the radiation source.
In summary, the oxygen content of the gas-phase products indicated that scission of
the side chain is the major radiolytic reaction leading to volatile products after irradiation of
PFA in vacuum at 303 K.

Chapter 3 Structural Changes in γ-Irradiated PFA 93
3.5 Conclusions
High-speed MAS 19F NMR has been used to identify non-volatile products in semi-
crystalline PFA following γ- irradiation. When PFA was irradiated at 303 K the main
process was chain scission, while at higher temperatures formation of short and long
branches becomes more prominent as did double bond formation. Perfluoromethyl side
chains were identified in two different morphological environments after γ-radiation. The
large negative G value for the PPVE comonomer suggested that it is highly sensitive to
radiation which was confirmed by MS and FTIR spectroscopy of the volatile products after
irradiation.

Chapter 3 Structural Changes in γ-Irradiated PFA 94
3.6 References 1. Forsythe, J. S., Hill, D. J. T., Logothetis, A. L., Seguchi, T., Whittaker, A. K.,
Macromolecules 30, 8101-8108 (1997). 2. Liu, S.-F., Schmidt-Rohr, K., Macromolecules 34, 8416-8418 (2001). 3. English, A. D., Garza, O. T., Macromolecules 12, 351-353 (1979). 4. Dec, S. F., Wind, R. A., Maciel, G. E., Anthonio, F. E., J. Magn. Reson. 70, 355-
359 (1986). 5. Fuchs, B., Scheler, U., Macromolecules 33, 120-124 (2000). 6. Katoh, E., Sugishwa, H., Oshima, A., Tabata, Y., Seguchi, T., Yamazaki, T.,
Radiat. Phys. Chem. 54, 165-171 (1999). 7. Forsythe, J. S., Hill, D. J. T., Mohajerani, S., Whittaker, A. K., Radiat. Phys. Chem.
60, 439-444 (2001). 8. Sun, J., Zhang, Y., Zhong, X., Polymer 35, 2881-2883 (1994). 9. Sun, J., Zhang, Y., Zhong, X., Zhu, X., Radiat. Phys. Chem. 44, 655-659 (1994). 10. Oshima, A., Tabata, Y., Kudoh, H., Seguchi, T., Radiat. Phys. Chem. 45, 269-273
(1995). 11. Tabata, Y., Oshima, A., Takashika, K., Seguchi, T., Radiat. Phys. Chem. 48, 563-
586 (1996). 12. Dec, S. F., Wind, R. A., Maciel, G. E., Macromolecules 20, 2754-2761 (1987). 13. Scheler, U., Solid State NMR 12, 9-13 (1998). 14. Wray, V. Annual Reports on NMR Spectroscopy; Webb, G. Ed.; Academic Press:
London, 1980; Vol. 10B; (a) p. 28; (b) p. 93; (c) p. 53; (d) p. 54; (e) p. 22. 15. Hintzer, K., Lohr, G. Melt Processable Tetrafluoroethylene - Perfluoropropylvinyl
Ether Copolymers (PFA). In: Modern Fluoropolymers; Scheirs, J. Ed.; John Wiley & Sons, 1997; pp. 223-237.
16. Weeks, J. J., Eby, R. K., Clark, E. S., Polymer 22, 1496-1499 (1981). 17. Starkweather, H. W., Zoller, P., Jones, G. A., J. Polym. Sci., Polym. Phys. Ed. 22,
1431-1437 (1984). 18. White, M. L., Waddon, A. J., Atkins, E. D. T., Farris, R. J., J. Polym. Sci., Polym.
Phys. Ed. 36, 2811-2819 (1998).

Chapter 3 Structural Changes in γ-Irradiated PFA 95
19. Whittaker, A. K., unpublished results. 20. Oshima, A., Seguchi, T., Tabata, Y., Polym. Int. 48, 996-1003 (1999). 21. Lunkwitz, K., Lappan, U., Lehmann, D., Radiat. Phys. Chem. 57, 373-376 (2000). 22. Lappan, U., Geissler, U., Lunkwitz, K., Nuc. Inst. Meth. Phys. Res. B 151, 222-226
(1999). 23. Fisher, W. K., Correlli, J. C., J. Polym. Sci., Polym. Chem. 19, 2465-2493 (1981). 24. Tutiya, M., Jap. J. Appl. Phys. 11, 1542-1546 (1972). 25. Carlson, D. P., US Pat. 3,642,742, (1972). 26. Tsuda, M., Oikawa, S., J. Polym. Sci. (Chem.) 17, 3759 (1979). 27. Wray, V. Annual Reports on NMR Spectroscopy; Academic Press: London, 1983;
Vol. 14; p.22. 28. Katoh, E., Sugimoto, H., Kita, Y., Ando, I., J. Mol. Struct. 355, 21-26 (1995). 29. Errede, L. A., J. Org. Chem. 27, 3425-3430 (1962). 30. Morisaki, S., Thermochimica Acta 25, 171-183 (1978). 31. Ciampelli, F., Venturi, M. T., Sianesi, D., Organic Mag. Res. 1, 281-293 (1969). 32. Bowmer, T. N., Ho, S.-Y., O'Donnell, J. H., Polym. Degrad. Stab. 5, 449-456
(1983). 33. Pacansky, J., Waltman, R. J., Jebens, D., Macromolecules 29, 7699-7704 (1996). 34. Pacansky, J., Waltman, R. J., Jebens, D., Heery, O., J. Fluorine Chem. 82, 85-90
(1997). 35. Carre, D. H., Markowitz, J. A., Am. Soc. Lubr. Eng. Trans. 27, 40-46 (1985). 36. Lappan, U., Fuchs, B., Geissler, U., Scheler, U., Lunkwitz, K., Polymer 43, 4325-
4330 (2002). 37. Kupel, R. E., Nolan, M., Keenan, R. G., Hite, M., Scheel, L. D., Anal. Chem. 36,
386-389 (1964).

Chapter 4
4 Crosslinking of PFA by High Temperature Electron Beam Irradiation
4.1 Introduction
An implication of the polarity and strength of the C–F bond is that during synthesis of
fully-fluorinated polymers, F atom abstraction or disproportionation and branch formation
is improbable. PTFE is therefore an inherently linear polymer, although, fluoropolymers
containing a small percentage of short-branches have been prepared by incorporation of
comonomers with pendant groups to form copolymers such as FEP and PFA. While these
copolymers are melt-processable, they essentially still have the properties of linear
polymers. Producing fluoropolymers with crosslinked networks offers the possibility of
improving the strength, dimensional stability, and resistance to solvents at elevated
temperatures of these polymers.1 In the previous chapter it was shown that branched
structures were formed when PFA was treated with γ-radiation at high temperature,
although it was not conclusive whether crosslinking occurred. In this chapter the effect of
electron beam irradiation on PFA is examined with the aim of forming a crosslinked
network.
Since chemical crosslinking of fluoropolymers is not feasible, radiation processing
offers the only pathway to formation of a crosslinked network in these polymers and has
attracted much attention in the literature. One of the first fully-fluorinated polymers to be
crosslinked by high-temperature irradiation was FEP.1,2 Bowers and Lovejoy observed an
increase in the melt viscosity of FEP after it was irradiated under a nitrogen atmosphere at a
temperature above the Tg of 353 K. They proposed that the changes observed were caused
by an excess of crosslinking reactions over chain scission reactions. When FEP was
irradiated above the crystalline melting temperature the melt viscosity decreased,
suggesting that the polymer was degrading. These workers also attempted to crosslink
PTFE by subjecting it to irradiation above the Tg but below the melting temperature but
found that the polymer only degraded. Forsythe et al. cast doubt over the conclusions

Chapter 4: Electron Beam Irradiation of PFA 97
reported by Bowers and Lovejoy for the observations made when FEP was irradiated.
Instead of crosslinking causing the observed increase in melt viscosity, Forsythe et al.
suggested that perhaps an increase in crystallinity and presence of in-chain double bonds
could lead to chain rigidity which would be responsible for the observations.3
Other workers have since reported the successful crosslinking of PTFE by
irradiation above the crystalline melting point in the absence of oxygen. Using the NMR
linewidth as a measure of the crystallinity of irradiated PTFE, Tutiya noticed a correlation
between the crystallinity and irradiation temperature. When PTFE was irradiated with
γ-radiation below 593 K the crystallinity dropped with increasing temperature, while when
the irradiation temperature was above 593 K the crystallinity increased.4 The same trend of
decreasing crystallinity with increasing irradiation temperature was later reported based on
DSC measurements.5 Increases in yield strength and modulus have also been observed
when PTFE was irradiated at approx 613 K.6-8 More recently, with improvements in NMR
spinning speeds, solid-state NMR spectroscopy has been used to characterize PTFE
crosslinked by electron beam irradiation.9-11
No details of the experimental conditions necessary to crosslink PFA could be
found in the literature. Sun et al. reported in 1993 that they had crosslinked PFA but did not
disclose the conditions they used.12 In the previous chapter it was determined that PFA
undergoes net chain scission when irradiated at or below 573 K. Unfortunately, due to
limitations in the equipment used, the upper temperature allowable for the irradiation was
573 K so it was not possible to irradiate PFA in the melt with γ-radiation. However, using
different heating equipment and electron beam irradiation, higher irradiation temperatures
were feasible. In this chapter, PFA is examined using spectroscopic methods after
irradiation with electron beams in the melt at 633 K.
Chapter 4: Electron Beam Irradiation of PFA 98
4.2 Experimental
4.2.1 Electron Beam Irradiation
PFA pellets (DuPont, code TE 7132) were irradiated using an electron beam accelerator
(ELV-2, Budker Institute of Nuclear Physics, Novosibirsk, Russia). The electron energy
was 1.5 MeV with a beam current of 2 mA. A transport system was used with conveyor
speed of 0.6 m min-1 with the irradiation done in steps with a dose of 50 kGy for each pass.
The average dose rate was 14.7 kGy min-1 and samples were irradiated with total doses of
0.5, 1 and 2 MGy.
Irradiation was performed by placing the PFA pellets in a vacuum vessel and
evacuating to a pressure of 4 × 10⁻² Pa. The vessel was fitted with a thin metal foil window
for electron beam penetration and contained an electric heating device. The vacuum vessel
mounted on the conveyor system of the irradiation facility was passed under the electron
beam at a speed such that the specimens received a dose calculated to be 50 kGy per pass.
Irradiation experiments were carried out at a temperature of 633 ± 2 K measured with a
resistance thermocouple in the sample holder. After irradiation the temperature was held at
633 ± 2 K for 20 min then the vessel was filled with nitrogen gas to atmospheric pressure
before cooling. The real temperature of the specimens was probably different to the
temperature measured with the resistance thermocouple in the sample holder. In order to
estimate the temperature difference, a second, non-permanent resistance thermocouple was
used for measuring the temperature of the surface of the sample holder at atmospheric
pressure in air (open vessel). At 633 K the temperature of the surface measured was
approximately 593 K. The real temperature of the surface in vacuum was probably slightly
higher because of the decreased heat dissipation to the surrounding atmosphere (reduced
pressure).

Chapter 4: Electron Beam Irradiation of PFA 99
Electron beam
1.5 MeV
Specimen
HeatingTurbomolecularpump
Inert gas
Scanner
Figure 4.1 Top: Diagram of the chamber used for electron beam irradiation; Middle and Bottom: photographs
of the scanner and vacuum chamber (courtesy of Dr Uwe Lappan, IPF).

Chapter 4: Electron Beam Irradiation of PFA 100
4.2.2 NMR Spectroscopy NMR spectroscopy was performed using a Doty probe using the same conditions in
Chapter 3, Section 3.1.1.
4.2.3 FTIR Spectroscopy
FTIR spectroscopy was performed using the same conditions in Chapter 3, Section 3.1.1.
4.3 Results and Discussion
4.3.1 NMR Spectroscopy
The untreated PFA used had a crystallinity of 34 ± 3 % and was semi-opaque. After
irradiation with electron beams in vacuum at 633 K, the PFA changed in appearance
compared to the untreated material. At the doses examined (0.5, 1 and 2 MGy) the samples
became progressively less opaque and more transparent with increasing dose.
Accompanying the change in appearance was a significant weight loss. At the highest dose
examined (2 MGy) the weight loss was 41 % (Figure 4.2). These observations are evidence
of dramatic chemical and structural changes of the PFA.
Dose (MGy)
0.0 0.5 1.0 1.5 2.0 2.5
Wei
ght
loss
(%
)
0
10
20
30
40
50
Figure 4.2 Weight loss (measured gravimetrically) of PFA samples irradiated at 633 K with electron beams.

Chapter 4: Electron Beam Irradiation of PFA 101
To investigate the chemical changes in electron beam irradiated PFA, high-speed
MAS 19F NMR spectroscopy was used. The NMR rotor used had an outer diameter of
2.9 mm and could be spun at a maximum spinning speed of approximately 20 kHz using
the equipment available. At this speed the chemical shift anisotropy and dipole interactions
were sufficiently averaged so that the linewidths were narrow enough to identify individual
peaks, however, the spectra were partially obscured by spinning sidebands. At speeds
between 17 and 19.5 kHz there were spinning sidebands overlapping with the >CF– region
(–180 to –190 ppm). To observe the full spectral range of interest, a second set of spectra
were recorded using a slower spinning speed of 13.5 kHz to shift the spinning sideband
from the –180 to –190 ppm region.
Examination of the spectra in Figure 4.3 A-F acquired of PFA irradiated to 0.5, 1
and 2 MGy at 633 K, reveals that chain scission and branching reactions are occurring
simultaneously at this irradiation temperature. Chain scission is evident from the growth in
the peaks at –83 and –127 ppm due to –CF2CF3 chain ends, while the peak assigned to
branch-point fluorine groups (>CF–) at –187 ppm also increases in intensity with
increasing dose.

Chapter 4: Electron Beam Irradiation of PFA 102
Figure 4.3 HS MAS 19F NMR of PFA irradiated at 633 K in vacuum. (A) 0.5 MGy,13.5 kHz; (B) 0.5 MGy,
17 kHz; (C) 1 MGy, 13.5 kHz; (D) 1 MGy, 19 kHz; (E) 2 MGy, 13.5 kHz; (F) 2 MGy, 19.5 kHz.
The movement of the spinning sidebands due to the CF2 peak at –122 ppm is indicated by the dashed lines.
The asterisk on the peak at –150 ppm denotes the spinning sideband from the peak at –83 ppm.
Chapter 4: Electron Beam Irradiation of PFA 103
When PFA was irradiated below the melting temperature, the 19F NMR spectra
contained two new peaks due to CF3 side chains in two different morphological
environments (Chapter 3, Section 3.3.5.1). In the spectra of PFA irradiated to 1 and 2 MGy
at 633 K, the intensity of the peak at –68 ppm (assigned to CF3 side chains in the crystalline
regions) is negligible (Figure 4.3 D,F). In the spectra of PFA irradiated to 0.5 MGy, this
region of the spectra is partially obscured by a spinning sideband at both of the spinning
speeds used. The diminishing intensity of the peak at –68 ppm due to CF3 side chains
incorporated into the crystallites can be related back to the changing crystallinity of the
samples after irradiation (of course during the irradiation the samples are totally amorphous
as they are in molten form). Formation of long branches can hinder crystal formation and
lower the overall crystallinity. In Chapter 5, it is shown that when PFA is irradiated at
633 K, the overall crystallinity dropped significantly after irradiation. After a dose of
2 MGy, the crystallinity was just 18 %, almost half the crystallinity of the untreated
material, so that there were fewer crystalline regions in which the CF3 side chains can be
incorporated.
Less intense peaks in the spectra in Figure 4.3 A-F not obscured by spinning
sidebands include one at –155 and one at –73 ppm. These peaks were also observed in
similar intensity in the spectra of PFA irradiated at 473 and 573 K (Chapter 3) and can be
assigned to either CF3–CF=CF– or (CF3)2–CF– for the peak at –73 ppm, and –CF=CF– for
the peak at –155 ppm. All assignments for the spectra acquired on PFA samples irradiated
at 633 K are presented in Table 4.1.

Chapter 4: Electron Beam Irradiation of PFA 104
Table 4.1 Assignments of new peaks observed in the 19F NMR spectra of PFA after irradiation at 633 K.
Structure Chemical shift (ppm)
CF2 CF3 –83
CF2 CF3 –127
CF2 CF CF2
CF3 –71 (crystalline), –68 (amorphous)
CF2 CF CF2
CF3 –113
CF2 CF CF2
CF2
–109
CF
–187
Rf CF CF Rf –155
CF3 CF CF or
CF3 CF2
–73
4.3.2 FTIR Spectroscopy
The FTIR spectra of PFA, irradiated at 633 K (Figure 4.4), and PTFE irradiated in the
melt13-16 showed many of the same structures. Bands include internal and terminal double
bonds (1785, 1730 and 1717 cm-1), double bonds at branch points (–CF=C<) (1671 cm-1)
(only seen at 2 MGy), as well as oxygen-containing end groups such as –COF and –COOH
(1884, 1814, 1775 and 3557 cm-1 (not shown)). A list of the assignments is shown in Table
4.2. The oxygen-containing species were initially thought to originate from the cleavage of
the ether group of the alkoxy side chain since no oxygen would have been available as the
irradiation was carried out in vacuum. After irradiation, the samples were checked fo r
residual radicals which may have reacted with oxygen in the air, but it was found that no

Chapter 4: Electron Beam Irradiation of PFA 105
radicals were present. This suggested that the oxygen-containing species must originate
from the ether group of the side chain. However, when PTFE was irradiated under almost
identical conditions by Lappan and coworkers, –COF and –COOH end groups were also
observed in the FTIR spectra.14,16 This was attributed to either trace amounts of oxygen in
the vacuum or oxygen dissolved in the polymer. If –COF and –COOH groups can form in
PTFE, which does not contain any bonded oxygen, when irradiated under almost identical
conditions to those used here, then it may be possible that the source of the oxygen in PFA
is not exclusively the oxygen of the ether group in the alkoxy side chain.
Figure 4.4 FTIR spectra of (A) untreated PFA; (B) PFA irradiated to 0.5 MGy at 633K; (C) PFA irradiated to
2 MGy at 633K.
Table 4.2 Assignments of bands in the FTIR spectra of PFA irradiated in vacuum at 633 K.
Band (cm-1) Assignment Reference
1671 -CF=C< 13-17
1730, 1717 -CF=CF- “
1785 -CF=CF2 “
1814 -COOH (free) 16-18
1884 -COF “
1775 (shoulder) -COOH (associated) 18,19
3100 (not shown) -COOH (associated) 18
3557 (not shown) -COOH (free) 18

Chapter 4: Electron Beam Irradiation of PFA 106
4.3.3 G Values of Crosslinking
The proportion of crosslinks in PTFE irradiated in the melt have been reported by
Katoh et al. and also by Scheler and coworkers.9-11 Unfortunately, the results cannot be
directly compared as each group of workers have different definitions of what constitutes a
crosslink. Scheler and coworkers define a crosslink as a long branch which meets with
another main chain. This type of crosslink may be considered to be a “pseudo” H-type
crosslink. A “real” H-type crosslink is formed when two main-chain radicals on adjacent
molecules react to form a single-bond crosslink between the two chains.20 H-type crosslinks
are generally observed in polyolefins, but have a low probability of being formed in
crosslinked PTFE and FEP due to the difficulty in alkyl radicals combining.21-23 The
crosslinks Scheler and coworkers describe are H-type in shape but are formed through
many bonds (–CF2–CF2–CF2– chains) between the main chains. They calculated the
proportion of crosslinks as the difference between the number of long branch points and
chain ends and stated that it was an estimate of the lower bound of crosslinking. At low
dose, they reported that short and long branches were formed, while at high dose the long
branches reacted with radicals formed on neighbouring chains to form a crosslink between
the two chains.11
Katoh et al. define a crosslink as any type of branch point or Y-type crosslink,
perhaps erroneously including CF3 side chains as crosslinks. They reported the crosslink
density as simply the number of tertiary CF groups as a fraction of the total number of CF,
CF2 and CF3 groups. The G value of crosslinking was then calculated by converting the
crosslink density to moles then expressing this as the number of crosslinks per 100 eV of
energy input into the polymer. In this way they report a G value for crosslinking (G(X)) for
each dose from 0 to 10 MGy. G(X) passes through a maximum at 2 MGy indicating that at
this dose the increase in crosslinking density was at its greatest. Above this dose, the
crosslinking may be expected to hinder chain mobility and limit any subsequent
crosslinking.
Fuchs and Scheler10 reported the relative content of crosslinks, branches and CF3
side chains over the dose range 0.5 to 3 MGy. While they did not report the relative content
of the chain ends, it could be calculated from the difference between long branches and
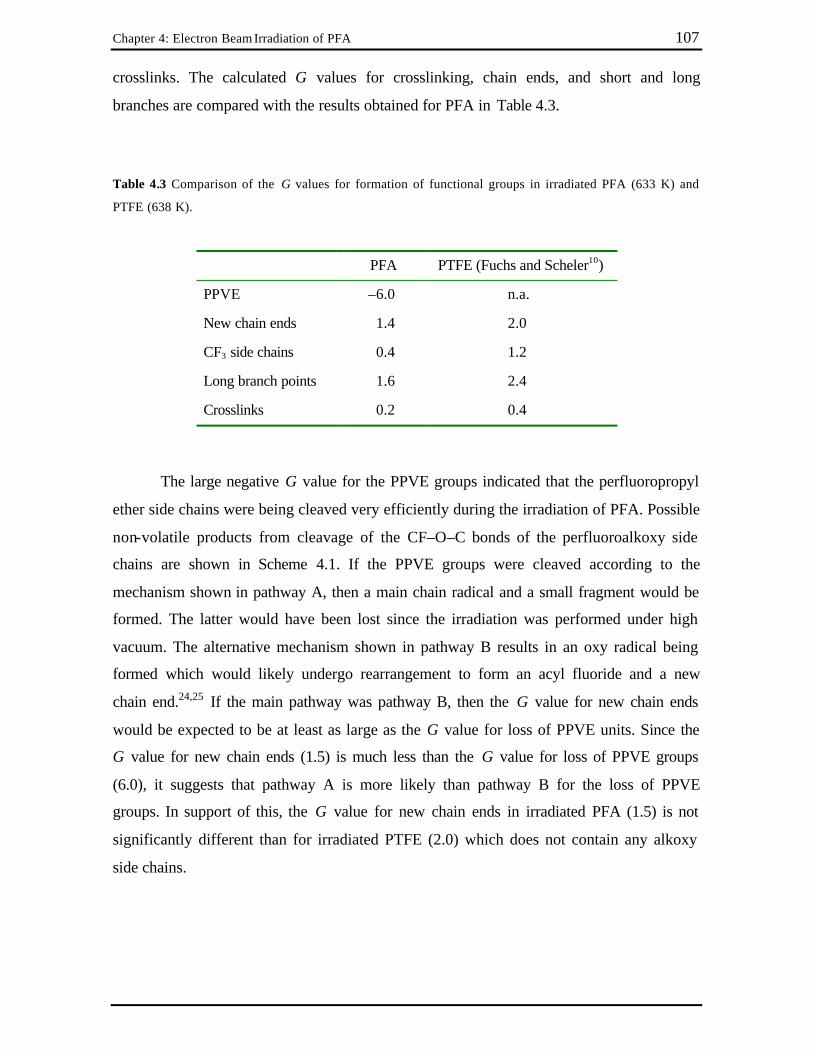
Chapter 4: Electron Beam Irradiation of PFA 107
crosslinks. The calculated G values for crosslinking, chain ends, and short and long
branches are compared with the results obtained for PFA in Table 4.3.
Table 4.3 Comparison of the G values for formation of functional groups in irradiated PFA (633 K) and
PTFE (638 K).
PFA PTFE (Fuchs and Scheler10)
PPVE –6.0 n.a.
New chain ends 1.4 2.0
CF3 side chains 0.4 1.2
Long branch points 1.6 2.4
Crosslinks 0.2 0.4
The large negative G value for the PPVE groups indicated that the perfluoropropyl
ether side chains were being cleaved very efficiently during the irradiation of PFA. Possible
non-volatile products from cleavage of the CF–O–C bonds of the perfluoroalkoxy side
chains are shown in Scheme 4.1. If the PPVE groups were cleaved according to the
mechanism shown in pathway A, then a main chain radical and a small fragment would be
formed. The latter would have been lost since the irradiation was performed under high
vacuum. The alternative mechanism shown in pathway B results in an oxy radical being
formed which would likely undergo rearrangement to form an acyl fluoride and a new
chain end.24,25 If the main pathway was pathway B, then the G value for new chain ends
would be expected to be at least as large as the G value for loss of PPVE units. Since the
G value for new chain ends (1.5) is much less than the G value for loss of PPVE groups
(6.0), it suggests that pathway A is more likely than pathway B for the loss of PPVE
groups. In support of this, the G value for new chain ends in irradiated PFA (1.5) is not
significantly different than for irradiated PTFE (2.0) which does not contain any alkoxy
side chains.

Chapter 4: Electron Beam Irradiation of PFA 108
CF2 CF CF2
OC3F7
CF2 CF CF2
O
CF CF2CF2 CFO
.
.+
A
B
A B
.CF2 CF CF2
2
Scheme 4.1 Possible non-volatile products from cleavage of the C–O bonds of the alkoxy group of PFA.
The amount of branching, both long and short side chains, was less in PFA than in
PTFE as indicated by the higher G values for CF3 side chains and long branch points for
PTFE compared with PFA (Table 4.3). It should be noted that in their measurement of CF3
side chains, Fuchs and Scheler10 included structures such as >C=C(CF3)– which were
assigned to a number of small peaks in the region –55 to –65 ppm. In the spectra of PFA
this region was obscured by spinning sidebands so it could not be measured. Interference
from the spinning sidebands with other peaks was also problematic in the measurement of
peak areas. The peaks at –71 ppm and –187 ppm (Figure 4.3 B,D,F) assigned to CF3 side
chains and >CF– groups, respectively, were partially obscured by spinning sidebands. This
led to a certain degree of error in the measurements of the peak areas making it difficult to
compare the absolute G values of branching for PFA with PTFE. In addition to this, Fuchs
and Scheler used an irradiation temperature 5 K higher than what was used for PFA. This
temperature difference may also explain the differences in the amount of branching in the
two polymers. Despite the small discrepancies between the experimental conditions and
measurement of the peak areas used to derived the G values, it is clear that these G values
for branching in PFA and PTFE are of the same order of magnitude.
The G value for crosslink formation in PFA in Table 4.3 was calculated by
subtracting the number of chain ends from the number of long branch points. The value
Chapter 4: Electron Beam Irradiation of PFA 109
obtained, 0.2, is less than that of PTFE reported by Fuchs and Scheler but is still a positive
value, indicating that crosslinking was the net process.
4.4 Conclusions
PFA has been crosslinked using electron beam irradiation at 633 K in vacuum. This
conclusion is based on the observation that the polymer lost most of its crystallinity based
on the change in appearance from opaque to transparent after irradiation, and on NMR
spectroscopy data showing an excess of branch points over chain ends, implying net
crosslinking. The results in this chapter are complementary to the results in Chapter 3,
proving that, under the correct choice of conditions, net crosslinking of PFA can be
achieved.

Chapter 4: Electron Beam Irradiation of PFA 110
4.5 References
1. Bowers, G. H., US Pat. 3116226, (1963). 2. Bowers, G. H., Lovejoy, E. R., I&EC Product Research and Development 1, 89-92
(1962). 3. Forsythe, J. S., Hill, D. J. T., Mohajerani, S., Whittaker, A. K., Radiat. Phys. Chem.
60, 439-444 (2001). 4. Tutiya, M., Jap. J. Appl. Phys. 11, 1542-1546 (1972). 5. Oshima, A., Ikeda, S., Kudoh, H., Seguchi, T., Tabata, Y., Radiat. Phys. Chem. 50,
611-615 (1997). 6. Oshima, A., Tabata, Y., Kudoh, H., Seguchi, T., Radiat. Phys. Chem. 45, 269-273
(1995). 7. Sun, J., Zhang, Y., Zhong, X., Polymer 35, 2881-2883 (1994). 8. Sun, J., Zhang, Y., Zhong, X., Zhu, X., Radiat. Phys. Chem. 44, 655-659 (1994). 9. Katoh, E., Sugishwa, H., Oshima, A., Tabata, Y., Seguchi, T., Yamazaki, T.,
Radiat. Phys. Chem. 54, 165-171 (1999). 10. Fuchs, B., Scheler, U., Macromolecules 33, 120-124 (2000). 11. Fuchs, B., Lappan, U., Lunkwitz, K., Scheler, U., Macromolecules 35, 9079-9082
(2002). 12. Sun, J., Zhang, Y., Zhong, X., Zhang, W., Radiat. Phys. Chem. 42, 139-142 (1993). 13. Oshima, A., Ikeda, S., Katoh, E., Tabata, Y., Radiat. Phys. Chem. 62, 39-45 (2001). 14. Lappan, U., Geissler, U., Lunkwitz, K., J. Appl. Polym. Sci. 74, 1571-1576 (1999). 15. Lappan, U., Geissler, U., Lunkwitz, K., Radiat. Phys. Chem. 59, 317-322 (2000). 16. Lappan, U., Geissler, U., Lunkwitz, K., Nuc. Inst. Meth. Phys. Res. B 151, 222-226
(1999). 17. Lunkwitz, K., Lappan, U., Lehmann, D., Radiat. Phys. Chem. 57, 373-376 (2000). 18. Fischer, D., Lappan, U., Hopfe, I., Eichhorn, K.-J., Lunkwitz, K., Polymer 39, 573-
582 (1998). 19. Fisher, W. K., Correlli, J. C., J. Polym. Sci., Polym. Chem. 19, 2465-2493 (1981).
Chapter 4: Electron Beam Irradiation of PFA 111
20. Hill, D. J. T., Lewis, D. A., O'Donnell, J. H., Whittaker, A. K., Polym. Adv. Tech. 9, 45-51 (1998).
21. Tsuda, M., Oikawa, S., J. Polym. Sci. (Chem.) 17, 3759 (1979). 22. Tabata, Y., Oshima, A., Takashika, K., Seguchi, T., Radiat. Phys. Chem. 48, 563-
586 (1996). 23. Zhong, X., Sun, J., Wang, F., Sun, Y., J. Appl. Polym. Sci. 44, 639 (1992). 24. Pacansky, J., Waltman, R. J., Jebens, D., Macromolecules 29, 7699-7704 (1996). 25. Forsythe, J. S., Hill, D. J. T., Logothetis, A. L., Seguchi, T., Whittaker, A. K.,
Radiat. Phys. Chem. 53, 657-667 (1998).

________________________________________________________________________
Chapter 5
5 The Thermal Properties of Irradiated PFA
5.1 Introduction
The thermal properties of PTFE indicate that it is a linear, non-branched, non-crosslinked
polymer.1 When polymerized, PTFE has a high degree of crystallinity and melts at high
temperature over a narrow temperature range. The polymer is stable up to 723 K but when
heated further a single step weight- loss profile is observed by thermal gravimetric analysis.2
If PTFE is crosslinked by exposure to radiation while in the molten form, the melting
temperature and crystallinity drop due to hindrance of chain packing in the network
structure.3 The polymer is also less thermally stable after crosslinking and decomposes in
two steps as a result of the low molecular weight component which is a product of
radiation- induced scission.4
When TFE is copolymerized with HFP to form FEP, or with PPVE to form PFA,
the melting temperatures and crystallinity of the resulting copolymers are lower than for
PTFE. FEP with 12 % HFP incorporated melts at 535 K while PFA has a slightly higher
melting temperature due to the lower concentration of the comonomer used.5
At temperatures close to room temperature PTFE undergoes two crystal-crystal
transitions, corresponding to the triclinic-hexagonal and hexagonal-pseudohexagonal
transitions. FEP and PFA exhibit just one transition in this low temperature region,
although in the case of FEP the transition becomes broad and difficult to detect if the
comonomer concentration is high.5,6
Thermal analysis of FEP and tetrafluoroethylene-co-perfluorovinyl ethers has been
used to examine the incorporation of comonomer side-chains into the crystallites.
Pucciariello and coworkers observed that the melting temperatures of FEP copolymers
quenched from the melt were higher than the melting temperatures of perfluorovinyl ether
copolymers with similar amount of comonomer. They considered this as evidence for the

Chapter 5 The Thermal Properties of Irradiated PFA 113
incorporation of perfluoromethyl side chains into the homopolymer crystal lattice as point
defects and exclusion of larger perfluoroalkoxy side chains.7-11 X-ray diffraction studies
also support these finding.12-15
While the thermal properties, particularly the melting transitions, of PTFE and
crosslinked PTFE have been widely studied, however the same is not true for PFA. In this
chapter the thermal properties of untreated PFA and PFA irradiated over a wide
temperature range are examined. The mechanical properties of PFA irradiated at 303 K are
also examined with the view of determining the maximum allowable limits of radiation
exposure for subsequent grafting reactions.
5.2 Experimental
5.2.1 Radiolysis
The samples used were the same as in Chapters 3 and 4.
5.2.2 Thermal Analysis
Dynamic mechanical analysis (DMA) was performed using a Perkin Elmer DMA 7 over
the temperature range 303 to 473 K. The sample used was a ring from a Mimotopes lantern
injection moulded from PFA pellets (DuPont, code TE 7132) and had a thickness of
0.486 mm. Parallel plates were used with a static force of 100 mN and a dynamic force of
83 mN at a frequency of 1 Hz.
Differential scanning calorimetry (DSC) was performed using a Perkin Elmer
DSC 7. All runs were performed on 10 ± 0.5 mg samples in a nitrogen atmosphere.
Samples were weighed both before and after analysis to check for weight-loss due to
decomposition during the DSC runs. It was found that in all cases the difference in weight
before and after analysis was less than 2 % and was ignored for the calculation of the heat
of fusion. The apparatus was calibrated using the onset of melting of indium (429.6 K) and
zinc (692.47 K) and the heat of fusion of indium (28.45 J g-1). Before each run the baseline

Chapter 5 The Thermal Properties of Irradiated PFA 114
was optimized in the range of interest and later subtracted from the corresponding
calorimetric curve.
Samples crystallized by uniform cooling were first heated to 613 K and held at this
temperature for 10 minutes. Subsequent cooling and heating scans were performed at
40 K min-1. Isothermal crystallizations were carried out in the DSC instrument in a nitrogen
atmosphere by holding the sample at 613 K, then rapidly cooling using the maximum
cooling rate of the instrument (approximately 400 K min-1) to the selected crystallization
temperature and holding at that temperature for 30 minutes. The samples were then cooled
to 323 K at 20 K min-1 then heated to 613 K at 20 K min-1 to measure the melting
endotherm. Melting temperatures were taken from the maxima of the peaks
Thermal gravimetric analysis (TGA) was performed using a Perkin Elmer TGA 7.
Samples with weight 10 ± 0.5 mg were heated from 373 to 1246 K at a rate of 10 K min-1 in
a nitrogen atmosphere.
5.2.3 Preparation of Films for Tensile Measurements
Films were prepared by compression moulding of PFA pellets (DuPont code TE 7132,
washed with acetone) in a nitrogen atmosphere between polished Monel® 400 plates
(Pinch Alloys Australia) heated to 613 K (Monel is a nickel-copper alloy resistant to
hydrofluoric acid). Minimal pressure was applied for 10 minutes while the polymer melted,
then the pressure was increased to 2 tonne for 2 minutes to form a film. The thickness of
the films was controlled using metal windows (0.5 mm thick) placed between the plates.
The heating plates were then cooled using a stream of cool water, and the pressure released
once the plates had cooled to room temperature. Dogbones were cut using a die with gauge
length of 15 mm.
5.2.4 Radiolysis of Dogbones for Tensile Measurements
Dogbones were placed in Pyrex tubes and evacuated at 1 × 10⁻² Pa for 24 hours. The tubes
were sealed by melting a narrow neck in the glass, then the samples were irradiated in a 220
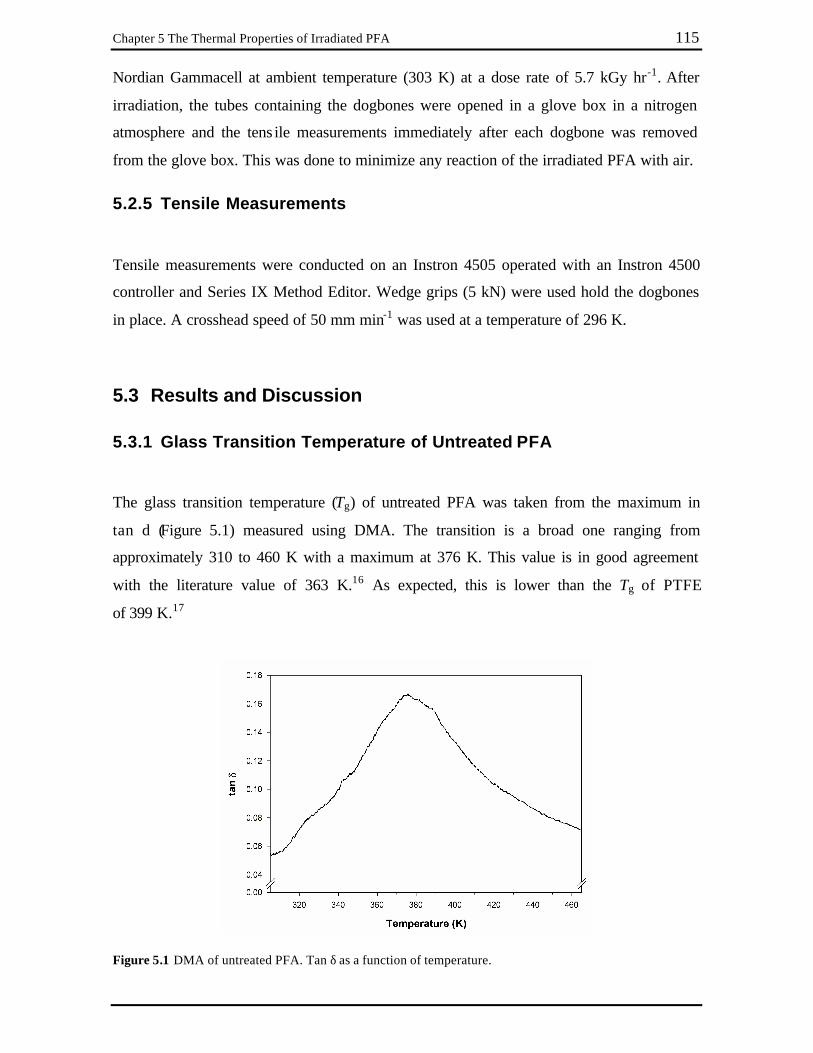
Chapter 5 The Thermal Properties of Irradiated PFA 115
Nordian Gammacell at ambient temperature (303 K) at a dose rate of 5.7 kGy hr-1. After
irradiation, the tubes containing the dogbones were opened in a glove box in a nitrogen
atmosphere and the tens ile measurements immediately after each dogbone was removed
from the glove box. This was done to minimize any reaction of the irradiated PFA with air.
5.2.5 Tensile Measurements
Tensile measurements were conducted on an Instron 4505 operated with an Instron 4500
controller and Series IX Method Editor. Wedge grips (5 kN) were used hold the dogbones
in place. A crosshead speed of 50 mm min-1 was used at a temperature of 296 K.
5.3 Results and Discussion
5.3.1 Glass Transition Temperature of Untreated PFA
The glass transition temperature (Tg) of untreated PFA was taken from the maximum in
tan d (Figure 5.1) measured using DMA. The transition is a broad one ranging from
approximately 310 to 460 K with a maximum at 376 K. This value is in good agreement
with the literature value of 363 K.16 As expected, this is lower than the Tg of PTFE
of 399 K.17
Figure 5.1 DMA of untreated PFA. Tan δ as a function of temperature.

Chapter 5 The Thermal Properties of Irradiated PFA 116
5.3.2 Melting Behavior of Untreated PFA
Superheating is an often sited problem when measuring the melting temperature of
fluoropolymers.5-7,18,19 The most obvious symptom of superheating is that the melting rate
of the crystals is lower than the heating rate. This can be detected by a change in the
melting temperature with variations in the heating rate. The intrinsic melting temperature
can be defined by the equilibrium melting temperature which is the temperature at which a
perfectly formed polymer crystallite melts.
Several methods have been reported in the literature to overcome the shortcomings
of superheating of fluoropolymers. Wunderlich and coworkers estimated the equilibrium
melting temperature of PTFE by annealing samples for 12 hours at a predetermined
temperature in the melting range then quickly cooling the samples to a temperature which
was too high to induce crystallization but was significantly below the melting temperature.
The annealing temperature at which no melting endotherm was observed on subsequent
heating was taken as the equilibrium melting temperature.5 Hoffman and Weeks determined
the equilibrium melting temperature of PCTFE using a different method where the polymer
was isothermally crystallized at a temperature Tc. They then plotted the melting temperature
(Tm) of the crystals against the crystallization temperature for a range of Tc values. The
intercept of the line fitted to the data with the line Tm = Tc was taken as the equilibrium
melting temperature.20 This method is less cumbersome and time consuming than the
method of Wunderlich and coworkers and has also been used by Pucciariello and
coworkers to determine the equilibrium melting temperature for FEP and TFE/PMVE
polymers.9,11
To determine the equilibrium melting temperature of PFA the isothermal
crystallization method of Hoffman and Weeks was used. Untreated* PFA was cooled from
the melt at the maximum rate the instrument would allow then held at a predetermined
temperature between 553 and 565 K for one hour, cooled to 323 K then heated to 613 K at
20 K min-1. If the crystallization temperature (Tc) was above 565 K an exotherm was
observed on subsequent cooling which suggested there was incomplete crystallization at * “untreated” refers to the polymer before exposure to radiation, regardless of heat treatment. The term “untreated” will be used only to describe the non-irradiated polymer. To distinguish between melted and non-melted PFA, the thermal history will be refe rred to in the text.

Chapter 5 The Thermal Properties of Irradiated PFA 117
this temperature. For this reason, the highest value of Tc used was 565 K. The DSC traces
of the first run of PFA and runs after crystallization are shown Figure 5.2. The first run was
used to determine the initial crystallinity of PFA before any irradiation or heat treatment.
The heat of fusion from the area under the melting endotherm was converted to crystallinity
based on the figure of 82 J g-1 reported for the melting of a perfect crystal of PTFE.5 This
gave a measure of the crystallinity of untreated pellets of PFA of 34 ± 3 %.
Figure 5.2 Melting endotherms (positive direction) of as received PFA and after crystallization at
temperatures Tc. The heating rate was 20 K min -1.
The multi-modal nature of the endotherms in Figure 5.2 was due to formation of
less perfect crystals (lower melting temperature) amongst the more perfect ones (higher
melting temperature). As Tc was decreased there is less chance for well ordered crystals to
form and the melting temperatures were shifted to lower values and the peaks broadened.

Chapter 5 The Thermal Properties of Irradiated PFA 118
When a Tc of 565 K was used, there is a broad endotherm at approximately 561 K and a
shoulder at 580 K which can be attributed to melting of less perfect crystals. As Tc was
decreased, the broad peak at 561 K shifted to lower temperature and became broader. At Tc
less than 555 K this peak became so broad it is almost indistinguishable from the baseline.
The shoulder which was at 580 K when Tc was 565 K also shifted to lower melting
temperature as Tc was decreased. Similar observations have been made for isothermal
crystallization experiments with TFE/PMVE.8 It is possible for the less perfect crystals to
recrystallize after melting to form more ordered crystals, however, the area under each trace
for each value of Tc in Figure 5.2 did not vary by more than 2 % suggesting that this effect,
if present, can be ignored for the purpose of this experiment.
The equilibrium melting temperature was estimated from the plot of Tc verses Tm in
Figure 5.3. Extrapolation of the line of best fit of the data intercepts the line Tc = Tm at
599 K. This value is only marginally below the value found for PTFE of 605 K using the
method of Wunderlich5 and would suggest that the perfluoropropyl ether side chains are
excluded from the crystallites. If they were included in the crystallites the Tm° would be
expected to me much lower than for PTFE. This is in agreement with work by Pucciariello
and coworkers who found that small CF3 side chains in FEP were partially included in the
homopolymer crystal lattice while larger perfluoroalkoxy side chains in TFE/PMVE
copolymers were excluded.9-11
Figure 5.3 Melting temperature (Tm) plotted as a function of crystallization temperature (Tc). The dashed line
satisfies the equation Tc = Tm.

Chapter 5 The Thermal Properties of Irradiated PFA 119
5.3.3 Thermal Properties of Irradiated PFA
Determination of the equilibrium melting temperature of PFA samples after irradiation was
not possible due to the chemical changes within the polymer. 19F NMR spectroscopy
studies (Chapters 3 and 4) revealed the formation of CF3 side chains which may be
incorporated or excluded from the crystallites. While the equilibrium melting temperature
of FEP has been reported using the method by Hoffman and Weeks,11 Centore et al.
postulated that when FEP is crystallized isothermally, the CF3 side chain concentration
incorporated into the crystallites may change with crystallization temperature, hence it is
not strictly correct to use this method for polymers containing HFP groups.6 Instead, to
compare the effects of radiation and radiation temperature on the melting temperature and
melting endotherms on PFA, samples were crystallized from the melt at a constant cooling
rate then heated through the melting transition at the same rate. Since a range of irradiation
temperatures were used, it was important to erase the thermal history of the polymers
before the melting transition was measured, thus the first DSC runs after irradiation were
ignored.
The effect of irradiation temperature on the melting behavior of PFA is compared in
Figure 5.4 for samples irradiated to 1 MGy and for untreated PFA. No transitions were
observed below 450 K and this region has been omitted for clarity. The melting
temperatures (taken from the maxima in the melting endotherms) and crystallinity
(calculated from the area under the endotherms) over the entire dose range examined are
plotted in Figure 5.5 and Figure 5.6, respectively. The irradiation temperatures used can be
split into three groups: below the Tg maximum (irradiation at 303 K), above the Tg, but
below the Tm (irradiation at 423 K and 473 K), and at or above the Tm (irradiation at 573 K
and 633 K). When PFA was irradiated at 303 K there was little change in the melting
temperature while the crystallinity increased significantly. The increase in crystallinity may
be attributed to loss of alkoxy side chains, cleavage of chains in the amorphous regions
interconnecting the crystallites (tie molecules), and overall lowering of the molecular
weight allowing better packing of the chains and hence an increase in crystallinity. In
support of this argument the melting endotherm of samples irradiated to 1 MGy at 303 K
was sharper than the endotherm of the untreated sample. The lowering of the molecular
weight is supported by the solid-state 19F NMR spectra (Chapter 3) which showed that the

Chapter 5 The Thermal Properties of Irradiated PFA 120
major non-volatile products resulting from irradiation at 303 K were new saturated chain
ends.
Figure 5.4 DSC traces of non-irradiated PFA and PFA irradiated to 1 MGy over a range of temperatures.
Samples were crystallized from the melt by cooling at 40 K min -1 followed by subsequent heating at
40 K min-1 to measure the melting endotherms (positive direction).

Chapter 5 The Thermal Properties of Irradiated PFA 121
Figure 5.5 Melting temperature as a function of dose for samples irradiated at 303, 423, 473, 573 and
633 K.
Figure 5.6 Crystallinity as a function of dose for samples irradiated at 303, 423, 473, 573 and 633 K.
Samples irradiated at 423 K and 473 K had similar thermal characteristics to one
another, namely slightly lower Tm and higher crystallinity than untreated PFA. The large
increase in crystallinity between 0 and 0.5 MGy may again be attributed to cleavage of tie

Chapter 5 The Thermal Properties of Irradiated PFA 122
molecules and alkoxy side chains, however above this dose the crystallinity decreased due
to fewer tie molecules and alkoxy side chains remaining and the formation of long and
short branches capable of disrupting the chain packing. The short branches (CF3) may be
able to be included in the crystallites, giving rise to less perfect crystal growth which may
explain the low temperature shoulder in the DSC traces (Figure 5.4) and the lower Tm
maximum. Analogous behavior was reported for FEP which found that increasing the
comonomer concentration decreased the Tm.11
Samples irradiated at or above the Tm of untreated PFA (573 K, 633 K) had
dramatically different DSC traces to the other samples, indicating major structural changes
within the polymer. The melting endotherms were broad and shifted to significantly lower
temperature when compared with the untreated PFA. The crystallinity marginally increased
after a dose of 0.5 MGy and may be considered to be a combination of release of strain
through cleavage of tie molecules as well as formation of short and long branches. Above
0.5 MGy the crystallinity dropped dramatically — the sample irradiated to 2 MGy at 633 K
had crystallinity of 18 % and a melting temperature of 530 K (note that the 2 MGy / 573 K
sample was lost due to excessive pressure build-up which led to an explosion of the glass
tube containing the sample during irradiation). Oshima et al. found that PTFE irradiated in
the melt to a dose of 2 MGy became almost completely amorphous.21
5.3.4 Thermal Gravimetric Analysis (TGA)
The thermal stabilities of PFA with and without radiation treatment were examined by
thermal gravimetric analysis (TGA). Figure 5.7 and Figure 5.8 show the weight- loss as a
function of temperature for the various irradiated PFA samples measured by TGA ranging
from 373 K to 1246 K with a heating rate of 10 K min-1. Below 450 K and above 950 K
there was no weight change so these regions have been omitted from the plots for clarity.
Decomposition of untreated PFA was a one step process beginning at approximately 725 K,
most likely to be via depolymerization and production of predominantly TFE units as is the
case for thermal decomposition of PTFE.22 The alkoxy side chains may be expected to
decompose at lower temperature due to the ether bond, however this is not obvious from
the TGA curve.

Chapter 5 The Thermal Properties of Irradiated PFA 123
Figure 5.7 TGA traces of untreated PFA and PFA irradiated to a dose of 1 MGy at 303, 423, 473, 573 and
633 K.
The onset of decomposition was shifted to lower temperature by radiation treatment
at all temperatures. At all irradiation temperatures with the exception of 633 K, the initial
lower temperature decomposition may be attributed to loss of low molecular weight
fragments. The absence of these fragments in the samples irradiated at 633 K was due to
the experimental conditions used. At this temperature electron beams were used instead of
γ-radiation and the samples were under continua l vacuum, thus any low molecular weight
fragments formed would have been removed by the vacuum during the radiation treatment.
Aside from loss of low molecular weight material below 700 K, all the irradiated
samples had essentially a two step weight- loss profile. The relative proportion of these two
steps gives some insight into their possible origins. Examination of Figure 5.8 D
(irradiation at 633 K) shows that the low temperature decomposition step increased with
increasing dose while the converse was true for the higher temperature step. 19F NMR
spectra showed that in these samples branching and crosslinking increased with dose.
Therefore, as a corollary it may be concluded that the first step between approximately 700
K and 775 K was due to decomposition of branched or crosslinked PFA while the second

Chapter 5 The Thermal Properties of Irradiated PFA 124
step between 775 K and 850 K was due to decomposition of non-crosslinked PFA. In
support of this argument, Oshima et al. reported the TGA of PTFE crosslinked at 610 K in
an argon atmosphere and found that the crosslinked material was less thermally stable than
the untreated PTFE.4 The lower stability of the branched / crosslinked material over the
linear material may originate from weak points and defects in the structure. FEP, which
contains CF3 branches introduced by copolymerization of TFE with HFP, decomposes in
two steps when heated in a nitrogen atmosphere.23 The first step is due to the lower stability
of the branched structures, while the second step is due to decomposition of TFE units. This
supports the observation that branched structures in PFA after irradiation decompose at a
lower temperature than non-branched structures.
Figure 5.8 TGA traces. (A) irradiated at 303 K; (B) irradiated at 473 K; (C) irradiated at 573 K (derivative
curves are included to highlight the predominately two-step decomposition); (D) irradiated at 633 K.

Chapter 5 The Thermal Properties of Irradiated PFA 125
5.3.5 Tensile Measurements of Low-Dose PFA
It is known that perfluoropolymers degrade when exposed to radiation.24 When irradiataed
in vacuum, PFA has slightly better radiation resistance when compared with FEP and PTFE
at low doses (< 30 kGy), but at high doses (> 100 kGy) all three polymers become
embrittled.25 In fact, a common method of recycling PTFE is to expose it to radiation to
break the polymer down into a free-flowing micropowder which can then be used as a
lubricant.26 One of the aims of this project was to graft styrene to PFA using γ-irradiation to
produce a graft copolymer with excellent chemical and thermal stability and reasonable
mechanical properties. To determine what maximum recommended total dose can be used
for the grafting reactions, the mechanical properties of PFA before and after irradiation in
vacuum were examined using an Instron tester.
Figure 5.9 shows a selection of stress-strain curves for PFA before and after
irradiation. The untreated material initially displayed Hookean elastic type behaviour at low
strain where the stress/stain curve is almost linear before reaching a point where there is
ductile flow. Upon further strain there was necking and strain-hardening of the polymer
before it finally broke. Similar profiles are observed up to 5 kGy dose, above which, the
samples broke without strain hardening. Above 10 kGy, the samples underwent brittle
fracture.
Figure 5.9 Typical stress-strain plots for untreated PFA and PFA irradiated to 5, 10 and 30 kGy, all in
vacuum at 303 K. Measurements were made at 296 K.

Chapter 5 The Thermal Properties of Irradiated PFA 126
In Figure 5.10 the tensile strength, Young’s modulus, elongation and energy to
break are plotted as a function of radiation dose. These figures show that the mechanical
properties of PFA were dramatically altered after relatively low radiation doses. The loss in
tensile strength, elongation and energy to break together with the increase in rigidity as
indicated by the increase in the Young’s modulus are consistent with chain scission. Other
workers have observed similar trends in the tensile strength and elongation of irradiated
PFA.25,27 This is in agreement with the NMR results for PFA irradiated at 303 K in
Chapter 3 which showed that chain scission was the main reaction at this irradiation
temperature.
Figure 5.10 Tensile strength, Young’s modulus, elongation and energy to break of irradiated PFA as a
function of irradiation dose. The dotted line is an aid to the eye only.
The results presented in Figure 5.10 suggested that when grafting to PFA, the
radiation dose should be kept as low as possible to avoid degradation of the polymer. The
actual mechanical properties of the graft copolymer will be different to the results here as
the graft may be expected to add to the properties. El-Sawy et al. found that when PFA was
grafted with vinyl acetate there was an improvement in the tensile strength at low graft
yields possibly due to crosslinking of the graft.28 Another consideration is that grafted
Chapter 5 The Thermal Properties of Irradiated PFA 127
supports for SPOC would more likely undergo compressive stresses rather than tensile
stresses during handling of the support. It is known that fluoropolymers perform better
under compression than elongation.29 Based on this information, it is recommended that the
total dose used for grafting preferably be kept below 10 kGy, and definitely not allowed to
exceed 30 kGy.
5.4 Conclusions
In this chapter the thermal properties of PFA before and after irradiation have been
examined. The equilibrium melting temperature of untreated PFA was estimated to be
599 K, slightly below the corresponding value for PTFE. When PFA was irradiated over a
temperature range from below the Tg to above the melting point, the thermal properties of
the polymer changed significantly. Low-temperature irradiation resulted in a decrease in
thermal stability and an increase in the crystallinity with little change in the melting
temperature. This was explained by the lowering of molecular weight and improved chain
packing accompanied by formation of a small amount of short branch structures. When
PFA was irradiated at or above the melting temperature the crystallinity, melting
temperature and thermal stability of the resulting polymer decreased which was attributed
to long and short branch formation and formation of low molecular weight fragments. At
irradiation temperatures above the Tg but below the melting temperature the properties were
intermediate between the higher and lower irradiation temperatures.
Tensile measurements of PFA irradiated at 303 K showed that the polymer
experienced a dramatic loss in the mechanical properties even at low dose. A recommended
upper limit of the total allowable dose to be used for grafting reactions of approximately
30 kGy was suggested in order for the graft copolymer to retain any useful mechanical
properties.

Chapter 5 The Thermal Properties of Irradiated PFA 128
5.5 References
1. Fisher, W. K., Correlli, J. C., J. Polym. Sci., Polym. Chem. 19, 2465-2493 (1981). 2. Lappan, U., Haussler, L., Pompe, G., Lunkwitz, K., J. Appl. Polym. Sci. 66, 2287-
2291 (1997). 3. Oshima, A., Ikeda, S., Kudoh, H., Seguchi, T., Tabata, Y., Radiat. Phys. Chem. 50,
611-615 (1997). 4. Oshima, A., Ikeda, S., Katoh, E., Tabata, Y., Radiat. Phys. Chem. 62, 39-45 (2001). 5. Lau, S. F., Suzuki, H., Wunderlich, B., J. Polym. Sci., Polym. Phys. Ed. 22, 379-405
(1984). 6. Centore, R., De Rosa, C., Guerra, G., Petracocone, V., Corradini, P., Villani, V.,
Eur. Polym. J. 24, 445-448 (1988). 7. Pucciariello, R., J. Polym. Sci.: Part B: Polym. Phys. 32, 1771-1776 (1994). 8. Pucciariello, R., J. Polym. Sci. Part B: Polym. Phys. 34, 1751-1759 (1996). 9. Pucciariello, R., J. Appl. Polym. Sci. 64, 407-409 (1997). 10. Pucciariello, R., Villani, V., Mancusi, C., J. Appl. Polym. Sci. 74, 1607-1613
(1999). 11. Pucciariello, R., Mancusi, C., J. Appl. Polym. Sci. 73, 919-925 (1999). 12. Starkweather, H. W., Zoller, P., Jones, G. A., J. Polym. Sci., Polym. Phys. Ed. 22,
1431-1437 (1984). 13. Weeks, J. J., Eby, R. K., Clark, E. S., Polymer 22, 1496-1499 (1981). 14. White, M. L., Waddon, A. J., Atkins, E. D. T., Farris, R. J., J. Polym. Sci., Polym.
Phys. Ed. 36, 2811-2819 (1998). 15. Marigo, A., Marega, C., Zannetti, R., Ajroldi, G., Macromolecules 29, 2197-2200
(1996). 16. DuPont. Teflon PFA Properties Handbook, 1997. 17. Brankdrup, J., Immergut, E. H. Polymer Handbook; John Wiley and Sons: New
York, 1999. 18. Starkweather, H. W., J. Polym. Sci., Polym. Phys. Ed. 23, 1177-1185 (1985).
Chapter 5 The Thermal Properties of Irradiated PFA 129
19. Hellmuth, E., Wunderlich, B., Rankin, J. M., Appl. Polym. Sym. 2, 101-109 (1966). 20. Hoffman, J. D., Weeks, J. J., J. Res. Natl. Bur. Stand. A 66A, 13-28 (1962). 21. Oshima, A., Tabata, Y., Kudoh, H., Seguchi, T., Radiat. Phys. Chem. 45, 269-273
(1995). 22. Morisaki, S., Thermochimica Acta 25, 171-183 (1978). 23. Mohajerani, S. PhD Thesis, The University of Queensland (2002). 24. Florin, R. E., Wall, L. A., J. Res. Natl. Bur. Stand. A 65A, 375-387 (1961). 25. Gangal, S. V. Tetrafluoroethylene-Perfluorovinyl Ether Copolymers. In:
Encyclopedia of Chemical Technology; Kirk-Othmer Ed.; John Wiley & Sons: New York, 1994; Vol. 11; pp. 671-683.
26. Lyons, B. J. The Radiation Crosslinking of Fluoropolymers. In: Modern
Fluoropolymers; Scheirs, J. Ed.; John Wiley & Sons Ltd: Chichester, 1997; pp. 335-347.
27. Taher, N. H., Dessouki, A. M., Khalil, F. H., El-Arnaouty, M. B., Polym. Int. 41,
383-389 (1996). 28. El-Sawy, N. M., Hegazy, E. A., Rabie, A. M., Hamed, A., Miligy, G. A., Polym. Int.
33, 285-291 (1994). 29. Scheirs, J. Structure/Property Considerations for Fluoropolymers and
Fluoroelastomers to Avoid In-service Failure. In: Modern Fluoropolymers; Scheirs, J. Ed.; John Wiley & Sons Ltd: Chichester, 1997; pp. 1-69.

Chapter 6
6 Grafting I – Vapour and Solvent Effects
6.1 Introduction
The pioneering work on radiation- induced grafting to PTFE was reported by Chapiro in the
late 1950s and early 1960s.1,2 Examining the process of simultaneous radiation- induced
grafting of styrene and methyl methacrylate to PTFE, Chapiro found that at low dose rates
the rate of polymerization was slow and grafting was diffusion controlled. Conversely, at
higher dose rates the higher rate of polymerization exceeded the rate of diffusion and
grafting was limited to the surface of the film. When the irradiation temperature was raised,
the dose rate required for the rate of polymerization to exceed the rate of diffusion also
increased. Since PTFE swells only slightly in styrene, Chapiro concluded that the diffusion
of monomer occurred not into the pure PTFE, but into the partially grafted layers.
Much of the recent interest in grafted fluoropolymers has stemmed from the need to
develop membranes for fuel-cells. Fluoropolymers are thought to be a good substrate for
this application due to their excellent chemical and thermal stability and reasonable
mechanical properties.3 In order to prepare a conducting fuel-cell membrane from a
fluoropolymer, the graft must penetrate the entire substrate. Much of the literature on this
subject has been dedicated to studying the effects of dose, dose rate, temperature, chemical
structure of the fluoropolymer, additives, graft monomer and to a lesser extent, solvents,
with the aim of obtaining an homogeneous graft throughout the substrate.4-16 One of the
aims of the work contained in this thesis was to prepare a graft copolymer suitable for high
temperature SPOC. For this application an accessible surface graft is desired, and while the
knowledge in the literature is useful for understanding the grafting process, few
publications have been aimed at achieving a surface graft with properties suitable for
SPOC.
Until recently, there were few publications covering the grafting of monomers to
PFA. Shortly after this project was conceived, Nasef et al. reported for the first time the

Chapter 6 Grafting I – Vapour and Solvent Effects 131
effect of solvents on the grafting of styrene to PFA.12 Later, Nasef reported similar work
examining the effects of solvents when grafting to PFA, FEP and PTFE.13 The solvents
Nasef and coworkers employed were dichloromethane, benzene and methanol. They found
that the graft yield, when grafting styrene to thin films of PFA, was strongly dependent on
the solvent used to dilute the monomer and the concentration employed. Like Chapiro,1,2
Nasef and coworkers found that at low dose rates diffusion of the monomer was enhanced,
leading to high graft yields while at high dose rates the rate of termination was fast, leading
to lower graft yields compared with lower dose rates for the same total dose. The papers of
Nasef and coworkers contain some spurious explanations of some of their findings. Firstly,
they reported that the reason a higher graft yield was observed when dichloromethane or
benzene was used compared with methanol was because of an increase in the number of
radicals produced in the grafting system, particularly in the polymer substrate, when the
former two solvents were used. No further explanation was given as to why the number of
radicals produced would be different. It is highly unlikely that merely changing the solvent
would affect the number of radicals produced within the polymer substrate to any
significant degree. Secondly, they claimed that no homopolymer was formed when
dichloromethane was used as a solvent. They made no attempt to isolate the homopolymer
formed in their grafting reactions and it can only be concluded that the reason they did not
observe any homopolymer in dichloromethane was that it was soluble and hence the
solution did not become cloudy. Finally, while differences in graft yields between the
various solvents are argued in terms of diffusion of the monomer, no attempts were made to
measure the diffusion or penetration of the graft into the substrate. To clarify some of these
anomalies, the effect of solvents on the grafting of styrene to PFA is revisited in this
chapter.
Also in this chapter, grafting of styrene vapour to PFA is investigated. In liquid-
phase grafting, the grafting rates have been shown to be approximately 70 % higher than in
the vapour-phase for grafting of styrene to polyethylene. This has been accounted for by the
high diffusion resistance at the polymer-vapour interface.17 Put another way, using
monomer vapour instead of monomer liquid, the graft can supposedly be limited to the
surface. No reports could be found where grafting to fluoropolymers had been conducted
using monomers in the vapour-phase. Vapour-phase grafting has advantages over liquid- or

Chapter 6 Grafting I – Vapour and Solvent Effects 132
solution-phase grafting in that no solvent is required and it is a very efficient use of
monomer as there is low parasitic loss of monomer by homopolymerization.
To characterize the grafted PFA copolymers both weight increase and Raman
microprobe spectroscopy (a brief overview of this technique is given in the next section)
have been used. In the final section of this chapter, a comparison is made of the suitability
of a selection of the graft copolymers prepared for use as supports for rudimentary SPOC
using loading tests.
6.2 Theory and Technical Aspects
6.2.1 Microprobe Raman Spectroscopy
The Raman effect was first predicted in the early 1920s by Smekal18 and later demonstrated
almost simultaneously by C.V. Raman and G. Landsberg and L. Mandelstam in 1928.19,20
This effect relates to the inelastic scattering of photons by matter.
When light illuminates a sample a small fraction of the light is scattered. This
scattered light is composed of two parts, namely Rayleigh scattering and Raman scattering.
Rayleigh scattering makes up the majority of the scattered light and originates from elastic
scattering, that is, it has the same energy as the incident light. The Raman scattering has
intensity equal to approximately one millionth of the Rayleigh scattering and is due to
inelastic scattering. In the Raman spectrum on either side of the Rayleigh line are Raman
lines of lower frequency (Stokes lines) and of higher frequency (anti-Stokes lines). The
more intense Stoke lines arise from interaction of incoming light with molecules in the
ground state energy level, while the less intense anti-Stokes lines are from interaction with
molecules already in a high energy state. Raman spectrometers use filters to remove the
Rayleigh scattering to measure the Raman scattering. The shift in frequency of the Stokes
and anti-Stokes Raman scatter lines from the exciting line form the Raman spectrum which
correspond to frequencies of molecular vibrations.
Unlike infrared spectroscopy, which requires a dipole moment to observe an
absorption band, Raman spectroscopy relies on a change in the polarisability of the
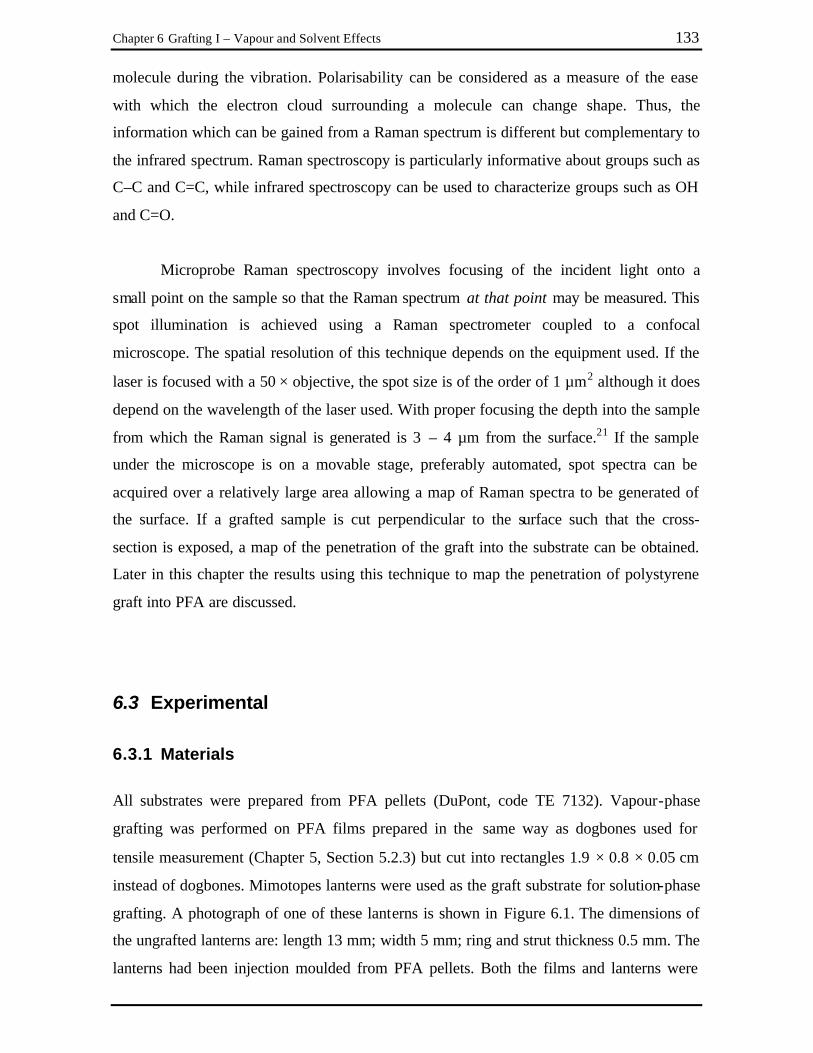
Chapter 6 Grafting I – Vapour and Solvent Effects 133
molecule during the vibration. Polarisability can be considered as a measure of the ease
with which the electron cloud surrounding a molecule can change shape. Thus, the
information which can be gained from a Raman spectrum is different but complementary to
the infrared spectrum. Raman spectroscopy is particularly informative about groups such as
C–C and C=C, while infrared spectroscopy can be used to characterize groups such as OH
and C=O.
Microprobe Raman spectroscopy involves focusing of the incident light onto a
small point on the sample so that the Raman spectrum at that point may be measured. This
spot illumination is achieved using a Raman spectrometer coupled to a confocal
microscope. The spatial resolution of this technique depends on the equipment used. If the
laser is focused with a 50 × objective, the spot size is of the order of 1 µm2 although it does
depend on the wavelength of the laser used. With proper focusing the depth into the sample
from which the Raman signal is generated is 3 – 4 µm from the surface.21 If the sample
under the microscope is on a movable stage, preferably automated, spot spectra can be
acquired over a relatively large area allowing a map of Raman spectra to be generated of
the surface. If a grafted sample is cut perpendicular to the surface such that the cross-
section is exposed, a map of the penetration of the graft into the substrate can be obtained.
Later in this chapter the results using this technique to map the penetration of polystyrene
graft into PFA are discussed.
6.3 Experimental
6.3.1 Materials
All substrates were prepared from PFA pellets (DuPont, code TE 7132). Vapour-phase
grafting was performed on PFA films prepared in the same way as dogbones used for
tensile measurement (Chapter 5, Section 5.2.3) but cut into rectangles 1.9 × 0.8 × 0.05 cm
instead of dogbones. Mimotopes lanterns were used as the graft substrate for solution-phase
grafting. A photograph of one of these lanterns is shown in Figure 6.1. The dimensions of
the ungrafted lanterns are: length 13 mm; width 5 mm; ring and strut thickness 0.5 mm. The
lanterns had been injection moulded from PFA pellets. Both the films and lanterns were
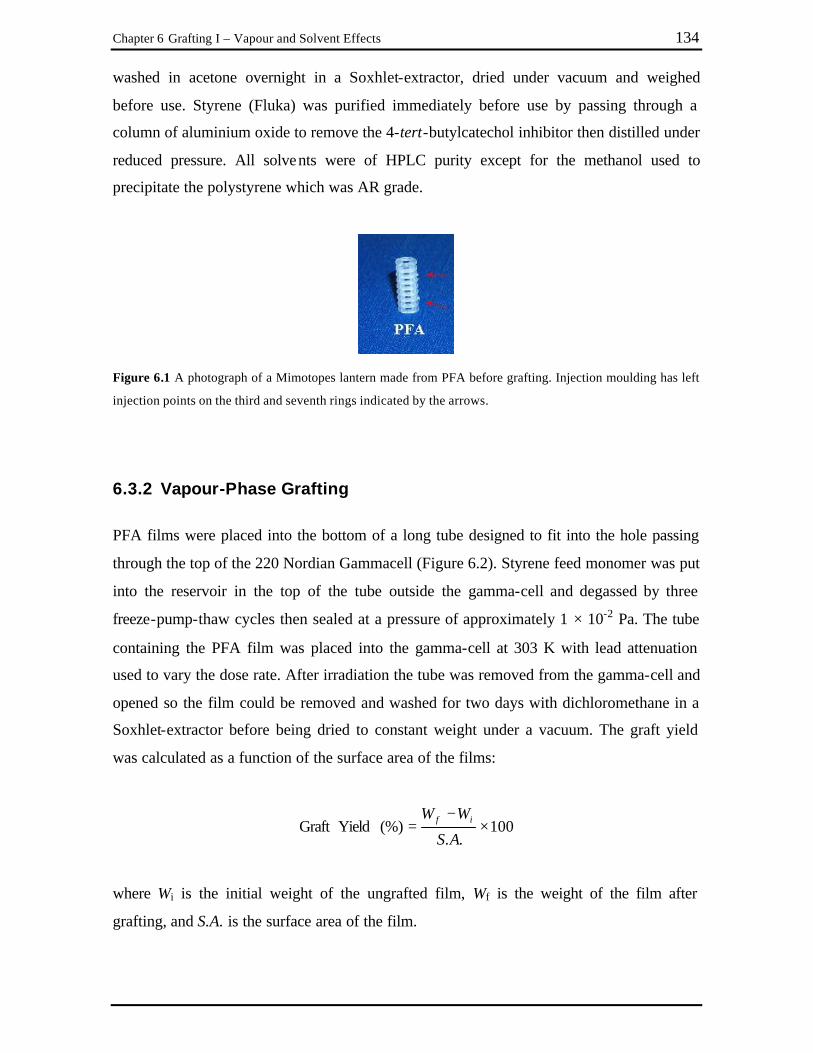
Chapter 6 Grafting I – Vapour and Solvent Effects 134
washed in acetone overnight in a Soxhlet-extractor, dried under vacuum and weighed
before use. Styrene (Fluka) was purified immediately before use by passing through a
column of aluminium oxide to remove the 4-tert-butylcatechol inhibitor then distilled under
reduced pressure. All solvents were of HPLC purity except for the methanol used to
precipitate the polystyrene which was AR grade.
Figure 6.1 A photograph of a Mimotopes lantern made from PFA before grafting. Injection moulding has left
injection points on the third and seventh rings indicated by the arrows.
6.3.2 Vapour-Phase Grafting
PFA films were placed into the bottom of a long tube designed to fit into the hole passing
through the top of the 220 Nordian Gammacell (Figure 6.2). Styrene feed monomer was put
into the reservoir in the top of the tube outside the gamma-cell and degassed by three
freeze-pump-thaw cycles then sealed at a pressure of approximately 1 × 10⁻² Pa. The tube
containing the PFA film was placed into the gamma-cell at 303 K with lead attenuation
used to vary the dose rate. After irradiation the tube was removed from the gamma-cell and
opened so the film could be removed and washed for two days with dichloromethane in a
Soxhlet-extractor before being dried to constant weight under a vacuum. The graft yield
was calculated as a function of the surface area of the films:
100..
(%) YieldGraft ×−
=AS
WW if
where Wi is the initial weight of the ungrafted film, Wf is the weight of the film after
grafting, and S.A. is the surface area of the film.

Chapter 6 Grafting I – Vapour and Solvent Effects 135
Figure 6.2 Glassware used for vapour-phase grafting. The PFA film was in the radiation source, while the
styrene feed monomer was outside the s ource.
6.3.3 Solution Grafting
Grafting reactions were performed by placing one lantern in each tube containing styrene
dissolved in the solvent made up to the desired concentration (total volume 2 mL). The
tubes were sealed with Subaseal brand rubber seals and degassed for 5 minutes by passing a
steady stream of nitrogen gas through a pair of needles passing through the Subaseals. The
samples were then irradiated at 298 K in a 200 Gammacell from the Atomic Energy of
Canada Limited at dose rate of 0.69 kGy hr-1. After irradiation the graft copolymers were
immediately removed from the grafting solutions to minimize any post- irradiation grafting
and washed in the same manner as for the vapour-phase grafted samples. The graft yield
was calculated from the weight increase after grafting:
100(%) YieldGraft ×−
=i
if
W
WW
where Wi is the initial weight of the ungrafted lantern, and Wf is the weight of the lantern
after grafting.

Chapter 6 Grafting I – Vapour and Solvent Effects 136
6.3.4 Microprobe Raman Spectroscopy
Microprobe Raman spectroscopy was performed using a Renishaw System 1000 Raman
spectrometer (Renishaw plc. Wotton-under-Edge, UK) equipped with Renishaw laser diode
emitting at 785 nm. An Olympus MD Plan microscope with a 50 × objective lens was used
to focus the laser to a spot size of approximately 1 µm. Each spectrum was collected in the
static mode for 20 seconds in the range 700 – 1200 cm-1. Graft copolymer samples to be
analyzed were mounted on a microscope slide and held in place with a generic putty. Maps
were made by acquiring spectra over the sample using an automated movable stage.
6.3.5 Size-Exclusion Chromatography (SEC)
Free homopolymer from the surrounding solutions of the solution-phase grafting reactions
was isolated by precipitation into methanol (500 mL), filtration, and drying under vacuum
and then dissolved in tetrahydrofuran (THF) for SEC analysis. Occluded homopolymer was
isolated by removing the grafted lanterns from the grafting solution, then briefly washing
the grafted lanterns in methanol to remove most of the residual styrene. The lanterns were
then soaked in THF for 48 hours to extract the occluded homopolymer. To check that the
THF washing effectively removed all the occluded homopolymer, the lanterns were then
further washed in dichloromethane in a Soxhlet-extractor overnight after which no weight
difference was observed.
SEC was performed using a Waters 2690 Alliance system equipped with two
Waters Ultrastyragel linear columns of dimensions 7.8 × 300 mm coupled in series to a
Waters 410 differential refractometer detector. THF (HPLC grade, EM Science) was used
as the solvent at a flow rate of 1.0 mL min-1. Each sample was prepared to a concentration
of approximately 1 mg mL-1 and 100 µL injections made.
A calibration curve was constructed using narrow molecular weight polystyrene
standards (Pressure Chemical Company, Pittsburgh) of molecular weight: 1.2 × 10⁶,
9.5 × 10⁵, 6.7 × 10⁵, 4.11 × 10⁵, 1.10 × 10⁵, 2.33 × 10⁵, 3.7 × 10⁴, 1.98 × 10⁴, 1.03 × 10⁴,
4.8 × 10³, 2.1 × 10³ and 9.0 × 10² g mol.-1. From the calibration curve the molecular weight
distributions of the free and occluded homopolymer were calculated.

Chapter 6 Grafting I – Vapour and Solvent Effects 137
6.3.6 Loading Tests
6.3.6.1 Aminomethylation
To PFA-g-PS (19 grafted lanterns) and a PP-g-PS control lantern (Mimotopes Pty Ltd) was
added a solution of N-(hydroxymethyl phthalimide) (Lancaster) (0.6 g) and
methanesulfonic acid (Fluka) (2 mL) dissolved in a trifluoroacetic acid / dichloromethane
1:4 solution (40 mL). The grafted lanterns and the aminomethylation solution was shaken
gently at 298 K for 23 hours before the supernatant solution was removed and the lanterns
washed in trifluoroacetic acid / dichloromethane (1:4 ratio, ca. 50 mL) for 10 minutes
followed by washing with dichloromethane (ca. 2 × 50 mL) for 10 and 45 minutes then
methanol
(ca. 50 mL) for 15 minutes. The lanterns were then heated to reflux overnight in a 5 %
solution of hydrazine hydrate (Lancaster) (25 mL) in methanol (500 mL). The lanterns were
then washed in hot methanol (4 × 50 mL for 25 minutes) followed by washing in
dichloromethane (50 mL for 5 minutes), 1 % trifluoroacetic acid / dichloromethane (50 mL
for 15 minutes) then again with dichloromethane (50 mL, 5 minutes) to convert any free
amine to the more stable trifluoroacetic acid salt.
Conversion of the trifluoroacetic acid salt back to the free amine was performed by
reacting the lanterns with a 5 % v/v triethylamine in a 1:1 dimethyl formamide /
dichloromethane mixture (50 mL for 15 minutes), removing the supernatant and adding
another aliquot (50 mL) of the 5 % triethylamine / dimethyl formamide / dichloromethane
solution and leaving for a further 15 minutes. The lanterns were then washed with 1:1
dimethyl formamide / dichloromethane (50 mL, 5 minutes), dichloromethane (50 mL,
5 minutes), 1:1 dimethyl formamide / dichloromethane (50 mL, 5 minutes) and
dichloromethane (50 mL, 5 minutes).
6.3.6.2 Fmoc-Rink Coupling
Fmoc-Rink (1.94 g), 1-hydroxybenzotriazole hydrate (Albatross Chemicals Inc.) (0.66 g)
and N, N’-diisopropyl-carbodiimide (Aldrich) (0.564 mL) were dissolved in a 1:4 dimethyl
formamide / dichloromethane solution (30 mL) and allowed to sit for 5 minutes to activate.

Chapter 6 Grafting I – Vapour and Solvent Effects 138
Portions (1.5 mL) of the Fmoc-Rink solution were added to individual vials containing one
lantern each and gently agitated at 298 K overnight. After Fmoc-Rink coupling the solution
was removed, the lanterns washed with 1:1 dimethyl formamide / dichloromethane mixture
(ca. 10 mL) then each lantern was acetylated by immersing in a solution of acetic anhydride
(0.25 mL) and diisopropylethylamine (0.05 mL) in 1:1 dimethyl formamide /
dichloromethane (2.5 mL) for one hour. The acetylating solution was then removed and the
lanterns washed using the same dichloromethane, dimethyl formamide / dichloromethane
procedure as above. The Fmoc-Rink was cleaved from each of the lanterns by adding a 20
% piperidine / dimethyl formamide solution (10 mL) to each of the individual lanterns in
tubes and allowed to react for two hours. A portion (1 mL) was taken from each vial and
diluted to 1 in 110 with 20 % piperidine / dimethyl formamide solution or 1 in 210 for the
PP-g-PS controls and the UV absorbance measured at 301 nm. The loading of the Fmoc-
Rink groups was calculated from the equation:
[ ] 1nm 301 lantern µm mLin volume/Loading -A ×= ε
where A301 is the UV absorbance of the solution at 301 nm and e = 7800 M-1 cm-1.
6.4 Results and Discussion
6.4.1 Vapour-Phase Grafting
Vapour-phase grafting in the absence of additives represents possibly the most simple
grafting system, free of solvents and significant homopolymer formation. Previous workers
have shown that when monomer vapour is used to graft to polyolefins, the diffusion of the
monomer at the polymer–vapour interface is hindered, resulting in predominately surface
grafting.17,22-25 In this section, the effect of dose and dose rate when grafting of styrene
vapour to films of PFA is examined using the simultaneous grafting method.
The PFA substrate used was in the form of a film 0.5 mm thick. While strictly
speaking a “film” usually refers to a thin object, for simplicity these thick pieces of PFA

Chapter 6 Grafting I – Vapour and Solvent Effects 139
will be referred to as films. The reason 0.5 mm was chosen was to resemble the Mimotopes
lanterns which have rings and struts approximately 0.5 mm thick. To introduce styrene
vapour experiments were performed using long tubes designed so that the monomer feed
solution was outside the radiation source and the PFA film inside the source, surrounded by
the styrene vapour as depicted in Figure 6.2 in the experimental section. This design was
developed after initial experiments with both the styrene and PFA film inside the gamma-
cell failed due to homopolymerization of the feed styrene which led to a drop in the vapour
pressure. The long tube with the monomer liquid outside of the radiation source did not
completely solve this problem as some homopolymerization could be detected at high doses
due to radiation leakage through the top of the gamma-cell. It is unlikely that reaction with
volatile radical fragments from degradation of the PFA would be able to travel the distance
of the tube to the monomer to cause initiation. While it was not done, it is possible that the
addition of a large amount of inhibitor to the feed monomer may prevent
homopolymerization.
Graft yields when PFA films were grafted using styrene vapour for four different
dose rates are shown in Figure 6.3. Since films were used, the graft yield has been
expressed as mass per unit surface area rather than mass increase as a percentage of the
original mass. The reason for this was that each film had slightly different thickness due to
problems with reproducibility and uniformity during film pressing. Since the graft did not
penetrate the entire film, the thickness would not affect the graft yield so this was
considered to be a reasonable measure of the graft yield. In Figure 6.3 it is evident that the
graft yield is independent of dose rate at times less than approximately 10 hours. The
exception is for the highest dose rate examined, 6.2 kGy hr-1, which deviates slightly from
this trend.

Chapter 6 Grafting I – Vapour and Solvent Effects 140
Figure 6.3 Graft yield as a function of time for the grafting of styrene vapour to PFA films using the
simultaneous grafting method.
The initial independence of the graft yield on the dose rate suggested that in the
early stages of the reaction the grafting was diffusion controlled. The same observation has
been made when grafting to PTFE using bulk monomer solutions,1,2,4 although in other
cases the rate of grafting has been observed as being dependent on the dose rate which has
been attributed to radiation- induced crystallization of the substrate and increased
homopolymer formation at high dose rates.12,26,27
At higher grafting times and doses, the plots deviate from being diffusion dependent
and begin to plateau. For example, after 20 hours the graft yield was highest for the low
dose rates while the opposite was true for the highest dose rates. This was due to several
possible reasons. At low dose rates, the grafted chains will be longer as the rate of
termination is low compared with higher dose rates. Longer chains will lead to higher graft
yields for the same number of initiation reactions. In the radical yield plots based on ESR
measurements (Chapter 2, Section 2.3.1), the number of stable radicals present per unit of
radiation reached a plateau at high total dose as combination reactions became important
due to high radical density. This same effect would also lead to a plateau in the graft yield
at high doses. Using high dose rates would result in higher radiation- induced crystallization

Chapter 6 Grafting I – Vapour and Solvent Effects 141
which may lead to lower grafting as styrene cannot penetrate the crystallites. In addition,
the homopolymerization of the monomer may be more of a problem at high dose rates
where there was less lead attenuation allowing for a higher dose rate at the top of the
gamma-cell where the monomer was located.
The distribution of the graft into the substrate is important not only in examining the
mechanism of the grafting process, but also in determining the applicability of the graft
copolymer for use in SPOC. To investigate the penetration depth, microprobe Raman
spectroscopy was used.
6.4.2 Raman Microprobe Mapping of Vapour-Phase Grafted Films
Raman microspectroscopic mapping of grafted polymer surfaces has been demonstrated
recently as a powerful tool in measuring the distribution of poly(styrene) (PS) in a
poly(propylene-g-styrene) copolymer.21,28 In order for this method to be useful, the Raman
spectra of the graft and substrate polymers should be easily distinguishable from one
another. Fortunately, PFA has a rather simple Raman spectrum (Figure 6.4), identical to
PTFE. Peaks include: symmetrical CF2 stretching (1382, 1301 cm-1), asymmetric CF2
stretching (1217 cm-1), C–C stretching (734 cm-1), CF2 rocking and wagging (600,
575 cm-1), CF2 bending (386 cm-1), and CF2 stretching (292 cm-1).29,30 No peaks were
identified which could be used to distinguish between chains in the amorphous and
crystalline regions.
Figure 6.4 Raman spectrum of untreated PFA in the region 3000 - 200 cm-1.

Chapter 6 Grafting I – Vapour and Solvent Effects 142
The Raman spectrum of PS is dominated by a peak at 999 cm-1 in the 1250 to
700 cm-1 region. Comparison of the Raman spectra of PFA and PS over this range is shown
Figure 6.5. The most intense peak in the spectrum of PS at 999 cm-1 has no overlap with the
PFA spectrum and was used as a measure of the PS content in the maps. Likewise, the
characteristic PFA peak at 734 cm-1 was used as a measure of the PFA content.
Figure 6.5 Raman spectra of (a) untreated PFA, and (b) pure PS in the region 1250 – 700 cm-1.
Microprobe Raman spectroscopy was used to map the penetration depth of the graft
into PFA after grafting with styrene vapour at different dose rates. To do this, cross-
sections of the graft copolymer were exposed by physically cutting the grafted films. A
microphotograph of one of these cross-sections is shown in Figure 6.6. The dark regions are
due to the graft while the lighter internal region is due to the PFA substrate. From this
photograph it would appear that there is a layer of PS on the PFA substrate and that there is
a reasonably sharp boundary between the graft and the substrate. To investigate this further,
microprobe Raman spectroscopy was used to construct a radial line map across the grafted
region of the cross-section. Spectra were recorded at 2 µm intervals over the cross-section
with the aid of an automated stage controller. An example of a stack plot constructed from
the Raman spectra of a vapour-phase grafted PFA film is shown in Figure 6.7.

Chapter 6 Grafting I – Vapour and Solvent Effects 143
Figure 6.6 Microscope photograph of a cross-section of a PFA film grafted using styrene vapour.
Raman Shift (cm-1)
Figure 6.7 Stack plot of vapour-phase grafted PFA. The total dose was 19.6 kGy at a dose rate of
1.9 kGy hr-1.
In Figure 6.7 the first three spectra at the front of the stack plots are weak due to the
map being started at the very edge of the cross-section. For these spectra the illumination
spot was only partially incident with the sample. The next several spectra are from the edge
of the cross-sections and was assigned to mostly PS from the intensity of the peak at
999 cm-1, while the spectra at the rear of the plots were recorded from the interiors of the
cross-sections which were composed of mostly PFA (734 cm-1). What was interesting to
note was that the graft was a mixture of both PS and PFA and not just PS and that the
boundary between the graft and the substrate was not sharp but was graded.

Chapter 6 Grafting I – Vapour and Solvent Effects 144
To further quantify these results, a method used Keen et al. was adopted.28 The
mole fraction of PS was calculated from the areas under the peaks at 999 cm-1 and 734 cm-1
then expressed as a fraction of the two signals using the equation:
A PS (999 cm-1) / σ PS (999 cm-1) Mole fraction =
of PS (A PS (999 cm-1) / σ PS (999 cm-1)) + (A PFA (734 cm -1) / σ PFA (734 cm-1))
where A PS(999 cm-1) is the area under the peak at 999 cm-1, A PFA (734 cm-1) is the area under the
peak at 734 cm-1, and σ PS(999 cm-1) and σ PFA(734 cm-1) are the relative Raman scattering cross-
sections. σ PS(999 cm-1) and σ PFA(734 cm-1) were measured by acquiring spectra of pure PS and
PFA, respectively.
Figure 6.8 shows the calculated mole fraction of PS as a function of the distance
from the edge of the cross-sections for PFA films grafted with styrene vapour to various
total doses over a range of dose rates. It should be noted that the edges of the samples from
where the map was started were not perfectly smooth. This introduced an error in the depth
profile estimated to be in the order of ± 10 µm. The depth of grafted layers were between
10 µm and 70 µm and were all a mixture of PFA and PS rather than pure PS. The highest
proportion of PS was observed when a dose rate of 0.56 kGy hr-1 was used for a total dose
of 11.1 kGy, where the mole fraction of PS reached 0.95. The profiles are indicative of a
grafting process which begins at the surface and progresses into the substrate, increasing in
mole fraction of PS with increasing penetration depth, regardless of the dose rate. What is
curious is that in every profile, the mole fraction of PS is lower at the surface than just
below the surface. This effect may be partially due to the large error in the first few spectra
recorded close to the edge of the cross-section where the spectra were very weak and
focusing was a problem due to the rough surface. However, the trend appears to be very
real in samples such as the one irradiated to 11.1 kGy at 0.56 kGy hr-1 where the proportion
of PS reaches a maximum approximately 20 µm from the surface. Surface restructuring due
to migration of the graft below the surface has been postulated based on XPS,31 however,
this occurs on a nanometer scale, not on the micron scale observed here. A more likely
explanation for the increase in the proportion of PS below the surface may be due to
crystallinity heterogeneity throughout the sample. It has been shown using Raman mapping

Chapter 6 Grafting I – Vapour and Solvent Effects 145
that Mimotopes lanterns made from a blend of poly(propylene), poly(ethylene) and
ethylene-propylene rubber have high crystallinity at the surface which was in contact with
the mould.28 The thickness of this highly crystalline layer was approximately 10 – 20 µm.
While the samples used for the vapour-phase grafting were in the form of films, and not
lanterns, it is possible that a similar crystallinity profile was present. It is known that
grafting occurs predominately in the amorphous regions of fluoropolymers which are more
accessible to monomer32 so that any areas with high levels of crystallinity would have low
grafting.
Figure 6.8 Depth penetration profiles of the mole fraction of PS for films grafted with styrene vapour at
different dose rates.
To test the validity of the microprobe Raman mapping as a quantitative method, the
area under each penetration profile was plotted as a function of the graft yield and is shown
in Figure 6.9. While there is a certain amount of scatter, it is evident that the graft yield is

Chapter 6 Grafting I – Vapour and Solvent Effects 146
directly proportional to the area under the penetration profile suggesting that the
microprobe Raman mapping and calculation of mole fraction of PS does have merit as a
quantitative method.
Figure 6.9 The correlation between the area under the Raman profile and the graft yield for vapour-phase
grafted PFA.
6.4.3 Effect of Solvents on the Graft Yield
The use of solvents in grafting reactions can determine the specific nature of the graft
copolymer.33 Solvents have been used to aid the swelling of polyolefin substrates or to
accelerate the grafting reaction by changing the viscosity of the grafted region to lower
termination reactions.34,35 The influence of solvents on the graft yield of monomers to
fluoropolymers, however, has received little attention in the literature. In this section, the
effect that a range of solvents have on the grafting of styrene to PFA is examined.
The solvents chosen in this study have a diverse range of polarities and chemical
compositions ranging from non-solvents for PS to good solvents for PS; they were:
methanol, ethanol, acetonitrile, toluene and dichloromethane. The simultaneous radiation
grafting method was used where the polymer substrate, monomer and solvent (if any) were
all exposed to the radiation source. As well as graft polymer being formed, this method
invariably results in homopolymer formation so that the graft solution becomes a complex

Chapter 6 Grafting I – Vapour and Solvent Effects 147
mixture of polymer substrate, monomer, solvent, graft polymer and homopolymer. PFA
moulded into Mimotopes lanterns were used as the polymer substrate.
Figure 6.10 shows the effect of styrene concentration in the five different solvents
studied on the graft yield to PFA. It is clear that at low monomer concentration the graft
yield is low, while the converse is generally true at high monomer concentration. In dilute
styrene solutions the rate of termination of the grafted chains is large due to lack of
monomer available for propagation and to a lesser extent, high termination via chain
transfer to the solvent. Above 50 % styrene concentration the graft yields for reactions in
each of the solvents becomes complex.
Figure 6.10 Effect of monomer concentration for various solvents. Total dose: 15 kGy, dose
rate: 0.69 kGy hr-1.
It was interesting to observe that some of the solutions became heterogeneous
during the irradiation process. While the dichloromethane and toluene solutions remained
clear, cloudiness and phase-separation was observed in the methanol, ethanol and
acetonitrile solutions. The solutions with initial styrene concentration between 10 % and
30 % became cloudy during the irradiation, whereas the solutions with styrene
concentration between 40 % and 70 % had a cloudy layer sitting above a viscous clear
layer. Above 80 % styrene concentration the solutions remained clear throughout the
irradiation. The size of the clear layer in the phase-separated solutions increased with
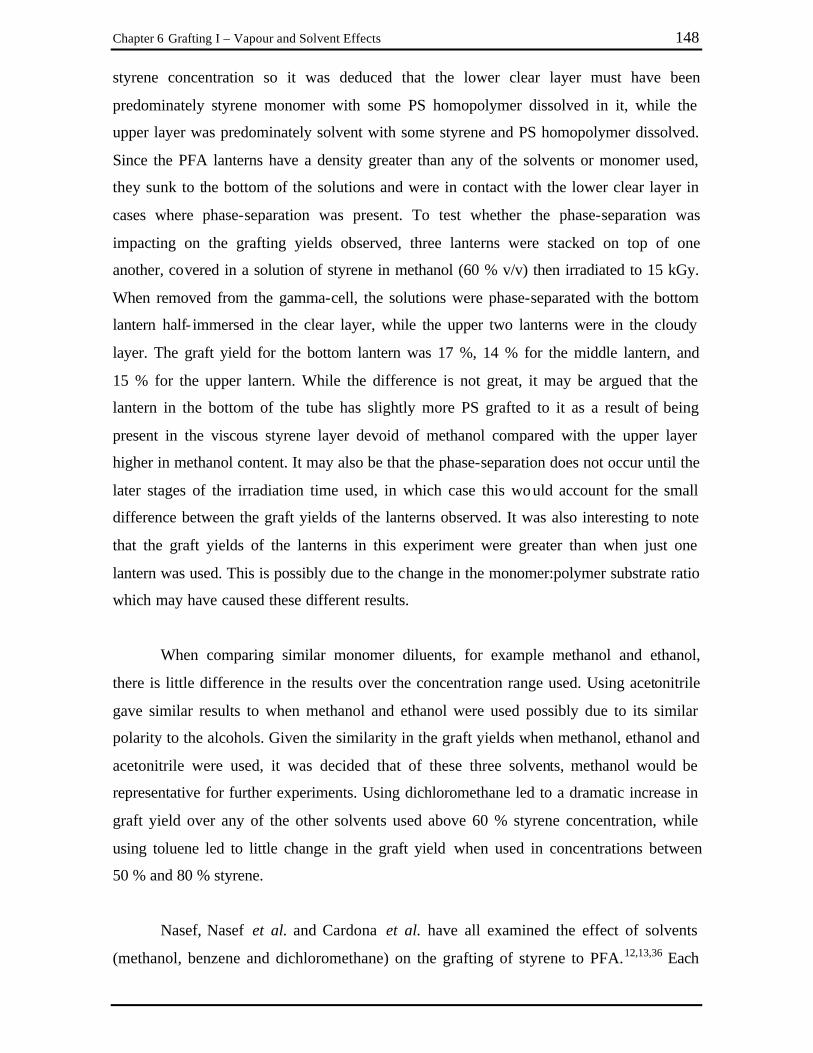
Chapter 6 Grafting I – Vapour and Solvent Effects 148
styrene concentration so it was deduced that the lower clear layer must have been
predominately styrene monomer with some PS homopolymer dissolved in it, while the
upper layer was predominately solvent with some styrene and PS homopolymer dissolved.
Since the PFA lanterns have a density greater than any of the solvents or monomer used,
they sunk to the bottom of the solutions and were in contact with the lower clear layer in
cases where phase-separation was present. To test whether the phase-separation was
impacting on the grafting yields observed, three lanterns were stacked on top of one
another, covered in a solution of styrene in methanol (60 % v/v) then irradiated to 15 kGy.
When removed from the gamma-cell, the solutions were phase-separated with the bottom
lantern half- immersed in the clear layer, while the upper two lanterns were in the cloudy
layer. The graft yield for the bottom lantern was 17 %, 14 % for the middle lantern, and
15 % for the upper lantern. While the difference is not great, it may be argued that the
lantern in the bottom of the tube has slightly more PS grafted to it as a result of being
present in the viscous styrene layer devoid of methanol compared with the upper layer
higher in methanol content. It may also be that the phase-separation does not occur until the
later stages of the irradiation time used, in which case this would account for the small
difference between the graft yields of the lanterns observed. It was also interesting to note
that the graft yields of the lanterns in this experiment were greater than when just one
lantern was used. This is possibly due to the change in the monomer:polymer substrate ratio
which may have caused these different results.
When comparing similar monomer diluents, for example methanol and ethanol,
there is little difference in the results over the concentration range used. Using acetonitrile
gave similar results to when methanol and ethanol were used possibly due to its similar
polarity to the alcohols. Given the similarity in the graft yields when methanol, ethanol and
acetonitrile were used, it was decided that of these three solvents, methanol would be
representative for further experiments. Using dichloromethane led to a dramatic increase in
graft yield over any of the other solvents used above 60 % styrene concentration, while
using toluene led to little change in the graft yield when used in concentrations between
50 % and 80 % styrene.
Nasef, Nasef et al. and Cardona et al. have all examined the effect of solvents
(methanol, benzene and dichloromethane) on the grafting of styrene to PFA.12,13,36 Each

Chapter 6 Grafting I – Vapour and Solvent Effects 149
group of workers reported that when dichloromethane was used as a solvent for styrene
when grafting to PFA, a maximum in the graft yield – solvent composition plots was
observed. Nasef and Nasef et al. reported this maximum at 60 % styrene concentration,
although as they only had points every 20 % the actual maximum could have been
60 ± 20 %. Cardona et al. observed the maximum at 70 ± 10% styrene and also reported a
maximum at 50 ± 10 % when benzene was used, although the maximum was much less
pronounced than when dichloromethane was used. Neither group reported the effect of
monomer composition in methanol on the graft yield. The maximum seen by Cardona et al.
when benzene was used as a diluent is similar to the trend for toluene in Figure 6.10,
however, it was curious why no maximum was seen for dichloromethane in Figure 6.10,
despite one being observed by these two other groups of workers. One explanation may be
the different conditions used. Nasef and Nasef et al. grafted to films of PFA and FEP with
thickness of 120 µm and used a dose rate of 1.32 kGy hr-1, approximately double the dose
rate used here.12,13,37 The total dose they used, 20 kGy, is comparable to that used here.
Cardona et al., like here, grafted to lanterns, although the total dose of 100 kGy at an
unspecified dose rate, is much larger than that used here.
The maxima observed by Nasef et al. when dichloromethane was used, and by
Cardona et al. when dichloromethane and benzene were used, were attributed to viscosity
effects, hence, the maxima may be expected to be dose and graft yield dependent. To
investigate this, a higher total dose of 30 kGy was used with all other parameters the same
as for Figure 6.10. The graft yields when methanol, toluene and dichloromethane were used
are presented in Figure 6.11. In this case the graft yield at 90 % styrene concentration is
approximately the same or lower than the graft yield at 80 % styrene concentration within
the bounds of the error limits. The profiles for when methanol and toluene were used are
similar to those for a dose of 15 kGy, only the graft yields were slightly higher.

Chapter 6 Grafting I – Vapour and Solvent Effects 150
Figure 6.11 Graft yield for higher dose (30 kGy): methanol, toluene and dichloromethane.
The explanation given by Nasef, Nasef et al. and Cardona et al. for the observed
behaviour when dichloromethane was used as the diluent was that styrene diffusion and
concentration in the grafting layers increased with increasing styrene concentration to
approximately 60 to 70% styrene, above which, the homopolymer formation hindered the
diffusion of styrene through the polymer matrix. Nasef and Nasef et al. ignored the
possibility that if the diffusion of styrene is hindered, the motion of the growing chains ends
will be hindered as well, and termination by combination may be lowered, leading to higher
molecular weight grafts, hence higher graft yield. Nasef also contradicts himself by saying
that no homopolymer was observed in the styrene / dichloromethane grafting residue.13
What is more likely is that homopolymer was formed, but because it was completely
soluble in the dichloromethane it was simply not visible to the naked eye. Later in this
chapter, in Section 6.4.5, results of measurement of the homopolymer formation is
presented.
To investigate the enhancing effect increased viscosity may have on grafting,
lanterns were grafted in solutions with artificially high amounts of homopolymer present.
To do this, solutions of styrene in solvent were irradiated to a dose of 15 kGy without any
PFA, then untreated PFA was added to the solutions now containing homopolymer, and
irradiated for a further dose of 15 kGy. The results were compared with PFA grafted under

Chapter 6 Grafting I – Vapour and Solvent Effects 151
standard conditions to 15 and 30 kGy. A control experiment irradiating PFA with just
homopolymer (that is, no monomer) showed that no grafting occurred between the PS
homopolymer and the PFA substrate. The results in Table 6.1 show that for both methanol
and dichloromethane solutions, the graft yield was higher after 15 kGy in the pre- irradiated
solutions compared with the untreated solutions. This would suggest that homopolymer
formation, under the right conditions, increases the graft yield for these two solvents. In the
case of methanol, the graft yield after 15 kGy in the pre- irradiated solution was actually
higher than if PFA was irradiated to 30 kGy in the untreated solution. This may be a
consequence of the phase separation and effective lowering of the methanol concentration
around the PFA substrate. The same trend was not observed for dichloromethane.
Table 6.1 Graft yield in methanol and dichloromethane solutions irradiated to 15 and 30 kGy and
pre-irradiated.
Grafting conditions Styrene / Methanol (70% v/v)
Styrene / Dichloromethane (70% v/v)
15 kGy (standard conditions)
15 31
15 kGy (in a solution pre-irradiated to 15 kGy)
32 43
30 kGy (standard conditions) 20 85
Nasef, Nasef et al. and Cardona et al. are no doubt correct in postulating that at
higher monomer concentration in dichloromethane or benzene the diffusion of styrene into
the substrate is hindered. However, this may not be due to an increase in viscosity due to
homopolymer formation, but may rather simply be that at higher monomer concentration,
there is less solvent available to swell the substrate. This is based on the observations that
increasing the amount of homopolymer increases the graft yield and that no drop in graft
yield was observed when methanol was used at high styrene concentration.
To further characterize the grafted copolymers and investigate the mechanism of
grafting, the distribution of the graft into the PFA substrate was examined using Raman
microprobe mapping.
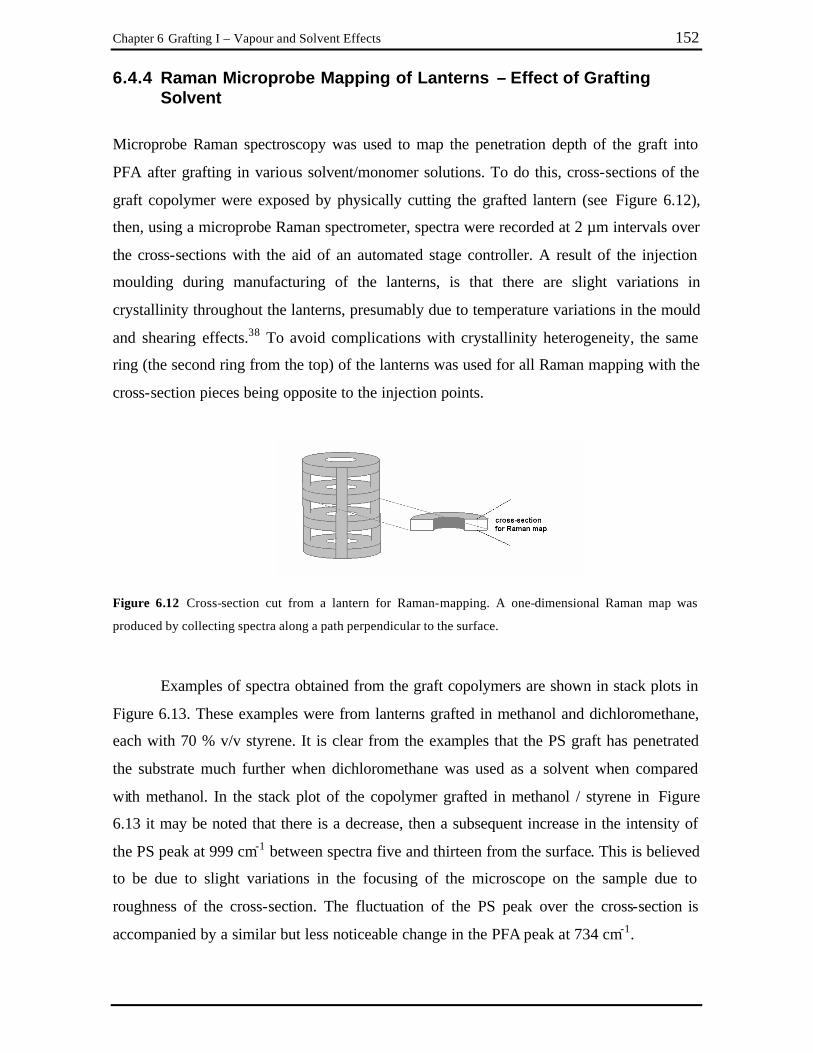
Chapter 6 Grafting I – Vapour and Solvent Effects 152
6.4.4 Raman Microprobe Mapping of Lanterns – Effect of Grafting Solvent
Microprobe Raman spectroscopy was used to map the penetration depth of the graft into
PFA after grafting in various solvent/monomer solutions. To do this, cross-sections of the
graft copolymer were exposed by physically cutting the grafted lantern (see Figure 6.12),
then, using a microprobe Raman spectrometer, spectra were recorded at 2 µm intervals over
the cross-sections with the aid of an automated stage controller. A result of the injection
moulding during manufacturing of the lanterns, is that there are slight variations in
crystallinity throughout the lanterns, presumably due to temperature variations in the mould
and shearing effects.38 To avoid complications with crystallinity heterogeneity, the same
ring (the second ring from the top) of the lanterns was used for all Raman mapping with the
cross-section pieces being opposite to the injection points.
Figure 6.12 Cross-section cut from a lantern for Raman-mapping. A one-dimensional Raman map was
produced by collecting spectra along a path perpendicular to the surface.
Examples of spectra obtained from the graft copolymers are shown in stack plots in
Figure 6.13. These examples were from lanterns grafted in methanol and dichloromethane,
each with 70 % v/v styrene. It is clear from the examples that the PS graft has penetrated
the substrate much further when dichloromethane was used as a solvent when compared
with methanol. In the stack plot of the copolymer grafted in methanol / styrene in Figure
6.13 it may be noted that there is a decrease, then a subsequent increase in the intensity of
the PS peak at 999 cm-1 between spectra five and thirteen from the surface. This is believed
to be due to slight variations in the focusing of the microscope on the sample due to
roughness of the cross-section. The fluctuation of the PS peak over the cross-section is
accompanied by a similar but less noticeable change in the PFA peak at 734 cm-1.
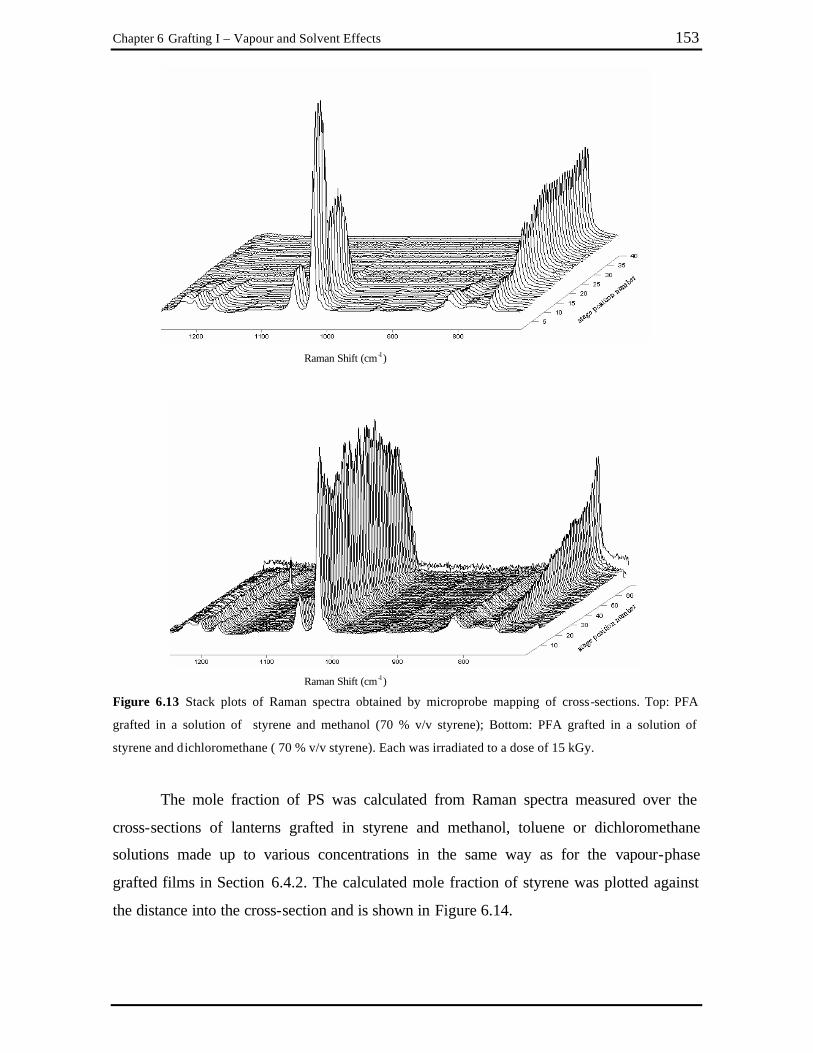
Chapter 6 Grafting I – Vapour and Solvent Effects 153
Raman Shift (cm -1)
Raman Shift (cm -1) Figure 6.13 Stack plots of Raman spectra obtained by microprobe mapping of cross-sections. Top: PFA
grafted in a solution of styrene and methanol (70 % v/v styrene); Bottom: PFA grafted in a solution of
styrene and dichloromethane ( 70 % v/v styrene). Each was irradiated to a dose of 15 kGy.
The mole fraction of PS was calculated from Raman spectra measured over the
cross-sections of lanterns grafted in styrene and methanol, toluene or dichloromethane
solutions made up to various concentrations in the same way as for the vapour-phase
grafted films in Section 6.4.2. The calculated mole fraction of styrene was plotted against
the distance into the cross-section and is shown in Figure 6.14.

Chapter 6 Grafting I – Vapour and Solvent Effects 154
Figure 6.14 Profiles of the mole fraction of PS into graft copolymers prepared by grafting in styrene
dissolved in: (A) methanol; (B) toluene (note: bulk styrene is included in this profile); (C) dichloromethane.
The total dose for all samples was 15 kGy at a dose rate of 0.69 kGy hr-1.

Chapter 6 Grafting I – Vapour and Solvent Effects 155
The profiles in Figure 6.14 show that as with the vapour-phase grafted films, there
was not a sharp boundary between the PS graft and the PFA substrate, but rather the grafted
layer was a mixture of the two polymers. Even at the edge of the cross-sections the graft
never reached a mole fraction of 1.0. This is consistent with the graft growing inwards from
the surface forming a PS/PFA boundary, the thickness being dependent on the conditions
employed for the grafting reaction.
It is clear from Figure 6.14 that the penetration of the graft into the PFA substrate
was greatest when dichloromethane was used as a solvent for styrene across the entire
concentration range examined. This result is reflected in the relatively high graft yield as
seen earlier in Figure 6.10. Conversely, when methanol was used as the solvent, the
penetration was relatively shallow, while when toluene was used it lay somewhere between
the penetration depth for when methanol and dichloromethane were used. When styrene
was grafted to PFA without using a solvent (this profile is shown in Figure 6.14 B), the
penetration was deeper than when methanol or toluene were used, but shallower than when
dichloromethane was used. These observations may be explained in terms of the ability of
each of the solvent / monomer solutions to swell the grafted layers and PFA substrate.
Nasef showed that a mixture of 60 % v/v styrene in methanol, benzene or dichloromethane
swelled thin films of ungrafted PFA by 0.17, 0.22 and 0.4 %, respectively.13 While Nasef
did not report the swelling ability of toluene, it may be assumed that it would give a
comparable result to that reported for benzene, based on their similar polarity. However, it
is not just the swelling of the untreated polymer substrate which is important in the
penetration of the graft. The swelling of the grafted layer, which as the Raman maps show
is composed of both PFA and PS, is also critical. No data is available on the solubility of
PFA-PS copolymers in styrene / solvent mixtures, however some predictions may be made
based on their individual solvent strengths. Toluene, dichloromethane and styrene are all
solvents for PS, while methanol is a non-solvent. A mixture of dichloromethane and styrene
may be expected to be a good swelling solvent for PFA / PS grafted layers as long as the
styrene content is not too high, while a toluene / styrene mix may swell the graft to a
similar extent over a broad concentration range. A methanol / styrene mix conversely
would precipitate the graft and force the chains to lie flat on the surface at high methanol
concentration, whereas, at high styrene concentration, the swelling properties would be
more like that of styrene.

Chapter 6 Grafting I – Vapour and Solvent Effects 156
When methanol was used as a grafting solvent, the penetration of the graft was
relatively shallow as indicated by the Raman maps in Figure 6.14 A for 50, 70 and
90 % v/v styrene in methanol. The difference in the penetration depth for samples grafted in
50 and 70 % v/v styrene is within the error of the measurements, however, the sample
grafted with 90 % v/v styrene obviously had graft penetrating significantly further into the
substrate. At this concentration the methanol may be considered to be present in only
additive amounts and the resulting graft distribution is similar as if bulk styrene (see
Figure 6.14 B) were used.
When toluene was used there was no significant difference in the penetration depths
between 50, 70 % v/v styrene and bulk styrene. This is presumably due to the similar
polarity of toluene and styrene and is also reflected in the similar graft yields at these
concentrations from Figure 6.10 in Section 6.4.3.
The depth profiles of the graft for samples grafted in dichloromethane show that the
dichloromethane is very effective in enabling the styrene to pene trate deep into the PFA
matrix. From the plots in Figure 6.14 C it is quite clear why the graft yield is so much
higher when dichloromethane was used as a solvent compared with any of the other
solvents used. When 50 % v/v styrene in dichloromethane was used, the penetration was
deep but the mole fraction of PS was less than 0.7 at its maximum. Using 70% v/v styrene
resulted in a higher mole fraction of PS in the graft which meant the graft was more “PS-
like” and less “PFA-like” and hence swelled more allowing greater penetration of the graft
front. Using 90 % v/v styrene something different happened. As mentioned earlier in
Section 6.4.3, at high percentage of styrene in the graft solution, there was higher viscosity
in the graft layers due to homopolymer formation and a lower percentage of
dichloromethane which led to lower swelling of the graft and consequently less penetration.
Accompanying the lower penetration was a higher mole fraction of PS in the graft.

Chapter 6 Grafting I – Vapour and Solvent Effects 157
6.4.5 Molecular Weight Distribution of the Homopolymer
It is evident that homopolymer formation plays a pivotal role in the grafting reactions. In
addition, the molecular weight distribution (MWD) of the grafted chains is of interest for
the optimization of the graft copolymer for use in SPOC. Unfortunately, since the graft is
formed through a C–C bond between the PFA and the grafted PS it is not possible to
selectively cleave the graft as has been done for cellulose-g-PS.39 Instead, the MWD of the
homopolymer was measured and used as an estimate of the MWD of the graft. Other
workers have done this for grafted polyolefins,40 however, it is believed that this is the first
time the homopolymer formation has been investigated for a range of solvents when
grafting to a fluoropolymer.
Since the simultaneous radiation-grafting method was used, homopolymer formed
not only in the solutions surrounding the graft copolymer, but in the swollen grafted regions
as well. To distinguish between the homopolymer formed in these two regions, the
homopolymer formed in the grafted regions will be referred to as occluded homopolymer,
while the polymer formed in solution will be referred to as free homopolymer. The latter
was isolated by simply decanting the excess solution after grafting followed by
precipitation into methanol and isolation by filtration, while the former was isolated by
soaking the grafted copolymers in a known volume of tetrahydrofuran (THF) for 48 hours
to extract the occluded homopolymer. It should be noted that the MWD of the occluded
homopolymer for the vapour-phase grafting was not measured as the amounts of
homopolymer formed around the sample was less than is practical for SEC sample
preparation.
The conversion of the isolated free homopolymer is presented in Table 6.2 for each
of the solvents studied. With the exception of toluene and dilute alcohol solutions, addition
of solvents increased the percent conversion compared with bulk styrene. The low
conversion values in Table 6.2 reported for dilute alcohol solutions was due to loss of very
fine homopolymer particles during the filtration step leading to lower than expected values.
The effect of the solvents was to act as additional initiation sources via radical fragments
formed as a result of the exposure to radiation.

Chapter 6 Grafting I – Vapour and Solvent Effects 158
Table 6.2 Percentage conversion of styrene to PS for each solvent over a concentration range. The total dose
was 15 kGy at a dose rate of 0.69 kGy hr-1.
% Conversion Styrene
concentration (vol %) MeOH EtOH MeCN Toluene CH2Cl2 Bulk styrene
20 … … … 5.1 … -
30 2.4 … 6.1 5.1 11.1 - 40 1.4 4.8 6.5 6.0 11.0 - 50 5.8 7.0 7.3 5.1 10.8 - 60 8.0 9.8 7.7 6.1 10.6 - 70 10.1 11.5 8.6 5.1 9.8 - 80 13.3 11.4 8.6 5.6 9.1 - 90 14.3 10.7 - - 9.1 -
100 - - - - - 5.1
… indicates that no homopolymer was isolated because it was too fine for the filters used.
THF solutions of occluded and free homopolymer were analyzed by SEC. The
concentration of occluded homopolymer in the THF solutions was calculated from lanterns
which were grafted in parallel and dried and weighed before and after washing of the
occluded homopolymer. Some of the key SEC chromatograms are presented in Figure 6.15.
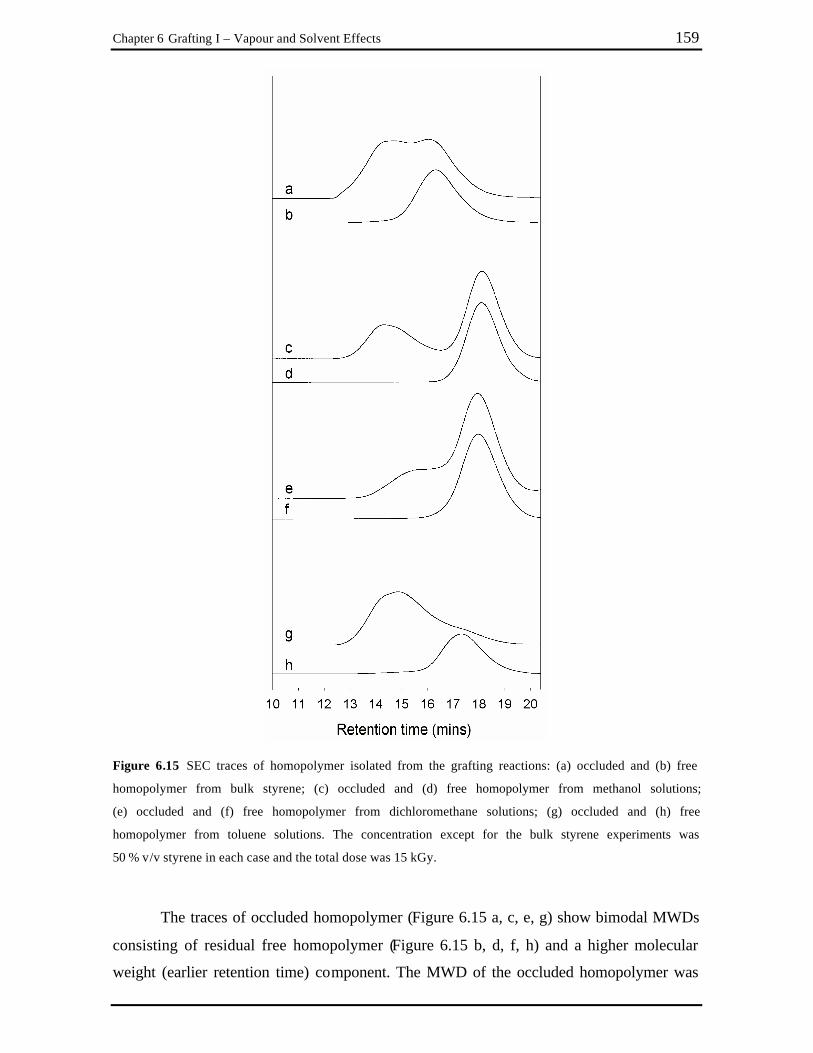
Chapter 6 Grafting I – Vapour and Solvent Effects 159
Figure 6.15 SEC traces of homopolymer isolated from the grafting reactions: (a) occluded and (b) free
homopolymer from bulk styrene; (c) occluded and (d) free homopolymer from methanol solutions;
(e) occluded and (f) free homopolymer from dichloromethane solutions; (g) occluded and (h) free
homopolymer from toluene solutions. The concentration except for the bulk styrene experiments was
50 % v/v styrene in each case and the total dose was 15 kGy.
The traces of occluded homopolymer (Figure 6.15 a, c, e, g) show bimodal MWDs
consisting of residual free homopolymer (Figure 6.15 b, d, f, h) and a higher molecular
weight (earlier retention time) component. The MWD of the occluded homopolymer was

Chapter 6 Grafting I – Vapour and Solvent Effects 160
calculated by subtracting the free homopolymer component of the chromatograms b, d, f
and h to give a chromatogram approximating the occluded polymer. The number-average
(Mn) and weight-average (Mw) molecular weights and the polydispersity (PD) were
calculated using Equations 1-3:
Equation 1 Mn = ? n i.Mi / ? ni = ? Hi / ? H i / mi
Equation 2 Mw = ? ni.Mi
2 / ? ni.Mi = ? M i.Hi / ? Hi
Equation 3 PD = Mw / Mn
where Mi is the molecular weight of a molecule and ni is the number of such molecules.
These values were extracted from the chromatograms using Hi as the detector response and
mi as the molecular weight at this detector response, obtained from the calibration curve. In
each case the PD was 2.0 – 2.1, consistent with a random MWD.41 The termination
mechanism for conventional free radical polymerization of bulk styrene is mainly by
combination (77 %) and to a less extent by disproportionation (23 %) which would lead to
PD closer to 1.5.42 However, in the grafting system the presence of solvents will mean that
termination by chain transfer to the solvent or by combination with small radical fragments
will play an important role. A feature of radiolysis is that it attacks all components in the
system including the solvent which may explain why the PD was higher than for
conventional free radical polymerization.
The calculated Mn values of the free and occluded homopolymer for samples
grafted with bulk styrene and 50 % v/v solutions are shown in Table 6.3. The lower Mn
values of the free homopolymer when solvents were used compared with when bulk styrene
was used is consistent with lower monomer availability and additional termination by chain
transfer to the respective solvents. The order of the chain transfer constants are:
methanol (0.3) > dichloromethane (0.15) > toluene (0.11).43 This is reflected in the MWD
of the free homopolymer where MWD in methanol < dichloromethane < toluene. The same
trend was not observed for the occluded homopolymer and obviously the mobility of the
growing PS chains is important. The higher molecular weight polymer can be considered to
originate in the highly viscous swollen grafted regions where motion of the growing chains
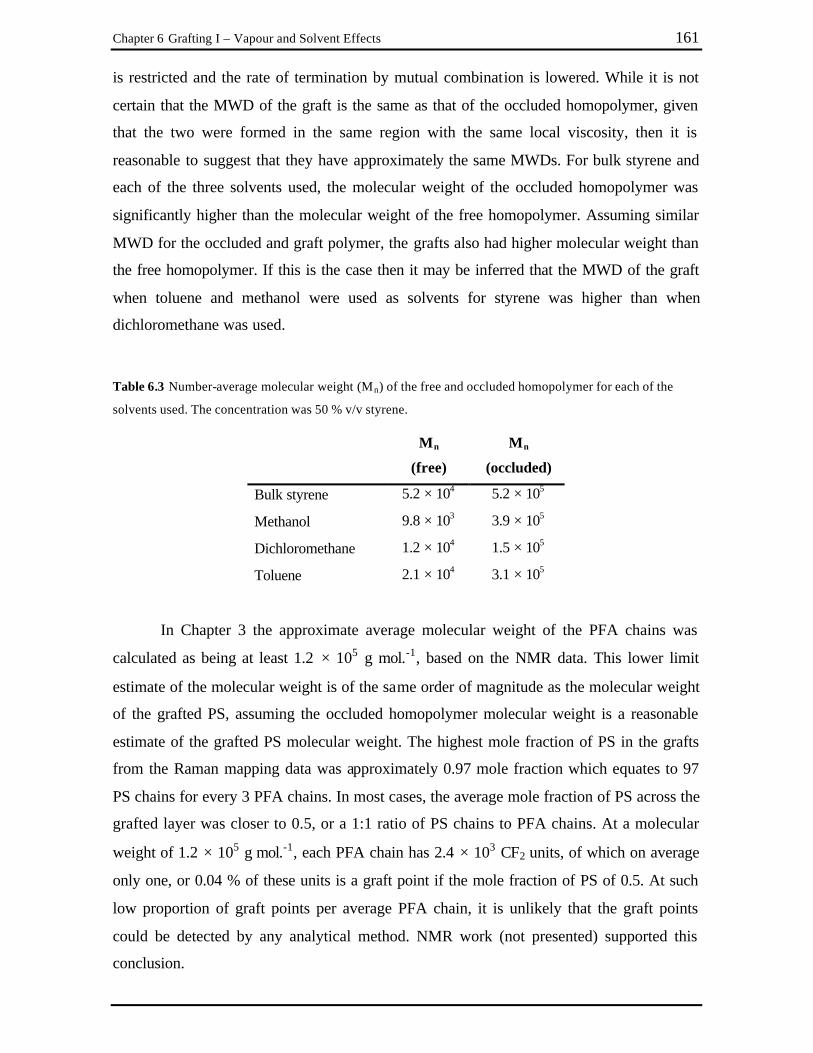
Chapter 6 Grafting I – Vapour and Solvent Effects 161
is restricted and the rate of termination by mutual combination is lowered. While it is not
certain that the MWD of the graft is the same as that of the occluded homopolymer, given
that the two were formed in the same region with the same local viscosity, then it is
reasonable to suggest that they have approximately the same MWDs. For bulk styrene and
each of the three solvents used, the molecular weight of the occluded homopolymer was
significantly higher than the molecular weight of the free homopolymer. Assuming similar
MWD for the occluded and graft polymer, the grafts also had higher molecular weight than
the free homopolymer. If this is the case then it may be inferred that the MWD of the graft
when toluene and methanol were used as solvents for styrene was higher than when
dichloromethane was used.
Table 6.3 Number-average molecular weight (Mn) of the free and occluded homopolymer for each of the
solvents used. The concentration was 50 % v/v styrene.
Mn
(free)
Mn
(occluded)
Bulk styrene 5.2 × 10⁴ 5.2 × 10⁵
Methanol 9.8 × 10³ 3.9 × 10⁵
Dichloromethane 1.2 × 10⁴ 1.5 × 10⁵
Toluene 2.1 × 10⁴ 3.1 × 10⁵
In Chapter 3 the approximate average molecular weight of the PFA chains was
calculated as being at least 1.2 × 10⁵ g mol.-1, based on the NMR data. This lower limit
estimate of the molecular weight is of the same order of magnitude as the molecular weight
of the grafted PS, assuming the occluded homopolymer molecular weight is a reasonable
estimate of the grafted PS molecular weight. The highest mole fraction of PS in the grafts
from the Raman mapping data was approximately 0.97 mole fraction which equates to 97
PS chains for every 3 PFA chains. In most cases, the average mole fraction of PS across the
grafted layer was closer to 0.5, or a 1:1 ratio of PS chains to PFA chains. At a molecular
weight of 1.2 × 10⁵ g mol.-1, each PFA chain has 2.4 × 10³ CF2 units, of which on average
only one, or 0.04 % of these units is a graft point if the mole fraction of PS of 0.5. At such
low proportion of graft points per average PFA chain, it is unlikely that the graft points
could be detected by any analytical method. NMR work (not presented) supported this
conclusion.

Chapter 6 Grafting I – Vapour and Solvent Effects 162
6.4.6 Loading of Grafted Substrates
Loading tests were performed on the grafted copolymers to determine which are most
suitable for SPOC. The loading test is a measure of how much of the grafted PS can be
bonded with a linker and functional group. The test is performed by bonding a Fmoc-Rink
group to the available PS then cleaving the Fmoc groups.44 By measuring the intensity of
the ultra-violet absorption of the cleaved groups in solution, the amount of Fmoc-Rink
which was loaded onto the solid support can be calculated. The mechanism of the
Fmoc-Rink test is shown in Scheme 6.1.
To obtain meaningful results from the Fmoc-Rink loading tests, scale-ups of the
grafting reactions were done to obtain five lanterns grafted under each of the conditions
chosen so that the loading results were an average of five separate experiments. Lanterns
were grafted using bulk styrene, styrene vapour and styrene in methanol, toluene and
dichloromethane. The concentrations of the solutions used are shown in Table 6.4. The
doses used for each condition were chosen so that the graft yield in each case was similar.
Apart from the dilute methanol solutions, the graft yield in all cases was between 12 and
16 %. The loading figures in Table 6.4 were expressed in terms of the graft yield so that a
direct comparison could be made for all the lanterns prepared using the different grafting
conditions. The loading tests show that lanterns grafted in styrene vapour had higher
loading than lanterns grafted in bulk styrene for similar graft yields. While a direct
comparison was not made using the Raman mapping for lanterns grafted under these two
conditions, it may be assumed that the higher surface grafting characteristic of
vapour-phase grafting was responsible for the better loading performance of the vapour-
phase grafted samples due to better accessibility of the reagents during the loading
reactions.

Chapter 6 Grafting I – Vapour and Solvent Effects 163
n
HO
OO
NH
O
O
O
O
N
O
O
CH2 OH
CH3 SO
OOH
N
O
O
n
H2N NH2
NH2
nHOBt.H2O
DIC
NH
n
OO
NH
O
O
O
O
20 % DMF / PIP
PFA-g-PS
OO
NH2
O
O
n
NH
N
H
UV-active group
+
= PFA lantern
Scheme 6.1 Mechanism of the Fmoc-Rink loading test.

Chapter 6 Grafting I – Vapour and Solvent Effects 164
Table 6.4 Results of Fmoc loading tests.
Solvent % styrene
(v/v)
Total dose used (kGy)
Graft Yield (%)
Loading (µmol / lantern)
Loading / mg of graft
Styrene (bulk) 100 12 13 27 2.0
Styrene (vapour) n.a. 15 16 65 4.0
Methanol 30 30 5 27 5.5
Methanol 50 15 8 46 5.7
Methanol 70 12 12 57 4.8
Toluene 50 15 12 11 1.0
Dichloromethane 50 15 13 3 0.2
When solvents were used in the grafting reactions, the resulting grafted lanterns
exhibited a wide range of loading capacities. While the highest graft yield was observed
when dichloromethane was used as a solvent, these lanterns had the lowest loading of
0.2 µmol. per mg of PS graft. This result stemmed from the distribution of the graft into the
PFA. Since most of the graft was buried below the sur face, the reagents used to
functionalize the PS would not be able to reach the majority of the graft. Conversely,
lanterns grafted in methanol solutions exhibited good loading characteristics. Unfortunately
comparison of the loading results of the three different concentrations was difficult because
of the variation in graft yield over the concentration range, however there does not appear
to be a great difference when the loading is expressed in terms of loading per mass of graft.
The high loading of PFA grafted in methanol solutions can be attributed to the graft being
limited to the near surface area. The loading for samples grafted in toluene solutions, like
the depth profiles from microprobe Raman spectroscopy, was between that of samples
grafted using methanol and dichloromethane.

Chapter 6 Grafting I – Vapour and Solvent Effects 165
6.5 Conclusions
Grafted solid supports have been prepared which may be used in high temperature SPOC
applications. To obtain these supports, a number of different grafting conditions were
examined, including vapour-phase grafting and solution-phase grafting. The graft
copolymers were characterized in terms of their graft yield and the penetration of the graft
into the substrate using microprobe Raman spectroscopy. The vapour-phase grafting was
found to be diffusion controlled at low grafting times and at dose rates of 2.8 kGy hr-1 or
below. At higher grafting times the factors influencing the grafting such as changes in
crystallinity, radical-radical recombination reactions and possibly loss of vapour pressure
due to homopolymerization of the feed monomer led to deviation from independence on the
dose rate.
Solution-phase grafting was shown to be highly dependent on the solvents and the
concentrations in which they were used in terms of the graft yield, penetration profile of the
graft and loading characteristics. The penetration depth of the grafts decreased in the order:
dichloromethane > toluene > methanol. Despite grafting reactions performed in methanol
having low graft yield and penetration, the loading tests showed that this was the most
successful solvent for preparing supports for SPOC. The molecular weight of the
homopolymer formed in the grafted regions was significantly higher than that formed in the
surrounding solutions which would suggest the same may be true of the graft.

Chapter 6 Grafting I – Vapour and Solvent Effects 166
6.6 References
1. Chapiro, A., J. Polym. Sci. 34, 481-501 (1959). 2. Chapiro, A., Matsumoto, A., J. Polym. Sci. 57, 743-761 (1962). 3. Gupta, B., Scherer, G. G., Chimia 48, 127-137 (1994). 4. Hegazy, E. A., Ishigaki, I., Okamoto, J., J. Appl. Polym. Sci. 26, 3117-3124 (1981). 5. Hegazy, E. A., El-Assy, N. B., Rabie, A. M., Ishigaki, I., Okamoto, J., J. Polym. Sci.
22, 597-604 (1984). 6. Hegazy, E. A., Dessouki, A. M., Rabie, A. M., Ishigaki, I., J. Polym. Sci. Polymer
Chem Ed. 22, 3673-3685 (1984). 7. Hegazy, E. A., Taher, N. H., Kamal, H., J. Appl. Polym. Sci. 38, 1229-1242 (1989). 8. Hegazy, E. A., Taher, N. H., Ebaid, A. R., J. Appl. Polym. Sci. 41, 2637-2647
(1990). 9. Hegazy, E. A., Osman, M. B. S., Mokhtar, S. M., Mostafa, A. E. B., Polymer 33,
4230-4235 (1992). 10. El-Sawy, N. M., Hegazy, E. A., Rabie, A. M., Hamed, A., Miligy, G. A., Polym. Int.
33, 285-291 (1994). 11. Gupta, B., Buchi, F., Scherer, G. G., J. Polym. Sci., A, Polym. Chem. 32, 1931-1938
(1994). 12. Nasef, M. M., Saidi, H., Nor, H. M., Dahlan, K. Z. M., Hashim, K., J. Appl. Polym.
Sci. 73, 2095-2102 (1999). 13. Nasef, M. M., Polym. Int. 50, 338-346 (2001). 14. Gupta, B. D., Chapiro, A., Eur. Polym. J. 25, 1145-1148 (1989). 15. Walsby, N., Paronen, M., Juhanoja, J., Sundholm, F., J. Polym. Sci., A, Polym.
Chem. 38, 1512-1519 (2000). 16. Brack, H., Buhrer, H. G., Bonorand, L., Scherer, G. G., J. Mater. Chem. 10, 1795-
1803 (2000). 17. Kamel, I., Machi, S., Silverman, J., J. Polym. Sci., Part A-1 10, 1019-1029 (1972). 18. Smekal, A., Naturwiss. 11, 873 (1923). 19. Raman, C. V., Krishnan, K. S., Nature 121, 501 (1928).
Chapter 6 Grafting I – Vapour and Solvent Effects 167
20. Landsberg, G., Mandelstam, L., Naturwiss. 16, 557 (1928). 21. Keen, I., Rintoul, L., Fredericks, P. M., Macromolecular Symposia 184, 287-298
(2002). 22. Imai, M., J. Polym. Sci., A, Polym. Chem. 14, 2887-2894 (1976). 23. Yamamoto, F., Yamakawa, S., Kato, Y., J. Polym. Sci., A, Polym. Chem. 16, 1883-
1895 (1978). 24. Yamamoto, F., Yamakawa, S., Kato, Y., J. Polym. Sci., A, Polym. Chem. 16, 1897-
1907 (1978). 25. Austin, M. E., Busfield, W. K., Pomery, P. J., Eur. Polym. J. 31, 683-687 (1995). 26. Hegazy, E. A., Dessouki, A. M., El-Assy, N. B., El-Sawy, N. M., El-Ghaffar, M. A.
A., J. Polym. Sci., A, Polym. Chem. 30, 1969-1976 (1992). 27. Nasef, M. M., Saidi, H., Dessouki, A. M., El-Nesr, E. M., Polym. Int. 49, 399-406
(2000). 28. Keen, I., Rintoul, L., Fredericks, P. M., Appl. Spec. 55, 984-991 (2001). 29. Legeay, G., Coudreuse, A., Legeais, J.-M., Werner, L., Bulou, A., Buzare, J.-Y.,
Emery, J., Silly, G., Eur. Polym. J. 34, 1457-1465 (1998). 30. Cutler, D. J., Hendra, P. J., Rahalkar, R. R., Cudby, M. E. A., Polymer 22, 726-730
(1981). 31. Tan, K. L., Woon, L. L., Wong, H. K., Kang, E. T., Neoh, K. G., Macromolecules
26, 2832-2836 (1993). 32. Hietala, S., Holmberg, S., Karjalainen, M., Nasman, J., Paronen, M., Serimaa,
R., Sundholm, F., Vahvaselka, S., J. Mater. Chem. 7, 721-726 (1997). 33. Chapiro, A. Radiation Chemistry of Polymeric Systems. In: High Polymers; Mark,
H.; Marwell, C. S.; Melville, H. W. Eds.; Interscience: New York, 1962; Vol. XV.; p. 598.
34. Odian, G., Henry, R., Koenig, R., Mangaraj, D., Trung, D., Chao, B., Derman, A.,
J. Polym. Sci., Polym. Chem. 13, 623 (1975). 35. Machi, S., Kamel, I., Silverman, J., J. Polym. Sci., Part A-1 8, 3329-3337 (1970). 36. Cardona, F., George, G. A., Hill, D. J. T., Rasoul, F., Maeji, J., Macromolecules 35,
355-364 (2002). 37. Nasef, M. M., Saidi, H., Nor, H. M., J. Appl. Polym. Sci. 76, 220-227 (2000).

Chapter 6 Grafting I – Vapour and Solvent Effects 168
38. Cardona, F. (University of Queensland), Personal Communication 39. Garnett, J. L., Jankiewicz, S. V., Sangster, D. F., Radiat. Phys. Chem. 36, 571-579
(1990). 40. Berg, R. H., Almdal, K., Pedersen, W. B., Holm, A., Tam, J. P., Merrifield, R. B.,
J. Am. Chem. Soc. 111, 8024-8026 (1989). 41. Rudin, A. Molecular Weight Distributions. In: Comprehensive Polymer Science;
Allen, G.; Berington, J. C. Eds.; Pergamon Press: Oxford, 1989; Vol. 3; pp. 239-244.
42. Allcock, H. R., Lampe, F. W. Contemporary Polymer Chemistry; Prentence Hall,
Inc.: New Jersey, 1981. 43. Brankdrup, J., Immergut, E. H. Polymer Handbook; John Wiley and Sons: New
York, 1999. 44. Maeji, N. J., Valerio, R. M., Bray, A. M., Campbell, R. A., Geysen, H. M., React.
Polym. 22, 203-212 (1994).

Chapter 7
7 Grafting II – Grafting by “Living” Polymerization
7.1 Introduction
Controlled or “living” polymerizations have aroused intense interest from polymer chemists
in the past few years due to of the prospect of alleviating many of the limitations of free
radical polymerization. Some of these limitations arise from the lack of control of the
process, leading to structures with undefined molecular weight distribution, structure and
end groups. Controlled polymerizations offer the prospect of narrow polydispersity
homopolymers, high purity block copolymers and end functionalized polymers.1
The forms of controlled polymerizations available include nitroxide-mediated
“living” free radical polymerization,2 atom transfer radical polymerization (ATRP)3-5 and
reversible addition fragmentation chain transfer (RAFT) polymerization.6,7 Of these
“living” free radical polymerization (LFRP) techniques, this chapter will only be concerned
with using nitroxides as the LFRP agent, although all three methods are based on the same
premise that the growing chains permanently undergo reversible dissociation of the end
groups.
The synthesis of well-defined polymers by “living” free radical methods was first
demonstrated by Rizzardo and coworkers in the early 1980s using stable nitroxide free
radicals.2 Nitroxide species, when used in certain polymerizations, act to mediate the
reactivity of the growing polymer chains by forming thermally unstable alkoxy amine chain
ends. An equilibrium is formed between the dormant alkoxy amine chain ends and active
free radical chain ends upon homolysis of the carbon-oxygen bond of the alkoxy amine
(Scheme 7.1). In the free radical state, more monomer units can add before the growing
chains are reversibly terminated by the nitroxide radical. The reversible reaction between
active and dormant chain ends gives the polymerization a “living” character.

Chapter 7 Grafting II – Grafting by “Living” Polymerization 170
I.
+I .
n
n
.I
+ O NR
R'
. IO N
R
R'
n
I .
n + 1
Scheme 7.1 Proposed mechanism for nitroxide-mediated polymerization.
This technique has enabled control of chain ends, molecular weight and
macromolecular architecture for the polymerization of a number of monomers.8-11 The
polydispersity attainable with nitroxide-mediated polymerization is typically below 1.5
(conventional radical polymerization with termination by chain transfer or
disproportionation will give polydispersity of approximately 2.0, or 1.5 for combination
termination).1,12
Normally nitroxide-mediated LFRPs are performed by adding an initiator and a
nitroxide to bulk monomer and heating between 353 and 408 K. At these temperatures the
alkoxy amine will readily dissociate so that additional monomer units can add to the
growing chains before being capped by the nitroxide. This process of dissociation,
monomer addition, and re-association continues until either all the monomer is consumed
or the reaction is stopped by the operator.

Chapter 7 Grafting II – Grafting by “Living” Polymerization 171
The linear, narrow molecular weight distribution polymers attainable using LFRP
potentially have an application in SPOC since well-defined, uniform solid supports, in the
form of a surface or a bead, may be expected to lead to better loading and reaction kinetics.
Recently, workers at the Park-Davis laboratories reported using nitroxide-mediated LFRP
to graft what was believed to be long straight chain polymers bearing functional groups to a
crosslinked PS core (Merrifield resin).13 These resins, called “Rasta” resins (Figure 7.1 A),
when prepared using styrene and 3- isopropenyl-a,a-dimethylbenzyl isocyanate (TMI)
monomers to incorporate isocyanate functional groups, (Figure 7.1 B) exhibited higher
loading than Merrifield resin. Optical analysis experiments bonding fluorescence probes to
the isocyanate moieties showed that the isocyanate groups were distributed throughout the
entire resin, suggesting that during the LFRP step the reagents are free to diffuse
throughout the Merrifield resin.14 Control of the polymerization allows the customized
spacing of the functional groups through judicious choice of comonomers and fine-tuning
of solvent affinity.
A B
Figure 7.1 (A) Cartoon picture of “Dreadlocked” “Rasta” resin; (B) TMI / styrene “Rasta” resin (taken from
reference [13]).
Other high- loading resins have also been reported using dendrimers bound to a resin
core,15 however, in this case the dendrites were part of the linker groups and not the
polymeric substrate and will not be discussed further other than to mention that it
demonstrates the potential of well-defined supports for high loading.
Graft copolymers have been prepared using LFRP by including an alkoxy amine in
the backbone of the base polymer during the synthesis step.16 Grafting involves heating the
backbone polymer with incorporated alkoxy amine groups in the presence of a monomer to
form a graft copolymer with controlled molecular weight. While this chapter of the thesis is
mainly concerned with using nitroxide LFRP to form graft copolymers, it should be noted

Chapter 7 Grafting II – Grafting by “Living” Polymerization 172
that other “living” techniques have been used to prepare graft copolymers. Recent examples
include the use of ATRP to control grafting of styrene to the fluoropolymer PVDF,17 and
the use of RAFT to graft various monomers to polypropylene.18
A novel method for using nitroxide-mediated LFRP to graft a polymer to a
pre-existing polymer was recently demonstrated by Miwa et al.19 Using the pre- irradiation
peroxy grafting method (outlined in Chapter 1, Section 1.5.1), these workers were able to
graft styrene to polypropylene with control of the molecular weight of the graft using the
classical nitroxide, 2,2,6,6-tetramethyl-1-piperidinyloxy (TEMPO). Their method involved
initially irradiating polypropylene in the presence of air to create hydroperoxy groups.
Styrene and TEMPO were then added to the irradiated polypropylene and heated. The
hydroperoxy groups decomposed to form oxy radicals, which initiated the graft
copolymerization of styrene (Scheme 7.2). A consequence of using oxy radicals as the
initiating species was that an ether group was formed between the polymer substrate and
the graft. Miwa et al. exploited the presence of the acid sensitive ether group by selectively
cleaving the graft through the ether bond by treatment with trifluoroacetic acid in toluene.
This allowed the measurement of the MWD of the cleaved graft using SEC. Comparison of
the MWD of the graft and free homopolymer revealed little difference between the two. It
is interesting to note that they were only able to cleave approximately 1 % of the grafted
chains by treatment with acid. The end groups of the cleaved PS were identified as hydroxy
groups by NMR, thereby proving that the PS isolated was not a product of thermal
auto-initiation. Unfortunately, when the hydroperoxy groups on the polypropylene
decompose to form oxy radicals during the grafting reactions, they produce •OH radicals
capable of initiating homopolymerization of styrene.20 Therefore, while much of the
homopolymer may be expected to have end groups resulting from thermal auto- initiation,21
in this case there may also be some homopolymer formed from reaction of styrene with •OH radicals. Hence, it may be possible that Miwa et al. may have simply removed
occluded homopolymer during their cleavage reaction, which would explain why most of
the graft remained bonded to the polypropylene substrate after the cleavage reaction.
The pre- irradiation peroxy method has draw-backs when grafting to PFA where the
application is for SPOC supports. Firstly, PFA becomes very brittle when irradiated in air.22
Secondly, the presence of acid sensitive ether groups is undesirable when the graft
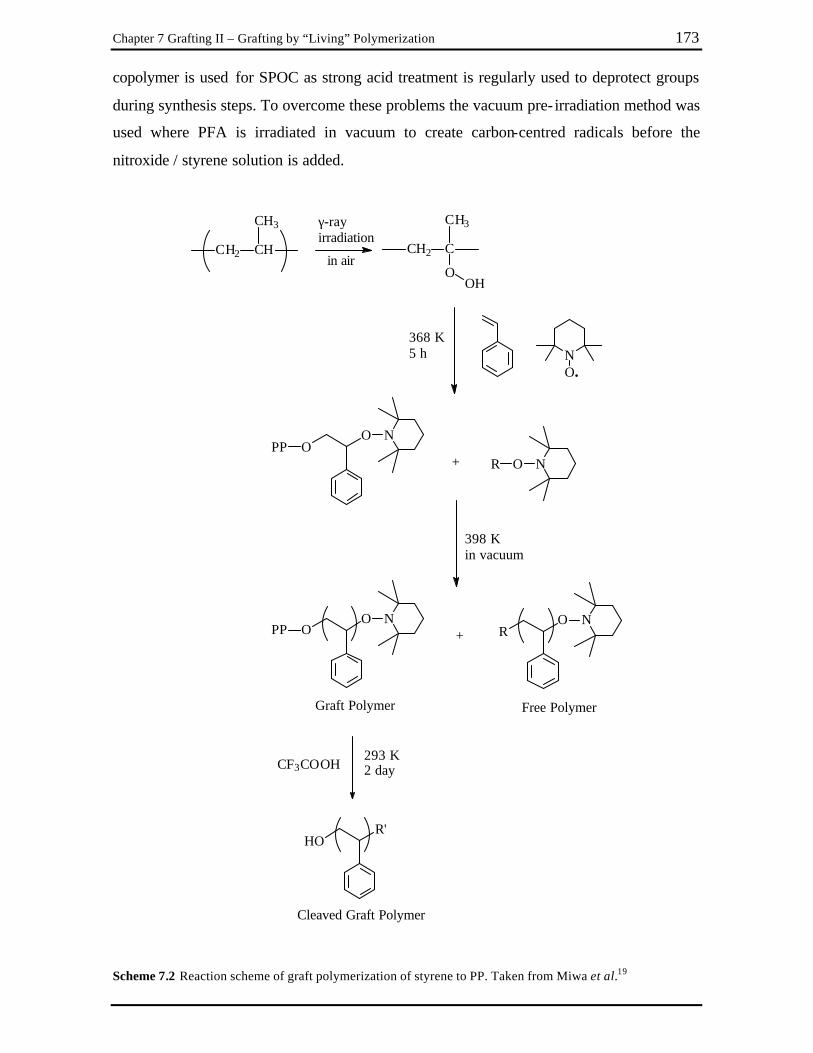
Chapter 7 Grafting II – Grafting by “Living” Polymerization 173
copolymer is used for SPOC as strong acid treatment is regularly used to deprotect groups
during synthesis steps. To overcome these problems the vacuum pre- irradiation method was
used where PFA is irradiated in vacuum to create carbon-centred radicals before the
nitroxide / styrene solution is added.
CH2 CH
CH3
CH2 C
CH3
OOH
NO.
368 K5 h
+ O NR
γ-rayirradiation
in air
OPPO N
398 Kin vacuum
OPPO N
+ RO N
Graft Polymer Free Polymer
CF3COOH293 K2 day
HOR'
Cleaved Graft Polymer
Scheme 7.2 Reaction scheme of graft polymerization of styrene to PP. Taken from Miwa et al.19
Chapter 7 Grafting II – Grafting by “Living” Polymerization 174
7.2 Experimental
7.2.1 Reagents
Styrene (Fluka) was passed through a column of alumina oxide then distilled under reduced
pressure just prior to use. 2,2,6,6-Tetramethyl-1-piperidinyloxy (TEMPO) (Aldrich) was
used as received. 1,1,3,3-Tetraethylisoindolin-2-yloxyl (TESIO) was kindly donated by Urs
Wermuth from Griffith University and recrystallized from n-pentane before use.
Dichloromethane used for washing was reagent grade and used as received.
7.2.2 Grafting
Grafting of styrene to PFA was performed using the pre- irradiation method in vacuum.
PFA (Du Pont, code TE 7132), injection molded lanterns with rings of 0.5 mm in thickness
were evacuated at 1 × 10⁻² Pa in glass tubes for 24 hours and sealed. The samples were then
irradiated at 300 K in a 220 Nordian Gammacell to a dose of 20 kGy at a dose rate of 4.7
kGy hr-1. Nitroxide solutions were prepared by dissolving either TEMPO or TEISO in
styrene (5 mL) to make up to the desired concentration. The nitroxide solutions were added
to the irradiated PFA under a stream of nitrogen gas through a tap fitted with rubber
o-rings. The tubes were then degassed by three freeze-pump-thaw cycles and sealed under
vacuum by melting a narrow neck in the glass. The tubes containing irradiated PFA, styrene
and the nitroxide were then heated in an oil bath at 373 ± 2 K for 40 hours. The tubes were
then opened and the grafted PFA washed overnight with dichloromethane in a Soxhlet-
extractor to remove any non-reacted styrene and occluded homopolymer. The grafted PFA
samples were then dried under vacuum. The graft yield was determined as the weight of the
graft as a percentage of the initial weight of the PFA.
7.2.3 Differential Scanning Calometry
A Perkin Elmer DSC7 was used to perform DSC on sections of the grafting rings cut using
a blade. Samples were heated under a nitrogen atmosphere from 323 to 633 K at
40 K min-1, held at 633 K for one minute, then cooled to 303 K at 40 K min-1 using ice as

Chapter 7 Grafting II – Grafting by “Living” Polymerization 175
the coolant. For the ungrafted samples, the heat of fusion was taken from the peak area
under the melting endotherm. For grafted samples, where the amorphous PS component
dilutes the crystallinity, the heat of fusion for just the PFA component was calculated as:
)/(
PSPFAPFA
totalPFA WW
HH
+
∆=∆
where WPFA and WPFA+PS are the weight of the samples before and after grafting,
respectively.
7.2.4 Microprobe Raman Spectroscopy Details of the microprobe Raman are described in Chapter 6, Section 6.3.4. 7.2.5 Loading Tests Details of the loading tests are described in Chapter 6, Section 6.3.6.

Chapter 7 Grafting II – Grafting by “Living” Polymerization 176
7.3 Results and Discussion
7.3.1 Nitroxide Effect on Graft Yield
The rate determining step in nitroxide LFRPs is the bond dissociation of the alkoxy amine
group.23,24 The rate of homolysis of the NO–C bond of the alkoxy amines is known to
depend on a combination of steric compression around the NO–C bond, the stabilities of
the radicals formed, and polar factors.1 By varying the R and R’ groups of the nitroxide
shown in Scheme 7.1, the reactivity of the nitroxide can be modified.10,11,21,25 Of the two
nitroxides used for this work, the rate of homolysis of the NO–C bond is known to be more
rapid for TEISO than for TEMPO (structures are shown in Figure 7.2).25
NO.
NO.
Figure 7.2 Structures of TEMPO (left); and TEISO (right).
The concentration of the nitroxide used in a thermally initiated styrene mixture
influences the conversion and molecular weight distribution of the PS formed.9,26 At low
nitroxide concentration the system behaves more like a traditional free radical
polymerization giving rise to high conversion, high molecular weight distribution, and wide
polydispersity. If excess nitroxide is used there is a definite incubation period where little
or no polymer is formed. Once all of the excess nitroxide is consumed the rate of
conversion is similar to that observed for normal nitroxide-mediated LFRPs and polymers
with narrow polydispersity and low molecular weight distribution are formed.
The effect of nitroxide concentration on the grafting of styrene to pre- irradiated
PFA was investigated by using a range of nitroxide concentrations, from neat styrene to
styrene with 3.6 × 10⁻² M nitroxide. When the reaction was performed at room temperature
with 4.6 × 10⁻³ M TEMPO no grafting or homopolymerization was observed, even after
100 hours, due to the stability of the alkoxy amine at this temperature. By way of

Chapter 7 Grafting II – Grafting by “Living” Polymerization 177
comparison, the same reaction at room temperature without any nitroxide led to a graft
yield of 65 % after 40 hours.
By increasing the temperature of the reaction to 373 K the alkoxy amine groups can
dissociate and the polymerization becomes “living”. The effect of different concentrations
of TEMPO and TEISO at 373 K on the graft yield is shown in Figure 7.3. The higher the
nitroxide concentration, the lower the graft yield, although above 1 × 10⁻² M nitroxide
concentration any increase in concentration appeared to have little effect. Clearly the
nitroxides lower the rate of polymerization although there was no significant difference in
the graft yield when TEISO was used compared to when TEMPO was used.
Figure 7.3 Graft yield for different nitroxide concentration when grafting styrene to PFA at 373 K – (¦ )
TEMPO; (? ) TEISO. The grafting time was 40 hours.
PFA swollen in styrene represents a highly viscous medium for grafting, which may
explain why the degrees of grafting when TEISO was used were not higher than for
TEMPO, as may be predicted from the more labile NO–C bond when TEISO forms an
alkoxy amine. It is possible that mediation by the nitroxides used in this system is diffusion
controlled and independent of the NO–C bond stability. Lutz et al. have reported
experimental validation of kinetic models for nitroxide-mediated polymerization proposed
by Fischer27,28 and found that at high conversion, the experimental values deviated from

Chapter 7 Grafting II – Grafting by “Living” Polymerization 178
theoretical predictions and suggested that the behavior was due to viscosity effects.29 When
grafting styrene to PFA, the highly viscous grafting regions may be considered to mimic a
polymerization which has gone to high conversion. It was therefore not surprising that the
graft yield for TEMPO and TEISO did no t obey the rules predicted by the NO–C bond
strength.
7.3.2 Distribution of the Graft
The distribution of the graft and the accessibility of the graft to reagents are important
factors when the grafted supports are to be used for SPOC. To measure the distribution of
the graft, microprobe Raman spectroscopy was used to map cross-sections of the grafted
supports. The well- resolved Raman shifts at 999 cm-1 for PFA and 734 cm-1 for PS were
used as a measure of the PS distribution in the graft copolymer. The Raman map of a cross-
section of PFA-g-PS with 4.6 × 10⁻³ M TEMPO is shown in Figure 7.4. The map for PFA
grafted under the same conditions, only without any nitroxide, is shown in Figure 7.5.
Without nitroxide added, the peak due to the PS graft was more intense relative to the peak
due to PFA, while the opposite was true when nitroxide was used. TEMPO has an intense
Raman shift at 847 cm-1 (Figure 7.6) which was not observed in the map spectra. This
suggested that either the alkoxy amine end-groups were not present in high enough
concentration to observe, or that the chain ends were “dead” as a result of termination by
combination, disproportiona tion or chain transfer.

Chapter 7 Grafting II – Grafting by “Living” Polymerization 179
20
40
60
1050 1000 950 900 850 800 750 700
Wavenumber (cm-1)
Figure 7.4 Raman map of a cross-section of PFA grafted with styrene with 4.6 × 10⁻³ M TEMPO.
20
4060
80
1050 1000 950 900 850 800 750 700 Wavenumber (cm-1)
Figure 7.5 Raman map of a cross-section of PFA grafted with neat styrene.
A semi-quantitative measure of the distribution of PS graft in PFA was calculated
from the maps and are shown in Figure 7.7. The penetration profiles have been expressed
as the distance into the cross-sections as a percentage of the total thickness, since each
grafted sample had a different thickness. It was assumed that the cross-sections were
symmetrical and the other 50 % of the map was a mirror image to the first 50 %.

Chapter 7 Grafting II – Grafting by “Living” Polymerization 180
Figure 7.7 shows that the mole fraction of PS in the PFA decreased with increasing
concentration of nitroxide. At 373 K with no nitroxide, the mole fraction of PS was
between 0.5 and 0.65, whereas with TEMPO added the fraction of PS dropped to < 0.2
mole fraction PS. It appears that the TEMPO has an influence on the grafting reactions
within the PFA substrates, presumably lowering the molecular weight. Increasing the
concentration of TEMPO from 4.6 × 10⁻³ to 1.9 × 10⁻² M resulted in a slight decrease in the
mole fraction of PS in the grafted PFA. Grafting performed at 373 K, either with or without
nitroxide added, led to the graft penetrating the entire substrate. Grafting performed at room
temperature without nitroxide in neat styrene resulted in PS only partially penetrating the
substrate. The mechanism at room temperature is most likely to be the front mechanism
where grafting begins at the surface and progressively moves into the substrate as the
grafted layers swell in the styrene. This was confirmed using Raman microprobe mapping
in Chapter 6. When the grafting temperature was raised to 373 K the graft penetrated the
entire substrate for the same grafting time. At this temperature it is likely that diffusion of
styrene is rapid and it may not be the rate determining step.
0
5
10
15
20
1100 1050 1000 950 900 850 800 750 700
Wavenumber (cm-1)
Figure 7.6 Raman spectrum of TEMPO in the range 700 – 1100 cm-1.

Chapter 7 Grafting II – Grafting by “Living” Polymerization 181
Figure 7.7 Map of PS graft into PFA substrate. (-¦ -) room temperature grafting, no nitroxide; (-? -) no
TEMPO, 373 K; (-? -) 4.6 × 10⁻³ M TEMPO, 373 K; (-•-) 1.9 × 10⁻² M TEMPO, 373 K. 0 % indicates the
surface of the graft copolymer, while 50 % indicates the mid-point into the cross-section.
7.3.3 Radical Stability and Crystallinity
At the high temperatures needed to force nitroxide-mediated polymerization to proceed, the
majority of the radicals created during the irradiation at ambient temperature would have
decomposed. Examination of the radicals formed in PFA when irradiated in vacuum at
room temperature using ESR spectroscopy, revealed that at approximately 400 K all
end-chain (~C•F2) radicals had decomposed leaving just a portion of the main-chain
(~CF2–C•F–CF2~) radicals (Chapter 2). The less thermally stable end-chain radicals are
assumed to be present in the amorphous regions, while the long- lived main-chain radicals
must reside in the crystallites or at the surface of the crystallites.
To determine whether the grafting process disturbs the crystallites, the heat of
fusion of the crystalline melting endotherm of PFA was measured using differential
scanning calorimetry (DSC) before and after grafting. Since little difference was observed
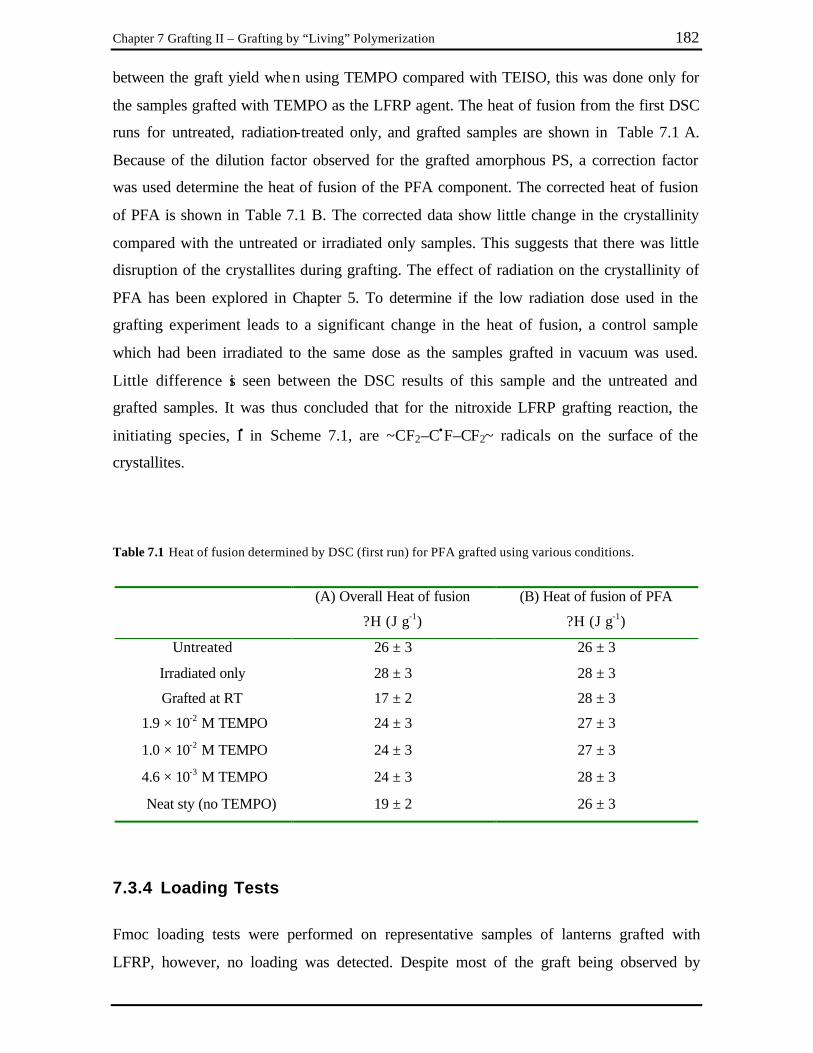
Chapter 7 Grafting II – Grafting by “Living” Polymerization 182
between the graft yield when using TEMPO compared with TEISO, this was done only for
the samples grafted with TEMPO as the LFRP agent. The heat of fusion from the first DSC
runs for untreated, radiation-treated only, and grafted samples are shown in Table 7.1 A.
Because of the dilution factor observed for the grafted amorphous PS, a correction factor
was used determine the heat of fusion of the PFA component. The corrected heat of fusion
of PFA is shown in Table 7.1 B. The corrected data show little change in the crystallinity
compared with the untreated or irradiated only samples. This suggests that there was little
disruption of the crystallites during grafting. The effect of radiation on the crystallinity of
PFA has been explored in Chapter 5. To determine if the low radiation dose used in the
grafting experiment leads to a significant change in the heat of fusion, a control sample
which had been irradiated to the same dose as the samples grafted in vacuum was used.
Little difference is seen between the DSC results of this sample and the untreated and
grafted samples. It was thus concluded that for the nitroxide LFRP grafting reaction, the
initiating species, I• in Scheme 7.1, are ~CF2–C•F–CF2~ radicals on the surface of the
crystallites.
Table 7.1 Heat of fusion determined by DSC (first run) for PFA grafted using various conditions.
(A) Overall Heat of fusion
?H (J g-1)
(B) Heat of fusion of PFA
?H (J g-1)
Untreated 26 ± 3 26 ± 3
Irradiated only 28 ± 3 28 ± 3
Grafted at RT 17 ± 2 28 ± 3
1.9 × 10⁻² M TEMPO 24 ± 3 27 ± 3
1.0 × 10⁻² M TEMPO 24 ± 3 27 ± 3
4.6 × 10⁻³ M TEMPO 24 ± 3 28 ± 3
Neat sty (no TEMPO) 19 ± 2 26 ± 3
7.3.4 Loading Tests
Fmoc loading tests were performed on representative samples of lanterns grafted with
LFRP, however, no loading was detected. Despite most of the graft being observed by

Chapter 7 Grafting II – Grafting by “Living” Polymerization 183
Raman mapping to be below the surface due to the high temperature used, it was expected
that surface grafting would be sufficient to allow some loading. From the cross-section
maps in Figure 7.7 it can be seen that the mole fraction of PS at the surface of the samples
grafted with LFRP was less than 0.2. At such high proportions of PFA in the lanterns, the
graft substrate would have swelled only slightly in the dichloromethane and
dimethylformamide / dichloromethane used as solvents for the loading tests and would not
be able to access significant amounts of the “buried” PS, hence leading to the lack of
measurable loading.
7.4 Conclusions
Grafting of styrene to PFA pre- irradiated in vacuum using nitroxide-mediated LFRP has
been examined. The effect of the nitroxides, TEMPO and TEISO, was to lower the graft
yield compared with the system without nitroxide added. Microprobe Raman mapping
showed that most of the graft was below the surface presumably due to rapid diffusion of
styrene at the high temperatures needed to force the nitroxide mediated LFRP to proceed.
After grafting styrene to PFA using the nitroxides, the crystallinity of the substrate did not
change appreciably which suggested that the grafting was occurring at the surface of the
crystallites. The failure of the loading tests on the grafted samples was a result of the graft
not being accessible under the loading conditions, however, such graft copolymers may
have promise as conducting membranes since a homogeneous graft across the entire
substrate was achieved.
Chapter 7 Grafting II – Grafting by “Living” Polymerization 184
7.5 References 1. Moad, G., Solomon, D. H. The Chemistry of Free Radical Polymerization, First ed.;
Elsevier Science: Oxford, 1995. 2. Solomon, D. H., Rizzardo, E., Cacioli, P., US Pat. 4581429, Chem. Abstr. 102
(1985). 3. Patten, T. E., Xia, J., Abernathy, T., Matyjaszewski, K., Science 272, 866-868
(1996). 4. Matyjaszewski, K., Coca, S., Gaynor, S. G., Greszta, D., Patten, T. E., Wang, J.-S.,
Xia, J., WO 87/18247, (1997). 5. Wang, J. S., Matyjaszewski, K., J. Am. Chem. Soc. 117, 5614-5615 (1995). 6. Moad, G., Chiefari, J., Krstina, J., Postma, A., Mayadunne, R. T. A., Rizzardo, E.,
Thang, S. H., Polym. Int. 49, 993-1001 (2000). 7. Chiefari, J., Chong, Y. K., Ercole, F., Krstina, J., Jeffery, J., Le, T. P. T.,
Mayadunne, R. T. A., Meijs, G. F., Moad, C. L., Moad, G., Rizzardo, E., Thang, S. H., Macromolecules 31, 5559-5562 (1998).
8. Hawker, C. J., Hedrick, J. L., Macromolecules 28, 2993-2995 (1995). 9. Devonport, W., Michalak, L. M., Malmstrom, E. E., Mate, M., Kurdi, B., Hawker,
C. J., Macromolecules 30, 1929-1934 (1997). 10. Harth, E., Van Horn, B., Hawker, C. J., Chem. Commun., 823-824 (2001). 11. Benoit, D., Chaplinski, V., Braslau, R., Hawker, C. J., J. Am. Chem. Soc. 121, 3904-
3920 (1999). 12. Billingham, N. C. Molecular Weight Distributions. In: Comprehensive Polymer
Science; Allen, G.; Berington, J. C. Eds.; Pergamon Press: Oxford, 1989; Vol. 3; pp. 43-57.
13. Hodges, J. C., Harikrishnan, L. S., Ault-Justus, S., J. Comb. Chem. 2, 80-88 (2000). 14. McAlpine, S. R., Lindsley, C. W., Hodges, J. C., Leonard, D. M., Filzen, G. F., J.
Comb. Chem. 3, 1-5 (2001). 15. Mahajan, A., Chhabra, S. R., Chan, W. C., Tett. Lett. 40, 4909-4912 (1999). 16. Stehling, U. M., Malmstrom, E. E., Waymouth, R. M., Hawker, C. J.,
Macromolecules 31, 4396-4398 (1998). 17. Holmberg, S., Holmlund, P., Wilen, C.-E., Kallio, T., Sundholm, G., Sundholm, F.,
J. Polym. Sci., A, Polym. Chem. 40, 591-600 (2002).

Chapter 7 Grafting II – Grafting by “Living” Polymerization 185
18. Barner, L., Zwaneveld, N., Barner-Kowollik, C., Davis, T. P. “Gamma Radiation
Induced Grafting onto Solid Surfaces Using the RAFT Process”; 25th Australasian Polymer Symposium, 2002, Armidale, Australia.
19. Miwa, Y., Yamamoto, K., Sakaguchi, M., Shimada, S., Macromolecules 34, 2089-
2094 (2001). 20. Bozzi, A., Chapiro, A., Radiat. Phys. Chem. 32, 193-196 (1988). 21. Moad, G., Rizzardo, E., Solomon, D. H., Polym. Bull. 6, 589-593 (1982). 22. Gangal, S. V. Tetrafluoroethylene-Perfluorovinyl Ether Copolymers. In:
Encyclopedia of Chemical Technology; Kirk-Othmer Ed.; John Wiley & Sons: New York, 1994; Vol. 11; pp. 671-683.
23. Veregin, R. P. N., Georges, M. K., Kazmaier, P. M., Hamer, G. K., Macromolecules
26, 5316-5320 (1993). 24. Veregin, R. P. N., Georges, M. K., Hamer, G. K., Kazmaier, P. M., Macromolecules
28, 4391-4398 (1995). 25. Moad, G., Rizzardo, E., Macromolecules 28, 8722-8728 (1995). 26. Mardare, D., Matyjaszewski, K., Polym. Prep. 35, 778-779 (1994). 27. Fischer, H., J. Polym. Sci. Part A: Polym. Chem. 37, 1885-1901 (1999). 28. Fischer, H., J. Am. Chem. Soc. 108, 3925-3927 (1986). 29. Lutz, J., Lacroix-Desmazes, P., Boutevin, B., Macromol. Rapid Commun. 22, 189-
193 (2001).

Chapter 8
8 Overall Conclusions and Further Work
8.1 Radiolysis of PFA
The radiation chemistry of PFA was examined to identify the radicals responsible for
initiating grafting reactions and to understand the chemical and physical changes in
radiation-treated PFA.
PFA was shown to be intolerant to radiation across a wide range of irradiation
temperatures in terms of the changes in the tensile properties, main-chain and end-chain
radical formation, changes in the chemical structures and thermal properties, and the
emission of volatile fragments. The damage that radiation exposure caused to PFA was
illustrated by the drop in the energy to break and percentage elongation to 1/10 of their
original values after a dose of 20 kGy at 303 K.
Chain scission was ident ified as the main radiolytic process when PFA was
irradiated at 303 K. This was based on the observed increase in crystallinity, drop in the
melting temperature, tensile strength and energy to break, increase in rigidity and increase
in the number of ~C•F2 and ~CF3 chain ends. The lack of branch formation when PFA was
irradiated at 303 K was attributed to the glassy-state of the amorphous regions and to the
rigid crystalline regions preventing sufficient movement of the macro-radicals to combine
to form branches. At 77 K the polymer chains are even more rigid. When irradiated at 77 K
the radical yield was 0.16, lower than at 303 K (0.93), suggesting that many of the radicals
formed at 77 K immediately recombined. At 303 K, PFA has short chain motion as it is
above the γ-relaxation transition, recombination is less prevalent and the radicals formed
are able to move far enough apart from each other to prevent instant recombination. The
stability of the main-chain radicals in the crystalline regions exceeded two years at 294 K.
Analogous chain mobility arguments were used to explain the formation of
branched structures when PFA was irradiated at high temperature. When irradiated above

Chapter 8 Overall Conclusions and Further Work 187
the Tg but below the Tm, both long and short branches were identified by 19F high-speed
MAS NMR. Two types of short perfluormethyl branches were assigned based on
comparison of their respective T2 relaxation times, measured using a Hahn echo pulse
experiment. The perfluoromethyl side chains with short T2 were assigned to side groups
incorporated into the crystallites, while the perfluoromethyl side chains with long T2 were
assigned to those in the amorphous regions or at the surface of crystallites. Assignments of
small peaks in the range –52 to –64 ppm remain inconclusive. Further work using
correlation spectroscopy is required for unequivocal assignment of these peaks.
The formation of long chains was postulated to occur by combination of end-chain
and main-chain radicals in the amorphous regions or at the crystallite surfaces. Radiation-
induced crystallization was observed in the samples irradiated above and below the Tg at
low dose due to lowering of the molecular weight by chain scission and loss of
perfluoralkoxy groups allowing crystallization. When irradiated below the Tg the
crystallinity increased with increasing dose due to further chain scission, while the samples
irradiated above the Tg but below the Tm decreased in crystallinity due to disruption of the
crystallites by the newly formed pendant groups.
When irradiated at the Tm the G value of branch points was 1.2 but was exceeded by
the number of chain ends (1.8). When PFA was irradiated with electron beams at 633 K
(above the Tm) the G value of long branch points (1.6) was greater than that of chain ends
(1.4) suggesting that net crosslinking occurred. A decrease in the crystallinity supported
this finding.
The loss of perfluoroalkoxy groups from the PPVE units across the irradiation
temperature range examined was prevalent. G values calculated from the NMR data for loss
of perfluoroalkoxy groups ranged from –0.8 at 303 K to –6.0 at 633 K. The gases evolved
from PFA irradiated at 303 K were analysed by FTIR and MS and found to consist of large
amounts of oxygen-containing species. Cleavage appeared to occur at the C–O bonds and
to a lesser extent at the C–C bond of the CF3 at the end of the pendent groups. The
fragment, CF3CF2COF, was identified by FTIR, while ethyl ether and acyl fluoride groups
were identified by NMR and FTIR. The major decomposition pathways of the PPVE units
of PFA are summarized in Scheme 8.1.

Chapter 8 Overall Conclusions and Further Work 188
CF2 CF CF2
.
.
CF2 CF CF2
O CF2 CF3CF2 CF CF2
O
CF2 CFO
CF2
.O CF2 CF2 CF3.
CF2 CF3FCO
CF2 CF CF2
O CF2 CF2 CF3A
B C
AB
C+ F.
Scheme 8.1 The major decomposition pathways of the PPVE units in PFA when exposed to γ-radiation.
8.2 Grafting to PFA
The effect of monomer phase (vapour / liquid), solvent, and addition of nitroxides were
investigated for the preparation of PFA-g-PS graft copolymers for use in SPOC.
The distribution of the PS graft in the PFA substrate was a key factor in determining
the loading, and hence usefulness, of the grafted copolymer as a SPOC support. In all cases
the graft layer was not pure PS, but instead was graded into the PFA substrate as a mixture
of PFA and PS. The distribution of the graft was largely dependent on the diffusion of
styrene into the substrate, which was aided or hindered by the conditions used, such as
solvent selection or temperature.
The solvents used to dilute the styrene for the grafting reactions could be classified
into three categories according to swelling ability and resulting graft yield and distribution
of the graft:

Chapter 8 Overall Conclusions and Further Work 189
1) Swells PFA slightly and is a good solvent for PS (dichloromethane) – high graft yield
distributed mostly below the surface.
2) Swells PFA very weakly and is a good solvent for PS (toluene) – moderate graft yield
with the graft below the surface but not penetrating as far as in (1).
3) Does not swell PFA and is a poor solvent for PS (methanol, ethanol, acetonitrile) – low
graft yield restricted to the near-surface region of the substrate.
The viscosity of the grafting medium played an important role in the grafting
reactions. Under certain conditions an increase in viscosity of the grafting solution led to a
higher graft yield, presumably due to longer graft chains being formed as a result of fewer
termination reactions by combination. High viscosity could also lower the graft yield by
hindering diffusion of styrene to the graft front.
When styrene vapour was used, transport of styrene into the substrate was
independent of dose rate at low graft times and the graft was limited mainly to the surface
regions.
The nitroxides TEMPO and TEISO were used to give the grafted chains a “living”
character. Unfortunately the high temperature required for the nitroxide-mediated reactions
to proceed allowed diffusion of the styrene into the amorphous regions of the PFA such that
the resulting graft was below the surface. The resulting graft copolymers were unsuitable
for SPOC, but if sulfonated, may have an application in conducting membranes.
In Chapter One the following list of aims was presented:
Aims:
- to understand the radiation chemistry of the base fluoropolymer.
- to understand how grafting conditions affect the extent and rate of grafting so
that grafted polymer preparation can be carried out in a rapid and reproducible
manner.
- to develop a solid support with thermal and chemical stability to a large range of
solvents and conditions.

Chapter 8 Overall Conclusions and Further Work 190
- to develop a solid support with better loading and kinetics than that of existing
solid supports.
The radiation chemistry of PFA has been studied in-depth and is now well
understood. A range of grafting conditions were investigated and correlations made
between solvents used and their concentration, dose and dose rates and use of “living”
polymerization additives. By using PFA as the graft substrate, the thermal and chemical
stability of the support made it useful in harsh SPOC conditions. The mechanical properties
of the substrate after irradiation were of a concern above 10 kGy and future work may be
required to improve these properties. Some preliminary work (not presented) examining the
grafting of styrene to crosslinked PFA showed some promise. A relationship between the
distribution of the graft and the amount of loading was identified. The best conditions
found for preparing a PFA-based solid support were using a non-solvent for PS or styrene
in the vapour-phase. Further work is required to test the kinetics of the chemistry on the
grafted solid support.