LIVING SKILLS TEACHER PERCEPTION OF TEACHING PREPAREDNESS: AN EXPLORATION

ELTR Journal, e-ISSN 2579-8235, Vol. 5, No. 1, January 2021, pp. 38-49
English Language Teaching and Research Journal
http://apspbi.or.id/eltr
English Language Education Study Program Association, Indonesia
38
STUDENTS PERCEPTION ON THE TEACHER NONVERBAL
COMMUNICATION AT THE SEVENTH GRADE STUDENTS
OF MTSS NAGARI BINJAI
Septria Arima, Irwandi and Reflinda Ali
IAIN Bukittinggi, Indonesia
correspondence: [email protected]
DOI: doi.org/10.37147/eltr.2020.050103
received 18 November 2020; accepted 8 December 2020
Abstract
This research is to find out students’ perception on the teacher’s nonverbal
communication. The research is conducted since the teacher does not usually uses
nonverbal communication in English classroom and make students difficult to
understand with teacher’s nonverbal communication. For this reason, the research
is aimed to find out students perception on the teacher’s nonverbal communication
in English class of MTsS Nagari Binjai Pasaman. The research use descriptive
quantitative research by usingquestionnaire as an instrument. The researcher use
total sampling. Thr sample of this research are VII a and VII b of MTsS Nagari
Binjai Pasaman that were 66 students as sample. The data is collected by distributed
a questionnaire to each others. The research finds that the students’ perception on
all types of nonverbal communication such as gesture, facial expression, eye
contact, pitch, rate, pause, friendship and warmth. Most of the result of the students
answer refer to good enough. It can be concluded that students tend to have good
enough perception on the teacher’s nonverbal communication in English classroom
at the seventh grade students of MTsS Nagari Binjai Pasaman.
Keywords: Students perception, teacher’s nonverbal communication
Introduction
The communication is the key success of being a live with the society.
According to Irwandi, communication is a symbolic process whereby meaning is
shared and negotiated. Communication is one of the points in teaching English,
since the teachers teaches language and should make a good relation with the
students through communication. It is the creation of meaning between two people
or more and in broad sense, communication can be defined as the sharing of
experience. It means that communication is the process where people interact each
other to give and take information.
Communication can be verbal or nonverbal. Verbal communication is spoken
communication by using speech or media like conversation by telephone.
According to Charly and Hayati, having good verbal communication is the one of
qualifications to be good speaker. Therefore, nonverbal communication includes all
nonverbal aspects in our behavior such as facial expression, gesture, eye contact
etc. In teaching learning process besides using verbal communication, the teacher

ELTR Journal, e-ISSN 2597-4718, Vol. 5, No. 1, January 2021, pp. 38-49
39
sometimes use nonverbal communication to teach in order to communicate with the
students.
Nonverbal communication play an important role in our daily life. According
to Alex Sobur, nonverbal communication is process communication without words.
Nonverbal communication becomes more prominent relational messages about
degree feelings or emotional in communication than what are our thinking. It means
that nonverbal communication replacing verbal communication.
Nonverbal communication is one of the communication types which are used
by English teacher in teaching and learning process. In communication, English
teacher need to increase the nonverbal communication because if English only teach
by talking in common, it does not make students understand with the teacher’s
explanation. For this case, the teacher should teach with variation style in
communication especially nonverbal communication to make students comprehend
about what teacher’s explanation is. As an instructor, the teacher should make the
harmonious relation with the students especially in communication.
The nonverbal communication is devided into three types which are body
movement, voice, touch and appearance. First, body movements are in other words
known as kinesics that includes gesture, facial expression, and eye contact. Second,
voice is also known as paralanguage. Voice includes pitch, rate and pause that can
influence the message that is spoken. The way a message spoken can give the same
words many meanings. Third, touch is known as haptics. Touch can communicate
many messages, signal and a variety of relationship. Last, appearance is the way
that someone or something looks.
Furthermore, according to Levine and Adelman, communication is the process
of sharing meaning through verbal and nonverbal behavior. It means that
communication can be verbal or nonverbal. Verbal communication is spoken
communication by using speech or media like conversation by telephone.
According to Charly and Hayati, having good verbal communication is the one of
qualifications to be good speaker. Therefore, nonverbal communication includes all
nonverbal aspects in our behavior such as facial expression, gesture, eye contact
etc. In teaching learning process besides using verbal communication, the teacher
sometimes use nonverbal communication to teach in order to communicate with the
students. The teacher should combine both of kind communication well as long as
students understand about what the teacher says.
Most of the people use nonverbal communication to communicate in daily life.
Here is certain nonverbal communication in Indonesian which has different
meaning with Western that indicate of the culture. Irwandi stated that culture is
communication and communication is culture. In other words, to learn a language
well usually requires knowing something about the culture of that language.
Communication that lacks of appropriate cultural content often becomes the source
of serious miscommunication and misunderstanding. As example, in Western,
symbol the ring has meaning “ok” and “sexual insult” but in Indonesian it just have
meaning “ok”. The use of nonverbal communication should be related with the
culture less misunderstanding in communication.

ELTR Journal, e-ISSN 2597-4718, Vol. 5, No. 1, January 2021, pp. 38-49
40
Perception There are several opinions from the experts related to the definition of
perception. McShane and Glinow state that perception is the process of receiving
information about and making sense of the world around us. It appears because an
individual always doing the perception about what are they thinking and it is what
they get. The perception exists because human have cognitive ability to process
information from the behavior with critical thinking and make a view about what
are they look and they thinking. Moreover, Slameto stated that perception is the
process that provides some the message or information to the brain of people.
The Principles of Perception
Slameto mentions that the teacher must know and apply those principles
concerned with perception is very important, because:
1. The better an object, person, event, or relationship is known, the better object,
event or relationship can be remembered.
2. In teaching, avoiding misunderstanding is a must done by the teacher, because
misunderstanding will make students learn something wrong or irrelevant.
3. In teaching something, teachers need to replace the actual object with pictures
of the object, then teacher must know the image or should be made in order to
avoid wrong perception.
The Measuring of Perception
There are two methods that apply in measuring perception. According to Rudi
that measuring perception has the same way as measuring behavior. There are two
kinds of methods in measuring perception that are self report and involuntary
behavior. There are two methods can be used or modify to measure perception.
1. Self report
Self report is a method where the respondents give answers that can be used to
indicate students’ perceptions. The researcher gives alternative answers to the
respondent where the alternative answers can be very good, good, moderate, poor,
and bad. The respondents choose one of alternative answers that is provided.
2. Involuntary behavior
Involuntary behavior is a method that can only be done if there is a willing
from the respondent in doing it.
It can be concluded that someone can use these methods of behavior
measurement in measuring perception through answer given by the respondents
through questionnaires.
Nonverbal Communication
Nonverbal communication is a process of communication by making a
statement using some signs other than spoken words. There are six signs in
generally that usually used by people in daily life such as posture and gesture, face
and eyes, voice, touch, etc. Usually nonverbal sign more influence than verbal sign,
in generally if we as the acceptor two messages that not appropriate, we more
inclined believe nonverbal message. According to Arifa and Aaquil, nonverbal

ELTR Journal, e-ISSN 2597-4718, Vol. 5, No. 1, January 2021, pp. 38-49
41
communication is deemed much reliable and effective in comparison to verbal
communication as it gives additional support to the verbal communication.
In addition, Budyatna states that nonverbal communication is every
information or emotion of communication without use words or linguistics.
Moreover, Alex states that nonverbal communication without words means that
nonverbal is a sign minus words. It is clear that in communication people use
nonverbal communication for strengthen verbal communication in convey of
meaning and purpose.
Nonverbal communication is a good way to communicate because when
someone use nonverbal communication, she or he really convey message base on
what are they thinking. That is a way of keeping themselves honest because
nonverbal communication is a way to make people interacting and communicating
with each other. This is not only the way to interact and communicate to each other
but also as express ideas and emotional expressions as well as the ability to process
an idea will have meaning and purpose.
In summary, nonverbal communication can define as a kind of communication
without expeling the voice but use gesture or body language where strengthen the
verbal communication. In addition, nonverbal communication most generally refers
to wordless communication, including gesture, color, facial expression etc.
Nonverbal communication is not only about communicating, but also expressing
emotional and feeling that have meaning and purpose.
Method
This research uses descriptive quantitative research. Descriptive research is a
kind of research method to describe and interpretate an object naturaly. The purpose
of this research is to describe the phenomena existing in field in order to get the
information base on data collection. Quantitative research is a process to get
knowledge or information by using numerial data as the tool to get what information
which is intended to be known.
Population and Sampel
The study was conducted at the MTsS Nagari Binjai, Tigo Nagari, Pasaman.
with the use of total sampling, the respondents of the study were 66 sample in this
research is all of the seventh grade students at MTsS Nagari Binjai Pasaman in
academic year 2019/2020 in which consist of two classes with total population 66
students.
Research Instrument
In this research, the researcher gave questionnaire to the students to collect
information about their perception on teacher’s nonverbal communication in
English classroom. The researcher used questionnaire because it was a precise way
to collect data related to the focus of the research and gave some advantages for the
researcher. This research used checklist to answer the questionnaire. In this
research, the researcher used type of Likert Scale questionnaire.

ELTR Journal, e-ISSN 2597-4718, Vol. 5, No. 1, January 2021, pp. 38-49
42
Rating Likert Scale
Likert Scale Code
Always A
Often O
Sometimes ST
Ever E
Never N
Technique of Data Collection
There are essential steps in doing a research in collecting the data. In this
research to collect the data, the researcher used questionnaire as instrument which
contributed to the students as the sample of the research of what are the students
perception on the teacher’s nonverbal communication in English classroom at the
seventh grade students of MTsS Nagari Binjai Pasaman academic year 2019/2020.
The steps taken by researcher to collect the data, as follow:
1. The researcher distributed the questionnaire to the respondents as sample of the
research.
2. The researcher asked respondents to choose the optional answer that is provide
in the questionnaire
3. The researcher gave a time to the respondents to answer the question.
4. The researcher collected the questionnaire.
Technique of Data Analysis This data were analyzed through instrument to get the research result after
collect the data. In describing the data of the students’ perception on teacher’s
nonverbal communication in teaching English, the researcher followed these
following steps:
1. The researcher collected the students questionnaire.
2. The researcher tabulated the data from the students’ answer
3. The researcher calculated the percentage of the data. The researcher used
technique for analysing the data by using the formula that suggested by
Sudijono, as follows:
P = 𝑓
𝑛 x 100%
Where: P = percentage of the result
f = frequency of total score
n = total amount of the sample.
4. Then, the researcher found mean of the data by using formula that suggested
by Sudijono as follow:
Mx= ∑𝑥
𝑛
Where: Mx = mean
∑x = total of the percentage
n = amount of items
5. Data interpretation
After found the mean of the data, the researcher calculated all the percentages
gotten from each indicator and to gain the data interpretation for each indicator.

ELTR Journal, e-ISSN 2597-4718, Vol. 5, No. 1, January 2021, pp. 38-49
43
To see the data percentage result of the data got can be seen in the data
interpretation below:
Table 3.3 Data Interpretation of Rating Quality
Very good 41-50%
Good 31-40%
Moderate 21-30%
Poor 11-20%
Bad 0-10%
6. Making the conclussion
The last step, the researcher made the conclusion from this research that is
taken from the higher mean score. It is as a general perception of the students
on the teacher’s nonverbal communication.
Findings and Discussion
Gesture
The first indicator of the questionner is gesture of the teacher’s nonverbal
communication. Gesture in nonverbal communication used movements of the
hands and arms in communicate that include illustrators, emblems, adaptors and
manipulators. In the first indicator, there are eight items that can be seen in the
statement number one until seven and number nine.
Table 4.2 the percentage of students answer for teacher’s gesture
communication in English class.
Table 4.2 shows the mean score of teacher’s gesture. There are 15,93%
respondents who answered always perceive for teacher used gesture in English
class, 32% respondents who answered often perceive for teacher used gesture in
English class, 34,09% respondents who answered sometimes perceive for teacher
used gesture in English class. 21,78% respondents who answered ever perceive for
teacher used gesture in English class. 14,2% respondents who answered never
perceive for teacher used gesture in English class.
No. Statement
Number
Always
(P)
Often (P) Sometimes
(P)
Ever
(P)
Never
(P)
1. 1 0% 07,6% 37,8% 33,3% 21,2%
2. 2 06,1% 09,0% 31,8% 36,4% 16,6%
3. 3 22,7% 06,1% 43,9% 10,6% 12,1%
4. 4 28,8% 09,1% 45,5% 06,1% 10,6%
5. 5 19,6% 18,2% 31,8% 19,7% 10,6%
6. 6 37,9% 24,2% 21,2% 10,6% 06,1%
7. 7 33,3% 13,6% 28,8% 13,6% 10,6%
8. 8 09,1% 06,1% 15,2% 43,9% 25,8%
Total of Percentage 127,5% 256% 272,7% 174,2% 113,6%
Mean 15,93% 32% 34,09% 21,78% 14,2%

ELTR Journal, e-ISSN 2597-4718, Vol. 5, No. 1, January 2021, pp. 38-49
44
Facial Expression
The second indicator of the questionner is facial expression of the teacher’s
nonverbal communication. Facial expression is a shape of nonverbal
communication that show the emotion and feeling such as happy, sad, surprise and
pain that can be looked from the smile, shrink forehead, glum, etc. In facial
expression, there is one item that can be seen in the satement number eight.
Table 4.3 The percentage of students answer for facial expression of the
teacher’s nonverbal communication in English classroom.
Table 4.3 shows the mean score of teacher’s facial expression. There are
06,1%% respondents who answered always perceive for teacher used facial
expression while communicated in English class, 07,6% respondents who answered
often perceive for teacher used facial expression while communicated in English
class, 36,4% respondents who answered sometimes perceive for teacher used facial
expression while communicated in English class, 22,7% respondents who answered
ever perceive for teacher used facial expression while communicated in English
class, 27,3% respondents who answered never perceive for teacher used facial
expression while communicated in English class.
Eye contact
The third indicator of the questionner is eye contact of the teacher’s nonverbal
communication. Eye contact is a shape of nonverbal communication that shows
someone is feeling that can be looked from raise of eyebrow, eyes’ open wide, cry,
etc. In this indicator, there are three items that can be seen in the statements number
ten until twelve.
Table 4.4 The percentage of students answer for eye contact of the teacher’s
nonverbal communication in English class.
Table 4.4 shows the mean score of teacher’s eye contact. There are 27,7%
respondents who answered always perceive for teacher used eye contact while
communicated in English class, 16,2% respondents who answered often perceive
for teacher used eye contact while communicated in English class, 21,2%
No. Statement
Number
Always
(P)
Often (P) Sometimes (P) Ever
(P)
Never
(P)
1. 1 06,1% 07,6% 36,4% 22,7% 27,3%
Mean 06,1% 07,6% 36,4% 22,7% 27,3%
No. Statement
Number
Always
(P)
Often
(P)
Sometimes
(P)
Ever
(P)
Never
(P)
1. Statement 1 01,2% 10,6% 21,2% 39,4% 27,3%
2. Statement 2 36,4% 09,1% 21,2% 13,6% 15,1%
3. Statement 3 45,6% 28,8% 21,2% 03,2% 01,5%
Total of Percentage 83,2% 48,5% 63,6% 56,2% 43,9%
Mean 27,7% 16,2% 21,2% 18,7% 14,7%

ELTR Journal, e-ISSN 2597-4718, Vol. 5, No. 1, January 2021, pp. 38-49
45
respondents who answered sometimes perceive for teacher used eye contact while
communicated in English class, 18,7% respondents who answered ever perceive for
teacher used eye contact while communicated in English class, 14,7% respondents
who answered never perceive for teacher used eye contact while communicated in
English class.
Pitch
The fourth indicator of the questionner is pitch of the teacher’s voice. Pitch is
high/low of the teacher’s voice when communicate to the students in the class. In
this indicator, there are two items that can be seen in the statements number thirteen
and fourteen.
Table 4.5 The percentage of students answer the pitch of the teachers’ voice
in communication.
Table 4.5 shows the mean score of teacher’s pitch. There are 15,9%
respondents who answered always perceive for teacher used pitch while
communicated in English class, 9,85% respondents who answered often perceive
for teacher used pitch while communicated in English class, 18,45% respondents
who answered sometimes perceive for teacher used pitch while communicated in
English class, 17,45% respondents who answered ever perceive for teacher used
pitch while communicated in English class, 13,65% respondents who answered
never perceive for teacher used pitch while communicated in English class.
Rate
The fifth indicator of the questionner is rate of the teacher’s voice. Rate is fast
or slow of the teacher’s voice when communicate to the students in the classroom.
In this indicator, there are three items that can be seen in the statements number
fifteen, sixteen and seventeen.
Table 4.6 The percentage of students answer the rate of the teachers’ voice in
communication.
No. Statement
Number
Always
(P)
Often
(P)
Sometimes
(P)
Ever
(P)
Never
(P)
1. Statement 1 21,2% 10,6% 36,4% 16,7% 15,2%
2. Statement 2 10,6% 09,1% 0,5% 18,2% 12,1%
Total of Percentage 31,8% 19,7% 36,9% 34,9% 27,3%
Mean 15,9% 9,85% 18,45% 17,45% 13,65%
No. Statement
Number
Always (P) Often (P) Sometimes
(P)
Ever
(P)
Never
(P)
1. 1 22,7% 10,6% 30,3% 24,2% 12,1%
2. 2 36,4% 12,1% 34,8% 07,6% 09,1%
3. 3 22,7% 13,6% 45,5% 06,1% 12,1%
Total of Percentage 81,8% 36,3% 110,6% 37,9% 33,3%
Mean 27,4% 12,1% 36,9% 12,6% 11,1%

ELTR Journal, e-ISSN 2597-4718, Vol. 5, No. 1, January 2021, pp. 38-49
46
Table 4.6 shows the mean score of teacher’s rate. There are 27,4% respondents
who answered always perceive for teacher used rate while communicated in English
class, 12,1% respondents who answered often perceive for teacher used rate while
communicated in English class, 36,9% respondents who answered sometimes
perceive for teacher used rate while communicated in English class, 12,6%
respondents who answered ever perceive for teacher used rate while communicated
in English class, 11,1% respondents who answered never perceive for teacher used
rate while communicated in English class.
Pause
The sixth indicator of the questionner is pause of the teachers’ voice. Pause is
how the teacher speak by space, for example filler words by the teacher when
communicate to the students. In this indicator, there is one item that can be seen in
the statements number eighteen.
Table 4.7 The percentage of students answer the pause of the teacher’s voice
in communication.
Table 4.7 shows the mean score of teacher’s pause in communication. There
are 34,8%% respondents who answered always perceive for teacher used pause
while communicated in English class, 12,1% respondents who answered often
perceive for teacher used pause while communicated in English class, 36,4%
respondents who answered sometimes perceive for teacher used pause while
communicated in English class, 13,6% respondents who answered ever perceive for
teacher used pause while communicated in English class, 03,3% respondents who
answered never perceive for teacher used pause while communicated in English
class.
Frienship and warmth
The seventh indicator of the questionner are friendship and warmth. It means
that nonverbal communication includes the relation than can show the feeling each
other. In this indicator, there are two items that can be seen in the statements number
nineten and twelve.
No. Statement
Number
Always
(P)
Often (P) Sometimes
(P)
Ever
(P)
Never
(P)
1. 1 34,8% 12,1% 36,4% 13,6% 03,3%
Mean 34,8% 12,1% 36,4% 13,6% 03,3%
ELTR Journal, e-ISSN 2597-4718, Vol. 5, No. 1, January 2021, pp. 38-49
47
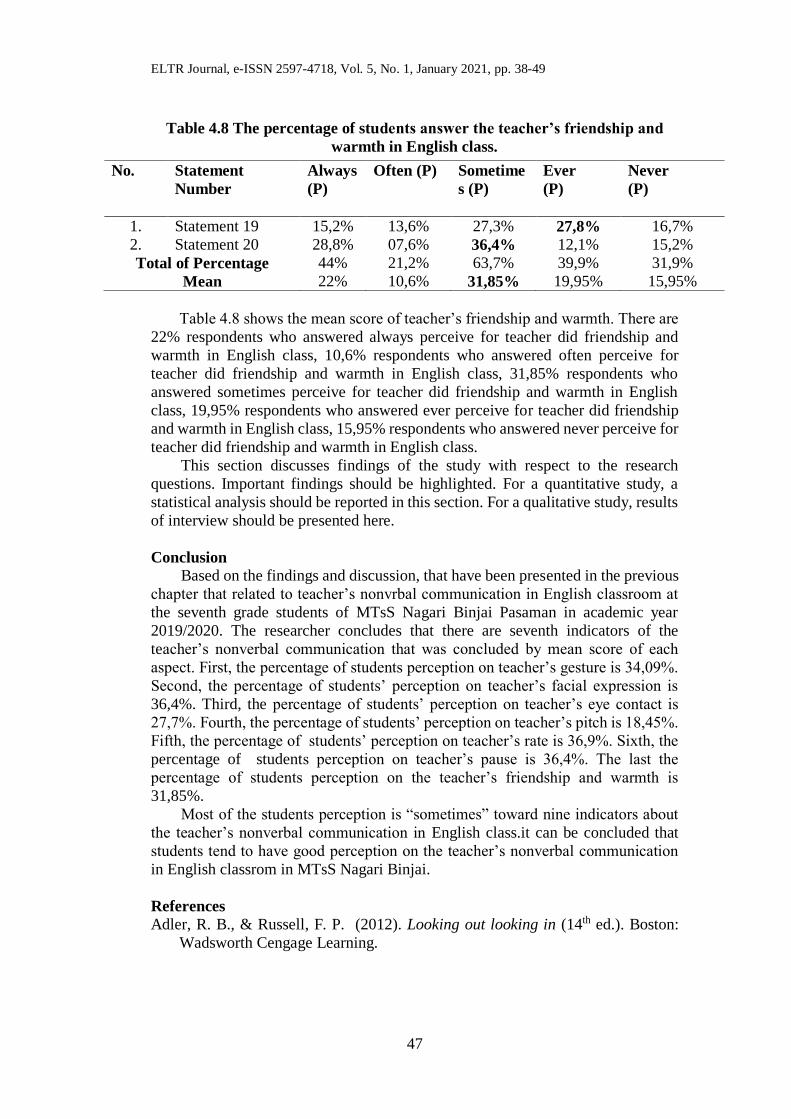
Table 4.8 The percentage of students answer the teacher’s friendship and
warmth in English class.
Table 4.8 shows the mean score of teacher’s friendship and warmth. There are
22% respondents who answered always perceive for teacher did friendship and
warmth in English class, 10,6% respondents who answered often perceive for
teacher did friendship and warmth in English class, 31,85% respondents who
answered sometimes perceive for teacher did friendship and warmth in English
class, 19,95% respondents who answered ever perceive for teacher did friendship
and warmth in English class, 15,95% respondents who answered never perceive for
teacher did friendship and warmth in English class.
This section discusses findings of the study with respect to the research
questions. Important findings should be highlighted. For a quantitative study, a
statistical analysis should be reported in this section. For a qualitative study, results
of interview should be presented here.
Conclusion
Based on the findings and discussion, that have been presented in the previous
chapter that related to teacher’s nonvrbal communication in English classroom at
the seventh grade students of MTsS Nagari Binjai Pasaman in academic year
2019/2020. The researcher concludes that there are seventh indicators of the
teacher’s nonverbal communication that was concluded by mean score of each
aspect. First, the percentage of students perception on teacher’s gesture is 34,09%.
Second, the percentage of students’ perception on teacher’s facial expression is
36,4%. Third, the percentage of students’ perception on teacher’s eye contact is
27,7%. Fourth, the percentage of students’ perception on teacher’s pitch is 18,45%.
Fifth, the percentage of students’ perception on teacher’s rate is 36,9%. Sixth, the
percentage of students perception on teacher’s pause is 36,4%. The last the
percentage of students perception on the teacher’s friendship and warmth is
31,85%.
Most of the students perception is “sometimes” toward nine indicators about
the teacher’s nonverbal communication in English class.it can be concluded that
students tend to have good perception on the teacher’s nonverbal communication
in English classrom in MTsS Nagari Binjai.
References
Adler, R. B., & Russell, F. P. (2012). Looking out looking in (14th ed.). Boston:
Wadsworth Cengage Learning.
No. Statement
Number
Always
(P)
Often (P) Sometime
s (P)
Ever
(P)
Never
(P)
1. Statement 19 15,2% 13,6% 27,3% 27,8% 16,7%
2. Statement 20 28,8% 07,6% 36,4% 12,1% 15,2%
Total of Percentage 44% 21,2% 63,7% 39,9% 31,9%
Mean 22% 10,6% 31,85% 19,95% 15,95%

ELTR Journal, e-ISSN 2597-4718, Vol. 5, No. 1, January 2021, pp. 38-49
48
Behjat, F., Samaneh, B., & Ali, A. K. (2014). An investigation of students’ attitudes
on teachers’ nonverbal interaction in Iranian EFL classrooms. International
Journal of Language and Linguistic, 2(6-1).
Budyattna, M. (2011). Teori komunikasi antar pribadi. Jakarta: Kencana Prenada
Media Group.
Bunglowala, A., & Aaquil. (2015). Nonverbal communication: An integral part of
teaching learning process. Special Issue, 1st International Conference on
Advent Trends in Engineering Science and Technology. Bunglowala. E-ISSN:
2321-9637.
Cahya, V. E., & Prabandari, C. S. (2016). Students’ perception on pre-reading
activities in basic reading II class of the english language education study
program of Sanata Dharma University. LLT Journal, 18(2).
Charli, H., & Hayati, S. (2019). Furnishing English students’ proficiency for
being public speaker to multilingual society at educational major.
Procedings of the Fourth International Seminar on English Language and
Teaching (ISELT-4).
Creswell, J.W. (2009). Educational research planning, conducting and evaluating
quantitative and qualitative research.Merriil Prentice, Hall.
Irwandi. (2017). Integrating intercultural communication competence in English
literature teaching: The application of reading novel. FKIP UMSB, (2)18.
Irwandi. (2017). Integrating intercultural communication competence in teaching
oral communication skill. Proceedings of the Fifth International seminar on
English Language and Teaching (ISELT-5).
Irwandi. (2018). Building teachers’intercultural communication competence in the
digital era. The 3th International Conference on Education.
Margono. (2007). Metodologi penelitian pendidikan, komponen MKDK. Jakarta:
Rineka Cipta.
Morissan. (2014). Teori komunikasi individu hingga massa. Jakarta: Kencana
Perdana Madia Group.
Mulyana, D. (2012). Cultures and communication. Bandung: PT Remaja
Rosdakarya.
Nurudin. (2017). Ilmu komunikasi ilmiah dan populer. Depok: PT Rajagrafindo
Persada.
Pami, H. P. (2019). Integrating divine values in intercultural communication class.
Fuaduna: Jurnal Kajian Keagamaan dan Kemasyarakatan, 3(1).
Putri, Y. M. (2017). Student’s perception on teacher’s communication style on
student’s motivation in learning English. STKIP PGRI Sumatera Barat TELL-
US Journal, 3(2).
Samovar, L. A. (2017). Communication between cultures. Boston: WadsWorth.
Sobur, A. (2016). Semiotika komunikasi. Bandung: PT Remaja Rosdakarya.
Sudijono, A. (2005). Pengantar statistik pendidikan. Jakarta: PT Raja Grafindo.
Sugiyono. (2015). Metode penlitian pendidikan pendekatan kuantitafif, kualitatif
dan RND. Bandung: Alfabeta.
Sukardi. (2003). Metodologi penelitian pendidikan. Jakarta:PT Bumi Aksara.
Surkamp, C. (2014). Nonverbal communication: Why we need it in foreign
language teaching. Vol.2014.

ELTR Journal, e-ISSN 2597-4718, Vol. 5, No. 1, January 2021, pp. 38-49
49
Sutiyatno, S. (2020). The effect of teachers’ verbal and nonverbal communication
on students’ English achievement. Journal of Language Teaching and
Research, 9(2).
Tubbs, S. L., & Sylvia, M. (2012). Human communication. Bandung: Remaja
Rosdakarya.