
STUDENTS’ PERCEIVED EASE OF USE OF AN...
23
J. EDUCATIONAL COMPUTING RESEARCH, Vol. 33(3) 285-307, 2005 STUDENTS’ PERCEIVED EASE OF USE OF AN eLEARNING MANAGEMENT SYSTEM: AN EXOGENOUS OR ENDOGENOUS VARIABLE? CHENG-CHANG (SAM) PAN University of Texas at Brownsville and Texas Southmost College STEPHEN SIVO GLENDA GUNTER RICHARD CORNELL University of Central Florida ABSTRACT Five factors affecting student use of an eLearning management system in two Web-enhanced hybrid undergraduate courses are investigated using the Technology Acceptance Model (TAM). This research represents a causal relationship existing between students’ attitude toward WebCT and their actual use of the system. Students’ perception of the WebCT use, Computer Self-Efficacy, and Subjective Norms are also taken into account. Multigroup structural modeling procedure, specifically PROC CALIS, is used to extract those factors from student use of WebCT and to determine their inter- relatedness among one another. Results show that extended adaptations of the Technology Acceptance Model are not as suitable for Engineering students as they are for Psychology students. Of the two competing models in the psychology class, Perceived Ease of Use is deemed an exogenous variable. A multi-sample analysis suggests that covariance structure differences between psychology and engineering students were found obvious over Computer Self-Efficacy and Subjective Norms variables. Lessons and experience from a southeastern metropolitan university in the United States are addressed. Studying the influence of the design features of learning technologies on end-users, specifically students, is of central importance in educational contexts. 285 Ó 2005, Baywood Publishing Co., Inc.
Transcript of STUDENTS’ PERCEIVED EASE OF USE OF AN...
J. EDUCATIONAL COMPUTING RESEARCH, Vol. 33(3) 285-307, 2005
STUDENTS’ PERCEIVED EASE OF USE OF
AN eLEARNING MANAGEMENT SYSTEM:
AN EXOGENOUS OR ENDOGENOUS VARIABLE?
CHENG-CHANG (SAM) PAN
University of Texas at Brownsville and Texas Southmost College
STEPHEN SIVO
GLENDA GUNTER
RICHARD CORNELL
University of Central Florida
ABSTRACT
Five factors affecting student use of an eLearning management system in
two Web-enhanced hybrid undergraduate courses are investigated using the
Technology Acceptance Model (TAM). This research represents a causal
relationship existing between students’ attitude toward WebCT and their
actual use of the system. Students’ perception of the WebCT use, Computer
Self-Efficacy, and Subjective Norms are also taken into account. Multigroup
structural modeling procedure, specifically PROC CALIS, is used to extract
those factors from student use of WebCT and to determine their inter-
relatedness among one another. Results show that extended adaptations of the
Technology Acceptance Model are not as suitable for Engineering students
as they are for Psychology students. Of the two competing models in the
psychology class, Perceived Ease of Use is deemed an exogenous variable. A
multi-sample analysis suggests that covariance structure differences between
psychology and engineering students were found obvious over Computer
Self-Efficacy and Subjective Norms variables. Lessons and experience from a
southeastern metropolitan university in the United States are addressed.
Studying the influence of the design features of learning technologies on
end-users, specifically students, is of central importance in educational contexts.
285
� 2005, Baywood Publishing Co., Inc.

Testing the viability of models that have found application in contexts outside of
education may prove very beneficial, particularly when attempting to explain
how educational institutions can support or even enhance the learning experiences
of students through technology.
The primary focus of this study is to examine the viability of an empirically
supported statistical model used in the corporate sector in context of education.
The aim of this study is to evaluate one way of enhancing the educational
experience of postsecondary students by identifying the factors underlying their
affective response to the technology now widely used for the purpose of course
management.
To meet diverse needs of the student body, Web-enhanced classes using
WebCT are currently offered at the University of Central Florida (UCF). In the
present study, WebCT is conceptualized as an information system project and
it is also considered an eLearning management system. This study was con-
textualized in the inter-relationship among students’ perception of WebCT
design features, their attitude toward WebCT, and their WebCT use.
Fishbein and Ajzen’s (1975) theory of reasoned action (TRA) specified a
causal relationship between individual behavioral intention and actual behavior.
With TRA, one can differentiate an individual’s actual behavior from his or her
behavioral intention. Behavioral intention is a latent factor that is measured by
two other latent factors: attitude toward behavior and subjective norm.
Rooted in TRA, the Technology Acceptance Model (TAM) by Davis (1989)
identifies two distinct constructs, Perceived Usefulness and Perceived Ease of
Use. Those two constructs directly affect a person’s attitude toward the target
system use and indirectly affect actual system use (Davis, 1993), David (1993)
defined Perceived Usefulness as “the degree to which an individual believes
that using a particular system would enhance his or her job performance” and
Perceived Ease of Use as “the degree to which an individual believes that
using a particular system would be free of physical and mental effort” (p. 477).
Furthermore, attitude toward use of a system is defined as “the degree to which an
individual evaluates and associates the target system with his or her job” (p. 476).
Actual system use is a behavioral response, measured by the individual’s actions
in real life. Davis (1993) states that “Frequency of use and amount of time spent
using a target system are typical of the usage metrics” (p. 480).
The TAM is used by Management Information Systems (MIS) practitioners
to predict the success or a failure of an information systems project. The TAM is
based on the following assumptions:
1. When end users perceive the target system as one that is easy to use and
nearly free of mental effort, they may have a favorable attitude toward using
the system. Nevertheless, Sanders and McCormick (1993) argued that an
individual must use some of or all of one’s mental resources in order to
perform a task.
286 / PAN ET AL.

2. When end users perceive the system as one that is helpful to their job, then
they may have a positive attitude toward the system used.
3. When users have a favorable attitude toward the target system, they may use
the system frequently and intensely, which means that the system developed
is successful.
4. Above all, the TAM was adapted to predict the acceptance or rejection of
WebCT by the participating classes when the courses go fully Web-based.
PURPOSE AND RELEVANCE OF THE STUDY
Pan (2003) conducted a correlational study to investigate the causal relationship
existing among student perception of WebCT, student attitude toward the use
of WebCT, their actual system use and two other external variables: Subjective
Norms and Computer Self-Efficacy. In doing so, Pan successfully replicated
the Technology Acceptance Model (TAM) and extended TAM in a higher educa-
tion setting by verifying a belief-attitude-behavior relationship in the context
of WebCT adoption.
Following the focus of this study aforementioned, the primary purpose is
two-fold. First, we attempt to verify the role of students’ perceived ease of
WebCT’s use in the presence of two external variables: Subjective Norms and
Computer Self-Efficacy. Second, we identify differences of the factor covariance
structures between the two student groups by conducting a multi-sample analysis
using structural equation modeling. To be clear, the focus of this study is not on
the WebCT courseware, per se, but instead the plausibility of the hypothetical
TAM model in portraying their affective response to the technology used for the
purpose of managing a course.
The relevance of this joint research effort presents to university professors
insights in students’ perception of the adopted courseware system and their
personal traits. Both factors may possibly govern student acceptance or rejection
of the technology. All of the findings from the present and past studies (e.g.,
Dziuban & Moskal, 2001; Moskal & Dziuban, 2001) in eLearning are able to
serve instructors in analyzing the capability of the TAM in explaining the student
affective response to an eLearning management system (in this case, WebCT) so
that the impact of how students feel about this technology on how they learn can be
better understood.
REVIEW OF LITERATURE
The Technology Acceptance Model
The Technology Acceptance Model (TAM) originated from the psychological
environment and expanded into the business settings. Adapted from the Theory
of Reasoned Action (TRA), the Technology Acceptance Model (TAM) by Davis
STUDENTS’ PERCEIVED EASE OF USE / 287
(1989) identified two distinct constructs, Perceived Usefulness and Perceived
Ease of Use, which directly affect the attitude toward target system use and
indirectly affect actual system use (Davis, 1993). Each of the factors is defined
as follows:
• Perceived Ease of Use: the degree to which the individual users perceive that
their use of the target system would be mentally and physically effortless
(Davis, 1993).
• Perceived Usefulness: the degree to which individual users perceive that their
use of the target system would increase their work performance (Davis, 1993).
• Attitude toward use of target system: the degree to which individual users
would assess and relate their use of the target system to their job performance
(Davis, 1993).
• Actual system use: defined as a form of external psycho-motor response that
is quantified by individual users’ real course of action (Davis, 1989).
The causality of the four components of the Technology Acceptance Model
addressed previously can be explained theoretically and empirically. Reversely
speaking, management Information Systems (MIS) research bases the success
of actual system use on the Frequency and Intensity of the target system use
(Davis, 1993). Attitude measures the tendency toward actual system use (e.g.,
Davis, 1985; Harris, 1999; Lu, Yu, & Lu, 2001). According to Davis (1989), when
the causal relationship between attitude and usage is established, then antecedents
or determinants of end user attitude toward the target system are not as difficult
to investigate. The antecedents mentioned referred to end-user perception about
the easiness and usefulness of the IT system.
From a system design features’ viewpoint (Davis, 1985), the TAM identified
two vital determinants of end users’ attitude toward the technology: Perceived
Ease of Use and Perceived Usefulness. The causal relationship of Perceived
Ease of Use to Perceived Usefulness is corroborated by Hubona and Blanton
(1996). Hubona and Blanton measured the predictive capabilities of Perceived
Ease of Use and Perceived Usefulness to three variables: task accuracy, task
latency (i.e., response time), and user confidence in decision quality; their
findings suggested that users’ Perceived Ease of Use affects the three outcome
variables much more significantly than users’ Perceived Usefulness. This is
supported by Igbaria, Zinatelli, Cragg, and Cavaye (1997), who demonstrated
that administration/management support coupled with external expert support
(e.g., vendors) can influence Perceived Ease of Use and Perceived Usefulness,
which, in turn, contributes to system use.
The pattern of the TAM with respect to the models’ predictive effect on
end-user acceptance has been modestly detected in the past 20 years. Reviewing
22 pieces of TAM-related research, Legris, Ingham, and Collerette (2003) con-
ducted a meta-analysis study on the effect and power of TAM and noted:
288 / PAN ET AL.
1. The TAM has been adopted and deployed in settings using three major
types of information systems: office automation tools, software develop-
ment tools, and business application tools.
2. The TAM has been compared and contrasted with other user acceptance
models and theories. For instance, the theory of reasoned action (TRA) and
the theory of planned behavior (TPB).
3. Some researchers have interchangeably used two variables: attitude toward
the system use and behavioral intention to the system use; some have
examined both respectively.
4. The TAM has been adapted and expanded in the literature, where differing
causal paths and new external variables were investigated. Frequency and
Intensity (or Duration) were treated as the two manifest variables or two
sub-scales of Actual System Use, which is the outcome variable, in some
relevant studies. Subjective Norms, a latent factor studied in the TRA,
was commonly scrutinized in the expanded TAM studies. Computer Self-
Efficacy is another popular variable in the literature.
Although these three Canadian researchers were not impressed by the per-
formance of these external variables in their marginal increases on the explained
variances of the outcome variable, they claimed that TAM is a useful user
acceptance model when it comes to plotting user behavior in an information
system.
External Variables
Drawing from Bandura’s (1977) Self-Efficacy theory, Computer Self-Efficacy
becomes a pivotal issue in technology acceptance. Venkatesh and Davis (1994)
defined Computer Self-Efficacy as the degree to which an individual is confident
in using the power of the computer for a particular purpose as a result of
accumulated, successful prior experiences. In the context of the present study,
the starkest difference between the scales used to assess Computer Self-Efficacy
and perceived ease of WebCT use is the object upon which each scale is
focused. In this study, the Computer Self-Efficacy focuses on computers; the
Perceived Ease of Use scale, on WebCT. This readily apparent distinction is
not the only one possible because a more subtle difference can be made between
self-confidence and Perceived Ease of Use, per se. Self-Efficacy, unlike Perceived
Ease of Use defined previously, assesses an individual’s confidence in responding
to external stimuli, based on previous successful experiences. in this context,
Computer Self-Efficacy focuses specifically on an individual’s confidence in
responding to features central to work processing, e-mail, chat room, course
content, and the Internet. Conversely, Perceived Ease of Use assesses confidence,
but with the added attribute that previous experience is unnecessary. An individual
can perceive a system to be easy to use with little or no prior experience, but
instead simply based upon a gross initial impression.
STUDENTS’ PERCEIVED EASE OF USE / 289

Venkatesh and Davis (1994) reported that users’ Perceived Ease of Use is
strongly regressed on Computer Self-Efficacy in the early stage of technology
acceptance. To their convenience, the authors used Computer Self-Efficacy in
the present study to denote Self-Efficacy for online learning systems skills in
Web-enhanced courses.
Subjective Norms include users’ perception of the external forces and their
motivation to comply with the forces (Robinson, 2001). Wolski and Jackson
(1999) endorsed this proposition from the perspective of university faculty in
the context of faculty development.
RESEARCH METHODOLOGY
This study is a research investigation using structural equation modeling.
Derived from Davis’ (1985) Technology Acceptance Model (TAM), two hypo-
thetic models were designed to compete with each other in order to verify the
role of students’ perceived ease of WebCT’s use in the presence of two external
variables: Computer Self-Efficacy and Subjective Norms and to measure the
factor covariance structure differences between the two classes of student par-
ticipants: the psychology class and the engineering class. The purpose of this
study was to answer the following questions:
1. Does student perceived ease of WebCT’s use variable remain an exogenous
variable in the presence of the two external variables?
2. To what extent does the psychology class differ from the engineering
class with respect to factor covariance structures involved in the study.
Design and Sample of the Study
This is a correlational research study of students’ use of WebCT in two
WebCT-enhanced undergraduate courses in the University of Central Florida
(UCF) in Orlando, Florida. This structural equation modeling study with quanti-
tative measurements concentrated on the Web-enhanced hybrid courses, particu-
larly the two large-sized undergraduate courses: PSY2012a General Psychology
course and EGN1007a Engineering Concepts and Methods. In the psychology
class, 230 out of 239 participants were randomly selected. In the engineering
class, all of the 230 participants were included in the analysis.
The rationale for focusing on psychology and engineering students was based
upon distinctions between the preparation and prior knowledge of both student
groups. Previously, Pan, Sivo, and Brophy (2003) found that the TAM when fitted
to psychology student data explained the relationships among factors germane to
student acceptance of WebCT. One motivation for this study was to observe
whether the constellation of relationships successfully specified to explain the
affective response of psychology students to WebCT could be generalized to
290 / PAN ET AL.
students in other majors. Indeed, if any alterations are to be made in course design
to facilitate student acceptance of technology, the generality of this previous
finding must be empirically validated. Psychology students were chosen as a
benchmark group, having previously been studied. For a comparison group,
engineering students were chosen for two primary reasons. First, in comparison
to psychology students, who are in the social sciences, engineering students
may serve to represent a field in the hard sciences. Second, the demand of the
engineering major is that its students are required to have more technological
familiarity and expertise than psychology. Generally, engineering students are
expected to have more technological preparation including but not limited to
computer technology. Hence, all the scales used to assess constructs pertinent
to the TAM are arguably likely to be answered different across the two student
groups. Among the number of other majors outside of psychology, engineering,
as a very different major, was a choice that would challenge the generality of
the TAM, given the tendency for student preparations and prior knowledge
differences. In a recent study by Pan, Gunter, Sivo, and Cornell (2005) confirmed
that there is indeed a dissimilar manner in which both psychology and engineering
classes responded to Self-Efficacy and Subjective Norms scales. The second
research question was intended to further explore the response pattern between
the two participating groups on two time occasions.
In this article, the causality issue in the belief-attitude-behavior relationship
was scrutinized from the students’ perspective of WebCT use in the WebCT-
enhanced hybrid courses across one semester with an emphasis on students’
perceived ease of WebCT’s use. Given this context and based on the previous
findings, causal pathways among students’ Perceived Ease of Use, Perceived
Usefulness, Attitude toward Using WebCT, their personal Subjective Norms,
Self-Efficacy with regard to WebCT, and Actual Use of WebCT were re-explored.
In this study, the model tested using structural equation modeling software
implies certain causal relationships between variables. In many other kinds of
correlational research, the idea of modeling causality can be swiftly challenged in
that correlation does not necessarily imply causation. In the context of structural
equation modeling, however, causality is capable of being assessed though the
results are fundamentally based upon correlational data. This is particularly
true for models with several variables where theoretical constraints can be placed
upon the solution so that a path moving in one direction between two variables
actually obtains a different estimated coefficient than a path between the same
two variables, specified in the opposite direction. Here, the various constraints
placed on the model affect the solution so that the success of one direction of a
path can be discriminated from the other direction. The reader is directed to
the following works for more on the interpretation of causality specified in
structural models when analyzing correlational data: Pearl (1993, 1994, 1995)
and Pearl and Verma (1991).
STUDENTS’ PERCEIVED EASE OF USE / 291

Data Collection and Analysis
Endorsed by the University of Central Florida Institutional Review Board, an
online questionnaire with seven varied scales was administered to students in
the two courses on two time occasions in the Spring Semester of 2003. The
instruments included (1) a Usability Instrument (including Perceived Ease of
Use and Perceived Usefulness scales by Davis, 1989); (2) an Attitude Instru-
ment (Ajzen & Fishbein, 1980); (3) a Computer Self-Efficacy Instrument (Lee,
2002); (4) a Subjective Norms Instrument (Wolski & Jackson, 1999); (5) a
WebCT Use Instrument (Davis, 1993); (6) a Student Demographic Instrument
(Bayston, 2002; Lee, 2002). Sample questions in the instruments aforementioned
are as follows:
1. Usability Instrument: “Learning to use WebCT would be easy for me,”
and “I would find WebCT useful in my course work.”
2. Attitude Instrument: The instrument was introduced by a general statement,
“All things considered, my using WebCT in my course work is . . .”
Students were requested to respond to such scales as “Foolish vs. Wise”
and “Negative vs. Positive.”
3. Computer Self-Efficacy Instrument: “I feel confident conducting an
Internet search using search engines,” and “I feel confidence reading a
message posted on discussion area.”
4. Subjective Norms Instrument: “The instructor thinks that I should use
WebCT for my course work,” and “My peers think I should use WebCT
for my course work.”
For the scope of this study, all the variables from the first five instruments
were analyzed, which yielded a total of 51 variables (including student achieve-
ment variable) for each class. To conduct a categorical analysis to determine the
factor covariance structure differences between the two groups as suggested
by Marcoulides and Hershberger (1997, p. 252), 102 variables were taken into
account in this study. In acknowledging the linear dependency between variables
found at the bottom level (Pan, Sivo, & Brophy, 2003; Sivo, Pan, & Brophy,
2004), the authors remained to conduct this study on a factor level. Please
consult Appendices A and B for the validity and reliability of the instruments
used in this inquiry. Appendices C, D, and E represent descriptive statistics of
variables involved and correlation matrix on two different time occasions.
The outcome variables considered in this study were: frequency of WebCT
use, intensity of WebCT use, and end of the semester grades. The Frequency and
Intensity variables are standard variable considered in Davies’ original TAM,
and so are considered here. This study focused on grades as well because class
objectives typically considered in a course may be sorted into affective as well
as cognitive objectives. The heart of the TAM is focusing on the affective domain
292 / PAN ET AL.
of the students to better model their reactions to the technology used to manage
their class. It would be remiss, however, to not consider the possibility that
student affective responses have some impact on student learning. This research
has the potential benefit of helping instructors understand student acceptance of
classroom technology and perhaps later intervene to facilitate better acceptance.
A failure to model any connection between other factors in this model and student
grades could potentially undermine the utility of this model in a distinctively
educational context.
Data analysis of the present study was composed of two stages: testing the
two competing models on both classes separately and examining the factor
covariance structure differences between the two classes. After sampling the
same number of participants in the two classes, a SEM procedure, PROC CALIS,
was used to model all the variables and error terms at one time on a scale
level. Then, taking Marcoulides and Hershberger’s (1997) suggestion, the authors
sought to “fool” the SAS program to undergo a factorial analysis of the two
groups, using PROC CALIS, as opposed to EQS or LISREL. PROC PRINT was
used to generate covariance matrices prior to the factorial analysis. The debate
over use of PROC CALIS in the categorical analysis is beyond the scope of this
SEM study.
The following fit indices were examined: Comparative Fit Index (CFI) and the
Standardized Root Mean Square Residual Estimate (SRMR). These indices were
chosen because of their relative merits. The CFI is an Incremental Fit Index
that indicates how much the fit of a model improves upon the nested null model.
This index is more sensitive to misspecification between latent and manifest
variables relationship misspecifications. The SRMR is more sensitive to latent-
latent variable relationship misspecifications.
An assessment of adequate fit in structural equation modeling is not without
standard cutoff criteria. In part, the cutoff criteria chosen are the result of Hu
and Bentler’s (1999) monte carlo simulation findings. The CFI is expected to
exceed .95 if the model is to be deemed as fitting well. The SRMR is expected
to attain values no higher than .05.
RESULTS
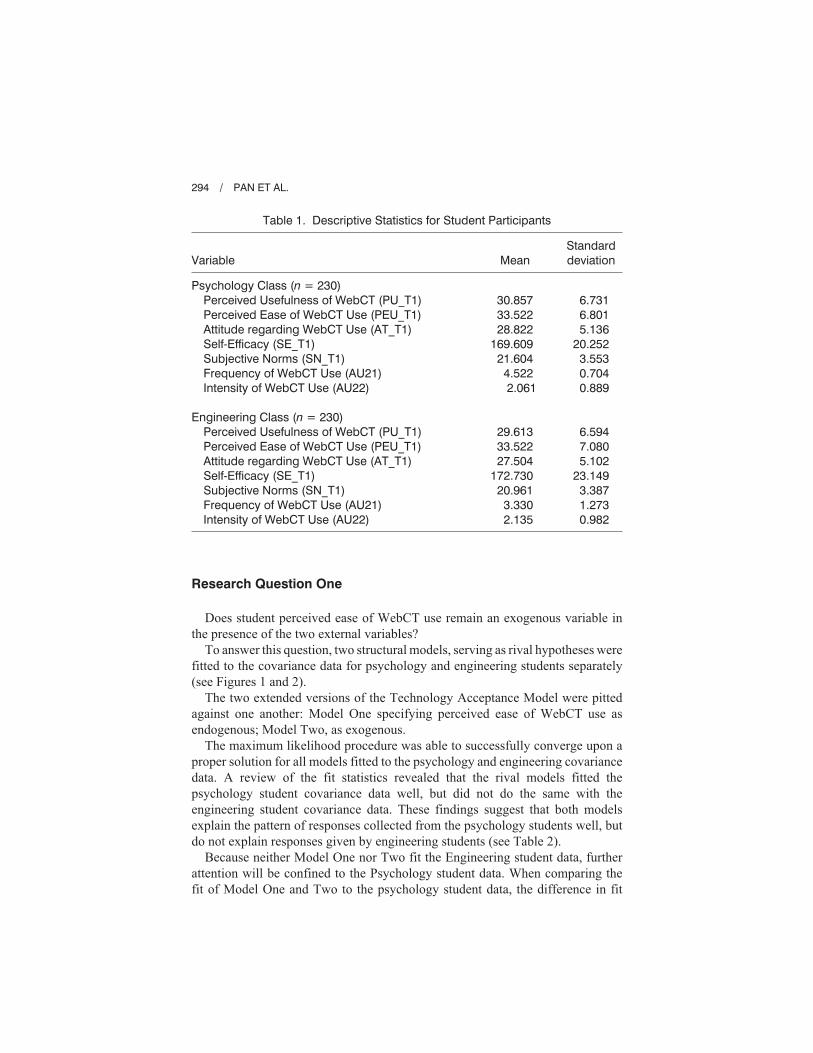
The descriptive statistics calculated for the two groups presented in Table 1
reveal that both groups were overall similar in terms of the variable means and
standard deviations.
Although the Engineering students scored a little higher than the Psychology
students with respect to Self-Efficacy in terms of computer use, the difference is
not pronounced enough to warrant attention, especially given the variability in
the scores, as suggested by the standard deviations.
STUDENTS’ PERCEIVED EASE OF USE / 293
Research Question One
Does student perceived ease of WebCT use remain an exogenous variable in
the presence of the two external variables?
To answer this question, two structural models, serving as rival hypotheses were
fitted to the covariance data for psychology and engineering students separately
(see Figures 1 and 2).
The two extended versions of the Technology Acceptance Model were pitted
against one another: Model One specifying perceived ease of WebCT use as
endogenous; Model Two, as exogenous.
The maximum likelihood procedure was able to successfully converge upon a
proper solution for all models fitted to the psychology and engineering covariance
data. A review of the fit statistics revealed that the rival models fitted the
psychology student covariance data well, but did not do the same with the
engineering student covariance data. These findings suggest that both models
explain the pattern of responses collected from the psychology students well, but
do not explain responses given by engineering students (see Table 2).
Because neither Model One nor Two fit the Engineering student data, further
attention will be confined to the Psychology student data. When comparing the
fit of Model One and Two to the psychology student data, the difference in fit
294 / PAN ET AL.
Table 1. Descriptive Statistics for Student Participants
Variable Mean
Standard
deviation
Psychology Class (n = 230)
Perceived Usefulness of WebCT (PU_T1)
Perceived Ease of WebCT Use (PEU_T1)
Attitude regarding WebCT Use (AT_T1)
Self-Efficacy (SE_T1)
Subjective Norms (SN_T1)
Frequency of WebCT Use (AU21)
Intensity of WebCT Use (AU22)
Engineering Class (n = 230)
Perceived Usefulness of WebCT (PU_T1)
Perceived Ease of WebCT Use (PEU_T1)
Attitude regarding WebCT Use (AT_T1)
Self-Efficacy (SE_T1)
Subjective Norms (SN_T1)
Frequency of WebCT Use (AU21)
Intensity of WebCT Use (AU22)
30.857
33.522
28.822
169.609
21.604
4.522
2.061
29.613
33.522
27.504
172.730
20.961
3.330
2.135
6.731
6.801
5.136
20.252
3.553
0.704
0.889
6.594
7.080
5.102
23.149
3.387
1.273
0.982

STUDENTS’ PERCEIVED EASE OF USE / 295
Figure 2. Model Two with Perceived Ease of Use as an exogenous variable.
Figure 1. Model One with Perceived Ease of Use as an endogenous variable.
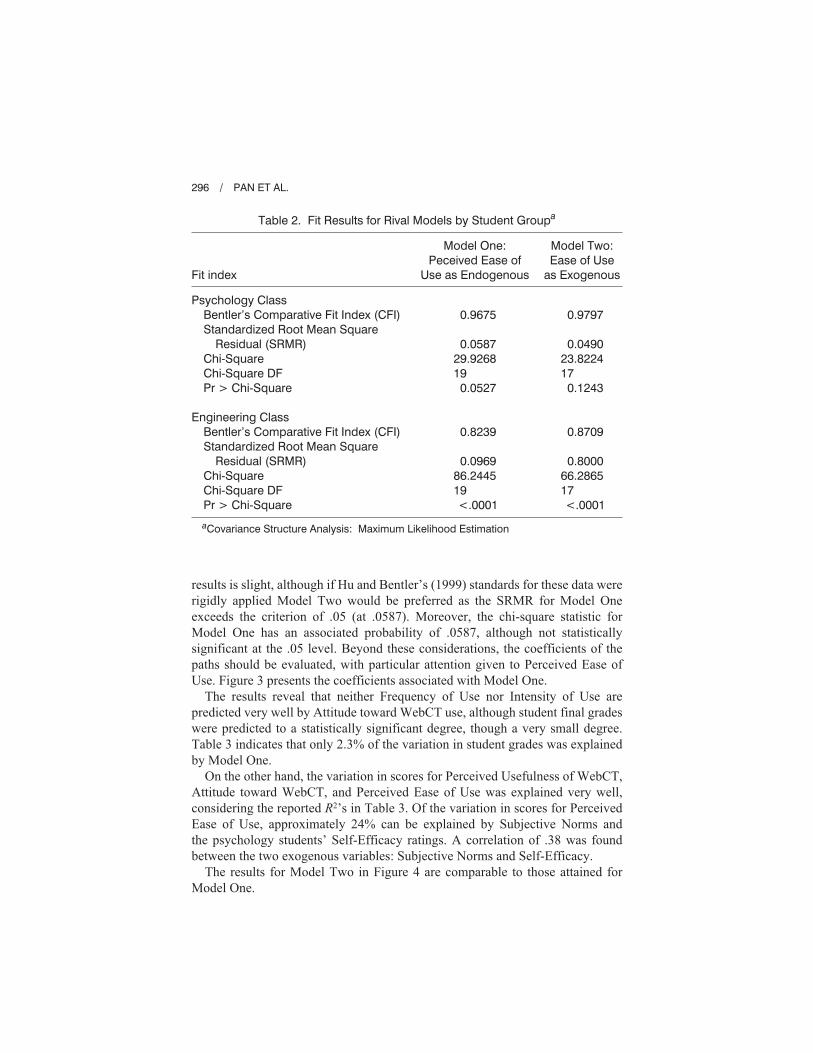
results is slight, although if Hu and Bentler’s (1999) standards for these data were
rigidly applied Model Two would be preferred as the SRMR for Model One
exceeds the criterion of .05 (at .0587). Moreover, the chi-square statistic for
Model One has an associated probability of .0587, although not statistically
significant at the .05 level. Beyond these considerations, the coefficients of the
paths should be evaluated, with particular attention given to Perceived Ease of
Use. Figure 3 presents the coefficients associated with Model One.
The results reveal that neither Frequency of Use nor Intensity of Use are
predicted very well by Attitude toward WebCT use, although student final grades
were predicted to a statistically significant degree, though a very small degree.
Table 3 indicates that only 2.3% of the variation in student grades was explained
by Model One.
On the other hand, the variation in scores for Perceived Usefulness of WebCT,
Attitude toward WebCT, and Perceived Ease of Use was explained very well,
considering the reported R2’s in Table 3. Of the variation in scores for Perceived
Ease of Use, approximately 24% can be explained by Subjective Norms and
the psychology students’ Self-Efficacy ratings. A correlation of .38 was found
between the two exogenous variables: Subjective Norms and Self-Efficacy.
The results for Model Two in Figure 4 are comparable to those attained for
Model One.
296 / PAN ET AL.
Table 2. Fit Results for Rival Models by Student Groupa
Fit index
Model One:
Peceived Ease of
Use as Endogenous
Model Two:
Ease of Use
as Exogenous
Psychology Class
Bentler’s Comparative Fit Index (CFI)
Standardized Root Mean Square
Residual (SRMR)
Chi-Square
Chi-Square DF
Pr > Chi-Square
Engineering Class
Bentler’s Comparative Fit Index (CFI)
Standardized Root Mean Square
Residual (SRMR)
Chi-Square
Chi-Square DF
Pr > Chi-Square
0.9675
0.0587
29.9268
19
0.0527
0.8239
0.0969
86.2445
19
<.0001
0.9797
0.0490
23.8224
17
0.1243
0.8709
0.8000
66.2865
17
<.0001
aCovariance Structure Analysis: Maximum Likelihood Estimation
STUDENTS’ PERCEIVED EASE OF USE / 297
Figure 3. Causal paths associated with Model One fitted toPsychology Student Data.
Table 3. Squared Multiple Correlations for Model One Fitted
to Psychology Student Dataa
Variable Error variance Total variance R-Square
PAU21
PAU22
PGD
PAT_T1
PPU_T1
PPEU_T1
0.49425
0.78709
0.33118
14.50291
30.38769
35.19718
0.49500
0.79100
0.33900
26.37400
45.31100
46.25100
0.00152
0.00494
0.0231
0.4501
0.3294
0.2390
aPPU_T1 = Perceived Usefulness; PPEU_T1 = Perceived Ease of Use; PAT_T1 = Attitude;PGD = Grades; PSE_T1 = Self-Efficacy; PSN_T1 = Subjective Norms; PAU21 = Frequencyof Use; PAU22 = Intensity of Use.

Again, Attitude toward WebCT use predicts neither Frequency of Use nor
Intensity of Use, and WebCT Attitude predict student final grades to the same
degree. Perceived Ease of Use, along with Subjective Norms and Self-Efficacy,
explained a noteworthy proportion of the variation in scores for Perceived
Usefulness of WebCT and Attitude toward WebCT, as reported in Table 4.
Moreover, the correlations between Perceived Ease of Use and the other
two exogenous variables were not negligible, with Perceived Ease of Use cor-
relating higher with Self-Efficacy (r = .48) than Subjective Norms (r = .28). In
the end, the evidence tilts in favor of Model Two over Model One, if stringent
fit criteria are used. The coefficients associated with Perceived Ease of Use are
as viable in Model One as they are in the Model Two. Please note that correlations
between Perceived Ease of Use and Self-Efficacy, Perceived Ease of Use and
Subjective Norms, and Self-Efficacy and Subjective Norms are .48, .28, and
.38 respectively.
Research Question Two
To what extent does the psychology class differ from the engineering class
with respect to the factor covariance structures involved in the study?
298 / PAN ET AL.
Figure 4. Causal paths associated with Model Two fitted toPsychology Student Data.

To answer this question, a multi-sample analysis of the covariance structure
differences between psychology and engineering students was undertaken on a
variable level, with attention given to each scale considered previously in this
study: Perceived Usefulness, Perceived Ease of Use, Attitude toward WebCT,
Subjective Norms, and Self-Efficacy. When a Multi-sample model fits the data
well, the implication is that the groups under comparison have very similar
covariance structures underlying the patterns in their responses because such
models require path coefficients for one group to be equal to path coefficients for
the other group. In other words, each multi-sample model constrains the path
coefficients for one group to be equal to path coefficients for the other group.
The fit results suggest that covariance structure differences between Engineer-
ing and Psychology students are particularly notable with respect to how they
responded to questions on the Self-Efficacy and Subjective Norms scales (repre-
sented by a SRMR of .0988 and .0670, respectively), as neither multi-sample
model fit well. Both SRMR values exceeded the customary cut-off point of .05.
The manner in which Engineering and Psychology students responded to
questions concerning Attitude toward WebCT are, on the other hand, very similar,
as suggested by the CFI of .99 and a SRMR of .0255. Similar results were found
for Perceived Usefulness and Perceived Ease of Use. This may explain why
neither Model One nor Two fit the Engineering covariance data well. Perhaps the
way in which the Engineering students responded to the Self-Efficacy and Subjec-
tive Norms scales was antithetical to the specification of Models One and Two.
CONCLUSIONS
Instructors are increasingly relying on eLearning management systems such as
WebCT. With many student dollars allocated to the adoption of such eLearning
STUDENTS’ PERCEIVED EASE OF USE / 299
Table 4. Squared Multiple Correlations for Model Two Fitted
to Psychology Student Dataa
Variable Error variance Total variance R-Square
PAU21
PAU22
PGD
PAT_T1
PPU_T1
0.49425
0.78709
0.33118
14.12142
30.38769
0.49498
0.79090
0.33881
25.72644
45.31100
0.00149
0.00482
0.0225
0.4511
0.3294
aPPU_T1 = Perceived Usefulness; PAT_T1 = Attitude; PGD = Grades; PSE_T1 = Self-Efficacy; PSN_T1 = Subjective Norms; PAU21 = Frequency of Use; PAU22 = Intensityof Use.
management systems to facilitate learning, it is important to consider how best
to understand student perceptions and attitudes regarding these systems. The
authors’ primary intention in conducting this piece of research is to provide
instructors with insights in facilitating a learning experience and customizing their
instructions for student clients, using an alternative learning technology, in a hope
to accommodate the growing UCF student populations with a wide variety of
backgrounds. Making a sound decision on the use of an eLearning management
system has not always been easy for the university, particularly faculty. This
situation can be exacerbated by the limited resources, e.g., manpower and budget.
Given the importance of the scholarship of teaching, a prudent approach on the
part of instructors would be to study student reactions to the technology used
and how to improve them to positively affect their overall learning climate and,
indeed, learning itself. The results presented in this current study suggest that
extended adaptations of the Technology Acceptance Model are not as suitable for
engineering students as they are for psychology students. New or modified TAM
models are in demand. Moreover, although both competing models hypothesized
are capable of explaining the attitudes of students taking a psychology course,
neither ultimately does a very good job of explaining how frequently or how long
students make use of WebCT while completing their coursework. Still more,
neither model can predict very well the Final Grades that students earn. In the end,
with respect to WebCT use, final grades were not associated with the Frequency
of WebCT use (r = –0.0647, p = .3290), and very little with the Intensity of
WebCT (i.e., duration of WebCT use per session; r = .1690, p = .0102). Indeed,
the ever slight association existing between Intensity and student grades would
suggest that students who used WebCT for longer periods, tended to do slightly
less well. This may have been that psychology students were conscientious
enough to log on and off WebCT as soon as they got the assignments done or
what they needed. Another possible explanation may involve low playfulness
or low enjoyment of the WebCT course.
Though we feel the results of this study address an important issue, and the
findings illuminate that distinctions may exist between student groups, it is
imperative to identify limitations associated with this study. First, this research
only applies to one university setting. Its results can only be applicable to similar
settings. Because the sample was selected purposively, the study findings may
be skewed to some extent. Second, because a simple random sample of either
student group was not obtained, the generalizability of these results may be
questioned. Although this is true, to this end, we do find that the results obtained
for the psychology students in the class studied replicate previous findings for
psychology students in a similar class previously examined by Pan, Sivo, and
Brophy (2003), Pan, Gunter, Sivo, and Cornell (2005), and Sivo and Pan
(in press). These replicated results do suggest that the previous findings are
generalizable at the very least to other psychology students at UCF taking a
similar class, though further replication is always preferable.
300 / PAN ET AL.
The findings of this study suggest that none of the outcome variables considered
were particularly well-explained by student attitudes toward WebCT, but this
does not rule out the consideration of student attitude toward WebCT as an end
itself inasmuch as a caring instructor would like to know the factors that are at play
in student reactions to an eLearning management system. The TAM succeeded in
predicting student attitudes suggesting a positive relationship between Attitude
and Perceived Usefulness (� = .41, t = 9.02), Perceived Ease of Use (� = .10,
t = 2.02), and Subjective Norms (� = .17, t = 2.24), with Perceived Usefulness
being most highly predictive of student attitudes toward the eLearning manage-
ment system. These results suggest that to an instructor who wants to single out
one issue to address in order to improve student attitudes toward an eLearning
management system, focusing on improving student perceptions of the usefulness
of the system would be most beneficial. An instructor concerned about improving
the overall climate of the classroom by improving student attitudes toward the
required technology in the classroom, in this case WebCT, might make the habit
of emphasizing the usefulness of the system throughout the course. Clearly, the
instructor, in doing so, will also serve to affect attitudes inasmuch as Subjective
Norms influences student attitudes as well. Subjective Norms, as it should be
recalled, is grounded, in part, in students’ perceptions of instructor expectations.
As with significant causal relations of Perceived Ease of Use with Perceived
Usefulness and Attitude toward WebCT considered, an eLearning management
system, which is made to afford clear and favorable interaction between the
instructor/content/system and the learner and between learners may be adopted
and used to advantage. With that in mind, instructors are advised to selectively
use available features of an eLearning management system that best facilitate
effective course activities and promote instructional objectives.
STUDENTS’ PERCEIVED EASE OF USE / 301
302 / PAN ET AL.
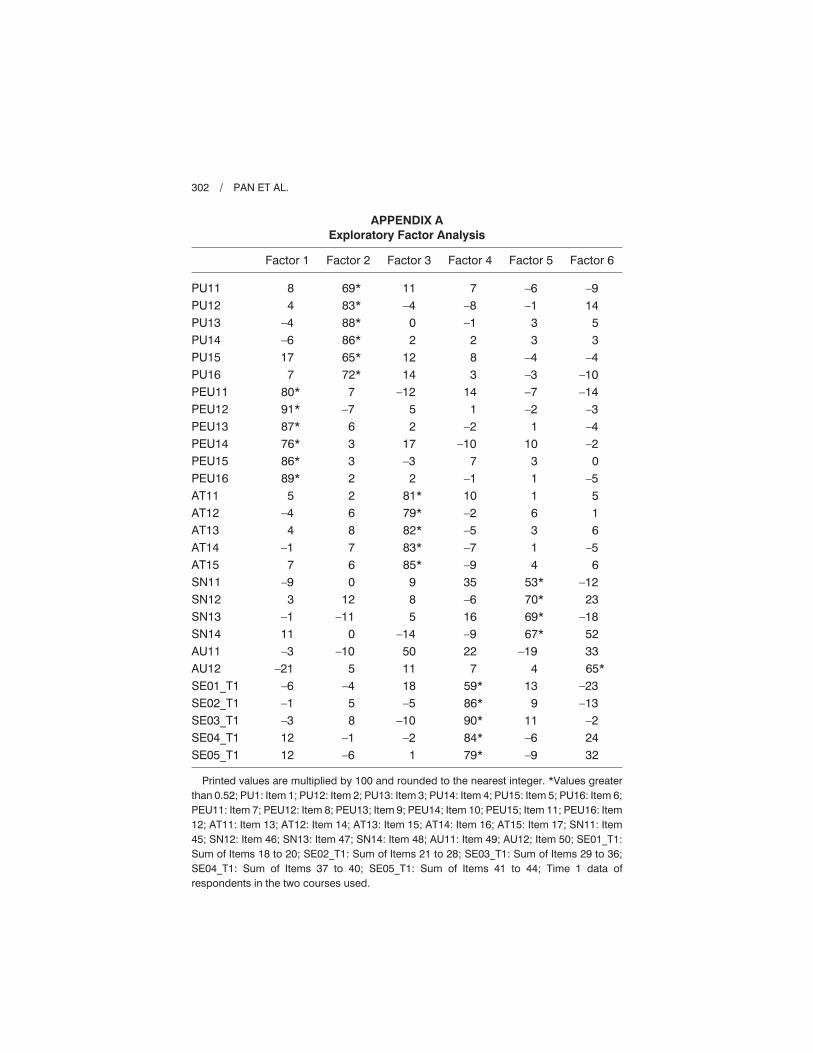
APPENDIX A
Exploratory Factor Analysis
Factor 1 Factor 2 Factor 3 Factor 4 Factor 5 Factor 6
PU11
PU12
PU13
PU14
PU15
PU16
PEU11
PEU12
PEU13
PEU14
PEU15
PEU16
AT11
AT12
AT13
AT14
AT15
SN11
SN12
SN13
SN14
AU11
AU12
SE01_T1
SE02_T1
SE03_T1
SE04_T1
SE05_T1
8
4
–4
–6
17
7
80*
91*
87*
76*
86*
89*
5
–4
4
–1
7
–9
3
–1
11
–3
–21
–6
–1
–3
12
12
69*
83*
88*
86*
65*
72*
7
–7
6
3
3
2
2
6
8
7
6
0
12
–11
0
–10
5
–4
5
8
–1
–6
11
–4
0
2
12
14
–12
5
2
17
–3
2
81*
79*
82*
83*
85*
9
8
5
–14
50
11
18
–5
–10
–2
1
7
–8
–1
2
8
3
14
1
–2
–10
7
–1
10
–2
–5
–7
–9
35
–6
16
–9
22
7
59*
86*
90*
84*
79*
–6
–1
3
3
–4
–3
–7
–2
1
10
3
1
1
6
3
1
4
53*
70*
69*
67*
–19
4
13
9
11
–6
–9
–9
14
5
3
–4
–10
–14
–3
–4
–2
0
–5
5
1
6
–5
6
–12
23
–18
52
33
65*
–23
–13
–2
24
32
Printed values are multiplied by 100 and rounded to the nearest integer. *Values greater
than 0.52; PU1: Item 1; PU12: Item 2; PU13: Item 3; PU14: Item 4; PU15: Item 5; PU16: Item 6;
PEU11: Item 7; PEU12: Item 8; PEU13; Item 9; PEU14; Item 10; PEU15; Item 11; PEU16: Item
12; AT11: Item 13; AT12: Item 14; AT13: Item 15; AT14: Item 16; AT15: Item 17; SN11: Item
45; SN12: Item 46; SN13: Item 47; SN14: Item 48; AU11: Item 49; AU12; Item 50; SE01_T1:
Sum of Items 18 to 20; SE02_T1: Sum of Items 21 to 28; SE03_T1: Sum of Items 29 to 36;
SE04_T1: Sum of Items 37 to 40; SE05_T1: Sum of Items 41 to 44; Time 1 data of
respondents in the two courses used.

STUDENTS’ PERCEIVED EASE OF USE / 303
APPENDIX C
Descriptive Statistics of Variables (N = 469)
Variable Mean SDa Sum Minimum Maximum
Time 1
Attitude toward WebCT
Perceived Ease of Use
Perceived Usefulness
Subjective Norms
Computer Self-Efficacy
Frequency
Intensity
Time 2
Attitude toward WebCT
Perceived Ease of Use
Perceived Usefulness
Subjective Norms
Computer Self-Efficacy
Frequency
Intensity
End-of-Course Grades
28.22
33.56
30.27
17.13
171.13
4.08
2.15
28.64
34.60
30.78
16.97
171.39
3.94
2.09
4.78
5.15
6.91
6.68
2.62
21.85
1.02
0.85
5.63
7.39
7.64
3.22
26.25
1.18
0.93
0.62
13233
15738
14197
8033
80260
1915
1008
13432
16226
14434
7960
80384
1848
982.00
2243
11.00
6.00
6.00
8.00
30.00
1.00
1.00
5.00
6.00
6.00
3.00
27.00
1.00
1.00
1.00
35.00
42.00
42.00
21.00
189.00
5.00
5.00
35.00
42.00
42.00
21.00
189.00
5.00
5.00
5.00
aSD = standard deviation.
APPENDIX B
Reliability Testing
Cronbach alpha for instruments
Time 1 Time 2
Perceived Ease of Use
Perceived Usefulness
Attitude toward WebCT
Computer Self-Efficacy
Subjective Norms
.942
.910
.926
.969
.625
.954
.946
.944
.982
.679
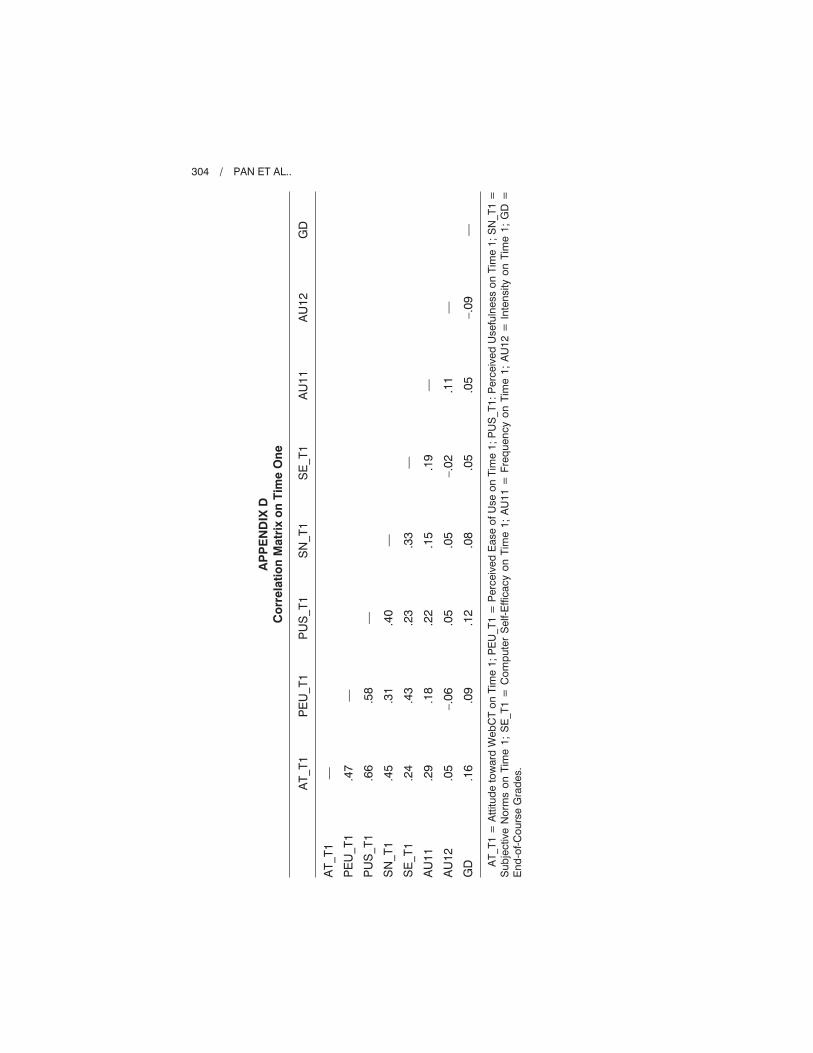
304 / PAN ET AL..
AP
PE
ND
IXD
Co
rre
lati
on
Matr
ixo
nT
ime
On
e
AT
_T
1P
EU
_T
1P
US
_T
1S
N_T
1S
E_T
1A
U1
1A
U1
2G
D
AT
_T
1
PE
U_T
1
PU
S_T
1
SN
_T
1
SE
_T
1
AU
11
AU
12
GD
— .47
.66
.45
.24
.29
.05
.16
— .58
.31
.43
.18
–.0
6
.09
— .40
.23
.22
.05
.12
— .33
.15
.05
.08
— .19
–.0
2
.05
— .11
.05
— –.0
9—
AT
_T
1=
Att
itu
de
tow
ard
Web
CT
on
Tim
e1
;P
EU
_T
1=
Perc
eiv
ed
Ease
ofU
se
on
Tim
e1
;P
US
_T
1:
Perc
eiv
ed
Usefu
lness
on
Tim
e1
;S
N_T
1=
Su
bje
ctive
No
rms
on
Tim
e1
;S
E_T
1=
Co
mp
ute
rS
elf-E
ffic
acy
on
Tim
e1
;A
U1
1=
Fre
qu
en
cy
on
Tim
e1
;A
U1
2=
Inte
nsity
on
Tim
e1
;G
D=
En
d-o
f-C
ou
rse
Gra
des.

AP
PE
ND
IXE
Co
rre
lati
on
Matr
ixo
nT
ime
Tw
o
AT
_T
2P
EU
_T
2P
US
_T
2S
N_T
2S
E_T
2A
U2
1A
U2
2G
D
AT
_T
2
PE
U_T
2
PU
S_T
2
SN
_T
2
SE
_T
2
AU
21
AU
22
GD
— .33
.62
.44
.14
.33
.04
.17
— .58
.52
.66
.14
.01
.06
— .55
.40
.31
.14
.08
— .53
.20
.06
.04
— .03
–.0
9
.02
—
–.0
6
.06
— –.1
2—
AT
_T
2=
Att
itu
de
tow
ard
Web
CT
on
Tim
e2
;P
EU
_T
2=
Perc
eiv
ed
Ease
ofU
se
on
Tim
e2
;P
US
_T
2:
Perc
eiv
ed
Usefu
lness
on
Tim
e2
;S
N_T
2=
Su
bje
ctive
No
rms
on
Tim
e2
;S
E_T
2=
Co
mp
ute
rS
elf-E
ffic
acy
on
Tim
e2
;A
U2
1=
Fre
qu
en
cy
on
Tim
e2
;A
U2
2=
Inte
nsity
on
Tim
e2
;G
D=
En
d-o
f-C
ou
rse
Gra
des.
STUDENTS’ PERCEIVED EASE OF USE / 305
REFERENCES
Ajzen, I., & Fishbein, M. (1980). Understanding attitudes and predicting social behavior.
Englewood Cliffs, NJ: Prentice Hall.
Bandura, A. (1977). Self-Efficacy: Toward a unifying theory of behavioral change.
Psychological Review, 84(2), 191-215.
Bayston, T. E., Jr. (2002). A study of research behavior patterns and online technology
self-efficacy. Unpublished doctoral dissertation, University of Central Florida, Orlando.
Davis, F. D. (1985). A technology acceptance model for empirically testing new end-
user information systems: Theory and results. Unpublished doctoral dissertation,
Massachusetts Institute of Technology, Cambridge.
Davis, F. D. (1989). Perceived usefulness, perceived ease of use, and user acceptance of
information technology. MIS Quarterly, 13(3), 319-340.
Davis, F. D. (1993). User acceptance of information technology: System characteristics,
user perceptions, and behavioral impacts. International Journal of Man Machine
Studies, 38, 475-487.
Dziuban, C., & Moskal, P. (2001). Evaluating distributed learning in metropolitan univer-
sities. Metropolitan Universities, 12(1), 41-49.
Fishbein, M., & Ajzen, I. (1975). Belief, attitude, intention and behavior: An introduction
to theory and research. Reading, MA: Addison-Wesley.
Harris, R. W. (1999). Attitudes toward end-user computing: A structural equation model.
Behaviour & Information Technology, 18(2), 109-125.
Hu, L., & Bentler, P. M. (1999). Cut criteria for fit indexes in covariance structure analysis:
Conventional criteria versus new alternatives. Structural Equation Modeling, 6(1),
1-55.
Hubona, G. S., & Blanton, J. E. (1996). Evaluating system design features. International
Journal of Human-Computer Studies, 44, 93-118.
Igbaria, M., Zinatelli, N., Cragg, P., & Cavaye, A. L. M. (1997). Personal computing
acceptance factors in small firms: A structural equation model. MIS Quarterly, 21,
279-305.
Lee, C.-Y. (2002). The impact of self-efficacy and task value on satisfaction and per-
formance in a web-based course. Unpublished doctoral dissertation, University of
Central Florida, Orlando.
Legris, P., Ingham, J., & Collerette, P. (2003). Why do people use information tech-
nology? A critical review of the technology acceptance model. Information &
Management, 40, 191-204.
Lu., H. P., Yu, H. J., & Lu, S. S. K. (2001). The effects of cognitive style and model type
on DSS acceptance: An empirical study. European Journal of Operational Research,
131, 649-663.
Marcoulides, G., & Hershberger, S. L. (1997). Multivariate statistical methods: A first
course. Hillsdale, NJ: Lawrence Erlbaum Associates.
Moskal, P. D., & Dziuban, C. D. (2001). Present and future directions for assessing
cybereducation: The changing research paradigm. In L. R. Vandervert, L. V. Shavinina,
& R. A. Cornell (Eds.), Cybereducation: The future of long distance learning
(pp. 157-184). Larchmont, NY: Mary Ann Liebert.
Pan, C. (2003). System use of WebCT in the light of the technology acceptance model:
A student perspective. Unpublished doctoral dissertation, University of Central
Florida, Orlando.
306 / PAN ET AL.

Pan, C., Gunter, G., Sivo, S., & Cornell, R. (2005). End-user acceptance of a learning
management system in two hybrid large-sized introductory undergraduate courses.
Journal of Educational Technology Systems, 33(4), 355-365.
Pan, C., Sivo, S., & Brophy, J. (2003). Students’ attitude in a Web-enhanced hybrid course:
A structural equation modeling inquiry. Journal of Educational Media & Library
Sciences, 41(2), 181-194.
Pearl, J. (1993). Comment: Graphical models, causality, and intervention. Statistical
Science, 87, 266-269.
Pearl, J. (1994). A probabilistic calculus of actions. In R. Lopez de Mantaras & D. Poole
(Eds.), Uncertainty in artificial intelligence (pp. 454-462). San Mateo, CA: Morgan
Kaufmann.
Pearl, J. (1995). Causal inference from indirect experiments. Artificial Intelligence in
Medicine, 7, 561-582.
Pearl, J., & Verma, T. (1991). A theory of inferred causation. In J. A. Allen, R. Fikes, &
E. Sandewall (Eds.), Principles of knowledge representation and reasoning: Proceed-
ings of the 2nd international conference (pp. 441-452). San Mateo, CA: Morgan
Kaufmann.
Robinson, L., Jr. (2001). Sales force use of technology: An extension of the technology
acceptance model, including antecedents and outcomes relevant in professional selling
organizations. Unpublished doctoral dissertation, University of South Florida, Tampa.
Sanders, M. S., & McCormick, E. J. (1993). Human factors in engineering and design
(7th ed.). New York: McGraw-Hill.
Sivo, S., & Pan, C. (in press). Undergraduate engineering and psychology students’ use of
a course management system: A factorial invariance study of user characteristics
and attitudes. Journal of Technology Studies.
Sivo, S., Pan, C., & Brophy, J. (2004). Temporal cross-lagged effects between subjective
norms and students’ attitudes regarding the use of technology. Journal of Educational
Media & Library Sciences, 42(1), 63-73.
Venkatesh, V., & Davis, F. D. (1994). Modeling the determinants of perceived ease of use,
Proceedings of the 15th International Conference on Information Systems, Vancouver,
British Columbia, Canada, 213-228.
Wolski, S., & Jackson, S. (1999, February). Technology diffusion within educational
institutions: Applying the technology acceptance model. Paper presented at the 10th
Society for Information Technology & Teacher Education International Conference,
San Antonio, TX.
Direct reprint requests to:
Dr. Cheng-Chang (Sam) Pan
Educational Technology
School of Education
The University of Texas at Brownsville
and Texas Southmost College
80 Fort Brown, EDBC 1.320
Brownsville, TX 78520
e-mail: [email protected]
STUDENTS’ PERCEIVED EASE OF USE / 307


![INVESTIGATING COLLABORATIVE COMMERCE SYSTEM FROM …web.csulb.edu/journals/jecr/issues/20131/paper6.pdf · INVESTIGATING COLLABORATIVE COMMERCE SYSTEM FROM ... 2013], the factors](https://static.fdocuments.net/doc/165x107/5ad270337f8b9abd6c8cbd4f/investigating-collaborative-commerce-system-from-webcsulbedujournalsjecrissues20131.jpg)


![Personalization Research: A rigorous literature review on …web.csulb.edu › journals › jecr › issues › 20104 › Paper5.pdf · 2010-11-30 · and Tuzhilin [2005b] and a casy](https://static.fdocuments.net/doc/165x107/5f0f8a6e7e708231d444ac0d/personalization-research-a-rigorous-literature-review-on-webcsulbedu-a-journals.jpg)


