Student Uses and Perceptions of Closed Captions and Transcripts · 2018-09-13 · Student Uses and...
52
Student Uses and Perceptions of Closed Captions and Transcripts Results from a national study Katie Linder, Ph.D. www.3playmedia.com/student-research-study
Transcript of Student Uses and Perceptions of Closed Captions and Transcripts · 2018-09-13 · Student Uses and...

Student Uses and Perceptions of Closed Captions and Transcripts
Results from a national studyKatie Linder, Ph.D.
www.3playmedia.com/student-research-study

Student Uses and Perceptions of Closed Captions and Transcripts
Katie Linder, PhD
Research Director, Oregon State University Ecampus
Suggested citation: Linder, K. (2016). Student uses and perceptions of closed captions and
transcripts: Results from a national study. Corvallis, OR: Oregon State University Ecampus Research Unit.
October 2016

3
CONTENTS
Acknowledgements……………………………………………………………………………………………………………………4
Definitions….….……………………………………..……………………………..……………………………………………………5
Executive Summary….…………………………………………………………..………………………………………………..6-7
Results……………………………………………………..…………………………………………………………………………..8-26
Video, closed caption, and transcript availability…………………………………………………………8-9
Student awareness of the availability of closed captions and transcripts…………………..9-10
Student use of closed captions and transcripts……………………………………………………….11-12
How do students with disabilities compare to students without disabilities in closed caption and transcript use? …………………………………………………………………………………………12
Why students use video closed captions and transcripts…………………………………………12-14
Closed caption and transcript availability impacts their helpfulness………………………..14-15
The perceived benefits of closed captions and transcript use………………………………….15-21
How students use closed captions and transcripts to support their learning…………..21-24
The perceived hindrances of closed captions and transcript use……………………………..24-27
Conclusion: Takeaways and Future Directions…………………………………………………………………….27-28
Methodology & Respondent Demographics……………………..….…………………………………………….29-31
Appendix A: Survey……………………..….…………………………………………………….……………………………32-41
Appendix B: Data Tables……………………..….………………………………………………………………………….42-50
Sponsors……………………..….…………………………………………………….……………………………………………51-52
Cover design by Samara Battisti
This work is licensed under a Creative Commons Attribution-NonCommercial-NoDerivatives 4.0 International License.

4
ACKNOWLEDGEMENTS
Partnerships between academic researchers and commercial vendors may be viewed with some level of skepticism, but I believe they are a crucial component of the future of distance education research. Both academic institutions and vendors bring important insights, experiences, and networks to the table when designing research projects. Sometimes it takes this combined effort to gather additional information on what can improve students’ learning environments and experiences in higher education.
That was certainly the case here and I was fortunate to have 3Play Media as a partner in this study. I thank them for their feedback on the study research questions and for their support in recruiting study participants and sharing the study results. Special thanks to Tole Khesin and Lily Bond at 3Play Media for their collaborative efforts on this project.
This study was also made possible by the recruitment efforts of the many higher education administrators who assisted in sharing the study materials with students at their institutions. Many thanks to those who sent emails, assisted with institution-specific IRB paperwork, and expressed their enthusiasm about the study results.
The data analysis for this study was completed with the assistance of two statistics consultants, Paula Quinn and Dr. Brooke Robertshaw, and the qualitative coding was completed with assistance from Amy Donley.
Finally, this study would not have occurred without the participation of the student respondents. Much gratitude to those who took the time to share about their uses and perceptions of closed captions and transcripts, the specific experiences they have had on their campuses, and their feedback on how closed captions and transcripts can become better learning aids for them and their peers.
Dr. Katie Linder Research Director, Oregon State University Ecampus October 2016
5
DEFINITIONS Videos were defined in the survey as recorded lectures, lessons, or other video materials that might be made by a professor or videos a professor includes in a course that are created by other people.
Closed captions were defined in the survey as blocks of text usually shown at the bottom of a video that mirror the spoken audio and that can be turned on or off.
Transcripts were defined in the survey as a separate document that can be read or printed that represents the entire spoken audio of a video.

6
EXECUTIVE SUMMARY To what extent are students aware of the availability of video closed captions and transcripts in their courses? Approximately 60% of the student respondents said they knew how to tell if a video has closed captioning as a feature; approximately 30% said that they sometimes know and approximately 15% said they did not know how to tell if a video has closed captioning as a feature.
Respondents were also asked how many videos in their courses had closed captioning or transcripts as an option. Comparatively, closed captions were more available than transcripts with almost 30% of respondents reporting that closed captions were available for “all,” “most,” or “many” videos. Almost an equal number (a combined 26.7%) said that closed captions were available for “just a few” or for “none” of the videos in their courses.
When asked about the availability of transcripts, only 12.2% of respondents reported that transcripts were available for “all,” “most,” or “many” videos. Almost 61% said that transcripts were available for “just a few” or for “none” of the videos in their courses.
In both cases, a relatively large number of respondents were unsure about the availability of these resources. Over one quarter were unsure about the availability of closed captions (27%) and almost one in five were not sure about the availability of transcripts (18.4%). To what extent do various student populations use video closed captions and transcripts?
Respondents were asked how often they use closed captions and transcripts when they are available. Approximately 35% noted that they “always” or “often” use closed captions when they are available. In response to that same question, 26% said they never use them.
In the case of transcripts, approximately 19% noted that they “always” or “often” use transcripts when they are available; 55.5% said that they never use transcripts when they are available.
Why do students use video closed captions and transcripts? Survey respondents were asked to check all of the options that apply to them from a pre-determined list regarding why they use closed captions and transcripts. For closed captions, the most respondents said that they use closed captions to help them focus, to help them retain information, and to help them overcome poor audio quality of

7
videos. The smallest group of respondents use closed captions because of English being their second language.
Comparatively, respondents reported using closed captions more than transcripts in all categories. This may be, in part, because closed captions were reported as being more available. Twice as many respondents reported using closed captions than transcripts for help with focus. More than twice as many reported using closed captions than transcripts for watching videos in sound sensitive environments such as libraries.
How do students use video closed captions and transcripts to support their learning?
For both closed captions and transcripts, the majority of student respondents focused their qualitative comments on the helpfulness of each as a learning aid. Due to the large number of comments related to the use of closed captions and transcripts as a learning aid, these comments were further coded in to four additional sub-themes: (1) accuracy, (2) comprehension, (3) retention, and (4) engagement.
For closed captions, the highest number of comments (51.9%) was related to the use of closed captions to aid with comprehension. This category was also the highest for transcripts, with 45.6% stating that transcripts were helpful with comprehension of course material.
To what extent do various student populations perceive the use of video closed captions as potentially valuable to their learning?
Regarding the helpfulness of closed captions, sub-group analyses show that the percentage of respondents who stated that closed captions were either “very” or “extremely” helpful to them was higher for many sub-groups including (in ascending order) students with learning disabilities (60.6%), adult learners (62%), students who have difficulty with vision (64%), students who “always” or “often” have trouble maintaining focus (64.7%), first generation students (64.8%), students who have difficulty with visual representations (65.4%), Pell-eligible students (65.4%), students with other disabilities (65.4%), students registered with an Office of Disability Services (65.8%), ESL students (66%), students receiving academic accommodation (66.3%), and students who have difficulty with hearing (71.4%).
Regarding the helpfulness of transcripts, the percentage of respondents who stated that transcripts where either “very” or “extremely” helpful to them was higher for (in ascending order) students who “always” or “often” have trouble maintaining focus (30.7%), students with learning disabilities (32.8%), adult learners (34.7%), students registered with an Office of Disability Services (35%), students who have difficulty with hearing (35.4%), students who have difficulty with visual representations (36.2%), ESL students (36.8%), and students receiving academic accommodation (37%).

8
RESULTS Video, closed caption, and transcript availability
The students who responded to the survey are taking courses in a range of modalities. A little over half of respondents (51.9%) take courses primarily online with occasional face-to-face and a little over one-third (35.2%) take courses primarily face-to-face.
Face-to-face35%
Primarily face-to-face with occasional online
4%
Equally face-to-face and online
5%
Primarily online with occasional face-to-face
52%
Only online4%
Course Modality
Figure 1: Primary Course Modality of Respondents
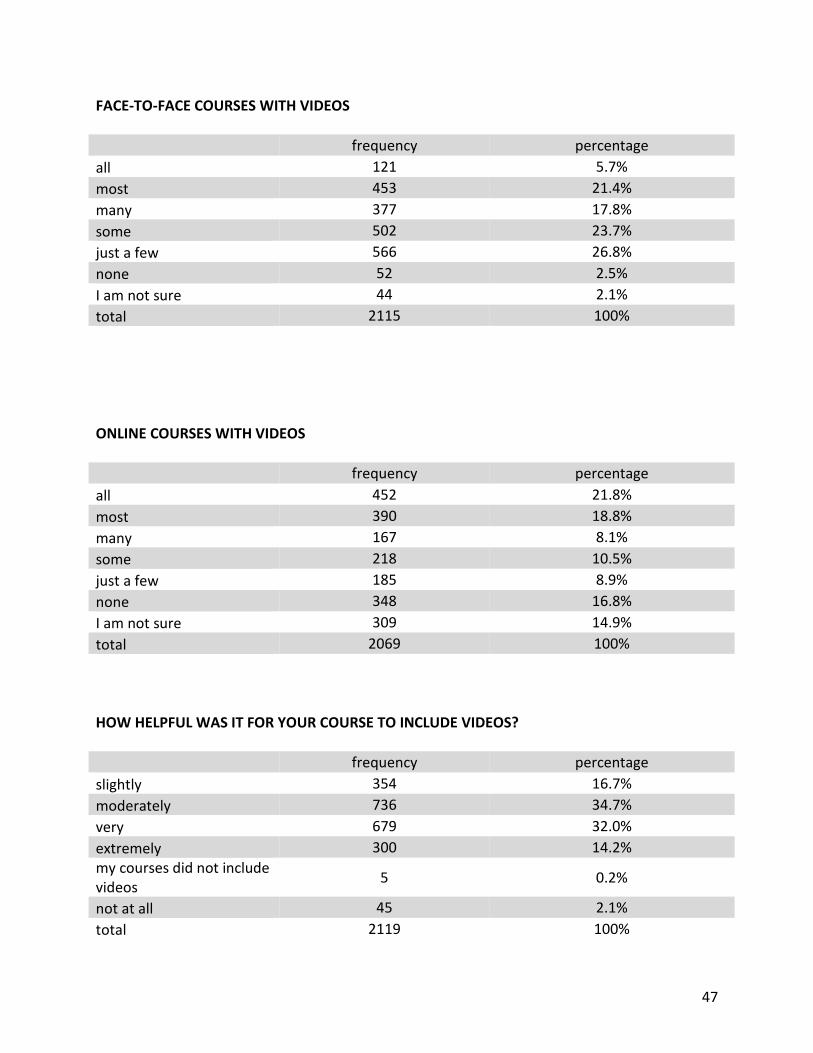
When asked whether any of their courses included videos, 99.7% of respondents noted that at least one of their courses included videos. In face-to-face courses, a combined 44.9% said that “all,” “most,” or “many” of their courses had videos. Only 2.5% noted that “none” of their courses had videos. In online courses, 48.7% said that “all,” “most,” or “many” of their courses had videos. Somewhat surprisingly, 16.8% noted that “none” of their online courses had videos.

9
5.7%
21.4%
17.8%
23.7%
26.8%
2.5% 2.1%
21.8%
18.8%
8.1%10.5%
8.9%
16.8%14.9%
0%
5%
10%
15%
20%
25%
30%
All Most Many Some Just a few None I am not sure
Video Availability in Face-to-Face versus Online Courses(as percentage of the whole)
Face-to-Face Online
Figure 2: Video Availability in Face-to-Face Compared to Online Courses
While 46.2% of respondents found it “extremely” or “very” helpful for their courses to include videos, the majority said that videos are only “moderately” or “slightly” helpful (a combined 51.4%).
The percentage of respondents who found videos “extremely” or “very” helpful was higher for first generation students (51.6%), Pell-eligible students (51.7%), adult learners (52.8%), students who have difficulty with hearing (53.6%), and for ESL students (58.1%).
The percentage of respondents who found videos “extremely” or “very” helpful was lower for students with other disabilities (40.7%), students under the age of 25 (42.1%), students with learning disabilities (44.9%), and for students receiving an academic accommodation (46%).
Student awareness of the availability of closed captions and transcripts
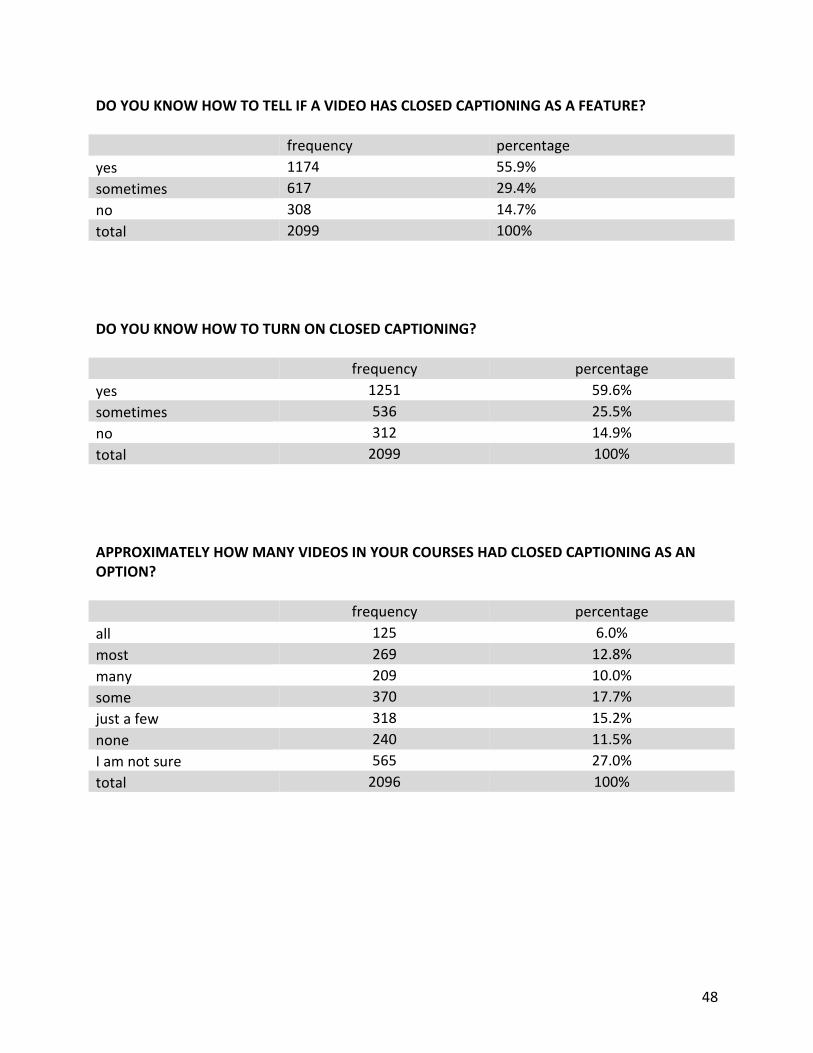
When asked whether they knew how to tell if a video has closed captioning as a feature, 55.9% of respondents said that they did know, approximately 30% said that they sometimes know, and approximately 15% said they did not know how to tell if a video has closed captioning as a feature.
Of the 15% who reported not knowing how to tell if a video has closed captioning as a feature, the highest percentage of this group were students who have difficulty with visual representations (17.9%).

10
When asked whether they know how to turn on closed captioning, respondents reported similar numbers to their awareness of the availability of closed captions as a feature with almost 60% stating they know how to turn closed captioning on, a little over a quarter (25.5%) saying they sometimes know, and approximately 15% stating that they do not know how to turn on closed captions.
Of the 15% who reported not knowing how to turn on closed captioning, the highest percentage of this group were students who have difficulty with visual representations (19.8%) and students with learning disabilities (19.3%).
Respondents were also asked how many videos in their courses had closed captioning or transcripts as an option. Comparatively, closed captions were more available than transcripts with almost 30% of respondents reporting that closed captions were available for “all,” “most,” or “many” videos. Almost an equal number (a combined 26.7%) said that closed captions were available for “just a few” or for “none” of the videos in their courses.
6.0%
12.8%10.0%
17.7%15.2%
11.5%
27.0%
3.1%4.1% 4.0%
9.6%
18.0%
42.8%
18.4%
0%
5%
10%
15%
20%
25%
30%
35%
40%
45%
All Most Many Some Just a few None I am not sure
Availability of Closed Captions versus Transcripts(as percentage of the whole)
Closed Captions Transcripts
Figure 3: Availability of Closed Captions versus Transcripts
When asked about the availability of transcripts, only 12.2% of respondents reported that transcripts were available for “all,” “most,” or “many” videos. Almost 61% said that transcripts were available for “just a few” or for “none” of the videos in their courses.
In both cases, a relatively large number of respondents were unsure about the availability of these resources. Over one quarter were unsure about the availability of closed captions (27%) and almost one in five were not sure about the availability of transcripts (18.4%).

11
Student use of closed captions and transcripts
Respondents were asked how often they use closed captions and transcripts when they are available. In response to the question about closed captions, 34.9% noted that they “always” or “often” use closed captions when they are available. In response to that same question, 26% said they never use them.
The percentage of respondents who “always” or “often” use closed captions when they are available was higher for students with other disabilities (41.1%), ESL students (44.1%), students registered with an Office of Disability Services (44.8%), students with academic accommodations (48.2%), and students who have difficulty with hearing (50.3%).
In the case of transcripts, 18.7% noted that they “always” or “often” use transcripts when they are available; 55.5% said that they never use transcripts when they are available.
The percentage of respondents who “always” or “often” use transcripts when they are available was higher for students with other disabilities (21.5%), students who “always” or “often” have trouble maintaining focus (21.8%), ESL students (22.6%), adult learners (22.7%), students with learning disabilities (22.8%), students registered with an Office of Disability Services (24%), students who have difficulty with visual representations (26.6%), students receiving academic accommodation (27%), and students who have with difficulty hearing (28%).
The percentage of respondents who “always” or “often” use transcripts when they are available was lower for students under the age of 25 (16.7%) and first generation students (17.2%).
26.0%20.1% 19.0% 17.1% 17.8%
55.5%
12.7% 13.2%8.7% 10.0%
0%
10%
20%
30%
40%
50%
60%
Never Seldom Sometimes Often Always
Student Use of Closed Captions and Transcripts(as percentage of the whole)
Closed Captions Transcripts
Figure 4: Comparing Student Use of Closed Captions and Transcripts

12
As a percentage of the whole, more of the respondents used closed captions when they were available than used transcripts when they were available.
How do students with disabilities compare to students without disabilities in closed caption and transcript use?
A comparison was made between students who identified as having a disability (either requiring accommodations and/or indicating that they are registered with the Office of Disability Services) and those who did not identify as having a disability regarding how much they used transcriptions and captions. Further analysis compared how helpful and how much of a hindrance closed captions and transcripts were and if there was a difference between students who indicated they had a disability and those without disabilities.
It was found that students with disabilities use closed captions more often than students without disabilities, but the size of difference is small (t(1935)=-4.153, p=0.000, d=0.30).
It was found that students with disabilities use transcripts more often than students without disabilities, but the magnitude of difference is small (t(753)=-3.076, p=0.002 d=0.38).
Overall, there were 1,569 student respondents who did not self-identify as having difficult with hearing. Of those, 31.4% use closed captions “always” or “often.” A slightly smaller proportion (29.2%) reported “never” using closed captions. In other words, 70.8% of survey respondents without hearing difficulties use closed captions at least some of the time.
Why students use video closed captions and transcripts
Survey respondents were asked to check all of the options that apply to them from a pre-determined list regarding why they use closed captions and transcripts. Respondents were also given the option of “other” with a text box to describe alternative uses of each.
For closed captions, the most respondents said that they use closed captions to help them focus, to help them retain information, and to help them overcome poor audio quality of videos. The smallest group of respondents use closed captions because of English being their second language.
Comparatively, respondents reporting used closed captions more than transcripts in all categories. This may be, in part, because closed captions were reported as being more available. Twice as many respondents reported using closed captions than transcripts for help with focus. More than twice as many reported using closed captions than transcripts for watching videos in sound sensitive environments such as libraries.

13
1001 963 958
650
418288 285
155 112
0
200
400
600
800
1000
1200
Why Respondents Use Closed Captions
Figure 5: Why Respondents Use Closed Captions
682 668 667
491428
288 273 261178
13675
0
100
200
300
400
500
600
700
800
Why Respondents Use Transcripts
Figure 6: Why Respondents Use Transcripts

14
Figure 7: A Comparison of Closed Caption and Transcript Uses by Frequency
Two categories of use were offered for transcripts that were not offered for closed captions: (1) as study guides and (2) for help finding information. Both of these categories were in the top three uses of transcripts by respondents.
Closed caption and transcript availability impacts their helpfulness
Analysis was done to determine if the availability of closed captions and transcriptions made a difference regarding how helpful students perceived the closed captions and transcripts to be. Statistical analyses show that the helpfulness of closed captions and transcripts is significantly affected by their availability.
It was found that the availability of closed captions made a significant difference in how helpful students found them to be and the difference between the groups was large (f(6)=6.294, p=0.000, ηp2 =0.346). More detailed comparisons indicated that students who were unsure if captions were available caused there to be significance based on availability of captions. When students who are unsure are removed from the analysis there is no longer any significant difference in how helpful students perceive the captions to be, and there is no magnitude of difference.
It was found that the availability of transcripts made a significant difference in how helpful students found them to be and the difference between the groups was large (f(6)=87.710, p=0.000, ηp2 =0.221. More detailed comparisons indicated that the significance and large magnitude of difference was caused by students who were unsure if transcripts were available, as well as by those who indicated that no transcripts were available. When these two groups
963 1001 958
418
155
650
285 288112
668
491 428288 273 261
178 13675
0
200
400
600
800
1000
1200
Comparison of Closed Caption and Transcript Uses
Closed Captions Transcripts

15
were removed from the analysis there is no longer any significant difference or magnitude of difference in availability and perceived helpfulness of transcripts.
The perceived benefits of closed captions and transcript use
Respondents were asked about whether they perceived closed captions and transcripts as being helpful to their learning. As a percentage of the whole, closed captions were perceived as more helpful with 59.1% of respondents noting that closed captions where either “very” or “extremely” helpful to them. Comparatively, 28% of respondents noted that transcripts were “very” or “extremely” helpful to them.
Sub-group Analyses for Closed Captions
Regarding the helpfulness of closed captions, sub-group analyses show that the percentage of respondents who stated that closed captions where either “very” or “extremely” helpful to them was higher for many sub-groups including students with learning disabilities (60.6%), adult learners (62%), students who have difficulty with vision (64%), students who “always” or “often” have trouble maintaining focus (64.7%), first generation students (64.8%), students who have difficulty with visual representations (65.4%), Pell-eligible students (65.4%), students with other disabilities (65.4%), students registered with an Office of Disability Services (65.8%), ESL students (66%), students receiving academic accommodation (66.3%), and students who have difficulty with hearing (71.4%).
Regarding the helpfulness of closed captions, the percentage of respondents who stated that closed captions where either “very” or “extremely” helpful to them was lower for students under the age of 25 (57.7%).
Of those students who indicated that they used closed captions often or always, there was no significant difference between how helpful students with disabilities found them compared with students without disabilities and further the size difference was not noticeable (t(676)=-1.478, p=0.140, (d=0.17).
Sub-group Analyses for Transcripts
Regarding the helpfulness of transcripts, the percentage of respondents who stated that transcripts where either “very” or “extremely” helpful to them was higher for students who “always” or “often” have trouble maintaining focus (30.7%), students with learning disabilities (32.8%), adult learners (34.7%), students registered with an Office of Disability Services (35%), students who have difficulty with hearing (35.4%), students who have difficulty with visual representations (36.2%), ESL students (36.8%), and students receiving academic accommodation (37%).

16
1.4%
10.5%
29.0%
35.7%
23.4%
31.1%
18.4%22.5%
17.0%
11.0%
0%
5%
10%
15%
20%
25%
30%
35%
40%
Not at all Slightly Moderately Very Extremely
Helpfulness of Closed Captions & Transcripts Bar Chart (as percentage of whole)
Closed Captions Transcripts
Figure 8: Bar Chart Comparison of Student Perceptions of Helpfulness of Closed Captions and Transcripts
1.4%
10.5%
29.0%
35.7%
23.4%
31.1%
18.4%22.5%
17.0%
11.0%
0%
5%
10%
15%
20%
25%
30%
35%
40%
Not at all Slightly Moderately Very Extremely
Helpfulness of Closed Captions & Transcripts Line Graph (as percentage of whole)
Closed Captions Transcripts
Figure 9: Line Graph Comparison of Student Perceptions of Helpfulness of Closed Captions and Transcripts

17
Regarding the helpfulness of transcripts, the percentage of respondents who stated that transcripts where either “very” or “extremely” helpful to them was lower for students under the age of 25 (24.7%).
Of those students who indicated that they used transcripts often or always, there was no significant difference between how helpful students with disabilities found them compared with students without disabilities and further the size of the difference was not noticeable ((t(293)=-1.070, p=0.285, d=0.16).
There was also a significant difference between the number of respondents who viewed closed captions and transcripts as “not at all” helpful. For closed captions, only 1.4% noted that closed captions are not at all helpful to them. For transcripts, almost one-third of respondents (31.1%) said that transcripts were not at all helpful to them.
Qualitative Analysis of Comments Related to the Helpfulness of Closed Captions and Transcripts
Respondents were also offered an opportunity to qualitatively respond to why closed captions and transcripts are helpful to them. For closed captions 1,210 responses were included in the analysis. For transcripts, 826 responses were included in the analysis. For both questions, responses were coded into five main categories of helpfulness: (1) environmental, (2) poor video/audio quality and/or instructor difficult to understand, (3) convenience, (4) disability accommodation, and (5) as a learning aid.
For the qualitative comments related to the helpfulness of closed captions, 6.7% were environmental, 22.4% related to poor video/audio quality, 8.3% related to an instructor being difficult to understand, 5.1% referenced convenience, 6% noted a disability accommodation, and 75.5% comments on closed captions being helpful as a learning aid.
Sample comments of perceived benefits of closed captions
Environmental (6.7%)
• “I don’t like playing videos with sound when I’m in an environment where doing so would be disruptive.”
• “Closed captions are helpful when in an environment where the sound cannot be on. It allows the video to still be watched and understood in such a situation.”
Poor video/audio quality (22.4%)
• “Helps when a video has poor sound quality.”
• “Unclear sound quality in the video or poorly recorded voices were helped to distinguish with the provided closed captions.”

18
Figure 10: Qualitative Themes for Helpfulness of Closed Captions
Instructor difficult to understand (8.3%)
• “My professor has a slight accent that makes her words fast and jumbled.”
• “If my teachers talk quickly, I don't have to worry about missing a word. Some professors have had an accent that makes interpreting words quite difficult, so closed captioning helps me to be confident in what I am hearing.”
Convenience (5.1%)
• “I find it easier to read along with the videos rather than just sit there and listen to the professor talk.”
• “For note taking, it is easier to pause the video and copy down CC than it is to replay the audio numerous times.”
environmental, 6.7%
poor audio/video quality, 22.4%
instructor difficult to understand, 8.3%
convenience, 5.1%
accommodation, 6.0%
learning aid, 75.5%
Qualitative Themes for Helpfulness of Closed Captions

19
Accommodation (6%)
• “I’m dyslexic so it helps me to know that the notes I’m writing down are both spelled correctly and in the right syntax.”
• “I wear hearing aids due to hearing loss. When I am at school I have to take them out or I hear what is going on in the other classroom. The closed captions make it easier for me to understand what is being said during this time.”
Learning Aid (75.5%)
• “Closed captions allow me the watch the video in two different ways: the first time I watch a video, I go through it without subtitles and the second time, I watch it with subtitles. This allows me to check if I missed anything in the video and allows me to pause the video to write stuff down if I want an exact quote.”
• “I had to watch videos for a Spanish class, and the closed captions helped me learn the vocabulary and overcome the fast paced speaking. Also, in several science classes, I have used closed captions when the professor was discussing hard to understand vocabulary or complex chemical names.”
For the qualitative comments related to the helpfulness of transcripts, 2.2% were environmental, 4.1% related to poor video/audio quality, 2.1% related to an instructor being difficult to understand, 35.8% referenced convenience, 2.2% noted a disability accommodation, and 81.1% comments on closed captions being helpful as a learning aid.
Sample comments of perceived benefits of transcripts
Environmental (2.2%)
• “They helped me understand what was being said if I was in a noisy environment, or when I was in a quiet environment. I found it easier to follow along as well.”
• “Transcripts are helpful in situations where you may not be able to view the video or hear the audio properly.”
Video/audio quality (4.1%)
• “Helped me overcome poor audio.”
• “They can help me understand what the video says without having to listen to terrible audio.”

20
Instructor difficult to understand (2.1%)
• “It is not always easy to understand professors who have a foreign dialect or who speak too quickly.”
• “I have a hard time with accents so I prefer to be able to understand what is being said so I can actively participate and pass my classes.”
Convenience (35.8%)
• “It’s much easier to locate the key ideas and terms.”
• “They’re easy to reference when looking for specific information and I don’t have to sit through an entire video just to find the one thing I’m looking for.”
• “I read very quickly. When I don’t have time to watch a video, reading the transcript helps me get my work done faster.”
environmental, 2.2% poor audio/video quality, 4.1%
Instructor difficult to understand, 2.1%
convenience, 35.8%
accommodation, 2.2%learning aid, 81.1%
Qualitative Themes for Helpfulness of Transcripts
Figure 11: Qualitative Themes for Helpfulness of Transcripts

21
6.7%
26.4%
5.1% 6.0%
75.5%
2.2%5.6%
35.8%
2.2%
81.1%
0%
10%
20%
30%
40%
50%
60%
70%
80%
90%
environmental poor audio/videoquality
convenience accommodation learning aid
Comparing Percentages of Qualitative Themes for Helpfulness of Closed Captions and Transcripts
Closed Captions Transcripts
Figure 12: Comparison of Qualitative Themes for Helpfulness of Closed Captions and Transcripts
Accommodation (2.2%)
• “It helps with my learning disability, being able to read the information while watching the video.”
• “I’m a hearing impaired student, having transcripts over the video helps extremely because I cannot hear video sound speaking very clearly.”
Learning Aid (81.1%)
• “Reinforcement of the information and helpful for studying. Also I can go back and read it during the video to understand.”
• They give me all the information in the video which I can then summarize more easily & helps me not to miss anything.”
How students use closed captions and transcripts to support their learning
For both closed captions and transcripts, the majority of student respondents focused their qualitative comments on the helpfulness of each as a learning aid.
Due to the large number of comments related to the use of closed captions and transcripts as a learning aid, these comments were further coded in to four additional sub-themes: (1) accuracy, (2) comprehension, (3) retention, and (4) engagement.

22
For comments on accuracy, students said things related to closed captions and transcripts helping with not missing important information, being able to see unfamiliar words or terminology, being able to distinguish between similar sounding words, demonstrating correct spelling of names and terms, and assisting with accurate note-taking and quoting.
For comments on comprehension, students said things related to closed captions and transcripts helping with visually seeing key points, connecting ideas between text and visual representations, offering information in more than one way, learning English as a second language, following the video content, playback or pausing for review, learning a foreign language, and organizing information.
For comments on retention, students said things related to closed captions and transcripts helping with better retaining information through reading the video content, test and exam review, and studying.
For comments on engagement, students said things related to closed captions and transcripts helping with focus and with being distracted while watching the video.
There were 913 comments coded into the learning aid theme for closed caption use. Within the four categories of comments related to the use of transcripts as a learning aid, 33.4% were related to accuracy, 51.9% were related to comprehension, 14.6% were related to retention of information, and 20.3% were related to student engagement.
Sample comments of perceived benefits of closed captions for learning
Accuracy (33.4%)
• “If I need to write down notes, I know exactly how to quote a video.”
• “If I missed what the person said in the video I could read their words.”
Comprehension (51.9%)
• “It can help me deeply understand the lecture.”
• “It helps to read in addition to hearing. Learning with both senses to improve understanding.”
Retention (14.6%)
• “By simultaneously reading and listening to the content, I am able to retain the information better.”
• “They help me to better retain and understand the information that I am being taught.”

23
Engagement (20.3%)
• “They help me to focus on the video instead of just tuning out the noise.”
• “I find closed captions helpful as it helps me focus on what the lesson is and understand it fully in case I didn't catch the audio.”
There were 671 comments coded into the learning aid theme for transcript use. Within the four categories of comments related to the use of transcripts as a learning aid, 41.3% were related to accuracy, 45.6% were related to comprehension, 8.2% were related to retention of information, and 4.9% were related to student engagement.
Sample comments of perceived benefits of transcripts for learning
Accuracy (41.3%)
• “If I missed anything, I could have it right in front of me.”
• “They were used with a foreign language. They were helpful because I could look up words I wasn’t familiar with.”
Comprehension (45.6%)
• “It is harder to take notes from a video. Transcripts allow easier identification of key points.”
• “If I didn’t want to watch the video, I could just read the transcript in my time. Also it was useful for if I didn’t understand a concept so I could reread it instead of go back in the video repeatedly.”
Retention (8.2%)
• “I am a visual learner so being able to read the material at my own pace and take notes helped me retain the information better.”
• “Seeing text helps me retain information better.”
Engagement (4.9%)
• “It helps me not have to take notes, which allows me to focus on the video.”
• “They are helpful to keep me on point and focused. I had one online course that the teacher had a video, powerpoint and narration of her video and I was most successful in

24
her class as I felt totally supported from all angles.”
33.4%
51.9%
14.6%
20.3%
41.3%45.6%
8.2%4.9%
0%
10%
20%
30%
40%
50%
60%
Accuracy Comprehension Retention Engagement
Sub-theme Frequencies for Closed Caption and Transcript Use as a Learning Aid
Closed Captions Transcripts
Figure 13: Comparing Sub-theme Frequencies for Closed Caption and Transcript Use as a Learning Aid
The perceived hindrances of closed captions and transcript use
Respondents were asked whether they perceived closed captions and transcripts to be a hindrance.
Regarding closed captions, the majority of respondents (89.6%) said that they are “not at all” or “slightly” a hindrance with only 1.1% stating that they were “very” or “extremely” a hindrance.
Of those students who indicated that they used closed captions often or always, there was no significant difference between how much of a hindrance students with disabilities found them compared with students without disabilities and the size of the difference was not noticeable (t(675)=-1.257, p=0.209, d=0.13).
Of those students who indicated that they used transcripts often or always, there was a significant difference between how much of a hindrance students with disabilities found them compared with students without disabilities but that difference was small (t(293)=-2.237, p=0.026, d=0.32).
For the qualitative comments related to closed caption hindrances, 399 comments were included in the analysis and four main themes emerged:

25
• 41.6% (166 respondents) said that closed captions were distracting or required too much cognitive load
• 34.6% (138 respondents) said that closed captions included incorrect information such as typos or were incorrectly synced with the video
• 32.1% (128 respondents) said that closed captions blocked important information
• 9% (36 respondents) cited miscellaneous design issues as being a hindrance
Sample comments of perceived hindrances of closed captions
Distracting or required too much cognitive load (41.6%)
• “I do not focus on the video, I focus on the reading.”
• “If the video is simple with simple vocabulary then closed captioning can be annoying and seem repetitive causing the feeling of boredom.”
• “They are distracting from the actual video.”
Included incorrect information such as typos or were incorrectly synced with the video (34.6%)
• “Most of the time the videos in class have used automatic captions which never match up with what is really being said which often makes them inaccurate and not helpful.”
• “When the captioning is wrong, it is frustrating because in a PhD program details matter. Additionally, when they are wrong, it takes that much longer to process and contribute to a conversation.”
Blocked important information (32.1%)
• “Some instances it covered up the equations needed to see for the math classes.”
• “It can block important images/pictures.”
• “When they are in the way of the video (specifically words, such as names or positions of people talking in video).”
Miscellaneous design issues (9%)
• “When they were not optional.”

26
• “If the quality of the caption are bad or if they blend in with the video or are too big or too small or when the words lag behind to far on what the audio is saying.”
Regarding transcripts, the majority of respondents (91.6%) said that they are “not at all” or “slightly” a hindrance with only 2.2% stating that they were “very” or “extremely” a hindrance.
For the qualitative comments related to transcript hindrances, 153 comments were included in the analysis and four main themes emerged:
• 49.7% (76 respondents) said that transcripts were distracting from the video or visual cues or required too much attention or cognitive load
• 20.3% (31 respondents) said that transcripts included incorrect information such as typos, were not well-written, or were not formatted well
• 11.8% (18 respondents) said that transcripts were too long, were too much to read, or required too much time
• 9.2% (14 respondents) said that transcripts were costly and/or inconvenient to print out and carry around
Sample comments of perceived hindrances of transcripts
Transcripts were distracting or required too much attention (49.7%)
• “Transcripts are meant to be read without the video playing, so you cannot see an object if the person is pointing to it in the video.”
• “Hard to read and listen and watch at the same time.” Transcripts included incorrect information such as typos, were not well-written, or were not formatted well (20.3%)
• “Contained info that was irrelevant.”
• “Not all correctly transcribed and often have weird line breaks.”
• “Hard to sift through big blocks of text sometimes.” Transcripts were too long, were too much to read, or required too much time (11.8%)
• “It can make studying take longer than it should.”

27
• “It is time consuming when you have to request for transcripts.”
• “I would have to read it and not be able to watch the video and might fall behind withthe other classmate.”
Transcripts were costly and/or inconvenient to print out and carry around (9.2%)
• “Printing them out.”
• “If it’s printed paper, that’s a bother to carry around if there are several videos andseveral transcripts.”
• “Finding a printer that doesn’t cost money to use poses to be difficult at times.”
Conclusion: Takeaways, Opportunities, and Future Directions
Based on the results from this survey, there are several potential takeaways and opportunities:
Takeaway: Almost 100% of survey respondents had at least one course, either face-to-face or online, that included some video content. Across modalities of online and face-to-face courses, students are encountering videos in almost all of their course content.
Opportunity: Ensure that all videos across modalities have closed captions or transcripts provided.
Takeaway: Closed captions or transcripts are not being provided for all videos and multimedia items or students are not aware when closed captions or transcripts have been made available. Many students reported not having closed captions or transcripts as an option, not being able to tell if closed captions are present or not knowing how to turn them on, and/or not being able to find transcripts.
Opportunity: Ensure that students know about closed caption and transcript options by showing them the features and how to find them or turn them on.
Takeaway: Generally, students find closed captions to be more helpful than transcripts. However, transcripts are less available to students than closed captions.
Opportunity: Provide both options for all videos so that students can choose which option they prefer.

28
Takeaway: Closed captions and transcripts are being used in a range of ways to aid student learning. Students who do not require closed captioning or transcripts for accommodation are using these tools in a range of ways to access videos and support their learning. However, not all students are aware that these tools can be used in these ways.
Opportunity: Share with all students how they can use closed captioning and transcripts as learning aids to assist with accuracy, comprehension, retention of information, and engagement.
Takeaway: Many of the common hindrances for closed captions and transcripts can be mitigated. By instituting a quality assurance process that involves the creator of the content, many of the common hindrances cited by survey respondents can be fixed.
Opportunity: Involve video creators in quality assurance checks of closed captions and transcripts to ensure that common hindrances sited by students are resolved when possible.
Future Research Directions for Student Perceptions and Uses of Closed Caption and Transcripts
This study has also highlighted several potential future research questions regarding student perceptions and uses of closed captions and transcripts:
1) Does the modality of the closed captions (i.e. closed versus open captions; pre-recorded versus live captioned) impact student learning?
2) What is the level of availability of interactive transcripts? Do students prefer this option to closed captions and/or regular transcripts?
3) To what degree does the player used for videos impact students’ experience of closed captions?
4) How does student use and perception of closed captions or transcripts change when they are provided for multimedia items (videos that already include text on screen)?
In many ways, this study is just scratching the surface of what we know about how students use and perceive closed captions and transcripts in the college and university classroom.
Additional research on the questions above, or other questions related to student use and perceptions of closed captions and transcripts, is welcomed and encouraged.

29
METHODOLOGY & RESPONDENT DEMOGRAPHICS The following research questions were developed in collaboration between the Oregon State University Ecampus Research Unit Director and 3Play Media to guide the exploratory survey for students:
1) To what extent are students aware of the availability of video closed captions in their courses?
2) To what extent do various student populations use video closed captions and transcripts?
3) Why do students use video closed captions and transcripts? 4) How do students use video closed captions and transcripts to support their learning? 5) To what extent do various student populations perceive the use of video closed captions
as potentially valuable to their learning?
Recruitment Institutions who were asked to assist in recruitment for the student survey were contacted from the following recruitment pools: (1) a recruitment list of institutions that are members of AAC&U, APLU, EDUCAUSE, AHEAD, and WCET was compiled using publically available information and (2) institutions who heard about the study via Twitter messages and/or word of mouth from colleagues in the first recruitment pool and (3) institutions who heard about the study via general word of mouth messaging from the vendor or PI using email language from the recruitment messages from the first pool.
The institutional representatives (provosts, student affairs representatives, and/or directors of disability services offices) received an email announcing the study and asking that person to (1) “opt-in” via a survey asking for additional contact information or (2) attend a webinar to learn more about participating.
A series of repeated webinars (all with the same content) describing the study were held. At these webinars, institutional representatives learned about the sponsors of the study, the purpose of the study, and what was involved in participating in the study.
For institutions that chose to participate in the study, either via the opt-in survey or after completing a webinar, recruitment materials for the student survey were shared for those institutions to distribute on behalf of the PI and 3Play Media.
Reminder emails were sent to institutions taking part in the study at regular intervals until the data collection period ended. Respondents A total of 15 institutions agreed to assist with recruitment of student survey participants. From those 15 institutions, 2,839 students responded. After data cleaning procedures were

30
complete, a total of 2,124 student participant responses were included in the analysis.
Participants who were under the age of 18 were excluded from the study.
Participant Demographics Participants for this study came from schools that were 80% public colleges and universities, with 20% coming from private institutions. Of all of the respondents, 80% came from 4-year colleges and universities and 20% from 2-year schools.
School Respondents Institutional Profile A 1 Private 4-year, nonprofit, Northeast B 8 Public 2-year, nonprofit, Midwest C 32 Public 4-year, nonprofit, Southeast D 4 Public 4-year, nonprofit, Southeast E 32 Public 2-year, nonprofit, Southwest F 7 Public 4-year, nonprofit, Midwest G 64 Public 2-year, nonprofit, Midwest H 24 Private 4-year, nonprofit, Southwest I 60 Public 4-year, nonprofit, Midwest J 4 Public 4-year, nonprofit, Midwest K 1130 Public, 4-year, nonprofit, West L 300 Public 4-year, nonprofit, West M 100 Private 4-year, nonprofit, Northeast N 123 Public 4-year, nonprofit, West O 235 Public 4-year, nonprofit, West
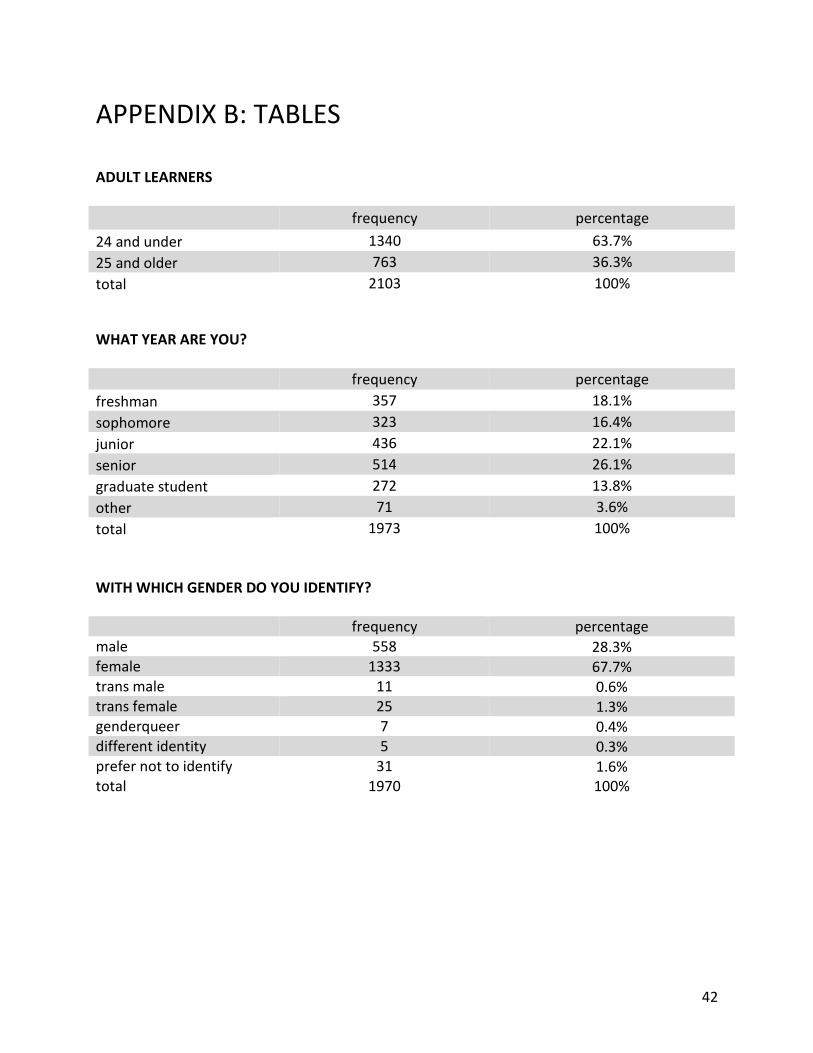
The majority of students who responded to the survey were juniors (22.1%) and seniors (26.1%). Almost two-thirds (63.7%) of respondents were 24-years old or younger. The majority of respondents identify as white (76.2%) with the next highest racial category being two or more races (10.3%).
A little over one in ten (11.3%) of respondents identified as having English as a second language and 28.3% of respondents self-identified as first-generation college students. Although many respondents did not know their Pell-eligibility status (28.1%), 39% of respondents self-identified as Pell-eligible.
The majority of respondents noted that they “always,” “often,” or “sometimes” struggle with maintaining attention in class (a combined 77.3%) with 8.6% choosing “always” and 21.6% choosing “often.” Of all the respondents, 19.1% noted having difficulty with hearing and 37.2% noting having difficulty with vision. Approximately one in ten (10.8%) noting having difficulty understanding visual representations such as graphs and charts. Almost one in ten (9.5%) of respondents had been diagnosed with a learning disability and 10.7% noted that they have

31
some form of disability other than, or in addition to, a learning disability. These percentages were in alignment with the 13.1% of respondents who had registered with an Office of Disability Services and the 11.4% of respondents who require academic accommodations.
An important note
Many institutions only think about closed captions in relation to student accommodation; thus, even though we repeatedly stated that we were interested in learning how ALL students use captions, some institutions only sent out the survey to the students who were receiving captions for accommodation. This explains some of the small response rates for certain institutions that assisted with study recruitment.
Statistical Analyses
For the statistical analysis a few methods were used. To describe the data, descriptive statistics including frequency, means, standard deviations and medians were run on all questions. These descriptives examined the whole sample and then examined each response question by the demographic questions captured in the survey. Inferential models were also run, which incorporated the use of t-tests, ANOVAs, generalized linear models, and effect sizes. All respondents were included in all analyses except for those that involved the use of transcripts. For analysis of questions about transcripts respondents who indicated that the resource was not made available to them were excluded from this analysis. Qualitative Coding Methods
Before the start of this project a small pilot study was run to test out the instrumentation with approximately 700 Oregon State University Ecampus students. During this pilot the head researcher developed a series of codes to describe the themes in the qualitative data. For the qualitative data in this study, a second person was given the codes developed during the pilot to complete a first round of coding for the qualitative data. When appropriate, qualitative comments were coded into more than one theme. For certain questions, the second coder then coded sub-themes that were also developed during the pilot study (for example, with the large amount of responses regarding closed captions and transcripts as a learning aid).
To check for reliability of the coding themes the head researcher then coded a random sample of 10% of the data. A Cohen’s Kappa was used to check for the level agreement between the head researcher and the second coder and it was found that there was a high level agreement (κ=0.890, p=.000).

32
APPENDIX A: SURVEY Survey on Student Perceptions and Uses of Closed Captions and Transcripts
Explanation of Research Study
[Institution Name] is partnering with Oregon State University and 3Play Media to collect data for a research project that explores how students use closed captions and whether students perceive closed captions as helpful to their learning. This study has been approved by Oregon State University’s IRB. Your decision to take part or not take part in this study will not affect your grades, your relationship with your professors, or your standing at [Institutional Name].
If you choose to participate, you will be asked to complete a survey that should take approximately 20 minutes.
You will have the option at the end of the survey to provide your email if you would like to be entered into a raffle for one of fifty $25 Amazon gift cards.
Your participation in this survey is completely voluntary and your answers will be reported only in the aggregate. You may choose to leave the survey at any time. Responses from this survey will be shared with your institution, but only in aggregate form and with any identifiable information removed.
Because this study involves web-based research, there is a possibility of a breach of confidentiality. The research team has attempted to minimize risk to the study participants. All records and data collected as part of this study will be kept in a confidential environment.
There are no anticipated benefits that you will experience from the study.
If you have questions about this research, you can contact Dr. Katie Linder, Research Director for Extended Campus at Oregon State University ([email protected]).
Thank you for taking the time to respond to our Survey on Student Perceptions and Uses of Closed Captions and Transcripts.
Dr. Katie Linder Research Director, Ecampus Oregon State University

33
I consent to taking part in this study. Yes (1) No (2) If No Is Selected, Then Skip To End of Survey
Enter today's date:
Are you 18 years old or over? Yes (1) No (2) If No Is Selected, Then Skip To Q5
You are ineligible to be a participant in this study. If You are ineligible to be a ... Is Displayed, Then Skip To End of Survey
How do you take courses at your university/college? Only face-to-face (1) Primarily face-to-face with occasional online (4) Equally face-to-face and online (3) Primarily online with occasional face-to-face (2) Only online (5)
The following questions are about videos, which include recorded lectures, lessons, or other video materials. These videos might be made by your professors or they might be videos your professor includes in your course that are created by other people.
Of the face-to-face and/or online courses that you have taken at your university/college, have any of them included videos? Yes (1) No (5) If No Is Selected, Then Skip What year are you?

34
Of the face-to-face courses that you have taken at your university/college, how many of them have included videos? All (1) Most (2) Many (3) Some (4) Just a few (5) None (6) I'm not sure (7)
Of the online courses that you have taken at your university/college, how many of them have included videos? All (1) Most (2) Many (3) Some (4) Just a few (5) None (6) I'm not sure (7)
How helpful was it for your courses to include videos? My courses did not include videos (6) Not at all (7) Slightly (2) Moderately (3) Very (4) Extremely (5)
Closed captions are blocks of text usually shown at the bottom of a video that mirror the spoken audio. Closed captions can be turned on or off. The following items ask about your use of closed captions with videos.
When you watch a video, do you know how to tell if the video has closed captioning as a feature? Yes (1) Sometimes (2) No (5)

35
When you watch a video, do you know how to turn on the closed captioning feature? Yes (1) Sometimes (2) No (3)
Of the videos that were included in your courses, approximately how many of them gave you the option to see closed captions? All (1) Most (2) Many (3) Some (4) Just a few (5) None (6) I am unsure (7)
Of the videos that you knew had closed captions, how often did you use them? Never (1) Seldom (2) Sometimes (3) Often (4) Always (5) If Never Is Selected, Then Skip A transcript is a document…
Why do you use closed captions? Check all that apply. English is my second language (1) I have difficulty with hearing (2) I watch videos in sound sensitive environments (e.g. a library) (3) Helps me focus (4) Helps me with difficult vocabulary (5) Helps overcome poor audio quality (6) My professor has an accent (7) Helps me retain the information (8) Other (please describe) (9) ____________________

36
How helpful were the closed captions? Not at all (1) Slightly (2) Moderately (3) Very (4) Extremely (5) If Not at all Is Selected, Then Skip To How much of a hindrance were the clos...
Please describe why the closed captions were helpful.
How much of a hindrance were the closed captions? Not at all (1) Slightly (2) Moderately (3) Very (4) Extremely (5) If Not at all Is Selected, Then Skip To In general, describe your experiences...
Please explain why the closed captions were a hindrance.
In general, describe your experiences with closed captioning in an academic setting:
A transcript is a document that represents the entire spoken audio of a video. A transcript is a separate document that can be read or printed. The following items ask about your use of transcripts with videos.
Of the video lessons that were included in your courses, approximately how many of them gave you the option to read or print a transcript of the video? All (1) Most (2) Many (3) Some (4) Just a few (5) None (6) I am unsure (7)

37
Of the videos that you knew included the option to read or print a transcript of the video, how often did you use it? Never (1) Seldom (2) Sometimes (3) Often (4) Always (5)
Why do you use transcripts? Check all that apply. English is my second language (1) I have difficulty with hearing (2) I watch videos in sound sensitive environments (e.g. the library) (3) Helps me focus (4) I use transcripts as study guides (5) Helps with difficult vocabulary (6) Helps overcome poor audio quality (7) My professor has an accent (8) Helps me retain the information (9) Helps me find what I'm looking for (10) Other (please describe) (11) ____________________
How helpful were the transcripts? Not at all (1) Slightly (2) Moderately (3) Very (4) Extremely (5) If Not at all Is Selected, Then Skip To How much of a hindrance were the tran...
Please describe why the transcripts were helpful.
How much of a hindrance were the transcripts? Not at all (1) Slightly (2) Moderately (3) Very (4) Extremely (5) If Not at all Is Selected, Then Skip To Are you more likely…

38
Please explain why the transcripts were a hindrance.
Are you more likely to watch a video if you know it has closed captions or a transcript? Yes (1) No (2)
What year are you? Freshman (1) Sophomore (2) Junior (3) Senior (4) Graduate Student (5) Other (6)
What is your major?
If you are a double major, what is your second major?
With which gender do you identify? Male (1) Female (2) Trans male/Trans man (5) Trans female/Trans woman (6) Genderqueer/Gender non-conforming (7) Different Identity (please state) (3) ____________________ Prefer not to identify (4)
When is your birthday? (mm/dd/yyyy)
With which race do you identify? American Indian or Alaska Native (1) Asian (2) Black or African American (3) Native Hawaiian or Other Pacific Islander (4) White (5) Two or More Races (6)

39
Do you identify as Hispanic? Hispanic (1) Non-Hispanic (2)
What is your overall GPA?
Is English your first language? Yes (1) No (2)
What was the highest school completed by your mother or parent 1? Middle school/Jr. high (1) High school (2) College or beyond (3) Other (4) Unknown (5)
What was the highest school completed by your father or parent 2? Middle school/Jr. high (1) High school (2) College or beyond (3) Other (4) Unknown (5)
Are you eligible for or have you received a Pell grant? Yes (1) No (2) I don't know (3)
Do your ever struggle with focusing or maintaining attention in class? Always (1) Often (2) Sometimes (3) Seldom (4) Never (5)
Do you have difficulty with hearing? Yes (1) No (2)

40
Do you have difficulty with vision? Yes (1) No (2)
Do you have difficulty with understanding visual representations of content (such as graphs or charts)? Yes (1) No (2)
Were you ever diagnosed as having a learning disability? Yes (1) No (2)
Do you have any other disabilities? Yes (1) No (2) If No Is Selected, Then Skip To Are you registered with Student Disab...
What other disabilities do you have? (check all that apply) Chronic Medical (1) Sensory Disability (2) Physical Disability (3) Mental Health Disability (4) Learning Disability (5) Development Disability (6) Other (7) ____________________
Are you registered with an Office of Disability Services at your institution? Yes (1) No (2) I am unsure (3)
Do you require academic accommodations? Yes (1) No (2)

41
Thank you for participating in this survey. If you would like to be entered into a raffle to receive one of fifty $25 Amazon gift cards, please click on or copy the following link into your browser to be taken to a separate survey: [link] If you have questions about this research, you can contact Dr. Katie Linder, Research Director for Extended Campus at Oregon State University, at [email protected].
42
APPENDIX B: TABLES
ADULT LEARNERS
frequency percentage 24 and under 1340 63.7% 25 and older 763 36.3% total 2103 100%
WHAT YEAR ARE YOU?
frequency percentage
freshman 357 18.1% sophomore 323 16.4% junior 436 22.1% senior 514 26.1% graduate student 272 13.8% other 71 3.6% total 1973 100%
WITH WHICH GENDER DO YOU IDENTIFY?
frequency percentage male 558 28.3% female 1333 67.7% trans male 11 0.6% trans female 25 1.3% genderqueer 7 0.4% different identity 5 0.3% prefer not to identify 31 1.6% total 1970 100%

43
WITH WHICH RACE DO YOU IDENTIFY?
frequency percentage
American Indian or Alaskan Native 28 1.5%
Asian 152 8.0% Black or African American 55 2.9% Native Hawaiian or other Pacific Islander 21 1.1%
White 1451 76.2% Two or more races 197 10.3% total 1904 100%
DO YOU IDENTIFY AS HISPANIC?
frequency percentage
Hispanic 238 12.8% Non-Hispanic 1628 87.2% total 1866 100%
IS ENGLISH YOUR FIRST LANGUAGE?
frequency percentage
yes 1742 88.7% no 222 11.3% total 1964 100% WHAT WAS THE HIGHEST SCHOOL COMPLETED BY YOUR MOTHER OR PARENT 1? frequency percentage middle school 98 5.0% high school 656 33.4% college or beyond 1124 57.2% other 62 3.2% unknown 26 1.3% total 1966 100%

44
WHAT WAS THE HIGHEST SCHOOL COMPLETED BY YOUR FATHER OR PARENT 2?
frequency percentage
middle school 115 5.9% high school 675 34.4% college or beyond 1037 52.8% other 67 3.4% unknown 70 3.6% Total 1964 100%
ARE YOU ELIGIBLE TO RECEIVE A PELL GRANT?
frequency percentage
yes 765 39.0% no 646 32.9% I don't know 553 28.1% total 1964 100%
DO YOU EVER STRUGGLE WITH FOCUSING OR MAINTAINING ATTENTION IN CLASS?
frequency percentage
always 169 8.6% often 422 21.6% sometimes 922 47.1% seldom 386 19.7% never 59 3.0% total 1958 100%
DO YOU HAVE DIFFICULTY WITH HEARING?
frequency percentage
yes 374 19.1% no 1586 80.9% total 1960 100%

45
DO YOU HAVE DIFFICULTY WITH VISION?
frequency percentage yes 729 37.2% no 1232 62.8% total 1961 100%
DO YOU HAVE DIFFICULTY WITH UNDERSTANDING VISUAL REPRESENTATIONS OF CONTENT (SUCH AS GRAPHS OR CHARTS)?
frequency percentage yes 212 10.8% no 1745 89.2% total 1957 100%
WERE YOU EVER DIAGNOSED AS HAVING A LEARNING DISABILITY?
frequency percentage
yes 187 9.5% no 1774 90.5% total 1961 100%
DO YOU HAVE ANY OTHER DISABILITIES?
frequency percentage
yes 210 10.7% no 1746 89.3% total 1956 100%

46
ARE YOU REGISTERED WITH AN OFFICE OF DISABILITY SERVICES AT YOUR INSTITUTION?
frequency percentage
yes 256 13.1% no 1657 84.7% not sure 44 2.2% total 1957 100%
DO YOU REQUIRE ACADEMIC ACCOMMODATIONS?
frequency percentage
yes 223 11.4% no 1730 88.6% total 1953 100%
HOW DO YOU TAKE COURSES AT YOUR COLLEGE OR UNIVERSITY?
frequency percentage
face-to-face 748 35.2% primarily face-to-face with occasional online 77 3.6%
equally face-to-face and online 109 5.1%
primarily online with occasional face-to-face 1102 51.9%
only online 88 4.1% total 2124 100%
HAVE ANY OF YOUR COURSES INCLUDED VIDEOS?
frequency percentage
yes 2116 99.7% no 7 0.3% total 2123 100%
47
FACE-TO-FACE COURSES WITH VIDEOS
frequency percentage all 121 5.7% most 453 21.4% many 377 17.8% some 502 23.7% just a few 566 26.8% none 52 2.5% I am not sure 44 2.1% total 2115 100%
ONLINE COURSES WITH VIDEOS
frequency percentage
all 452 21.8% most 390 18.8% many 167 8.1% some 218 10.5% just a few 185 8.9% none 348 16.8% I am not sure 309 14.9% total 2069 100%
HOW HELPFUL WAS IT FOR YOUR COURSE TO INCLUDE VIDEOS?
frequency percentage
slightly 354 16.7% moderately 736 34.7% very 679 32.0% extremely 300 14.2% my courses did not include videos 5 0.2%
not at all 45 2.1% total 2119 100%
48
DO YOU KNOW HOW TO TELL IF A VIDEO HAS CLOSED CAPTIONING AS A FEATURE?
frequency percentage
yes 1174 55.9% sometimes 617 29.4% no 308 14.7% total 2099 100%
DO YOU KNOW HOW TO TURN ON CLOSED CAPTIONING?
frequency percentage
yes 1251 59.6% sometimes 536 25.5% no 312 14.9% total 2099 100%
APPROXIMATELY HOW MANY VIDEOS IN YOUR COURSES HAD CLOSED CAPTIONING AS AN OPTION?
frequency percentage
all 125 6.0% most 269 12.8% many 209 10.0% some 370 17.7% just a few 318 15.2% none 240 11.5% I am not sure 565 27.0% total 2096 100%

49
HOW OFTEN DID YOU USE CLOSED CAPTIONS WHEN THEY WERE AVAILABLE?
frequency percentage
never 541 26.0% seldom 418 20.1% sometimes 394 19.0% often 356 17.1% always 370 17.8% total 2079 100%
HOW HELPFUL WERE THE CLOSED CAPTIONS?
frequency percentage
not at all 21 1.4% slightly 161 10.5% moderately 445 29.0% very 548 35.7% extremely 359 23.4% total 1534 100%
APPROXIMATELY HOW MANY VIDEOS IN YOUR COURSES HAD TRANSCRIPTS AS AN OPTION?
frequency percentage
all 62 3.1% most 82 4.1% many 81 4.0% some 193 9.6% just a few 364 18.0% none 864 42.8% I am not sure 371 18.4% total 2017 100%

50
HOW OFTEN DID YOU USE TRANSCRIPTS WHEN THEY WERE AVAILABLE?
frequency percentage
never 1087 55.5% seldom 248 12.7% sometimes 258 13.2% often 171 8.7%
always 196 10.0% total 1960 100%
HOW HELPFUL WERE THE TRANSCRIPTS?
frequency percentage
not at all 581 31.1% slightly 343 18.4% moderately 419 22.5% very 318 17.0% extremely 205 11.0% total 1866 100%

51
About the Research Unit at Oregon State Ecampus Vision To support Oregon State University’s mission and vision by conducting world-class research on online education that develops knowledge, serves our students and contributes to the economic, social, cultural and environmental progress of Oregonians, as well as national and international communities of teachers and learners. Mission The Ecampus Research Unit (ECRU) makes research actionable through the creation of evidence-based resources related to effective online teaching, learning and program administration toward the fulfillment of the goals of Oregon State’s mission.
Specifically, the research unit conducts original research, creates and validates instruments, supports full-cycle assessment loops for internal programs, and provides resources to encourage faculty research and external grant applications related to online teaching and learning. Research priorities With nationally ranked online programs delivered by Oregon State Ecampus, the Ecampus Research Unit contributes to the field of online teaching and learning research in the following four areas:
• Access • Quality • Administrative Excellence • Adult Learners
The ECRU prioritizes research that crosses multiple of these areas.
Contact
Website: ecampus.oregonstate.edu/research Email: [email protected] Twitter: @ecresearchunit

52
About 3Play Media
3Play Media provides closed captioning, transcription, and subtitling services to more than 2,000 customers. What sets 3Play Media apart is their premium quality, fast turnaround, and tools that save time and cut costs. 3Play Media is directly integrated with most video platforms—making the process of captioning as simple as pushing a button. 3Play Media also provides interactive transcripts that make videos searchable and more engaging.
Having produced captions and transcripts for more than a million videos, they have developed deep expertise in transcribing all academic areas. 3Play Media has also developed numerous technologies with 8 patents (granted and pending) to optimize every aspect of the captioning and transcription process.
Learn more about 3Play Media at www.3playmedia.com/solutions/education/
Contact
Website: www.3playmedia.com Email: [email protected] Twitter: @3playmedia