Student Success Scorecard 2018 Fact Book overview...Student Success Scorecard 2018 & Fact Book...
24
Student Success Scorecard 2018 & Fact Book overview Dr. Kristi Blackburn, Dean of Institutional Effectiveness, Research and Planning Presented to the Cerritos College Board of Trustees Sept. 19, 2018
Transcript of Student Success Scorecard 2018 Fact Book overview...Student Success Scorecard 2018 & Fact Book...
Student Success Scorecard 2018
&Fact Bookoverview
Dr. Kristi Blackburn, Dean of Institutional Effectiveness, Research and PlanningPresented to the Cerritos College Board of Trustees
Sept. 19, 2018
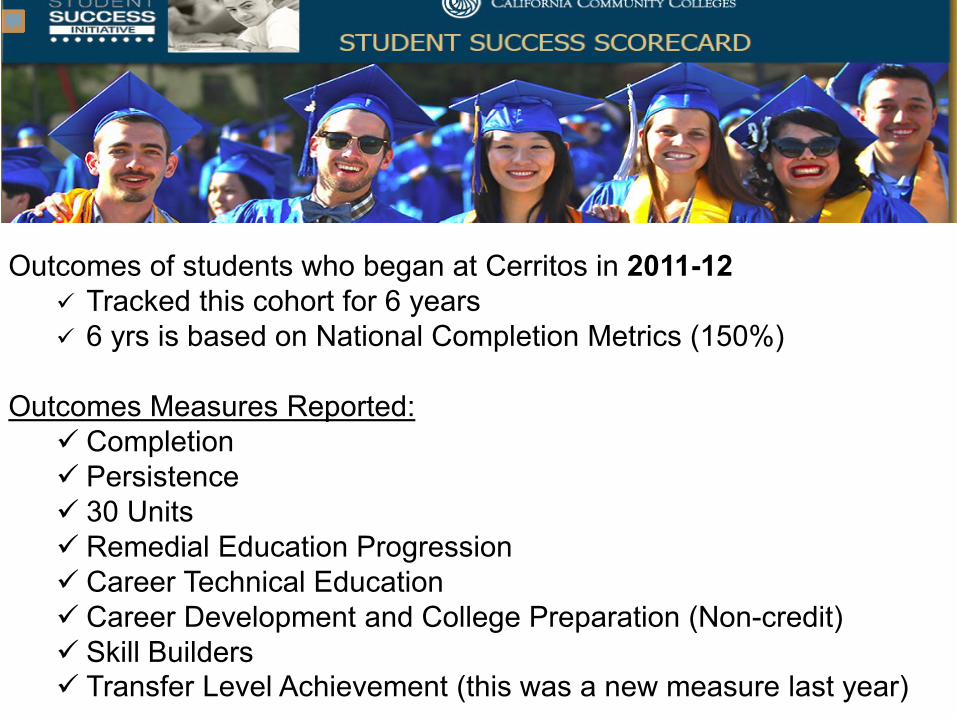
Outcomes of students who began at Cerritos in 2011-12 Tracked this cohort for 6 years 6 yrs is based on National Completion Metrics (150%)
Outcomes Measures Reported: Completion Persistence 30 Units Remedial Education Progression Career Technical Education Career Development and College Preparation (Non-credit) Skill Builders Transfer Level Achievement (this was a new measure last year)
Presenter
Presentation Notes
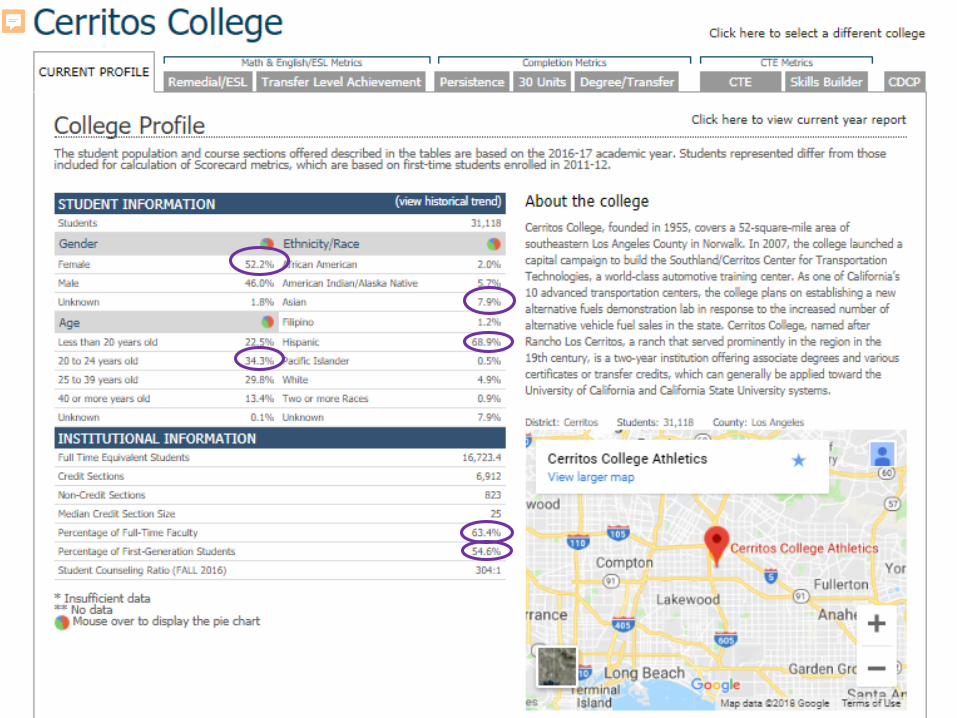
About the Scorecard: Requires that students included in the measurement have social security numbers; some of our students are AB 540, which means they do not have ssn. The state chancellor’s office estimates that it is about 11.7% of students overall system-wide. This is a decision made at the state level. Cerritos College students rate of missing SSNs was 3.5%
Presenter
Presentation Notes
We match very closely for gender: females at Cerritos 52.2%, State 53.6%; males at Cerritos 46%, state 45.2% We are slightly different than the state age profile, with Cerritos having more 20-24 year olds 34.3% compared to state 30.9%. We are closer to the state this year for students 40 or older having 13.4% compared to state 15.4%. Regarding ethnicity, we are different from the state in 3 areas: Cerritos has fewer Asian students at 7.9% compared to state 11.5%; Cerritos has more Hispanic students 68.9% compared to state 43.6%; and Cerritos has fewer White students 4.9% than compared to state 26.4%. We are higher than the state average regarding FT Faculty at 63.4%; state 56.4% We are above the state average of first generation students at 54.8% compared to state 43%
COMPLETION (DEGREE/TRANSFER)SPAR: Student Progress and Attainment Rate
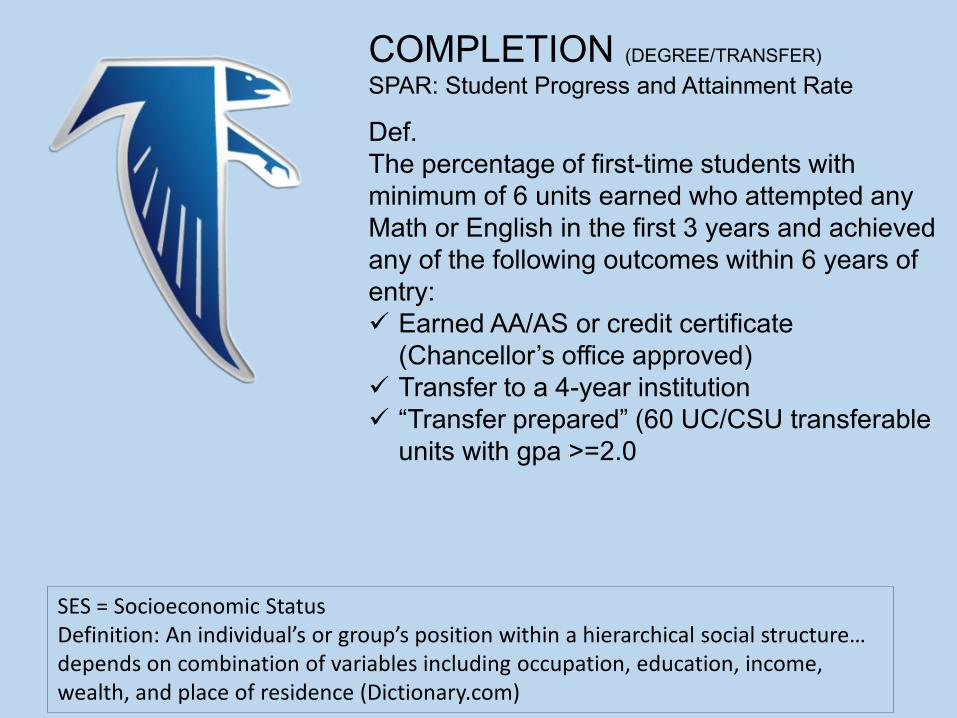
Def.The percentage of first-time students with minimum of 6 units earned who attempted any Math or English in the first 3 years and achieved any of the following outcomes within 6 years of entry: Earned AA/AS or credit certificate
(Chancellor’s office approved) Transfer to a 4-year institution “Transfer prepared” (60 UC/CSU transferable
units with gpa >=2.0
SES = Socioeconomic StatusDefinition: An individual’s or group’s position within a hierarchical social structure… depends on combination of variables including occupation, education, income, wealth, and place of residence (Dictionary.com)
Presenter
Presentation Notes
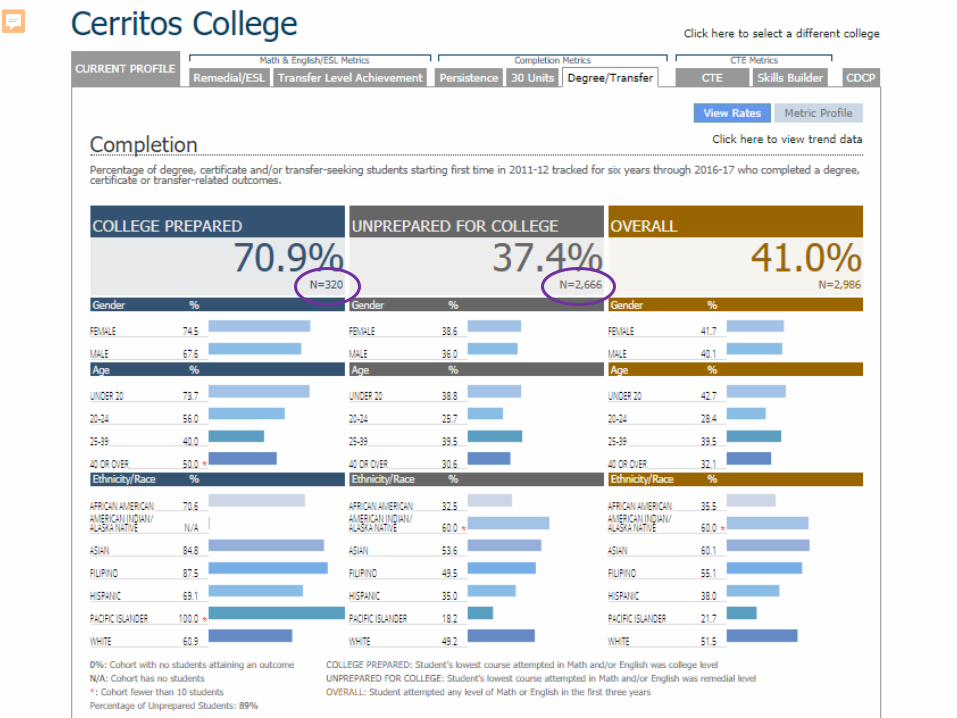
Compared to state averages, we are slightly above for college prepared students at 70.9%, compared to the state at 70.4% Regarding our Unprepared students, 37.4% we are also very close to the state average of 41%. Overall students (both combined): Cerritos is 41% compared to 48.2% state overall. Circles: Because of the large number of unprepared students at Cerritos College, we experience a drag effect in the overall completion metric. At the state level, the overall Completion metric is 48.2% based on N= 188,597.
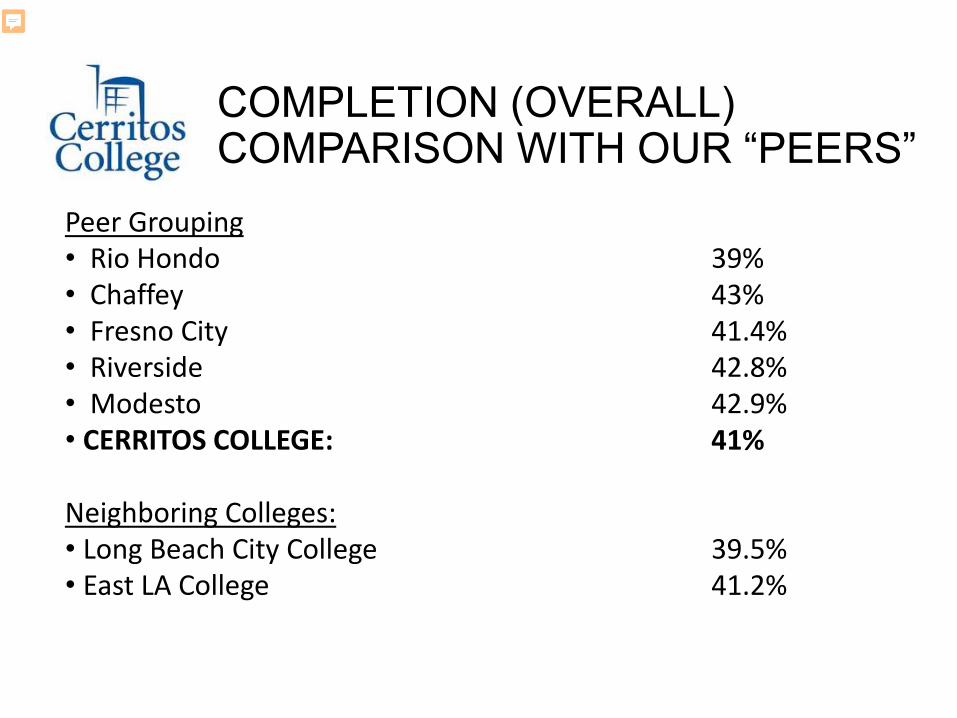
COMPLETION (OVERALL)COMPARISON WITH OUR “PEERS”
Peer Grouping• Rio Hondo 39%• Chaffey 43%• Fresno City 41.4%• Riverside 42.8%• Modesto 42.9%• CERRITOS COLLEGE: 41%
Neighboring Colleges:• Long Beach City College 39.5%• East LA College 41.2%
Presenter
Presentation Notes
The peer grouping changed again with this iteration of the Scorecard; Historically we had been peer grouped with LBCC, East LA, and LA Trade Tech but the state changed its methodology for Peer Groups with the 2016 scorecard. Peer Group this year established through CCCCO using Cluster analysis/Regression (“hierarchical”): 3 factors– API score of high schools in service area, most recent score as this is no longer being collected; Bachelor+= attainment of Bachelor degree by those of age 25+; Students attending the college that are 25+ years/negatively associated with SPAR. Bachelor+ was used as proxy for SES.

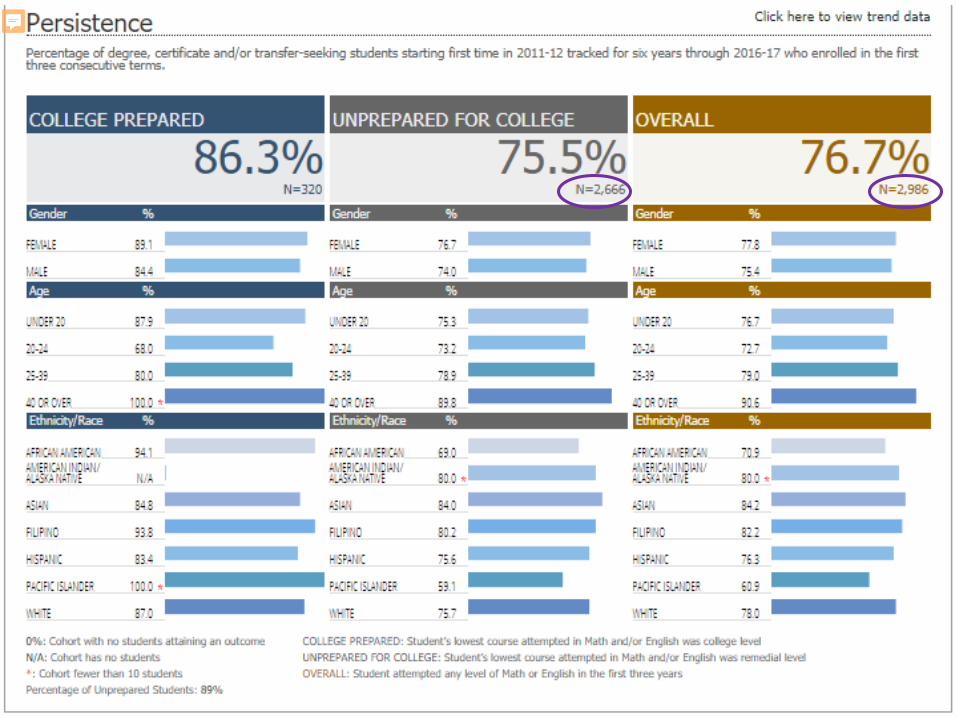
PERSISTENCEDef.The percentage of first time students with a minimum of 6 units earned who attempted any Math or English in the first 3 years and achieved the following measure of progress or momentum point: Enroll in the first 3 consecutive
primary semester terms (or four quarter terms) anywhere in the CCC system
Presenter
Presentation Notes
We are above, state levels on Persistence metrics. We are above College Prepared persistence at 86.3%, above the state at 79.4%. Of the Cerritos College cohort, only X% are College Prepared (320 divided by 2,986); statewide 24.25% are college prepared (46,239 divided by 188,597) We nearly identical to the state level for the Unprepared for college metric at 75.5%, state average is 75.6% The overall persistence rate we are above of the state average: Cerritos 76.7% and the state: 76.5% We have seen improvement on this metric.
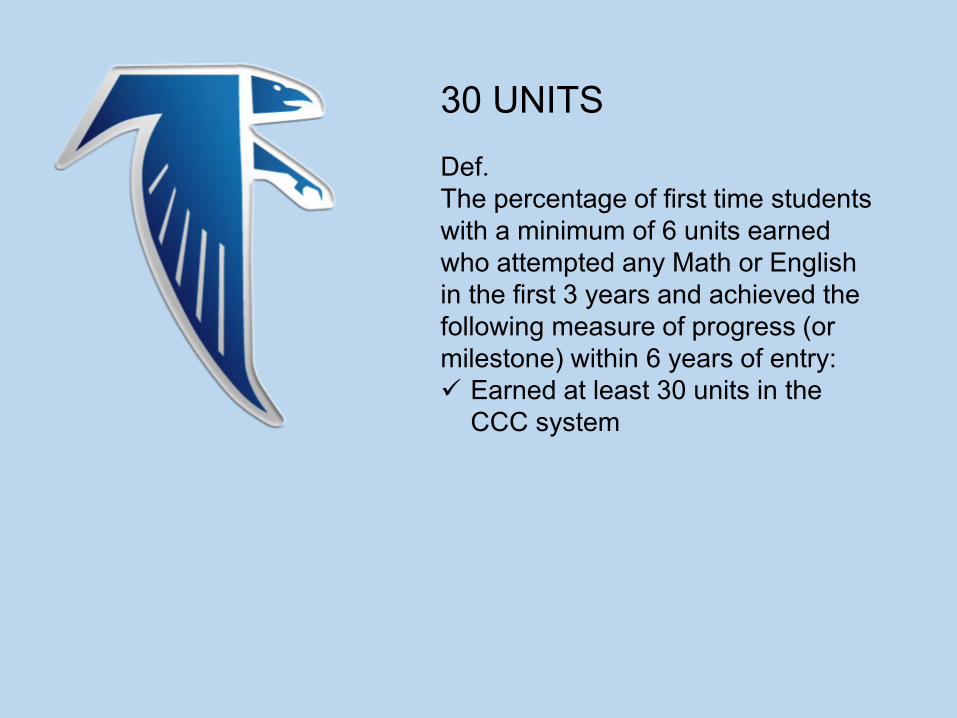
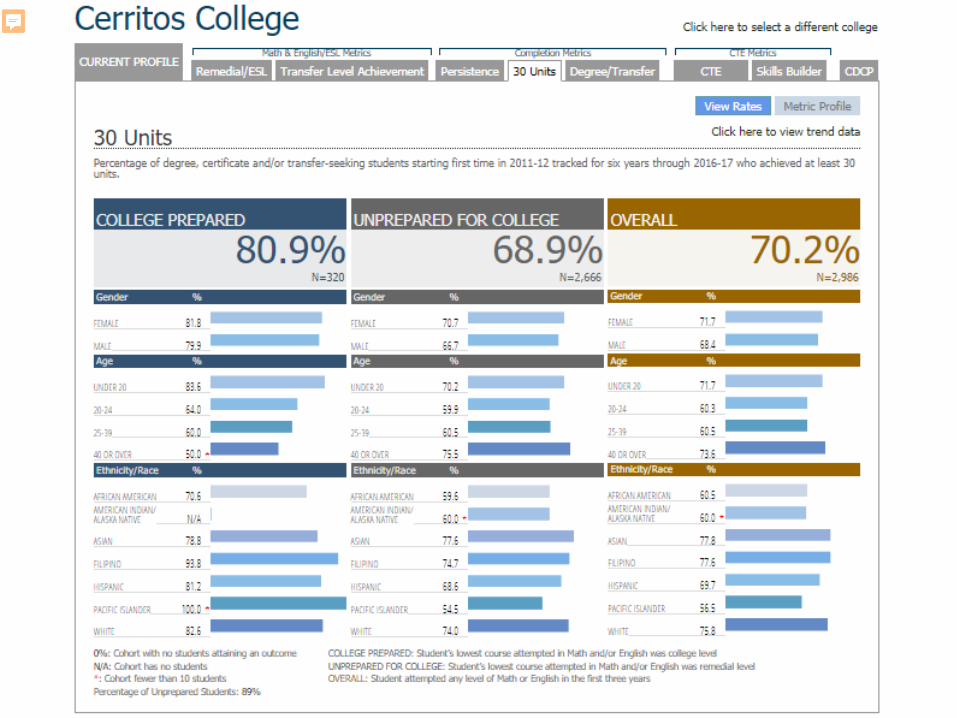
30 UNITSDef.The percentage of first time students with a minimum of 6 units earned who attempted any Math or English in the first 3 years and achieved the following measure of progress (or milestone) within 6 years of entry: Earned at least 30 units in the
CCC system
Presenter
Presentation Notes
Regarding 30 Units: We are ABOVE the state average on our college prepared population with 80.9% compared to state 76.5% We are ABOVE state averages of our Unprepared students at 68.9% whereas the state is 67.4%, OVERALL– ABOVE state average in achieving 30 units at 70.2% and the state being at 69.6%. We have improved on this metric for the second year in a row.
REMEDIALDef.The percentage of credit students who attempted a course designated “at levels below transfer” in:
• MATH and successfully completed a college level course in Math within 6 years
• ENGLISH and successfully completed a college level course in English within 6 years
• ESL and successfully completed a college level ESL course or a college level English course within 6 years
Presenter
Presentation Notes
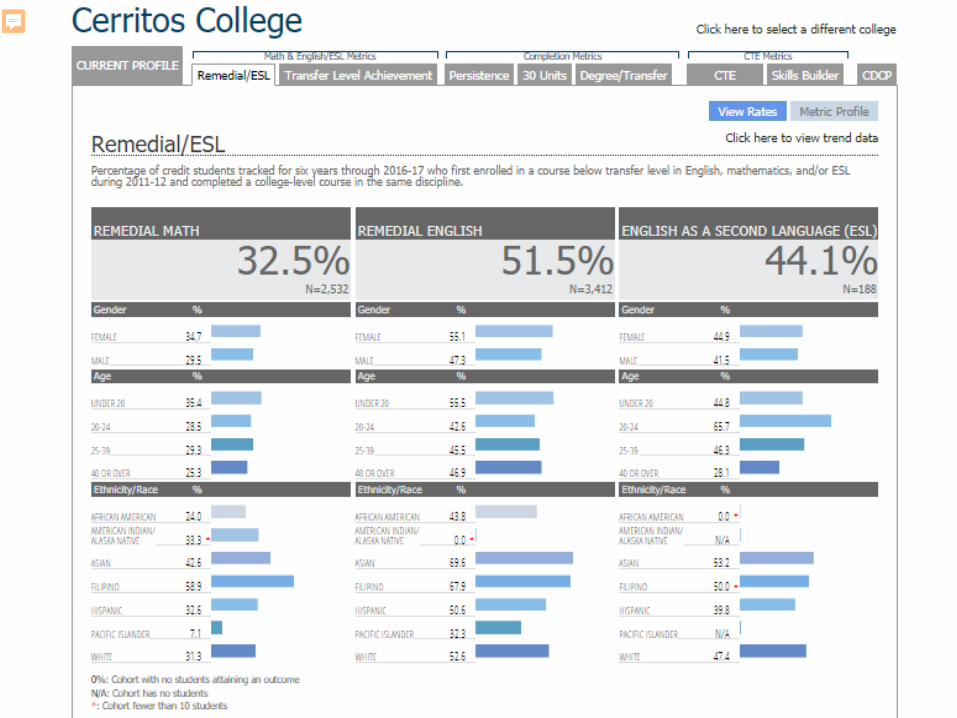
Compared to the state averages, we are below on Math (CC 32.5%, state 36.5%); but ABOVE in English at 52.5% compared to the state average 48.7% and ABOVE in ESL at 44.1% compared to state average of 33.4% Compared to the previous year’s cohort, we also increased on all measures for this metric from last year: 28.5% Math, 51.3% English, 39.1% ESL
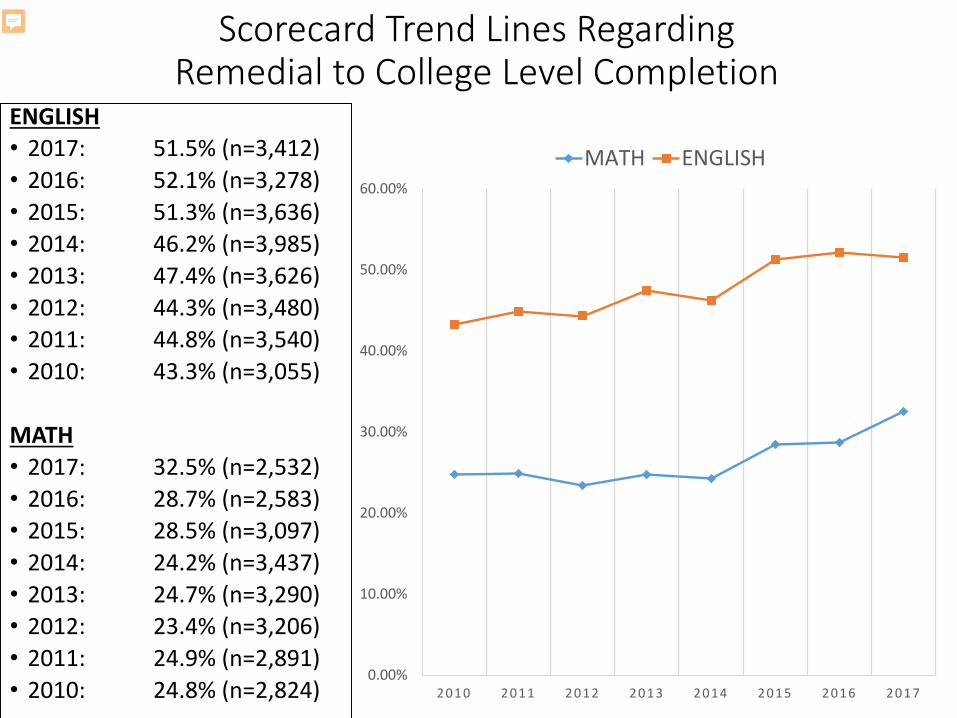
Scorecard Trend Lines Regarding Remedial to College Level Completion
ENGLISH• 2017: 51.5% (n=3,412)• 2016: 52.1% (n=3,278)• 2015: 51.3% (n=3,636)• 2014: 46.2% (n=3,985)• 2013: 47.4% (n=3,626)• 2012: 44.3% (n=3,480)• 2011: 44.8% (n=3,540)• 2010: 43.3% (n=3,055)
MATH• 2017: 32.5% (n=2,532)• 2016: 28.7% (n=2,583)• 2015: 28.5% (n=3,097)• 2014: 24.2% (n=3,437)• 2013: 24.7% (n=3,290)• 2012: 23.4% (n=3,206)• 2011: 24.9% (n=2,891)• 2010: 24.8% (n=2,824)
0.00%
10.00%
20.00%
30.00%
40.00%
50.00%
60.00%
2010 2011 2012 2013 2014 2015 2016 2017
MATH ENGLISH
Presenter
Presentation Notes
Access has increased; and completion of a developmental course+ transfer level course has increased as well over the past eight years
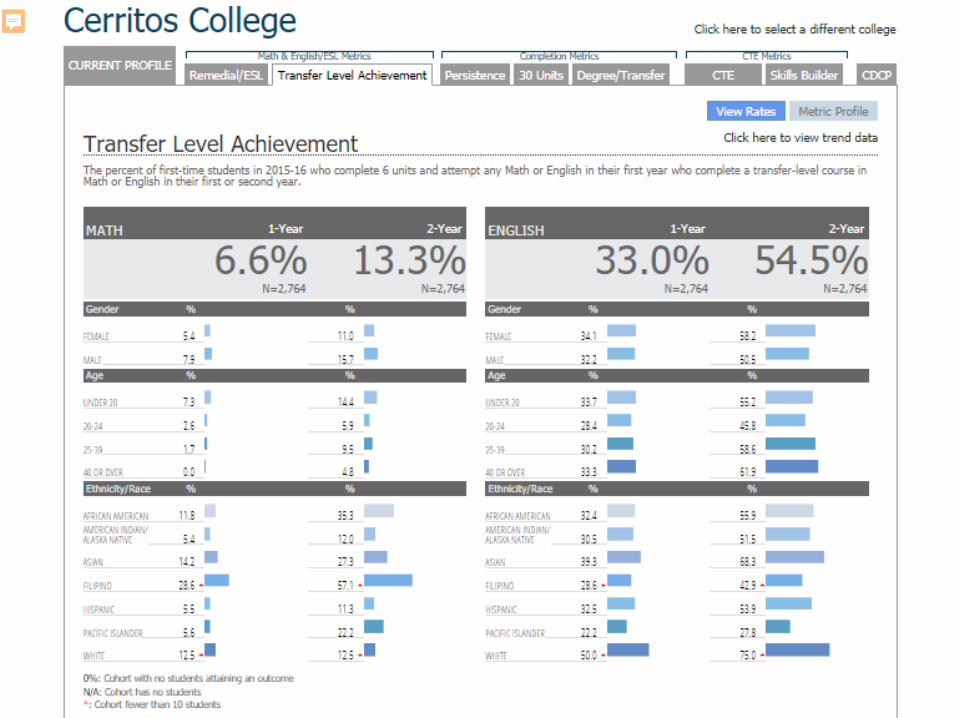
TRANSFER LEVEL ACHIEVEMENT
Def.The percentage of first-time students in 2014-15 who completed 6 units and attempted any Math or English in their first year; who then completed a transfer-level course in Math or English in their second year:
Note the cohort change (above dates) to the time period of 2014-15
This scorecard is reporting on the 2010-11 cohort
Presenter
Presentation Notes
THIS WAS A NEW METRIC LAST YEAR. WE IMPROVED ON ALL 4 METRICS WE ARE BELOW THE STATE ON ALL 4 OF THE METRICS: MATH 1 YEAR: 6.6% COMPARED TO STATE 18.4% MATH 2 YEAR: 13.3% COMPARED TO STATE 30.4% ENGLISH 1 YEAR: 33% COMPARED TO STATE 41.2% ENGLISH 2 YEAR: 54.5% COMPARED TO STATE 59.3% WE WILL BE WORKING ON THE TRANSFER LEVEL ACHIEVEMENT THROUGH MANY DIFFERENT INITIATIVES AT THE COLLEGE: AB 705 aka MMAP (MULTIPLE MEASURES ASSESSMENT PILOT) IS KICKING INTO HIGH GEAR WHICH WILL SHORTEN THE PIPELINE OF MATH/ENGLISH COURSES, LESSENING EXIT POINTS.
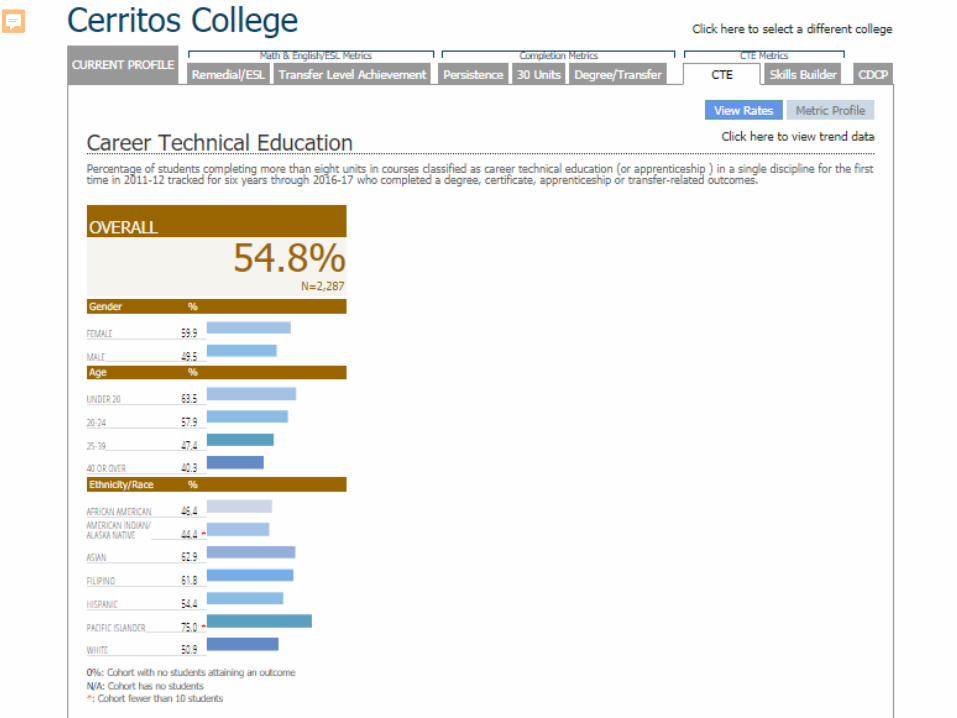
CTEDef. The percentage of students who attempted a CTE course for the first time and completed more than 8 units in 3 subsequent years in a single discipline (2 digit vocational TOP code where at least one of the courses is occupational SAM B or C) and who achieved any of the following outcomes within 6 years of entry: Earned any AA/AS or credit Certificate
(Chancellor’s Office approved) Transfer to 4 year institution Achieved “Transfer Prepared” (successfully
completed 60 UC/CSU transferable units with a gpa>= 2.0
Presenter
Presentation Notes
We are nearly equal to the state average for CTE Completion at 54.8% compared to state 55.1% This is the third year we have improved on this metric
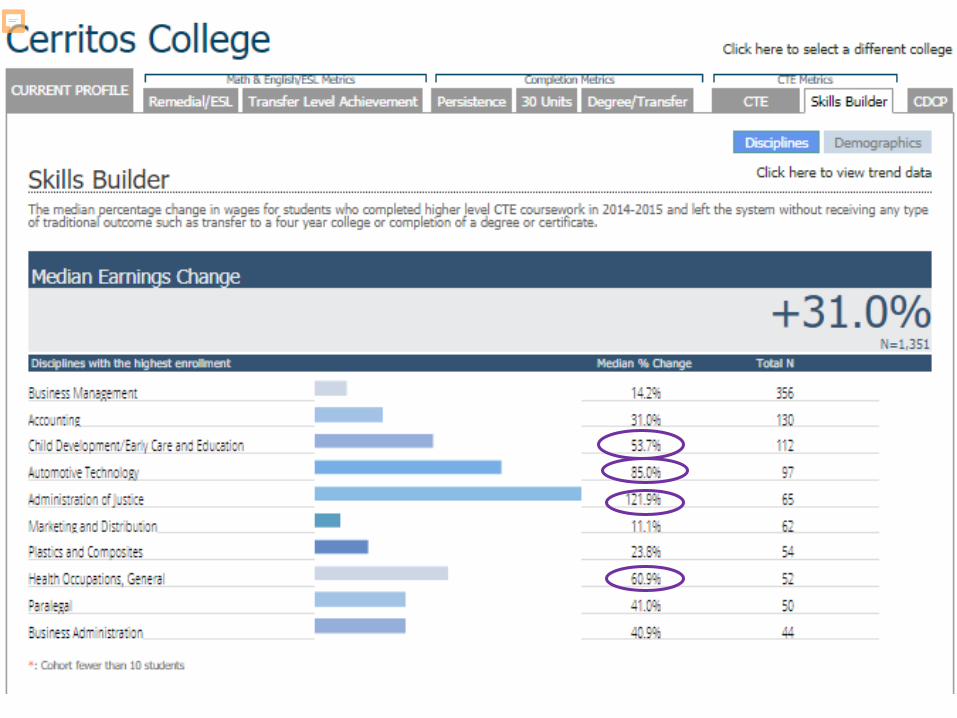
Skill Builders
Def.The median inflation adjusted wages before and after the year of enrollment for students who completed a S.A.M. A, B, or C course of at least (.5 units) and passed all CTE coursework in a given academic year. Students no longer enrolled anywhere in the
system the following academic year; and Did not earn an award or transfer to a 4 year
college the year of enrollment of the following year.
Reported by disciplines with the highest enrollments, and median earnings changes
Presenter
Presentation Notes
Also to be in this metric, students could not fail a CTE course. Most students older and in the workforce. Duplicated Head Count based on TOPS code enrollments Measured median wage% increase 1 year prior, and 1 year post enrollment This is the third year this metric has been reported on
Presenter
Presentation Notes
Disciplines with the highest enrollments median wage gains were by students in Auto Technology and AJ– same for the past 2 years; with Child Development/Early Care and Education, Health Occupations and Paralegal showing some modest gains as well. Cerritos at 31% is above the state average 28.2% The state’s largest median change was in EMD at 40.9%, followed by accounting 32.7%, and general business commerce 30.2% WE HAVE IMPROVED ON THIS METRIC FROM LAST YEAR 15.4% TO 25.2% THIS YEAR!
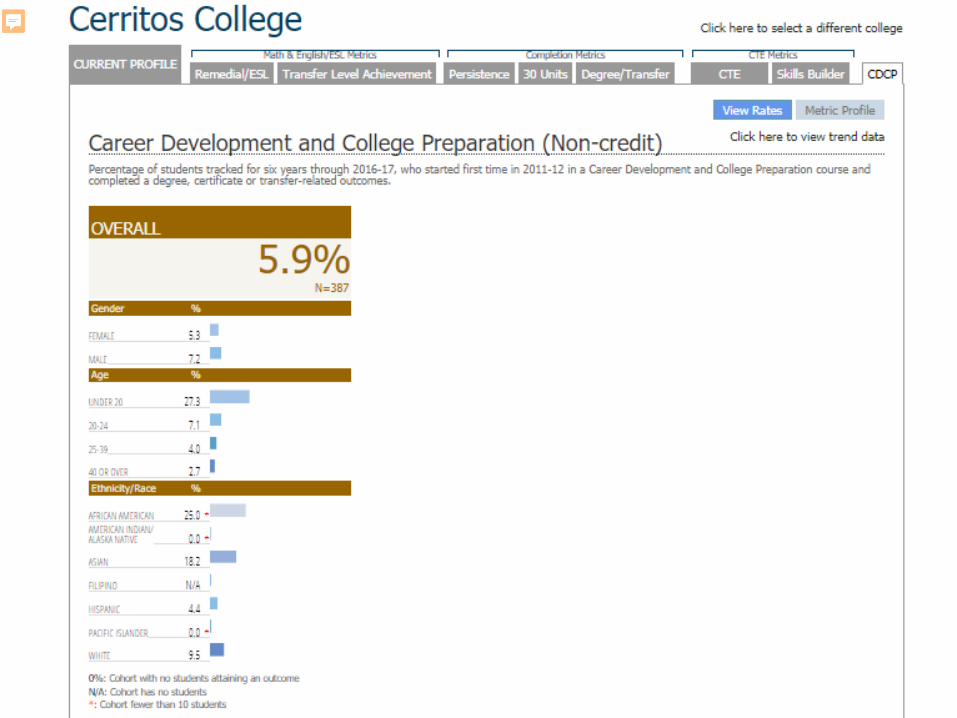
CDCP (non-credit)
Def. Percentage of students tracked for six years who started first time in 2011-12 in a Career Development and College Preparation course and completed a degree, certificate or transfer-related outcomes.
Presenter
Presentation Notes
CDCP courses are non-credit and funded at the credit rate. We are at 5.9%, the state is 16.3%
Looking ahead to next year:
FAREWELL SCORECARD HELLO NEW METRICS!
• In development by CCCCO• Includes some of the same metrics
•Adds a lot of new, particularly in the area of non-credit to credit transition
Question & Answer