Student Research Project - Young Scientist
86
Student Research Project Log Book Year 10, 2015
Transcript of Student Research Project - Young Scientist

Student Research Project Log Book
Year 10, 2015

SRP LOG Expectation of Completion Table
Objective Expected date of completion
If Completed on time? (Y/N)
If not, reason why
Brainstorm ideas for SRP topic and come up with reasonable ideas to discuss with Mrs McGrouther
2/2/15 Y
Finalise SRP topic 3/2/15 N As I slightly changed my topic after talking to ms McGrouther from testing the sound absorption of multiple recyclable materials to testing whether covering a rooms walls with styrofoam cups effects the acoustics and absorbs sound.
Gather information from suitable sources on chosen topic
10/2/15 Y
Background research relating to the topic
10/2/15 Y
Complete Aim 6/2/15 Y
Complete Hypothesis 6/2/15 N As wanted to complete research before completing my hypothesis to have scientific research that could back up my claim.
Identify independent, dependant, and controlled variables
9/2/15 Y
Write equipment list 9/2/15 Y
Construct and Finalise Method
9/2/15 N Had constructed first draft but not yet finalised

Construct explanation on why method is valid for investigating the hypothesis
10/2/15 N Waiting for finalization of method before beginning its analysis.
Construct risk assessment
10/2/15 N Ran out of time but completed next day
Check through current work to ensure that it meets the criteria for the SRP Proposal
11/2/15 Y
Print and Bind Proposal ready for collection
11/2/15 Y
Submit Proposal 12/2/15 Y
Collect (or purchase) equipment for experiment
20/2/15 N Had all equipment but still waiting for the sheets of styrofoam to arrive.
Conduct experiment 25/2/15 N As Waiting for the sheets to arrive
Record results and process into tables, graphs and images
2/3/15 N Process pushed back because of experiment
Complete the discussion of results: (accuracy, reliability and validity)
6/3/15 N “ ”
Complete Conclusion 9/3/15 N “ ”
Construct bibliography
16/3/15 N “ ”
Self evaluation 20/3/15 N “ ”
Ensure SRP meets criteria
23/3/15 N “ ”
Finalise SRP 28/3/15 N “ ”
Print and Bind SRP ready for collection
29/3/15 Y
Work Record Log
Date Time Description
29/1/15 30 minutes Created table explaining the expectation of completion of certain agenda and set up log (i will reword this later because I do not know how to now)
1/2/15 3 hours Researching and reading about different scientific experiment to obtain ideas on what to do as a topic. Then assessed my current top 6 ideas, discussing the negatives and positives of each.
6/2/15 40 minutes Writing research questions and beginning reading on topic, finalizing research topic
7/2/15 5 hours Researching topic, mainly ‘Why is this research relevant?’ and adding sources to log
7/2/15 1 hour Equipment and searching for photo for method
7/2/15 1 hour Research, writing ‘What is sound?’
7/2/15 1 hour Writing ‘What is the difference between sound
blocking and sound absorption?’
7/2/15 1 hour 10 minutes Writing ‘Why am I interested in this topic?’ along with ‘What similar experiments have been previously conducted?’
7/2/15 2 hours Completing all research and writing ‘What is the science behind my Hypothesis?’
8/2/15 30 min Filling out source log
9/2/15 3 hours Writing Variables, method and equipment list.
11/2/15 6 hours Editing method and trialing different method structures, risk assessment, summary of research, explanation of why method is valid, fina equipment list, creating proposal and editing log ready for handing in.
22/2/15 1 hour Correcting SRP based on feedback given by proposal
7/3/15 50 min Create Tables for data that were then printed to be used during experiment.
8/3/15 5 hours Experiment Conducted
16/3/15 2 hours Beginning to slow down videos of oscilloscope and measure the time for sound absorption and then compare results.
20/3/15 4 hours Continued to slow down videos of oscilloscope and time
21/3/15 3 hours Finished slowing down videos and timing

27/3/15 1 hour Measuring sizes of styrofoam pieces to update method.
28/3/15 10 hours Finalising method, variables, risk assessment and equipment also processing data and beginning on Discussion
29/3/5 6 hours Finishing Discussion and conclusion, editing and Finalizing Project
Sources
Date Url Research (extract) Summary
7/2/15 http://greenliving.lovetoknow.com/How_Styrofoam_is_Bad_for_the_Environment
Environmental health concerns start with the elements used to make Styrofoam. Styrene, for example, is the foundational ingredient used to make polystyrene. It is broadly used in the manufacture of plastics, resins, and rubber.
This website gave me a lot of useful information about the negative impacts of styrofoam in our environment.
7/2/15 http://www.epa.gov/reg3wcmd/solidwasterecyclingfacts.htm
Each year American throw away 25,000,000,000 Styrofoam cups. Even 500 years from now, the foam coffee cup you used this morning will be sitting in a landfill.
Gave me this fact which I used.
7/2/15 http://cleanseascoalition.org/index.php?option=com_content&view=article&id=77:thestyrofoamdilemma&catid=34:news&Itemid=58
In the Great Pacific Garbage Patch, for example an area the size of a continent in the North Pacific Ocean there are almost three kilograms of plastic for every halfkilo of plankton, which has a devastating effect on aquatic life that confuse the two.
Gave me a lot of information about the effect that styrofoam cups has on the aquatic environment.
7/2/15 http://www.cleanup.org.au/PDF/au/clean_up_australia_polystrene_factsheet.pdf
Polystyrene foam is generally used once before disposal. Given that there is a high amount of energy embodied in foam products, their single use is particularly wasteful. Life cycle analysis traces the energy used and waste generated from producing, transporting and disposing of polystyrene products.
This Factsheet highlighted a lot of the environmental concerns associated with polystyrene cups.
7/2/15 http://isites.harvard.edu/fs/docs/icb.topic967858.files/PolystyreneFactSheets.pdf
The environmental impacts of polystyrene production in the categories of energy consumption, greenhouse gas effect, and total environmental effect ranks second highest, behind aluminium.
This once again gave me a lot of facts and helped in explaining what polystyrene is.
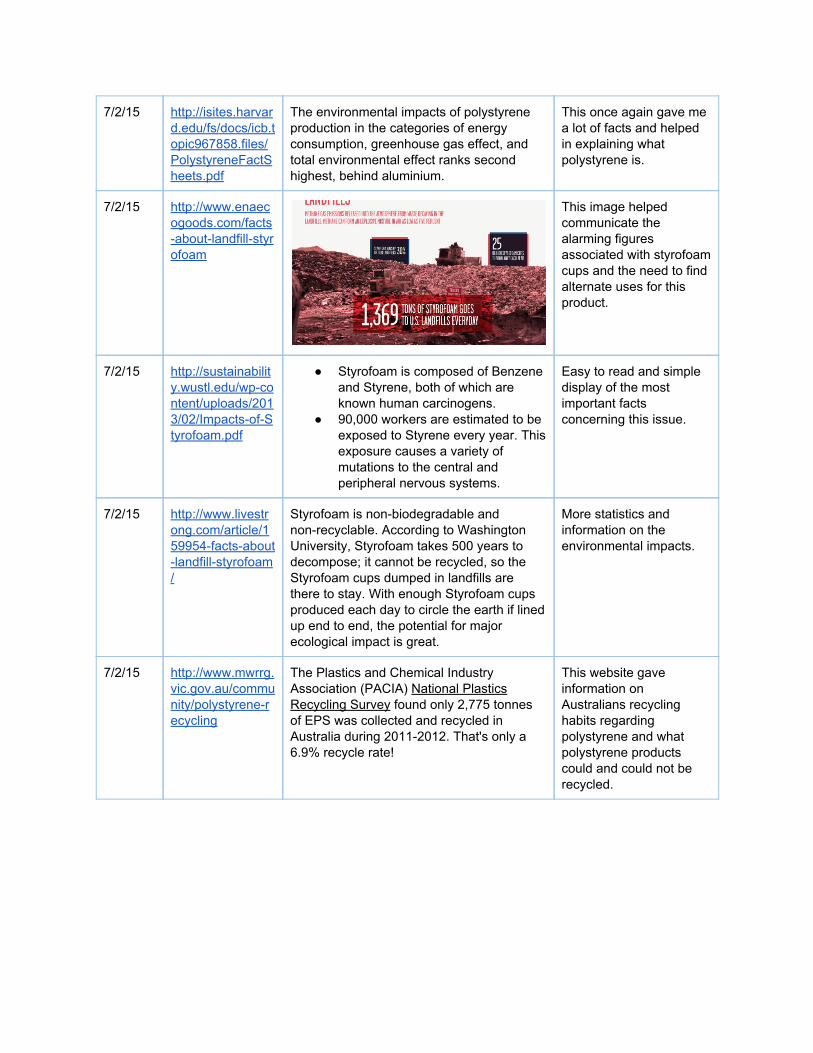
7/2/15 http://www.enaecogoods.com/factsaboutlandfillstyrofoam
This image helped communicate the alarming figures associated with styrofoam cups and the need to find alternate uses for this product.
7/2/15 http://sustainability.wustl.edu/wpcontent/uploads/2013/02/ImpactsofStyrofoam.pdf
Styrofoam is composed of Benzene and Styrene, both of which are known human carcinogens.
90,000 workers are estimated to be exposed to Styrene every year. This exposure causes a variety of mutations to the central and peripheral nervous systems.
Easy to read and simple display of the most important facts concerning this issue.
7/2/15 http://www.livestrong.com/article/159954factsaboutlandfillstyrofoam/
Styrofoam is nonbiodegradable and nonrecyclable. According to Washington University, Styrofoam takes 500 years to decompose; it cannot be recycled, so the Styrofoam cups dumped in landfills are there to stay. With enough Styrofoam cups produced each day to circle the earth if lined up end to end, the potential for major ecological impact is great.
More statistics and information on the environmental impacts.
7/2/15 http://www.mwrrg.vic.gov.au/community/polystyrenerecycling
The Plastics and Chemical Industry Association (PACIA) National Plastics Recycling Survey found only 2,775 tonnes of EPS was collected and recycled in Australia during 20112012. That's only a 6.9% recycle rate!
This website gave information on Australians recycling habits regarding polystyrene and what polystyrene products could and could not be recycled.

7/2/15 http://www.instructables.com/id/CoffeeCupSoundProofing/#step1
This website or more in particular this picture helped me in establishing the way in which the wall will be covered in Styrofoam cups. Also showed told that you need approx. 16 cups per square foot of wall.
7/2/15 http://www.bbc.co.uk/bitesize/ks2/science/physical_processes/sound/read/5/
Sounds are vibrations that can travel through different materials. The pitch of a sound is how high or low the sound is. The loudness of a sound is how loud or soft it is.
I used this website to validate my information for ‘What is sound?’ However the information for this question was obtained from existing knowledge and notes from previous years.
7/2/15 http://www.soundproofingtips.com/soundproofingmaterials/
I used this picture to show the difference between the appearance of sound blocking materials to sound absorbing materials.
7/2/15 http://www.diytrade.com/china/pd/5718743/sound_absorbing_foam.html
I used this picture to show the difference between the appearance of sound blocking materials to sound absorbing materials.
7/2/15 http://www.acousticalsurfaces.com/acoustic_IOI/101_7.htm
Sound absorption is defined, as the incident sound that strikes a material that is not reflected back. An open window is an excellent absorber since the sounds passing through the open window are not reflected back but makes a poor sound barrier. Painted concrete block is a good sound barrier but will reflect about 97% if the incident sound striking it.
I used this website to help me understand the difference between sound blocking and sound absorbing

7/2/15 https://www.youtube.com/watch?v=cncqLyG1GrA
This youtube video was very helpful in understanding the difference between sound absorption and sound blocking. It also gave me diagrams which I used in my SRP
7/2/15 http://www.noisehelp.com/noiseabsorbers.html
Sound blocking is what you want when your goal is to prevent sound from entering or leaving a room or a building. This is what we normally mean when we talk about soundproofing.
This website also helped in explaining the difference between the two ways of controlling sound. This website also gave scenarios of when each type of when each type was used over the other.
7/2/15 http://www.acousticalsurfaces.com/blog/soundproofing/soundproofingvssoundabsorbingthedifferencebetweenblockingandabsorbing/
Products that are designed to block sound from entering or leaving a space are almost always found inside the wall construction. These products are heavy, dense, cumbersome, or designed to decouple the wall so that one side of the wall doesn’t have hard surface contact with the either.
This website explains the difference between sound blocking and absorbing through the analogy of a fish tank. It also outlines the properties of materials that are usually effective in absorbing or blocking sound.
7/2/15 http://en.wikipedia.org/wiki/Foam
An important division of solid foams is into closedcell foams and opencell foams. In a closedcell foam, the gas forms discrete pockets, each completely surrounded by the solid material.
This website effectively explained the difference between open and closed cell foam.
7/2/15 http://ocw.mit.edu/courses/materialsscienceandengineering/3063polymerphysicsspring2007/assignments/polymer_foams.pdf
Closedcell foams are generally more rigid, while opencell foams are usually flexible.
This assignment helped me in determining that styrofoam is a closed cell foam.
7/2/15 http://www.ctsciencefair.org/media/2013Abstracts.pdf
The purpose of this experiment was to find the best soundproofing material. I tested nine different materials commonly used in those two industries.
This website had a large range of previously been done before experiments. I looked for similar experiments to mine for comparison.

7/2/15 http://cusef.byu.edu/abstracts/2012/elementary1
We wondered which common household items would stop sound the best. Using twoinch thick layers of Styrofoam, plywood, a down comforter and cardboard, we created a test to see which materials stopped sound better than others.
This website gave information on a similar experiment where the sound blocking ability of styrofoam was tested
7/2/15 http://www.allsciencefairprojects.com/science_fair_projects/109/949/8d38ac0e409ffe52fc03e65f1ffbe6c9.html#Sound_Stopper
Conclusion: I concluded that the polystyrene board insulation is the best agent for soundproofing of those that I tested. Also, I concluded that the sound with a frequency of 200hz was the easiest to sound proof.
I used this website once again to source similar experiments than mine that had been done before
11/2/15 http://www.everydayhealth.com/headachemigrainepictures/top10migrainetriggers.aspx#07
Loud noise or highpitched noise can be a migraine trigger. If you already have a migraine headache, loud noise or any noise can make your headache worse.
This site helped me with my risk assessment and determining whether being exposed to high pitched sounds is a health hazard and how to deal with it.
29/3/15 https://swfsc.noaa.gov/uploadedFiles/Operating_units/FRD/Survey_Technology/ManScatteringAbsorptionMeasurements_APL_20040202.pdf
In conclusion, we have demonstrated that the scattering of sound from the human body is solely described by the mass of the human, while the absorption is largely dominated by the amount and type of clothing
Explains and shows effect of human presence on sound within room.
29/3/15 http://www.paroc.com/knowhow/sound/soundabsorption
In a small room or hall (volume <1000 m3) where the sound field is diffused and the average absorption is less than 0.3, an empirical formula called the Sabine formula can be used to calculate the reverberation time:
Gave information on Sabine formula.
29/3/15 https://books.google.com.au/books?id=ktkrzNp8zCAC&printsec=frontcover&source=gbs_ge_summary_r&cad=0#v=onepage&q&f=false
Information on reverberation RT60
29/3/15 http://www.bios.niu.edu/news_events/Dangers_of_Polystyrene.pdf
The United Nations Environment Program estimated in 2006 that every square mile of ocean hosts 46,000 pieces of floating plastic.
Information of harms of Styrofoam for Discussion.

Teachers Comments 2/2/15
Good start Emma. You may find that your project may require you to gather data over a much longer period of time than the week allocated. Do you have a question yet?
1/2/15 Topic/Title
Topic Idea Advantages Disadvantages
Testing the Validity of the 5 second rule
Relevant and entertaining topic to research
Most equipment is easy to obtain and is of a low cost
Method requires the use of a bacteria growing substance called agar which may be hard to obtain
http://www.madaboutscience.com.au/store/index.php?main_page=page&id=43 website on how to make homemade agar plates
Homemade agar plates may not be effective
Test a range of fuels to determine the amount that must be used for each fuel in order to heat a heat a 100 ml beaker of water 20⁰C above its normal temperature. This would then be compared to the cost of each to determine which is the most economical.
Relevant to life May be hard to get the right amount of fuel to burn to reach a temperature increase of 20⁰C. May result in many attempts of trial and error. May have to end up changing method to see how much temperature increase their is using a constant mass of fuel
Fuels may be hard to obtain. (Ethanol, Propane, Butane)
Due to the use of some equipment, would have to be

carried out at school meaning limited time to complete experiment.
Comparing the energy in different cereals. Would burn cereal under a test tube of water and measure energy released by temperature increase of water. Energy Absorbed by Water = mass of water x specific heat of water x change in temperature of the water Energy released by cereal = energy absorbed by water Energy released by 1 gram of cereal = energy released by cereal/ mass of cereal
If equipment can be obtained, experiment can be conducted at home.
Not entirely sure if this would work
May be restrictions on what equipment can be borrowed from school
The Sound Proof Box. Create shoe boxes lined with different materials to determine which better absorbs sound. Phone is placed in the box surrounded by a specific material, the phone is then called from the inside of the box and the sound made is then measured.
Would allow for very solid research and explanation to why which worked better
Materials can be obtained from home
fun and entertaining experiment
There are two most probable ways the sound can be measured, firstly just listening to see whether anything can be heard or instead use a decibel meter to measure the sound
Update: found an app that measures sound https://itunes.apple.com/au/app/decibel10th/id448155923?mt=8 however reliability is unknown
Will take a lot of time and effort
Compare the extension of different brands of rubber brands. Hang rubber bands off a
Simple equipment list Can be completed in
a short period of time.
Not a very interesting topic
Very Simplistic

retort stand adding weights to test how far it stretches.
To compare the amount of Vitamin C in different brand of orange juice (or can be tested on different types of drinks).
Will personally help me with my selection of orange juice.
Not overly complicated or will take a lot of time.
Will need to obtain chemicals and mixtures such as starch suspension, iodine and vitamin C
2/2/15
Today in class I discussed my topic ideas with Mrs McGrouther. We talked about the need to make a experiment that is relative to current world issues and that is original. After this discussion I feel as if the most valid topic is ‘The Sound Proof Box’. However to make this topic relevant I would test recyclable materials.
3/2/15
Current SRP topic : Testing the sound absorption of recyclable materials. 6/2/15
Final SRP topic : Testing the effect that styrofoam cups have in soundproofing and changing the acoustics of a room. Testing the ability of styrofoam cups in blocking and absorbing sound to determine whether they are an effective way to soundproof rooms and to also to determine the effect on the acoustics of a room. Title of Research: 25 billion gone to waste.
Research
6/2/15 Research questions:
Why is this research relevant? Why am I interested in this topic? What is sound? What is the difference between sound blocking and sound absorption? What is the science behind my hypothesis? What similar experiments have previously been done?

7/2/15
Why is This Research Relevant? Styrofoam is made from a plastic called polystyrene, which is made petroleum . This 1
means Styrofoam is non-sustainable, non-renewable and a major contributor to pollution. It is only after at least 500 years Styrofoam cups are believed to decompose . This is because it is resistant to photolysis; ‘the breaking down of 2
materials by photons originating from a light source’ . Every year, Americans alone 3
dispose of 25,000,000,000 (25 billion) Styrofoam cups . Every day 1,369 tons of 4
Styrofoam goes into U.S landfills daily, resulting in Styrofoam taking an overage of 30% of these landfills . This is enough Styrofoam to circle around the word 426 times . 5 6
The environmental effects of Styrofoam are disastrous. It is the main pollutant of water sources such as beaches, bays and oceans and often causes wildlife to choke. For example in the Great Pacific Garbage Patch, an area of ocean equivalent to the size of a continent covered in garbage, there is more plastic than there is plankton. Aquatic life often confuse the two resulting in unnecessary deaths of marine animals . Australians 7
throw out 40,335 tonnes of Expanded Polystyrene (EPS) packaging but only recycle 2,775 tonnes of it each year. Meaning only 6.9% of EPS is recycled . However 8
Styrofoam cups cannot be recycled and some recycling companies do not accept any polystyrene products.
1 TheWayToGo Polystyrene fast facts. http://isites.harvard.edu/fs/docs/icb.topic967858.files/PolystyreneFactSheets.pdf, 2008 2 Washington University in Saint Louis The Environmental Impacts of Styrofoam. http://sustainability.wustl.edu/wp-content/uploads/2013/02/Impacts-of-Styrofoam.pdf 3 Frazier, K How Styrofoam is bad for the environment. http://greenliving.lovetoknow.com/How_Styrofoam_is_Bad_for_the_Environment, 2015 4 U.S. Environmental Protection Agency 10 fast facts on recycling. http://www.epa.gov/reg3wcmd/solidwasterecyclingfacts.htm, 2013 5 ENA Facts about landfill & Styrofoam. http://www.enaecogoods.com/facts-about-landfill-styrofoam, 2013 6 Clean Up Australia Polystyrene Fact Sheet. http://www.cleanup.org.au/PDF/au/clean_up_australia_polystrene_factsheet.pdf, 2010 7 Solyom, C The Styrofoam Dilemma. http://cleanseascoalition.org/index.php?option=com_content&view=article&id=77:the-styrofoam-dilemma&catid=34:news&Itemid=58, 2009 8 Metropolitan Waste and Resource Recovery Croup Polystyrene recycling. http://www.mwrrg.vic.gov.au/community/polystyrene-recycling, 2014

The harm brought to the environment from the disposal of Styrofoam cups highlights the need to put these cups to alternate uses instead of being ‘useful for minutes’. This is why this research topic is relevant in our current world, finding ways to reuse these cups opposed to letting them fill our landfills and kill our animals is a prevalent problem of our time. Due to the convenience of these cups it is very unlikely that their production will stop any time soon. So while they are still produced it is important to limit their negative impact on our world by finding secondary fields where they can benefit society. The status quo needs to change and that is why testing Styrofoam cups to determine whether they can be used as soundproofing or to better acoustics is relevant. Why am I Interested in this Topic? I became interested in the study of soundproofing ever since sharing an adjacent room to my older brother. He constantly stays up late playing deafening music as I try to fall asleep. I also see the possible benefit this research could have in finding alternate uses for Styrofoam cups rather than filling landfills and poisoning our flora and fauna. What is Sound? Sounds are vibrations, when air vibrations enter your ear they are heard as sounds. Sound can travel through liquids, solids and gases. Sound waves need particles to work meaning sound cannot travel through a vacuum. Sound is transferred from particle to particle as they collide into each other continuing the vibration. Sound is usually represented as compression waves, however the oscilloscope represents sound using a transverse waves. In sound the amplitude represents volume and frequency represents pitch. In this experiment to determine if the Styrofoam cups have been successful is blocking the sound (soundproofing the room) we have to compare the amplitude of the sound before and after covering the walls with Styrofoam. This must be done when the sound source in on the opposite side of the wall from the oscilloscope. To determine if the Styrofoam has the ability to absorb sound and reduce echo we would compare how long it takes the transverse wave to return to the amplitude and frequency prior to the sound. This must be done when the sound source and oscilloscope are both in the room. What are the Differences Between Sound Blocking and Sound Absorption?
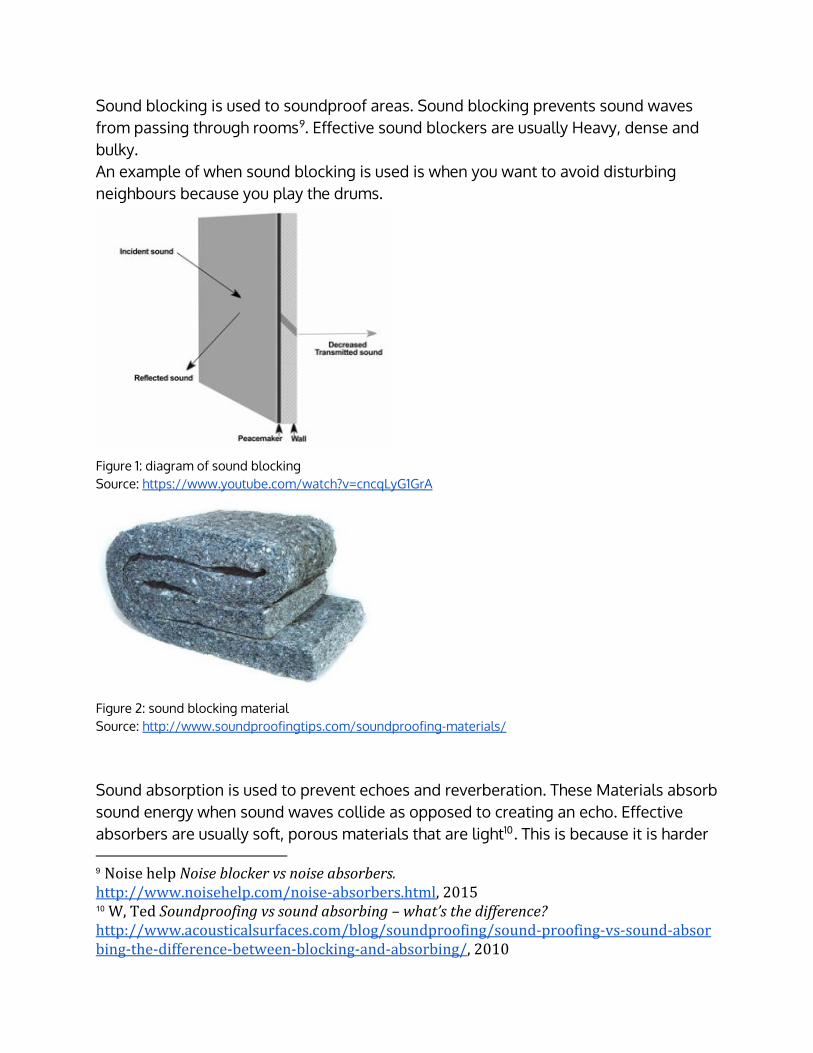
Sound blocking is used to soundproof areas. Sound blocking prevents sound waves from passing through rooms . Effective sound blockers are usually Heavy, dense and 9
bulky. An example of when sound blocking is used is when you want to avoid disturbing neighbours because you play the drums.
Figure 1: diagram of sound blocking Source: https://www.youtube.com/watch?v=cncqLyG1GrA
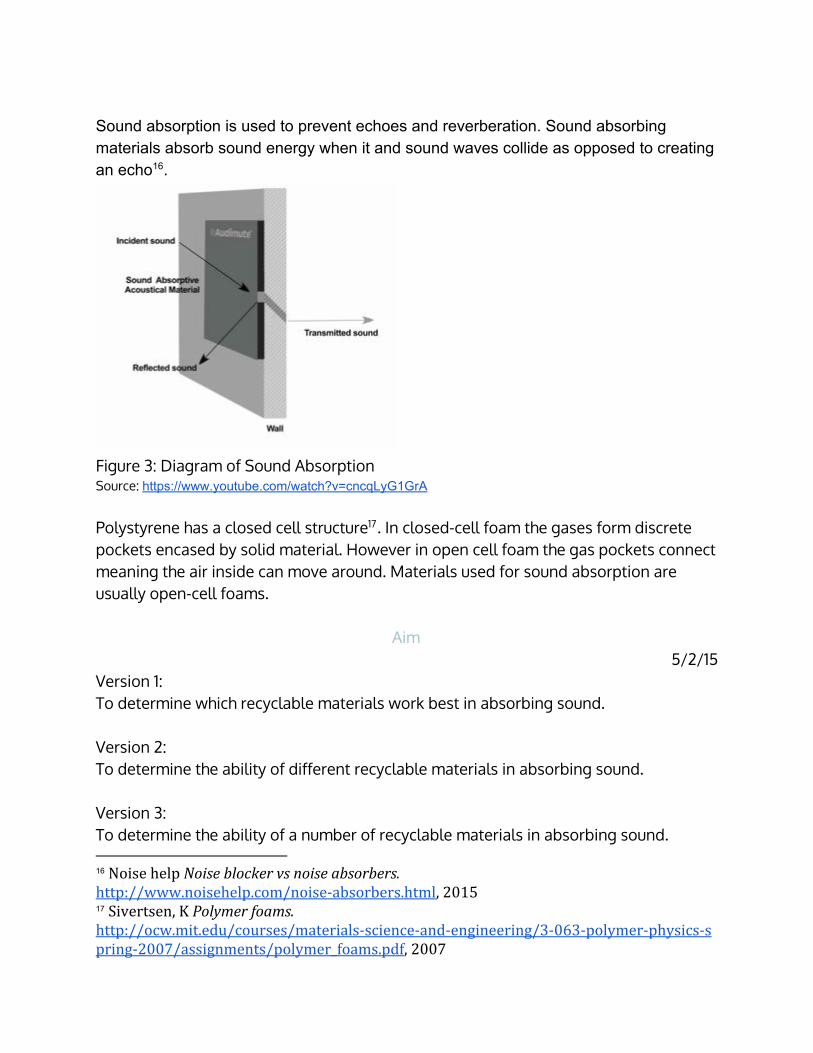
Figure 2: sound blocking material Source: http://www.soundproofingtips.com/soundproofing-materials/ Sound absorption is used to prevent echoes and reverberation. These Materials absorb sound energy when sound waves collide as opposed to creating an echo. Effective absorbers are usually soft, porous materials that are light . This is because it is harder 10
9 Noise help Noise blocker vs noise absorbers. http://www.noisehelp.com/noise-absorbers.html, 2015 10 W, Ted Soundproofing vs sound absorbing – what’s the difference? http://www.acousticalsurfaces.com/blog/soundproofing/sound-proofing-vs-sound-absorbing-the-difference-between-blocking-and-absorbing/, 2010

for sound to reflect on soft surfaces. Sound absorbers help when the listener is in the same room as the source of the sound. Sound absorption improves the sound quality of a room but it does not block sound transmission. An example of when this is useful is when a recording studio needs to stop sound reflections to preserve clarity in the sound being recorded.
Figure 3: Diagram of Sound Absorption Source: https://www.youtube.com/watch?v=cncqLyG1GrA
Fig 4: Sound Absorption Material Source: http://www.diytrade.com/china/pd/5718743/sound_absorbing_foam.html What is the Science Behind my Hypothesis? Hypothesis: That Styrofoam cups will block sound but not absorb it. The scientific reasoning behind my hypothesis is the qualities a material should have in order to be effective in blocking and absorbing sound. In order to absorb sound the material should be soft, porous and light. Although Styrofoam is light it is not soft and

porous which is evident as its prominent purpose is to hold liquid. For a material to block sound it should be heavy, dense and bulky. Even though Styrofoam is quite dense and compact it is extremely light. A Styrofoam cup is not bulky however with a large quantity it can become so. Polystyrene has a closed cell structure . In closed-cell foam the gases form discrete 11
pockets encased by solid material. However in open cell foam the gas pockets connect meaning the air inside can move around. Materials used for sound absorption are usually open-cell foams. The reason why open-cell foams are good absorbers is that the sound particles go into their pores and get trapped meaning they do not reflect. However as this is not the case with polystyrene I predict that the cups will not absorb sound. I do however believe Styrofoam cups will have an effect on the volume of the sound through the wall. I believe this may not be a large effect because as stated before to block waves effectively a material should be bulky. I think only having one layer of styrofoam cups covering the walls will only have a minimal effect on the sound waves however even a small impact highlights potential for styrofoam cups in becoming sound barriers. I think it is very doubtful that with one layer of Styrofoam cups a room would become completely soundproof but I do think it would help in preventing the sound transmission of soft sounds from one room to another. What similar experiments have previously been done? Similar experiments that have previously been conducted include: an experiment comparing the effectiveness of different materials including fibreglass insulation, shredded newspaper and Polystyrene insulation. This experiment was conducted by putting these materials in a box along with a sound source, the sound levels were then compared to each other and was concluded that polystyrene board insulation was the best agent for soundproofing out of the three[4]. There were many other experiments similar to this however most tested branded materials rather than polystyrene. The following experiment was conducted by building a sound tube with a space in the middle to insert the materials, to test which worked better. This test had differing results to the prior as it concluded Styrofoam the least sound resistant. Differences between these experiments and my own is they tested materials to see its sound blocking ability however I am also testing sound absorption. Also, these experiments
11 Sivertsen, K Polymer foams. http://ocw.mit.edu/courses/materials-science-and-engineering/3-063-polymer-physics-spring-2007/assignments/polymer_foams.pdf, 2007

were all conducted by using a box or tube as a representation of a room whereas I am using a life size room, which will hopefully result in more relevant conclusions.
9/2/15 Summary of Research Styrofoam is made from a plastic called polystyrene, which is made petroleum . This 12
means Styrofoam is non-sustainable, non-renewable and a major contributor to pollution. Every year, Americans alone dispose of 25,000,000,000 (25 billion) Styrofoam cups . Only 6.9% of polystyrene products are recycled and Styrofoam cups 13
are not accepted by recycling companies which is why it is important to find alternate 14
uses for styrofoam cups. Sounds are usually represented as a compression wave. However, oscilloscopes have the ability to represent sound through transverse waves where the amplitude reflects volume and the frequency represents pitch. Sound blocking is used to soundproof areas. Sound blocking prevents sound waves from passing through rooms . 15
Figure 1: diagram of sound blocking Source: https://www.youtube.com/watch?v=cncqLyG1GrA
12 TheWayToGo Polystyrene fast facts. http://isites.harvard.edu/fs/docs/icb.topic967858.files/PolystyreneFactSheets.pdf, 2008 13 U.S. Environmental Protection Agency 10 fast facts on recycling. http://www.epa.gov/reg3wcmd/solidwasterecyclingfacts.htm, 2013 14 Metropolitan Waste and Resource Recovery Croup Polystyrene recycling. http://www.mwrrg.vic.gov.au/community/polystyrene-recycling, 2014 15 Noise help Noise blocker vs noise absorbers. http://www.noisehelp.com/noise-absorbers.html, 2015
Sound absorption is used to prevent echoes and reverberation. Sound absorbing materials absorb sound energy when it and sound waves collide as opposed to creating an echo . 16
Figure 3: Diagram of Sound Absorption Source: https://www.youtube.com/watch?v=cncqLyG1GrA Polystyrene has a closed cell structure . In closed-cell foam the gases form discrete 17
pockets encased by solid material. However in open cell foam the gas pockets connect meaning the air inside can move around. Materials used for sound absorption are usually open-cell foams.
Aim 5/2/15
Version 1: To determine which recyclable materials work best in absorbing sound. Version 2: To determine the ability of different recyclable materials in absorbing sound. Version 3: To determine the ability of a number of recyclable materials in absorbing sound.
16 Noise help Noise blocker vs noise absorbers. http://www.noisehelp.com/noise-absorbers.html, 2015 17 Sivertsen, K Polymer foams. http://ocw.mit.edu/courses/materials-science-and-engineering/3-063-polymer-physics-spring-2007/assignments/polymer_foams.pdf, 2007

6/4/15
Version 4: To determine the effects that styrofoam cups have on sound and whether they can block sound to become a soundproof material or can absorb sound to enhance acoustics. Version 5 To determine whether styrofoam cups can absorb and block sound. Version 6: To determine the effectiveness of Styrofoam cups in blocking and absorbing sound.
Hypothesis 7/2/15
Possible Hypotheses: The styrofoam cups will neither absorb nor block sound. The styrofoam cups will both absorb and block sound. The styrofoam cups will block sound but not absorb it. The styrofoam cups will absorb sound but not block it.
Hypothesis: Styrofoam cups will block sound but not absorb it.
Equipment 3/2/15
List of recyclable materials that could possibly be used to test soundproofing: Used paper (shredded) Aluminium cans Cut up cardboard from boxes Glass bottles Wood Denim Coffee Cups Spare Carpet Styrofoam balls from packaging Styrofoam cups Left over carpet

7/2/15 After my change of topic, there has been a change of equipment needed, Equipment:
Equipment name Image Use How to be obtained
Oscilloscope
To measure the sound frequency
Borrow from school or if not possible there are apps Iphone apps which can work as a replacement.
Styrofoam Cups (approximately 2000)
To test Can be purchased online in bulk: http://www.ebay.com.au/itm/MedlineStyrofoamCup6ozbulkpackof1000/350946848062 http://www.parishsupply.com/insulatedfoamdrinkingcups.aspx http://www.restockit.com/DartContainerFoamCupsnumDRC8J8.html
Large Sheets of Cardboard
Covering the walls to stick on the Styrofoam Cups (thin so can be stuck up with glue tak)
Reach out to sources to obtain recycled sheets or buy online

Glue
To stick cups onto cardboard
Use already owned glue or purchase from art stores.
Multiple Sound Sources (phone)
To create the sound that is measured, I chose a phone so volume can be kept constant
Use already purchased phone
Blu Tack
To stick the pieces of cardboard to the wall without permanently damaging the walls
Purchase: $3.21 at Woolworths
9/2/15 Equipment list:
- Oscilloscope - Decibel meter - Sound Source with the ability to create sound waves of different frequencies
(500, 1000 and 8000 Hz) - Camera - Blu tack - Large sheets of cardboard - Styrofoam Cups - PVA glue - Software with the ability to slow down videos by 90%, such as iMovie.

11/2/15 Final equipment list with quantities, brands and sizes.
- Oscilloscope - Decibel meter - Sound source with the ability to create frequencies of 500, 1000 and 8000 Hertz - Camera - Software with the ability to slow down videos by 90%, such as iMovie - Stopwatch - Blu tack - Large pieces of sturdy cardboard - PVA glue - Styrofoam cups (approximately 16 cups for every 30cm x 30cm patch of wall)
22/2/15
Equipment list - post proposal submission - Oscilloscope - Physics Oscilloscope - Decibel meter - PASCO scientific - Sound source with the ability to create frequencies of 500, 1000 and 8000 Hertz - Camera - Iphone 5s - Software with the ability to slow down videos by 90%, such as iMovie - Stopwatch - Iphone 6s - Blu tack - Large pieces of sturdy cardboard - PVA glue - Styrofoam cups (approximately 16 cups for every 30cm x 30cm patch of wall)
7/3/15
Equipment list - 3 Iphone 6s - Oscilloscope - Physics Oscilloscope by Rytech Apps - Decibel meter - Decibel 10th by SkyPaw Co. Ltd - Sound source - Audio Function Generator by Thomas Gruber - Camera - Iphone 5s - Software with the ability to slow down videos by 95% - iMovie - Stopwatch - Blu tack - 6 Styrofoam sheets - 1.2m x 2.5m x 10mm
28/3/15 Final Equipment List:

3 x IPhone 6 1 x Oscilloscope - Physics Oscilloscope by Rytech Apps 1 x Decibel meter - Decibel 10th by SkyPaw Co. Ltd 1 x Sound source - Audio Function Generator by Thomas Gruber 1 x Camera - Iphone 5s 1 x Laptop with software with the ability to slow down videos by 95% - iMovie 1 x Stopwatch 6 x Styrofoam sheets - 1.2m x 2.5m x 10mm 1 x Measuring Tape 1 x Box Cutter 1 x Step Ladder Blu tack
Variables 9/2/15
Independent Material covering/not covering wall
Wall uncovered Wall covered with cardboard Wall covered with cardboard and styrofoam cups
Dependent
The amount of sound blocked and absorbed Controlled
The room being tested The sound source The volume of the sound source The distance between the oscilloscope and the sound source The Elimination of undesired noise The chosen wall in between the oscilloscope and the sound source
28/3/15
Independent Material covering/not covering wall
Wall uncovered Wall covered with styrofoam sheets
Dependent The amount of sound blocked and absorbed
Controlled
The room being tested The volume of the sound source The distance between the oscilloscope and the sound source The distance between the decibel meter and the sound source The Elimination of undesired noise The elimination of unnecessary objects within the room The chosen wall in between the oscilloscope, decibel meter and the sound
source The direction the sound source’s sound outlet is facing Location and position of experimenter/s within the room Battery levels of equipment such as phones The technology used:
Type of oscilloscope Type of Decibel Meter Type of Sound Source Program used to slow down videos
29/3/15
Addition of the following variable through research explaining the effect of clothes in absorbing sound:
The clothes of the experimenter/s should remain constant
Method
7/2/15
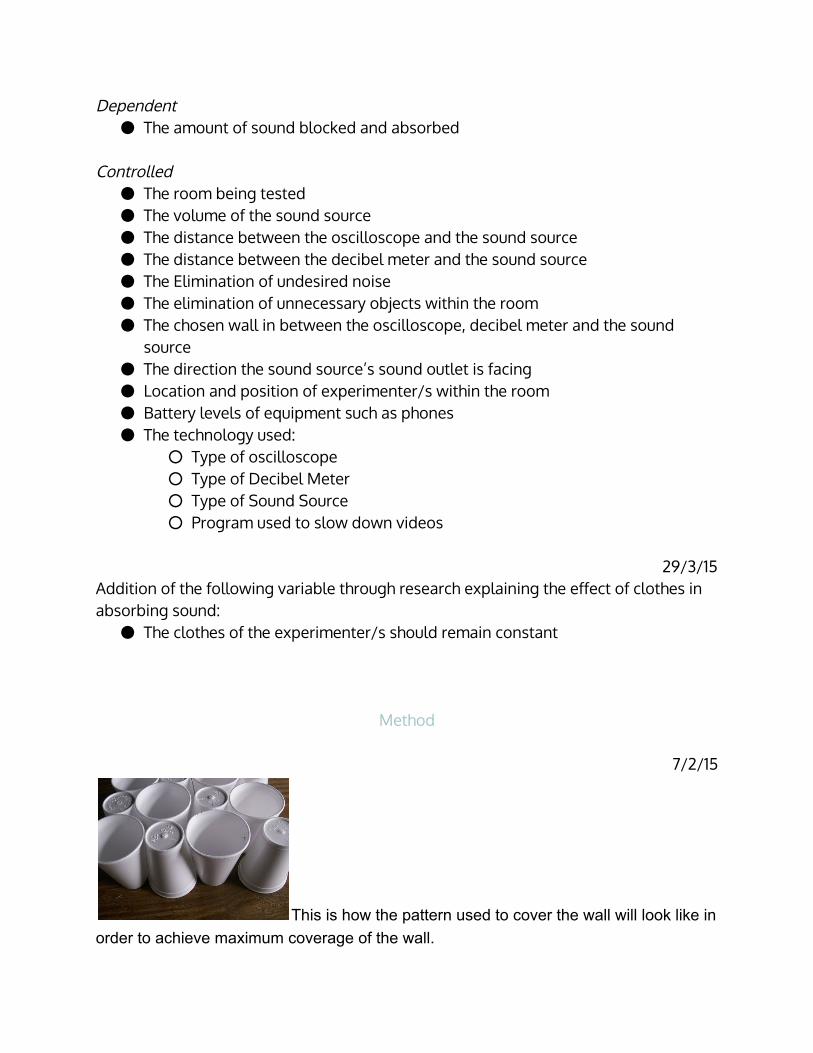
This is how the pattern used to cover the wall will look like in order to achieve maximum coverage of the wall.

9/2/15
Rough first draft of method. Part A Testing sound blocking
1. An oscilloscope and decibel meter was placed in an adjacent room to a sound source that had the ability to create sound waves of different frequencies. (Such as a phone)
2. The sound source was then activated at 500 Hz and the volume was recorded using the decibel meter and pictures of the oscilloscope were taken.
3. This was then repeated for reliability. 4. Step 2 and 3 was then repeated using 1000 Hz and again repeated using 8000
Hz. The volume was kept constant. 5. Using blu tack cardboard was then stuck onto the walls, covering its entire
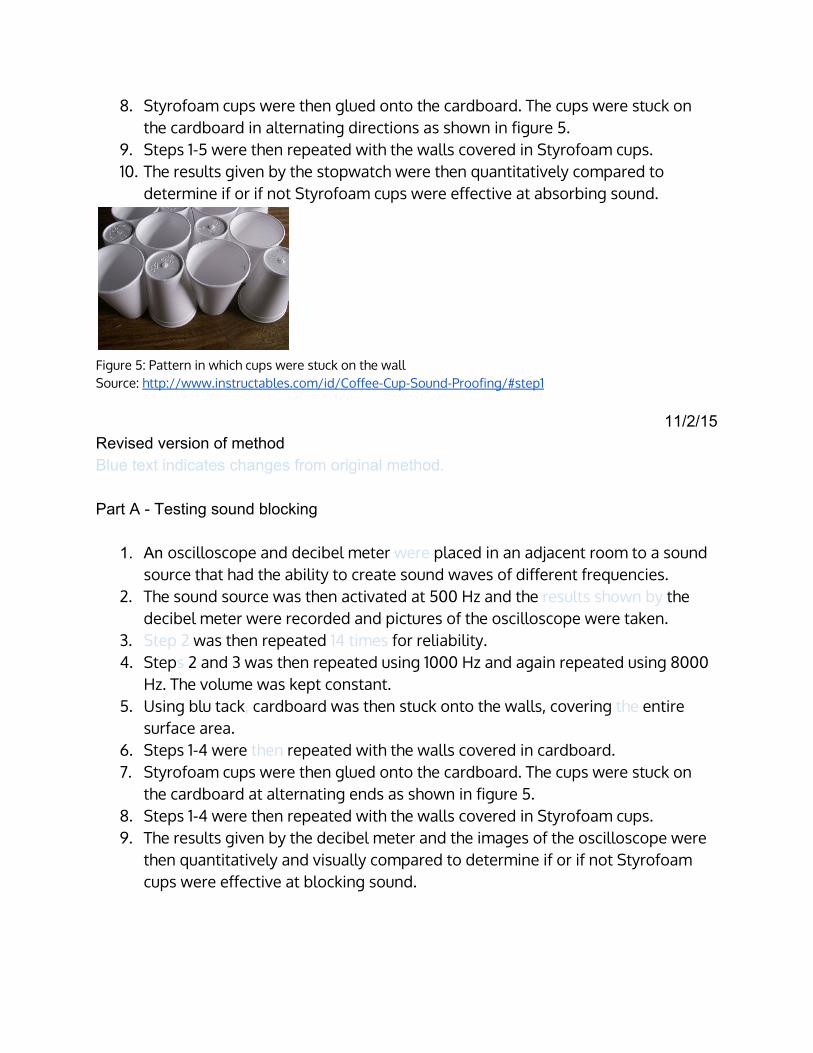
surface area. 6. Steps 1-4 were repeated with the walls covered in cardboard 7. Styrofoam cups were then glued onto the cardboard. The cups were stuck on
the cardboard in alternating directions as shown in figure 5. 8. Steps 1-4 were then repeated with the walls covered in Styrofoam cups. 9. The results given by the decibel meter and the oscilloscope were then
quantitatively and visually compared to determine if or if not Styrofoam cups were effective at blocking sound.
Part B - Testing Sound Absorption
1. An oscilloscope was placed in the same room as a sound source that had the ability to create sound waves of different frequencies. (Such as a phone)
2. The sound source was then turned on at 500 Hz for 3 seconds. (A video of the oscilloscope was taken.)
3. (The video was then slowed down.) A stopwatch was then used to time how long it took the oscilloscope to return to what it had been before the sound. These results were then recorded.
4. This was then repeated twice for reliability 5. Steps 2 - 4 were then repeated using 1000 Hz and 8000 Hz. The volume was
kept constant. 6. Using blu tack cardboard was then stuck onto the walls, covering its entire
surface area. 7. Steps 1-5 were then repeated with the walls covered in glue tack
8. Styrofoam cups were then glued onto the cardboard. The cups were stuck on the cardboard in alternating directions as shown in figure 5.
9. Steps 1-5 were then repeated with the walls covered in Styrofoam cups. 10. The results given by the stopwatch were then quantitatively compared to
determine if or if not Styrofoam cups were effective at absorbing sound.
Figure 5: Pattern in which cups were stuck on the wall Source: http://www.instructables.com/id/Coffee-Cup-Sound-Proofing/#step1
11/2/15 Revised version of method Blue text indicates changes from original method. Part A Testing sound blocking
1. An oscilloscope and decibel meter were placed in an adjacent room to a sound source that had the ability to create sound waves of different frequencies.
2. The sound source was then activated at 500 Hz and the results shown by the decibel meter were recorded and pictures of the oscilloscope were taken.
3. Step 2 was then repeated 14 times for reliability. 4. Steps 2 and 3 was then repeated using 1000 Hz and again repeated using 8000
Hz. The volume was kept constant. 5. Using blu tack, cardboard was then stuck onto the walls, covering the entire
surface area. 6. Steps 1-4 were then repeated with the walls covered in cardboard. 7. Styrofoam cups were then glued onto the cardboard. The cups were stuck on
the cardboard at alternating ends as shown in figure 5. 8. Steps 1-4 were then repeated with the walls covered in Styrofoam cups. 9. The results given by the decibel meter and the images of the oscilloscope were
then quantitatively and visually compared to determine if or if not Styrofoam cups were effective at blocking sound.

Part B - Testing Sound Absorption
10.An oscilloscope was placed in the same room as a sound source that had the ability to create sound waves of different frequencies.
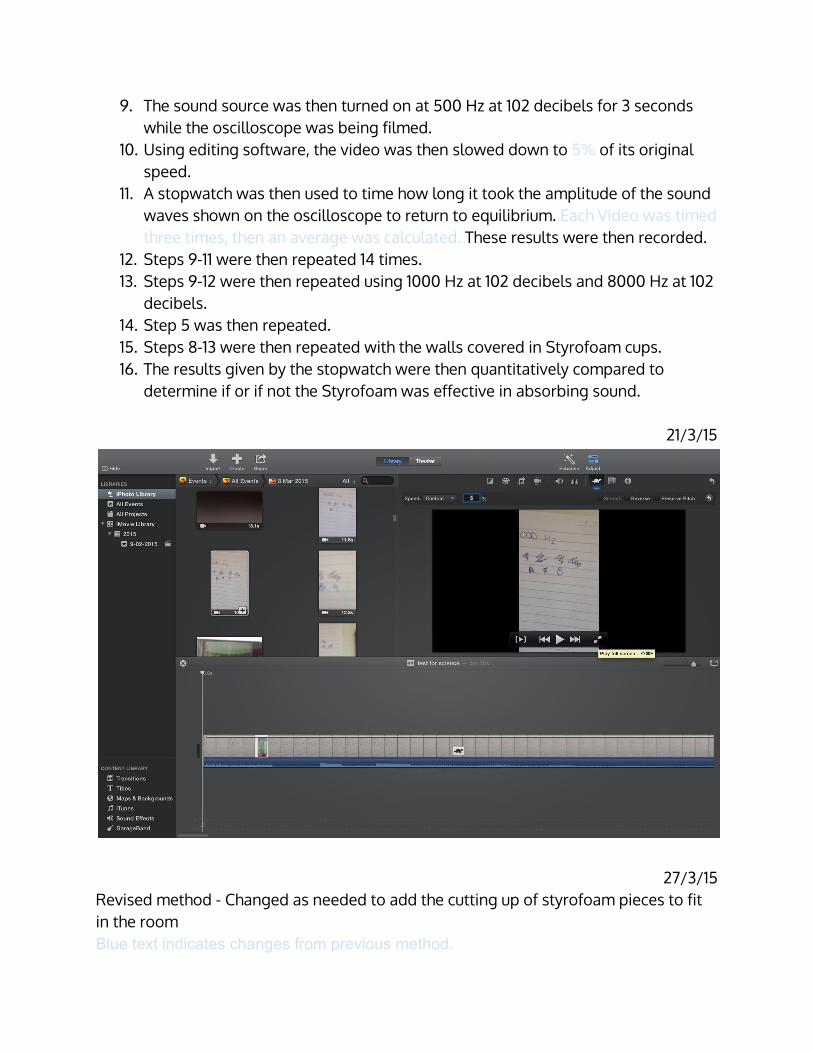
11.The sound source was then turned on at 500 Hz for 3 seconds while the oscilloscope was being filmed.
12. Using editing software, the video was then slowed down to 10% of its original speed.
13. A stopwatch was then used to time how long it took the amplitude of the sound waves shown on the oscilloscope to return to equilibrium. These results were then recorded.
14. Steps 11-13 were then repeated 14 times for reliability 15. Steps 11 - 14 were then repeated using 1000 Hz and 8000 Hz. The volume was
kept constant. 16. Step 5 was then repeated. 17. Steps 10-15 were then repeated with the walls covered in cardboard. 18. Step 7 was then repeated 19. Steps 10-15 were then repeated with the walls covered in Styrofoam cups. 20.The results given by the stopwatch were then quantitatively compared to
determine if or if not Styrofoam cups were effective in absorbing sound. Method in alternate structure Blue text indicates changes from previous method. Part A Testing sound blocking
1. An oscilloscope and decibel meter was placed in an adjacent room to a sound source that had the ability to create sound waves of different frequencies.
2. The sound source was then activated at 500 Hz and the results shown by the decibel meter were recorded and pictures of the oscilloscope were taken.
3. Step 2 was then repeated 14 times for reliability. 4. Steps 2 and 3 was then repeated using 1000 Hz and again repeated using 8000
Hz. The volume was kept constant. 5. The oscilloscope was then placed in the same room as a sound source that had
the ability to create sound waves of different frequencies. 6. The sound source was then turned on at 500 Hz for 3 seconds while the
oscilloscope was being filmed.

7. Using editing software, the video was then slowed down to 10% of its original speed.
8. A stopwatch was then used to time how long it took the amplitude of the sound waves shown on the oscilloscope to return to equilibrium. These results were then recorded.
9. Steps 11-14 were then repeated 14 times for reliability 10. Steps 11 - 14 were then repeated using 1000 Hz and 8000 Hz. The volume was
kept constant. 11. Using blu tack, cardboard was then stuck onto the walls, covering the entire
surface area. 12. Steps 1-4 were then repeated with the walls covered in cardboard 13. Steps 5-10 were then repeated with the walls covered in cardboard. 14. Styrofoam cups were then glued onto the cardboard. The cups were stuck on
the cardboard at alternating ends as shown in figure 5. 15. Steps 1-4 were then repeated with the walls covered in Styrofoam cups. 16. The results given by the decibel meter and the images of the oscilloscope were
then quantitatively and visually compared to determine if or if not Styrofoam cups were effective at blocking sound.
17. Steps 10-15 were then repeated with the walls covered in Styrofoam cups. 18. The results given by the stopwatch were then quantitatively compared to
determine if or if not Styrofoam cups were effective in absorbing sound. Method in alternate structure Blue text indicates changes from previous method. Part A Uncovered Walls Part A1 Sound Blocking
1. An oscilloscope and decibel meter were placed in an adjacent room to a sound source that had the ability to create sound waves of different frequencies.
2. The sound source was then activated at 500 Hz and the results shown by the decibel meter were recorded and pictures of the oscilloscope were taken.
3. Step 2 was then repeated 14 times for reliability. 4. Steps 2 and 3 was then repeated using 1000 Hz and again repeated using 8000
Hz. The volume was kept constant.

Part A2 - Sound Absorption 5. The oscilloscope was then placed in the same room as a sound source that had
the ability to create sound waves of different frequencies. 6. The sound source was then turned on at 500 Hz for 3 seconds while the
oscilloscope was being filmed. 7. Using editing software, the video was then slowed down to 10% of its original
speed. 8. A stopwatch was then used to time how long it took the amplitude of the sound
waves shown on the oscilloscope to return to equilibrium. These results were then recorded.
9. Steps 6 - 8 were then repeated 14 times for reliability 10. Steps 6 - 9 were then repeated using 1000 Hz and 8000 Hz. The volume was
kept constant. Part B - Walls covered in Cardboard Part B1 - Sound Blocking
11. Using blu tack, cardboard was then stuck onto the walls, covering the entire surface area.
12. Steps 1-4 were then repeated with the walls covered in cardboard Part B2 - Sound Absorption
13. Steps 5-10 were then repeated with the walls covered in cardboard. Part C - Walls Covered in Styrofoam Cups Part C1 - Sound Blocking
14. Styrofoam cups were then glued onto the cardboard. The cups were stuck on the cardboard at alternating ends as shown in figure 5.
15. Steps 1-4 were then repeated with the walls covered in Styrofoam cups. 16. The results given by the decibel meter and the images of the oscilloscope were
then quantitatively and visually compared to determine if or if not Styrofoam cups were effective at blocking sound.
Part C2 - Sound Absorption
17. Steps 5-10 were then repeated with the walls covered in Styrofoam cups. 18. The results given by the stopwatch were then quantitatively compared to
determine if or if not Styrofoam cups were effective in absorbing sound.

FINAL METHOD FOR PROPOSAL Part A Testing sound blocking
1. An oscilloscope and decibel meter was placed in an adjacent room to a sound source that had the ability to create sound waves of different frequencies.
2. The sound source was then activated at 500 Hz and the results shown by the decibel meter were recorded and pictures of the oscilloscope were taken.
3. Step 2 was then repeated 14 times for reliability. 4. Steps 2 and 3 was then repeated using 1000 Hz and again repeated using 8000
Hz. The volume was kept constant. 5. Using blu tack, cardboard was then stuck onto the walls, covering the entire
surface area. 6. Steps 1-4 were then repeated with the walls covered in cardboard 7. Styrofoam cups were then glued onto the cardboard. The cups were stuck on
the cardboard at alternating ends as shown in figure 5. 8. Steps 1-4 were then repeated with the walls covered in Styrofoam cups. 9. The results given by the decibel meter and the images of the oscilloscope were
then quantitatively and visually compared to determine if or if not Styrofoam cups were effective at blocking sound.
Part B - Testing Sound Absorption
10. An oscilloscope was placed in the same room as a sound source that had the ability to create sound waves of different frequencies.
11. The sound source was then turned on at 500 Hz for 3 seconds while the oscilloscope was being filmed.
12. Using editing software, the video was then slowed down to 10% of its original speed.
13. A stopwatch was then used to time how long it took the amplitude of the sound waves shown on the oscilloscope to return to equilibrium. These results were then recorded.
14. Steps 11-13 were then repeated 14 times for reliability 15. Steps 11 - 14 were then repeated using 1000 Hz and 8000 Hz. The volume was
kept constant. 16. Step 5 was then repeated. 17. Steps 10-15 were then repeated with the walls covered in cardboard. 18. Step 7 was then repeated 19. Steps 10-15 were then repeated with the walls covered in Styrofoam cups.

20.The results given by the stopwatch were then quantitatively compared to determine if or if not Styrofoam cups were effective in absorbing sound.
Why is the method valid? Table
Step (number may change due to change in structure of method)
Explanation
1. An oscilloscope and decibel meter was placed in an adjacent room to a sound source that had the ability to create sound waves of different frequencies. (Such as a phone)
Both an oscilloscope and a decibel meter were used to measure results both visually and quantitatively. This will create clearer results and reliability as there are two machines testing for results. They were placed in Adjacent rooms as this step was testing for sound blocking and sound blocking is the ability to stop sound waves from passing through walls. A sound device that had the ability to create sound waves of different frequencies. This was important as frequencies of different pitches may respond Styrofoam cups differently. It was important to use a device where the volume could be controlled.
2. The sound source was then activated at 500 Hz and the volume was recorded using the decibel meter and pictures of the oscilloscope were taken.
The reason the sound source was activated as 500 Hz was because lower frequencies could not even travel through naked walls and therefore would not show relevant results.
3. This was then repeated 15 times for reliability.
This step was important to obtain reliable results and eliminate error that may have occurred in the first trial.
4. Step 2 and 3 was then repeated using 1000 Hz and again repeated using 8000 Hz. The volume was kept constant.
As said before these steps were repeated with different frequencies. This is because the Styrofoam may be effective in blocking sound waves with certain frequencies but not effective in blocking
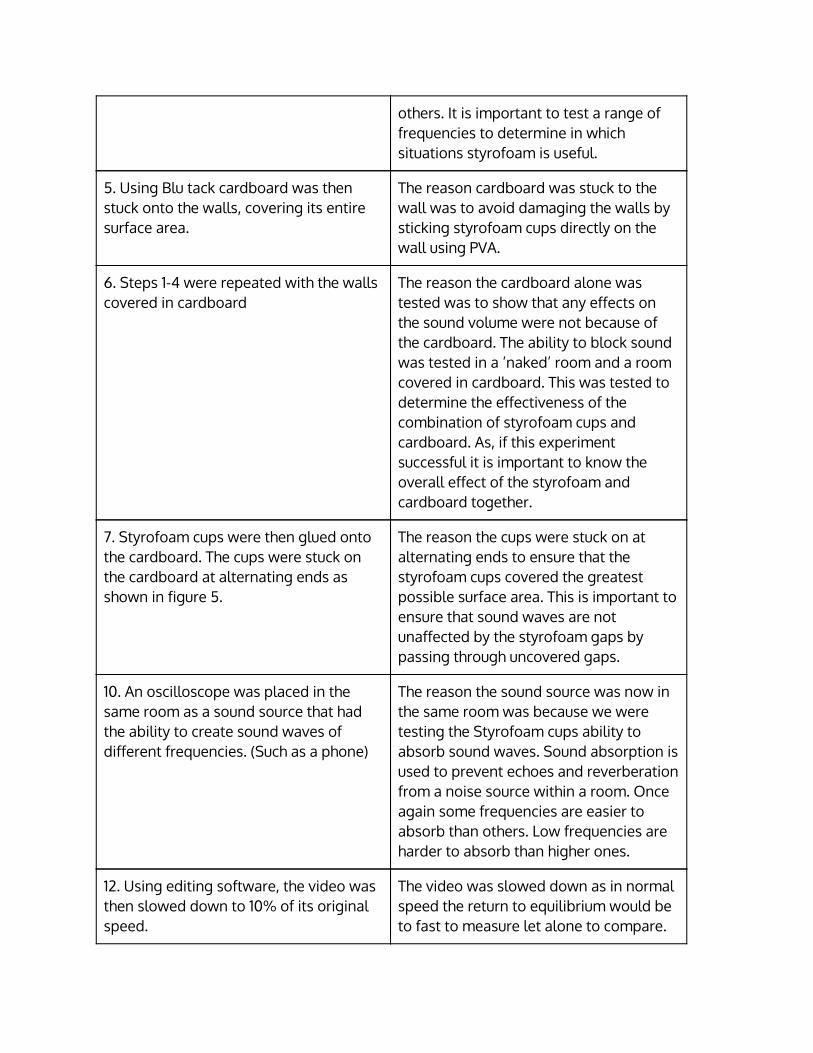
others. It is important to test a range of frequencies to determine in which situations styrofoam is useful.
5. Using Blu tack cardboard was then stuck onto the walls, covering its entire surface area.
The reason cardboard was stuck to the wall was to avoid damaging the walls by sticking styrofoam cups directly on the wall using PVA.
6. Steps 1-4 were repeated with the walls covered in cardboard
The reason the cardboard alone was tested was to show that any effects on the sound volume were not because of the cardboard. The ability to block sound was tested in a ‘naked’ room and a room covered in cardboard. This was tested to determine the effectiveness of the combination of styrofoam cups and cardboard. As, if this experiment successful it is important to know the overall effect of the styrofoam and cardboard together.
7. Styrofoam cups were then glued onto the cardboard. The cups were stuck on the cardboard at alternating ends as shown in figure 5.
The reason the cups were stuck on at alternating ends to ensure that the styrofoam cups covered the greatest possible surface area. This is important to ensure that sound waves are not unaffected by the styrofoam gaps by passing through uncovered gaps.
10. An oscilloscope was placed in the same room as a sound source that had the ability to create sound waves of different frequencies. (Such as a phone)
The reason the sound source was now in the same room was because we were testing the Styrofoam cups ability to absorb sound waves. Sound absorption is used to prevent echoes and reverberation from a noise source within a room. Once again some frequencies are easier to absorb than others. Low frequencies are harder to absorb than higher ones.
12. Using editing software, the video was then slowed down to 10% of its original speed.
The video was slowed down as in normal speed the return to equilibrium would be to fast to measure let alone to compare.

13. A stopwatch was then used to time how long it took the amplitude of the sound waves shown on the oscilloscope to return to equilibrium. These results were then recorded.
Whenever a stopwatch is used, the recorded time may very from the true results due to delay of human reactions. By slowing down the video this will be less of a problem as recorded times may be off by 1% rather than if it was only partially slowed down where human error could be off by over 50% as the waves on the oscilloscope move very fast.
Written The above method is valid for testing the hypothesis as it assesses whether Styrofoam cups have the ability to block and absorb sound. To successfully block sound is to reduce the volume of sound from inside one room to another. Therefore, for the method to be valid, we need to compare the change in volume of a sound as it passes through an uncovered wall to when it passes through a Styrofoam cup wall to determine if the cups have any effect. The reason the method uses both an oscilloscope and a decibel meter is that the oscilloscope gives results in the form of transverse waves where volume is represented by the amplitude of each wave as opposed to a decibel meter which measures volume in decibels. Therefore, the data is more reliable and the results can be shown both visually and quantitatively. Sound absorption is the absorbing of sound to eliminate echoes and reverberations. If sound is echoing it takes longer for that sound to dissipate and it therefore takes longer for the sound waves shown on a oscilloscope to return to equilibrium. Unless the video of the oscilloscope is slowed down we would be unable to comparatively measure the effect of the styrofoam cups on echo as sound waves are too rapid. In this method many variables have been controlled such as the volume and frequency of the sound source, the room being tested and the elimination of undesired noise. The experiment is repeated many times for reliability to be able to determine if any results are outliers. Different frequencies were tested as some frequencies can be absorbed or blocked better than others. For example it is easier for materials to absorb high-pitched noises rather than low ones. Cardboard alone was tested as a control group to rule out alternative explanations for the results and so that the alone effect of Styrofoam cups on sound could be concluded. The cups were stuck onto the cardboard at alternating ends to ensure that they covered the greatest possible surface area. This is important to ensure that sound waves cannot simply pass through uncovered gaps unaffected. Therefore, this method is valid for measuring the hypothesis.
22/2/15

Revised method - post proposal submittal Blue text indicates changes from previous method. Part A Testing sound blocking
1. An oscilloscope and decibel meter was placed in an adjacent room to a sound source that had the ability to create sound waves of different frequencies.
2. The sound source was then activated at 500 Hz at 102 decibels and the results shown by the decibel meter were recorded and pictures of the oscilloscope were taken.
3. Step 2 was then repeated 14 times. 4. Steps 2 and 3 was then repeated using 1000 Hz at 102 decibels and again
repeated using 8000 Hz at 102 decibels. 5. Using blu tack, the Styrofoam sheets were then blue tacked onto the wall
ensuring the entire surface area of the room was covered. 6. Steps 1-4 were then repeated with the walls covered in Styrofoam sheets. 7. The results given by the decibel meter and the images of the oscilloscope were
then quantitatively and visually compared to determine if or if not Styrofoam was effective in blocking sound.
Part B - Testing Sound Absorption
8. An oscilloscope was placed in the same room as a sound source that had the ability to create sound waves of different frequencies.
9. The sound source was then turned on at 500 Hz at 102 decibels for 3 seconds while the oscilloscope was being filmed.
10. Using editing software, the video was then slowed down to 10% of its original speed.
11. A stopwatch was then used to time how long it took the amplitude of the sound waves shown on the oscilloscope to return to equilibrium. These results were then recorded.
12. Steps 9-11 were then repeated 14 times. 13. Steps 9-12 were then repeated using 1000 Hz at 102 decibels and 8000 Hz at 102
decibels. 14. Step 5 was then repeated. 15. Steps 8-13 were then repeated with the walls covered in Styrofoam cups. 16. The results given by the stopwatch were then quantitatively compared to
determine if or if not the Styrofoam was effective in absorbing sound.

8/3/15 Images from Experiment


16/3/15
Revised method - Changed as a result of experiences while measuring absorbing ability of Styrofoam Blue text indicates changes from previous method. Part A Testing sound blocking
1. An oscilloscope and decibel meter was placed in an adjacent room to a sound source that had the ability to create sound waves of different frequencies.
2. The sound source was then activated at 500 Hz at 102 decibels and the results shown by the decibel meter were recorded and pictures of the oscilloscope were taken.
3. Step 2 was then repeated 14 times. 4. Steps 2 and 3 was then repeated using 1000 Hz at 102 decibels and again
repeated using 8000 Hz at 102 decibels. 5. Using blu tack, the Styrofoam sheets were then blue tacked onto the wall
ensuring the entire surface area of the room was covered. 6. Steps 1-4 were then repeated with the walls covered in Styrofoam sheets. 7. The results given by the decibel meter and the images of the oscilloscope were
then quantitatively and visually compared to determine if or if not Styrofoam was effective in blocking sound.
Part B - Testing Sound Absorption
8. An oscilloscope was placed in the same room as a sound source that had the ability to create sound waves of different frequencies.
9. The sound source was then turned on at 500 Hz at 102 decibels for 3 seconds while the oscilloscope was being filmed.
10. Using editing software, the video was then slowed down to 5% of its original speed.
11. A stopwatch was then used to time how long it took the amplitude of the sound waves shown on the oscilloscope to return to equilibrium. Each Video was timed three times, then an average was calculated. These results were then recorded.
12. Steps 9-11 were then repeated 14 times. 13. Steps 9-12 were then repeated using 1000 Hz at 102 decibels and 8000 Hz at 102
decibels. 14. Step 5 was then repeated. 15. Steps 8-13 were then repeated with the walls covered in Styrofoam cups. 16. The results given by the stopwatch were then quantitatively compared to
determine if or if not the Styrofoam was effective in absorbing sound.
21/3/15
27/3/15 Revised method - Changed as needed to add the cutting up of styrofoam pieces to fit in the room Blue text indicates changes from previous method.

Part A Testing sound blocking
1. An oscilloscope and decibel meter was placed in an adjacent room the sound source.
2. The sound source was then activated at 500 Hz at 102 decibels and the results shown by the decibel meter were recorded and screenshots of the oscilloscope were taken.
3. Step 2 was then repeated 14 times. 4. Steps 2 and 3 was then repeated using 1000 Hz at 102 decibels and again
repeated using 8000 Hz at 102 decibels. 5. 5 styrofoam sheets were cut into 15 pieces sized: 28 cm x 2.5 m, 1.7 m x 34 cm,
1.7 m x 1.03 m, 1.7 m x 38 cm, 1.03 m x 35 cm, 1.03 m x 80 cm, 70 cm x 2.5 m, 73 cm x 2.5 m, 1.82 x 1.03, 37 cm x 54cm, 54 x 49 cm, 54cm x 49 cm, 36 cm x 47 cm, 1.03 m x 2.5 with a 37 cm x 42 cm rectangle cut out at 33cm right of the bottom left corner, 1.82 m x 1.03 m with 25 x 43 cm hole cut out at 39 cm above the bottom left corner and 1 styrofoam sheet was left uncut.
6. Using blu tack, the Styrofoam sheets were then blue tacked onto the wall ensuring the entire surface area of the room was covered.
7. Steps 1-4 were then repeated with the walls covered in Styrofoam sheets. 8. The results given by the decibel meter and the images of the oscilloscope were
then quantitatively and visually compared to determine if or if not Styrofoam was effective in blocking sound.
Part B - Testing Sound Absorption
9. An oscilloscope was placed in the same room as the sound source. The sound source’s speaker was placed facing away from the oscilloscope.
10. The sound source was then turned on at 500 Hz at 102 decibels for 3 seconds while the oscilloscope was being filmed.
11. Using iMovie, the video was then slowed down to 5% of its original speed. 12. A stopwatch was then used to time how long it took the amplitude of the sound
waves shown on the oscilloscope to return to equilibrium after the sound waves were affected by the sound source being turned off. Each Video was timed three times, then an average was calculated. These results were then recorded.
13. Steps 10-12 were then repeated 14 times. 14. Steps 10-13 were then repeated using 1000 Hz at 102 decibels and 8000 Hz at
102 decibels. 15. Step 6 was then repeated. 16. Steps 9-14 were then repeated with the walls covered with Styrofoam sheets.

17. The results given by the stopwatch were then quantitatively compared to determine if or if not the Styrofoam was effective in absorbing sound.
29/3/15
Revised method - Addition of sources to refer to Blue text indicates changes from previous method. Part A Testing sound blocking
1. An oscilloscope and decibel meter was placed in an adjacent room the sound source.
2. The sound source was then activated at 500 Hz at 102 decibels and the results shown by the decibel meter were recorded and screenshots of the oscilloscope were taken.
3. Step 2 was then repeated 14 times. 4. Steps 2 and 3 was then repeated using 1000 Hz at 102 decibels and again
repeated using 8000 Hz at 102 decibels. 5. 5 styrofoam sheets were cut into 15 pieces sized: 28 cm x 2.5 m, 1.7 m x 34 cm,
1.7 m x 1.03 m, 1.7 m x 38 cm, 1.03 m x 35 cm, 1.03 m x 80 cm, 70 cm x 2.5 m, 73 cm x 2.5 m, 1.82 x 1.03, 37 cm x 54cm, 54 x 49 cm, 54cm x 49 cm, 36 cm x 47 cm, 1.03 m x 2.5 with a 37 cm x 42 cm rectangle cut out at 33cm right of the bottom left corner, 1.82 m x 1.03 m with 25 x 43 cm hole cut out at 39 cm above the bottom left corner and 1 styrofoam sheet was left uncut.
6. Using blu tack, the Styrofoam sheets were then blue tacked onto the wall ensuring the entire surface area of the room was covered. (refer to figure y)
7. Steps 1-4 were then repeated with the walls covered in Styrofoam sheets. 8. The results given by the decibel meter and the images of the oscilloscope were
then quantitatively and visually compared to determine if or if not Styrofoam was effective in blocking sound.
Part B - Testing Sound Absorption
9. An oscilloscope was placed in the same room as the sound source. The sound source’s speaker was placed facing away from the oscilloscope. (fig a)
10. The sound source was then turned on at 500 Hz at 102 decibels for 3 seconds while the oscilloscope was being filmed.
11. Using iMovie, the video was then slowed down to 5% of its original speed. (refer to figure x)
12. A stopwatch was then used to time how long it took the amplitude of the sound waves shown on the oscilloscope to return to equilibrium after the sound waves

were affected by the sound source being turned off. Each Video was timed three times, then an average was calculated. These results were then recorded.
13. Steps 10-12 were then repeated 14 times. 14. Steps 10-13 were then repeated using 1000 Hz at 102 decibels and 8000 Hz at
102 decibels. 15. Step 6 was then repeated. 16. Steps 9-14 were then repeated with the walls covered with Styrofoam sheets. 17. The results given by the stopwatch were then quantitatively compared to
determine if or if not the Styrofoam was effective in absorbing sound.
Fig z: Experimental Set up for Sound blocking

Fig y: Styrofoam sheets being placed and blu tacked onto the surface area of the room
Fig a: Experimental Setup for Sound Absorption

Fig x: Video being slowed on iMovie
Risk Assessment 9/2/15
Step 1:
Identify the hazard
Step 2: Strategies to minimise the
hazard
Step 3: Assessment of
risk
Step 4: What if
something goes wrong?
Step 5: Packing up
May fall off chair/ladder
while gluing on cardboard and cups causing
injury
Be careful when standing on chair/ladder. Eliminate any
possible objects that that may
cause you to fall. Use safe and
sturdy chair/ladder.
2+1=3=MODERATE In case of accident
concerning falling seek help of teacher and seek first aid if
required.
Carefully remove cups and
cardboard from the walls.
Ingesting or getting PVA glue
in eyes.
Be careful with glue. Keep away from mouth and
wear safety glasses at all
times.
1 + 1 = 2 = LOW RISK
If PVA glue is ingested or gets in eyes consult
teacher.
Pack away carefully.
Listening to high pitch sounds resulting in
Use ear muffs if prone to having
1 + 1 = 2 = LOW RISK
If beginning to feel unwell,
immediately turn
N/A
feeling sick or having
headaches
reactions to high pitch noises.
off sound source and lie down. Only continue experiment if feeling better.
Mandatory precautions: Covered shoes, safety glasses, hair exceeding shoulder length tied back.
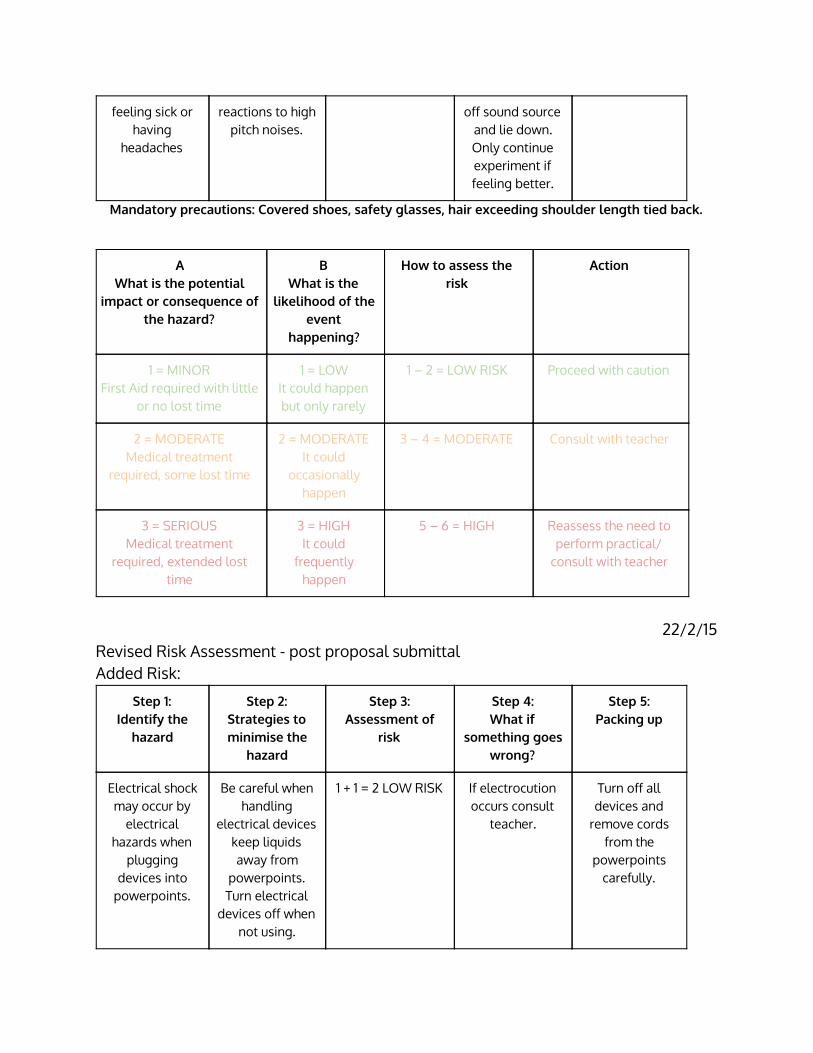
A What is the potential
impact or consequence of the hazard?
B What is the
likelihood of the event
happening?
How to assess the risk
Action
1 = MINOR First Aid required with little
or no lost time
1 = LOW It could happen but only rarely
1 – 2 = LOW RISK Proceed with caution
2 = MODERATE Medical treatment
required, some lost time
2 = MODERATE It could
occasionally happen
3 – 4 = MODERATE Consult with teacher
3 = SERIOUS Medical treatment
required, extended lost time
3 = HIGH It could
frequently happen
5 – 6 = HIGH Reassess the need to perform practical/
consult with teacher
22/2/15
Revised Risk Assessment - post proposal submittal Added Risk:
Step 1: Identify the
hazard
Step 2: Strategies to minimise the
hazard
Step 3: Assessment of
risk
Step 4: What if
something goes wrong?
Step 5: Packing up
Electrical shock may occur by
electrical hazards when
plugging devices into
powerpoints.
Be careful when handling
electrical devices keep liquids away from
powerpoints. Turn electrical
devices off when not using.
1 + 1 = 2 LOW RISK If electrocution occurs consult
teacher.
Turn off all devices and
remove cords from the
powerpoints carefully.

28/3/15
Above Risk acquitted as using Phones as technology which do not possess the harm of
electrocution however may break and cause cuts:
Step 1:
Identify the hazard
Step 2: Strategies to minimise the
hazard
Step 3: Assessment of
risk
Step 4: What if
something goes wrong?
Step 5: Packing up
Phones can break and cause
cuts.
Place phones away from edges of benches and
be cautious while handling.
1 + 1 = 2 LOW RISK In case of breakage consult
teacher and be cautious when
handling phone. If cuts occur, seek
first aid.
Pack away with caution.

11/2/15
The Proposal Background Research: Styrofoam is made from a plastic called polystyrene, which is made petroleum . This 18
means Styrofoam is non-sustainable, non-renewable and a major contributor to pollution. Every year, Americans alone dispose of 25,000,000,000 (25 billion) Styrofoam cups . Only 6.9% of polystyrene products are recycled and Styrofoam cups 19
are not accepted by recycling companies which is why it is important to find alternate 20
uses for styrofoam cups. Sounds are usually represented as a compression wave. However, oscilloscopes have the ability to represent sound through transverse waves where the amplitude reflects volume and the frequency represents pitch. Sound blocking is used to soundproof areas. Sound blocking prevents sound waves from passing through rooms . 21
Figure 1: diagram of sound blocking Source: https://www.youtube.com/watch?v=cncqLyG1GrA
18 TheWayToGo Polystyrene fast facts. http://isites.harvard.edu/fs/docs/icb.topic967858.files/PolystyreneFactSheets.pdf, 2008 19 U.S. Environmental Protection Agency 10 fast facts on recycling. http://www.epa.gov/reg3wcmd/solidwasterecyclingfacts.htm, 2013 20 Metropolitan Waste and Resource Recovery Croup Polystyrene recycling. http://www.mwrrg.vic.gov.au/community/polystyrene-recycling, 2014 21 Noise help Noise blocker vs noise absorbers. http://www.noisehelp.com/noise-absorbers.html, 2015

Sound absorption is used to prevent echoes and reverberation. Sound absorbing materials absorb sound energy when it and sound waves collide as opposed to creating an echo . 22
Figure 3: Diagram of Sound Absorption Source: https://www.youtube.com/watch?v=cncqLyG1GrA Polystyrene has a closed cell structure . In closed-cell foam the gases form discrete 23
pockets encased by solid material. However in open cell foam the gas pockets connect meaning the air inside can move around. Materials used for sound absorption are usually open-cell foams. Aim: To determine the effectiveness of Styrofoam cups in blocking and absorbing sound. Hypothesis: Styrofoam cups will block sound but not absorb it.
22 Noise help Noise blocker vs noise absorbers. http://www.noisehelp.com/noise-absorbers.html, 2015 23 Sivertsen, K Polymer foams. http://ocw.mit.edu/courses/materials-science-and-engineering/3-063-polymer-physics-spring-2007/assignments/polymer_foams.pdf, 2007

Equipment List:
- Oscilloscope - Decibel meter - Sound source with the ability to create frequencies of 500, 1000 and 8000 Hertz - Camera - Software with the ability to slow down videos by 90%, such as iMovie - A Stopwatch - Blu tack - Large pieces of sturdy cardboard - PVA glue - Styrofoam cups (approximately 16 cups for every 30cm x 30cm patch of wall)
Risk Assessment
Step 1: Identify the
hazard
Step 2: Strategies to minimise the
hazard
Step 3: Assessment of
risk
Step 4: What if
something goes wrong?
Step 5: Packing up
May fall off chair/ladder
while gluing on cardboard and cups causing
injury
Be careful when standing on chair/ladder. Eliminate any
possible objects that that may
cause you to fall. Use safe and
sturdy chair/ladder.
2+1=3=MODERATE In case of accident concerning falling
seek help of teacher and seek
first aid if required.
Carefully remove cups and
cardboard from the walls.
Ingesting or getting PVA glue
in eyes.
Be careful with glue. Keep away from mouth and
wear safety glasses at all
times.
1 + 1 = 2 = LOW RISK If PVA glue is ingested or gets in
eyes consult teacher.
Pack away carefully.
Listening to high pitch sounds resulting in
feeling sick or having headaches
Use ear muffs if prone to having reactions to high
pitch noises.
1 + 1 = 2 = LOW RISK If beginning to feel unwell,
immediately turn off sound source
and lie down. Only continue
experiment if feeling better.
N/A

Mandatory precautions: Covered shoes, safety glasses, hair exceeding shoulder length tied back.
A What is the potential impact
or consequence of the hazard?
B What is the
likelihood of the event happening?
How to assess the risk Action
1 = MINOR First Aid required with little or
no lost time
1 = LOW It could happen but
only rarely
1 – 2 = LOW RISK Proceed with caution
2 = MODERATE Medical treatment required,
some lost time
2 = MODERATE It could occasionally
happen
3 – 4 = MODERATE Consult with teacher
3 = SERIOUS Medical treatment required,
extended lost time
3 = HIGH It could frequently
happen
5 – 6 = HIGH Reassess the need to perform practical/ consult
with teacher
Method Part A Testing sound blocking
17.An oscilloscope and decibel meter was placed in an adjacent room to a sound source that had the ability to create sound waves of different frequencies.
18. The sound source was then activated at 500 Hz and the results shown by the decibel meter were recorded and pictures of the oscilloscope were taken.
19. Step 2 was then repeated 14 times for reliability. 20.Steps 2 and 3 was then repeated using 1000 Hz and again repeated using 8000
Hz. The volume was kept constant. 21. Using blu tack, cardboard was then stuck onto the walls, covering the entire
surface area. 22. Steps 1-4 were then repeated with the walls covered in cardboard. 23. Styrofoam cups were then glued onto the cardboard. The cups were stuck on
the cardboard at alternating ends as shown in figure 5. 24.Steps 1-4 were then repeated with the walls covered in Styrofoam cups. 25. The results given by the decibel meter and the images of the oscilloscope were
then quantitatively and visually compared to determine if or if not Styrofoam cups were effective at blocking sound.
Part B - Testing Sound Absorption
26. An oscilloscope was placed in the same room as a sound source that had the ability 11. to create sound waves of different frequencies.
27. The sound source was then turned on at 500 Hz for 3 seconds while the oscilloscope was being filmed.

28. Using editing software, the video was then slowed down to 10% of its original speed.
29. A stopwatch was then used to time how long it took the amplitude of the sound waves shown on the oscilloscope to return to equilibrium. These results were then recorded.
30.Steps 11-13 were then repeated 14 times for reliability. 31. Steps 11 - 14 were then repeated using 1000 Hz and 8000 Hz. The volume was
kept constant. 32. Step 5 was then repeated. 33. Steps 10-15 were then repeated with the walls covered in cardboard. 34. Step 7 was then repeated 35. Steps 10-15 were then repeated with the walls covered in Styrofoam cups. 36. The results given by the stopwatch were then quantitatively compared to
determine if or if not Styrofoam cups were effective in absorbing sound.
Figure 5: Pattern in which cups were stuck on the wall Source: http://www.instructables.com/id/Coffee-Cup-Sound-Proofing/#step1 Explanation of why method is Valid. The above method is valid for testing the hypothesis as it assesses whether Styrofoam cups have the ability to block and absorb sound. To successfully block sound is to reduce the volume of sound from inside one room to another. Therefore, for the method to be valid, we need to compare the change in volume of a sound as it passes through an uncovered wall to when it passes through a styrofoam cup wall to determine if the cups have any effect. The reason the method uses both a oscilloscope and a decibel meter is that the oscilloscope gives results in the form of transverse waves where volume is represented by the amplitude of each wave as opposed to a decibel meter which measures volume in decibels. Therefore, the data is more reliable and the results can be shown both visually and quantitatively. Sound absorption is the absorbing of sound to eliminate echoes and reverberations. If sound is echoing it takes longer for that sound to dissipate and it therefore takes longer for the sound waves

shown on a oscilloscope to return to equilibrium. Unless the video of the oscilloscope is slowed down we would be unable to comparatively measure the effect of the styrofoam cups on echo as sound waves are too rapid. In this method many variables have been controlled such as the volume and frequency of the sound source, the room being tested and the elimination of undesired noise. The experiment is repeated many times for reliability to be able to determine if any results are outliers. Different frequencies were tested as some frequencies can be absorbed or blocked better than others. For example it is easier for materials to absorb high pitched noises rather than low ones. Cardboard alone was tested as a control group to rule out alternative explanations for the results and so that the alone effect of styrofoam cups on sound could be concluded. The cups were stuck onto the cardboard at alternating ends to ensure that they covered the greatest possible surface area. This is important to ensure that sound waves cannot simply pass through uncovered gaps unaffected. Therefore, this method is valid for measuring the hypothesis. Variables Independent
Material covering/not covering wall Wall uncovered Wall covered with cardboard Wall covered with cardboard and styrofoam cups
Dependent
The amount of sound blocked and absorbed Controlled
The room being tested The sound source The volume of the sound source The distance between the oscilloscope/decibel meter and the sound source The elimination of undesired noise The chosen wall in between the oscilloscope and the sound source The reduction of speed from videos

TImeline
For a more detailed outline of organisation of SRP tasks please refer to SRP log.

Results 7/3/15
First draft of tables. Printed and used to record information during experiment. Table for Blocking Sound:

Table for Absorbing Sound:

8/3/15 Screenshots of Oscilloscope from the testing of sound blocking


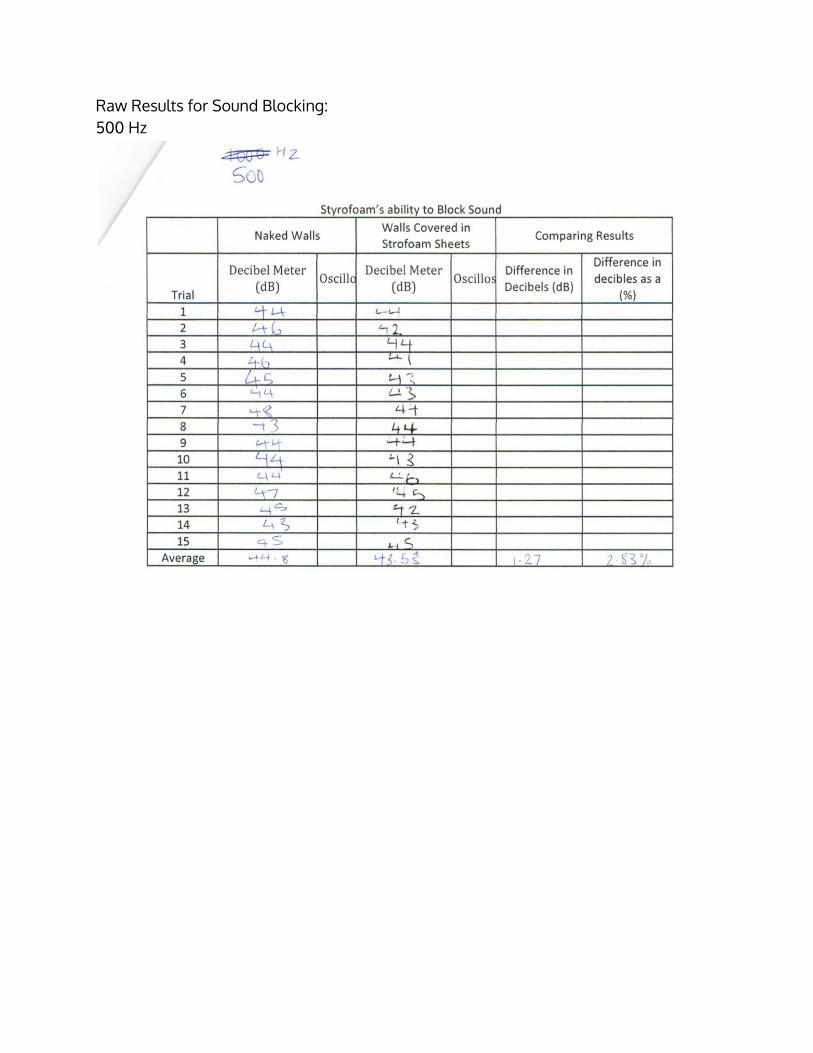
Raw Results for Sound Blocking: 500 Hz

1000 Hz
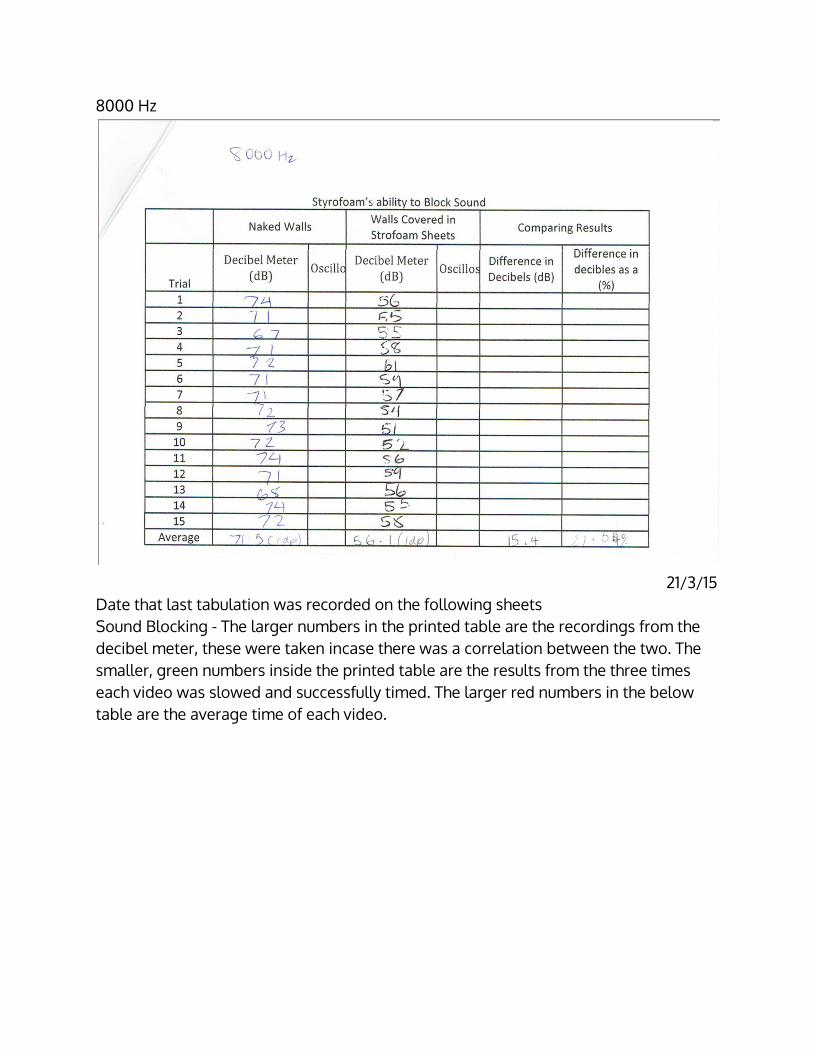
8000 Hz
21/3/15
Date that last tabulation was recorded on the following sheets Sound Blocking - The larger numbers in the printed table are the recordings from the decibel meter, these were taken incase there was a correlation between the two. The smaller, green numbers inside the printed table are the results from the three times each video was slowed and successfully timed. The larger red numbers in the below table are the average time of each video.

500Hz

1000Hz

8000Hz

28/3/15 Updated Sound Blocking Table:
Table for Comparing Results of Sound blocking:

Completed Tables on Sound Blocking:


Sound Absorption Table Template:

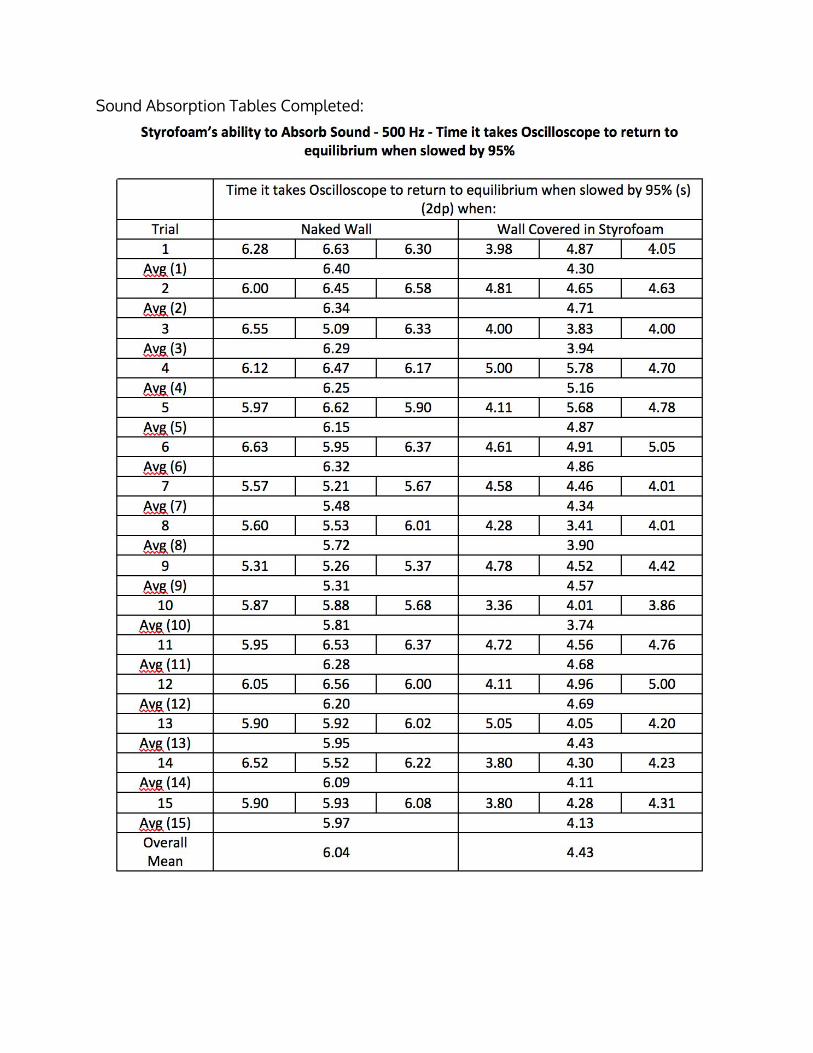
Sound Absorption Tables Completed:


Range added to Sound Absorption tables:
e.g. Line Graphs for Sound Blocking:


Did not include Line Graphs in report as not correct spacing between different frequencies and limited number of points means an inability to prove trend.
Discussion 29/3/15
The majority of the data gathered has shown that Styrofoam possesses the ability to both block and absorb sound. However, its’ ability to do so varies depending on the frequency of the sound source. Therefore the results do not support the hypothesis, which was that Styrofoam cups would block sound but not absorb it as Styrofoam both blocked and absorbed sound. Concerning Styrofoam’s ability to block sound it was evident from both the quantitative and qualitative results that Styrofoam best blocked sound of the frequency 8000 Hz. From the data gathered we are lead to believe that as the frequency increases so does the percentage of sound that is blocked by the Styrofoam. When the Walls were uncovered, as the Frequency increased so did the volume, rapidly between 500 and 1000 Hz and slowly between 1000 and 8000 Hz. However, when the walls were covered with Styrofoam the trend of a rapid increase of volume between 500 and 1000 Hz remained the same however the volume decreased between 1000 and 8000 Hz. This is because higher frequency sounds are easier to block than lower frequency sounds. The scientific explanation behind this is that sound waves of low frequencies are more distant than that of high frequencies and therefore displace larger amounts of air. This air is then pushed toward the sounddeadening structure (the styrofoam), which makes it more difficult for the structure to absorb all of the sound[1]. The gathered data show that Styrofoam used does not possess the ability to completely block sound and is thus not an effective sound proofing material. However, larger thicknesses may be able to completely block sounds with lower volumes, which is an area to further research. Styrofoam can be used to reduce sound transmission from one room to the other, which is an ability that is still utilizable concerning infrastructure. The addition of Styrofoam lead to a decrease in the reverberation and reflection of sound within the room, which was evident as the time it took for the soundwaves to return to equilibrium after disturbance was quicker. Therefore, the Styrofoam was able to absorb sound. Without the testing of other frequencies no trend concerning the amount of sound absorbed vs. the frequency of the sound can be determined. Out of the tested frequencies 1000 Hz was the best absorbed with a decrease in the time it took the sound waves to return to equilibrium of more than half. 8000 Hz followed with a decrease in time of 37.84% and 500 Hz with 26.66%. Therefore, to be able to determine a trend regarding frequency vs. percentage absorbed, more frequencies should be
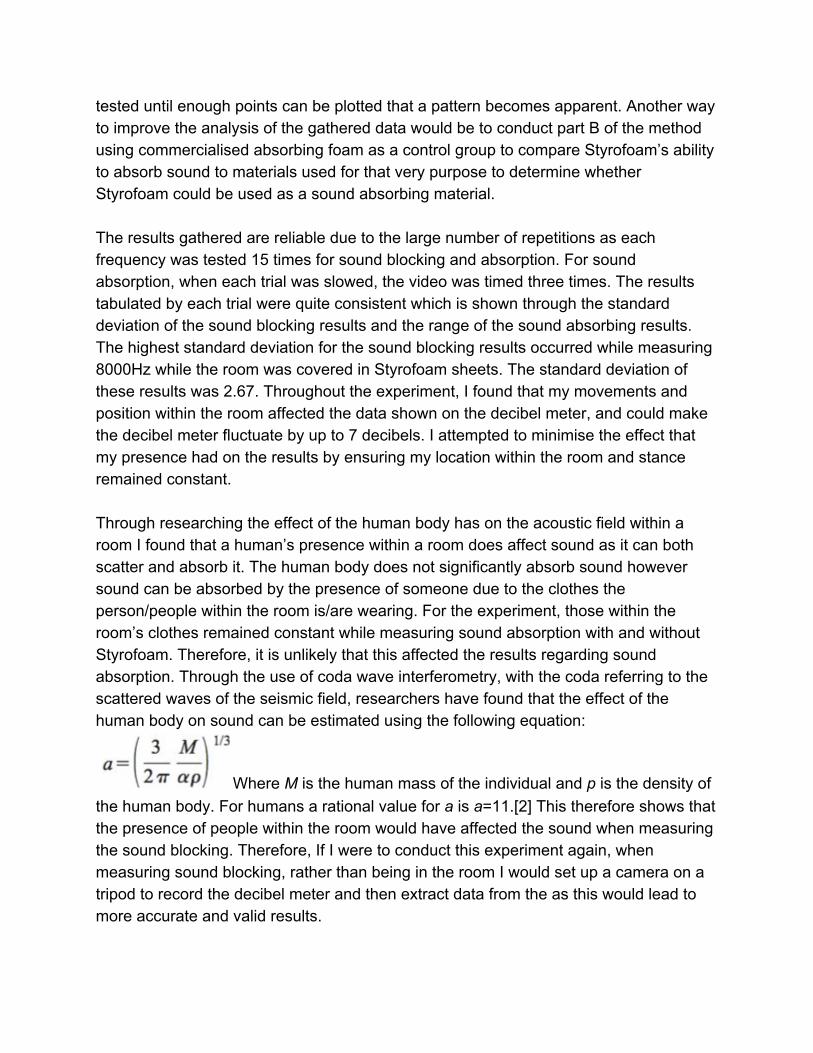
tested until enough points can be plotted that a pattern becomes apparent. Another way to improve the analysis of the gathered data would be to conduct part B of the method using commercialised absorbing foam as a control group to compare Styrofoam’s ability to absorb sound to materials used for that very purpose to determine whether Styrofoam could be used as a sound absorbing material. The results gathered are reliable due to the large number of repetitions as each frequency was tested 15 times for sound blocking and absorption. For sound absorption, when each trial was slowed, the video was timed three times. The results tabulated by each trial were quite consistent which is shown through the standard deviation of the sound blocking results and the range of the sound absorbing results. The highest standard deviation for the sound blocking results occurred while measuring 8000Hz while the room was covered in Styrofoam sheets. The standard deviation of these results was 2.67. Throughout the experiment, I found that my movements and position within the room affected the data shown on the decibel meter, and could make the decibel meter fluctuate by up to 7 decibels. I attempted to minimise the effect that my presence had on the results by ensuring my location within the room and stance remained constant. Through researching the effect of the human body has on the acoustic field within a room I found that a human’s presence within a room does affect sound as it can both scatter and absorb it. The human body does not significantly absorb sound however sound can be absorbed by the presence of someone due to the clothes the person/people within the room is/are wearing. For the experiment, those within the room’s clothes remained constant while measuring sound absorption with and without Styrofoam. Therefore, it is unlikely that this affected the results regarding sound absorption. Through the use of coda wave interferometry, with the coda referring to the scattered waves of the seismic field, researchers have found that the effect of the human body on sound can be estimated using the following equation:
Where M is the human mass of the individual and p is the density of the human body. For humans a rational value for a is a=11.[2] This therefore shows that the presence of people within the room would have affected the sound when measuring the sound blocking. Therefore, If I were to conduct this experiment again, when measuring sound blocking, rather than being in the room I would set up a camera on a tripod to record the decibel meter and then extract data from the as this would lead to more accurate and valid results.

The largest range regarding sound absorption was 2.6 seconds, which occurred when measuring the time it took sound waves of 1000 Hz to return to equilibrium when disturbed by the cancellation of sound without Styrofoam sheets covering the surface area of the room. This may be as a result of the increase of time it took the sound waves to return to equilibrium leading to the increase in the variation of the results, which, as a percentage is equivalent to the variation in the other sound absorption results. An issue of validity was human error and reaction time when measuring the videos with a stopwatch. However, due to the repetitions of the timing of these recordings and the caution used when timing the videos the data gathered can be considered both reliable and valid. As the results of trials were repeatable with little variation between the data found for each trial both the results of sound blocking and sound absorption were reliable. To further investigate Styrofoam’s ability to absorb sound it would be ideal to compare its’ absorbing ability to other materials by substituting its properties and those of this experiment into Sabine’s reverberation equation: RT = 0.16 x V/A (This is a simplified version of the equation) Where T is the reverberation time (s), V is the volume of the room (m3) and A = (Σ
surface area (S) x α) = absorption area of the room, m2 [3]. However, Sabine’s equation is relevant to RT60 which is the time required for reflections of a direct sound to decay 60 dB.[4] Therefore part B of the experiment would have to be repeated with the sound source outputting sound at 60 decibels. The method is valid for testing the hypothesis as it assesses whether Styrofoam has the ability to block and absorb sound. To successfully block sound is to reduce the volume of sound from inside one room to another. Therefore, for the method to be valid, a comparison between the changes in volume of sound as it passes through an uncovered wall to when it passes through a wall covered with Styrofoam must occur to determine if polystyrene had any effect on sound. Using both an oscilloscope and a decibel meter to measure the results is to accumulate data qualitatively in the form of transverse waves where volume is represented by the amplitude of each wave and quantitatively to a decibel meter, which gives numerical measurement of volume in decibels. This means trends were more reliable if both the decibel meter and the oscilloscope showed them. Sound absorption is the absorbing of sound to eliminate echoes and reverberations. If sound is echoing it takes longer for that sound to dissipate and it therefore takes longer for the sound waves shown on an oscilloscope to return to equilibrium. For validity the

video of the oscilloscope must be slowed down as otherwise we would be unable to comparatively measure the effect of the styrofoam cups on echo as sound waves are too rapid and human reaction times would lead to invalid data. In this method many variables have been controlled which can be identified in the variables section of this report. If these variables were not controlled the data gathered would be invalid as it would become unknown if the trends present are due to the uncontrolled variables or the independent variable. The steps within the method are repeated many times to establish the reliability of this experiment as well as to be able to determine if any results are outliers. Different frequencies were tested as some frequencies can be absorbed or blocked better than others as shown in the results. It is easier for materials to absorb highpitched noises rather than low ones which is supported through the results as both 1000 and 8000 Hz were absorbed better than 500 Hz. One questionable factor of the gathered data is the validity of the equipment used, and whether using mobile phones as a decibel meter, oscilloscope and sound source is a valid way to conduct the experiment. To determine if or if not the mobile phones produced valid data it would be useful to conduct the experiment again using a physical decibel meter and oscilloscope to determine whether the phones were valid measuring instruments. However, even without this follow on experiment being conducted I do believe the equipment used was valid in measuring results as the oscilloscope and decibel meter had supporting data and the advancement of mobile phone technology has been enormous. The results were quite accurate however accurate trends could not be determined due to the small number of frequencies tested. Therefore, to continue research in this field I would conduct the same experiments with different frequencies until trends can be supported with data. This would further enhance our knowledge on how sound behaves with the presence of Styrofoam. Therefore, as a whole this method is valid for testing the hypothesis. However, there were some errors that occurred while conducting the experiment. As stated before the presence of a person inside the room caused the sound to scatter slightly varying the results, so to avoid this next time I would use a camera and tripod to film the decibel meter. Another error was the slight vary in the oscilloscope amplitude for certain frequencies when I approached to take a screenshot. To avoid this I would use a Bluetooth control to take the screenshot, which means I would not have to be in the room, which, works cohesively with the other alteration above. Thirdly, when covering the walls with Styrofoam small gaps occurred when styrofoam sheets met, to prevent this from occurring again I would use more caution and ensure lines are straight when measuring and cutting.

As shown in the introduction a change concerning humanity’s Styrofoam habits must occur. As styrofoam cups cannot be recycled to become new styrofoam cups we must find alternate ways to recycle this nonrenewable material. Therefore, this experiment is relevant in finding solution to this problem and could be applied to the real world. To further this research, I would begin to research how Styrofoam cups and other Styrofoam products can be packed into Styrofoam sheets. As this experiment has found that Styrofoam is successful in preventing the transmission of some sound from one room to the other and is able to absorb sound resulting in the decrease of echo the next step of research is to study how styrofoam products would be implemented in infrastructure projects. An example is the idea pictured below where Styrofoam products including cups have been packed into an oriented strand board.
Figures 9,10,11: Styrofoam packed into an oriented strand board. Source: http://greenpassivesolar.com/2012/11/howstyrofoamcanberecycled/ Another area of research would be to study whether the thickness of Styrofoam has an effect on its’ ability to block and absorb sound. Additionally I think it would be interesting to look into whether polystyrene can be shredded and then condensed into Styrofoam sheets that resemble the one’s used in the experiment. Therefore this research is relevant to our modern world as Styrofoam is rapidly becoming a growing prevalent and concerning global issue. This is due to the pollution caused when the material is disposed of as it takes over 500 years to decompose, every day 1,369 tones of styrofoam goes into landfills in the U.S alone and in 2006 an United Nations Environment Program estimated that every square mile of ocean hosts 46,000 pieces of floating plastic[5] which destroys the ecosystems within that area. These facts along with many more highlight the need for change concerning Styrofoam use, which my project aims to achieve.
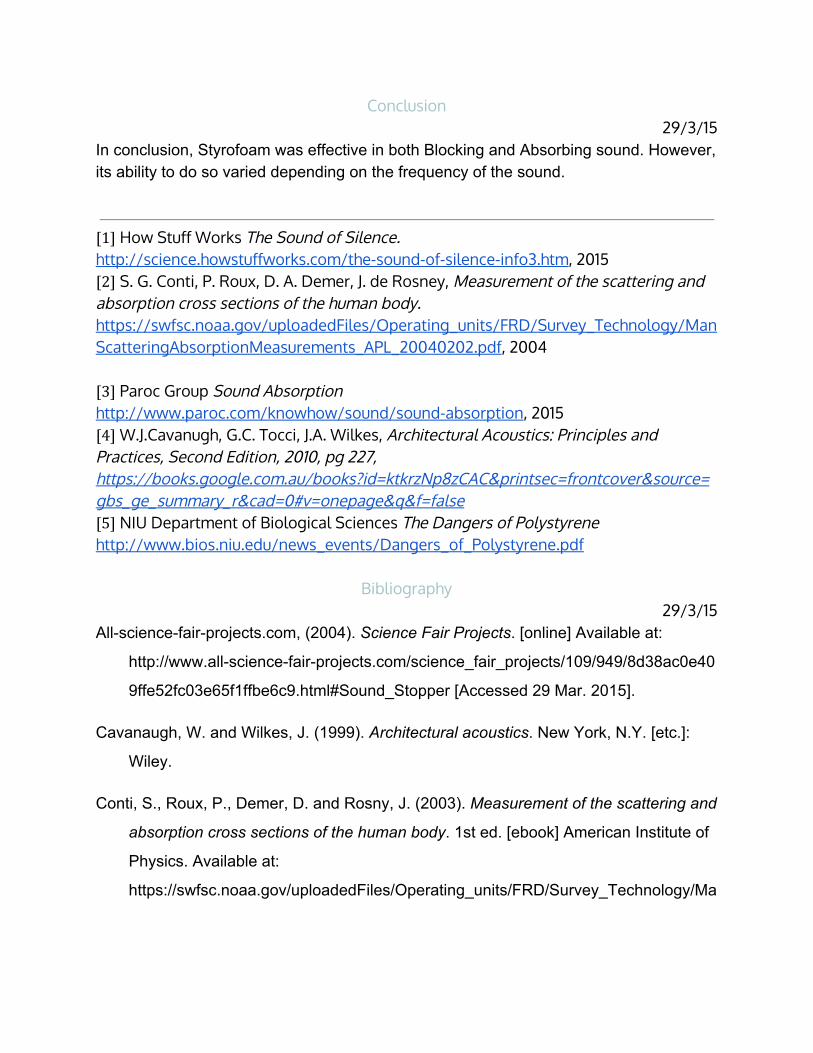
Conclusion 29/3/15
In conclusion, Styrofoam was effective in both Blocking and Absorbing sound. However, its ability to do so varied depending on the frequency of the sound.
[1] How Stuff Works The Sound of Silence. http://science.howstuffworks.com/the-sound-of-silence-info3.htm, 2015 [2] S. G. Conti, P. Roux, D. A. Demer, J. de Rosney, Measurement of the scattering and absorption cross sections of the human body. https://swfsc.noaa.gov/uploadedFiles/Operating_units/FRD/Survey_Technology/ManScatteringAbsorptionMeasurements_APL_20040202.pdf, 2004 [3] Paroc Group Sound Absorption http://www.paroc.com/knowhow/sound/sound-absorption, 2015 [4] W.J.Cavanugh, G.C. Tocci, J.A. Wilkes, Architectural Acoustics: Principles and Practices, Second Edition, 2010, pg 227, https://books.google.com.au/books?id=ktkrzNp8zCAC&printsec=frontcover&source=gbs_ge_summary_r&cad=0#v=onepage&q&f=false [5] NIU Department of Biological Sciences The Dangers of Polystyrene http://www.bios.niu.edu/news_events/Dangers_of_Polystyrene.pdf
Bibliography 29/3/15
Allsciencefairprojects.com, (2004). Science Fair Projects. [online] Available at:
http://www.allsciencefairprojects.com/science_fair_projects/109/949/8d38ac0e40
9ffe52fc03e65f1ffbe6c9.html#Sound_Stopper [Accessed 29 Mar. 2015].
Cavanaugh, W. and Wilkes, J. (1999). Architectural acoustics. New York, N.Y. [etc.]:
Wiley.
Conti, S., Roux, P., Demer, D. and Rosny, J. (2003). Measurement of the scattering and
absorption cross sections of the human body. 1st ed. [ebook] American Institute of
Physics. Available at:
https://swfsc.noaa.gov/uploadedFiles/Operating_units/FRD/Survey_Technology/Ma

nScatteringAbsorptionMeasurements_APL_20040202.pdf [Accessed 29 Mar.
2015].
DIYTrade, (2015). soundabsorbing foam. [online] Available at:
http://www.diytrade.com/china/pd/5718743/sound_absorbing_foam.html [Accessed
29 Mar. 2015].
Earth's Natural Alternative, (2013). FACTS ABOUT LANDFILL & STYROFOAM. [online]
Available at: http://www.enaecogoods.com/factsaboutlandfillstyrofoam [Accessed
29 Mar. 2015].
Environmental Protection Agency, (2013). 10 Fast Facts on Recycling. [online] Available
at: http://www.epa.gov/reg3wcmd/solidwasterecyclingfacts.htm [Accessed 29 Mar.
2015].
Frazier, K. (2015). How Styrofoam is Bad for the Environment. [online] LoveToKnow.
Available at:
http://greenliving.lovetoknow.com/How_Styrofoam_is_Bad_for_the_Environment
[Accessed 29 Mar. 2015].
How to Soundproof a Room: Sound Absorption vs Sound Blocking by Audimute. (2009).
[video] Audimute.
HowStuffWorks, (2015). Approaches to Stopping Noise The Sound of Silence. [online]
Available at: http://science.howstuffworks.com/thesoundofsilenceinfo3.htm
[Accessed 29 Mar. 2015].
Lea, K. (2012). How Styrofoam Can Be Recycled. [online] Green Passive Solar
Magazine. Available at:
http://greenpassivesolar.com/2012/11/howstyrofoamcanberecycled/ [Accessed
29 Mar. 2015].
mcqueen, J. (2014). Polystyrene recycling. [online] Metropolitan Waste and Resource
Recovery Group. Available at:

http://www.mwrrg.vic.gov.au/community/polystyrenerecycling [Accessed 29 Mar.
2015].
Noise Help, (2015). Noise Blockers vs Noise Absorbers: Soundproofing Materials.
[online] Available at: http://www.noisehelp.com/noiseabsorbers.html [Accessed 29
Mar. 2015].
Paroc, (2015). Sound absorption. [online] Available at:
http://www.paroc.com/knowhow/sound/soundabsorption [Accessed 29 Mar. 2015].
Polystyrene Fact Sheet. (2010). 1st ed. [ebook] Clean up Australia. Available at:
http://www.cleanup.org.au/PDF/au/clean_up_australia_polystrene_factsheet.pdf
[Accessed 29 Mar. 2015].
Polystyrene Fast Facts. (2008). 1st ed. [ebook] TheWaytoGO, pp.14. Available at:
http://isites.harvard.edu/fs/docs/icb.topic967858.files/PolystyreneFactSheets.pdf
[Accessed 29 Mar. 2015].
Sivertsen, K. (2007). POLYMER FOAMS. 1st ed. [ebook] Available at:
http://ocw.mit.edu/courses/materialsscienceandengineering/3063polymerphysi
csspring2007/assignments/polymer_foams.pdf [Accessed 29 Mar. 2015].
Solyom, C. (2009). The Styrofoam dilemma. [online] Clean seas coalition. Available at:
http://cleanseascoalition.org/index.php?option=com_content&view=article&id=77:th
estyrofoamdilemma&catid=34:news&Itemid=58 [Accessed 29 Mar. 2015].
Soundproofing Tips, (2015). Top 10 Soundproofing Materials Soundproofing Tips.
[online] Available at: http://www.soundproofingtips.com/soundproofingmaterials/
[Accessed 29 Mar. 2015].
The Dangers of Polystyrene. (2015). 1st ed. [ebook] Available at:
http://www.bios.niu.edu/news_events/Dangers_of_Polystyrene.pdf [Accessed 29
Mar. 2015].

The Environmental Impacts of Styrofoam. (2013). 1st ed. [ebook] Washington University
in St. Louis. Available at:
http://sustainability.wustl.edu/wpcontent/uploads/2013/02/ImpactsofStyrofoam.pd
f [Accessed 29 Mar. 2015].
W, T. (2010). Soundproofing vs Sound Absorbing What's the Difference? Acoustical
Surfaces. [online] Acoustical Surfaces. Available at:
http://www.acousticalsurfaces.com/blog/soundproofing/soundproofingvssoundab
sorbingthedifferencebetweenblockingandabsorbing/ [Accessed 29 Mar. 2015].
Abstract
29/3/15
Styrofoam is a nonrecyclable plastic and its effect on the environment are rapidly worsening. Extremely large amounts of Styrofoam go to waste bins where they remain for over 500 years. Therefore it is important to find uses for used Styrofoam. Sound blocking is when sound waves are prevented from passing from one room to the next. Sound Absorption is when sound waves are absorbed preventing the reverberation of sound. The aim of the experiment was to determine the effectiveness of Styrofoam in blocking and absorbing sound. This would then lead us to see whether Styrofoam could be used as a sound blocker or absorber. Different frequencies (500, 1000 and 8000 Hz) were tested to see whether the frequency affected the Styrofoam’s sound blocking or absorbing ability. Sound blocking was tested by placing an oscilloscope and decibel meter in an adjacent room to a sound source. Sound absorption was tested by placing the sound source in the same room as the oscilloscope. It was filmed when the sound source was turned off. The videos were then slowed, timed and compared to see if Styrofoam had absorbed sound. The hypothesis stated that Styrofoam would block sound but not absorb it. The results disproved this hypothesis. They showed that Styrofoam was able to block sound but not soundproof a room. The increase of frequency lead to the increase of the percentage of sound blocked. The data also showed that Styrofoam absorbed sound. It did this most successfully for 1000 Hz as the time it took the sound waves to return to equilibrium were more than halved. One problem that occurred was the effect the human body inside the room had on the results as it scattered sound. However overall the results were valid, reliable and showed that Styrofoam could partially block and absorb sound. (299 words)