Student Lesson: Square Root · PDF fileSquare Root Functions Maximizing Algebra II Performance...
35
Square Root Functions Maximizing Algebra II Performance Student Lesson: Square Root Functions 322 Student Lesson: Square Root Functions TEKS a5 Tools for algebraic thinking. Techniques for working with functions and equations are essential in understanding underlying relationships. Students use a variety of representations (concrete, pictorial, numerical, symbolic, graphical, and verbal), tools, and technology (including, but not limited to, calculators with graphing capabilities, data collection devices, and computers) to model mathematical situations to solve meaningful problems. a6 Underlying mathematical processes. Many processes underlie all content areas in mathematics. As they do mathematics, students continually use problem-solving, language and communication, and reasoning (justification and proof) to make connections within and outside mathematics. Students also use multiple representations, technology, applications and modeling, and numerical fluency in problem-solving contexts. 2A.9 Quadratic and Square Root Functions. The student formulates equations and inequalities based on square root functions, uses a variety of methods to solve them, and analyzes the solutions in terms of the situation. 2A.9A The student is expected to use the parent function to investigate, describe, and predict the effects of parameter changes on the graphs of square root functions and describe limitations on the domains and ranges. 2A.9B The student is expected to relate representations of square root functions, such as algebraic, tabular, graphical, and verbal descriptions. 2A.9C The student is expected to determine the reasonable domain and range values of square root functions, as well as interpret and determine the reasonableness of solutions to square root equations and inequalities. 2A.9D The student is expected to determine solutions of square root equations using graphs, tables, and algebraic methods. 2A.9E The student is expected to determine solutions of square root inequalities using graphs and tables. 2A.9F The student is expected to analyze situations modeled by square root functions, formulate equations or inequalities, select a method, and solve problems. 2A.9G The student is expected to connect inverses of square root functions with quadratic functions.
-
Upload
phungxuyen -
Category
Documents
-
view
216 -
download
0
Transcript of Student Lesson: Square Root · PDF fileSquare Root Functions Maximizing Algebra II Performance...

Square Root Functions
Maximizing Algebra II Performance Student Lesson: Square Root Functions
322
Student Lesson: Square Root Functions TEKS a5 Tools for algebraic thinking. Techniques for working with functions and
equations are essential in understanding underlying relationships. Students use a variety of representations (concrete, pictorial, numerical, symbolic, graphical, and verbal), tools, and technology (including, but not limited to, calculators with graphing capabilities, data collection devices, and computers) to model mathematical situations to solve meaningful problems.
a6 Underlying mathematical processes. Many processes underlie all content areas in mathematics. As they do mathematics, students continually use problem-solving, language and communication, and reasoning (justification and proof) to make connections within and outside mathematics. Students also use multiple representations, technology, applications and modeling, and numerical fluency in problem-solving contexts.
2A.9 Quadratic and Square Root Functions. The student formulates equations and inequalities based on square root functions, uses a variety of methods to solve them, and analyzes the solutions in terms of the situation.
2A.9A The student is expected to use the parent function to investigate, describe, and predict the effects of parameter changes on the graphs of square root functions and describe limitations on the domains and ranges.
2A.9B The student is expected to relate representations of square root functions, such as algebraic, tabular, graphical, and verbal descriptions.
2A.9C The student is expected to determine the reasonable domain and range values of square root functions, as well as interpret and determine the reasonableness of solutions to square root equations and inequalities.
2A.9D The student is expected to determine solutions of square root equations using graphs, tables, and algebraic methods.
2A.9E The student is expected to determine solutions of square root inequalities using graphs and tables.
2A.9F The student is expected to analyze situations modeled by square root functions, formulate equations or inequalities, select a method, and solve problems.
2A.9G The student is expected to connect inverses of square root functions with quadratic functions.

Square Root Functions
Maximizing Algebra II Performance Student Lesson: Square Root Functions
323
Materials Prepare in Advance:
Make copies of student pages and overhead transparencies. Collect materials for Bottle Bounce activity. Cut cards for the Card Sort in Activity 3 and place each set in a bag or envelope.
Presenter Materials:
Metronome for demonstration, OR equipment to show the video clip of the metronome For each student group of 3 - 4 students:
Plastic 16-ounce bottle, filled with water Rubber bands (enough to loop together to make a “spring” about 1 meter long) Metric tape measure or meter stick Stopwatch Chart paper and markers, or transparencies and overhead pens 1 Card Sort set per group (Activity 3) 1 copy per group of The Pirate Ship
For each student:
Graphing calculator Bottle Bounce Activity 1 Represent Square Root Functions Activity 3 The Pirate Ship Selected Response Items
Engage The Engage portion of the lesson is designed to generate student interest in the square root relationship found in the Bottle Bounce Activity. This part of the lesson is designed for groups of 4 students. 1. Display Transparency: Metronome. Ask a student with band or choir experience to explain
to the class what a metronome is. 2. Demonstrate the use of a metronome. First, show students how a metronome keeps time for a
slow tempo (largo). Then, show students how a metronome keeps time for a fast tempo (allegro).
3. Ask students to compare how the metronome keeps time for the two tempos. Record responses on the Transparency. Possible responses may include: For the slow tempo, the metronome moved more slowly than for the fast tempo. For the slow tempo, the weight is further toward the end of the metronome than for the fast tempo.

Square Root Functions
Maximizing Algebra II Performance Student Lesson: Square Root Functions
324
Explore The Explore portion of the lesson provides the student with an opportunity to be actively involved in the exploration of the mathematical concepts addressed. This part of the lesson will be a combination of whole group and small group format. 1. Distribute the Bottle Bounce Activity 1 activity sheet, and display Transparency #1. 2. Discuss the situation, steps, and group jobs. Check for understanding and clarify as needed. 3. Students will work together to collect data and answer the questions in Part A of the activity. 4. Instruct students to display their table and graph of their data on chart paper (or on group
copies of Transparencies #2 and #3). 5. Debrief Part A of Bottle Bounce Activity 1 activity sheet by discussing the similarities and
differences in the tables of data and graphs created by the various groups. 6. Circulate about the room, asking groups questions in order to assess or guide. Periodically
call students back as a whole class to discuss group responses.
Facilitation Questions – Explore, Part A • What is happening to the time interval as the length of the spring increases?
The time also increases, though not at a constant rate. • What factor(s) limit the length of the rubber band “spring”?
We are limited by how high we can hold the pencil to support the spring. • What time did you get when the bottom of the bottle was 0 cm from the pencil
“spring” length of 0? It could not be done because there was no rubber band left to allow movement.
• Are the data points from all groups’ graphs increasing? Explain. They should be. As the length of the spring increases, the interval time increased.
• How is this graph different from graphs of other functions? Answers will vary. The shape seems like half of a parabola on its side.
• How is this graph similar to graphs of other functions? Answers will vary. Just as with some other functions, it is increasing.
• Did all groups get the exact same data? Explain. No. There are other variables (besides just time and length of spring) that affect the outcome.
Square Root Functions
Maximizing Algebra II Performance Student Lesson: Square Root Functions
325
Bottle Bounce Activity 1
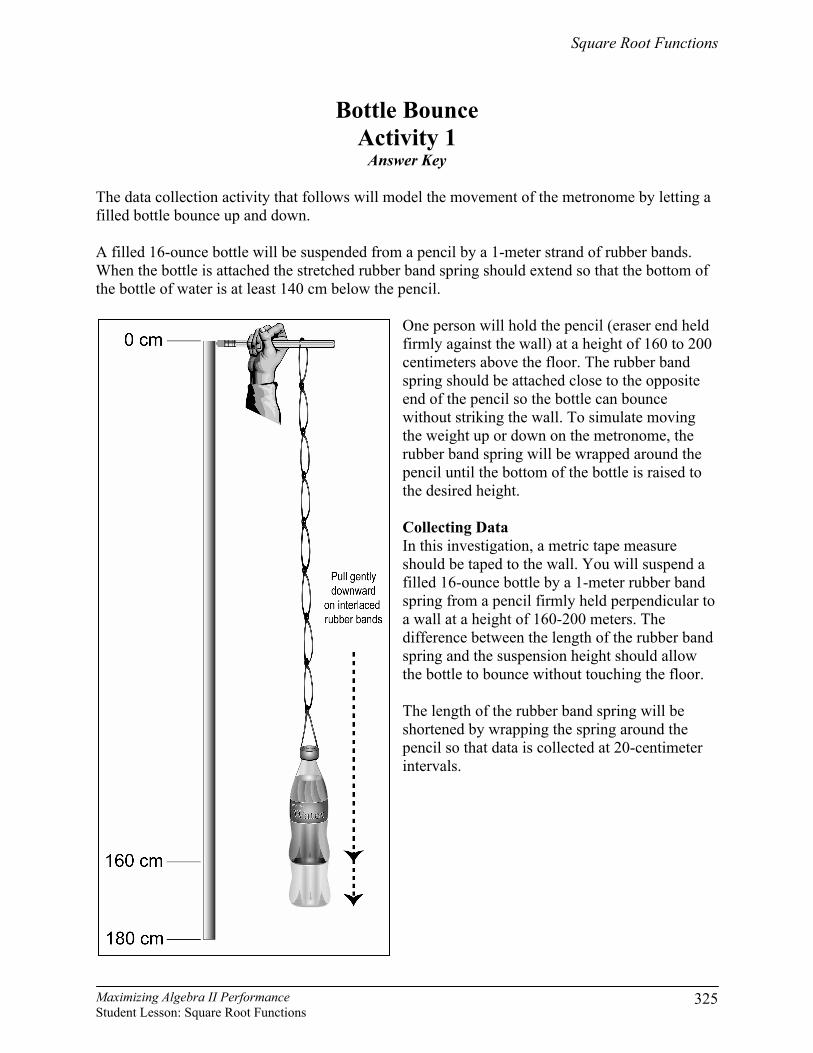
Answer Key The data collection activity that follows will model the movement of the metronome by letting a filled bottle bounce up and down. A filled 16-ounce bottle will be suspended from a pencil by a 1-meter strand of rubber bands. When the bottle is attached the stretched rubber band spring should extend so that the bottom of the bottle of water is at least 140 cm below the pencil.
One person will hold the pencil (eraser end held firmly against the wall) at a height of 160 to 200 centimeters above the floor. The rubber band spring should be attached close to the opposite end of the pencil so the bottle can bounce without striking the wall. To simulate moving the weight up or down on the metronome, the rubber band spring will be wrapped around the pencil until the bottom of the bottle is raised to the desired height. Collecting Data In this investigation, a metric tape measure should be taped to the wall. You will suspend a filled 16-ounce bottle by a 1-meter rubber band spring from a pencil firmly held perpendicular to a wall at a height of 160-200 meters. The difference between the length of the rubber band spring and the suspension height should allow the bottle to bounce without touching the floor. The length of the rubber band spring will be shortened by wrapping the spring around the pencil so that data is collected at 20-centimeter intervals.

Square Root Functions
Maximizing Algebra II Performance Student Lesson: Square Root Functions
326
You will be working in groups of 4. Each person in the group has a job.
Set-up Instructions Step 1 The materials manager should get the necessary materials and ask two of the team
members to secure the tape measure or meter sticks against the wall. The tape measure or meter sticks should be positioned perpendicular to the floor so that the “zero end” is at 180-200 meters above the floor.
Step 2 While the tape measure or meter sticks are being positioned, the materials manager
and remaining team member build the rubber band spring by looping rubber bands together until the length of the spring is about 1 meter. This task will go more quickly if each person makes about half of the spring. Then the two pieces can be joined.
Materials manager: Gets the necessary materials, directs the team in setting up the investigation, holds the pencil with the suspended bottle, and shortens the spring when needed.
Measure manager: Measures the distance from the pencil to the bottom of the bottle for
each length, initiates the bounce by pulling the suspended bottle down an additional 10 centimeters and counts the bounces (10 at each height).
Time manager: Uses a stop watch to determine the length of each 10-bounce period of
time. The time starts when the bottle is released by the measures manager and ends when the bottle completes its 10th bounce.
Data manager: Records the necessary measurements in the table and shares the data
with the team.

Square Root Functions
Maximizing Algebra II Performance Student Lesson: Square Root Functions
327
Step 3 Secure one end of the rubber band spring to the pencil and the other around the neck
of the bottle. Another way to secure the rubber band to the bottle is to remove the cap, insert the end of the spring in the bottle, and screw the cap back on.
Step 4 The measures manager pulls the bottle downward about 10 cm and releases it. Step 5 The time manager starts the stopwatch when it is released and stops it at the end of 10
complete bounces. Have all team members count aloud together. Step 6 The data manager records the number of seconds in the table under Trial 1 for 160
cm. Hint: Starting with the spring fully extended and shortening the spring may prove more meaningful than to begin at the top and work down.
Step 7 Repeat for Trials 2 and 3. Average the data from the 3 trials and record in the
Average Time column. Step 8 The materials manager who is holding the pencil shortens the spring by wrapping it
around the pencil until the desired length of 140 is obtained. Step 9 Continue repeating the procedure with shortened lengths of rubber band spring.
Continue to record your data.

Square Root Functions
Maximizing Algebra II Performance Student Lesson: Square Root Functions
328
Part A: Recording the Data 1. Fill in the table with the data you collected.
Sample response using a bottle 20 cm tall: Spring Length
(from bottom of the bottle to the pencil)
x
Trial 1 Trial 2 Trial 3 Average Time of
the Interval y
0 Cannot be done 20 0 30 4.23 40 5.92 60 8.30 80 10.04 100 11.70 120 13.17 140 14.22 160 15.34
2. What is the independent variable of this situation? The length of the spring in centimeters 3. What is the dependent variable of this situation? The period of 10 bounces measured in seconds. 4. What is a reasonable domain for the set of data?
Responses may vary. The length of the extended rubber band spring with the bottle is approximately 160 cm.
5. What is a reasonable range for the set of data?
Responses may vary. The size and elasticity of the rubber bands used will affect the data. The maximum 10-bounce period appears to be about 16 seconds for this set of data.
6. Make a scatterplot of the data you collected.
Inte
rval
(sec
)
Length of Spring (cm)

Square Root Functions
Maximizing Algebra II Performance Student Lesson: Square Root Functions
329
7. Verbally conclude what happened in this data collection investigation. The shorter the spring, the shorter the interval appears to be. The interval time increases
rapidly between intervals when the spring is at short lengths but increases more slowly as the length of the spring increases.
8. Is this data set continuous or discrete? Why?
The data set is discontinuous; however, the data points would be closer if we were to shorten the spring by smaller increments. The data could be theoretically continuous, but it is discontinuous in any practical collection of data.
9. Does the set of data represent a function? Why? Yes, the data set represents a function. For each increase in the length of the spring, there is
an increase in the 10-bounce interval.
10. Does the data appear to be a linear, quadratic, exponential, or some other type of parent function? Why do you think so?
The data does not appear to be linear because it is not constant. It does not appear to be quadratic because of its behavior in relation to the y-axis, and it seems to lack a symmetric “half.” It does not appear to be exponential because of its behavior in relation to the y-axis. It might be an inverse function.

Square Root Functions
Maximizing Algebra II Performance Student Lesson: Square Root Functions
330
Explain The Explain portion of the lesson is directed by the teacher to allow the students to formalize their understanding of the TEKS addressed in the lesson. Students will work in their groups to complete the questions in Part B of Bottle Bounce Activity 1. After students have completed the activity page, debrief Part B: Interpreting the Data of Bottle Bounce Activity 1. Encourage students to verbalize the connection between the graph and its equation. Part B: Interpreting the Data 1. How could you determine whether this function is the inverse of another parent function? Answers will vary. The data could be reflected over the line y = x. That is, the x values would
become the y values, and vice versa. Or, the L2 values could be mapped to L1 using the table feature of the graphing calculator.
2. Input your values into L1 and L2 of a graphing calculator, letting L1 be independent values
and L2 dependent values, and create a scatterplot. Sketch your scatterplot here.
3. Create a second scatterplot using L2 as the domain and L1 as the range. Use a different plot
symbol for this scatterplot. Determine a new domain and range, and set a new viewing window. Display the graph and sketch it here.

Square Root Functions
Maximizing Algebra II Performance Student Lesson: Square Root Functions
331
4. How do the values from the first scatterplot correspond to the values in the second scatterplot?
The x-coordinates become the y-coordinates, and the y-coordinates become the x-coordinates.
5. Which parent function do the reflected points most closely appear to represent? Quadratic
6. Using what you know about transforming functions, find a function that approximates your data for Plot 2.
Answers will vary. A possible response for this data is 20.6 20y x= + .
7. Does your viewing window allow you to see both sides of the parabola? If not, readjust your viewing window. Possible viewing window
8. How could you use this function to find a function that would approximate the first
scatterplot you graphed?
I could find the inverse of the function, in this case, ( 20)0.6
xy −= .
9. Reset your window to view Plot 1. Enter the equation you found in #8 in the equation editor.
Is your graph a close fit to the data in Plot 1? Responses may vary.
10. What conclusion can you draw about the function of your bottle bounce data?
It can be represented by a square root function.

Square Root Functions
Maximizing Algebra II Performance Student Lesson: Square Root Functions
332
11. How are the graphs of a quadratic function and a square root function similar? The square root function and the positive side of the quadratic function are inverses. 12. How are the graphs different? There is no “negative” side to the square root function. 13. Why are there no negative coordinates? Possible responses: It would not be a function. It would fail the vertical line test.
Facilitation Questions – Explore, Part B • Why did Plot 2 reverse the domain and range of the data?
The purpose was to find the inverse function. • What type of function do the reflected points resemble?
Quadratic (half of a sideways parabola)

Square Root Functions
Maximizing Algebra II Performance Student Lesson: Square Root Functions
333
Elaborate The Elaborate portion of the lesson provides an opportunity for the student to apply the concepts of the TEKS within a new situation. Students will extend their understanding of square root functions as they solve square root equations. This part of the lesson is designed for a combination of whole class and small group format. 1. Distribute Graph Match to students. Ask them to follow directions on the activity. 2. Debrief Graph Match.
3. Distribute Representing Square Root Functions Activity 3. Explain to students that part of
the information in the table (first page of activity) is missing. They will work to complete it. 4. Do one function as a whole class in order to formalize the vocabulary of the various
transformations and the idea of domain and range for square root functions. 5. Students could then work in groups to complete the table, OR you could assign each group
only one of the functions. Then each group could display their one function in its various representations on chart paper.
6. The second page of the activity is the recording sheet for the Card Sort. To make the card sort, make copies of the Answer Key page and cut out each entry. Put them in a small bag or envelope.
7. Give each group a set of cards. They will use the cards to decide what functions to write for each entry on the recording chart. This activity will help them cement the idea of square root transformations and lead them to the symbolic notation. Display the chart (Transparency #4) and have student volunteers record and explain their results.
Facilitation Questions – Elaborate • How does the graph of the reflected (quadratic) data compare to the graph of y = x²?
It is wider (vertical compression) and is translated up. • How will that help you decide how to transform the function to better fit the data?
The coefficient of x² (the “a” value) should be greater than zero, but less than one. There should be a “c” value that is positive.
• What happens to the graph if a number is added or subtracted from the x? The graph will translate (shift) left or right (horizontally).
• What happens to the graph if there is a negative sign in front of the radical? The parent function is reflected over the x-axis.
• Is it possible to take the square root of –x ? Yes, if the x values are negative. It becomes a reflection of the parent function over the y-axis.

Square Root Functions
Maximizing Algebra II Performance Student Lesson: Square Root Functions
334
Graph Match Input the following functions into the equation editor of your graphing calculator. You may use the calculator graph to help you determine which graph is the best match. All graphs were drawn using a standard viewing window. D 1. =y x A. B. A 2. 5= −y x B 3. 3= +y x C. D. C 4. 6= −y x F 5. 4= +y x E. F. H 6. 3y x=
E 7. 12
=y x
G. H. G 8. = −y x

Square Root Functions
Maximizing Algebra II Performance Student Lesson: Square Root Functions
335
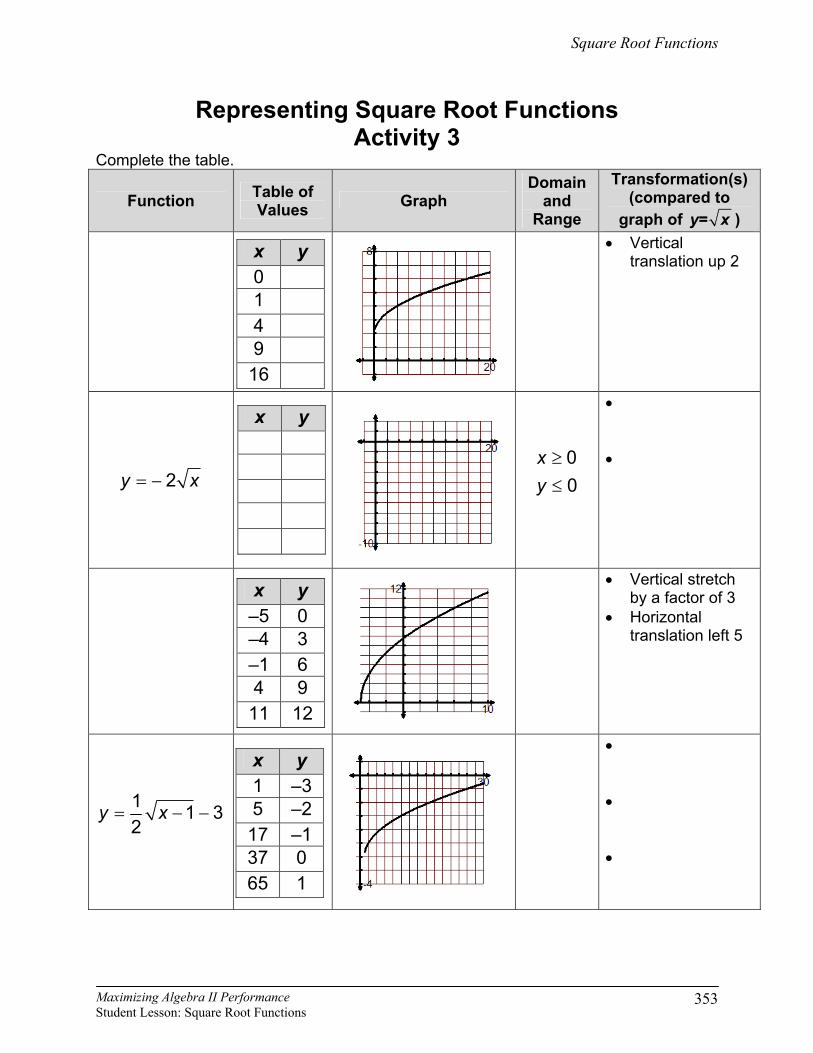
Representing Square Root Functions Activity 3 Answer Key
Complete the table.
Function
Table of Values
Graph
Domain
and Range
Transformation(s) (compared to graph of
y x= )
2y x= +
02
xy≥≥
• Vertical translation up 2
2y x= −
00
xy≥≤
• Vertical stretch by a factor of 2
• Reflection over the x-axis
( ) 3 5f x x= +
50
xy≥ −≥
• Vertical stretch by a factor of 3
• Horizontal translation left 5
1 1 32
y x= − −
1
3xy≥≥ −
• Vertical compression by a factor of 1
2
• Horizontal translation right 1
• Vertical translation down 3
x y –5 0 –4 3 –1 6 4 9
11 12
x y 1 –3 5 –2
17 –1 37 0 65 1
x y 0 0 1 –2 4 –4 9 –6
16 –8
x y 0 2 1 3 4 4 9 5
16 6

Square Root Functions
Maximizing Algebra II Performance Student Lesson: Square Root Functions
336
Card Sort
1. Place the cards in the proper row and column.
Description Example Example Notation
Vertical Translation
Up 5y x= + 1y x= +
0y x k
k= +>
Vertical Translation
Down 3y x= +− 5y x= −
0y x k
k+=
<
Horizontal Translation Left 4y x= −− 5y x= +
0y x h
h= −<
Horizontal Translation
Right 6y x= −+ 5y x= −
0y x h
h= −>
Vertical Stretch 3y x= 5y x= 1y a xa=>
Vertical Compression
23y x= 1
5y x= 0 1y a x
a=< <
Reflection y x=− 5y x=− 0y a xa=<

Square Root Functions
Maximizing Algebra II Performance Student Lesson: Square Root Functions
337
2. Describe the role of a. a is the vertical stretch/compression factor. If a<0, the graph is reflected across the x-axis.
3. Describe the role of h. h is the horizontal translation.
4. Describe the role of k. k is the vertical translation. 5. Using x, a, h, and k, write an equation that could be used to summarize the transformations to
the square root function. y a x h k= − + or ( )f x a x h k= − +
Evaluate The Evaluate portion of the lesson provides the student with an opportunity to demonstrate his or her understanding of the TEKS addressed in the lesson. This part of the lesson is designed for small groups. 1. Provide each group with the Performance Assessment: The Pirate Ship activity sheet. 2. Upon completion of the activity sheet, a rubric should be used to assess student
understanding of the concepts addressed in the lesson. Answers and Error Analysis for selected response questions:
Question Number TEKS Correct
Answer Conceptual
Error Conceptual
Error Procedural
Error Procedural
Error Guess
1 2A.9D D A B C
2 2A.9A D B C A
3 2A.9B B A D C
4 2A.9C C D A B

Square Root Functions
Maximizing Algebra II Performance Student Lesson: Square Root Functions
338
The Pirate Ship Answer Key
At Thalia’s favorite amusement park, there is a ride called the “Pirate Ship.” People sit in what looks like a huge ship. The “ship” then swings back and forth, moving like a pendulum. Thalia notices that it takes somewhere between 7 and 8 seconds for the ride to make one complete swing back and forth.
What would be the possible domain of values for the height of the “Pirate Ship” ride, if the time for one complete swing is between 7 and 8 seconds?
Solution: The height is between (approximately) 39.8 and 51.9 feet.
The function that represents the time in seconds of one complete swing, t, based on the height
of the pendulum arm, h, in feet, is 232
π=ht .

Square Root Functions
Maximizing Algebra II Performance Student Lesson: Square Root Functions
339
Transparency: Metronome A metronome is frequently used in music to mark exact time using a repeated tick. Musicians, choirs, bands, and orchestras all use metronomes to ensure that the beat of the music is consistent with the instructions of the composer and does not unintentionally speed up or slow down while the piece is being played.
How does the metronome keep a slow tempo or a fast tempo? How do they compare?

Square Root Functions
Maximizing Algebra II Performance Student Lesson: Square Root Functions
340
Bottle Bounce: Activity 1
Transparency

Square Root Functions
Maximizing Algebra II Performance Student Lesson: Square Root Functions
341
Transparency: Recording the Data
Spring Length
(from bottom of
the bottle to the pencil)
(x)
Average Time of
the Interval
(y)
0 20 30 40 60 80
100 120 140 160

Square Root Functions
Maximizing Algebra II Performance Student Lesson: Square Root Functions
342
Transparency: Recording the Data
Length of Spring (cm)
Inte
rval
(sec
)

Square Root Functions
Maximizing Algebra II Performance Student Lesson: Square Root Functions
343
Card Sort
Description Example Example Notation Vertical
Translation Up
Vertical Translation
Down
Horizontal Translation Left
Horizontal Translation
Right
Vertical Stretch
Vertical Compression
Reflection

Square Root Functions
Maximizing Algebra II Performance Student Lesson: Square Root Functions
344
Bottle Bounce Activity 1
The data collection activity that follows will model the movement of the metronome by letting a filled bottle bounce up and down.
A filled 16-ounce bottle will be suspended from a pencil by a 1-meter strand of rubber bands. When the bottle is attached the stretched rubber band spring should extend so that the bottom of the bottle of water is at least 140 cm below the pencil. One person will hold the pencil (eraser end held firmly against the wall) at a height of 160 to 200 centimeters above the floor. The rubber band spring should be attached close to the opposite end of the pencil so the bottle can bounce without striking the wall. To simulate moving the weight up or down on the metronome, the rubber band spring will be wrapped around the pencil until the bottom of the bottle is raised to the desired height. Collecting Data In this investigation, a metric tape measure should be taped to the wall. You will suspend a filled 16-ounce bottle by a 1-meter rubber band spring from a pencil firmly held perpendicular to a wall at a height of 160-200 centimeters. The difference between the length of the rubber band spring and the suspension height should allow the bottle to bounce without touching the floor. The length of the rubber band spring will be shortened by wrapping the spring around the pencil so that data is collected at 20-centimeter intervals.
A metronome is frequently used in music to mark exact time using a repeated tick. Individual instrumentalists, choirs, bands, and orchestras all use metronomes to ensure that the beat of the music is consistent with the instructions of the composer and does not unintentionally speed up or slow down while the piece is being played.

Square Root Functions
Maximizing Algebra II Performance Student Lesson: Square Root Functions
345
You will be working in groups of 4. Each person in the group has a job.
Set-up Instructions Step 1 The materials manager should get the necessary materials and ask two of the
team members to secure the tape measure or meter sticks against the wall. The tape measure or meter sticks should be positioned perpendicular to the floor so that the “zero end” is at 180-200 centimeters above the floor.
Step 2 While the tape measure or meter sticks are being positioned, the materials
manager and remaining team member build the rubber band spring by looping rubber bands together until the length of the spring is about 1 meter. This task will go more quickly if each person makes about half of the spring. Then the two pieces can be joined.
Materials manager: Gets the necessary materials, directs the team in setting up the investigation, holds the pencil with the suspended bottle, and shortens the spring when needed.
Measure manager: Measures the distance from the pencil to the bottom of the
bottle for each length, initiates the bounce by pulling the suspended bottle down an additional 10 centimeters and counts the bounces (10 at each height).
Time manager: Uses a stop watch to determine the length of each 10-
bounce period of time. The time starts when the bottle is released by the measures manager and ends when the bottle completes its 10th bounce.
Data manager: Records the necessary measurements in the table and
shares the data with the team.

Square Root Functions
Maximizing Algebra II Performance Student Lesson: Square Root Functions
346
Step 3 Secure one end of the rubber band spring to the pencil and the other around
the neck of the bottle. Another way to secure the rubber band to the bottle is to remove the cap, insert the end of the spring in the bottle, and screw the cap back on.
Step 4 The measures manager secures the spring so that it is approximately 160
centimeters in length. After the bottle remains motionless for a few seconds, he should measure the actual length of the spring. The length of the spring includes the length of the rubber band and the length of the bottle.
Step 5 The measures manager then pulls the bottle downward about 10 cm and
releases it. Step 6 The time manager starts the stopwatch when it is released and stops it at the
end of 10 complete bounces. Have all team members count aloud together. Step 7 The data manager records the number of seconds in the table under Trial 1
for 160 cm. Hint: Starting with the spring fully extended and shortening the spring may prove more meaningful than to begin at the top and work down.
Step 8 Repeat for Trials 2 and 3. Average the data from the 3 trials and record in the
Average Time column.

Square Root Functions
Maximizing Algebra II Performance Student Lesson: Square Root Functions
347
Step 9 The materials manager who is holding the pencil shortens the spring by wrapping it around the pencil until the desired length of 140 is obtained.
Step 10 Continue repeating the procedure with shortened lengths of rubber band
spring. Continue to record your data.

Square Root Functions
Maximizing Algebra II Performance Student Lesson: Square Root Functions
348
Part A: Recording the Data 1. Fill in the table with the data you collected.
Approximate Spring Length
(from bottom of the bottle to the
pencil in cm)
Actual Length of
Spring (cm)x
Trial 1 Trial 2 Trial 3
Average Time of
the Interval
(sec) y
0 20 30 40 60 80 100 120 140 160
2. What is the independent variable of this situation? 3. What is the dependent variable of this situation? 4. What is a reasonable domain for the set of data? 5. What is a reasonable range for the set of data? 6. Make a scatterplot of the data you collected.
Length of Spring (cm)
Inte
rval
(sec
)

Square Root Functions
Maximizing Algebra II Performance Student Lesson: Square Root Functions
349
7. Verbally conclude what happened in this data collection investigation. 8. Is this data set continuous or discrete? Why?
9. Does the set of data represent a function? Why?
10. Does the data appear to be a linear, quadratic, exponential, or some other type of
parent function? Why do you think so?

Square Root Functions
Maximizing Algebra II Performance Student Lesson: Square Root Functions
350
Part B: Interpreting the Data 1. How could you determine whether this function is the inverse of another parent
function? 2. Input your values into L1 and L2 of a graphing calculator, letting L1 be independent
values and L2 dependent values, and create a scatterplot.
Sketch your scatterplot here.
3. Create a second scatterplot using L2 as the domain and L1 as the range. Use a
different plot symbol for this scatterplot. Determine a new domain and range, and set a new viewing window. Display the graph and sketch it here.
4. How do the values from the first scatterplot correspond to the values in the second
scatterplot?
5. Which parent function do the reflected points most closely appear to represent?

Square Root Functions
Maximizing Algebra II Performance Student Lesson: Square Root Functions
351
6. Using what you know about transforming functions, find a function that approximates your data for Plot 2.
7. Does your viewing window allow you to see both sides of the parabola? If not, readjust your viewing window.
8. How could you use this function to find a function that would approximate the first
scatterplot you graphed? 9. Reset your window to view Plot 1. Enter the equation you found in #8 in the equation
editor. Is your graph a close fit to the data in Plot 1? 10. What conclusion can you draw about the function of your bottle bounce data? 11. How are the graphs of a quadratic function and a square root function similar? 12. How are the graphs different? 13. Why are there no negative coordinates?

Square Root Functions
Maximizing Algebra II Performance Student Lesson: Square Root Functions
352
Graph Match Input the following functions into the equation editor of your graphing calculator. You may use the calculator graph to help you determine which graph is the best match. All graphs were drawn using a standard viewing window. _____ 1. =y x A. B. _____ 2. = − 5y x _____ 3. = + 3y x C. D. _____ 4. = −6y x _____ 5. = + 4y x E. F. _____ 6. = 5y x
_____ 7. =12
y x
G. H. _____ 8. = −y x
Square Root Functions
Maximizing Algebra II Performance Student Lesson: Square Root Functions
353
Representing Square Root Functions Activity 3
Complete the table.
Function Table of Values Graph
Domain and
Range
Transformation(s) (compared to
graph of y= x )
• Vertical translation up 2
= − 2y x
≥≤
00
xy
• •
• Vertical stretch by a factor of 3
• Horizontal translation left 5
= − −1 1 32
y x
• • •
x y –5 0 –4 3 –1 6 4 9
11 12
x y 1 –3 5 –2
17 –1 37 0 65 1
x y
x y 0 1 4 9
16

Square Root Functions
Maximizing Algebra II Performance Student Lesson: Square Root Functions
354
Card Sort 1. Place the cards in the proper row and column.
Description Example Example Notation
Vertical Translation
Up
Vertical Translation
Down
Horizontal Translation Left
Horizontal Translation Right
Vertical Stretch
Vertical Compression
Reflection

Square Root Functions
Maximizing Algebra II Performance Student Lesson: Square Root Functions
355
2. Describe the role of a in a square root function.
3. Describe the role of h in a square root function.
4. Describe the role of k in a square root function 5. Using x, a, h, and k, write an equation that could be used to summarize the
transformations to the square root function.

Square Root Functions
Maximizing Algebra II Performance Student Lesson: Square Root Functions
356
The Pirate Ship At Thalia’s favorite amusement park, there is a ride called the “Pirate Ship.” People sit in what looks like a huge ship. The “ship” then swings back and forth, moving like a pendulum. Thalia notices that it takes somewhere between 7 and 8 seconds for the ride to make one complete swing back and forth.
What would be the possible domain of values for the height of the “Pirate Ship” ride, if the time for one complete swing is between 7 and 8 seconds?
Symbolic Table Graph
The function that represents the time in seconds of one complete swing, t, based on the
height of the pendulum arm, h, in feet, is ht π= 232
.